Embed Size (px)
Citation preview
The effect of two types of El Niño on the southerlylow-level jets in North AmericaLejiang Yu1, Shiyuan Zhong2, Warren E. Heilman3, and Xindi Bian3
1Polar Research Institute of China, Shanghai, China, 2Department of Geography and Center for Global Climate Change andEarth Observations, Michigan State University, East Lansing, Michigan, USA, 3Northern Research Station, USDA ForestService, Lansing, Michigan, USA
Abstract Low-level jets (LLJs) are frequent weather phenomena in many regions of North America andhave profound impacts on precipitation and wind energy. We used a 31 year (1979–2010) three-hourlyreanalysis data set to examine the teleconnection between southerly LLJ activity in North America and thetwo dominant patterns of the equatorial Pacific Ocean sea surface temperature anomalies characterized byEl Niño and El Niño Modoki. We show that El Niño and El Niño Modoki exert different effects on the jetactivities, and the results vary by region and by season. Overall, El Niño Modoki affects jet activity all yearround, but El Niño’s influence is limited mostly to the cold season (October–March). El Niño Modoki induceslarger changes in jet frequency, but El Niño’s influence extends to larger regions. A better understandingof this teleconnection canbe used to improve seasonal predictions of precipitation andwind energy resourcesin regions of North America.
1. Introduction
Low-level jets (LLJs), thin narrow streams of fast moving air in the lower troposphere, have been observedaround the globe, including over Africa [Farquharson, 1939; Xiao et al., 2015], Asia [Yu et al., 1983; Du et al.,2012], Australia [Brook, 1985; Keenan et al., 1989], Antarctica [Andreas et al., 2000], North America [Means,1952; Uccellini et al., 1987], South America [Virji, 1981; Vera et al., 2006], and the Caribbean [Amador, 1998;Whyte et al., 2008]. Although LLJs can come from any direction, North America LLJs are predominantly fromthe south and are usually referred to as southerly LLJs or simply SLLJs. SLLJs in North America frequentlyoccur over the Great Plains of the United States [Bonner, 1968; Banta et al., 2002; Walters et al., 2008], theMid-Atlantic states [Zhang et al., 2006], the western Gulf of Mexico [Doubler et al., 2015], the Gulf ofCalifornia, and southwestern Arizona [Douglas, 1995; Doubler et al., 2015]. By transporting heat and moisturefrom the ocean into the continental interior, SLLJs play an important role in the development of severeweather phenomena like mesoscale convective complexes, squall lines, and tornadoes over the GreatPlains and the Midwest of the United States [Zhong et al., 1996; Ting and Wang, 2006; Walters and Winkler,2001; Winkler, 2004; Cook et al., 2008; Weaver et al., 2012; Lee et al., 2013]. In addition to severe weather,SLLJs over North America have also been linked to pollution transport [Corsmeier et al., 1997], wind energyproduction [Nunalee and Basu, 2014], bird migration [Liechti and Schaller, 1999; Zhu et al., 2006], and wildlandfires and smoke transport [Charney et al., 2003; Simpson et al., 2013].
SLLJs over North America, particularly the core region in the Great Plains, exhibit considerable diurnal andseasonal variabilities with much higher frequency at night and in the spring and summer seasons [Bonner,1968; Mitchell et al., 1995], and a great deal has been learned about the underlying physical mechanismsfor these variations. However, relatively little is known about how and why SLLJs vary at longer (interannualand decadal) time scales due largely to the lack of long-term data containing vertical wind profiles. As variousglobal or regional reanalysis products have become widely available in recent years, some progress has beenmade toward this understanding. Ting and Wang [2006] found that the variability of the Bermuda Highstrength makes a contribution to the interannual variability of the Great Plains SLLJ strength. Wang et al.[2007] noted that the sea surface temperature (SST) in the tropical North Atlantic Ocean has a strong influ-ence on the variability of the Caribbean low-level jet. Weaver and Nigam [2008] and Weaver et al. [2012]showed that extratropical large-scale climate factors over the North Atlantic Ocean, such as the AtlanticMultidecadal Oscillation and the North Atlantic Oscillation, also play an important role in the modulationof SLLJ interannual variability. SST in the Pacific Ocean also is an important factor influencing the interannualand interdecadal variabilities of SLLJ frequency and strength. Song et al. [2005] noted that fewer (more) SLLJs
YU ET AL. LOW-LEVEL JET AND ENSO TELECONNECTION 1
PUBLICATIONSEarth and Space Science
RESEARCH ARTICLE10.1002/2016EA000164
Key Points:• A teleconnection exists between theNorth America southerly low-level jet(sLLJ) activity and El Niño and El NiñoModoki
• The El Niño and El Niño Modoki exertdifferent effects on LLJ activity, andthe results vary significantly by regionand by season
• A better understanding of theteleconnection can be used toimprove seasonal predictions ofprecipitation and wind energy inNorth America
Correspondence to:S. Zhong,[email protected]
Citation:Yu, L., S. Zhong, W. E. Heilman, and X.Bian (2016), The effect of two types ofEl Niño on the southerly low-level jets inNorth America, Earth and Space Science,3, doi:10.1002/2016EA000164.
Received 25 JAN 2016Accepted 18 JUL 2016Accepted article online 21 JUL 2016
©2016. The Authors.This is an open access article under theterms of the Creative CommonsAttribution-NonCommercial-NoDerivsLicense, which permits use and distri-bution in any medium, provided theoriginal work is properly cited, the use isnon-commercial and no modificationsor adaptations are made.
occurred in the southern Great Plains during the major El Niño (La Niña) episodes and the warm (cold) phaseof the Pacific Decadal Oscillation during the 1997–2002 period. The relationships between SLLJs and El Niño-La Niña appear to be more complicated. Stronger Great Plains SLLJs appear to be related to La Niña duringthe July–September period [Weaver et al., 2009; Krishnamurthy et al., 2015], but the relationship is reversedduring the April–June period [Krishnamurthy et al., 2015]. The different phases of El Niño–SouthernOscillation modulate the different empirical orthogonal function modes of Great Plains SLLJ strength duringthe May–July period [Weaver and Nigam, 2008]. In contrast, Harding and Snyder [2015] reported that strongGreat Plains SLLJ events predominantly occur with negative values of the Pacific-North American (PNA)teleconnection pattern. The above investigations into the relationships between large-scale circulationsand SLLJs in North America facilitate further understanding of the variability of SLLJs and improve seasonalpredictions of SLLJs and the phenomena related to them.
Recent studies have identified two types of El Niño events [Larkin and Harrison, 2005]. One type is the con-ventional El Niño event with warm (cold) SST anomalies over the tropical eastern (western) Pacific Ocean,and the other is the El Niño Modoki (pseudo El Niño) event, which is characterized by warm SST anomaliesover the tropical central Pacific Ocean flanked by cold SST anomalies in the eastern and western tropicalPacific Ocean [Ashok et al., 2007]. These two types of El Niño events have been shown to be associated withdistinct patterns of wintertime temperature and precipitation across the United States [Mo, 2010; Yu and Zou,2013], different springtime streamflows in the Mississippi River [Liang et al., 2014], and stronger and weakersummer season 925 hPa meridional wind anomalies over the Great Plains [Liang et al., 2015].
Here we present a comprehensive study on the impact of the two types of El Niño events on SLLJs over NorthAmerica. Our study builds on the work of Liang et al. [2015] (hereafter referred to as Liang15) but differs fromit in several important ways, including a more accurate LLJ definition (classical LLJ definition that includescriteria for both maximum wind and wind shear versus meridional wind anomalies at one pressure level(925 hPa) in Liang15), larger geographical coverage (most of North America versus Great Plains in Liang15),longer time coverage (warm and cold seasons versus summer season in Liang15), and higher spatial dataresolution (32 km versus ~ 210 km in Liang15). The improved jet definition and higher data resolution allowfor a more complete depiction of LLJs, and their spatial distributions, which together with the expansion inspatial and temporal coverage, will further our understanding of the relationships between the two El Niñotypes and LLJs over North America.
Given the scientific and socioeconomic implications of a SLLJ, it is necessary for climate models to capturethis phenomenon and its variability. The current study focuses on the SLLJ variability at interannual timescales and seeks to further our understanding of the potential teleconnection between the interannual varia-bility of SLLJs over North America and sea surface temperature anomalies over the tropical Pacific Ocean. Theresults from the current analyses, which could be replicated by climate models, can be used as a means ofinvestigating whether climate models are capable of simulating such observed teleconnection patternsand improve climate predictions of SLLJs over North America.
2. Data and Methods
SLLJs were identified from the 3-hourly vertical wind profiles of the North American Regional Reanalysis(NARR) [Mesinger et al., 2006] for the period 1979–2010 over a domain (10°N–60°N and 150°W–50°W) encom-passing most of the North America. The NARR is produced at the National Centers for EnvironmentalPrediction (NCEP) via the injection of a large amount of available observational data from a variety of sourcesinto its operational regional forecast Eta model [Mesinger et al., 1988; Janjic, 1994]. The NARR data set has ahorizontal resolution of 32 km, a vertical resolution of 25 hPa/50 hPa (below/above 700 hPa), and a temporalresolution of 3 h. The NARR vertical wind profiles have been shown to agree reasonably well with those ofrawinsonde soundings at a number of upper air stations over the Great Plains and the upper Midwest[Walters et al., 2014; Li et al., 2010].
Each 3-hourly NARR vertical wind profile within the study domain and during the study period 1979–2010was examined for the presence of SLLJs by using the jet criteria described in Walters et al. [2014] andDoubler et al. [2015]: (1) wind direction from 113° to 247°, (2) a wind speedmaximum of ≥12m s�1 at or below3000m above ground level (agl), (3) a decrease in wind speed of ≥6m s�1 above the maximum wind level tothe next minimum or to 5000m agl (whichever is lower), and (4) a decreasing wind speed of ≥6m s�1 below
Earth and Space Science 10.1002/2016EA000164
YU ET AL. LOW-LEVEL JET AND ENSO TELECONNECTION 2
the maximum wind level. At each grid point in the study domain, a jet frequency is calculated for the warm(April–September) and cold (October–March) seasons, respectively, by dividing the number of jet profiles bythe total number of vertical wind profiles within that season. A climatology for the jet frequencies is derivedfor the warm season and for the cold season by averaging the seasonal mean frequencies over the entirestudy period 1979–2010, with anomalies calculated as deviations from the climatology. The anomalies areregressed to the indices representing the two types of El Niño events.
In this study, the conventional type of El Niño is represented by the Niño3.4 index defined as Pacific seasurface temperature anomalies in the region bounded by 90°W–150°W and 5°S–5°N [Trenberth, 1997] andwas obtained from National Oceanic and Atmospheric Administration Climate Prediction Center (availableat http://www.cpc.ncep.noaa.gov/data/indices/). The other type of El Niño, which is characterized by anom-alous warming in the central tropical Pacific Ocean flanked by cooling in the eastern and western tropicalPacific Ocean [Ashok et al., 2007], is represented in this study by the El Niño Modoki index obtained fromthe Japan Agency for Marine-Earth Science and Technology (available at http://www.jamstec.go.jp/frsgc/research/d1/iod/modoki_home.html.en).
To help explain the relationships between the two El Niño indices and the SLLJ frequencies in North America,we also examine large-scale atmospheric circulation patterns associated with the two types of El Niño. Thelarge-scale atmospheric circulation fields were extracted from a global reanalysis data set, in particular theNCEP-Department of Energy Global Reanalysis 2 [Kanamitsu et al., 2002], which has a horizontal resolutionof T62 (~209 km).
3. Results
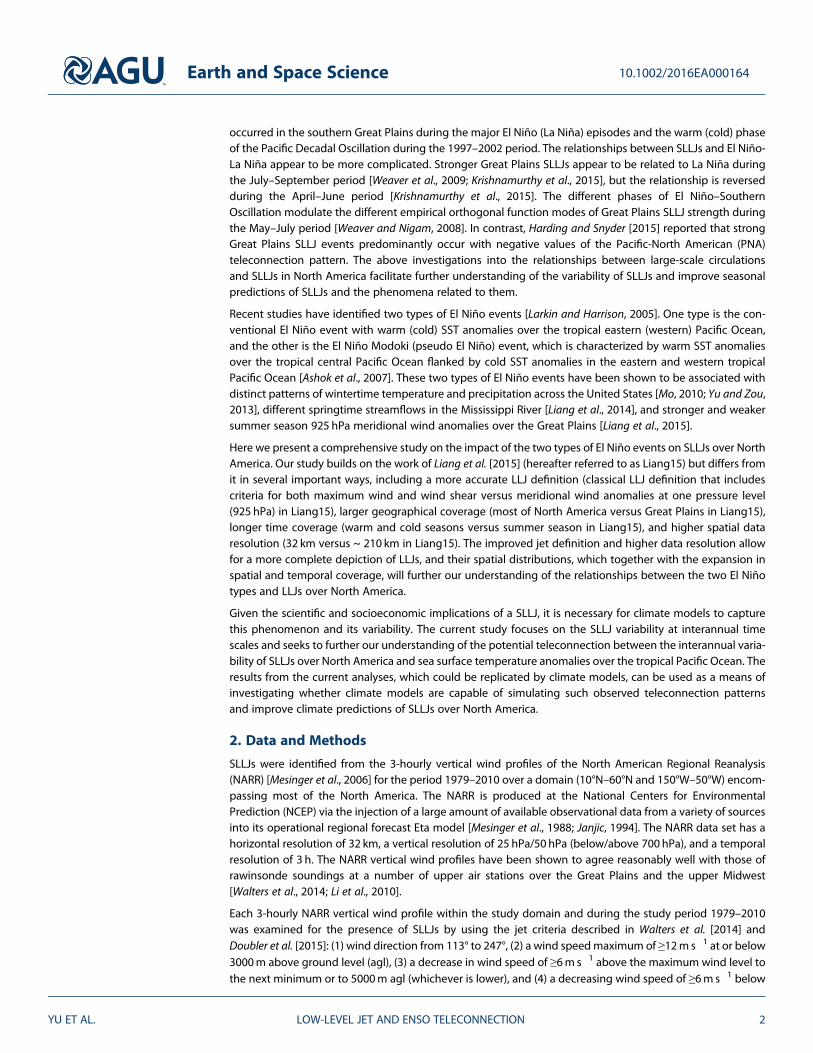
To put the spatial patterns of SLLJ climatology and variability in the warm and cold seasons into context, wefirst show the spatial pattern of the mean low-level wind fields as represented by the 925 hPa vector windsaveraged over the warm and the cold seasons, respectively, for the 1979–2010 study period (Figure 1).During the warm season, the mean vector wind field is a reflection of the dominant large-scale pressurepatterns with the Bermuda High over the western North Atlantic Ocean, the Pacific High over the easternPacific Ocean, and a thermal low over the southwestern United States. The anticyclonic circulation aroundthe Bermuda High produces strong southeasterly to southwesterly flows off the Atlantic coast and a zoneof pronounced southeasterly and southerly flows extending from the Caribbean and the Gulf of Mexiconorthward to the Great Plains of the United States. Weak southerly flows also occur off the coast of BritishColumbia. During the cold season, the southerly flows off the Atlantic coast, the Gulf of Mexico, and theGreat Plains of the United States weaken as the Bermuda High weakens and retreats and the CanadianHigh builds over central North America. However, the strength of the southerly winds off the coast ofBritish Columbia increases as a result of the Aleutian Low developing over the Gulf of Alaska.
Figure 1. Climatological 925 hPa wind field during (a) the warm season (April–September) and (b) the cold season(October–March) (b).
Earth and Space Science 10.1002/2016EA000164
YU ET AL. LOW-LEVEL JET AND ENSO TELECONNECTION 3
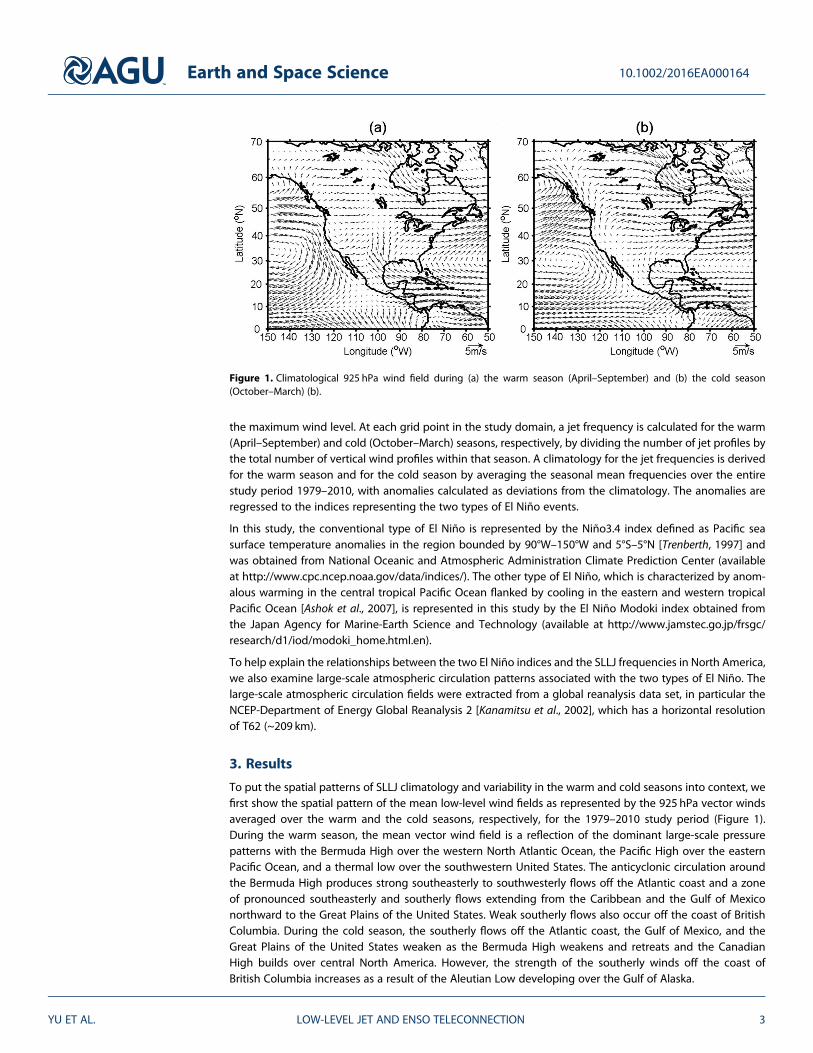
The climatological spatial pattern of the SLLJ frequency (Figure 2) coincides with the regions mentionedabove, where moderate to strong southerly winds prevail at the 925 hPa level. However, strong 925 hPawinds with southerly components do not necessarily mean the presence of SLLJs; to qualify as a SLLJ, bothmaximum wind speed and wind shear above/below the maximum have to exceed the specified criteria.For both the warm and the cold seasons, SLLJs are most frequent over the Great Plains of the UnitedStates, stretching southward into the Gulf of Mexico and the Yucatan Peninsula (Figure 2). The maximumfrequency of 25–30% is found at the border of southern Texas and the western Gulf of Mexico. Two otherlocal maxima are found over south-central Texas and over the Oklahoma-Kansas border. Over the westernGulf of Mexico, there is an area of lower frequency between two high-frequency centers at the Texas borderand over the Yucatan Peninsula. Within the jet core region, the frequency is lower everywhere in the coldseason compared to the warm season. But, there is an increase in cold-season frequency over the westernNorth Atlantic Ocean and along the border of British Columbia. Compared to the climatology in Liang15derived from a global reanalysis, the finer horizontal resolution of the NARR data makes it possible to distin-guish separate centers of high SLLJ activity.
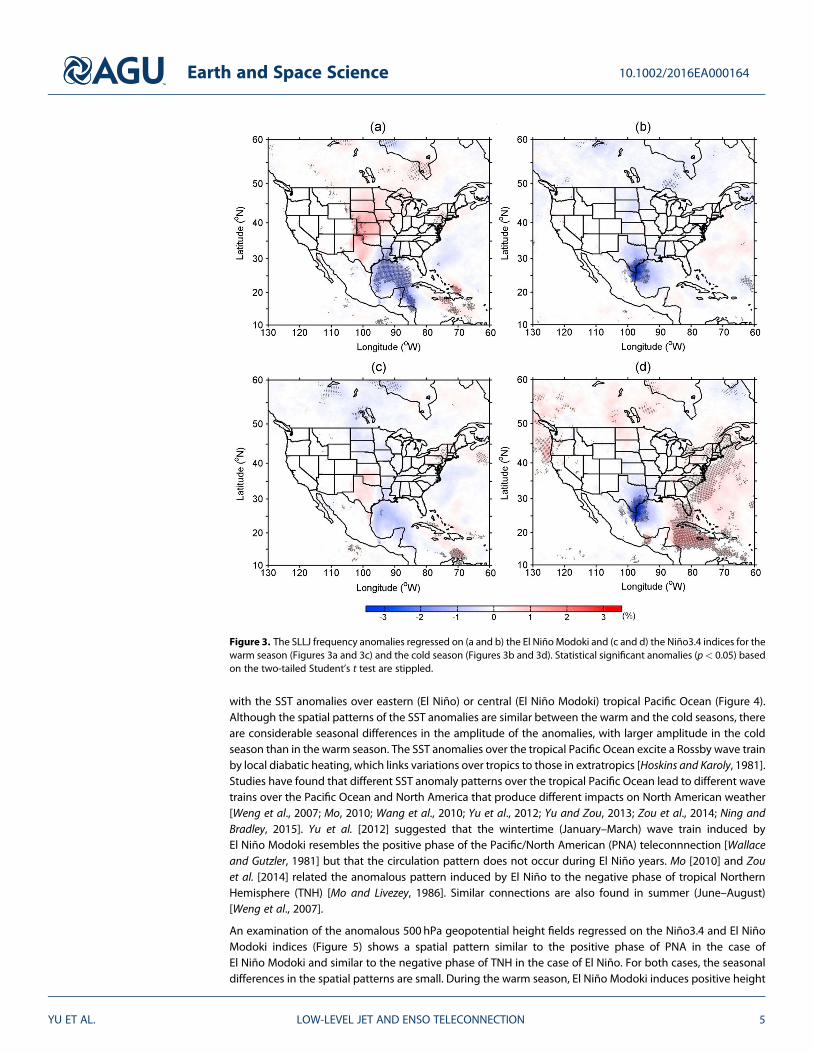
Despite the similar spatial pattern in the climatology of the SLLJ frequencies for the two seasons, significantseasonal differences exist when the seasonal anomalies are regressed on the Niño 3.4 or the El Niño Modokiindices (Figure 3). The number of grid points with significant SLLJ anomalies during the El Niño years is 1067for the warm season and 5989 for the cold season. The numbers during the El Niño Modoki years are 2791 forthe warm season and 1560 for the cold season. During the warm season, El Niño Modoki events have anopposite effect on the Great Plains jets and the Gulf of Mexico jets, with a significant decrease in the jetfrequencies over the Gulf and a significant increase over the Great Plains and the western Caribbean Sea.During the cold season, however, El Niño Modoki is associated with a reduction of jet frequencies over alljet regions (Figure 3b). The influence of El Niño Modoki events is stronger on the warm-season jets thanon the cold-season jets, as reflected by higher values and larger areas where the values are significant atthe 95% confidence level.
In contrast to El Niño Modoki, El Niño’s effects on jet frequencies appear to be stronger in the cold seasonthan in the warm season when there are no significant anomalies in the core jet regions (Figure 3c). The influ-ence of El Niño events on cold-season jet frequencies is much stronger compared to the influence of El NiñoModoki events. In addition to the presence of significant negative anomalies over the western Gulf of Mexicoand southern Texas and similar to the pattern with El Niño Modoki, significant positive anomalies are alsoseen over regions in the Northeast, along the Atlantic coast, and over the Caribbean. Significant positiveanomalies are also found off the coast of the Pacific Northwest and over British Columbia.
These differences in the influence of the two types of El Niño on the warm- and cold-season SLLJ frequenciesmay be explained, at least partially, by examining the anomalous atmospheric circulation patterns associated
Figure 2. The climatology of the SLLJ frequency of occurrences during (a) the warm season and (b) the cold season.
Earth and Space Science 10.1002/2016EA000164
YU ET AL. LOW-LEVEL JET AND ENSO TELECONNECTION 4
with the SST anomalies over eastern (El Niño) or central (El Niño Modoki) tropical Pacific Ocean (Figure 4).Although the spatial patterns of the SST anomalies are similar between the warm and the cold seasons, thereare considerable seasonal differences in the amplitude of the anomalies, with larger amplitude in the coldseason than in the warm season. The SST anomalies over the tropical Pacific Ocean excite a Rossby wave trainby local diabatic heating, which links variations over tropics to those in extratropics [Hoskins and Karoly, 1981].Studies have found that different SST anomaly patterns over the tropical Pacific Ocean lead to different wavetrains over the Pacific Ocean and North America that produce different impacts on North American weather[Weng et al., 2007; Mo, 2010; Wang et al., 2010; Yu et al., 2012; Yu and Zou, 2013; Zou et al., 2014; Ning andBradley, 2015]. Yu et al. [2012] suggested that the wintertime (January–March) wave train induced byEl Niño Modoki resembles the positive phase of the Pacific/North American (PNA) teleconnnection [Wallaceand Gutzler, 1981] but that the circulation pattern does not occur during El Niño years. Mo [2010] and Zouet al. [2014] related the anomalous pattern induced by El Niño to the negative phase of tropical NorthernHemisphere (TNH) [Mo and Livezey, 1986]. Similar connections are also found in summer (June–August)[Weng et al., 2007].
An examination of the anomalous 500 hPa geopotential height fields regressed on the Niño3.4 and El NiñoModoki indices (Figure 5) shows a spatial pattern similar to the positive phase of PNA in the case ofEl Niño Modoki and similar to the negative phase of TNH in the case of El Niño. For both cases, the seasonaldifferences in the spatial patterns are small. During the warm season, El Niño Modoki induces positive height
Figure 3. The SLLJ frequency anomalies regressed on (a and b) the El Niño Modoki and (c and d) the Niño3.4 indices for thewarm season (Figures 3a and 3c) and the cold season (Figures 3b and 3d). Statistical significant anomalies (p< 0.05) basedon the two-tailed Student’s t test are stippled.
Earth and Space Science 10.1002/2016EA000164
YU ET AL. LOW-LEVEL JET AND ENSO TELECONNECTION 5
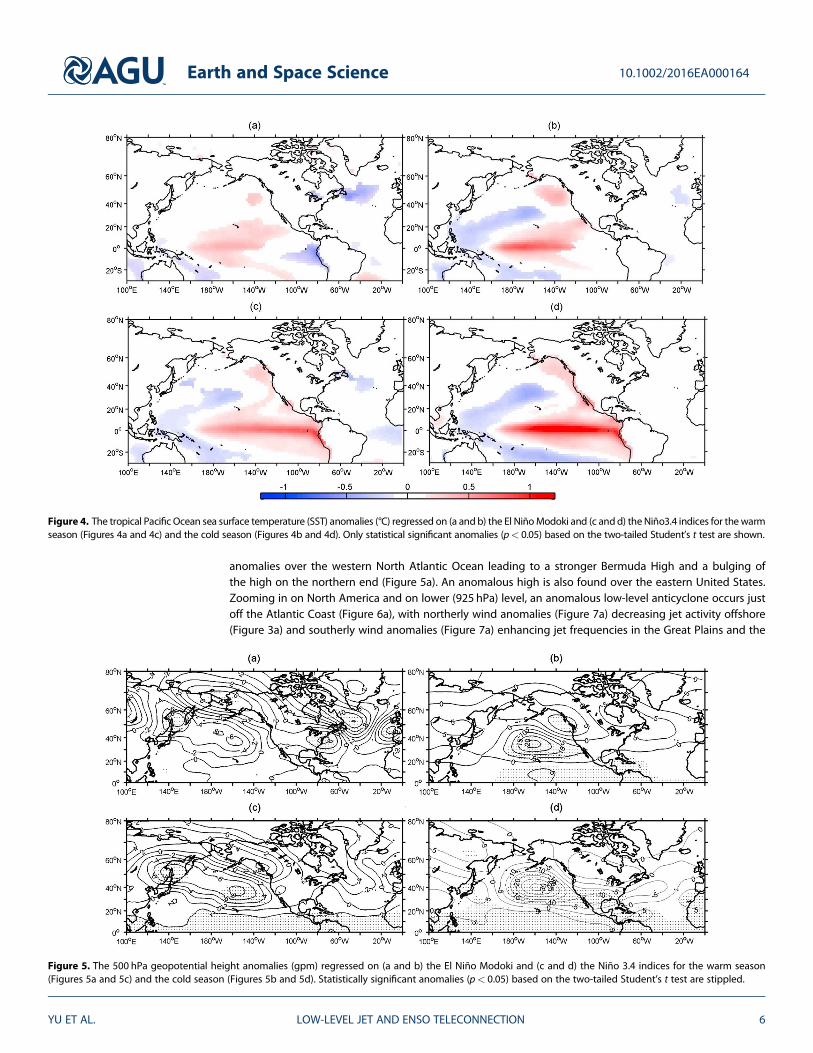
anomalies over the western North Atlantic Ocean leading to a stronger Bermuda High and a bulging ofthe high on the northern end (Figure 5a). An anomalous high is also found over the eastern United States.Zooming in on North America and on lower (925 hPa) level, an anomalous low-level anticyclone occurs justoff the Atlantic Coast (Figure 6a), with northerly wind anomalies (Figure 7a) decreasing jet activity offshore(Figure 3a) and southerly wind anomalies (Figure 7a) enhancing jet frequencies in the Great Plains and the
Figure 5. The 500 hPa geopotential height anomalies (gpm) regressed on (a and b) the El Niño Modoki and (c and d) the Niño 3.4 indices for the warm season(Figures 5a and 5c) and the cold season (Figures 5b and 5d). Statistically significant anomalies (p< 0.05) based on the two-tailed Student’s t test are stippled.
Figure 4. The tropical Pacific Ocean sea surface temperature (SST) anomalies (°C) regressed on (a andb) the El NiñoModoki and (c andd) theNiño3.4 indices for thewarmseason (Figures 4a and 4c) and the cold season (Figures 4b and 4d). Only statistical significant anomalies (p< 0.05) based on the two-tailed Student’s t test are shown.
Earth and Space Science 10.1002/2016EA000164
YU ET AL. LOW-LEVEL JET AND ENSO TELECONNECTION 6
Northeast (Figure 3a). The anomalous northerly winds over the Gulf of Mexico and anomalous southerlywinds over the Caribbean Sea (Figure 7a) are consistent with the decreased occurrences of the Gulf jetsand the increased occurrences of the Caribbean jets (Figure 3a).
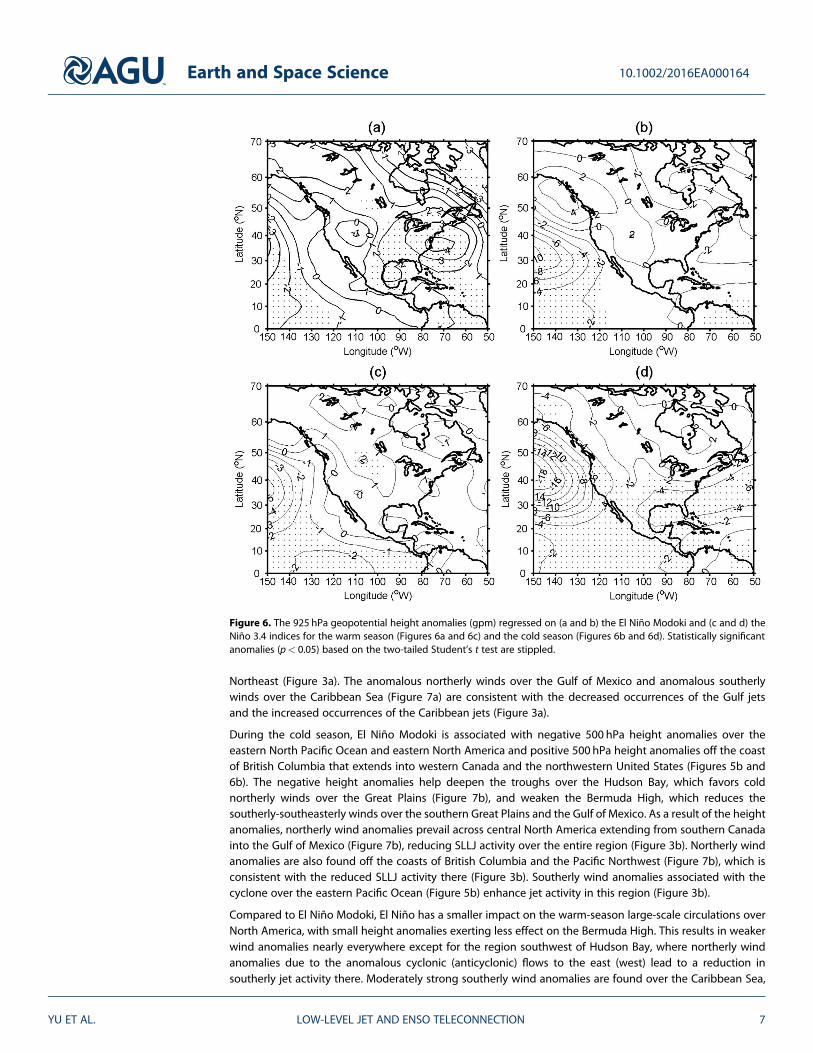
During the cold season, El Niño Modoki is associated with negative 500 hPa height anomalies over theeastern North Pacific Ocean and eastern North America and positive 500 hPa height anomalies off the coastof British Columbia that extends into western Canada and the northwestern United States (Figures 5b and6b). The negative height anomalies help deepen the troughs over the Hudson Bay, which favors coldnortherly winds over the Great Plains (Figure 7b), and weaken the Bermuda High, which reduces thesoutherly-southeasterly winds over the southern Great Plains and the Gulf of Mexico. As a result of the heightanomalies, northerly wind anomalies prevail across central North America extending from southern Canadainto the Gulf of Mexico (Figure 7b), reducing SLLJ activity over the entire region (Figure 3b). Northerly windanomalies are also found off the coasts of British Columbia and the Pacific Northwest (Figure 7b), which isconsistent with the reduced SLLJ activity there (Figure 3b). Southerly wind anomalies associated with thecyclone over the eastern Pacific Ocean (Figure 5b) enhance jet activity in this region (Figure 3b).
Compared to El Niño Modoki, El Niño has a smaller impact on the warm-season large-scale circulations overNorth America, with small height anomalies exerting less effect on the Bermuda High. This results in weakerwind anomalies nearly everywhere except for the region southwest of Hudson Bay, where northerly windanomalies due to the anomalous cyclonic (anticyclonic) flows to the east (west) lead to a reduction insoutherly jet activity there. Moderately strong southerly wind anomalies are found over the Caribbean Sea,
Figure 6. The 925 hPa geopotential height anomalies (gpm) regressed on (a and b) the El Niño Modoki and (c and d) theNiño 3.4 indices for the warm season (Figures 6a and 6c) and the cold season (Figures 6b and 6d). Statistically significantanomalies (p< 0.05) based on the two-tailed Student’s t test are stippled.
Earth and Space Science 10.1002/2016EA000164
YU ET AL. LOW-LEVEL JET AND ENSO TELECONNECTION 7
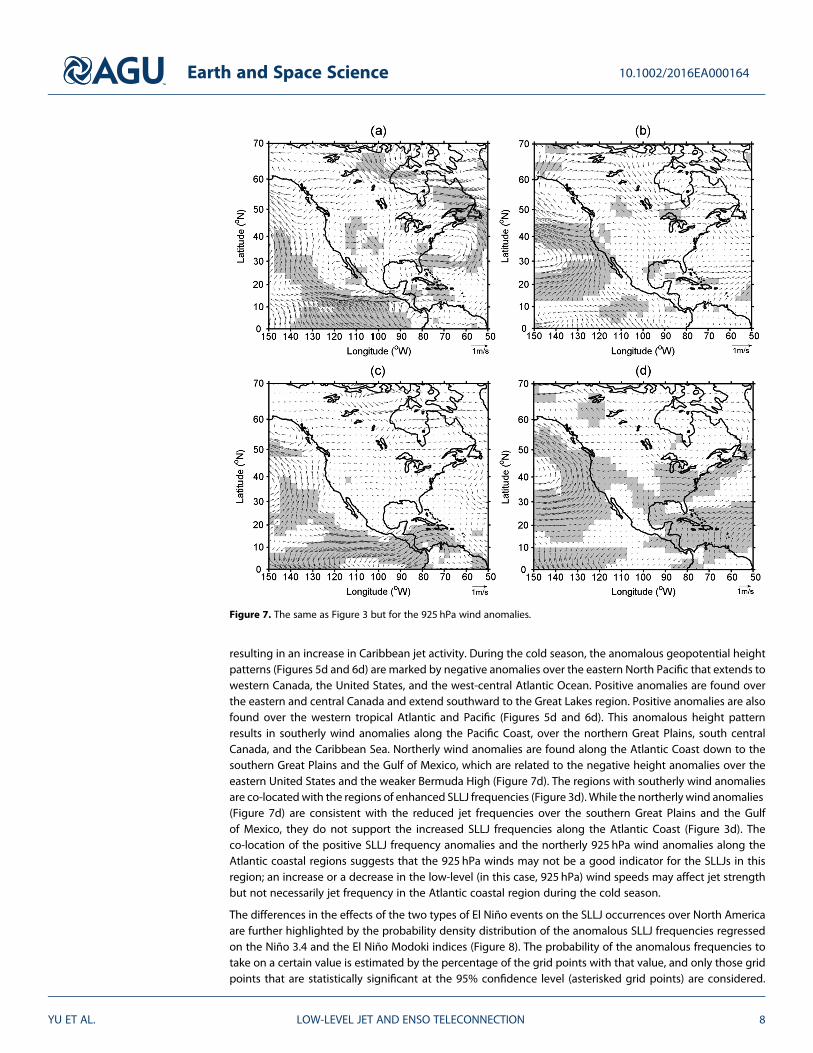
resulting in an increase in Caribbean jet activity. During the cold season, the anomalous geopotential heightpatterns (Figures 5d and 6d) are marked by negative anomalies over the eastern North Pacific that extends towestern Canada, the United States, and the west-central Atlantic Ocean. Positive anomalies are found overthe eastern and central Canada and extend southward to the Great Lakes region. Positive anomalies are alsofound over the western tropical Atlantic and Pacific (Figures 5d and 6d). This anomalous height patternresults in southerly wind anomalies along the Pacific Coast, over the northern Great Plains, south centralCanada, and the Caribbean Sea. Northerly wind anomalies are found along the Atlantic Coast down to thesouthern Great Plains and the Gulf of Mexico, which are related to the negative height anomalies over theeastern United States and the weaker Bermuda High (Figure 7d). The regions with southerly wind anomaliesare co-locatedwith the regions of enhanced SLLJ frequencies (Figure 3d). While the northerly wind anomalies(Figure 7d) are consistent with the reduced jet frequencies over the southern Great Plains and the Gulfof Mexico, they do not support the increased SLLJ frequencies along the Atlantic Coast (Figure 3d). Theco-location of the positive SLLJ frequency anomalies and the northerly 925 hPa wind anomalies along theAtlantic coastal regions suggests that the 925 hPa winds may not be a good indicator for the SLLJs in thisregion; an increase or a decrease in the low-level (in this case, 925 hPa) wind speeds may affect jet strengthbut not necessarily jet frequency in the Atlantic coastal region during the cold season.
The differences in the effects of the two types of El Niño events on the SLLJ occurrences over North Americaare further highlighted by the probability density distribution of the anomalous SLLJ frequencies regressedon the Niño 3.4 and the El Niño Modoki indices (Figure 8). The probability of the anomalous frequencies totake on a certain value is estimated by the percentage of the grid points with that value, and only those gridpoints that are statistically significant at the 95% confidence level (asterisked grid points) are considered.
Figure 7. The same as Figure 3 but for the 925 hPa wind anomalies.
Earth and Space Science 10.1002/2016EA000164
YU ET AL. LOW-LEVEL JET AND ENSO TELECONNECTION 8
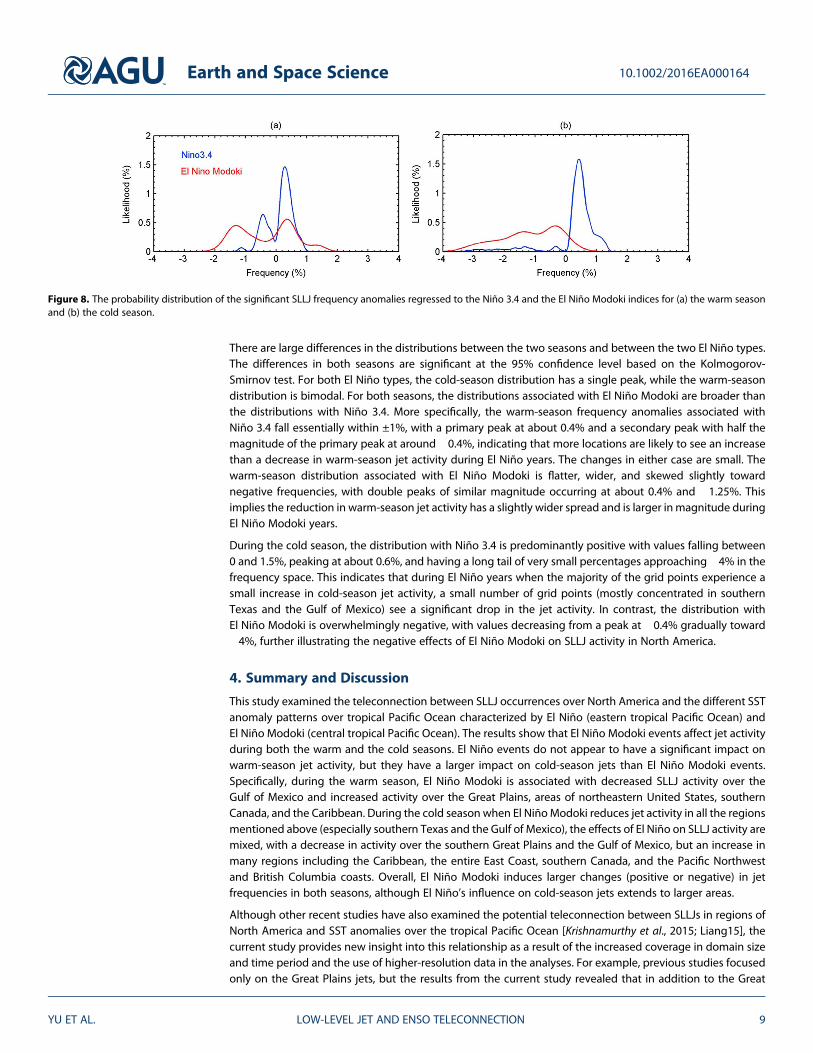
There are large differences in the distributions between the two seasons and between the two El Niño types.The differences in both seasons are significant at the 95% confidence level based on the Kolmogorov-Smirnov test. For both El Niño types, the cold-season distribution has a single peak, while the warm-seasondistribution is bimodal. For both seasons, the distributions associated with El Niño Modoki are broader thanthe distributions with Niño 3.4. More specifically, the warm-season frequency anomalies associated withNiño 3.4 fall essentially within ±1%, with a primary peak at about 0.4% and a secondary peak with half themagnitude of the primary peak at around �0.4%, indicating that more locations are likely to see an increasethan a decrease in warm-season jet activity during El Niño years. The changes in either case are small. Thewarm-season distribution associated with El Niño Modoki is flatter, wider, and skewed slightly towardnegative frequencies, with double peaks of similar magnitude occurring at about 0.4% and �1.25%. Thisimplies the reduction in warm-season jet activity has a slightly wider spread and is larger inmagnitude duringEl Niño Modoki years.
During the cold season, the distribution with Niño 3.4 is predominantly positive with values falling between0 and 1.5%, peaking at about 0.6%, and having a long tail of very small percentages approaching�4% in thefrequency space. This indicates that during El Niño years when the majority of the grid points experience asmall increase in cold-season jet activity, a small number of grid points (mostly concentrated in southernTexas and the Gulf of Mexico) see a significant drop in the jet activity. In contrast, the distribution withEl Niño Modoki is overwhelmingly negative, with values decreasing from a peak at �0.4% gradually toward�4%, further illustrating the negative effects of El Niño Modoki on SLLJ activity in North America.
4. Summary and Discussion
This study examined the teleconnection between SLLJ occurrences over North America and the different SSTanomaly patterns over tropical Pacific Ocean characterized by El Niño (eastern tropical Pacific Ocean) andEl Niño Modoki (central tropical Pacific Ocean). The results show that El Niño Modoki events affect jet activityduring both the warm and the cold seasons. El Niño events do not appear to have a significant impact onwarm-season jet activity, but they have a larger impact on cold-season jets than El Niño Modoki events.Specifically, during the warm season, El Niño Modoki is associated with decreased SLLJ activity over theGulf of Mexico and increased activity over the Great Plains, areas of northeastern United States, southernCanada, and the Caribbean. During the cold season when El NiñoModoki reduces jet activity in all the regionsmentioned above (especially southern Texas and the Gulf of Mexico), the effects of El Niño on SLLJ activity aremixed, with a decrease in activity over the southern Great Plains and the Gulf of Mexico, but an increase inmany regions including the Caribbean, the entire East Coast, southern Canada, and the Pacific Northwestand British Columbia coasts. Overall, El Niño Modoki induces larger changes (positive or negative) in jetfrequencies in both seasons, although El Niño’s influence on cold-season jets extends to larger areas.
Although other recent studies have also examined the potential teleconnection between SLLJs in regions ofNorth America and SST anomalies over the tropical Pacific Ocean [Krishnamurthy et al., 2015; Liang15], thecurrent study provides new insight into this relationship as a result of the increased coverage in domain sizeand time period and the use of higher-resolution data in the analyses. For example, previous studies focusedonly on the Great Plains jets, but the results from the current study revealed that in addition to the Great
Figure 8. The probability distribution of the significant SLLJ frequency anomalies regressed to the Niño 3.4 and the El Niño Modoki indices for (a) the warm seasonand (b) the cold season.
Earth and Space Science 10.1002/2016EA000164
YU ET AL. LOW-LEVEL JET AND ENSO TELECONNECTION 9
Plains of the United States, SLLJs are frequent in several other regions including the Gulf of Mexico, theCaribbean, and the coast of British Columbia. The jets in these other regions are affected more significantlyby El Niño and El Niño Modoki. The current results show significantly reduced jet activity over the Gulf ofMexico during El Niño Modoki events, and given the importance of this region in offshore energy production,this new understanding could have practical implications.
Previous studies focused on the summer-season jets. By extending the analyses to cold-season jets, thecurrent study provides insight into the relationships between cold-season jets and the two types of El Niño.The cold-season jets are found to have a statistically significant connection to both El Niño and El NiñoModoki events. Furthermore, the NARR-based analysis is superior in horizontal resolution to those derivedfrom global data sets, allowing for greater details in the spatial jet structure (e.g., the three localized maximawithin the core jet region).
SLLJs are known to greatly impact precipitation by transporting warm and moist air from the Gulf of Mexicointo the central United States, and a change in SLLJ activity may have a substantial effect on the region’sprecipitation. In a recent study, Barandiaran et al. [2013] indicated that in the last three decades the GreatPlains SLLJs have strengthened and migrated northward, leading to increased (decreased) precipitation overthe northern (southern) Great Plains. El Niño Modoki has displayed an increasing trend in its frequency ofoccurrence [Ashok et al., 2007], which, according to the established relationship between SLLJs and El NiñoModoki, may have contributed to the changes in precipitation patterns over the Great Plains in the last threedecades. The northward migration of the SLLJ core associated with El Niño Modoki could potentially affectwhere moisture convergence/divergence occur, contributing to drier or wetter than normal conditions inregions of the central United States [Yu et al., 2012; Basara et al., 2013].
The statistical relationships shown in this and other studies indicate that the pattern of the SST anomaliesover the tropical Pacific Ocean is potentially very useful for predicting the SLLJ-influenced climate overNorth America, especially for the El Niño Modoki SST anomaly pattern that has become more frequent inrecent decades. However, it is worth pointing out that the relationships between the SLLJs in NorthAmerica and the two types of El Niño are developed based purely on statistical analyses of data coveringrelatively short time period. Longer time series and numerical simulations are needed to validate theserelationships. Numerical simulations are also necessary to fully understand the physical mechanisms throughwhich the SST anomalies over central or eastern tropical Pacific Ocean influence SLLJ in North America.
ReferencesAmador, J. A. (1998), A climate feature of the tropical Americas: The trade wind easterly jet, Top. Meteorol. Oceanogr., 5, 1–13.Andreas, E. L., K. J. Claffey, and A. P. Makshtas (2000), Low-level atmospheric jets and inversions over the western Weddell Sea, Boundary
Layer Meteorol., 97, 459–486.Ashok, K., S. K. Behera, S. A. Rao, H. Wen, and T. Yamagata (2007), El Niño Modoki and its possible teleconnection, J. Geophys. Res., 112,
C11007, doi:10.1029/2006JC003798.Banta, R. M., R. K. Newsom, J. K. Lundquist, Y. L. Pichugina, R. L. Coulter, and L. Mahrt (2002), Nocturnal low-level jet characteristics over Kansas
during CASES-99, Boundary Layer Meteorol., 105, 221–252.Barandiaran, D., S.-Y. Wang, and K. Hilburn (2013), Observed trends in the Great Plains low-level jet and associated precipitation changes in
relation to recent droughts, Geophys. Res. Lett., 40, 6247–6251, doi:10.1002/2013GL058296.Basara, J. B., J. N. Maybourn, C. M. Peirano, J. E. Tate, P. J. Brown, J. D. Hoey, and B. R. Smith (2013), Drought and associated impacts in the
Great Plains of the United States—A review, Int. J. Geosci., 4, 72–81, doi:10.4236/ijg.2013.46A2009.Bonner, W. D. (1968), Climatology of the low-level jet, Mon. Weather Rev., 96, 833–850.Brook, R. R. (1985), The Koorin nocturnal low-level jet, Boundary Layer Meteorol., 32, 133–154.Charney, J., J. X. Bian, E. Potter, and W. E. Heilman (2003), Low-level jet impacts on fire evolution in the Mack Lake and other severe wildfires,
paper presented at 2nd International Wildland Fire Ecology and Fire Management Congress, Am. Meteorol. Soc., Orlando, Fla.Cook, K. H., E. K. Vizy, Z. S. Launer, and C. M. Patricola (2008), Springtime intensification of the Geart Plains low-level jet and Midwest
precipitation in GCM simulations of the twenty-first century, J. Clim., 21, 6321–6340.Corsmeier, U., N. Kalthoff, O. Kolle, M. Kotzian, and F. Fiedler (1997), Ozone concentration jump in the stable nocturnal boundary layer during
a LLJ-event, Atmos. Environ., 31, 1977–1989, doi:10.1016/S1352-2310(96)00358-5.Doubler, D. L., J. A. Winkler, X. Bian, C. K. Walters, and S. Zhong (2015), A NARR-derived climatology of southerly and northerly low-level jets
over North America and coastal environs, J. Appl. Meteorol. Climatol., 54, 1596–1619.Douglas, M. W. (1995), The summertime low-level jet over the Gulf of California, Mon. Weather Rev., 123, 2334–2347.Du, Y., Q. Zhang, and Y. Yue (2012), Characteristics of low-level jets in Shanghai during the 2008–2009 warm seasons as inferred from wind
profiler radar data, J. Meteorol. Soc. Jpn., 90, 891–903, doi:10.2151/jmsj.2012-603.Farquharson, J. S. (1939), The diurnal variation of wind over tropical Africa, Q. J. R. Meteorol. Soc., 65, 165–184.Harding, K. J., and P. K. Snyder (2015), The relationship between the Pacific-North American teleconnection pattern, the Great Plains
low-level jet, and North Central U.S. heavy rainfall events, J. Clim., 28, 6729–6742.
Earth and Space Science 10.1002/2016EA000164
YU ET AL. LOW-LEVEL JET AND ENSO TELECONNECTION 10
AcknowledgmentsThe research was supported partially bythe National Science Foundation underGrants BCS-0924768 and BCS-0924816,by the USDA Forest Service NorthernResearch Station under Research JointVenture Agreement 11-JV-11242306-065,and by AgBioResearch of Michigan StateUniversity. The authors would like tothank the NCEP for the NARR data set.The data set used for the analysis can befound at http://nomads.ncdc.noaa.gov/#narr_datasets.
Hoskins, B. J., and D. J. Karoly (1981), The steady linear response of a spherical atmosphere to thermal and orographic forcing, J. Atmos. Sci.,38, 1179–1196.
Janjic, Z. I. (1994), The step-mountain Eta coordinate model: Further developments of the convection, viscous sublayer, and turbulenceclosure schemes, Mon. Weather Rev., 122, 927–945.
Kanamitsu, M., W. Ebisuzaki, J. Woollen, S.-K. Yang, J. J. Hnilo, M. Fiorino, and G. L. Potter (2002), NCEP/DOE AMIP-II Reanalysis (R-2), Bull. Am.Meteorol. Soc., 83, 1631–1643.
Keenan, T. D., J. McBride, G. Holland, N. Davidson, and B. Gunn (1989), Diurnal variations during the Australian Monsoon Experiment (AMEX)Phase II, Mon. Weather Rev., 117, 2535–2553.
Krishnamurthy, L., G. A. Vecchi, R. Msadek, A. Wrrtenberg, T. L. Delworth, and F. Zeng (2015), The seasonality of the Great Plains low-level jetand ENSO relationship, J. Clim., 28, 4525–4544.
Larkin, N. K., and D. E. Harrison (2005), On the definition of El Niño and associated seasonal average U.S. weather anomalies, Geophys. Res.Lett., 32, L13705, doi:10.1029/2005GL022738.
Lee, S.-K., R. Atlas, D. B. Enfield, C. Wang, and H. Liu (2013), Is there an optimal ENSO pattern that enhances large-scale atmospheric processesconducive to major tornado outbreaks in the U.S.?, J. Clim., 26, 1626–1642.
Li, X., S. Zhong, X. Bian, and W. E. Heilman (2010), Climate and climate variability of the wind power resources in the Great Lakes region of theUnited States, J. Geophys. Res., 115, D18107, doi:10.1029/2009JD013415.
Liang, Y.-C., M.-H. Lo, and J.-Y. Yu (2014), Asymmetric response of land hydroclimatology to two types of El Niño in the Mississippi River Basin,Geophys. Res. Lett., 41, 582–588, doi:10.1002/2013GL058828.
Liang, Y.-C., J.-Y. Yu, M.-H. Lo, and C. Wang (2015), The changing influence of El Niño on the Great Plains low-level jet, Atmos. Sci. Lett., 16,512–517, doi:10.1002/asl.590.
Liechti, F., and E. Schaller (1999), The use of low-level jets by migrating birds, Naturwissenschaflen, 86, 549–551.Means, L. L. (1952), On thunderstorm forecasting in the central United States, Mon. Weather Rev., 80, 165–189.Mesinger, F., Z. I. Janjic, S. Nickovic, D. Gavrilov, and D. G. Deaven (1988), The step-mountain coordinate-model description and performance
for cases of Alpine lee cyclogenesis and for a case of an Appalachian redevelopment, Mon. Weather Rev., 116, 1493–1518.Mesinger, F., et al. (2006), North American regional reanalysis, Bull. Am. Meteorol. Soc., 87, 343–360.Mitchell, M., J. R. W. Arritt, and K. Labas (1995), A climatology of the warm season Great Plains low-level jet using wind profiler observations,
Weather Forecasting, 10, 576–591.Mo, K. C. (2010), Interdecadal modulation of the impact of ENSO on precipitation and temperature over the United States, J. Clim., 23,
3639–3656.Mo, K. C., and R. E. Livezey (1986), Tropical-extratropical geopotential height teleconnections during the Northern Hemisphere winter,
Mon. Weather Rev., 114, 2488–2515.Ning, L., and R. S. Bradley (2015), Influence of eastern Pacific and central Pacific El Niño events on winter climate extremes over the eastern
and central United States, Int. J. Climatol., 35, 4756–4770.Nunalee, C. G., and S. Basu (2014), Mesoscale modeling of coastal low-level jets: Implications for offshore wind resource estimation,
Wind Energy, 17, 1199–1216.Simpson, C., M. Katurji, M. T. Kiefer, S. Zhong, J. Charney, W. H. Heilman, and X. Bian (2013), Atmosphere-fire simulation of the effects of
low-level jets on pyro-convective plume dynamics, paper presented at 20th International Congress on Modelling and Simulation,Modelling and Simulation Society of Australia and New Zealand, December 2013, Adelaide, Australia.
Song, J., K. Liao, R. L. Coulter, and B. M. Lesht (2005), Climatology of the low-level jet at the southern Great Plains atmospheric boundary layerexperiments site, J. Appl. Meteorol., 44, 1593–1606.
Ting, M., and H. Wang (2006), The role of the North America topography on the maintenance of the Great Plains summer low-level jet,J. Atmos. Sci., 63, 1056–1068.
Trenberth, K. E. (1997), The definition of El Niño, Bull. Am. Meteorol. Soc., 78, 2771–2777.Uccellini, L. W., R. A. Petersen, K. F. Brill, P. J. Kocin, and J. J. Tuccillo (1987), Synergistic interactions between an upper-level jet streak and
diabatic processes that influence the development of a low-level jet and a secondary coastal cyclone,Mon. Weather Rev., 115, 2227–2261.Vera, C., et al. (2006), The South American low-level jet experiment, Bull. Am. Meteorol. Soc., 87, 63–77.Virji, H. (1981), A preliminary study of summertime tropospheric circulation patterns over South America estimated from cloud winds,
Mon. Weather Rev., 109, 599–610.Wallace, J. M., and D. S. Gutzler (1981), Teleconnnections in the potential height field during the Northern Hemisphere winter,Mon. Weather
Rev., 109, 784–812.Walters, C. K., and J. A. Winkler (2001), Airflow configurations of warm season southerly low-level wind maxima in the Great Plains: Part I.
Spatial and temporal characteristics and relationship to convection, Weather Forecasting, 16, 513–530.Walters, C. K., J. A. Winkler, R. P. Shadbolt, J. van Ravensway, and G. D. Bierly (2008), A long-term climatology of southerly and northerly
low-level jets for the central United States, Ann. Assoc. Am. Geogr., 98, 521–552.Walters, C. K., J. A. Winkler, S. Husseini, R. Keeling, J. Nikolic, and S. Zhong (2014), Low-level jets in the North American Regional Reanalysis
(NARR): A comparison with rawinsonde observations, J. Appl. Meteorol. Climatol., 53, 2093–2113.Wang, C., S.-K. Lee, and D. B. Enfield (2007), Impact of the Atlantic warm pool on the summer climate of the Western Hemisphere, J. Clim., 25,
5021–5040.Wang, H., S. Schubert, M. Suarez, and R. Koster (2010), The physical mechanisms by which the leading patterns of SST variability impact U.S.
precipitation, J. Clim., 23, 1815–1836.Weaver, S. J., and S. Nigam (2008), Variability of the Great Plains low-level jet: Large-scale circulation context and hydroclimate impacts,
J. Clim., 21, 1532–1551.Weaver, S. J., S. Schubert, and H. Wang (2009), Warm season variations in low-level circulation and precipitation over the central United
States in observations, AMIP simulations, and idealized SST experiments, J. Clim., 22, 5401–5420.Weaver, S. J., S. Baxter, and A. Kumar (2012), Climatic role of North American low-level jets on U.S. regional tornado activity, J. Clim., 25,
6666–6683.Weng, H., K. Ashok, and S. K. Behera (2007), Impacts of recent El Niño Modoki on dry/wet conditions in the Pacific rim during boreal summer,
Clim. Dyn., 29, 113–129.Whyte, F., M. T. Taylor, T. S. Stephenson, and J. D. Cambell (2008), Features of the Caribbean low level jet, Int. J. Climatol., 28, 119–128,
doi:10.1002/joc.1510.Winkler, J. A. (2004), The impact of technology upon in situ atmospheric observations and climate science, in Geography and Technology,
Kluwer Academic Publishers, Dordrecht, The Netherlands.
Earth and Space Science 10.1002/2016EA000164
YU ET AL. LOW-LEVEL JET AND ENSO TELECONNECTION 11
Xiao, Z., W. Shi, and P. Yang (2015), Possible causes of the interdecadal transition of the Somali jet around the late 1990s, J. Meteorol. Res.,29, 214–227.
Yu, J.-Y., and Y. Zou (2013), The enhanced drying effect of central-Pacific El Niño on US winter, Environ. Res. Lett., 8, doi:10.1088/1748-9326/8/1/014019.
Yu, J.-Y., Y. Zou, S. T. Kim, and T. Lee (2012), The changing impact of El Niño on US winter temperatures, Geophys. Res. Lett., 39, L15702,doi:10.1029/2012GL052483.
Yu, Z., G. Zhai, and Z. Wang (1983), The conditions for generation of rainstorms over the low-level jet core region along the mid-to-lowerYangtze River valley [In Chinese], Acta Meteorol. Sin., 41, 365–371.
Zhang, D.-L., S. Zhang, and S. J. Weaver (2006), Low-level jets over the Mid-Atlantic states: Warm-season climatology and a case study, J. Appl.Meteorol. Climatol., 45, 194–209.
Zhong, S., J. D. Fast, and X. Bian (1996), A case study of the Great Plains low-level jet using wind profiler network data and a high-resolutionmesoscale model, Mon. Weather Rev., 124, 785–806.
Zhu, M., E. B. Radcliffe, D. W. Ragsdale, I. V. MacRae, and M. W. Seeley (2006), Low-level jet streams associated with spring aphid migrationand current season spread of potato viruses in the U.S. northern Great Plains, Agric. For. Meteorol., 138, 192–202.
Zou, Y., J.-Y. Yu, T. Lee, M.-M. Lu, and S. T. Kim (2014), CMIP5 model simulations of the impacts of the two types of El Niño on the U.S. wintertemperature, J. Geophy. Res. Atmos., 119, 3076–3092, doi:10.1002/2013JD021064.
Earth and Space Science 10.1002/2016EA000164
YU ET AL. LOW-LEVEL JET AND ENSO TELECONNECTION 12