Embed Size (px)
Citation preview
Journal of Minerals & Materials Characterization & Engineering, Vol. 10, No.6, pp.479-492, 2011 jmmce.org Printed in the USA. All rights reserved
479
The Effect of Time, Percent of Copper and Nickel on the Natural Precipitation Hardness of Al – Cu – Ni Powder Metallurgy Alloys Using
Design of Experiments
Mohammad M. Hamasha1, Ahmad T. Mayyas2*, Mohammed T. Hayajneh3, Adel M. Hassan3
1 Department of Systems Science and Industrial Engineering, State University of New York at
Binghamton, Binghamton, NY 13850, USA 2 Department of Automotive Engineering, Clemson University-International Center for
Automotive Research (CU-ICAR), 4 Research Drive, Greenville, SC 29607, USA 3 Industrial Engineering Department, Jordan University of Science and Technology, P.O. Box
3030, Irbid 22110 Jordan
Corresponding Author: [email protected]
ABSTRACT In this investigation, the effect of time, percentage of copper and nickel on the hardness property of aluminum based powder metallurgy alloys were studied. A full factorial analysis with four levels for each factor was used. The samples were produced using powder metallurgy process, and then subjected to natural aging where heat treatment was conducted for all samples together at 550 °C for 3 hours before quenching in water. Then, the samples were left at room temperature for 936 hours (39 days) to allow traces atoms to diffuse and form coherent phases which increase the hardness. It was found that the hardness was firstly increased with time for about 300 hours after the quenching time, and then it tends to remain constant after that. However, the hardness drop at overage stage was not observed until the end of 936 hours. To get a full analysis of the natural aging we used design of experiment tool to study the effect of %Cu, %Ni and aging time on the hardness. The results showed that the hardness was influenced significantly by all considered factors and interactions between them. Keywords: Al; Powder Metallurgy; solution treatment; Natural Precipitation hardening.

480 M.M. Hamasha, A.T. Mayyas, M.T. Hayajneh, A.M. Hassan Vol.10, No.6
1. INTRODUCTION Precipitation hardening (also known as age hardening) is a process by which aluminum and steel alloys are heat and solution treated. The goals of the process are to increase the strength and hardness of the material [1]. Precipitation hardening consists of three main steps: solution treatment, quenching, and aging. Solution treatment involves heating the alloy to above the solvus temperature, which creates a homogeneous solid solution of one phase. At this stage, all of the solute atoms are dissolved into the solution. Quenching refers to the rapid cooling of the solid solution in a medium and it is the second step in natural hardening. During this step, the solute becomes over supersaturated. Finally, aging takes place where the solute atoms diffuse as clusters that distort and strengthen the material. The precipitation process differs widely in composition and in the microstructures formed. Precipitation hardening is often employed in aluminum alloys to improve the mechanical properties, such as strength and hardness. This change in properties is the result of the formation of finely dispersed second phase particles in the alloy. These particles induce lattice strain in the aluminum matrix that restricts dislocation flow. The material is then kept at room temperature or heated again to a temperature below the solvus temperature and held for some amount of time. This temperature is known as the age hardening temperature. The purpose of heating the alloy again to decrease the time needed to age the material. Heat-treated aluminum alloys are usually used for high performance parts, such as parts for aircraft. There are several classes of aluminum alloys that can be heat-treated. The 2xxx group of alloys is that in which the principle alloying elements is copper [1]. Magnesium and small amounts of other elements may also be added. In this alloy, Al2CuMg is the main strengthening precipitate [1]. A normal use of the 2xxx alloys, such as alloy 2024, is for aircraft structures. The 6xxx group of alloys contains magnesium and silicon as primary alloying elements [1]. Mg2Si is the strengthening precipitate for this alloy system [1]. This group of alloys, such as alloy 6061 is commonly used for general-purpose structural applications. The principal alloying elements for the 7xxx group are zinc, magnesium and copper. The intermetallic compound, MgZn2, is the main strengthening precipitate for this element [1-3]. Because of the high solubility of zinc and magnesium, it is possible to form a high density precipitates and perform very high strength. These alloys are generally used for aircraft structures, such as alloy 7075 [1-3]. To compare these alloy groups with each other, 2024 has a tensile strength of about 64 ksi, 6061 has a tensile strength of about 42 ksi, while 7075 has a tensile strength of about 73 ksi [1]. When choosing an alloy in the design stage, factors such as strength, ability of forming and machining, as well as prices of materials are important. Silicon increases the fluidity of the molten metal while copper and magnesium increase strength.

Vol.10, No.6 The Effect of Time, Percent of Copper and Nickel 481
In comparison with other material, the addition of copper as primary alloying element produces the strongest aluminum cast alloys [3-4]. Nickel in combination with copper enhances the strength and hardness at elevated temperature [5]. The use of a solution treatment-plus-aging heat treatment for the 2618-Al alloy (Si: 0.10-0.25, Fe: 0.9-1.3, Cu: 1.9-2.7, Mg: 1.3-1.8, Ni: 0.9-1.2, Zn: 0.10) wt%, produces specimens which allow machining to a smoother finish [9]. In a wide range of Al-Cu-Mg alloy compositions, age hardening is known to be associated primarily with the precipitation of Guinnier-Preston (Cu, Mg) zones and the semi-coherent phase S, which is closely related to the equilibrium S-phase (Al2CuMg) [2]. Bin-Lung Ou [7] investigated the influence of low-temperature preaging on the artificial precipitation-hardening of an aluminum alloy 6063 (Al–0.72Mg–0.42Si) and found that the increase in either the preaging temperature or the holding period has decreased significantly the strength after artificial aging. During precipitation hardening dimensional changes can also occur. These changes result from internal stresses, alloy concentrations, and the aging process. Dimensional changes are hard to predict because of the number of variables involved. Different alloys can be considered for precipitation hardening. Aluminum based alloys are commonly hardened and strengthened through precipitation hardening. There are different groups of aluminum alloys. These groups are defined by primary alloying elements, such as zinc, copper, silicon, and magnesium. Different alloy groups have different strengths and structural applications [1-5]. Oneda et. al. [8] examined the effect of preaging on the artificial precipitation-hardening of an Al-1.32wt% Mg2Si alloy at 170 °C. They found that the maximum hardness change was strongly dependent on the preaging temperature. Özbek [9] investigated the effects of re-solution treatment of AA2618 aluminum alloy, at solution heat treatments between 520–640 °C and holding time in the range of 14–24 h, followed by artificial aging. He found that further increase in the solution treatment temperature coarsened both the grains and the precipitates, resulting in significant reduction in hardness. Al9FeNi-type intermetallics are not completely dissolved by these solution treatments. Desmukh et. al. [10] investigated Al 7010 alloy (Zn 6.3, Mg 2.3, Cu 1.55, Zr 0.14), the fatigue strength corresponding to 106 cycles was further compared and the results revealed that the over aged material has a fairly high value of fatigue strength as compared to the peak aged alloy. These results are discussed in terms of the differences in the microstructures developed in the materials subjected to the different aging treatments. Zeren [11] studied the effect of heat-treatment on aluminum-based piston alloys, AlCu4MgNi alloys and AlSiCuMgNi alloys with (10.5, 12, 18 and 24) wt% Si were utilized for this purpose. It was found that the Mechanical properties of Al-based piston alloys largely depended on the heat treatment. Thus, characteristics of heat treatment play a vital role for a good combination of microstructure and mechanical properties.

482 M.M. Hamasha, A.T. Mayyas, M.T. Hayajneh, A.M. Hassan Vol.10, No.6
Ouellet et. al. [12] investigated aging of 356 and 319 Al alloys. They found that the main parameters expected to control the mechanical properties are the iron and copper intermetallics, the porosity size and distribution, the eutectic silicon particle characteristics, and the degree of supersaturation of Mg and Cu in the α-Al matrix after solution heat treatment. Cast aluminum alloys mainly contain Si, Cu, and Mg as the major alloying elements. Copper and Magnesium strengthen the alloy matrix and improve the mechanical properties and alloy machinability. M. Tash et. al. [13] studied the effect of metallurgical parameters on the hardness and microstructural characterization of as-cast and heat-treated 356 and 319 alloys. The aim of the study was to adjust these parameters to produce castings of suitable hardness and Fe-intermetallic volume fractions for subsequent use in studies relating to the machinability of these alloys. By measuring the amount of Fe- and Cu-intermetallics formed, and the changes in the eutectic Si particle characteristics resulting from alloying additions, and heat treatment of the 356 and 319 alloys, and the corresponding hardness values, it was possible to determine which conditions or metallurgical parameters yielded the required Fe-intermetallic volume fractions of 2 and 5% and hardness levels of 85 and 115 BHN. These levels conform to the most common levels observed in the commercial application of these alloys. Aging treatments were carried out at 155, 180, 200, and 220°C for 4 hours, followed by air cooling, as well as at 180 and 220°C for 2, 4, 6, and 8 h to determine the conditions under which the specified hardness levels of 85 and Brinell Hardness Number (BHN) of 115 could be obtained. Gonzalez-Martınez, et. al. [14] investigated the age hardening of different magnesium wrought alloys (magnesium- aluminum zinc series) by damping measurements and by hardness. It was found that the precipitation hardening temperature significantly accelerate the damping and the hardening of the specimens. The precipitation processes in Al–Cu–Mg alloys which fall within the (α+S) region of the ternary phase diagram have been the subject of numerous research due to their fundamental and commercial interest since the discovery of the alloy duralumin in 1906. Since then, they have been studied mainly by mechanical testing, calorimetric measurements and electron microscopy observations. Two hardness stages are observable during ageing at medium temperatures, which are the rapid initial rise (about 50–70% of the total hardness increase), and the second rise, which is much slower than the first one. In semi-logarithmic representation, they are separated by a sort of plateau whose duration depends strongly on temperature and alloy composition. In normal scale, a plateau does not always appear [15].
2. DESIGN OF EXPERIMENTS The Experiment was designed based on the design of experiment (DOE) tool using MINITAB software. After design the experiment (select factors and levels), the MINTAB used to
Vol.10, No.6 The Effect of Time, Percent of Copper and Nickel 483
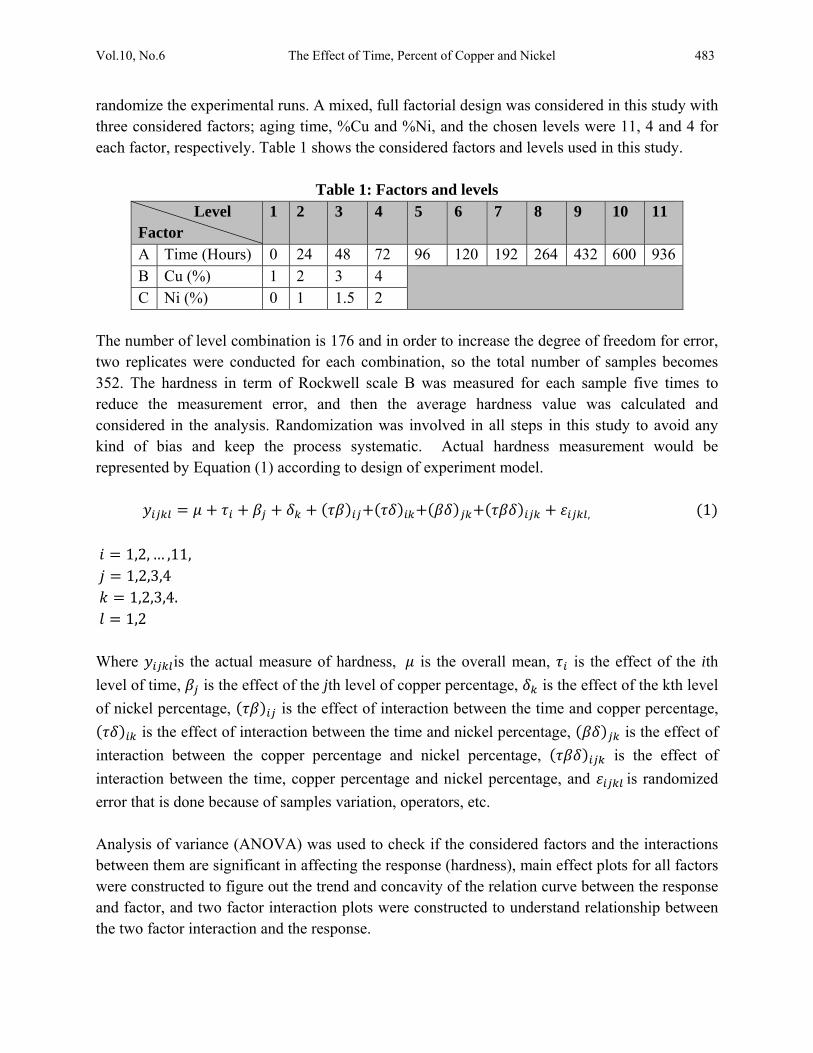
randomize the experimental runs. A mixed, full factorial design was considered in this study with three considered factors; aging time, %Cu and %Ni, and the chosen levels were 11, 4 and 4 for each factor, respectively. Table 1 shows the considered factors and levels used in this study.
Table 1: Factors and levels
Level Factor
1 2 3 4 5 6 7 8 9 10 11
A Time (Hours) 0 24 48 72 96 120 192 264 432 600 936B Cu (%) 1 2 3 4 C Ni (%) 0 1 1.5 2
The number of level combination is 176 and in order to increase the degree of freedom for error, two replicates were conducted for each combination, so the total number of samples becomes 352. The hardness in term of Rockwell scale B was measured for each sample five times to reduce the measurement error, and then the average hardness value was calculated and considered in the analysis. Randomization was involved in all steps in this study to avoid any kind of bias and keep the process systematic. Actual hardness measurement would be represented by Equation (1) according to design of experiment model.
, 1
1,2, … ,11, 1,2,3,4 1,2,3,4. 1,2 Where is the actual measure of hardness, is the overall mean, is the effect of the ith
level of time, is the effect of the jth level of copper percentage, is the effect of the kth level
of nickel percentage, is the effect of interaction between the time and copper percentage,
is the effect of interaction between the time and nickel percentage, is the effect of
interaction between the copper percentage and nickel percentage, is the effect of
interaction between the time, copper percentage and nickel percentage, and is randomized
error that is done because of samples variation, operators, etc. Analysis of variance (ANOVA) was used to check if the considered factors and the interactions between them are significant in affecting the response (hardness), main effect plots for all factors were constructed to figure out the trend and concavity of the relation curve between the response and factor, and two factor interaction plots were constructed to understand relationship between the two factor interaction and the response.
484 M.M. Hamasha, A.T. Mayyas, M.T. Hayajneh, A.M. Hassan Vol.10, No.6
Because ANOVA is based on F-test which is sensitive to normality in the distribution of error, the normality validation was done before applying ANOVA. Also to avoid any noise that arises during experimental work, validation for randomization in the experimental run was done as well.
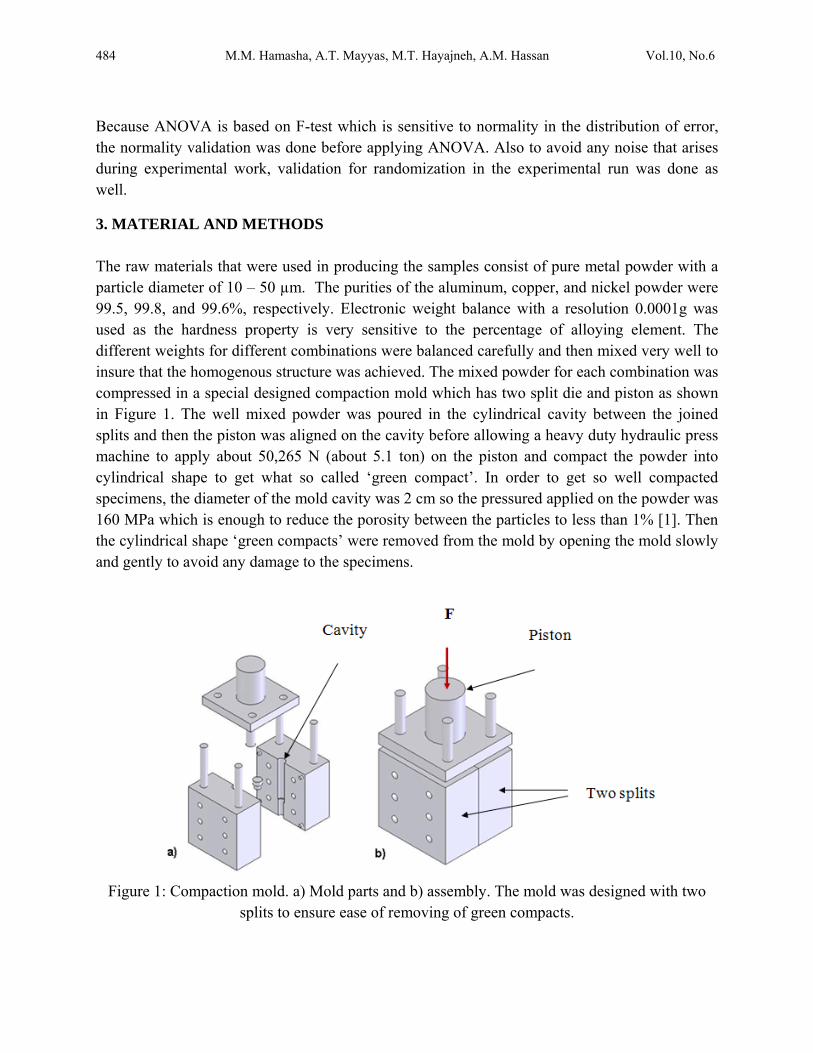
3. MATERIAL AND METHODS The raw materials that were used in producing the samples consist of pure metal powder with a particle diameter of 10 – 50 µm. The purities of the aluminum, copper, and nickel powder were 99.5, 99.8, and 99.6%, respectively. Electronic weight balance with a resolution 0.0001g was used as the hardness property is very sensitive to the percentage of alloying element. The different weights for different combinations were balanced carefully and then mixed very well to insure that the homogenous structure was achieved. The mixed powder for each combination was compressed in a special designed compaction mold which has two split die and piston as shown in Figure 1. The well mixed powder was poured in the cylindrical cavity between the joined splits and then the piston was aligned on the cavity before allowing a heavy duty hydraulic press machine to apply about 50,265 N (about 5.1 ton) on the piston and compact the powder into cylindrical shape to get what so called ‘green compact’. In order to get so well compacted specimens, the diameter of the mold cavity was 2 cm so the pressured applied on the powder was 160 MPa which is enough to reduce the porosity between the particles to less than 1% [1]. Then the cylindrical shape ‘green compacts’ were removed from the mold by opening the mold slowly and gently to avoid any damage to the specimens.
Figure 1: Compaction mold. a) Mold parts and b) assembly. The mold was designed with two
splits to ensure ease of removing of green compacts.
Vol.10, No.6 The Effect of Time, Percent of Copper and Nickel 485
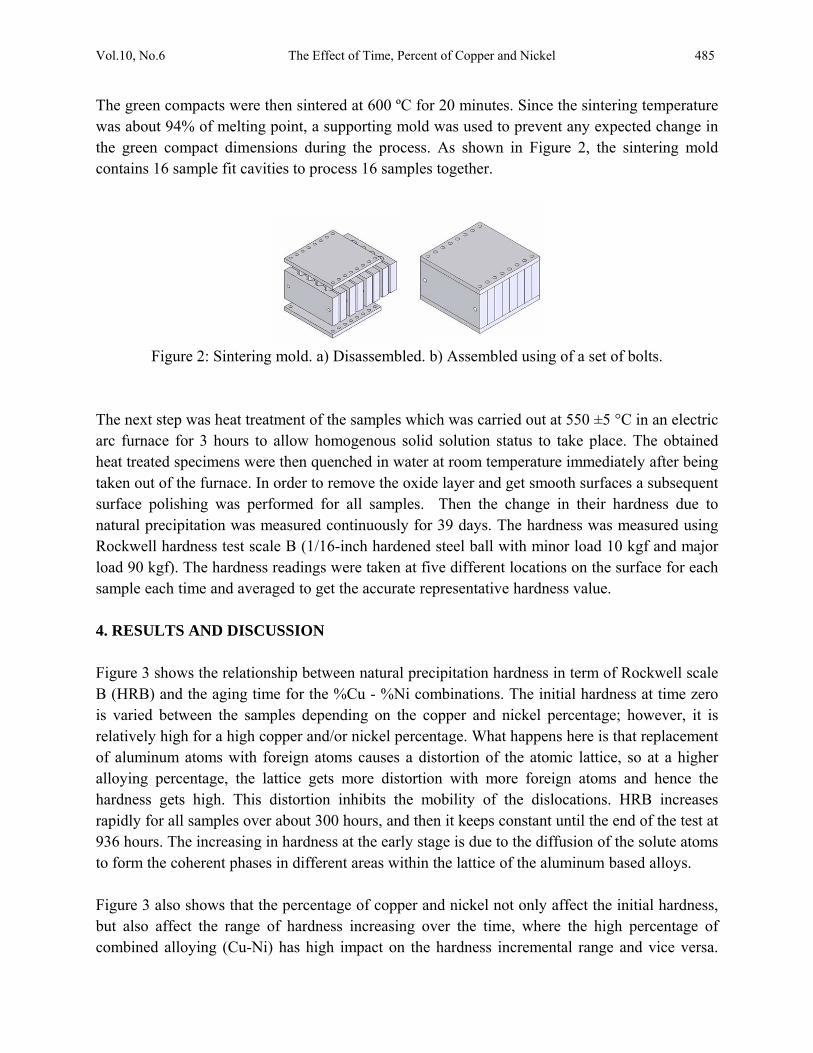
The green compacts were then sintered at 600 ºC for 20 minutes. Since the sintering temperature was about 94% of melting point, a supporting mold was used to prevent any expected change in the green compact dimensions during the process. As shown in Figure 2, the sintering mold contains 16 sample fit cavities to process 16 samples together.
Figure 2: Sintering mold. a) Disassembled. b) Assembled using of a set of bolts.
The next step was heat treatment of the samples which was carried out at 550 ±5 °C in an electric arc furnace for 3 hours to allow homogenous solid solution status to take place. The obtained heat treated specimens were then quenched in water at room temperature immediately after being taken out of the furnace. In order to remove the oxide layer and get smooth surfaces a subsequent surface polishing was performed for all samples. Then the change in their hardness due to natural precipitation was measured continuously for 39 days. The hardness was measured using Rockwell hardness test scale B (1/16-inch hardened steel ball with minor load 10 kgf and major load 90 kgf). The hardness readings were taken at five different locations on the surface for each sample each time and averaged to get the accurate representative hardness value. 4. RESULTS AND DISCUSSION
Figure 3 shows the relationship between natural precipitation hardness in term of Rockwell scale B (HRB) and the aging time for the %Cu - %Ni combinations. The initial hardness at time zero is varied between the samples depending on the copper and nickel percentage; however, it is relatively high for a high copper and/or nickel percentage. What happens here is that replacement of aluminum atoms with foreign atoms causes a distortion of the atomic lattice, so at a higher alloying percentage, the lattice gets more distortion with more foreign atoms and hence the hardness gets high. This distortion inhibits the mobility of the dislocations. HRB increases rapidly for all samples over about 300 hours, and then it keeps constant until the end of the test at 936 hours. The increasing in hardness at the early stage is due to the diffusion of the solute atoms to form the coherent phases in different areas within the lattice of the aluminum based alloys. Figure 3 also shows that the percentage of copper and nickel not only affect the initial hardness, but also affect the range of hardness increasing over the time, where the high percentage of combined alloying (Cu-Ni) has high impact on the hardness incremental range and vice versa.

486 M.M. Hamasha, A.T. Mayyas, M.T. Hayajneh, A.M. Hassan Vol.10, No.6
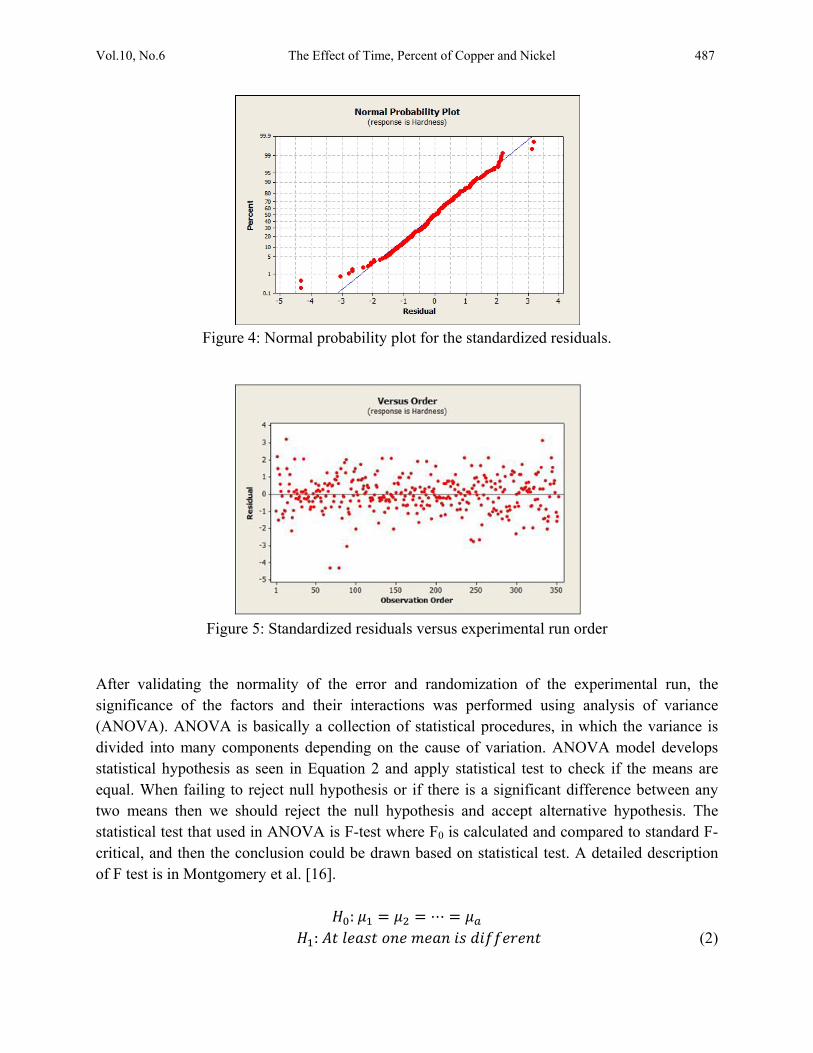
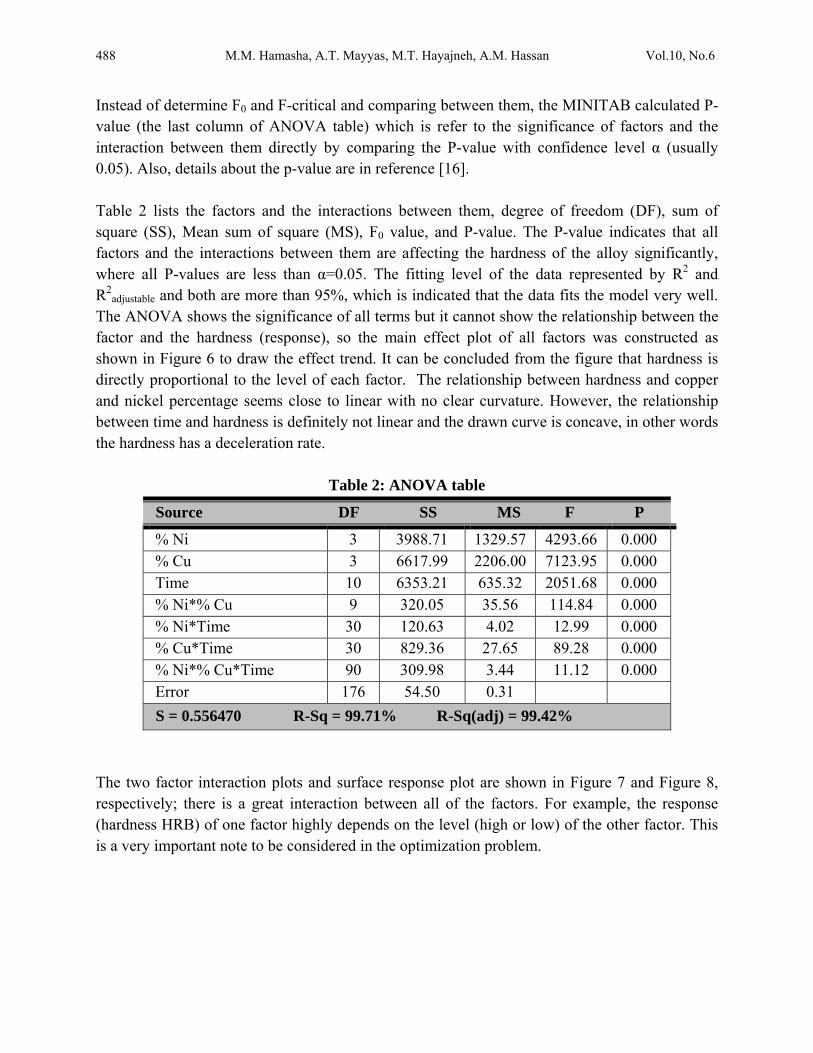
For example, 23.5 is the maximum increasing range for the combination of 4 % copper and 2 % nickel and 5 is the minimum increasing range for the combination of 1 % copper and 0 % nickel. This is partially due to the fact that as the alloying element increases, the amount of the precipitated coherent inside the lattice increased. An over-aging was not observed in all of the shown curves, as no curve showed a reduction in hardness. It seems that the time of 936 hours was too short for the considered alloys to allow the complete separation of the true non-coherent phases, which cause the phenomenon of over- aging to occur. Design of experiment (DOE) was involved in this research to analyze the total set of data and draw the conclusion. The normality of the error is an important assumption for any unbiased model. Figure 4 shows the normal probability plot. The linearity of the relation refers to the normality of the standardized error. As seen in the figure, almost all points is located on a linear line except few points which cluster themselves in the lower left side and upper right side of the line. Hence, one can conclude that the standardized error is very close to normal distribution and the model is valid for further analysis. To avoid any occurrence of any unintentionally run order trend, the observation order versus standardized error was plotted as shown in Figure 5; however, the standardized residual points are distributed around the zero and there is no sign of non randomized patterns within the data points. So the run order-related effects have no signs of adverse impact on the experimental data.
Figure 3: Effect of copper and nickel percentage on the natural precipitation hardness over 936 hours
15
35
55
0 200 400 600 800 1000
Hrandes HRB
Time ( Hours)
1% Cu, 0% Ni2% Cu, 0% Ni3% Cu, 0% Ni4% Cu, 0% Ni1% Cu, 1% Ni2% Cu, 1% Ni3% Cu, 1% Ni4% Cu, 1% Ni1% Cu, 1.5% Ni2% Cu, 1.5% Ni3% Cu, 1.5% Ni4% Cu, 1.5% Ni1% Cu, 2% Ni2% Cu, 2% Ni3% Cu, 2% Ni4% Cu, 2% Ni
Vol.10, No.6 The Effect of Time, Percent of Copper and Nickel 487
Figure 4: Normal probability plot for the standardized residuals.
Figure 5: Standardized residuals versus experimental run order
After validating the normality of the error and randomization of the experimental run, the significance of the factors and their interactions was performed using analysis of variance (ANOVA). ANOVA is basically a collection of statistical procedures, in which the variance is divided into many components depending on the cause of variation. ANOVA model develops statistical hypothesis as seen in Equation 2 and apply statistical test to check if the means are equal. When failing to reject null hypothesis or if there is a significant difference between any two means then we should reject the null hypothesis and accept alternative hypothesis. The statistical test that used in ANOVA is F-test where F0 is calculated and compared to standard F-critical, and then the conclusion could be drawn based on statistical test. A detailed description of F test is in Montgomery et al. [16].
: ⋯ : (2)
488 M.M. Hamasha, A.T. Mayyas, M.T. Hayajneh, A.M. Hassan Vol.10, No.6
Instead of determine F0 and F-critical and comparing between them, the MINITAB calculated P-value (the last column of ANOVA table) which is refer to the significance of factors and the interaction between them directly by comparing the P-value with confidence level α (usually 0.05). Also, details about the p-value are in reference [16]. Table 2 lists the factors and the interactions between them, degree of freedom (DF), sum of square (SS), Mean sum of square (MS), F0 value, and P-value. The P-value indicates that all factors and the interactions between them are affecting the hardness of the alloy significantly, where all P-values are less than α=0.05. The fitting level of the data represented by R2 and R2
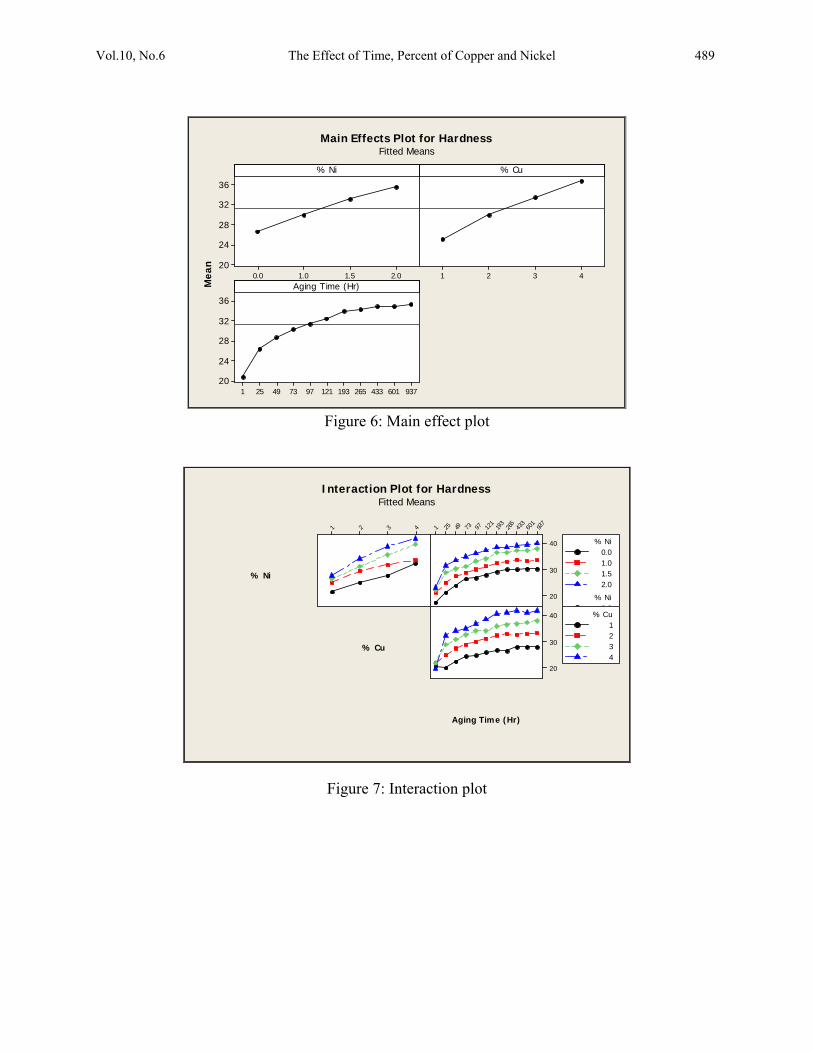
adjustable and both are more than 95%, which is indicated that the data fits the model very well. The ANOVA shows the significance of all terms but it cannot show the relationship between the factor and the hardness (response), so the main effect plot of all factors was constructed as shown in Figure 6 to draw the effect trend. It can be concluded from the figure that hardness is directly proportional to the level of each factor. The relationship between hardness and copper and nickel percentage seems close to linear with no clear curvature. However, the relationship between time and hardness is definitely not linear and the drawn curve is concave, in other words the hardness has a deceleration rate.
Table 2: ANOVA table
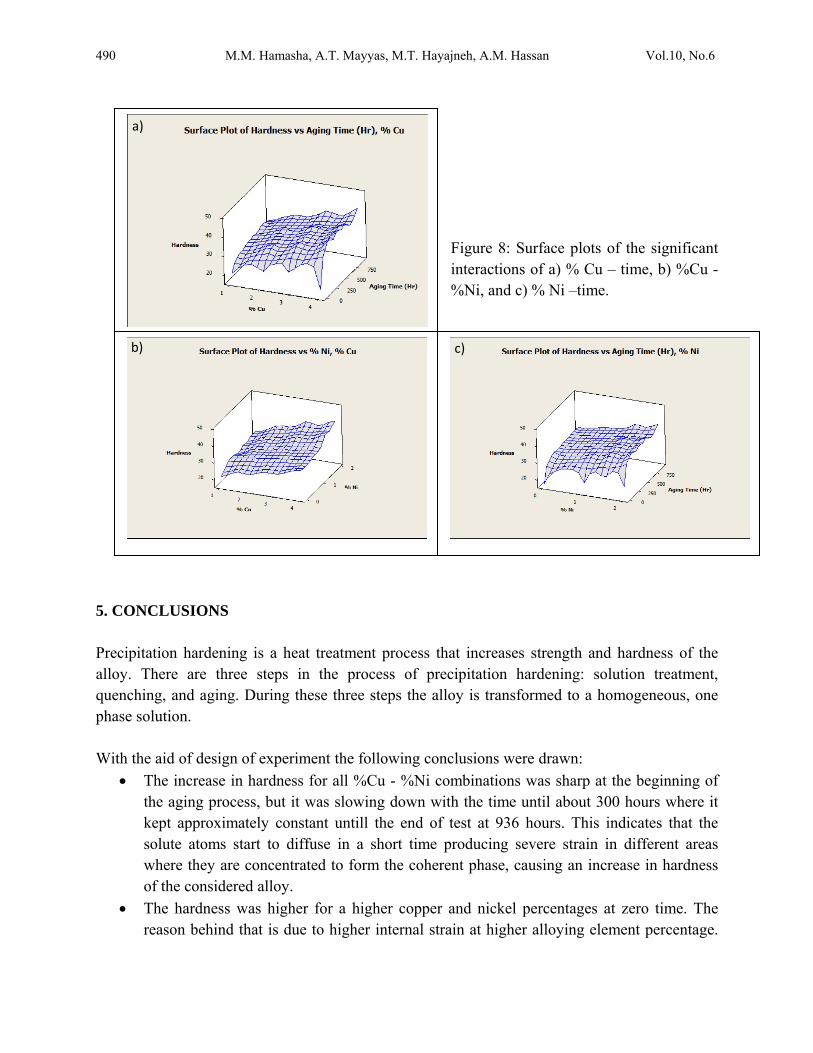
The two factor interaction plots and surface response plot are shown in Figure 7 and Figure 8, respectively; there is a great interaction between all of the factors. For example, the response (hardness HRB) of one factor highly depends on the level (high or low) of the other factor. This is a very important note to be considered in the optimization problem.
Source DF SS MS F P
% Ni 3 3988.71 1329.57 4293.66 0.000 % Cu 3 6617.99 2206.00 7123.95 0.000 Time 10 6353.21 635.32 2051.68 0.000 % Ni*% Cu 9 320.05 35.56 114.84 0.000 % Ni*Time 30 120.63 4.02 12.99 0.000 % Cu*Time 30 829.36 27.65 89.28 0.000 % Ni*% Cu*Time 90 309.98 3.44 11.12 0.000 Error 176 54.50 0.31
S = 0.556470 R-Sq = 99.71% R-Sq(adj) = 99.42%
Vol.10, No.6 The Effect of Time, Percent of Copper and Nickel 489
2.01.51.00.0
36
32
28
24
204321
937601433265193121977349251
36
32
28
24
20
% Ni
Mea
n
% Cu
Aging Time (Hr)
Main Effects Plot for HardnessFitted Means
Figure 6: Main effect plot
4321 937
601
433
265
193
121
977349251
40
30
20
40
30
20
% Ni
% Cu
Aging Time (Hr)
0.01.01.52.0
% Ni
0.01.01.52.0
% Ni
1234
% Cu
Interaction Plot for HardnessFitted Means
Figure 7: Interaction plot
490 M.M. Hamasha, A.T. Mayyas, M.T. Hayajneh, A.M. Hassan Vol.10, No.6
Figure 8: Surface plots of the significant interactions of a) % Cu – time, b) %Cu - %Ni, and c) % Ni –time.
5. CONCLUSIONS Precipitation hardening is a heat treatment process that increases strength and hardness of the alloy. There are three steps in the process of precipitation hardening: solution treatment, quenching, and aging. During these three steps the alloy is transformed to a homogeneous, one phase solution. With the aid of design of experiment the following conclusions were drawn:
The increase in hardness for all %Cu - %Ni combinations was sharp at the beginning of the aging process, but it was slowing down with the time until about 300 hours where it kept approximately constant untill the end of test at 936 hours. This indicates that the solute atoms start to diffuse in a short time producing severe strain in different areas where they are concentrated to form the coherent phase, causing an increase in hardness of the considered alloy.
The hardness was higher for a higher copper and nickel percentages at zero time. The reason behind that is due to higher internal strain at higher alloying element percentage.
c)
a)
b)

Vol.10, No.6 The Effect of Time, Percent of Copper and Nickel 491
Also the hardness increasing range was more at higher copper and nickel percentages. This is due to higher amount of alloying atoms available for diffusing to form more coherent phases and add more internal strain to the material.
Over-aging was not observed regardless of the used composition of the different alloying elements. It seems that the true separation of the non-coherent phases does not occur, because of the short period of the testing time in the present work.
REFERENCES
1. ASM Metals Hand book, Properties and Selection: Nonferrous Alloys and Special-Purpose Materials 2 (1990): 169-487.
2. ASM Metals Handbook, vol. 2. Properties and Selections: Nonferrous Alloys and Pure Metals, 10th Ed.; 1979. p. 81–2.
3. W. Smith, J. Hashemi, Foundations of Material Science and Engineering, Fourth Edition, McGraw-Hill International, 2006.
4. H.D. Chapra. B.C. Muddle. I.J. Polmear. The structure of primary strengthening precipitates in an Al-1.5wt% Cu-4.0wt% Mg- 0.5wt% Ag alloy. Philosophical magazine letters 1996, 73 (6) 351- 357.
5. R.D. Askeland, P.P. Phulé. Materials science and engineering. 4th edition, 2003 Brooks/Cole.
6. W.S. Miller, L. Zhuang, J. Bottema, A.J. Wittebrood. P. D. Smet, A, Haszler, A. Vieregge. Recent developments in aluminum alloys for the automotive industry. Materials Science and Engineering 280 (2000): 37–49.
7. B.L. Ou, and Chin-Hui Shen. Effect of preaging on precipitation behavior in Aluminum alloy 6063 during high-temperature aging. Scandinavian Journal of Metallurgy 2004; 33: 105–112.
8. N. Oneda, M. Shimura, Y. Takeuchi. The effect of preaging on the artificial precipitation-hardening of an Al-1.32wt% Mg2Si alloy. Light Metal 19 (1969): 41.
9. I. Özbek. A study on the re-solution heat treatment of AA 2618 aluminum alloy. Materials Characterization 58 (2007): 312–317.
10. M.N. Desmukh, R.K. Pandey, A.K. Mukhopadhyay. Effect of aging treatments on the kinetics of fatigue crack growth in 7010 aluminum alloy. Materials Science and Engineering (2006): 318–326.
11. M. Zeren. The effect of heat-treatment on aluminum-based piston alloys. Materials and Design 28 (2007): 2511-2517.
12. P. Ouellet, F.H. Samuel, J. Investigation study of 356 and 319 Al alloys. Journal of Material Science 34 (1999): 4671–4697.
13. R. González-Martínez, J. Göken, D. Letzig, K. Steinhoff, K.U. Kainer. Influence of aging on damping of the magnesium-aluminum-zinc Series. Journal of alloys and compounds 437 (1-2) (2007): 127-132.
492 M.M. Hamasha, A.T. Mayyas, M.T. Hayajneh, A.M. Hassan Vol.10, No.6
14. A. M. Zahra, C.Y. Zahra, M. Dumont. Effects of Ag or Si on precipitation in the alloy Al-2.5 mass% Cu-1.5 mass% Mg. Philosophical Magazine, 2005, 85 (31) 3735–3754.
15. S. Szczepanik, T. Sleboda, The influence of hot deformation and heat treatment on the properties of P/M Al-Cu composites. Journal of materials processing technology 60 (1996) 729-733.
16. Montgomery, D.C., Runger, G.C., Hubele, N.F., 2006. Engineering Statistics, 4th ed. John Wiley & Sons, Inc., New York (Chapter 7).