Embed Size (px)
Citation preview

TaE
MP
ARRAA
KLADSe
1
rwnthT[atfToamtfmiti
0h
Fluid Phase Equilibria 353 (2013) 50– 60
Contents lists available at SciVerse ScienceDirect
Fluid Phase Equilibria
j our na l ho me pa ge: www.elsev ier .com/ locate / f lu id
he effect of temperature on the liquid–liquid equilibria of someliphatic alcohols + di-sodium hydrogen citrate + water systems:xperimental and correlation
ohammed Taghi Zafarani-Moattar ∗, Parisa Jafarihysical Chemistry Department, University of Tabriz, Tabriz 51664, Iran
a r t i c l e i n f o
rticle history:eceived 20 February 2013eceived in revised form 19 May 2013ccepted 27 May 2013vailable online 5 June 2013
a b s t r a c t
Liquid–liquid equilibrium data for the ternary systems (1-propanol, 2-propanol, 2-methyl-2-propanol,1-butanol and 2-butanol + di-sodium hydrogen citrate + water) were measured at T = 298.15, 308.15 and318.15 K. The phase-separation ability of the studied systems was discussed on the basis of the solubilityof the constitutive alcohol. Furthermore, the effect of temperature on the tie-line at investigated systemswas discussed. The Merchuk equation with three parameters as the temperature dependency form was
eywords:iquid–liquid equilibriumlcoholsi-sodium hydrogen citrateetschenow-type equation, generalized-NRTL model, generalized Wilson model
successfully used for the correlation of binodal data in working temperatures. In addition, the experi-mental tie-line data were reproduced using the Setschenow-type equation, the generalized e-NRTL andgeneralized Wilson models.
© 2013 Elsevier B.V. All rights reserved.
. Introduction
The salt mixed solvent plays an important role in scientificesearch and chemical industry [1]. In recent years liquid extractionith salt has become a useful separation and purification tech-ology in chemical and biological process [2,3]. This extractionechnology offers the advantages of easy processing on any scale,igh capacity, easy and precise scale up and high product yield [4].he salts used are usually phosphate [5], citrates [6] or sulphates4]. When a ternary electrolyte mixture leads to two liquid phases,ll three components are present in both phases. The composi-ions of the two liquid phases are determined by intermolecularorces, hydrogen bonding, and ionic forces that have dissolved ions.his effect may be used to recover salts from concentrated aque-us solution. The opposite process can occur if a salt is added ton aqueous binary system. When the ions are dissolved, the waterolecules that surround the ions become unavailable for nonelec-
rolyte solution. Meanwhile, the nonelectrolyte becomes salted outrom the aqueous phase. Therefore, the solubility data of a salt in
ixed solvent and liquid–liquid equilibria (LLE) data are both very
mportant for designing these two processes. The effect of salt onhe LLE of (alcohols + salt + water) systems has been recently stud-ed [7–11]. The formation of the (hydrophilic alcohol + salt + water)∗ Corresponding author. Tel.: +98 411 3393135; fax: +98 411 3340191.E-mail address: [email protected] (M.T. Zafarani-Moattar).
378-3812/$ – see front matter © 2013 Elsevier B.V. All rights reserved.ttp://dx.doi.org/10.1016/j.fluid.2013.05.031
systems is generally believed to be attributable to the “salting-out”effect of salts [12]. The competition between salts and other phase-forming substances for water molecules leads to the formation oftwo or three phases. LLE is a key for improving the performanceof an extraction process and understanding the phase behavior ofsystems that exhibit two liquid phases.
In recent years many research groups have focused their atten-tion on the measurement of new two-phase equilibrium data foraqueous alcohol + salt systems. As examples, Taboada [13], Hu et al.[14], Chou and Tanokia [15], Nemati-Kande and Shekaaei [16], andZafarani-Moattar et al. [17] reported the effect of salt and alcohol-type on the phase-forming ability of the relevant aqueous biphasicsystems (ABSs). The effect of temperature on the ABSs composedof some (aliphatic alcohols + potassium carbonate + water) was dis-cussed by Salabat and Hashemi [18]. The effect of alcohol type andtemperature on the phase separation ability of some (aliphatic alco-hols + di-potassium oxalate + water) systems has also been studied[19]. Furthermore, the thermodynamic investigation of the LLE datausing reliable models in such ABSs is an important goal for thesestudies.
In this work, the binodal and tie-line data are reported for1-propanol, 2-propanol, 2-methyl-2-propanol, 1-butanol and 2-butanol + di-sodium hydrogen citrate + water ternary systems at
T = 298.15, 308.15 and 318.15 K. The effect of temperature for thesesystems has not been published previously. At 298.15 K, some LLEdata have been reported for 1-propanol, 2-propanol, 2-methyl-2-propanol + di-sodium hydrogen citrate + water systems recently
M.T. Zafarani-Moattar, P. Jafari / Fluid Phase Equilibria 353 (2013) 50– 60 51
Table 1A brief summary of the purity of the used materials.
Materiala CAS No. Purity M (g mol−1) d (kg m−3) ε (c2 J−1 m−1)
298.15 308.15 318.15 298.15f 308.15f 318.15f
1-Propanol 71-23-8 >0.995 60.096 799.54b 792.27b 784.20b 20.18 19.05 17.162-Propanol 67-63-0 >0.995 60.096 781.10b 772.88b 763.97b 19.85 17.76 16.151-Butanol 71-36-3 >0.995 74.123 793.20c 765.30c 754.20c 16.20 15.32 14.202-Butanol 78-92-2 >0.995 74.123 803.35d 793.21d 788.511d 15.90 14.50 13.102-Methyl-2-propanol 75-65-0 >0.995 74.123 784.30e 768.36e 756.327e 12.47 10.80 9.87Na2C6H6O7 6132-5-4 >0.990 263.88
a Both materials were supplied from Merck.b Taken from Ref. [26].c Taken from Ref. [27].
[awSW
2
2
at
2
2
tpcwwS
2aipicamwTciaf
n
htrlittT
Comparison between the binodal curves of studied systemsat T = 298.15 K shown in Fig. 6 indicates that the area of thetwo-phase region has the following order: 1-butanol > 2-butanol >
0
10
20
30
40
50
60
70
80
0
10
20
30
40
50
60
70
80
0 5 10 15 20 25 30 35 40
100w m
100ws
Fig. 1. Plot of mass percent alcohol against mass percent salt to illustrate theeffect of temperature on the binodal curve, slope and length of tie-lines of the
d Taken from Ref. [27].e Taken from Ref. [28].f Taken from Ref. [32].
16]. In this work for reproducing the experimental binodal datat different temperatures an empirical nonlinear expression [20]as used. Moreover, the experimental tie-lines were fitted with
etschenow-type equation [21], the e-NRTL [22] and generalizedilson [23] models.
. Experimental
.1. Materials
Physicochemical properties of the chemicals used in this workre described in Table 1. All the chemicals were used without fur-her purification and double distilled deionizied water was used.
.2. Apparatus and procedure
.2.1. Liquid–liquid equilibrium (LLE)The experimental apparatus employed is essentially similar to
he one used at previous works [5,22]. The binodal curves werelotted by clouding point titration method. In this method, theomposition of the mixture for each point on the binodal curveas determined from the amount of titrant added until turbidityas observed using an analytical balance (Shimatzu, 321-34553,
himatzu Co., Japan) with a precision of ±1.10−7 kg.For determination of the tie-lines, feed samples (about
× 10−5 m3) were prepared by mixing appropriate amounts oflcohol, salt and water in the vessel. Then these vessels were placedn the thermostat (JULABO model MB, Germany) at working tem-erature with an accuracy of ±0.02 K for at least 48 h to separate
nto two clear phases. After separations of the two phases, the con-entrations of di-sodium hydrogen citrate (Na2C6H6O7) in the topnd bottom phases were determined by flame photometer (JENVEYodel PFP7, England). The concentration of alcohols in both phasesas determined by refractive index measurements performed at
= 298.15 K using a refractometer (ATAGO DR-A1, Japan) with a pre-ision of ±0.0001. The uncertainty in refractive index measurements ±0.0002. For dilute aqueous solutions containing an alcohol and
salt, the relation between the refractive index, nD, and the massractions of alcohol, wm, and salt, ws is given by:
D = n0 + amwm + asws (1)
ere n0 is the refractive index of pure water for which we obtainedhe value of 1.3325 at T = 298.15 K. Two constants am and as cor-esponding to alcohol and salt, respectively, are obtained from theinear calibration plots of refractive index of the solution. However,
t should be noted that Eq. (1) is only valid for dilute solutions,herefore before refractive index measurements, it was necessaryo dilute the samples to be at mass fraction C range as indicated inable 2. The uncertainty for mass fraction of alcohol achieved bythis method and Eq. (1) was better than 0.002. The value of theseconstants and respective correlation coefficient values, R2, are givenin Table 2.
3. Results and discussion
3.1. Experimental binodal curves and tie-line data
For the aqueous alcohols + di-sodium hydrogen citrate systems,the binodal data and tie-line compositions determined experi-mentally at different temperatures are given in Tables 3 and 4–6,respectively. Additionally, the phase diagrams of the studiedaqueous two-phase systems (ATPSs) are shown in Figs. 1–5.In Fig. 6 experimental binodal curves for the investigated sys-tems at 298.15 K are shown and compared with the binodalcurves obtained recently at 298.15 K for 1-propanol, 2-propanol, 2-methyl-2-propanol + di-sodium hydrogen citrate + water systems[16]. This figure shows that there is a good agreement betweenour data and the literature [16] for these three systems.
3.2. Phase separation ability of the different alcohols
{1-propanol (m) + di-sodium hydrogen citrate (s) + water (w)} system: ( ) binodaldata at T = 298.15 K, ( ) binodal data at T = 318.15 K, (solid line) the calculated bin-odals from Eq. (4), ( ) tie-lines data at T = 298.15 K, ( ) tie-lines data atT = 318.15 K, obtained by connecting the experimental equilibrium phase composi-tion data.

52 M.T. Zafarani-Moattar, P. Jafari / Fluid Phase Equilibria 353 (2013) 50– 60
Table 2Values of the parameters of Eq. (1), am , for {alcohols (m) + di-sodium hydrogen citrate (s) + water (w)} systems.
Material Constant Value C range (w/w) aR2
1-Propanol am 0.0910 0–0.10 0.99942-Propanol am 0.0870 0–0.10 0.99941-Butanol am 0.1070 0–0.10 0.99982-Butanol am 0.1025 0–0.10 0.99982-Methyl-2-propanol am 0.0991 0–0.10 0.9996Na2C6H6O7 as 0.1305 0–0.08 0.9998
a R2 represented respective correlation coefficient value of the linear calibration plot of the refractive index against mass fraction for alcohols and di-sodium hydrogencitrate at the mass fraction range (C range) of each material.
Table 3Experimental binodal data in mass fraction, wi , for {alcohols (m) + di-sodium hydrogen citrate (s) + water (w)} systems at T = 298.15, 308.15 and 318.15 K.a
1-Propanol 2-Propanol 1-Butanol 2-Butanol 2-Methyl-2-propanol
100wmb 100ws
b 100wm 100ws 100wm 100ws 100wm 100ws 100wm 100ws
T = 298.15 K15.95 13.03 23.94 13.44 4.50 14.37 6.15 15.46 17.28 9.6916.36 12.88 24.13 13.34 4.27 13.01 6.31 14.96 17.64 9.5216.51 12.80 24.16 13.30 4.18 12.16 6.38 14.18 18.08 9.2416.63 12.71 24.27 13.26 4.12 11.46 6.81 12.87 19.29 8.6316.79 12.56 24.31 13.20 4.36 11.23 7.11 11.95 19.95 8.3717.02 12.45 24.45 13.13 4.38 10.58 7.38 11.22 20.62 8.1017.32 12.25 24.54 13.03 4.43 9.62 7.74 10.28 21.36 7.8018.43 11.47 24.80 12.94 4.47 8.36 7.99 9.40 22.14 7.5419.09 11.11 25.01 12.81 4.65 7.62 8.45 8.55 23.08 7.2119.75 10.78 25.33 12.62 4.86 6.73 8.83 7.85 23.97 6.9320.57 10.34 25.61 12.42 5.07 6.08 9.14 6.97 25.21 6.5521.41 9.98 26.11 12.17 5.12 5.16 9.58 6.39 26.31 6.2622.47 9.52 26.53 11.90 5.37 4.66 9.94 5.71 27.51 5.9123.51 9.11 27.16 11.55 5.49 4.05 10.27 5.17 29.05 5.5524.74 8.68 27.72 11.21 5.58 3.57 30.81 5.0925.89 8.28 28.46 10.80 5.86 3.1927.36 7.83 29.14 10.41
T = 308.15 K2.89 46.63 3.37 41.91 3.94 13.07 7.00 12.82 11.74 13.993.17 43.56 3.53 41.44 4.12 12.48 7.20 12.47 11.96 13.923.43 43.00 3.76 40.70 4.21 12.06 7.25 12.11 12.31 13.773.97 39.83 3.96 40.01 4.34 11.57 7.30 11.63 12.43 13.444.41 37.67 4.25 39.25 4.43 11.08 7.44 11.32 12.93 12.724.79 35.25 4.50 37.73 4.56 10.23 7.66 10.84 13.14 12.255.26 32.90 4.93 36.52 4.64 9.51 7.79 10.16 13.46 11.645.82 31.55 5.36 35.37 4.71 8.38 8.12 8.63 14.09 11.356.58 29.52 6.01 33.59 4.94 7.81 8.41 7.92 14.54 10.697.34 28.23 6.65 31.90 4.99 6.70 8.78 7.40 15.25 10.308.31 26.56 7.50 30.33 5.20 6.09 9.11 6.69 15.86 9.649.21 25.20 8.14 28.60 5.30 4.54 9.44 6.14 16.81 9.27
12.78 21.45 9.19 27.02 9.66 5.44 17.68 8.6714.28 20.78 10.12 25.61 9.96 4.95 18.52 8.21
11.27 23.98 10.32 4.4212.34 22.67 10.78 4.07
T = 318.15 K38.69 9.75 22.17 13.94 6.71 15.12 2.04 17.22 4.05 17.1638.76 9.72 22.40 13.84 6.45 14.28 2.22 17.09 4.14 17.1038.81 9.70 22.58 13.78 5.78 12.18 2.49 16.76 4.31 17.0038.87 9.66 22.73 13.70 5.52 11.22 2.81 16.15 4.47 16.8838.90 9.61 22.94 13.61 5.47 10.59 3.20 15.71 4.75 16.7439.00 9.55 23.13 13.52 5.50 10.10 3.99 14.53 5.14 16.4738.99 9.45 23.44 13.37 5.36 9.10 4.42 13.93 5.54 16.1338.91 9.29 23.73 13.20 5.45 8.39 5.00 12.47 5.95 15.9239.08 9.20 24.13 12.93 5.60 7.79 5.55 11.71 6.48 15.2739.37 9.06 24.67 12.73 5.39 4.91 6.10 10.48 7.08 14.9939.51 8.88 25.29 12.42 5.59 4.65 6.56 9.49 7.59 14.5440.15 8.76 25.87 12.09 5.37 3.89 7.21 8.56 8.42 14.0640.78 8.59 26.74 11.70 5.48 3.45 7.82 7.77 9.42 13.2641.66 8.43 27.48 11.30 8.29 6.84 10.24 12.4242.21 8.18 28.47 10.84 8.85 6.13 11.54 11.8342.99 7.93 29.33 10.42 9.16 5.35 12.59 11.1343.63 7.69 13.67 10.27
a Uncertainties for mass fraction and temperature are 0.002 and 0.05 K, respectively.b wi represents mass fraction of component i.

M.T. Zafarani-Moattar, P. Jafari / Fluid Phase Equilibria 353 (2013) 50– 60 53
Table 4Experimental tie-line data in mass fraction, wi , for {alcohols (m) + di-sodium hydrogen citrate (s) + water (w)} systems at T = 298.15 K.a
Feed sampleb Top phase Bottom phase Slopec TLLc
100w′m 100w′
s 100wm 100ws 100wm 100ws
1-Propanol26.29 0.99 42.374 3.651 13.207 15.289 −2.506 31.4025.88 10.80 46.557 2.828 10.440 17.211 −2.511 38.8826.32 12.30 50.818 2.202 7.739 20.623 −2.339 46.8526.25 14.88 54.661 2.046 6.890 23.611 −2.215 52.41
2-Propanol31.99 12.27 45.736 3.971 8.749 27.127 −1.597 43.6431.95 14.04 48.491 2.845 7.636 29.323 −1.543 48.6831.58 15.84 51.054 1.829 7.336 32.541 −1.424 53.4332.17 18.09 54.248 1.362 6.806 37.028 −1.330 59.35
1-Butanol18.84 0.62 69.822 0.279 5.196 7.950 −8.425 65.0820.06 0.81 71.883 0.155 4.818 10.669 −6.378 67.8819.94 0.97 73.284 0.122 4.961 12.751 −5.410 69.4820.02 11.34 74.422 0.051 4.556 14.574 −4.811 71.3619.99 12.54 74.860 0.020 5.235 16.347 −4.264 71.51
2-Butanol20.02 12.00 67.773 0.145 4.856 15.113 −4.203 64.6720.06 14.02 70.321 0.122 4.502 17.902 −3.702 68.1820.01 16.03 72.796 0.095 4.455 20.998 −3.269 71.4720.04 18.01 73.845 0.083 4.376 23.138 −3.013 73.1920.04 20.05 74.460 0.058 4.291 25.506 −2.757 74.64
2-Methyl-2-propanol25.00 0.80 45.665 2.100 14.284 11.279 −3.419 32.7025.00 10.01 51.177 1.611 10.557 14.740 −3.094 42.6924.89 11.96 54.542 1.412 7.696 17.736 −2.870 49.6125.02 14.01 57.923 1.184 6.151 21.178 −2.589 55.5025.06 16.04 61.104 1.088 4.929 24.336 −2.416 60.80
ely.ctivelqs. (2
2soa
t
Fe{doTt
a Uncertainties for mass fraction and temperature are 0.002 and 0.02 K, respectivb w′
m and w′s are total mass fractions of alcohol and salt in its feed samples, respe
c The tie-line length (TLL) and slope at different concentrations calculated from E
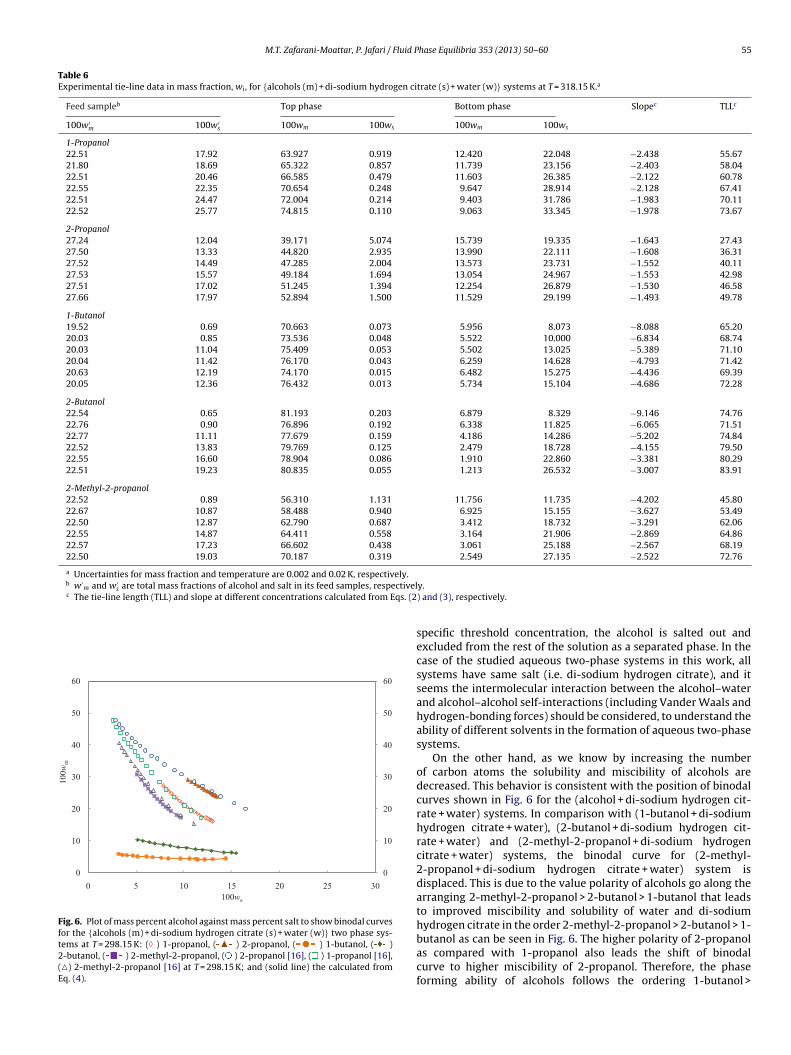
-methyl-2-propanol > 1-propanol > 2-propanol, therefore, phaseeparation ability of the studied alcohols is in the same order. At
ther temperatures (T = 308.15 and 318.15 K) similar behavior islso observed.This observation can be interpreted in terms of the concept ofhe kosmotropicity of salts. As discussed by Zafarani-Moattar et al.
0
10
20
30
40
50
60
0
10
20
30
40
50
60
0 10 20 30 40 50
100wm
100ws
ig. 2. Plot of mass percent alcohol against mass percent salt to illustrate theffect of temperature on the binodal curve, slope and length of tie-lines of the2-propanol (m) + di-sodium hydrogen citrate (s) + water (w)} system: ( ) binodalata at T = 298.15 K, ( ) binodal data at T = 318.15 K, (solid line) the calculated bin-dals from Eq. (4), ( ) tie-lines data at T = 298.15 K, ( ) tie-lines data at
= 318.15 K, obtained by connecting the experimental equilibrium phase composi-ion data.
y.) and (3), respectively.
[12], when the salt and the nonionic component such as alcoholare mixed together in an aqueous solution, the salt and the alcoholcompete with each other for the water molecules. The competitionis won by the one that has a stronger intermolecular interaction
with water (i.e. kosmotropic) and those of the alcohol lose, whichhas the weaker affinity to water, and as a result the alcohol–alcoholself-intermolecular interactions increased. Subsequently, at the0
10
20
30
40
50
60
70
80
0
10
20
30
40
50
60
70
80
0 5 10 15 20
100w m
100ws
Fig. 3. Plot of mass percent alcohol against mass percent salt to illustrate theeffect of temperature on the binodal curve, slope and length of tie-lines of the {1-butanol (m) + di-sodium hydrogen citrate (s) + water (w)} system: ( ) binodal data atT = 298.15 K, ( ) binodal data at T = 318.15 K, (solid line) the calculated binodals fromEq. (4), ( ) tie-lines data at T = 298.15 K, ( ) tie-lines data at T = 318.15 K,obtained by connecting the experimental equilibrium phase composition data.

54 M.T. Zafarani-Moattar, P. Jafari / Fluid Phase Equilibria 353 (2013) 50– 60
Table 5Experimental tie-line data in mass fraction, wi , for {alcohols (m) + di-sodium hydrogen citrate (s) + water (w)} systems at T = 308.15 K.a
Feed sampleb Top phase Bottom phase Slopec TLLc
100w′m 100w′
s 100wm 100ws 100wm 100ws
1-Propanol20.02 21.23 65.219 0.002 9.509 26.376 −2.112 61.6419.96 21.91 67.980 0.085 8.362 27.930 −2.141 65.8020.03 23.50 69.656 0.134 6.770 30.430 −2.076 69.8019.98 25.43 70.727 0.163 6.164 32.437 −2.000 72.1820.23 26.96 73.008 0.066 5.643 35.108 −1.922 75.9319.60 27.17 73.378 0.046 5.014 34.883 −1.962 76.73
2-Propanol25.04 20.86 51.240 1.920 6.260 33.120 −1.442 54.7424.48 21.69 54.531 1.824 5.867 33.850 −1.520 58.2625.01 22.57 55.708 0.407 5.184 36.309 −1.407 61.9824.05 24.14 59.969 0.395 4.904 37.082 −1.501 66.1724.71 25.31 63.717 0.644 4.555 38.904 −1.546 70.4624.47 25.68 63.780 0.010 4.052 40.211 −1.486 72.00
1-Butanol20.23 0.68 74.605 0.498 4.671 8.256 −9.015 70.3620.07 0.80 75.487 0.398 4.306 10.192 −7.268 71.8519.92 0.91 75.262 0.354 3.892 12.081 −6.086 72.3320.00 10.38 76.410 0.308 3.646 13.778 −5.402 74.0020.02 11.98 76.714 0.035 3.425 15.732 −4.669 74.9520.00 12.77 77.647 0.001 2.984 16.637 −4.488 76.49
2-Butanol20.02 0.731 80.516 0.364 8.224 8.831 −8.537 72.7920.01 0.914 80.976 0.007 7.176 11.212 −6.587 74.6520.12 11.04 81.086 0.006 6.938 13.309 −5.574 75.3319.99 12.87 82.559 0.012 6.839 15.873 −4.774 77.3619.99 14.87 83.453 0.004 6.147 17.976 −4.302 79.3719.37 15.83 83.872 0.001 5.746 19.139 −4.082 80.44
2-Methyl-2-propanol19.99 0.872 50.268 1.183 15.070 9.984 −3.999 36.2820.04 0.951 53.774 0.931 13.648 11.053 −3.964 41.3820.40 10.30 57.588 0.874 12.732 12.484 −3.863 46.3320.26 11.38 58.305 0.756 11.749 14.009 −3.513 48.4120.09 12.74 61.032 0.533 8.086 17.573 −3.107 55.6220.00 14.12 60.702 0.590 15.044 14.534 −3.274 47.74
a Uncertainties for mass fraction and temperature are 0.002 and 0.02 K, respectively.b w′
m and w′s are total mass fractions of alcohol and salt in its feed samples, respectively.
c The tie-line length (TLL) and slope at different concentrations calculated from Eqs. (2) and (3), respectively.
0
10
20
30
40
50
60
70
80
0
10
20
30
40
50
60
70
80
0 5 10 15 20 25 30
100w m
100ws
Fig. 4. Plot of mass percent alcohol against mass percent salt to illustrate theeffect of temperature on the binodal curve, slope and length of tie-lines of the {2-butanol (m) + di-sodium hydrogen citrate (s) + water (w)} system: ( ) binodal data atT = 298.15 K, ( ) binodal data at T = 318.15 K, (solid line) the calculated binodals fromEq. (4), ( ) tie-lines data at T = 298.15 K, ( ) tie-lines data at T = 318.15 K,obtained by connecting the experimental equilibrium phase composition data.
0
10
20
30
40
50
60
70
0
10
20
30
40
50
60
70
0 5 10 15 20 25 30
100w m
100ws
Fig. 5. Plot of mass percent alcohol against mass percent salt to illustrate the effectof temperature on the binodal curve, slope and length of tie-lines of the {2-methyl-2-propanol (m) + di-sodium hydrogen citrate (s) + water (w)} system: ( ) binodaldata at T = 298.15 K, ( ) binodal data at T = 318.15 K, (solid line) the calculated bin-odals from Eq. (4), ( ) tie-lines data at T = 298.15 K, ( ) tie-lines data atT = 318.15 K, obtained by connecting the experimental equilibrium phase composi-tion data.
M.T. Zafarani-Moattar, P. Jafari / Fluid Phase Equilibria 353 (2013) 50– 60 55
Table 6Experimental tie-line data in mass fraction, wi , for {alcohols (m) + di-sodium hydrogen citrate (s) + water (w)} systems at T = 318.15 K.a
Feed sampleb Top phase Bottom phase Slopec TLLc
100w′m 100w′
s 100wm 100ws 100wm 100ws
1-Propanol22.51 17.92 63.927 0.919 12.420 22.048 −2.438 55.6721.80 18.69 65.322 0.857 11.739 23.156 −2.403 58.0422.51 20.46 66.585 0.479 11.603 26.385 −2.122 60.7822.55 22.35 70.654 0.248 9.647 28.914 −2.128 67.4122.51 24.47 72.004 0.214 9.403 31.786 −1.983 70.1122.52 25.77 74.815 0.110 9.063 33.345 −1.978 73.67
2-Propanol27.24 12.04 39.171 5.074 15.739 19.335 −1.643 27.4327.50 13.33 44.820 2.935 13.990 22.111 −1.608 36.3127.52 14.49 47.285 2.004 13.573 23.731 −1.552 40.1127.53 15.57 49.184 1.694 13.054 24.967 −1.553 42.9827.51 17.02 51.245 1.394 12.254 26.879 −1.530 46.5827.66 17.97 52.894 1.500 11.529 29.199 −1.493 49.78
1-Butanol19.52 0.69 70.663 0.073 5.956 8.073 −8.088 65.2020.03 0.85 73.536 0.048 5.522 10.000 −6.834 68.7420.03 11.04 75.409 0.053 5.502 13.025 −5.389 71.1020.04 11.42 76.170 0.043 6.259 14.628 −4.793 71.4220.63 12.19 74.170 0.015 6.482 15.275 −4.436 69.3920.05 12.36 76.432 0.013 5.734 15.104 −4.686 72.28
2-Butanol22.54 0.65 81.193 0.203 6.879 8.329 −9.146 74.7622.76 0.90 76.896 0.192 6.338 11.825 −6.065 71.5122.77 11.11 77.679 0.159 4.186 14.286 −5.202 74.8422.52 13.83 79.769 0.125 2.479 18.728 −4.155 79.5022.55 16.60 78.904 0.086 1.910 22.860 −3.381 80.2922.51 19.23 80.835 0.055 1.213 26.532 −3.007 83.91
2-Methyl-2-propanol22.52 0.89 56.310 1.131 11.756 11.735 −4.202 45.8022.67 10.87 58.488 0.940 6.925 15.155 −3.627 53.4922.50 12.87 62.790 0.687 3.412 18.732 −3.291 62.0622.55 14.87 64.411 0.558 3.164 21.906 −2.869 64.8622.57 17.23 66.602 0.438 3.061 25.188 −2.567 68.1922.50 19.03 70.187 0.319 2.549 27.135 −2.522 72.76
a Uncertainties for mass fraction and temperature are 0.002 and 0.02 K, respectively.b w′
m and w′s are total mass fractions of alcohol and salt in its feed samples, respectivel
c The tie-line length (TLL) and slope at different concentrations calculated from Eqs. (2
0
10
20
30
40
50
60
0
10
20
30
40
50
60
0 5 10 15 20 25 30
100w m
100ws
Fig. 6. Plot of mass percent alcohol against mass percent salt to show binodal curvesfor the {alcohols (m) + di-sodium hydrogen citrate (s) + water (w)} two phase sys-tems at T = 298.15 K: ( ) 1-propanol, ( ) 2-propanol, ( ) 1-butanol, ( )2-butanol, ( ) 2-methyl-2-propanol, ( ) 2-propanol [16], ( ) 1-propanol [16],(�) 2-methyl-2-propanol [16] at T = 298.15 K; and (solid line) the calculated fromEq. (4).
y.) and (3), respectively.
specific threshold concentration, the alcohol is salted out andexcluded from the rest of the solution as a separated phase. In thecase of the studied aqueous two-phase systems in this work, allsystems have same salt (i.e. di-sodium hydrogen citrate), and itseems the intermolecular interaction between the alcohol–waterand alcohol–alcohol self-interactions (including Vander Waals andhydrogen-bonding forces) should be considered, to understand theability of different solvents in the formation of aqueous two-phasesystems.
On the other hand, as we know by increasing the numberof carbon atoms the solubility and miscibility of alcohols aredecreased. This behavior is consistent with the position of binodalcurves shown in Fig. 6 for the (alcohol + di-sodium hydrogen cit-rate + water) systems. In comparison with (1-butanol + di-sodiumhydrogen citrate + water), (2-butanol + di-sodium hydrogen cit-rate + water) and (2-methyl-2-propanol + di-sodium hydrogencitrate + water) systems, the binodal curve for (2-methyl-2-propanol + di-sodium hydrogen citrate + water) system isdisplaced. This is due to the value polarity of alcohols go along thearranging 2-methyl-2-propanol > 2-butanol > 1-butanol that leadsto improved miscibility and solubility of water and di-sodiumhydrogen citrate in the order 2-methyl-2-propanol > 2-butanol > 1-
butanol as can be seen in Fig. 6. The higher polarity of 2-propanolas compared with 1-propanol also leads the shift of binodalcurve to higher miscibility of 2-propanol. Therefore, the phaseforming ability of alcohols follows the ordering 1-butanol >
5 Fluid Phase Equilibria 353 (2013) 50– 60
2teat(tm((amdbmahoTb
3A
t3chwptrtgwthtoctf2mwpo
3
fc
T
S
R
3
3
t
0
10
20
30
40
50
60
70
80
0
10
20
30
40
50
60
70
80
0 5 10 15 20
100w m
100ws
Fig. 7. Plot of mass percent alcohol against mass percent salt to illustrate the effectof temperature on the binodal curve, slope and length of tie-lines of the {1-butanol(m) + di-sodium hydrogen citrate (s) + water (w)} system: ( ) experimental,( ) calculated tie-lines from generalized NRTL (e-NRTL) at T = 298.15 K, ( )
6 M.T. Zafarani-Moattar, P. Jafari /
-butanol > 2-methyl-2-propanol > 1-propanol > 2-propanol. Onhe other point of view, boiling point may be considered as anfficient criterion to represent the self-interaction forces betweenlcohol molecules, as pointed out by Wang et al. [7,28]. Therefore,he phase-separation ability of the studied ATPSs in each categoryI or II) can be discussed on the basis of the boiling point ofhe alcohols. In the case of the class (I) ATPSs (with completely
iscible alcohols) the boiling points are in order of 1-propanol370.35 K) > 2-propanol (355.45 K). Also, in the case of the classII) ATPSs (with incompletely miscible alcohols) the boiling pointsre in order of 1-butanol (391.15 K) > 2-butanol (372.66 K) > 2-ethyl-2-propanol (355.55 K). Therefore, the boiling-point data
emonstrate that, in both classes, the alcohol with the higheroiling point has more self-interaction forces between alcohololecules and easily can be excluded from the rest of the solution
s a separated phase. It should be noted that a similar conclusionas been made by Wang et al. [7] only about ATPSs composedf completely miscible alcohols (i.e. 1-propanol and 2-propanol).his conclusion has been made by Nemati-Kande et al. [22] on theoth class (I) and class (II) ATPSs.
.3. Effect of temperature on the phase-separation ability of theTPS
To study the effect of temperature on the investigated sys-ems, binodal and tie-line data were determined at T = 298.15,08.15 and 318.15 K. As shown in Figs. 1–5, in the case of ATPSsomposed of 2-methyl-2-propanol, the concentration of alco-ol required to achieve a phase separation slightly decreasesith increasing temperature, while in the case of ATPS com-osed of 1-propanol, 1-butanol or 2-butanol the increase of theemperature was reflected by increasing the concentration ofequired alcohol. In other words, the phase-separation ability ofhe system composed of (2-methyl-2-propanol + di-sodium hydro-en citrate + water) increased with increasing the temperature,hereas inversely the salting-out ability of the two-phase sys-
em composed of 1-propanol, 1-butanol or 2-butanol + di-sodiumydrogen citrate + water decreased with increasing the tempera-ure. It should be noted that, in the case of the ATPS composedf 2-propanol the temperature did not affect in any sensiblehange on the alcohol mass fraction at the measured tempera-ure range. Furthermore, the results show that the alcohol massraction required for phase-separation in the temperature range98.15–318.15 K is in the order of: 2-propanol > 1-propanol > 2-ethyl-2-propanol > 2-butanol > 1-butanol, which is in agreementith hydrophilic series. This trend is similar to the one reportedreviously [19] for 1-propanol, 2-propanol, 2-methyl-2-propanolr 2-butanol + di-potassium oxalate + water systems.
.4. Estimated slope and the length of tie-lines
The tie-line length, TLL, and the slope of the tie-line, S, at dif-erent compositions and temperatures for each system were alsoalculated, respectively, using Eqs. (2) and (3) as follows (Fig. 7):
LL = [(wtopm − wbot
m )2 + (wtop
s − wbots )]
0.5(2)
= wtopm − wbot
m
wtops − wbot
s
(3)
esults are also collected in Tables 4–6.
.5. Modeling
.5.1. Binodal curve correlationFor the correlation of binodal data of (alcohol + salt + water) sys-
ems, several empirical equations have been proposed. All of these
experimental binodal data at T = 298.15 K, (solid line) the calculated binodal fromEq. (4).
commonly used equations are nonlinear empirical expression ofalcohol mass fraction, wm, as a function of salt mass fraction, ws, orvice versa and at least have three parameters. In this work for thecorrelation of binodal data we examined the performance of thetemperature dependent Merchuk [20] equation (Eq. (4)):
wm = [a0 + a1(T − T0)] exp([b0 + b1(T − T0)]w0.5s
− [c0 + c1(T − T0)]w3s ) (4)
here a0, a1, b0, b1, c0 and c1 are fitting parameters of Eq. (4).The experimental binodal data for (alcohol + di-sodium hydro-
gen citrate + water) system at T = 298.15, 308.15 and 318.15 K werefitted by non-linear least-squares regression method to the Eq. (4).The fitting parameters for this equation along with the correspond-ing standard deviation for each temperature are given in Table 7.The obtained standard deviations (sd) show that Eq. (4) can besatisfactorily used to reproduce the binodal data.
3.5.2. Tie-line correlationVarious models with different thermodynamic basis may be
used for the correlation of tie-line data for (alcohols + salt + water)systems. In this work for the correlation of LLE data of investigated(alcohol + salt + water) systems we decided to use Setschenow-equation [21] which usually gives acceptable results in thecorrelation of these kinds of systems, and the generalized extendedNRTL (e-NRTL) [22] and generalized Wilson [23] models, whichhave been used recently.
3.5.2.1. Setschenow-equation. The following Setschenow-typeequation proposed by Hey et al. [21] has been used for thecorrelation of tie-line data of studied systems:
ln
(mtop
m
mbotm
)= km(mbot
m − mtopm ) + ks(mbot
s − mtops ) (5)
in which ks is the salting-out coefficient, km is a constant, and mm
and ms are the molality of alcohol and salt, respectively. The param-eters of the Eq. (5) which were obtained from the correlation of theexperimental LLE data at investigated temperatures are also given

M.T. Zafarani-Moattar, P. Jafari / Fluid Phase Equilibria 353 (2013) 50– 60 57
Table 7Values of parameters of Eq. (4), (ai , bi , ci), for {alcohols (m) + di-sodium hydrogen citrate (s) + water (w)} systems at T = 298.15, 308.15 and 318.15 K.
Merchuk equation as a function of temperature (Eq. (4))
T/K a0 a1 b0 b1 104c0 103c1 Deva
1-Propanol148.1064 362.0353 −0.2245 −10.2727 −0.048 0.494
298.15 0.03308.15 0.53318.15 0.41Overall 0.31
2-Propanol184.5899 0.001084 −0.5732 2.3034 0.096 −0.065
298.15 0.04308.15 0.03318.15 0.01Overall 0.03
1-Butanol7.1758 44.4040 −0.1267 −2.9997 −2.9068 6.2877
298.15 0.03308.15 0.25318.15 0.08Overall 0.11
2-Butanol31.0968 −556.3637 −0.6813 17.7982 1.5186 −0.104
298.15 0.24308.15 0.27318.15 0.08Overall 0.19
2-Methyl-2-propanol3.0021 0.00649 −0.4053 −13.9555 6.4959 −25.2
298.15 0.22308.15 0.34318.15 0.24Overall 0.27
a Dev =∑N−1
i=0((100wcal
m,i− 100wexp
m,i)2/N), where wm is the mass fraction of alcohol and
Table 8Values of parameters Steschenow-equation (Eq. (5)), (km , ks) (kg K mol−1), for{alcohols (m) + di-sodium hydrogen citrate (s) + water (w)} systems at T = 298.15,308.15 and 318.15 K.
Setschenow-type equation as a independent of temperature (Eq. (5))
T/K km ks Deva
1-Propanol298.15 0.4337 1.7572 0.07308.15 0.7107 1.1076 0.15318.15 1.494 0.5868 0.49
2-Propanol298.15 1.5001 0.3132 0.05308.15 0.5373 0.8731 0.20318.15 0.5065 0.6684 0.04
1-Butanol298.15 3.6050 0.3230 0.06308.15 3.7642 0.8148 0.01318.15 3.5125 0.4544 0.02
2-Butanol298.15 4.7860 75.6163 0.08308.15 3.495 0.6267 0.02318.15 3.2233 1.4667 0.10
2-Methyl-2-propanol298.15 0.7244 1.8686 0.08308.15 0.9083 1.722 0.40318.15 1.5391 1.751 0.85
a Dev =∑
p
∑l
∑j
∑T((100wcal
p,l,j,T− 100wexp
p,l,j,T)2/6N), where wp,l,j,T is the mass
fraction of the component j (i.e. alcohol, salt or water) in the phase p for lth tie-lineat temperature T, and N represents the number of tie line data.
N represents the number of data.
in Table 8 along with the corresponding deviations. The followingobjective function was used
Of =∑
T
∑p
∑l
∑j
(wcalT,p,l,j − wexp
T,p,l,j)2
(6)
Analyses of the ks values, listed in Table 8, indicate that there isnot any relation between ks values and phase separation ability ofthese investigated systems. This behavior has also been reportedby Nemati-Kande et al. [29] and Zafarani-Moattar et al. [30] inthe systems alcohol + sodium sulfite + water and alcohol + disodiumtartrate or disodium succinate + water, respectively. Therefore, ks
values cannot be used for describing the salting-out effect of theseinvestigated systems. According to these explanations, Setschenowequation is solely used for correlating the tie-line data. Based on thesmall standard deviations given in Table 8, we conclude that Eq. (5)with only two parameters has good performance in representingthe tie-line data.
3.5.2.2. Local composition models. The local composition modelsare comprehensive molecular thermodynamics models for systemwith molecular and ionic species, molecules and ions of varioussize, and hydrophobic, hydrophilic and amphiphilic species. To rep-resent the excess Gibbs energy of aqueous alcohol + salt system,Zafarani-Moattar et al. [22] and Nemati-Kande et al. [23] proposedthe generalized NRTL and generalized Wilson local composition
models, respectively.In these models, the excess Gibbs energy GE is built upfrom two contribution: a local composition NRTL contribution toaccount the short-range interaction contribution, Ge,NRTL, and a

58 M.T. Zafarani-Moattar, P. Jafari / Fluid Phase Equilibria 353 (2013) 50– 60
Table 9Values of parameters of generalized NRTL, � ij , for {alcohols (m) + di-sodium hydrogen citrate (s) + water (w)} systems at T = 298.15, 308.15 and 318.15 K (˛wm = ˛mw = 0.1,˛wca = ˛caw = 0.1, ˛mca = ˛cam = 0.01).
Generalized NRTL
T/K �wm �mw �wca �caw �mca �cam Dev
1-Propanol298.15 3.0393a −2.4819a 1.5603b −0.2022b 10.8878 10.2682 0.03308.15 1.5658 2.4868 7.5979 16.7112 20.2891 −10.828 0.04318.15 −0.9579 6.9760 −2.9943 10.9181 −0.8918 −1.8230 1.96
2-Propanol298.15 2.8091c 6.6528c 1.5603b −0.2022b −10.747 31.225 0.47308.15 0.6002 2.2569 −24.5115 39.2288 −111.9262 63.7750 0.98318.15 2.0136 30.0766 −524.113 −5.2630 −0.0046 73.2963 0.23
1-Butanol298.15 1.8636 10.8944 1.5603b −0.2022b −31.2722 87.9262 0.01308.15 1.2760 4.7165 21.1881 −2.6947 18.3268 −76.9062 0.08318.15 2.8636 −2.0065 16.1023 146.8547 −4.2605 87.6291 0.01
2-Butanol298.15 3.5456 13.3764 1.5603b −0.2022b −33.1109 161.4522 0.03308.15 −0.810 6.001 3.0020 −0.0854 −14.3002 65.79 0.87318.15 0.159 3.9984 −139 1299 −526.8444 33.1527 0.08
2-Methyl-2-propanol298.15 1.9800 2.5047 1.5603b −0.2022b −4.5304 26.2770 0.04308.15 2.6106 4.5565 17.3855 20.0824 48.769 −47.3063 0.35318.15 2.6294 −0.4043 −822.1102 8.2483 484100 34.9980 0.19
equilicient
equili
Pa
G
Ac
l
wTw
l
Fb[o
3wthraftfiaavt�ocN
a These parameters are obtained from the correlation of the binary vapor–liquid
b These parameters are obtained from the correlation of the binary activity coeffic These parameters are obtained from the correlation of the binary vapor–liquid
itzer–Debye–Huckel contribution to account the long-range inter-ction contribution, Ge,PDH
E = Ge,NRTL + Ge,PDH (7)
ccordingly, the activity coefficient of any component can be cal-ulated as follows:
n �j = 1RT
(∂Gex
m
∂nj
)T,P,ni /= nj
(8)
here j denotes any component (electrolyte or non-electrolyte).herefore, the activity coefficient of component i (alcohol, ions andater) can also be considered as the same of these contributions:
n �E = ln �E,LR + ln �E,SR (9)
or the long-range contribution, the Pitzer–Debye–Huckel [24] haseen used. For the short-range contribution, the generalized NRTL22] and generalized Wilson [23] models have been given previ-usly; since the equations are lengthy, they are not given here.
.5.2.3. Details of correlation. For the correlation of the tie-line datae used the value of � = 14.9, that has been frequently used for
he aqueous electrolyte solutions [25]. Densities of water and alco-ols were obtained from [26–31] at the studied temperatures andeported in Table 1. Furthermore, the dielectric constants of anylcohol and water at the mentioned temperatures were obtainedrom [32]. The generalized NRTL model has six interaction parame-ers (�m,ca, �ca,m, �w,ca, �ca,w , �mw , �wm) and three non-randomnessactors (˛wca, ˛mw and ˛mca) for which ̨ parameters are usually setn a fixed value. We examined different ̨ values in fitting the avail-ble vapor–liquid data for binary aqueous salt and alcohol solutionsnd the experimental LLE data obtained in this work. The suitablealues of non-randomness factors which give better quality of fit-ing are reported in Table 9. The four interaction parameters (�w,ca,
ca,w , �mw and �wm) are binary interaction parameters which can bebtained from the fitting of experimental water activity or osmoticoefficient data for aqueous salt and alcohol solutions to the e-RT model. The two remaining salt–alcohol, �ca,m, and alcohol–salt,brium data for (1-propanol + water) system reported in Ref. [34].data reported in Ref. [33] for binary (Na2C6H6O7 + water) system.brium data for (2-propanol + water) system reported in Ref. [35].
�m,ca parameters are determined from fitting of LLE data at workingtemperature and are reported in Table 9.
The activity coefficient data at T = 298.15 K for binary Na2C6H6O7was taken from [33]. Also, for binary 1-propanol + water and 2-propanol + water systems we used the vapor–liquid equilibriumdata (VLE) at T = 298.15 K reported in Refs. [34,35]. However, sincethere are no data for the binary alcohol and salt solutions atT = 308.15 and 318.15 K, it is not possible to obtain the corre-sponding interaction parameters at these temperatures. Thereforein these temperatures we decided to obtain the remaining fourinteraction parameters of the generalized NRTL model from thecorrelation of the LLE data at T = 298.15, 308.15 and 318.15 K. Theother remaining parameters are also obtained from the correlationof the LLE data.
The requirement for thermodynamic equilibrium is that theGibbs energy is at a minimum. It can be shown from classical ther-modynamics that a two-phase system at constant pressure andtemperature containing component i (alcohol, salt and water) at top(top) and bottom (bot) phases will obey the following constraintsat equilibrium.
(xj�j)top = (xj�j)
bot (10)
in which x and � represented mol fraction and activity coefficient,respectively. In fitting LLE data to the generalized NRTL, the objec-tive function (Eq. (6)) and equilibrium condition (Eq. (10)) werealso used.
Similarly, the Wilson model [23] has also six interaction param-eters (Hmca, Hcam, Hwca, Hcaw , Hmw and Hwm). The four binaryinteraction parameters (Hwca, Hcaw , Hmw and Hwm) can be obtainedusing aforementioned activity coefficient or VLE data at 298.15 Kfor binary salt and alcohol solutions to the Wilson model. Thetwo remaining salt–alcohol, Hcam, and alcohol–salt, Hmca param-eters are determined from the fitting of LLE data. Similar to the
e-NRTL model, for other two temperatures these four binary inter-action parameters and two interaction parameters correspondingto alcohol–salt, Hmca, and salt–alcohol, Hcam of Wilson model wereobtained from the fitting of the LLE data at different temperatures.
M.T. Zafarani-Moattar, P. Jafari / Fluid Phase Equilibria 353 (2013) 50– 60 59
Table 10Values of parameters of generalized Wilson, Hij , for {alcohols (m) + di-sodium hydrogen citrate (s) + water (w)} systems at T = 298.15, 308.15 and 318.15 K.
Generalized Wilson
T/K Hwm Hmw Hwca Hcaw Hmca Hcam Dev
1-Propanol298.15 1.4420a 0.4997a 2.4543b 0.6184b 1.0064 −2.788 0.27308.15 0.813 1.0205 0.9183 1.4139 0.2234 0.8352 0.04318.15 0.7084 0.8710 0.2285 0.2168 0.0713 1.0641 0.08
2-Propanol298.15 1.3389c 0.5808c 2.4543b 0.6184b 1.7977 −2.0613 0.84308.15 0.830 1.0005 0.9083 1.4039 0.1934 0.8352 0.02318.15 0.5560 0.8475 0.3228 0.2920 0.3582 0.7804 0.46
1-Butanol298.15 0.440 1.2009 2.4543b 0.6184b −2.10 −0.3513 5.48308.15 0.5090 1.1816 90.0878 −0.1826 −32.1242 −0.0001 0.12318.15 0.4303 1.418 0.0033 −3.5352 −0.0038 −1.9442 0.01
2-Butanol298.15 −9.4780 0.005 2.4543b 0.6184b −0.0085 0.5037 1.51308.15 0.8241 0.9142 0.0572 −2.2829 −0.2964 0.2028 0.06318.15 0.7639 0.868 1.0006 0.0649 −1.1995 0.0273 0.01
2-Methyl-2-propanol298.15 0.511 1.3433 2.4543b 0.6184b 1.1529 1.1529 0.19308.15 0.6993 0.9447 0.3920 −0.1668 0.5515 −0.5483 2.18318.15 0.6835 0.8914 0.1883 0.6126 0.0460 0.3859 0.59
equilicient
equili
Tpu
wgtomcthe
Fo((eE
a These parameters are obtained from the correlation of the binary vapor–liquid
b These parameters are obtained from the correlation of the binary activity coeffic These parameters are obtained from the correlation of the binary vapor–liquid
he results are listed in Table 10. Following the Sadeghi [36] Carameter was treated as a fixed value and the value of C = 10 wassed.
From the obtained standard deviations reported in Tables 8–10,e conclude that all the models considered in this work have
ood performance for representing the LLE data for the inves-igated two-phase systems; however, slightly better results arebtained with the generalized NRTL model. To see the perfor-ance of the generalized NRTL model in a better manner, the
omparison of the experimental and the predicted tie-lines usinghe generalized NRTL model for 1-butanol/2-butanol + di-sodium
ydrogen citrate at T = 298.15 K is shown in Figs. 8 and 9 asxamples.0
10
20
30
40
50
60
70
80
0
10
20
30
40
50
60
70
80
0 5 10 15 20 25 30
100w m
100ws
ig. 8. Plot of mass percent alcohol against mass percent salt to illustrate the effectf temperature on the binodal curve, slope and length of tie-lines of the {2-butanolm) + di-sodium hydrogen citrate (s) + water (w)} system: ( ) experimental,
) calculated tie-lines from generalized NRTL (e-NRTL) at T = 298.15 K, ( )xperimental binodal data at T = 298.15 K, (solid line) the calculated binodal fromq. (4).
brium data for (1-propanol + water) system reported in Ref. [34].data reported in Ref. [33] for binary (Na2C6H6O7 + water) system.brium data for (2-propanol + water) system reported in Ref. [35].
4. Conclusion
Liquid–liquid equilibrium data for the (alcohol + di-sodiumhydrogen citrate + water) system were obtained at investigatedtemperatures. The experimental binodal data were satisfactorilycorrelated using the Merchuck equation as a function of tem-perature with a linear temperature dependency in the form of(T − T0) K as a variable. Comparison between the experimentalresults shows that the phase-separation ability of the 1-propanol,1-butanol, 2-butanol + di-sodium hydrogen citrate + water systemsincreased with increasing the temperature, whereas adversely at(2-methyl-2-propanol + di-sodium hydrogen citrate + water) sys-tem decreased with increasing the temperature, and in the caseof the ATPS composed of 2-propanol the temperature did not affectin any sensible change on the alcohol mass fraction at the measuredtemperature range. Additionally, Setschenow-type equation andlocal composition based models (generalized NRTL and generalizedWilson) were used for the correlation of the studied systems. Onthe basis of the obtained results, it can be concluded that, the per-formances of all the considered models in the correlation are good.However, the Setschenow-type equation with only two parametersshows the best results in the correlation of tie-line compositions ofthe systems studied. Also, generalized NRTL model shows betterresults than generalized Wilson model in the fitting of tie-lines.
List of symbolswm mass fraction of alcoholws mass fraction of saltww mass fraction of watern0 refractive index of pure wateram polymer refractometery constantas salt refractometery constantT0 reference temperaturea0, a1, b0, b1, c0 and c1 fit parameters of Merchuk equation
ks salting-out coefficientkm a constant in Setschenow-type equationCm molality of alcoholCs molality of salt
6 Fluid P
tbTOwwsD
Ga���
Secimn
R
[[[[[[[[
[[[[[
[
[[[[
[[
[
[
[
0 M.T. Zafarani-Moattar, P. Jafari /
op alcohol rich phaseot salt rich phase
absolute temperaturef objective function′m total mass fraction of alcohol in its feed sample′s total mass fraction of salt in its feed sample
d standard deviationev deviation
reek letters0, a1, b0, b1, c0 and c1 fit parameters of Eq. (4)ij molecular interaction parameters for NRTL modelsi chemical potential of component i0i
the standard state chemical potential of component
ubscriptsxp experimentalal calculated
and j each component, s and w alcohol, salt and water, respectively
the number of coordination water molecules
eferences
[1] P.A. Albertsson, Partition of Cell Particles and Macromolecular, Wiley, NewYork, 1986.
[2] B.A. Andrews, J.A. Asenjo, in: E.L. Harris, S. Angal (Eds.), Protein PurificationMethods. A Practical Approach, IRL Press, Oxford, 1989.
[3] M.E. Tobada, T.A. Graber, B.A. Andrew, J.A. Asenjo, J. Chromatogr. B 743 (2000)101–105.
[4] S. Saravanana, J. Raghava Raoa, Murugesanb, B.U. Naira, T. Ramasamia, Chem.Eng. Sci. 62 (2007) 969–978.
[5] M.T. Zafarani-Moattar, E. Nemati-Kande, Calphad 34 (2010) 478–486.
[[
[[
hase Equilibria 353 (2013) 50– 60
[6] R. Sadeghi, R. Golabiazar, H. Shekaari, J. Chem. Termodyn. 442 (2010) 441–453.[7] Y. Wang, Y. Yan, S. Hu, X. Xu, J. Chem. Eng. Data 55 (2010) 876–881.[8] A. Carton, S. Bolado, M. Marcos, J. Chem. Eng. Data 45 (2000) 260–264.[9] M. Aznar, R.N. Araújo, J.F. Romanato, G.R. Santos, S.G. d’Ávila, J. Chem. Eng. Data
45 (2000) 1055–1059.10] F.S. Santos, S.G. d’Ávila, M. Aznar, Fluid Phase Equilib. 187/188 (2001) 265–274.11] R.A.G. Sé, M. Aznar, J. Chem. Eng. Data 47 (2002) 1401–1405.12] M.T. Zafarani-Moattar, S. Hamzehzadeh, J. Chem. Eng. Data 54 (2009) 833–841.13] M.E. Taboda, Fluid Phase Equilib. 204 (2003) 155–165.14] M. Hu, Q. Zhai, Y. Jiang, Z.J. Liu, J. Chem. Eng. Data 49 (2004) 1070–1073.15] T. Chou, A. Tanokia, Ind. Eng. Chem. Res. 37 (1998) 2039–2044.16] E. Nemati-Kande, H. Shekaaei, J. Solut. Chem. 41 (2012) 1649–1663.17] M.T. Zafarani-Moattar, S. Banisaied, M.A.S. Beirami, J. Chem. Eng. Data 50 (2005)
1409–1413.18] A. Salabat, M. Hashemi, J. Chem. Eng. Data 51 (2006) 1194–1197.19] H. Shekaari, R. Sadeghi, S.A. Jafari, J. Chem. Eng. Data 55 (2010) 4586–4591.20] J.C. Merchuk, B.A. Andrews, J.A. Asenjo, J. Chromatogr. B 711 (1998) 285–293.21] M.J. Hey, D.P. Jackson, H. Yan, Polymer 46 (2005) 2567–2572.22] M.T. Zafarani-Moattar, E. Nemati-Kande, A. Soleimani, Fluid Phase Equilib. 313
(2012) 107–113.23] E. Nemati-Kande, H. Shekaari, S.A. Jafari, Fluid Phase Equilib. 321 (2012)
64–72.24] K.S. Pitzer, J. Am. Chem. Soc. 102 (1980) 2902–2906.25] J.M. Simonson, K.S. Pitzer, J. Phys. Chem. 90 (1986) 3009.26] F.M. Pang, C.E. Seng, T.T. Teng, M.H. Ibrahim, J. Mol. Liq. 136 (2007) 71–78.27] J.M. Resa, C. Gonzalez, M. Juez, S.O. de Landaluce, Fluid Phase Equilib. 217 (2004)
175–180.28] K. Rajagopal, S. Chenthilnath, Indian J. Pure. Appl. Phys. 48 (2010) 326–333.29] E. Nemati-Kande, H. Shekaari, S.A. Jafari, Fluid Phase Equilib. 329 (2012)
42–54.30] M.T. Zafarani-Moattar, V. Hosseinpour-Hashemi, S. Banisaeid, M.A. Shamsi
Beirami, Fluid Phase Equilib. 338 (2013) 37–45.31] R.A. Robinson, R.H. Stokes, Electrolyte Solutions, 2nd ed., Butterworths, London,
1965.32] D.R. Lide, CRC Handbook of chemistry and physics, 87th ed., Taylor and Francis,
Boca Raton, FL, 2007.
33] R. Sadeghi, R. Golabiazar, E. Parsi, J. Chem. Eng. Data 55 (2010) 5874.34] J. Gmehling, U. Onken, Chemistry Data Series, vol. 1, DECHEMA, Frankfurt,Germany, 1977.35] T. Tsuji, K. Hasegawa, T. Hiaki, M. Hongo, J. Chem. Eng. Data 41 (1996) 956–960.36] R. Sadeghi, J. Chem. Thermodyn 37 (2005) 323–329.


![i.uran.rui.uran.ru/webcab/system/files/journalspdf/journal... · A Promising Ionic Liquid [BMIMl[FeC14] for the Extractive Separation of Aromatic and Aliphatic Hydrocarbons Salem](https://img.pdfslide.us/doc/110x75/5eb72f46dc05b955910a61c7/iuranruiuranruwebcabsystemfilesjournalspdfjournal-a-promising-ionic.jpg)