Embed Size (px)
Citation preview

DESIGN CONSIDERATIONS AND PERFORMANCE EVALUATION OF A SURGE TANK FOR DIAPHRAGM PUMP OPERATION
A THESIS SUBMITTED TO THE GRADUATE SCHOOL OF NATURAL AND APPLIED SCIENCES
OF MIDDLE EAST TECHNICAL UNIVERSITY
BY
ŞAHİKA ÖZDEMİR
IN PARTIAL FULFILLMENT OF THE REQUIREMENTS FOR
THE DEGREE OF MASTER OF SCIENCE IN
MECHANICAL ENGINEERING
SEPTEMBER 2010

APPROVAL OF THE THESIS
DESIGN CONSIDERATIONS AND PERFORMANCE EVALUATION OF A SURGE TANK FOR DIAPHRAGM PUMP
OPERATION
submitted by ŞAHİKA ÖZDEMİR in partial fulfillment of the requirements for
the degree of Master of Science in Mechanical Engineering Department,
Middle East Technical University by,
Prof. Dr. Canan Özgen _____________________ Dean, Graduate School of Natural and Applied Sciences Prof. Dr. Süha Oral _____________________ Head of Department, Mechanical Engineering Prof. Dr. Kahraman Albayrak Supervisor, Mechanical Engineering Dept., METU____________________ Dr. Serkan Kayılı Co-Supervisor, Mechanical Engineering Dept., METU_________________ Examining Committee Members: Prof. Dr. M. Haluk Aksel _____________________ Mechanical Engineering Dept., METU Prof. Dr. Kahraman Albayrak _____________________ Mechanical Engineering Dept., METU Assoc. Prof. Dr. Cemil Yamalı _____________________ Mechanical Engineering Dept., METU Dr. Tahsin Çetinkaya _____________________ Mechanical Engineering Dept., METU Onur Konuralp, M.Sc. _____________________ Manager, Layne Bowler
Date: 14.09.2010

I hereby declare that all information in this document has been obtained and presented in accordance with academic rules and ethical conduct. I also declare that, as required by these rules and conduct, I have fully cited and referenced all material and results that are not original to this work.
Name, Last name: Şahika Özdemir
Signature
iii

ABSTRACT
DESIGN CONSIDERATIONS AND PERFORMANCE EVALUATION OF A SURGE TANK FOR DIAPHRAGM PUMP OPERATION
Özdemir, Şahika
M.Sc., Department of Mechanical Engineering
Supervisor : Prof. Dr. Kahraman Albayrak
Co-Supervisor : Dr. Serkan Kayılı
September 2010, 96 Pages
This thesis is performed to evaluate the design consideration and performance
characteristics of a surge tank for a diaphragm pump operation and to evaluate the
proper volume and inlet area of surge tank in order to reduce the pulsations of the
discharge pressure.
An experimental set up is constructed for a three diaphragm positive displacement
pump and the experiments are conducted afterwards. The surge tanks having
different volumes and the surge tank inlet area configurations are tested in order to
achieve the minimum peak to peak pulsations.
Experiments showed that among the different sizes of the surge tanks, the
minimum peak to peak pulsations are achieved with the largest volume which is the
original surge tank of the test pump used by the pump manufacturer. This result is
supported by the literature which states that with greater surge tank size the
magnitude of pulsations can be diminished more.
iv

Regarding the surge tank inlet area design; among the eight different adaptors a
proper inlet area value is concluded having the minimum peak to peak pulsations
also smaller than the original configuration.
Keywords: pressure pulsation dampening, diaphragm pump, surge tank sizing,
surge tank testing.
v

ÖZ
DİYAFRAMLI BİR POMPANIN HAVA KABI TASARIM KRİTERLERİVE
PERFORMANSININ ARAŞTIRILMASI
Özdemir, Şahika
Yüksek Lisans, Makina Mühendisliği Bölümü
Tez Yöneticisi : Prof. Dr. Kahraman Albayrak
Ortak Tez Yöneticisi : Dr. Serkan Kayılı
Eylül 2010, 96 Sayfa
Bu tez çalışması üç diyaframları pozitif deplasmanlı bir pompanın çıkış
basıncındaki salınımları azaltmak için, kullanılan hava kabının tasarım ve
performansının incelenmesi ve hava kabı için en uygun boyutlandırma ve giriş
alanı tayini için yapılmıştır.
Bu amaçla tasarlanan ve kurulan deney düzeneğinde bahsedilen üç diyaframlı
pompanın performans özellikleri test edilmiş daha sonra da hava kabı deneyleri
gerçekleştirilmiştir. Farklı boyutlara sahip üç hava kabı ve hava kabı girişi için
tasarlanmış farklı alan büyüklüklerine sahip adaptörler ile deneyler yapılmış, en
düşük salınımların gözlenmesi amaçlanmıştır.
Deney sonuçlarına göre, üç farklı büyüklükteki hava kaplarından, en büyük hacme
sahip olan hava kabında en düşük basınç salınımları gözlenmiştir. Bu hava kabı da
pompa üreticisinin bu pompa ile endüstride kullandığı hava kabıdır. Bu sonuç
literatürde bu konu ile ilgili kaynaklardaki bilgilerle de örtüşmektedir. Çünkü
kaynaklarda hava kabının boyutları büyüdükçe çıkış basıncındaki salınımların da
azalacağı belirtilmektedir.
vi

Hava kabı giriş alanı ile ilgili olarak yapılan deneylerde sekiz farklı adaptör ve alan
büyüklükleri ile yapılan testlerin sonuçlarında kabının mevcut giriş alanından daha
küçük giriş alanı ile pompa çıkışındaki basınç salınımlarının azaltılması mümkün
olmuştur.
Anahtar Kelimeler: basınç salınım sönümlenmesi, diyafram pompa, hava kabı
boyutlandırması, hava kabı testleri.
vii

For My Parents
and
Beloved Husband
viii

ACKNOWLEDGMENTS
I would like to thank all the people who supported me throughout graduate school
and the writing of my thesis. I wish to express my deepest gratitude to my
supervisor Dr. Kahraman Albayrak and co-supervisor Dr. Serkan Kayılı for the
continuous guidance, advice, criticism and insight throughout the research. Also
thanks to Dr. Mahir Dursun for his support and help in my experiments.
Special thanks to my family for showing me the value of education, support and
patience throughout my life. I inscribe my graduation to them.
My heartfelt thanks go to my husband, for his encouragement and light for the last
and hardest times of this thesis. Without him in my life I could not make it.
ix

TABLE OF CONTENTS
ABSTRACT ........................................................................................................... iv
ÖZ .......................................................................................................................... vi
ACKNOWLEDGMENTS ..................................................................................... ix
TABLE OF CONTENTS ......................................................................................... x
LIST OF SYMBOLS AND ABBREVIATIONS .................................................. xv
CHAPTERS
1. INTRODUCTION................................................................................................ 1
1.1 POSITIVE DISPLACEMENT PUMPS ....................................................... 2
1.1.1 RECIPROCATING PUMPS .................................................................. 4
1.1.1.1 DIAPHRAGM PUMPS ......................................................................... 5
1.2 PULSATION DAMPENING AND SURGE TANKS ................................. 8
1.2.1 SURGE TANK TYPES ....................................................................... 10
2. LITERATURE SURVEY AND AIM OF THE STUDY .................................. 12
2.1 SURGE TANK SIZING ............................................................................. 12
2.2 EFFECT OF SURGE TANK INLET AREA ON PULSATIONS ............ 25
2.3 AIM OF THE THESIS ............................................................................... 25
3. EXPERIMENTAL SETUP AND INSTRUMENTATION ............................... 27
3.1 EXPERIMENTAL SETUPS ...................................................................... 27
3.1.1 EXPERIMENTAL SETUP FOR OBTAINING PUMP
PERFORMANCE ................................................................................ 28
x

3.1.1.1 INSTRUMENTATION FOR PUMP PERFORMANCE TEST SETUP
.............................................................................................................. 32
3.1.2 EXPERIMENTAL SETUP FOR SURGE TANK PERFOMANCE
TESTS .................................................................................................. 34
3.1.2.1 INSTRUMENTATION FOR SURGE TANK PEROFORMANCE
EVALUATION TESTS ....................................................................... 38
3.2 EXPERIMENTAL PROCEDURE ............................................................ 40
3.2.1 PUMP PERFORMANCE TESTS ....................................................... 40
3.2.2 SURGE TANK PEROFRMANCE TESTS ......................................... 42
3.2.3 TEST MATRIX ................................................................................... 48
4. RESULTS AND DISCUSSION ........................................................................ 50
4.1 PUMP PERFORMANCE TESTS .............................................................. 50
4.2 SURGE TANK PEROFRMANCE TESTS ............................................... 56
4.2.1 EFFECT OF THE SURGE TANK SIZE ............................................. 60
4.2.2 EFFECT OF THE INLET AREA OF SURGE TANK ........................ 65
4.3 UNCERTAINTY ANALYSIS ................................................................... 71
5. CONCLUDING REMARKS ............................................................................. 73
REFERENCES ....................................................................................................... 77
APPENDICES
A. SURGE TANK SIZING CALCULATIONS .................................................... 80
B. TECHNICAL SPECIFICATIONS OF INSTRUMENTS ................................ 88
C. TECHNICAL DRAWINGS .............................................................................. 91
xi

LIST OF TABLES TABLES
Table 1 Classification Criteria for Surge Tank Types ............................................ 10
Table 2 Pump Type Constants [18] ......................................................................... 21
Table 3 Results of Surge Tank Sizing Calculations ................................................ 24
Table 4 Technical Specification of the Test Pump ................................................. 28
Table 5 Surge Tanks Used in the Experiments ....................................................... 45
Table 6 Surge Tank Inlet Area Configurations ....................................................... 46
Table 7 Test Matrix ................................................................................................. 48
Table 8 Pump Performance Test Results ................................................................ 51
Table 9 Experimental Data for Different Surge Tank Sizes ................................... 61
Table 10 Experimental Data for Different Surge Tank Inlet Areas ........................ 66
Table 11 Uncertainty Analysis Data and Results .................................................... 72
Table 12 Test Pump Specifications ......................................................................... 88
Table 13 Pressure Transmitter Specifications ......................................................... 89
Table 14 LabJack U12 Properties [27].................................................................... 89
Table 15 Electric Motor Specifications [36] ........................................................... 89
Table 16 Flow Meter Features [28] ......................................................................... 90
xii

LIST OF FIGURES FIGURES
Figure 1 Positive Displacement Pump Detail Drawing [5] ....................................... 2
Figure 2 Positive Displacement Pump Characteristics [5] ........................................ 3
Figure 3 Single Acting and Double Acting Pumps [11] ........................................... 5
Figure 4 Diaphragm Pump [12] ................................................................................ 6
Figure 5 3D Model of the Test Pump ....................................................................... 7
Figure 6 Section Drawing of Diaphragm Pump [13] ................................................ 8
Figure 7 A Typical Surge Tank [16] ......................................................................... 9
Figure 8 Types of Surge Tanks [18] ....................................................................... 11
Figure 9 Flow Rate Diagram of Triplex Pump ....................................................... 14
Figure 10 Surge Tank Representation [22] ............................................................. 23
Figure 11 Experimental Setup for Pump Performance Tests .................................. 29
Figure 12 Calibration Curve for Pressure Sensor 1 ................................................ 30
Figure 13 Calibration Curve for Pressure Sensor 2 ................................................ 31
Figure 14 Datalogger Interface of Computer .......................................................... 33
Figure 15 Schematic Representation of Instrumentation for Pump Performance
Tests ........................................................................................................................ 34
Figure 16 Experimental Setup for Surge Tank Performance Tests ......................... 37
Figure 17 LabJack12 User Interface ....................................................................... 39
Figure 18 Schematic Representation of Instrumentation for Surge Tank
Performance Tests ................................................................................................... 40
Figure 19 Motor Part Load Efficiency [34] ............................................................ 47
Figure 20 Volumetric Flow Rate vs. Pump Speed .................................................. 52
Figure 21 Volumetric Flow Rate vs. Exit pressure ................................................. 53
Figure 22 Hydraulic Power vs. Pump speed ........................................................... 54
Figure 23 Hydraulic Power vs. Exit Pressure ......................................................... 54
Figure 24 Pump Efficiency vs.Exit Pressure .......................................................... 55
Figure 25 Pump Efficiency vs.Volumetric Flow Rate ............................................ 56
xiii
xiv
Figure 26 Correlation Coefficient ........................................................................... 57
Figure 27 Pressure Time History at 40 bar Exit Pressure with adaptor having area
ratio of 0.14 ............................................................................................................. 59
Figure 28 Pressure Frequency Spectrum at 40 bar Exit Pressure with adaptor
having area ratio of 0.14.......................................................................................... 59
Figure 29 Section View of the Surge Tank of the Test Pump ................................ 60
Figure 30 Pressure Time History at 40 bar Exit Pressure without surge tank on the
pump ........................................................................................................................ 62
Figure 31 Pressure Frequency Spectrum at 40 bar Exit Pressure without surge tank
on the pump ............................................................................................................. 62
Figure 32 Exit Pressure Pulsation Change with Surge Tank Size .......................... 63
Figure 33 Exit Pressure Pulsation Change with Surge Tank Size at 40 bar ........... 64
Figure 34 Exit Pressure Pulsations vs. Surge Tank Inlet Area ............................... 69
Figure 35 Exit Pressure Pulsations vs. Surge Tank Inlet Area at 40 bar ................ 70
Figure 36 Flow Rate Diagram of Simplex Pump .................................................... 80
Figure 37 Flow Rate Diagram of Duplex Pump ..................................................... 84
Figure 38 Flow Rate Diagram of Quad Pump ........................................................ 87
Figure 39 Technical Drawing of Pressure Transducer Adaptor.............................. 91
Figure 40 Technical Drawing of Test Bench .......................................................... 92
Figure 41 Technical Drawing of Coupling Pump Shaft.......................................... 92
Figure 42 Technical Drawing of Adaptor with r=0.09 ........................................... 93
Figure 43 Technical Drawing of Adaptor with r=0.14 ........................................... 93
Figure 44 Technical Drawing of Adaptor with r=0.15 ........................................... 94
Figure 45 Technical Drawing of Adaptor with r=0.19 ........................................... 94
Figure 46 Technical Drawing of Adaptor with r=0.25 ........................................... 95
Figure 47 Technical Drawing of Adaptor with r=0.35 ........................................... 95
Figure 48 Technical Drawing of Adaptor with r=1 ................................................ 96

LIST OF SYMBOLS AND ABBREVIATIONS
C: pump capacity per one revolution d,D: pump piston or plunger diameter dv: liquid volume that the search tank must store E: maximum error fmotor: Frequency of the motor fpump: Frequency of the pump K: pump constant LOD: Level of dampening n, N: Pump speed n, N: Number of data p: average fluid pressure, psi p1: minimum pressure in the line p2: maximum pressure in the line pc: precharge pressure, psi pd: Pump discharge pressure Pelec: Electrical power pexit: Exit pressure of the pump Phyd: Hydraulic power pin: Inlet pressure of the pump pmax: Maximum exit pressure of the pump pmin: Minimum exit pressure of the pump paverage: Average exit pressure of the pump Q: Volumetric flow rate f the pump Qpiston: Volumetric flow rate of the single piston r: Area ratio for the surge tank inlet area adaptors rbelt&pulley: Belt and pulley reduction ratio s: Stroke of the pump t: Time for tank to be filled in seconds V: Voltage value read from the Labjack
xv

Vsurge: Volume of the surge tank of the pump Vtank: Volume of measurement tank % pulsation: peak-to-peak pulsation percentage x : Mean of the data x: First parameter y: Second parameter z: Gaussian distribution value Δp: Allowed pressure pulsation, psi Δp: Pressure difference between inlet and exit of the tank
α: Significance level ηpump: Pump efficiency
ηsystem: System efficiency ρxy: Correlation coefficient σx: Standard deviation of the data qsurge: amount of flow entering the surge tank qpump: volumetric flow rate of the pump qmean: mean volumetric flow rate of the pump r: radius of the crank A Area of the piston α: crank angle ω: rotational speed l: crank length ΔH1 amount of water leaving the surge tank
ΔH2 amount of water enters the surge tank H1 amount of water in the surge tank at time t1 H2 amount of water in the surge tank at time t2 ΔHo: the air volume in the surge tank smax: maximum stroke length smin: minimum stroke length Δs: delta of the stroke length p2: exit pressure of the pump at time t2 p1: exit pressure of the pump at time t1
xvi

CHAPTER 1
INTRODUCTION
The flow pulsations and shaking forces caused by power cut off, valve closure or
the nature of the flow may lead to hazardous effects on the pumping systems such
as; piping vibration, fatigue failure of the pumping systems’ components and valve
damage. Also, they cause mechanical and foundation failure [1]. There are several
examples for this situation. An oversized piping system is designed to overcome
the higher pressure drop induced by the pulsative flow. Also, pump efficiency is
decreasing due to requirement of more power to overcome the higher internal
pressure peaks, and noise is induced throughout the piping system. Piston rods are
exposed to higher stresses because of unbalanced or dynamic forces, [2].
In order to solve the problems caused by flow pulsation, the systems are designed
such that the pulsations are taken in account and their amplitudes are minimized.
There are several methods to reduce the pulsations in the systems such as; using
controllable vanes, one sided vanes and “surge tanks” which is a commonly used
solution and is indeed one of the focuses of this thesis study [3].
In order to use these solutions efficiently, they must be designed and applied
uniquely to the systems according to the characteristics of the flow and the pump
parameters. Hence this study is performed to evaluate the design and performance
of a surge tank for a diaphragm pump operation, and to evaluate the proper inlet
area for surge tank in order to dampen the pulsations in the pumping system.
1

The theory of the thesis such as; pump types, especially reciprocating and
diaphragm pumps and the surge tanks, and also the aim of the thesis are mentioned
in this chapter. The literature survey, experimental set-up and instrumentation,
experimental results and discussion and the conclusion is explained in the
following sections.
1.1 POSITIVE DISPLACEMENT PUMPS
In positive displacement pumps, the diaphragm or piston is moved forward and
backward by the reciprocating motion of the plunger and with the help of the
valves the fluid is sucked when the diaphragm or piston moves backward and
discharged when it is pushed forward again by the plunger (Figure 1). The positive
displacement pumps are generally equipped with relief valves which are used for
the safety of the pump [4]. When the pump discharge is blocked during the
operation, or in case of any unwanted incidence such as stuffed filters, the relief
valve opens and the flow is diverted through it, not allowing the flow to over
pressurize the discharge of the pump. The positive displacement pumps usually
operate with laminar internal flow regimes
Figure 1 Positive Displacement Pump Detail Drawing [5]
2
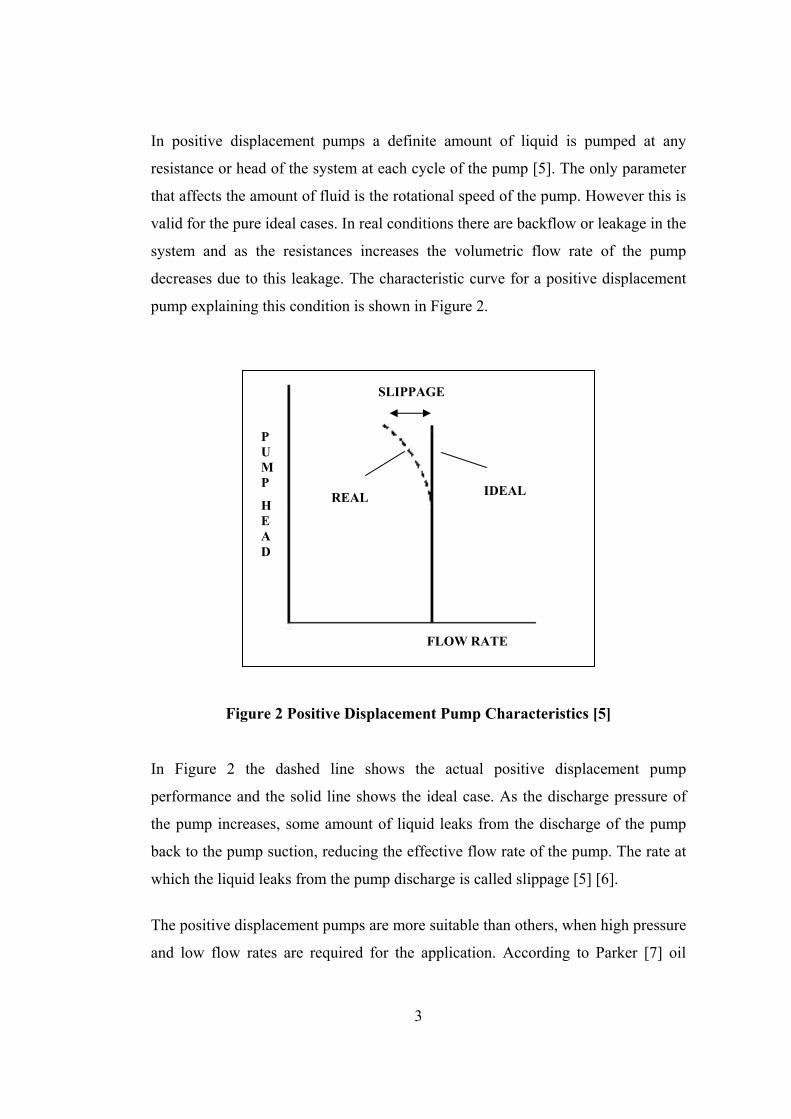
In positive displacement pumps a definite amount of liquid is pumped at any
resistance or head of the system at each cycle of the pump [5]. The only parameter
that affects the amount of fluid is the rotational speed of the pump. However this is
valid for the pure ideal cases. In real conditions there are backflow or leakage in the
system and as the resistances increases the volumetric flow rate of the pump
decreases due to this leakage. The characteristic curve for a positive displacement
pump explaining this condition is shown in Figure 2.
SLIPPAGE
Figure 2 Positive Displacement Pump Characteristics [5]
In Figure 2 the dashed line shows the actual positive displacement pump
performance and the solid line shows the ideal case. As the discharge pressure of
the pump increases, some amount of liquid leaks from the discharge of the pump
back to the pump suction, reducing the effective flow rate of the pump. The rate at
which the liquid leaks from the pump discharge is called slippage [5] [6].
The positive displacement pumps are more suitable than others, when high pressure
and low flow rates are required for the application. According to Parker [7] oil
REAL
P U MP IDEAL
HEAD
FLOW RATE
3

pipelines are used for transportation of the fluids having different viscosities and
require constant flow at various discharge pressure. Therefore they use positive
displacement pumps. Because other types may not be able to produce a high
enough pressure to clear the line in case of a shut down and restart of the system.
Since, with the cooling of the liquid viscosity increases and the pumping need
higher pressures than the normal. Similarly, the fuel systems require constant
amount of liquid although the pressure may increase or decrease in case of nozzle
deformations. These types of requirements can only be fulfilled with positive
displacement pumps which supply a steady source of power to the fuel systems.
1.1.1 RECIPROCATING PUMPS
The three basic types of positive displacement pumps are [8]:
• Reciprocating pumps
• Rotary pumps
• Special-purpose pumps
This study is focused on the reciprocating pumps especially on diaphragm pumps,
which is a subgroup of reciprocating pumps. A reciprocating pump has two one-
way valves, and a chamber that is filled and displaced between the two valves by a
piston or membrane moving in a reciprocating motion [8]. There are different
classifications of reciprocating pumps according to mechanisms or numbers of
cylinder [9]. A general classification can be presented as
• Piston pumps
• Diaphragm pumps
• Bellow pumps
Another classification is done according to the number of the cylinder. In simplex,
single acting pumps, there is one cylinder creating the flow with a single stroke in
a single rotation of the crank of the piston. There is a periodic sine wave pressure in
the flow which leads to pressure pulsations and shaking forces in the discharge. A
4

single acting duplex (or duplex) pump has two diaphragms and in a single
rotation of the crank the pump has two stokes created by the two pistons of the
pump. The pressure waves in the discharge are again sine waves but a triplex
pump is the one having three compression and three strokes in one cycle and
having three cylinders and quadruplex, having four cylinders.
In single acting pumps there is one intake and one compression in one stroke of the
piston. In a double acting pump, differently from single acting, there are two
intakes and two compressions in a single stroke of the piston. Bhabani and
McAllister [10] give the details of the flow characteristics of these types and the
behaviors are indicated.
Figure 3 Single Acting and Double Acting Pumps [11]
1.1.1.1 DIAPHRAGM PUMPS
Diaphragm pump is a kind of positive displacement pump, where a crank attaches
to the diaphragm and a hydraulic fluid moves the diaphragm up and down (or
5

sideways), leading the piston move in a reciprocating motion up and down. The
piston is the liquid end of the pump. The movement of the piston regulates the
amount of fluid pumped [4]. A duplex diaphragm pump and its details are indicated
in Figure 4.
Figure 4 Diaphragm Pump [12]
In a diaphragm pump, pressurized air or mechanically driven piston attached to the
diaphragm which pushes the diaphragm across the chamber and fluid on the other
side of the diaphragm is forced out. The diaphragm in the opposite chamber is
pulled towards the centre by the connecting rod. This creates suction of liquid in
chamber, when the diaphragm plate reaches the centre of the pump it pushes across
the pilot valve rod diverting a pulse of air to the air valve. This moves across and
diverts air to the opposite side of the pump reversing the operation. It also opens
the air chamber to the exhaust. Figure 5 indicates the diaphragm pump used in the
experiments.
6

Figure 5 3D Model of the Test Pump
Diaphragm pumps offer smooth flow, reliable operation, and the ability to pump
various viscous, chemically aggressive, abrasive and impure liquids. They are
used in many industries such as mining, petro-chemical, pulp and paper. In
addition, human heart can be classified as a diaphragm pump.
The liquid end of the diaphragm pump consists of a flexible membrane which
moves or pulsates in a cylinder. The movement of the membrane and a piston are
quite similar but the stroke of the membrane is smaller because of its geometry
and it cannot move up and down or sideways like a piston [4]. The periphery of
the membrane is fixed as indicated in Figure 6.
A schematic section of drawing of a diaphragm pump is indicated in Figure 6
presenting the elements,: (1)housing, (2)valves, (3)head cover, (4)diaphragm
clamping disc, (5)diaphragm (membrane), (6)diaphragm supporting rod,
(7)connecting rod, (8)eccentric bushing.
7

Figure 6 Section Drawing of Diaphragm Pump [13]
1.2 PULSATION DAMPENING AND SURGE TANKS
Because the pistons of the diaphragm pumps have reciprocating movement
creating pulsation, the damages of the pumping system due to shaking forces and
hydraulic shock in the long term usages are inevitable. These damages may come
up as unsteady flow, wear and fatigue, cavitation or noise and vibration [14].
In order to not to face such problems in the pumping systems, some precautions
must be taken such as; using equipments having pulsation reducing properties.
There are many methods to avoid these pulsations but using surge tanks,
controllable vanes, one sided vanes are the most extended used solutions [15].
Surge tanks, which can be also found as “pulsation dampener” or “air chamber”
in the literature, reduce the pulsations in the flow, and thus enhance the
performance and reliability of fluid handling equipment in industrial, chemical
transfer, and precision metering applications [14].
8

Gas Room
Bladder / Diaphragm Liquid
Room
Discharge Inlet
Figure 7 A Typical Surge Tank [16]
As indicated in Figure 7 surge tanks are small pressurized tanks containing both
fluid and air together separated by a membrane or diaphragm, and usually
connected to discharge of the pumps. The lower part of the surge tank open to the
flow allowing the inlet and discharge of the flow and the upper part is for the gas
(usually nitrogen or air) resisting the flow with the help of the precharge pressure
and the pressure increase due to compression because of the fluid flow. The
diaphragm between the gas and fluid chambers serve as a barrier and rapid
pressure response times for pressure control pump pulsation and shock-
dampening applications are facilitated by the light weight of the bladder [17].
The bladder or the diaphragm moves up and down with the flow pulsations whose
frequency is related to the rotational speed of the crank. With the upward
movement, the volume of the gas room decreases, increasing the pressure and
resisting the pressure pulsations in the liquid room caused by the flow. When the
flow in the line starts to fluctuate, fluid fills into the surge tank decreasing the
amplitudes of the pulsations with the pre-pressurized air on the surge tank.
9

10
The rate of the pressure change in the surge tank is directly related with the pre-
pressure value of the surge tank, the flow rate of the fluid, and the
thermodynamics of the air inside the surge tank [15]. In order to use the surge
tanks efficiently it is recommended to install them as near as the pistons or
diaphragms to minimize the length that the pulsated flow follows [3]. The other
and the most valuable parameter for the efficiency of the surge tank is its design.
For the high speed pumps or long delivery pipelines or against high heads the
surge tanks must be designed larger and the inlet area which is evaluated having a
significant pulsation dampening effect must be taken into consideration [3].
1.2.1 SURGE TANK TYPES
There are many different pulsation sources in the pumping systems caused by
different reasons and therefore there are many types of surge tanks. The
classification of them can be made according to their dampening fluid, their
bladder type, style or working principle as stated below [18].
Table 1 Classification Criteria for Surge Tank Types
Classification Criteria Types
Types of fluids Gas, liquid or dual where both gas and liquid is used.
Bladder types: Confined, unconfined, foam or none
Style: Appendage, flow thru, diverter
Working principle: Energy absorbing, acoustic or reactive.
The surge tank that is used in the experiments is gas type with a free bladder inside
having the energy absorbing property. There are several types of dampeners which
are indicated in Figure 8.

Figure 8 Types of Surge Tanks [18]
11

CHAPTER 2
LITERATURE SURVEY AND AIM OF THE STUDY
In the previous chapter the theory of the pump classification and pulsation
dampening and surge tank properties are explained. In this chapter the literature
survey is presented. The prior work on surge tank sizing, pump experiments and
inlet area configurations on surge tanks is presented. Although there are plenty of
sources in surge tank sizing, there is very little reference on surge tank inlet area
and effects on pressure pulsations. Similarly there is not a significant study to be
taken as reference on experiments of a diaphragm pump. With the lack of
information in the literature the motivation, necessity and the aim of this thesis
study is explained. The details are given in the following sections.
2.1 SURGE TANK SIZING
The selection of an installation location, the size and the inlet area at the entrance
of the surge tanks are the important parameter in the design stages. The effective
use of the surge tanks and eliminating the problems on the piping systems due to
the flow pulsations depend on the selection of these parameters.
Hence, in order to use the surge tanks efficiently and to avoid the damaging effects
of the pulsations on the piping systems, the installation location, the size and the
inlet area of the surge tanks must be designed and applied precisely.
In 1933 Mead [3] suggested, the triplex pumps under low lifts may be provided
with surge tanks of a capacity equal to a singe displacement of the plunger while
12

for single cylinder and double acting pumps the chamber should be six to eight
times of the plunger displacement. Therefore, the triplex pump used in this thesis
study, which has 90 l/min volumetric flow rate with 540 rpm a single displacement
of the piston, is:
3piston cm5.55
3540
100090Q =
⋅
⋅= (2.1)
3surgepiston cm5.55VQ == (2.2)
Where Qpiston is volumetric flow rate of the single piston and Vsurge is the volume of
the surge tank. Hence according to Mead, the surge tank volume of 55.5 cm3 is
enough for the triplex pump having 90 l/min volumetric flow rate with 540 rpm.
Though, the size of the surge tanks should be used depending upon the conditions
of working and the greater irregularities of the flow leads to grater surge tank
capacities. It can be concluded that with greater surge tank size the magnitude of
pulsations can be diminished.
By 1964, Özgür [19] introduced an analysis for positive displacement pumps for
the duplex pumps. From this study, the volume of a surge tank for a simplex and a
duplex pump supplying a definite volumetric flow rate and a rotational speed are to
be calculated with a simplified theory. In this study his approach is extended to
triplex pumps and the theory is redeveloped. It is assumed that the volumetric flow
rate keeps constant and the all the pulsation is assumed to be reduced by the surge
tank. In order to calculate the required surge tank a 1% pulsation is allowed and the
corresponding surge tank volume for the test pump is calculated as in the following
steps:
The mean volumetric flow rate of a triplex pump is
ωπ
=⋅⋅=2
rA2Ar2
60
nqmean (2.3)
13

If these two flow rates are compared it is realized that the flow rate is π times
greater than the mean flow rate when π=α . This much irregularity on the
compressed volume of the flow leads to big oscillations and vibration on the pump.
Therefore using a surge tank and/or increasing the piston number are preferred to
avoid this effect.
In Figure 9 the flow rate diagram of a triplex (three piston/diaphragm) pump is
presented.
Figure 9 Flow Rate Diagram of Triplex Pump
As indicated in Figure 9 the irregularity decreases and the flow rate fluctuation
period decreases to 60o.
In the pumping systems, in order to prevent the excess pressures and pressure
oscillations the device which is called “surge tank” is used. With the help of a
surge tank on the discharge side relives the flow strokes and pumps smoothly and
at a constant velocity.
For simplicity, the flow rate of the pump is
α⋅⋅ω⋅= sinArqpump (2.4)
For a triplex pump, the mean flow rate is
3 pistons
O π α π2 π3
o60mean flow
rate
1α 2α 3α
14

Ar995.0Ar3
qmean ⋅⋅ω⋅=π
⋅⋅ω⋅⋅= (2.5)
Therefore the difference between the mean volumetric flow rate and the pump flow
rate is always compensated by the surge tank. Then the amount of flow entering the
surge tank at any instant is meanpumpsurge qqq −=
For the beginning, the air volume in the surge tank is Ho. From point “O” to at
time t1,
1α
meanpump qq ≤ , therefore the flow is leaving the surge tank. If the amount
of water leaving the surge tank is 1ΔΗ
∫ ∫ ⋅−=⋅−=ΔΗ1 1t
0
t
0pumpmeansurge1 dtqqdtq (2.6)
tdsin3
ArdtsinArAr3 11 t
0
t
01 ω⋅⎟
⎟
⎠
⎞
⎜⎜
⎝
⎛α−
π⋅=⋅⎟
⎟
⎠
⎞
⎜⎜
⎝
⎛α⋅⋅ω−
π
⋅⋅ω⋅=ΔΗ ∫∫ (2.7)
α⋅⎟⎟
⎠
⎞
⎜⎜
⎝
⎛α−
π⋅=ΔΗ ∫
αdsin
3Ar
1
01 (2.8)
⎟⎟
⎠
⎞
⎜⎜
⎝
⎛−α+
π
α⋅=ΔΗ 1cos
3Ar 1
11 (2.7)
If the mean volumetric flow rate and the pump flow rate are equal to each other at
the points and 1α 2α
Ar3
sinAr ⋅⋅ωπ
=α⋅⋅ω⋅ (2.8)
269.11 =α and in radians. 87.12 =α
15

( ) Ar509.01297.211.1Ar1 ⋅⋅=−+⋅⋅=ΔΗ (2.9)
From point 1α to 2α (from time t1 to t2) the amount of water entering the surge tank
is 1ΔΗ
2
1
2
1
3cosArd
3sinAr2
α
α
α
α ⎥⎥⎦
⎤
⎢⎢⎣
⎡
π+α⋅−=α⋅⎟
⎟
⎠
⎞
⎜⎜
⎝
⎛
π−α⋅=ΔΗ ∫ (2.10)
⎥⎥
⎦
⎤
⎢⎢
⎣
⎡
⎟⎟
⎠
⎞
⎜⎜
⎝
⎛
π
α+α−⎟
⎟
⎠
⎞
⎜⎜
⎝
⎛
π
α+α⋅−=ΔΗ
11
222
3cos
3cosAr (2.11)
( ) [ ]5739.0592.0Ar3
coscosAr 12122 −−⋅−=⎥⎥⎦
⎤
⎢⎢⎣
⎡α−α
π+α−α⋅−=ΔΗ (2.12)
Ar018.02 ⋅⋅=ΔΗ (2.13)
Where,
2lr)max(s +=π=α (2.14)
2lr)0min(s +−==α (2.15)
r2ss =Δ= (2.16)
Therefore, (2.17) As009.02 ⋅⋅=ΔΗ
This means ΔH2 amount of water enters the surge tank and the water level
increases from level “I” to “II”. In the next stem between the points 2α to 3α ΔH1
amount of water leaves the surge tank and the water level in the surge tank
decreases to level “I”. Therefore the level in the surge tank differs in between the
levels “I” and “II”. The change in volume of the air is equal to the change in
volume of the water.
16

Therefore ΔH2 shows the difference of the surge tank air volume during the
operation.
To calculate the required surge tank volume this air (or the water) volume
difference is crucial. According to Özgür [19] to keep the discharge volumetric
flow rate as constant the surge tank pressure must be constant and to satisfy this
requirement the surge tank size must be infinitesimally large. However practically
the pressure is allowed to change 1% and the surge tank volume is calculated
consequently:
100
1
2
pp
pp
12
12=
+
− (2.18)
If the air in the surge tank is assumed as isothermal:
CHPHP 2211 =⋅=⋅ , where C is a constant number
If these are substituted in the previous equation:
100
1
V
HH
2
HH
HH
surge
21
12
12=
−=
+
− (2.19)
212 HHH −=Δ
where, ns
QA
⋅
⋅=
60 (2.20)
and as discussed before. r2s =
Hence, V ( ) 100HH 21surge ⋅−= (2.21)
17

If the equation is substituted:
n54100
nss009.0Vsurge ⋅=⋅
⋅⋅⋅=
Q60Q ⋅ (2.22)
6surge 10
540
0015.054V ⋅
⋅= (2.23)
3surge cm150V = (2.24)
This design solution can be adapted as it can be used for surge tank sizing of the
pump which is used in the experiments. Although it is a diaphragm pump, as soon
as the flow characteristics and the number of the diaphragms are the same, the
given design solution and the result are applicable to this pump.
The critical point of way that this design solution is adapted to the test pump is, the
piston area term in equation (2.20) which is affecting the result directly. In the test
pump the area of the piston of the connected diaphragm does not lead the way to
find the volume in the pump. On the other hand the volumetric flow rate of the
pump is supplied by manufacturer of the pump. With this information a virtual
piston area can be calculated as if this pump is a piston pump and the surge tank
volume required to suppress the pulsations of the pump having this much flow rate
can be calculated. Only factor affecting the surge tank size is the amplitude of the
flow pulsations (the number of pistons accordingly) and the flow rate of the pump
Where, Vsurge is volume of the surge tank, s is the stroke length of the piston, Q is
the volumetric flow rate of the pump and n is the rotation speed of the pump. The
calculation procedure is introduced in Appendix A in detail. If the same procedure
is applied to the pumps having different number of pistons, the equations become:
18

n
Q3300Vsurge ⋅= for one piston/diaphragm pump (2.25)
n
Q1260Vsurge ⋅= for two pistons/diaphragm pump having 180o angle between the
crank angles. (2.26)
n
Q240Vsurge ⋅= for four pistons/diaphragm pump having 90o angle between the
t pump used in this thesis study advised a precharge pressure of about 10%
of the average working pressure. Moreover the surge tank cannot maintain higher
According to the design c
pressure of the test pump, the surge tank s
crank angles. (2.27)
The detailed calculation is given in Appendix A
In 1995 Miller [18] was the one who considered the reducing of pressure pulsations
can be achieved not only with proper surge tank size but also with the correct surge
tank gas precharge pressure. The precharge pressure is the gas filled into the gas
surge tank, prior the operation. The most desirable precharge pressure offered by
Miller is 60% to 70% of the average working pressure of the pump or the limit of
the bladder allows. For the gas over liquid type surge tanks which is the type that is
used for the test pump the precharge can be 100% of the working pressure. It is
indicated in the literature that the precharge pressures below 25% of the average
working pressure should be avoided, to extend the bladder life. Also low precharge
pressures decreases the efficiency of the surge tanks However the manufacturer of
the tes
pressures. In case of higher precharge pressures there is air leakage from the surge
tank.
alculations of Miller with the suggested 10% precharge
ize is calculated as,
19

20
2surge pDsKV ⋅⋅= cd p (2.28)
gal315.45407.3394.01.0Vsurge =⋅⋅= (2.29) 3
surge cm16340V = (2.30)
Where, K is the pump constant indicated in
2
ts is not applicable for the surge tanks having 60%
70% precharge pressure. Since the calculated surge tank size is too large for a 90
liters triplex diaphragm pump.
Table 2. s is the stroke of the pump, D
is piston or plunger diameter, Pd is pump discharge pressure, Pc is the precharge
pressure and Vsurge is the volume of the surge tank. It can be concluded that the
procedure which Miller sugges
to

Table 2 Pump Type Constants [18]
21

On the other hand, Arnold and Stewart’s [20] approach is similar to the other
author’s that, they advise a precharge pressure of 60-70% of average fluid pressure.
The surge tank volume is suggested as;
c
22
surgep)p(100
pKsdV
Δ= (2.31)
Where
pc=precharge pressure (psi)
K = pump constant
s = pump stroke (in)
d= pump piston or plunger diameter (in)
p=average fluid pressure (psi)
Δp = allowed pressure pulsation (psi)
Therefore according to the properties of the flow and the pump the surge tank volume is calculated as;
3surge cm3.521V = (2.31)
Botteler and Wende [21] have a different approach but still they advise an 80% of
precharge pressure. According to their formulation but with the test pump’s
pressure values the surge tank size would be;
ttanConsLODeargprech%
cementPumpDsiplaVsurge
⋅⋅= (2.32)
The pump constant is advised as 7 for triplex pumps. Therefore the equation (2.32)
becomes;
32
surge cm4.2587315.0122.0
4DstrokeV =
⋅⋅
π⋅= (2.33)
22

According to the reference [22] the surge tank volume is related with the liquid
volume that the surge tank must store. Also maximum and minimum exit pressures
affect the surge tank size. Therefore the liquid volume that the surge tank must
store can be found as
( )12
2surge
ppeargprech%8.0
dvpV
−⋅⋅
⋅= (2.34)
Figure 10 Surge Tank Representation [22]
And for triplex pumps
18Cdv = (2.35)
Where
dv= liquid volume that the surge tank must store
C= the pump capacity per one revolution
P2=maximum pressure in the line
P1=minimum pressure in the line
23

Therefore
33 cm96.71018
54037.77dv =⋅= (2.36)
( )3
surge cm8.292334612.08.0
96.746V =
−⋅⋅
⋅= (2.37)
With the experiment results gathered for the proper surge tank inlet area
configuration.
Table 3 Results of Surge Tank Sizing Calculations Calculation According to Reference Surge Tank Volume
56 cm3 Mead [3]
150 cm3 Özgür [19]
16340 cm3 Miller [18]
521 cm3 Arnold and Stewart [35]
258 cm3 Boteler, Wende and Jennings [21]
293 cm3 Hidracar
415 cm3 Pump Manufacturer
According to the calculations gathered from the above references the Miller’s
theory is far from the applicability since the resulting surge tank is very large. All
the other theories seem applicable to the test pump. In order to create a vision to the
solution of the problem, the two different sized surge tanks are manufactured. a
200cm3 and a 80 cm3 tank is manufactured and tested. The results are compared
with the original surge tank of the pump which is 415cm3.
24

2.2 EFFECT OF SURGE TANK INLET AREA ON PULSATIONS
Reviewing the literature about surge tank sizing the experimental study on
pumping systems is searched to find similar studies as reference. In 1947 Becthold
[24] introduces his study on gas compression systems and nature of pulsations to be
expected from various types of compressors, as well as the effects which are
produced by different types of piping and other equipment which may be
associated with the compressor. In 2009 Almasi [25] had performed a study on
pulsation and shaking force in reciprocating compressor systems. However these
studies are about systems using gas as the working fluid and the authors did not
introduce a sight on surge tank performance or surge tank inlet area for triplex
diaphragm pumps
In spite of the several computational studies on surge tank design in the literature
there are a few experimental studies on pumps regarding the surge tank
performance and design studies. Besides, there is no considerable study on effect of
surge tank inlet area on pulsations which is considered as a significant parameter.
2.3 AIM OF THE THESIS
Each of the previous researches has a different approach in the design and
performance evaluation of surge tanks for diaphragm pumps. It is found that the
experimental studies generally deal with surge tanks on gas compression systems.
The lack of information in the literature about the nature of the pressure pulsations
of a triplex diaphragm pump with different surge tank sizes and different inlet cross
sectional areas and the experimental studies of the effect of them on the exit
pressure pulsations has been a weak point on surge tank performance studies.
Based on the knowledge taken from the previous studies, the aim of this thesis
study is to design and evaluate the performance of a surge tank for a triplex
diaphragm pump in order to achieve maximum reduction of exit pressure
fluctuations with the proper design of the proper surge tank size (volume) and
25

optimization of the surge tank cross sectional area. Two surge tanks having
different volumes are manufactured and performances are investigated and
compared with the manufacturer’s design. Moreover the effect of inlet cross
sectional area of the surge tank on exit pressure pulsations is investigated and a
proper design solution is searched both for the inlet area and the volume of the
surge tank.
The results of this study will hopefully lead to the broader knowledge of the surge
tank design and performance evaluation for a triplex diaphragm pump and the
insight of the effects of surge tank sizing and inlet cross sectional area on the exit
pressure pulsations.
26

CHAPTER 3
EXPERIMENTAL SETUP AND INSTRUMENTATION
Several experiments are conducted in this research in order to investigate the effect
of surge tanks and its parameter on the discharge pressure fluctuations. An
experimental set up is designed and constructed to perform these tests. Furthermore
the characteristics of the pump are analyzed before surge tank design experiments.
After the pump characteristics is obtained and the experiment set up is modified to
perform the surge tank tests.
3.1 EXPERIMENTAL SETUPS
This experimental study is classified into two parts. First one is done to determine
the pump performance characteristics and second one is done to evaluate the effect
of surge tank parameters for discharge pressure fluctuations of the diaphragm
pump. For these purposes, an experimental setup is constructed. A diaphragm
pump used in the experiments is a positive displacement pump of type triplex pump
having a surge tank on discharge side. The technical properties of this positive
displacement pump are listed in Table 4.
In the following sections the experimental procedures, apparatus are explained in
detail. Specifications of equipments as well as the test procedure are also notified.
27
28
Table 4 Technical Specification of the Test Pump
TEST PUMP
Piston Diameter [mm] 63
Eccentricity [mm] 10
Discharge [l/min] 90
Pressure [kg/cm2] 50
Speed [rpm] 540
Power [hp/kW] 12 / 9
Number of Pistons 3
Membrane Dia. [mm] 120
Useful Membrane Dia. [mm] 94
Efficiency [%] 76
Oil Capacity [l] 1,5
Size [cm] 35 x 42 x 35
Mass [kg] 35
3.1.1 EXPERIMENTAL SETUP FOR OBTAINING PUMP PERFORMANCE
In the preliminary study, an initial set-up is constructed and initial experiments are
performed in order to examine the characteristics of the diaphragm pump. Some of
the structural parts are designed and manufactured for instrumentation of the pump
for the data collecting and system stability. Firstly a clutch is designed and installed
to the pump shaft to engage it to the rotating shaft of the electric motor. In order to
avoid the vibration of the pump during working, an aluminum bench is
manufactured. Also an adaptor part is designed and installed on top of the surge
tank in order to install the pressure transmitter and the gage to the surge tank. The
technical drawing of the adaptor and details accordingly is given in Appendix B.

29
Water Reservoir
Discharge Valve
Clutch Engagement
Figure 11 Experimental Setup for Pump Performance Tests
Electric Motor Filter Pump
Surge Tank
Pressure Transduce
Gage

As indicated in Figure 11 the pump which sucks the fluid from the water tank and
discharges to the container is driven by the electric motor. The exit pressure is
controlled by the discharge valve. A filter is mounted at the suction side of the
pump to avoid unwanted particles inside the pipeline. The inlet, surge tank and exit
pressures are measured by pressure transducers and the gages at the same time.
Before the experiments, the calibrations of the gages are checked with the sensors
which are calibrated with a dead weight tester before. Dead weight tester is a
hydraulic pressure calibration device. It is a piston-cylinder type measuring device.
As primary standards, it is the most accurate instrument for the calibration of
electronic or mechanical pressure measuring instruments [26]. The calibration
curves for the pressure sensors are presented in Figure 12 and Figure 13.
Calibration for Sensor 1
0
5
10
15
20
25
30
35
0,0 0,5 1,0 1,5 2,0 2,5 3,0
voltage [V]
pressure [b
ar]
dead weight tester calibration
calculated calibration
Figure 12 Calibration Curve for Pressure Sensor 1
30

Calibration for Sensor 2
0
5
10
15
20
25
30
35
0 0,5 1 1,5 2 2,5
voltage [V]
pressure [b
ar]
3
dead weight tester calibration
calculated calibration
Figure 13 Calibration Curve for Pressure Sensor 2
The calculated pressure values and dead weight tester results are just identical for
the two sensors as indicated in Figure 12 and Figure 13. Therefore the conversion
of voltage data read from the pressure sensor can be converted to pressure value as
in the following formula which is actually an interpolation according to property of
the sensor and the resistance used to convert the ampere output to voltage data.
( )( 8,0V
8,04,4
60pexit −⋅
−= ) (3.1)
In the experiments, the volumetric flow rate, the electric and hydraulic power
consumption of the system, the inlet and discharge pressures for different rotational
speeds and discharge pressures are measured. With the help of these data, the flow
characteristic of the pump and efficiency is determined. The results of these data
are compared with the test results sent from pump manufacturer which they are
performed in their facility.
31

In the following sections the experimental procedures, apparatus are explained in
detail. Specifications of equipments as well as the test procedure are also notified
3.1.1.1 INSTRUMENTATION FOR PUMP PERFORMANCE TEST SETUP
The instrumentation used in the experimental set-up are indicated this section. The
figures of the instruments are presented in set-up representation diagrams and the
specifications are detailed in Appendix B.
Pump system is filled with water. Pressures at the inlet and exit of the pump are
measured by Bourdon gages. At the pump inlet, the flow and also the pressure
value read from the gage fluctuates because of the pulsations of the diaphragm
pump. Due to the fluctuations average values are recorded. Also, two pressure
transmitters are used to measure the pressure in the surge tank and at the pump
discharge. This value is also compared with the gage display at the discharge side.
The technical specification of the transmitters is given in appendix B The pressure
transmitter is connected to a DC power supply in order to activate the pressure
sensors. The output signals from the sensors are connected to a data logger to
collect the data and record. In these experiments, Elimko data logger is used to
gather pressure transmitter data for pump performance tests. The pressure
transmitter is connected to the data logger and data logger collects the data coming
from the transmitters and sends them to the computer. The data logger software
interface page is indicated in
Figure 14. In Appendix B, it is possible to find the technical details of this data
acquisition device.
32

Figure 14 Datalogger Interface of Computer
A computer is used to monitor the collected data. For the preliminary experiments,
an electric motor having 7.5kW power is used. However the available power to run
the pump could not be obtained. Therefore, another electric motor with 18.5kW
whose specifications is presented in Appendix B is used in the experiments. In
other words, the electric motor is replaced with a more powerful one and the
coupling is modified accordingly.
Siemens frequency converter is used to adjust the electric motor’s rotational speed.
A tachometer is used to measure the rotational speed of the pump. A voltmeter and
clamp meter is used to measure the electric voltage and current input to the electric
motor. In these tests, the volumetric flow rate is measured by a using calibrated
tank method. 30 liter container is used for this purpose. By using chronometer, the
time passed to be filled for the tank is measured and then it is converted to the
volumetric flow rate.
33

Figure 15 Schematic Representation of Instrumentation for Pump Performance Tests
3.1.2 EXPERIMENTAL SETUP FOR SURGE TANK PERFOMANCE TESTS
The surge tank tests are performed in order to achieve the aim of this thesis: to
evaluate the design and performance of a surge tank for a triplex diaphragm pump
in order to achieve maximum reduction of exit pressure fluctuations, with the
proper design of the surge tank size optimization of the surge tank cross sectional
area.
However, after the preliminary experiments are finished and the results are
gathered, it is concluded that the set-up needs to be improved. The main working
Tachometer
Electric Motor PUMP
Gage
Pressure Transmitter
Frequency Converter
Clampmeter
Voltmeter
Data Power Source Logger
Exit Valve
Surge Tank
Water Reservoir
Clutch
Filter
34

principle of the set-up remained the same but some extra elements are added to the
set-up. It is necessary to improve the system components in order to evaluate the
surge tanks parameters. In the previous experimental setup, the electric motor could
not run the pump at higher rotational speed. The coupling used to connect the
electric motor and the pump is replaced with a belt and pulley mechanism in order
to work the motor at the normal speed. This modification is performed to eliminate
the unknown efficiency decrease due to low rotational speed of the pump. After the
modification the only parameter changing the efficiency of the pump became the
ratio of the power of the electric motor to its rated power.
To collect the data from the surge tank some mechanical modifications are
completed. An adaptor is designed and manufactured to connect the gage and the
pressure transducer to the surge tank to collect surge tank pressure change data
during the experiments. However after some tests, it is noticed that the surge tank
pressure is not changing although the exit pressure is increased to 40 bars. It is
realized that there is air leakage from the surge tank during the experiments. Since
this issue affects the exit pressure pulsations, the adaptor and the pressure
transducer is disconnected from the surge tank, although this means to sacrifice the
surge tank pressure data.
In the preliminary experiments the Elimko data logger is used but it was impossible
with the data logger to collect time history data. Therefore the succeeding
experiments are done with Labjack U12 which is able to read 300 Hz data. We
recorded the data with the computer.
The efficiency of the system is unable to determine because of the inaccurate
reading of the clamp meter and voltmeter. Moreover in order to determine the
electric motor efficiency, the motor needs to be run at specified conditions.
However with using the clutch between the pump and the electric motor, the motor
have to be run at 540 rpm instead of 1460 rpm which is normal working speed of
the motor. Because of that a belt and pulley is installed in between the shafts of the
35

36
electric motor and the pump. In short, a belt and pulley connection provides the
electric motor operated at rated speed. With the help of belt and pulley, the speed
of the motor can be decreased by 1/ 2,72.
Furthermore in order to determine the electric power of the system a voltmeter and
a clamp meter is connected to the electric motor. However after the efficiency
calculations it is realized that the electric power calculated with the data from the
voltmeter and clamp meter is not correct. This is because the devices in the market
such as the ones used in the laboratory can have some inaccuracy at the frequency
range that we study. The system used in this thesis works at 27 Hz which will be
calculated in the following chapters. Therefore a current transformer system is
added to the system to measure the electric current accurately. Also to improve the
ease of replacement of the pump there is an adaptor shaft is installed between the
pump shaft and electric motor shaft.
When the pressure pulsations are analyzed, it is realized that the pulsations are
quite high than expected after a couple of measurements for the surge tank tests,.
The setup is improved such that
• The pressure transducers are connected to a battery for power in order to
disconnect them from the DC power source. If the electric motor and the
transducers have the same power source, the signals could be interfered.
• The electric motor is connected to ground by means of cables.
• Screened cables are used to connect the pressure transducers to the data
acquisition system in order to avoid the interference.
There are great advantages of the improvements such as determining the pressure
fluctuation amplitude and the pump efficiency with measuring the electric power
correctly. However there are disadvantages of these improvements such as
increasing the complexity of the set-up and also the friction losses emanated from
extra links. The final set-up is indicated in Figure 16.

37
Tachometer
Flowmeter
Belt & Pulley
Ada
Figure 16 Experimental Setup for Surge Tank Performance Tests
ptorPUMP
Surge Tank
Exit Valve
Gage Pressure Transmitter
Currency Tr
Water Reservoir
Power Source, Battery LabJack U12
Frequency Converter
Electric Motor
ansformers

3.1.2.1 INSTRUMENTATION FOR SURGE TANK PEROFORMANCE EVALUATION TESTS
The instrumentation used in the experimental set-up are indicated this section.
Same Bourdon gages are used to measure the pressure at the inlet and discharge of
the pump. Also same analog pressure transmitter is used to measure the pressure in
the surge tank and at the pump discharge. This value is also compared with the
gage display at the discharge side. The pressure transmitter is connected to a power
source and to a data logger to collect the data and record. Instead of Elimko brand
data logger the pressure time history of the data is recorded with LabJack U12 data
acquisition device for surge tank performance tests. The data from pressure
transmitters are gathered and uploaded to the computer. Pressure time histories are
visualized. LabJack collects data at a rate controlled by its own crystal, and stores
that data in an onboard buffer until read by the PC. The data is transferred from the
LabJack buffer to the PC buffer, simultaneous with data collection, allowing the
data to be streamed to disk continuously [27]. The user interface page is as
presented in Figure 17. The technical specification of this device can be found in
Appendix B.
The data collected with LabJack U12 are saved in “.txt” format and then imported
to Microsoft Excel to “.xls” format. All the data acquisition is performed in Excel
with the help of data analysis tools, Fast Fourier Transforms (FFT) and to speed up
Visual Basic codes are implemented.
The first step in data processing is to convert sensor output data to pressure values.
The pressure sensor expresses the pressure value in terms of amperes and this
output is needed to be converted to into bars. On the other hand the Labjack U12
instrument can collect the voltage data. In order to satisfy these needs the sensor
signal cable is connected to 220Ω resistance.
38

Figure 17 LabJack12 User Interface
A computer is used to monitor the collected data. The pressure transmitter is
connected to the data logger and data logger sends them to the computer for
monitoring. Same frequency converter is used to adjust the electric motor’s
rotational speed. A Racine Flow Meter [28] used to measure volumetric flow rate is
a digital variable area flow meter. The features are specified in Appendix B. Again,
a tachometer is used to measure the rotational speed of the pump. Current
transformers are an indispensable tool to aid in the measurement of AC current.
They provide a means of scaling a large primary current into a smaller, manageable
secondary current for measurement and instrumentation [29] . The figures of the
instruments are presented in set-up representation diagrams and the specifications
are detailed in Appendix B.
39

Figure 18 Schematic Representation of Instrumentation for Surge Tank Performance Tests
3.2 EXPERIMENTAL PROCEDURE
In this section the experimental procedures for the pump performance and the surge
tank tests are explained in detail
3.2.1 PUMP PERFORMANCE TESTS
The purpose of the experiments in the pump performance tests is to analyze the
characteristics of the pump and to verify the results taken from the set-up. In this
Tachometer
Electric Motor
Flowmeter
Belt & Pulley
Adaptor
PUMP Filter Surge
Tank
Water Reservoir
Exit Valve
Gage
Gage
Pressure Transmitter
Currency Transformers
Power Source
Labjack
Frequency Converter
Battery
40

scope a set of experiments is performed and the results are compared with the data
supplied by the pump manufacturer. Following parameters are measured in the
duration of experiment.
a) Rotational Speed of the pump from a tachometer
b) Pump Inlet pressure for Bourdon gage
c) Pump Discharge pressure from Bourdon gage and pressure transmitter
d) Electric Voltage Input from voltmeter
e) Electric Current Input from clamp meter
f) Time passed to fill the calibrated tank.
To evaluate the pump performance in the preliminary study it is needed to evaluate
electrical power. However as mentioned before due to some issues and
incompatible instrumentation that cannot be possible.
In order to calculate the flow rate the calibrated tank is used. The time for the tank
to be filled is measured and the volumetric flow rate is calculated as follows:
[ slt
VQ
k/
tan⋅= ] (3.2)
Where t represents the time for 30 l tank to be filled in seconds and Vtank is the
volume of the measurement tank (30 liters). The volumetric flow rate, hydraulic
power is calculated as:
Qpphyd ⋅Δ= (3.3)
inleteargdisch ppp −⋅=Δ (3.4)
where Δp is pressure difference between inlet and exit of the pump and Q is the
volumetric flow rate.
41

The pressure values are read from data logger which does not collect time history
of the data. It only gives the instantaneous value read from the transducers.
Therefore the pulsations were not possible to evaluate and investigate. The pump
properties are determined and the drawbacks of the experiment set are realized with
the help of the preliminary pump properties experiments
3.2.2 SURGE TANK PEROFRMANCE TESTS
After getting the characteristic behavior of the pump, the deficiencies of the
experimental set up is eliminated. The main purpose of the experiments in the
scope of this thesis study is to find a proper area ratio for the surge tank of the 3
diaphragm positive displacement pump having a 90lt /min volumetric flow rate and
a rotational speed of 540 rpm.
For this purpose the existing set-up is modified and a final set-up is obtained which
is indicated in Figure 18 and the following parameters are measured with the
corresponding equipment explained above.
a) Pump inlet pressure
b) Pump exit pressure
c) Pump rotational speed
d) Electric power
e) Pump volumetric flow rate
Moreover surge tank pressure is measured in couple of experiments. But after some
runs the adaptor part started to slip some air. Therefore the adaptor part with the
pressure transducer is disconnected and the original surge tank is used.
42

The flow frequency is calculated as follows:
27360
540fpump =⋅= Hz (3.5)
The electric motor frequency is:
5.24r60
540f pulley&beltmotor =⋅= Hz (3.6)
In order to evaluate the minimum pulsations and to determine a proper design for
both surge tank size and the inlet area adaptor, the maximum, minimum and the
average pressure values are recorded and peak-to-peak pulsation is calculated as
[19]:
average
minmax
p
pppulsation%
−= (3.7)
The main design consideration is the peak to peak pulsation percentages at 40 bars
since the normal working pressure of the pump is around this value. To evaluate
the data frequency spectrum to investigate that if the pulsation peaks are at the
pump working frequency, the data is processed. The processing of the collected
data is done by Microsoft Office Excel program. The time histories and their
frequency spectrum are evaluated. The data is converted to frequency domain by
the FFT converter of Office Excel and with the help of the manual by Klingenberg
[30]. The peaks of frequency spectrum of the pressure data are achieved at 27 Hz as
expected .The regarding results are presented in Chapter 4.
Variation of pressure with time is only collected in these experiments Rotational
speed or the volumetric flow rate history in time is not being able to be collected.
Only a single data for rotational speed and the volumetric flow rate could be
43

recorded for each run. It could be a further study to improve the instrumentation
and visualize the flow rate change with the pressure pulsations and the rotational
speed accuracy during the runs.
Various test runs are performed to simulate the different conditions to analyze the
behavior of the pump and come out with optimization concept. The parameters
which kept constant in the runs are;
• Rotational speed of the pump
• Surge tank initial pressure
• Surge tank volume
The test matrix is presented in section 3.2.3.
The rotational speed of the pump is adjusted by the frequency converter. Similarly
the surge tank pressure is intended to be kept constant during the runs. However
there may be some leakage on the valve. Hence a set of experiments is intended to
be performed with a higher pre-pressure of the surge tank. However the valve on
top of the surge tank did not let pressurizing it higher than 5 bars and this test is
cancelled. It could be a further study to improve the instrumentation and see the
effect of surge tank pre-pressure o the pulsations of exit pressures. Moreover after
some tests the adaptor connecting the pressure transducer to the surge tank was out
of order and it is disconnected sacrificing the surge tank pressure time history.
A valve installed to the discharge side of the pump. The size and inlet cross
sectional of the surge tank are analyzed to obtain the effects on the pressure
fluctuations at the discharge of the pump. Before finding the proper area ratio of
the inlet area, different surge tanks having different sizes are tested. The exit
pressure is varied from 0 bars to 40 bars with 10 bars increment. Although the
maximum exit pressure of the pump is 50 bars. The tests are performed at 40 bars
maximum because of the safety issues in the fluid laboratory and the excess
vibration of the set up. It could be a further study to improve the instrumentation
44

such as using a more stable bench which pump and the electric motor is installed or
using any suitable damper for the pump.
Three surge tanks are tested with different volumes whose figures are indicated in
Table 5. The experiments that are performed to find the proper inlet cross sectional
area using the eight adaptor configurations are performed with the largest surge
tank which is suggested by the manufacturer. The other two surge tanks are
manufactured according prior work of Chapter 2 but about 5% larger. The
properties of the surge tanks are presented in Table 5. After the experiments are
conducted to evaluate the surge tank size leading the minimum pulsations the
experiments are performed to evaluate the proper adaptor configuration. There are
eight adaptor configurations whose properties are indicated in Table 6 and detail
drawings are indicated in Appendix B.
Table 5 Surge Tanks Used in the Experiments ID Volume Figure
Surge Tank 1 415 cm3
Surge Tank 2 200 cm3
Surge Tank 3 80 cm3
45

Table 6 Surge Tank Inlet Area Configurations Adaptor no Number of holes Hole diameter Area Ratio 1 Surge tank is disconnected. 0 2 7 2 0,086 3 5 3 0,139 4 3 4 0,148 5 7 3 0,194 6 5 4 0,247 7 7 4 0,346 8 1 18 1
The area ratios of the adaptors are calculated rationalizing the area of the adaptor to
the maximum allowable inlet area. The ratio is calculated as:
adaptortheofareaavailableMaximum
adaptortheof.areaOpenAreaRatio
⋅⋅⋅⋅⋅
⋅⋅⋅⋅= (3.8)
The efficiency of the system is calculated as follows:
Pelec
Phydsystem =η (3.9)
Where,
Phyd =Hydraulic power
Pelec =Electrical Power
η = Efficiency
Furthermore the efficiency of the pump is calculated with the following
information
• The efficiency of the belt and the pulley system is 0,93 [31]
• The efficiency of the frequency converter is 0,97 [32]
46

• The efficiency of the electric motor is 0,91 at the rated power [33]
In order to calculate the efficiency and the loss of efficiency of the electric motor
the power percentage is calculated and efficiency loss percentage is calculated for
every test run with the help of Figure 19 in Motor Challenge Factsheet [34]. In
every measurement the electric power is measured from current transformers and
rationalized with the motor rated power which is 18,5 kW as the specifications are
given in Appendix B.
Figure 19 Motor Part Load Efficiency [34]
All the comparison between the results is done according to the peak to peak
pressures and the % pulsations. The exit pressure pulsations are compared for
different exit pressures and for different surge tank cross sectional areas.
47

3.2.3 TEST MATRIX
The eight configurations of surge tank inlet area adaptors are used whose detail is
indicated in previous sections. After this experiment the two more surge tanks are
tested with a single inlet area adaptor. The test matrix is presented in Table 7. For
all 8 configurations four exit pressure values; 0, 20, 30 and 40 bars are tested
Table 7 Test Matrix Test No Pexit [bar]
1
Surge tank volume 80 cm3 & r=0.14
5 2 20 3 30 4 40 5
Surge tank volume 200 cm3 & r=0.14
5 6 20 7 30 8 40 9
Surge tank volume 415 cm3 & r=0.14
5 10 20 11 30 12 40 13
Surge tank volume 415 cm3 & r=0.09
5 14 20 15 30 16 40 17
Surge tank volume 415 cm3 & r=0.14
5 18 20 19 30 20 40 21
Surge tank volume 415 cm3 & r=0.15
5 22 20 23 30 24 40 25
Surge tank volume 415 cm3 & r=0.19
5 26 20 27 30 28 40 29
Surge tank volume 415 cm3 & r=0.25
5 30 20 31 30 32 40
48

Table 7 Test Matrix (Continued)
33 Surge tank volume 415 cm3 & r=0.35 5 34
20
35 30 36 40 37
Surge tank volume 415 cm3 & r=1
5 38 20 39 30 40 40
49

CHAPTER 4
RESULTS AND DISCUSSION
In this section of the thesis study, the outcomes of the experiments and the results
are presented and the remarkable conclusions are reached. The effect of surge tank
size and inlet cross sectional area is investigated to evaluate the proper
configuration dampening the pulsations in the system.
4.1 PUMP PERFORMANCE TESTS
In the pump performance tests, pump exit and inlet pressures, surge tank pressure,
rotational speed of the pump and flow rate of the system are recorded for different
rotational speeds and different exit pressures. With the measurements, the
volumetric flow rate and the hydraulic power consumption of the system are
calculated. The test results are presented in Table 8. This study is done to
determine the performance of the pump and verify the test set-up reliability. There
are more than one data for each test points. However, the average values are
tabulated in Table 8.
50

Table 8 Pump Performance Test Results
N [rpm]
t [s]
pexit [bar]
pin [mm Hg]
Q [l/min]
Δp [Pa]
Phyd [W]
400 28,7 1 -100 63 1,13E+02 118 400 30,6 10 -170 59 1,02E+03 1004 400 31,4 20 -200 57 2,03E+03 1936 500 23,0 1 -90 78 1,12E+02 146 500 24,3 10 -50 74 1,01E+03 1243 500 25,0 20 -60 72 2,01E+03 2413 540 21,4 1 -90 84 1,12E+02 157 540 22,5 5 -50 80 5,07E+02 675 540 22,4 10 -100 80 1,01E+03 1357 540 23,2 15 -50 78 1,51E+03 1951 540 22,8 20 -100 79 2,01E+03 2649 540 23,4 25 -60 77 2,51E+03 3216 540 23,6 30 -60 76 2,96E+03 3771 540 23,2 40 -100 78 4,17E+06 5428 550 21,5 1 -100 84 1,13E+02 158 550 22,0 10 -100 82 1,01E+03 1382 550 23,0 20 -80 78 2,01E+03 2627
According to the data indicated above the pump performance properties are
presented in the following paragraphs.
Volumetric flow rate change with pump speed for different exit pressures is
presented in Figure 20. According to the figure, as the pump speed increases the
volumetric flow rate also increases up to the normal working speed of the pump
which is 540 rpm. Higher than this value the volumetric flow rate starts to decrease
slightly which is caused by the fluid leakage from the pump.
51

Volumetric Flow Rate Change with Pump Speed
50
55
60
65
70
75
80
85
90
300 350 400 450 500 550 600
n [rpm]
Q [l/min]
1 bar10 bar20 bar
Figure 20 Volumetric Flow Rate vs. Pump Speed
Volumetric flow rate change with exit pressure for different pump speeds is
presented in Figure 21. According to the figure, as the exit pressure increases the
volumetric flow rate is supposed to keep constant where an ideal diaphragm pump
does. However due to the increase in exit pressure there is some leakage in the
pump for the real cases. As a result, the volumetric flow rate slightly decreases as
the exit pressure increases.
52

Volumetric Flow Rate Change with Exit Presure
0
10
20
30
40
50
60
70
80
90
0 5 10 15 20 25 30 35
Exit Pressure [bar]
Q [l/min]
400 rpm
500 rpm
540 rpm
550 rpm
Figure 21 Volumetric Flow Rate vs. Exit pressure
The hydraulic power change with change in pump speed for different exit pressures
is presented in Figure 22. According to the figure with the increase in pump speed
the hydraulic power increases. At the same pump speed as the exit pressure
increases the hydraulic power increases too. This result is expected since the
hydraulic power relates the exit pressure. As presented in Figure 21 the volumetric
flow rate is directly proportional to pump speed therefore hydraulic power is
directly proportional to pump speed too.
53

Hydraulic Power Change with Pump Speed
0
500
1000
1500
2000
2500
3000
300 350 400 450 500 550 600
n [rpm]
Hydraulic Power [W]
1bar10bar20bar
Figure 22 Hydraulic Power vs. Pump speed
The hydraulic power change with change in pump exit pressure for different pump
speeds is presented in Figure 23. According to the figure, with the increase in exit
pressure hydraulic power increases too.
Hydraulic Power Change with Exit Pressure
0
500
1000
1500
2000
2500
3000
3500
4000
0 5 10 15 20 25 30 35
Exit Pressure [bar]
HydraulicPower [W]
400rpm
500rpm
540rpm
550rpm
Figure 23 Hydraulic Power vs. Exit Pressure
54
Pump Efficiency with Respect to Exit Pressure
0%
10%
20%
30%
40%
50%
60%
70%
80%
90%
0 5 10 15 20 25 30 35 40 45
Exit Pressure [bar]
Pump Efficiency
Efficiency
Curve Fit
Figure 24 Pump Efficiency vs.Exit Pressure
The pump efficiency behaviors with the change in exit pressure and the volumetric
flow rate are indicated in Figure 24 and Figure25. According to the efficiency
figures the best efficiency is achieved at 40 bar exit pressure and as the volumetric
flow rate increases the efficiency of the pump decreases. The results support each
other since, as the exit pressure increases, the volumetric flow rate of the pump
decreases due to the leakage of the pump.
55

Pump Efficiency with Respect to Volumetric Flow Rate
0%
10%
20%
30%
40%
50%
60%
70%
80%
90%
75 76 77 78 79 80 81 82 83 84
Volumetric Flow Rate[l/min]
Pump Efficiency
Efficiency
Curve Fit
Figure 25 Pump Efficiency vs.Volumetric Flow Rate
The preliminary pump performance tests are finalized and the results are presented.
According to the data and the figures presented the results are compatible with the
nature of the diaphragm pumps. Therefore it can be concluded that the test set up is
proper and the further experiments could be performed with the set-up.
4.2 SURGE TANK PEROFRMANCE TESTS
After pump performance tests, the experiments for the main focus of this thesis
study surge tank performance tests are conducted. In the surge tank tests the effect
of the surge tank size and the effect of inlet area of the surge tank on the exit
pressure pulsations are investigated. The proper designs for the surge tank size and
the surge tank inlet area configuration is evaluated. The exit pressure time history
is recorded and the evaluations are done with the time history data.
The pressure sensors are used to measure the pressure of flow on the discharge side
of the pump and the pulsations in the surge tank. With the data gathered from the
56

sensors the relation of the exit pressure and the surge tank pressure is interrogated
with linear correlation analysis and Pearson analysis functions of Microsoft Excel
and also with the hand solution of correlation coefficient ρxy. In every test run the
sample correlation function which is supposed to be in the interval [-1, 1] comes
out to be 1 or -1 as expected as indicated in Figure 26. The figure is a sample figure
of configuration 1 for 30 bars data.
Correlation Coefficient for Configuration1-30 bars
-1,5
-1
-0,5
0
0,5
1
1,5
0 50 100 150 200 250 300 350
Frequency [Hz]
Cor
rela
tion
Coe
ffici
ent
Figure 26 Correlation Coefficient
When the sample correlation function is ±1 the variables have a perfect linear
dependence. A nonlinear relationship and data scatter due to measurement error or
imperfect correlation of variables will force ρxy towards zero. For N number of
data;
( ) ( )[ ]
( ) ( )2/1N
1
N
1
2i
2i
N
1ii
xy
yyxx
yyxx
⎥⎥⎦
⎤
⎢⎢⎣
⎡−⋅−
−⋅−
=ρ
∑ ∑
∑ N,1i K= (4.1)
57

N
x
x
N
1i∑
= N,1i K= (4.2)
N
y
y
N
1i∑
= N,1i K= (4.3)
It can be concluded that the pulsations of the flow are directly related with the
surge tank pulsations for the whole frequency spectrum of the flow.
In order to identify the peak frequency of the pulsations, the pressure time history
of the data is converted to frequency domain. A frequency spectrum is calculated
for a time range between 5 to 8.41 seconds which is 1024 data points as
recommended in [30].This range was chosen randomly however a time lag is
considered for the system to reach steady state after changing the exit pressure.
In Figure 27 the time history of a sample data is indicated for a 40 bars exit
pressure. The frequency of this data is evaluated to identify the frequency of the
maximum pulsation frequency in the system. As presented in Figure 28 the
spectrum analysis of the data shows that the pulsation peaks are at 27 Hz and at
270Hz. This is expected for a 540 rpm 3 diaphragm pump flow since our system
frequency is also 27 Hz as explained in Chapter 3.
58

40 bar Exit Pressure Time History
0
5
10
15
20
25
30
35
40
45
50
5 5,1 5,2 5,3 5,4 5,5 5,6 5,7 5,8 5,9
Time [s]
Exit Pressure [bar]
Figure 27 Pressure Time History at 40 bar Exit Pressure with adaptor having area ratio of 0.14
40 bar Exit Pressure Frequency Spectrum
0
0,2
0,4
0,6
0,8
1
1,2
1,4
1,6
1,8
0 10 20 30 40 50 60 70 8
Frequency [Hz]
Pulsation Magnitude
[dB]
0
Figure 28 Pressure Frequency Spectrum at 40 bar Exit Pressure with adaptor having area ratio of 0.14
59

60
4.2.1 EFFECT OF THE SURGE TANK SIZE
Experiments are performed with surge tanks having different volumes. Six surge
tank sizing design procedures are presented in section 2.1. In order to analyze the
effect of surge tank size on the exit pulsations for the pump having three
diaphragms and having 90l/min volumetric flow rate, and to find a proper surge
tank size, a 80cm3, 200cm3 and 415cm3 surge tanks are tested. The original,
manufacturer’s surge tank’s section view is presented in Figure 29. The results are
compared with the data where the pump is run without the surge tank. The surge
tank is disassembled from the system and the pump worked with no surge tank.
Figure 29 Section View of the Surge Tank of the Test Pump
All the surge tanks are tested with the adaptor part having the area ratio of 0,14.
This is the proper area ratio creating the minimum pulsations. This result will be
detailed in the succeeding sections. In Table 9 the results are tabulated.
38.35 cm3
376.8 cm3
Membrane

Table 9 Experimental Data for Different Surge Tank Sizes
Surge Tank volume [cm3]
N [rpm]
Q [l/min]
pexit [bar]
pin [mmHg] ΔP[Pa] Pelec
[W] Phyd [W] ηsystem ηPump
pexit Max [bar]
pexit Min [bar]
%pulsation
0 540 89,73 4,5 -180 4,71E+05 2100 704 34% 59% 12,9 0,1 285% 0 540 81,13 20,9 -180 2,11E+06 4740 2858 60% 83% 39,3 9,0 145% 0 540 80,61 31,2 -180 3,15E+06 6180 4226 68% 84% 51,8 15,3 117% 0 540 79,18 41,5 -180 4,17E+06 7930 5504 69% 85% 61,3 23,6 91%
80 540 86,67 4,4 -200 4,71E+05 1870 680 36% 64% 13,0 0,3 287% 80 540 79,7 20,6 -200 2,09E+06 4470 2772 62% 85% 24,7 14,5 50% 80 540 80,71 30,7 -200 3,10E+06 6220 4172 67% 83% 36,6 21,6 49% 80 540 80,03 41,2 -200 4,15E+06 8080 5537 69% 84% 50,3
61
28,7 52% 200 540 83,65 4,3 -200 4,59E+05 1880 640 34% 60% 8,1 1,0 166% 200 540 78,28 20,2 -200 2,05E+06 4410 2669 61% 83% 25,6 15,0 52% 200 540 79,51 30,8 -200 3,11E+06 6380 4121 65% 80% 35,4 23,0 40% 200 540 79,87 41,0 -200 4,13E+06 8040 5499 68% 84% 46,6 30,8 39% 415 540 82,06 4,4 -180 4,61E+05 1950 631 32% 57% 10,6 1,3 211% 415 540 77,3 21,0 -180 2,12E+06 4490 2731 61% 83% 26,2 16,6 46% 415 540 78,26 30,8 -180 3,10E+06 6170 4046 66% 81% 36,6 24,7 39% 415 540 77,37 41,3 -180 4,16E+06 8120 5362 66% 81% 46,3 33,4 31%

According to the experimental data above the percentage of pressure pulsation are
calculated as indicated in equation (3.7)
40 bar Exit Pressure Time History
0
10
20
30
40
50
60
70
5 5,1 5,2 5,3 5,4 5,5 5,6 5,7 5,8 5,9
Time [s]
Exit Pressure [bar]
Figure 30 Pressure Time History at 40 bar Exit Pressure without surge tank on the pump
40 bar Exit Pressure Frequency Spectrum
0
1
2
3
4
5
6
7
8
9
10
0 10 20 30 40 50 60 70 80
Frequency [Hz]
Pulsation Magnitude
[dB]
Figure 31 Pressure Frequency Spectrum at 40 bar Exit Pressure without surge tank on the pump
62

As indicated in Figure 30 and Figure 31 when there is no surge tank on the pump
the pressure pulsations are quite different from the configurations with surge tank
expressed in Figure 27 and Figure 28. The pressure pulsations are much higher
when the surge tank is disconnected from the system. Form the figures it is
obviously seen how effective surge tank is in pulsation reducing. The exit pressure
pulsation changes with surge tank size are explained in following figures in detail.
In Figure 32 the exit pressure pulsation percentages are presented. As mentioned
several times before, the main purpose of this study is to find a proper surge tank
size and inlet area creating the minimum exit pressure pulsation. What can be
concluded from the figure is; the minimum pulsations in the system are achieved in
40 bars where the best efficiency is achieved. Therefore to create the minimum
pressure change in the flow this pump should be run at 40 bars. On the other hand,
only scattered data could be achieved for 5 bars for all the surge tank sizes. The
reason of the scattered data is unknown. However a curve is fitted to a polynomial
and presented in Figure 32.
Exit Pressure Pulsation Change with Surge Tank Size
0%
50%
100%
150%
200%
250%
300%
350%
0 50 100 150 200 250 300 350 400 450
Suge Tank Size [cm3]
Pulsations [%
]
5 bar20 bar30 bar40 bar5 bar Curve Fit
Figure 32 Exit Pressure Pulsation Change with Surge Tank Size
63

If Figure 32 is considered closely one should be focus on Figure 33. The figure
indicates a detail view on pulsations at 40 bars. The minimum pulsation is achieved
with the surge tank having the maximum volume. The pressure peak-to peak
pulsation percentage is 31%. Therefore it can be concluded that to achieve the
minimum pressure fluctuations in the system the pump should be run with the
biggest surge tank having 415 cm3. It is obvious that if there were tanks having
higher volume than 415cm3 the pulsations would be lower. This can be a further
study to do the test with larger surge tanks. This outcome agrees the theory which
Mead [3] introduced as with greater surge tank size the magnitude of pulsations can
be diminished more. With increasing the surge tank size the pulsations can be
decreased more.
Exit Pressure Pulsation Change with Surge Tank Size
0%
10%
20%
30%
40%
50%
60%
70%
80%
90%
100%
0 50 100 150 200 250 300 350 400 450
Suge Tank Size [cm3]
Pulsations [%
]
40 bar
Figure 33 Exit Pressure Pulsation Change with Surge Tank Size at 40 bar
64
65
4.2.2 EFFECT OF THE INLET AREA OF SURGE TANK
In the previous section the effect of the surge tank size on the exit pressure
pulsations is explained and the results are presented. To analyze the effect of the
surge tank inlet area the surge tank giving the best results are used in the next
experiments. The largest tank having 415 cm3 is used in the following experiments
having the minimum pulsations values. In this section the experimental results are
presented at Table 10. Among the inlet area configurations a proper configuration
creating the minimum pulsations is searched
The normal working pressure of the pump is 40 bars. Therefore the concentration
to find the proper configuration is focused on the 40 bars exit pressure data.
The sizes and the areas of the adaptors noted in Chapter 3. Therefore, eight inlet
area configurations of surge tank are tested. Among the eight, the one creating
minimum pressure pulsation at 40 bars is concluded as the proper solution for this
pump and surge tank size.

Table 10 Experimental Data for Different Surge Tank Inlet Areas Adaptor
Area Ratio
N [rpm]
pexit [bar]
pin [mmHg]
Q [l/min] Δp[Pa] Pelec
[W] Phyd [W] ηsystem ηPump pexit
max pexit min %pulsation
0 540 4,5 -180 89,73 4,71E+05 2100 704 34% 58% 12,9 0,1 285% 0 540 20,9 -180 81,13 2,11E+06 4740 2858 60% 82% 39,3 9,0 145% 0 540 31,2 -180 80,61 3,15E+06 6180 4226 68% 83% 51,8 15,3 117% 0 540 41,5 -180 79,18 4,17E+06 7930 5504 69% 85% 61,3 23,6 91%
0,086 540 4,4 -200 83,12 4,70E+05 1880 652 35% 60% 8,8 1,1 174% 0,086 540 21,1 -200 79,31 2,13E+06 4630 2818 61% 82% 25,8 13,0 61% 0,086 540 31,0 -200 79,89 3,12E+06 6130 4160 68% 83% 35,8 21,4 46% 0,086 540 41,3 -200 79,3 4,16E+06 8080 5497 68% 83% 45,7 30,7 36% 0,139 540 4,4 -180 82,06 4,61E+05 1950 631 32% 58% 10,6 1,3 211% 0,139 540 21,0 -180 77,3 2,12E+06 4490 2731 61% 83% 26,2 16,6 46% 0,139 540 30,8 -180 78,26 3,10E+06 6170 4046 66% 78% 36,6
66
24,7 39% 0,139 540 41,3 -180 77,37 4,16E+06 8120 5362 66% 82% 46,3 33,4 31% 0,148 540 4,4 -200 83,38 4,70E+05 1880 653 35% 56% 8,4 1,3 160% 0,148 540 20,8 -200 77,91 2,11E+06 4560 2738 60% 82% 26,8 16,2 51% 0,148 540 30,9 -200 79,01 3,12E+06 6250 4105 66% 80% 37,4 24,0 43% 0,148 540 40,6 -200 79,4 4,08E+06 7840 5404 69% 80% 46,0 32,2 34% 0,194 540 4,4 -180 82,71 4,60E+05 1910 634 33% 60% 9,1 2,0 162% 0,194 540 20,7 -180 77,96 2,09E+06 4500 2722 61% 81% 25,9 15,6 49% 0,194 540 31,1 -180 77,85 3,13E+06 6280 4065 65% 80% 36,0 23,6 40% 0,194 540 41,2 -180 77,96 4,14E+06 7800 5384 69% 84% 45,3 31,6 33% 0,247 540 4,3 -200 81,75 4,55E+05 1860 619 33% 58% 10,5 0,6 229% 0,247 540 20,8 -200 77,11 2,11E+06 4430 2714 61% 82% 28,1 14,9 63%

67
Table 10 Continued Adaptor
Area Ratio
N [rpm]
pexit [bar]
pin [mmHg]
Q [l/min] Δp[Pa] Pelec
[W] Phyd [W] ηsystem ηPump pexit
max pexit min %pulsation N
[rpm]
0,247 540 30,8 -200 77,92 3,11E+06 6290 4036 64% 79% 37,9 22,7 49% 0,247 540 41,4 -200 78,14 0,0013 4,17E+06 8040 5428 68% 79% 47,0 31,9 37% 0,346 540 4,3 -200 84,1 0,0014 4,56E+05 1940 639 33% 84% 10,0 1,1 207% 0,346 540 19,4 -200 78,6 0,0013 1,96E+06 4400 2570 58% 79% 27,7 6,0 112% 0,346 540 30,7 -200 78,72 0,0013 3,09E+06 6340 4056 64% 78% 37,7 22,5 50% 0,346 540 40,7 -200 79,75 0,0013 4,10E+06 8000 5445 68% 83% 46,5 30,7 39%
1 540 4,4 -181 83,51 0,0014 4,62E+05 1950 644 33% 57% 9,7 1,8 180% 1 540 20,6 -180 78,38 0,0013 2,09E+06 4490 2726 61% 82% 26,4 14,9 56% 1 540 31,6 -180 79,44 0,0013 3,18E+06 6170 4216 68% 83% 37,8 23,0 47% 1 540 41,1 -180 78,79 0,0013 4,14E+06 8120 5433 67% 82% 45,8 30,8 37%

According to the result tabulated in Table 10 the following conclusions can be
reached.
In Figure 34 the exit pressure pulsation percentages are presented. From this figure,
the minimum pulsations in the system are achieved at 40 bars where the best
efficiency is achieved. Also 40 bars is the normal working pressure of the pump
itself. Therefore to create the minimum pressure change in the flow this pump
should be run at 40 bars. On the other hand, only scattered data could be achieved
for 5 bars for all the surge tank sizes. The reason of the scattered data is unknown.
However a curve is fitted to a polynomial and presented in Figure 34.
Figure 34 shows that, if the surge tank is disconnected from the pump the pressure
pulsations become extensively high. For smaller exit pressures the pressure
pulsations are higher for the configuration having no surge tank. This result shows
the necessity of the surge tank in this pump application. When a surge tank with
inlet adaptor ratio of 0.09 is connected to the pump the pressure pulsations starts to
decrease apparently. When the surge tank inlet area ratio is increased more than
0.14 there is not much change in pressure pulsations.
68

Exit Pressure Pulsation Change with Surge Tank Inlet Area
0%
50%
100%
150%
200%
250%
300%
0 0,1 0,2 0,3 0,4 0,5 0,6 0,7 0,8 0,9 1
Area Ratio
Pulsations [%
]
5 bar20 bar30 bar40 bar5 bar Curve Fit
Figure 34 Exit Pressure Pulsations vs. Surge Tank Inlet Area
If Figure 34 is considered closely one should be focus on Figure 35. The figure
indicates a detail view on pulsations at 40 bars. The minimum pulsation is achieved
with the adaptor having area ratio of 0.14. The pressure peak-to peak pulsation
percentage is 31%. Therefore it can be concluded that to achieve the minimum
pressure fluctuations in the system the ratio of the surge tank inlet area to the
maximum available inlet area should be 0.14.
The manufacturer is better to change the design of the inlet area of the surge tank to
achieve smaller pulsations. Because the manufacturers original surge tank has an
inlet area ratio of 0.25 creating 37% exit pressure pulsation. With this thesis study
and the concluded results it is possible to decrease the exit pressure pulsations by
6%.
69

Exit Pressure Pulsation Change with Surge Tank Inlet Area
25%
35%
45%
55%
65%
75%
85%
95%
0 0,1 0,2 0,3 0,4 0,5 0,6 0,7 0,8 0,9 1
Area Ratio
Pulsation [%
]
40 bar
31%
Figure 35 Exit Pressure Pulsations vs. Surge Tank Inlet Area at 40 bar
One may conclude that instead of creating an inlet area with a ratio to the
allowable, it is acceptable to open the inlet area to the maximum value. This can be
correct if only the pulsation effects are considered. Because if the surge tank inlet
area is machined to the maximum allowable diameter the peak-to-peak pulsation is
37%. The effort of machining should be considered against the pulsation reduction.
However as soon as the surge tank diaphragm edge is very close to the surge tank
inlet if the connector combining the surge tank to the pump is machined thoroughly
the sharp edges may deform and even tear the diaphragm. However, with the
adaptor having the area ratio smaller than 1 has a supporting face for the diaphragm
avoiding deforming or tearing. Therefore the proper solution both mechanically
and for the minimum peak-to-peak pulsation is the adaptor having area ratio of
0.14.
70
4.3 UNCERTAINTY ANALYSIS
The uncertainty analysis of the experiment is performed to facilitate determine the
errors in the system and confidence of the results. In order to perform the analysis
30 measurements are recorded for Surge Tank 1 adaptor no 3 and the average exit
and surge tank pressures are evaluated for every test.
Table 11 presents the data and the maximum errors for the most common
confidence level of 95% [35].
In order to find the maximum error in an experiment the significance level must be
determined. For the confidence levels, the corresponding significance levels are as
follows:
⎪⎭
⎪⎬
⎫
⎪⎩
⎪⎨
⎧=
levelconfidence%99for58,2levelconfidence%95for96,1levelconfidence%90for645,1
z (4.1)
nE
x
2zσ
⋅= α (4.2)
Where,
E: Maximum error
z: Gaussian distribution value
α: significance level
σx: standard deviation of the data
n: number of data
x : mean of the data
For the data in Table 11 the error of the measured exit pressure value for the 95%
confidence level is:
71

0.010=⋅=30
0267.096.1E (4.3)
Table 11 Uncertainty Analysis Data and Results
Pin [mm Hg]
Q [l/min]
N [rpm]
V [Volt]
I [A]
Pexit [bars]
Psurge tank [bars]
Mean -140 81,26 542,6 275,92 12, 44,597 44,387
Standard Deviation 0 0,177 0,504 0,14 0,072 0,0267 0,0241
E 0 0,063 0,180 0,051 0,026 0,010 0,009
Since all the error values are small enough, it can be concluded that the tests are
accurate and the experiment results are truthful.
72

CHAPTER 5
CONCLUDING REMARKS
In the previous chapters the introduction information on the diaphragm pumps,
surge tanks and types are introduced, the corresponding literature survey and the
aim of this thesis in presented. The aim of this thesis study is to evaluate the design
and performance of a surge tank for a triplex diaphragm pump in order to achieve
maximum reduction of exit pressure fluctuations, with the proper surge tank size
and the surge tank cross sectional area. On behalf of this aim and experimental set
up is constructed and related experiments are conducted, in order to conclude to a
proper design of the surge tank. Corresponding results and discussion is also
explained n detail.
In this chapter concluding remarks on the whole thesis study is presented.
The surge tank design study is performed with six different methods of different
authors and three different surge tanks which are size representative of calculations
are used on the pump and experiments are conducted. Among the surge tanks are
having 80cm3, 200cm3 and 415cm3 the minimum peak to peak pulsations are
achieved with the largest surge tank having 415cm3 volume which is the original
surge tank of the test pump supplied by the pump manufacturer. The result;
achieving the minimum peak to peak pulsations is supported by Mead [3] who
introduced the concept; as with greater surge tank size the magnitude of pulsations
can be diminished more. According to this if larger surge tank is used in the
experiments peak to peak pressure pulsations of the pump will decrease.
Conducting the experiments with a number of larger surge tanks can be a further
study.
73

As far as the surge tanks having almost the same volume with the results of the
design calculations of literature survey, the pulsation percentages are far from what
is stated in the literature. The closest result is achieved with the method of Arnold
and Stewart78[19] resulting a surge tank size of 521cm3. This is about 25% larger
than what the manufacturer request. On the other hand Arnold and Stewart advise a
precharge pressure of 60-70% of average fluid pressure. However in the original
system the precharge pressure is 12% only. Conducting the experiments with a sure
tank design capable of 60-70% precharge pressure can be a further study.
Although there are many computational studies on surge tank design in the
literature there are a few experimental studies on pumps regarding the surge tank
performance and design studies. Besides, there is no considerable study on effect of
surge tank inlet area on pulsations which is considered as a significant parameter.
The cause of this can be; since this pumping and surge tank issues are part of
industrial subjects the companies or the institutes studying on this subject may not
want to share their knowhow which is their financial source.
In order to evaluate the design and performance of the surge tank and experimental
study is planned and conducted. An experimental set up is designed and
constructed to perform the surge tank tests. The pump performance is also analyzed
before surge tank design experiments. A baseline study is performed, the
experimental set up verified before the surge tank tests. The convenient
instrumentation is assembled to the set-up and the data acquisition devices are
used. In this period couple of issues are encountered and solved with the help of
different resources. The details are given in Chapter 3. With the help of set up
construction and the solve the problems encountered, both the mechanical
engineering department gained a diaphragm pump and surge tank experimental set-
up for further studies and the master of science student preparing this report had a
considerable mechanical and electrical and electronically experience.
74

As indicated in chapter 3 and 4 before the surge tank pressure transducer was out of
order there was data gathered from surge tank and discharge of the pump. These
data is used to evaluate the dependence of the surge tank and the exit pressure
pulsations. The exit pressure and the surge tank pressure is interrogated with linear
correlation analysis and Pearson analysis functions. The results shoed that the
correlation coefficient was always ±1 showing the variables have a perfect linear
dependence as expected. Because the surge tank and the ext pressure transducers
are connected to the discharge side but only to different locations.
In order to analyze the set-up uncertainty an uncertainty analysis is performed and
presented in Chapter 4. 95% confidence level is considered and the error is
maximum 0.027% which is anyway very little and can be neglected.
Finally, the aim of this thesis study is achieved that a proper surge tank inlet area
can be concluded. There are eight different configurations with the adaptors having
different areas are used in the experiments. These adaptors are connected to the
surge tank inlet to crate different resistances before the flow. With the different
adaptors connected to the surge tank inlet the experimentations are conducted and
the data are recorded. According to the results among the eight area configurations
the minimum peak to peak pulsations are achieved with the adaptor having the area
ratio of 0.14. The corresponding peak to peak pulsation is 31%. The original inlet
area gave a pulsation value of 37%. It can be concluded that the manufacturer is
better to change the design of the inlet area of the surge tank to achieve smaller
pulsations.
As indicated in Table 10 with the adaptor having no special configuration, no
resistance against the flow and machined thoroughly had the same peak to peak
pulsation value with the manufacturer’s original design. This configuration needs
no mechanical effort of creating an area with precise drilling operations. One may
conclude that instead of creating an inlet area with machining; it is acceptable to
sacrifice the 6% peak to peak pressure pulsation difference and use the adaptor
75

machined thoroughly having the area ratio of 1.This can be logical if the pulsation
effects are considered independently
However the surge tank diaphragm’s bottom end is very close to the surge tank
inlet. Therefore the adaptor having the area ratio of 1 having the sharp edges may
deform and even tear the diaphragm. On the other hand any adaptor having the area
ratio smaller than 1 has a supporting face for the diaphragm avoiding deforming or
tearing. Therefore the proper solution for this pump and surge tank configuration is
the adaptor having area ratio of 0.14 both mechanically and regarding the pressure
pulsation reduction purpose.
76

REFERENCES
[1] Almasi, A., 2009. “Pulsation control in process reciprocating compressors” Rotating Equipment Department, Madrid, Spain. DOI:10.1243/09544089JPME310
[2] Pope, Edward J, 1996. “Rules of Thumb for Mechanical Engineers -Reciprocating Compression Surge Drums”, Pages 92-124, DOI:10.1016/B978-088415790-8/50005-9
[3] Mead, Daniel W.1933. “Air and Vacuum Chambers and Shock Absorbers, Hydraulic Machinery” McGraw Hill Book Company Inc., New York and London.
[4] Wahren, Uno, 2005. “Chapter 4 - Pump Types, Forsthoffer's Rotating Equipment Handbooks”, Pages 251-264
[5] Integrated Publishing , Page Title: Positive Displacement Pump Characteristic Curves, Date accessed: 03.08.2009, url:http://www.tpub.com/content/doe/h1018v1/css/h1018v1_121.htm
[6] Engineers Edge, Page Title: Positive Displacement Pump Characteristic Curve, 2000-2010. Date accessed: 03.08.2009. url:http://www.engineersedge.com/pumps/positive_disp_pump_char.htm
[7] Parker , David B., “Positive Displacement Pumps -Performance And Application” Warren Pumps Incorporated Division of IMO Industries, Warren, Massachusetts
[8] Hickerson, Anna Iwaniec, 2005. “An Experimental Analysis of the Characteristic Behaviors of an Impedance Pump”, California Institute of Technology,
[9] Rayner, R., 2005. “Reciprocating pumps: Nomenclature, characteristics, components and types”, World Pumps, Volume 2005, Issue 460 , Pages 26-29
[10] Bhabani, P. Mohanty, McAllister, E.W.,” Pumps and Compressors” Allison Engine Company, Available online 12 September 2007
[11] Integrated Publishing , Page Title: Single-Acting and Double-Acting Pumps, Date accessed: 03.08.2009, http://www.tpub.com/content/doe/h1018v1/css/h1018v1_115.htm
[12] Wilden Pump & Engineering Company, Date accessed: 03.08.2009, url:http://www.wildenpump.com/
77

[13] Eckle, F.J, “Diaphragm Pumps” Vacuubrand GMBH CO. Page:85
[14] Wanner Engineering Inc “Pulsation Dampeners”. Date accessed: 16.03.2010 url:http://www.wannereng.com/
[15] Kavurmacioğlu, Levent, Karadoğan, Haluk, “Su Darbesi Projelendirme Hataları” VI. Ulusal Tesisat Mühendisliği Kongresi ve Sergisi
[16] PulseGuard Inc., “Pulsation Dampeners”, Date Accessed: 15.03.2010 url:http://www.pulsation-dampeners.com/drawings/lp-ptfe-diaphragm.html
[17] Beynart, V. Larry, “Pulsation dampening in suction and discharge systems for PD pumps”Fluid Energy Controls, California
[18] Miller, E. John, 1995. “The Reciprocating Pump-Theory, Design and Use”, Second Edition, Krieger Publishing Company, Malabar, Florida.
[19] Özgür, Cahit, 1964. “Su Makinaları Dersleri” İTÜ Makina Fakültesi İTÜ Teknik Okulu Yayınları İstanbul
[20] Arnold, Ken, Stewart, Maurice, 2008. “Surface Production Operations: Design of Oil-Handling Systems and Facilities-Chapter 12 Reciprocating Pumps”, Elsevier Inc.
[21] Boteler, Jack, Wende, Larry, Jennings, Peter, “Sizing Pulsation Dampeners for Reciprocating Pumps”, Pumps & Systems Magazine 2010, Date accessed: 10.02.2010 url: www.pump-zone.com/articles/594.pdf
[22] Hidracar, “Pulsation Dampers Size Calculation”, 2010, Date accessed: 11.02.2010. url:www.pulsation-dampers-hidracar.com/.../pulsation+dampers/.../pulsation+dampers+size+calculation.asp
[23] Alpay, Saip, 1958. “Pistonlu Pompalar Konstrüksyon Şekilleri Hesapları ve İşletmeleri”, Marifet Matbaası.
[24] Bechtold, Ira C., 1947. “Pulsation Phenomena In Gas Compression Systems”, url: http://calteches.library.caltech.edu/630/2/Pulsation.pdf
[25] Almasi, A, 2009. “Pulsation Suppression Device Design for Reciprocating Compressor”, World Academy of Science, Engineering and Technology.
[26] How They Work, Calibration Dynamics Ltd. Date accessed: 01.12.2009.
url:http://www.sensorland.com/HowPage079.html
78

[27] LabJack Measurement & Automation Simplified, Page Name: Products- U12, Date and owner: 2001–2010 LabJack Corporation. Date accessed: 18.02.2010, url:http://labjack.com/u12/datarates
[28] Racine Flow Meter Group Date and Owner: 2009 Racine Federated Inc, Date accessed: 25.11.2009 , url: www.racinefed.com
[29] Elkor Technologies Inc., Application Note AN0305 Introduction to Current Transformers 2006. url: http://www.elkor.net/
[30] Klingenberg, Larry, “Frequency Domain Using Excel”, San Francisco State University School of Engineering, April 2005
[31] Carlisle Power Transmission Products, Inc. “Energy Loss And Efficiency of Power Transmission Belts” Advanced Engineering Research Belt Technical Center, Springfield, Missouri
[32] Siemens Micro Master-and Midi Master Operating Instructions
[33] Abana Motorsan Electric Motors, Abana Motorsan San. Tic. A.S., 2010 url:http://www.motorsan.com.tr/motors.asp?id=1&prodid=2
[34] Motor Challenge Factsheet, Determining Electric Motor Load and Efficiency” DOE/GO-10097-517, Program of the U.S. Department of Energy
[35] Erbaş, Semra Oral, 2008. “Olasılık ve İstatistik” Gazi Kitabevi, Ankara.
[36] Gamak AŞ , Products Specifications Catalogue ,2009 url:http://www.gamak.com/index.php?option=com_content&task=view&id=16&Itemid=9
79

APPENDIX A
SURGE TANK SIZING CALCULATIONS
In this appendix section the surge tank sizing calculation approach of Özgür which
is only held for duplex pumps [19] is extended for triplex simplex and quadruplex
pumps. The calculation is explained in this section in detail.
FOR SIMPLEX PUMP
For a simplex (single piston) pump, the mean flow rate is
Ar318.0Ar
qmean ⋅⋅ω⋅=π
⋅⋅ω⋅= (A.1)
In
Figure 36 the flow rate graph of a simplex pump is given.
Figure 36 Flow Rate Diagram of Simplex Pump
α O π3π
qmean q
qpump=r.Ω.sinα
π 2
80

As indicated in Figure 36 for single piston or diaphragm pumps the half period is
for discharge and for rest half the piston/ diaphragm is inactive.
Therefore the amount of flow entering the surge tank at any instant is:
meanpumpsurge qqq −= (A.2)
For the beginning, the air volume in the surge tank is Ho. From point “O” to 1α at
time t1 , therefore the flow is leaving the surge tank. If the amount of
water leaving the surge tank is
meanp qq ≤
1ΔΗ
∫ ∫ ⋅−=⋅−=ΔΗ1 1t
0
t
0pumpmeansurge1 dtqqdtq
(A.27)
α⋅⎟⎟
⎠
⎞
⎜⎜
⎝
⎛α−
π⋅=ω⋅⎟
⎟
⎠
⎞
⎜⎜
⎝
⎛α−
π⋅=⋅⎟
⎟
⎠
⎞
⎜⎜
⎝
⎛α⋅⋅ω−
π
⋅⋅ω=ΔΗ ∫∫∫
αdsin
1Artdsin
1ArdtsinAr
Ar 111
0
t
0
t
01 (A.3)
⎟⎟
⎠
⎞
⎜⎜
⎝
⎛−α+
π
α⋅=ΔΗ 1cosAr 1
11 (A.4)
If the mean volumetric flow rate and the pump flow rate are equal to each other at
the points 1α and 2α
Ar1
sinAr ⋅⋅ωπ
=α⋅⋅ω⋅ (A.5)
324.01 =α and in radians. 818.22 =α
( ) Ar0509.01948.0103.0Ar1 (A.6) +⋅⋅=ΔΗ − = ⋅ ⋅
81

From point 1α to 2α (from time t1 to t2) the amount of water entering the surge tank
is 1ΔΗ
2
1
2
1
1cosArd
1sinAr2
α
α
α
α ⎥⎥⎦
⎤
⎢⎢⎣
⎡
π+α⋅−=α⋅⎟
⎟
⎠
⎞
⎜⎜
⎝
⎛
π−α⋅=ΔΗ ∫ (A.7)
⎥⎥
⎦
⎤
⎢⎢
⎣
⎡
⎟⎟
⎠
⎞
⎜⎜
⎝
⎛
π
α+α−⎟
⎟
⎠
⎞
⎜⎜
⎝
⎛
π
α+α⋅−=ΔΗ
11
222 coscosAr (A.8)
( ) [ ]794.0896.1Ar1
coscosAr 12122 +−⋅−=⎥⎥⎦
⎤
⎢⎢⎣
⎡α−α
π+α−α⋅−=ΔΗ (A.9)
Ar ⋅⋅=ΔΗ 102.12 (A.10)
where,
2lr)max(s +=π=α (A.11)
2lr)0min(s +−==α (A.12)
r2ss =Δ= (A.13)
Therefore, (A.14) As ⋅⋅=ΔΗ 551.02
100
1
2
pp
pp
12
12=
+
− (A.15)
82
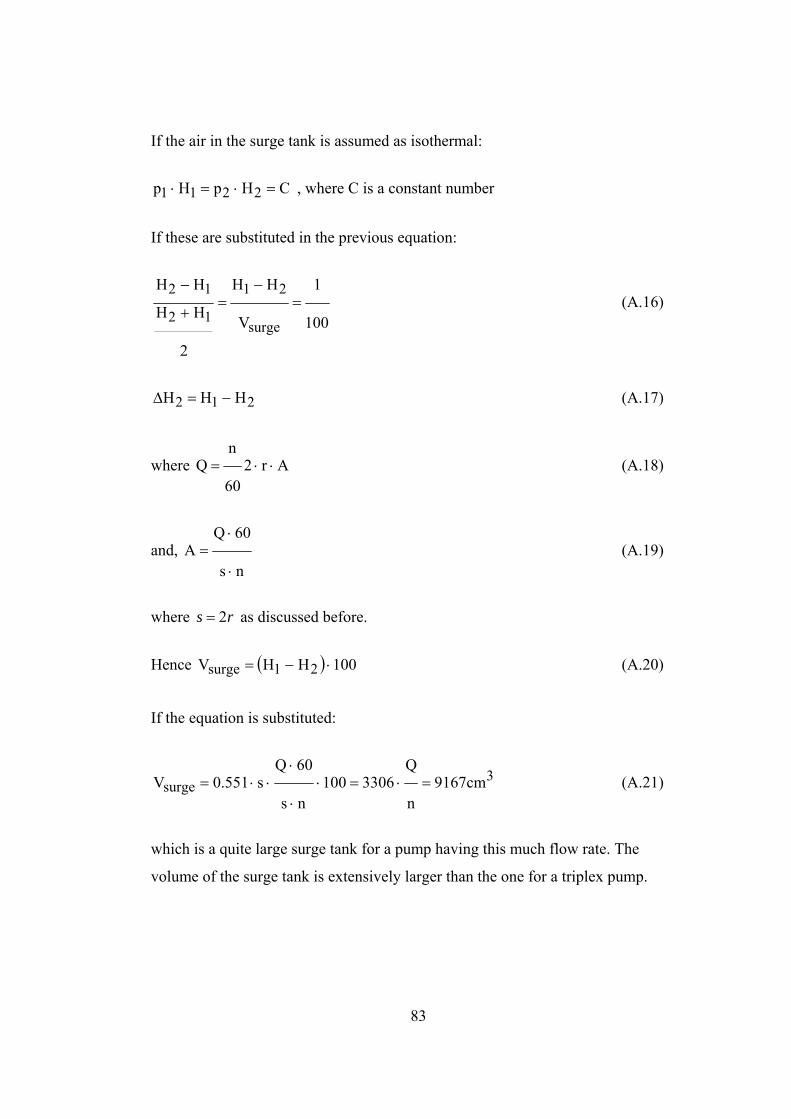
If the air in the surge tank is assumed as isothermal:
CHpHp 2211 =⋅=⋅ , where C is a constant number
If these are substituted in the previous equation:
100
1
V
HH
2
HH
HH
surge
21
12
12=
−=
+
− (A.16)
212 HHH −=Δ (A.17)
where Ar260
nQ ⋅⋅= (A.18)
and, ns
60QA
⋅
⋅= (A.19)
where as discussed before. rs 2=
Hence ( ) 100HHV 21surge ⋅−= (A.20)
If the equation is substituted:
3surge cm9167
n
Q3306100
ns
60Qs551.0V =⋅=⋅
⋅
⋅⋅⋅= (A.21)
which is a quite large surge tank for a pump having this much flow rate. The
volume of the surge tank is extensively larger than the one for a triplex pump.
83

FOR DUPLEX PUMP
For a duplex pump, the mean flow rate is
Ar637.0Ar2
qmean ⋅⋅ω⋅=π
⋅⋅ω⋅⋅= (A.22)
In
Figure 37 the flow rate graph of a duplex (two piston) pump is given.
Figure 37 Flow Rate Diagram of Duplex Pump
As indicated in
Figure 37 the irregularity decreases and the flow rate fluctuation period decreases
to π.
Similarly for duplex pumps
meanpumpsurge qqq −= (A.23)
∫ ∫ ⋅−=⋅−=ΔΗ1 1t
0
t
0pumpmeansurge1 dtqqdtq (A.24)
α⋅⎟⎟
⎠
⎞
⎜⎜
⎝
⎛α−
π⋅=ω⋅⎟
⎟
⎠
⎞
⎜⎜
⎝
⎛α−
π⋅=⋅⎟
⎟
⎠
⎞
⎜⎜
⎝
⎛α⋅⋅ω−
π
⋅⋅ω⋅=ΔΗ ∫∫∫
αdsin
2Artdsin
2ArdtsinAr
Ar2 111
0
t
0
t
01
(A.25)
O πα π2
1α 2α3α
αω sin⋅Ω⋅⋅= rpqq qort
84
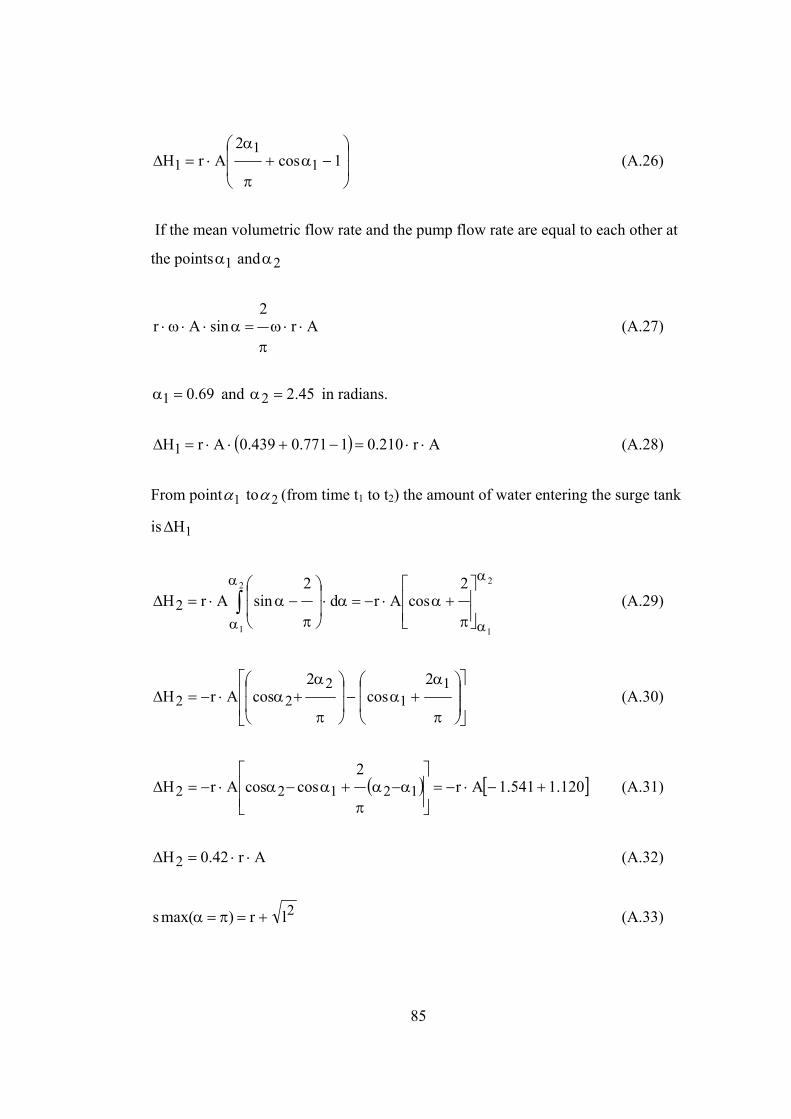
⎟⎟
⎠
⎞
⎜⎜
⎝
⎛−α+
π
α⋅=ΔΗ 1cos
2Ar 1
11 (A.26)
If the mean volumetric flow rate and the pump flow rate are equal to each other at
the points and 1α 2α
Ar2
sinAr ⋅⋅ωπ
=α⋅⋅ω⋅ (A.27)
69.01 =α and in radians. 45.22 =α
( ) Ar210.01771.0439.0Ar1 ⋅⋅=−+⋅⋅=ΔΗ (A.28)
From point 1α to 2α (from time t1 to t2) the amount of water entering the surge tank
is 1ΔΗ
2
1
2
1
2cosArd
2sinAr2
α
α
α
α ⎥⎥⎦
⎤
⎢⎢⎣
⎡
π+α⋅−=α⋅⎟
⎟
⎠
⎞
⎜⎜
⎝
⎛
π−α⋅=ΔΗ ∫ (A.29)
⎥⎥
⎦
⎤
⎢⎢
⎣
⎡
⎟⎟
⎠
⎞
⎜⎜
⎝
⎛
π
α+α−⎟
⎟
⎠
⎞
⎜⎜
⎝
⎛
π
α+α⋅−=ΔΗ
11
222
2cos
2cosAr (A.30)
( ) [ 120.1541.1Ar2
coscosAr 12122 +−⋅−=⎥⎥⎦
⎤
⎢⎢⎣
⎡α−α
π+α−α⋅−=ΔΗ ] (A.31)
Ar42.02 ⋅⋅=ΔΗ (A.32)
2lr)max(s +=π=α (A.33)
85

2lr)0min(s +−==α (A.34)
r2ss =Δ= (A.35)
Therefore, 100
1
2
pp
pp
12
12=
+
− (A.36)
If the air in the surge tank is assumed as isothermal:
CHpHp 2211 =⋅=⋅ , where C is a constant number
If these are substituted in the previous equation:
100
1
V
HH
2
HH
HH
surge
21
12
12=
−=
+
− (A.37)
212 HHH −=Δ (A.38)
where, ns
60QA
⋅
⋅= and (A.39)
r2s = (A.40)
Hence, ( ) 100HHV 21surge ⋅−= (A.41)
3surge cm3500
n
Q1261100
ns
60Qs21.0V =⋅=⋅
⋅
⋅⋅⋅= (A.42)
86
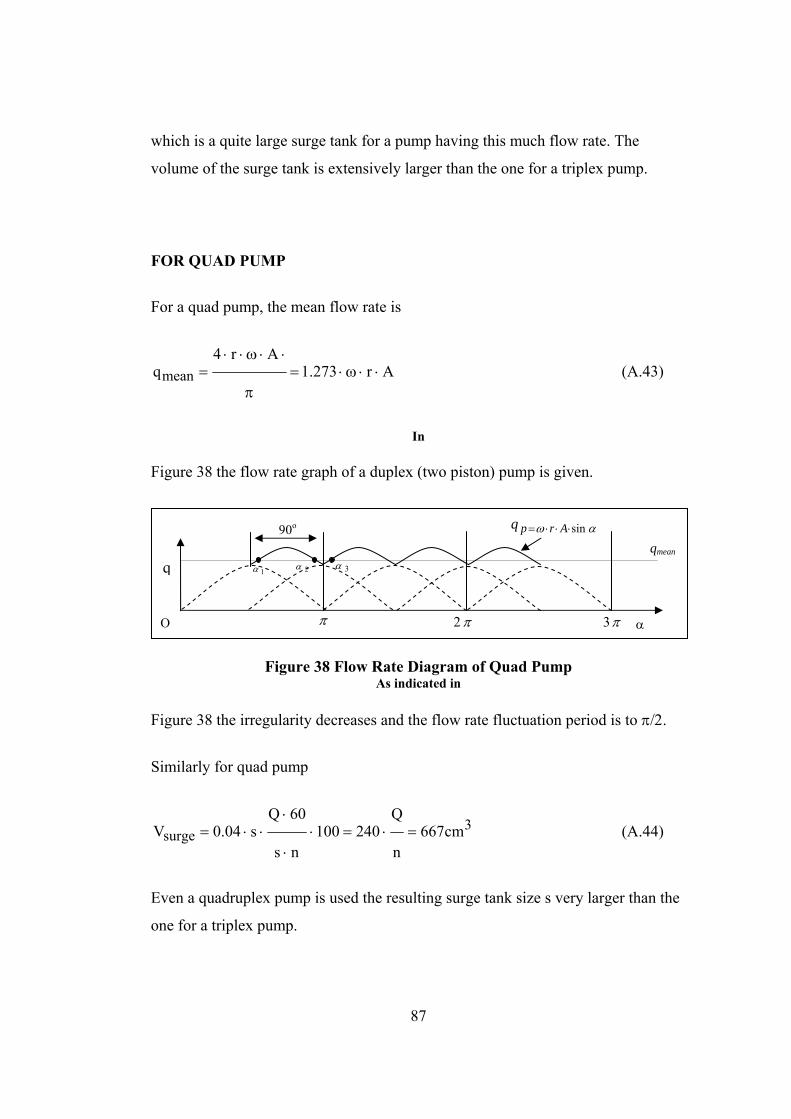
which is a quite large surge tank for a pump having this much flow rate. The
volume of the surge tank is extensively larger than the one for a triplex pump.
FOR QUAD PUMP
For a quad pump, the mean flow rate is
Ar273.1Ar4
qmean ⋅⋅ω⋅=π
⋅⋅ω⋅⋅= (A.43)
In
Figure 38 the flow rate graph of a duplex (two piston) pump is given.
αω sin⋅⋅⋅= Arpq
Figure 38 Flow Rate Diagram of Quad Pump As indicated in
Figure 38 the irregularity decreases and the flow rate fluctuation period is to π/2.
Similarly for quad pump
3surge cm667
n
Q240100
ns
60Qs04.0V =⋅=⋅
⋅
⋅⋅⋅= (A.44)
Even a quadruplex pump is used the resulting surge tank size s very larger than the
one for a triplex pump.
O π α π2
1α 2α 3αq qmean
π3
90o
87

APPENDIX B
TECHNICAL SPECIFICATIONS OF INSTRUMENTS Table 12 Test Pump Specifications
TEST PUMP
Piston Diameter [mm] 63
Eccentricity [mm] 10
Discharge [l/min] 90
Pressure [kg/cm2] 50
Speed [rpm] 540
Power [hp/kW] 12 / 9
Number of Pistons 3
Membrane Dia. [mm] 120
Useful Membrane Dia. [mm] 94
Efficiency [%] 76
Oil Capacity [l] 1,5
Size [cm] 35 x 42 x 35
Mass [kg] 35
88

Table 13 Pressure Transmitter Specifications Brand GEMS Type 2200B G Pressure Interval 0-60 bars Current 4-20 mA Pressure Limit 2 times nominal pressure Feed 24V DC Rated, 12-36V DC operable
Operating Temperature -20°C...+80°C compensated -40°C...+100°C operable
Connection G ¼ to BS2779 compatible with ISO228 Shield IP 65 Response time to pressure 0.5 ms
Table 14 LabJack U12 Properties [27] Command/Response 50 scans/second (up to 4 AI)
Command/Response 25 scans/second (up to 8 AI)
Stream 1200 samples/second (up to 4 AI)
Burst 8192 samples/second (up to 4 AI)
Table 15 Electric Motor Specifications [36] Voltage 380 V
Frequency 50 Hz
Current 38 A
Power 18.5 kW
Power Factor 0.87
Speed 1460 rpm
89

Table 16 Flow Meter Features [28] Digital display of rate and total flow
10 point linearization
4-20 mA loop-powered
0-5 or 0-10 V DC outputs
90

APPENDIX C
TECHNICAL DRAWINGS
Figure 39 Technical Drawing of Pressure Transducer Adaptor
91

Figure 40 Technical Drawing of Test Bench
Figure 41 Technical Drawing of Coupling Pump Shaft
92

Figure 42 Technical Drawing of Adaptor with r=0.09
Figure 43 Technical Drawing of Adaptor with r=0.14
93

Figure 44 Technical Drawing of Adaptor with r=0.15
Figure 45 Technical Drawing of Adaptor with r=0.19
94

Figure 46 Technical Draw g of Adaptor with r=0.25
in
Figure 47 Technical Draw g of Adaptor with r=0.35
in
95

96
Figure 48 Technical Drawing of Adaptor with r=1