Embed Size (px)
Citation preview

Lappeenranta University of Technology
School of Business
International Marketing Management
Janne Andberg THE EFFECT OF STRATEGIC ORIENTATIONS ON SMEs’ INTERNATIONAL MARKETING STRATEGY AND BUSINESS PERFORMANCE
Examiners:
Prof. Olli Kuivalainen Prof. Sami Saarenketo


“Better is to get wisdom than gold”
51°29'50.2"N 0°10'21.0"W

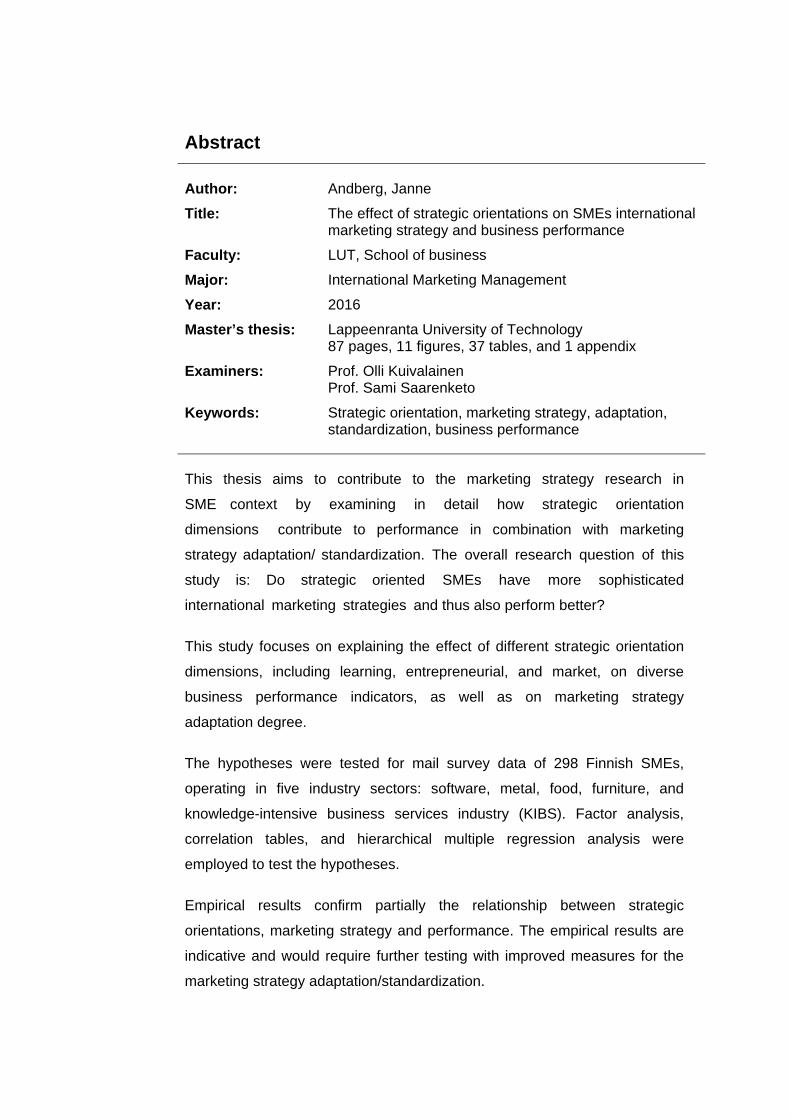
Abstract
Author: Andberg, Janne
Title: The effect of strategic orientations on SMEs international marketing strategy and business performance
Faculty: LUT, School of business
Major: International Marketing Management
Year: 2016
Master’s thesis: Lappeenranta University of Technology 87 pages, 11 figures, 37 tables, and 1 appendix
Examiners: Prof. Olli Kuivalainen Prof. Sami Saarenketo
Keywords: Strategic orientation, marketing strategy, adaptation, standardization, business performance
This thesis aims to contribute to the marketing strategy research in
SME context by examining in detail how strategic orientation
dimensions contribute to performance in combination with marketing
strategy adaptation/ standardization. The overall research question of this
study is: Do strategic oriented SMEs have more sophisticated
international marketing strategies and thus also perform better?
This study focuses on explaining the effect of different strategic orientation
dimensions, including learning, entrepreneurial, and market, on diverse
business performance indicators, as well as on marketing strategy
adaptation degree.
The hypotheses were tested for mail survey data of 298 Finnish SMEs,
operating in five industry sectors: software, metal, food, furniture, and
knowledge-intensive business services industry (KIBS). Factor analysis,
correlation tables, and hierarchical multiple regression analysis were
employed to test the hypotheses.
Empirical results confirm partially the relationship between strategic
orientations, marketing strategy and performance. The empirical results are
indicative and would require further testing with improved measures for the
marketing strategy adaptation/standardization.


Tiivistelmä
Tekijä: Andberg, Janne
Tutkielman nimi: Strategisten orientaatioiden vaikutus PK-yritysten kansainväliseen markkinointistrategiaan ja kaupalliseen menestykseen
Tiedekunta: LUT, Kauppatieteellinen tiedekunta
Pääaine: International Marketing Management
Vuosi: 2016
Pro gradu: Lappeenrannan teknillinen yliopisto 87 sivua, 11 kuvaa, 37 taulukkoa ja 1 liite
Tarkastajat: Prof. Olli Kuivalainen Prof. Sami Saarenketo
Avainsanat: Strateginen orientaatio, markkinointi strategia, sopeuttaminen, standardointi, kaupallinen menestys
Tämän työn tavoitteena on myötävaikuttaa markkinointistrategiatutkimukseen pienten ja keskisuurten yritysten toimintaympäristössä tutkimalla yksityiskohtaisesti miten strategisten orientaatioiden eri dimensiot myötävaikuttavat yrityksen menestymiseen, yhdistettynä markkinointi-strategian sopeuttamiseen/standardoimiseen. Tämän tutkimuksen päätutkimuskysymys on: Onko strategisesti suuntautuneilla pk-yrityksillä entistä kehittyneemmät kansainvälisen markkinoinnin strategiat, ja sitä kautta ne myös menestyvät paremmin?
Työ keskittyy selittämään eri strategisten orientaatioiden, sisältäen oppimisen, yrittäjyyden ja markkinaorientaation, dimensioiden vaikutuksia eri menestyksen mittareihin sekä markkinointistrategian sopeuttamisasteeseen.
Tutkielman empiirinen osuus suoritettiin verkkopohjaisella kyselytutkimuksella, johon osallistui 298 kotimaista pk-yritystä viideltä eri teollisuuden alalta: ohjelmisto-, metalli-, huonekalu-, ruoka-, ja osaamis-intensiivinen liike-elämän palveluteollisuus (KIBS). Faktorianalyysiä, korrelaatio-taulukoita ja hierarkkista monimuuttujaregressioanalyysiä käytettiin hypoteesien testaamisessa.
Empiiriset tulokset vahvistavat osittain strategisten orientaatioiden, markkinointi-strategian ja kaupallisen menestymisen suhteen. Empiiriset tulokset ovat viitteellisiä ja vaatisivat uudelleen testaamista parannetuilla markkinointistrategian sopeuttamisen/standardoinnin mittareilla.


Acknowledgements
Seventeen years ago I started my professional career and decided to
postpone the starting point of my business studies. Now, after three years
of struggle in finding time and motivation for the thesis, I am writing the
very final words to this journey. Obviously several external forces were
required to make it possible.
First and foremost, I would like to thank Professor Sanna-Katriina
Asikainen. With this final document I am proud to show that your efforts
have not been wasted, totally. Thank you for your support along the road.
Secondly I would like to thank Professor Olli Kuivalainen not only for
supervising this thesis but for the positive spirit you have been
continuously able to create. I am especially grateful to your enthusiasm
when teaching.
I would like to thank the individual companies and people behind the
information analyzed in this thesis. Further on I would like to thank LUT
for collecting and sharing the data, and Professor Sami Saarenketo for
examining the thesis.
My very special thanks are extended to the two musketeers, Päivi and
Toni. Without you I would not be here.
I want to express my deepest gratitude to Helena as well.
Finally, I would like to add personal thanks to my family for the support
and understanding, and apologize for the time I have lost being with you. I
hope my children will someday understand that life is a never ending
learning experience.
This particular thesis received no specific grant from any funding agency
in the public, commercial, or not-for-profit sectors.
Pointless to say, all errors and oversights are entirely my own.

List of abbreviations and definitions
Beta coefficient Standardized regression coefficient that allows for a direct comparison between coefficients as to their relative explanatory power of the dependent variable.
Collinearity Expression of the relationship between independent variables. Complete collinearity means correlation coefficient 1.
Content validity Assessment of the degree of correspondence between the items selected to constitute a summated scale and its conceptual definition.
Cronbach's alpha Measure of reliability that ranges from 0 to 1, with values of 0,60 to 0,70 deemed the lower limit of acceptability.
Eigenvalue Column sum of squared loadings for a factor; also referred to as the latent root. It represents the amount of variance accounted for by a factor.
EO Entrepreneurial orientation
Homoscedasticity/
Heteroscedasticity
Description of data for which the variance of the error terms (e) appears constant over the range of values of an independent variable. When the error terms have increasing or modulating variance, the data are said to be heteroscedastic.
LO Learning orientation
MO Market orientation
Mediator variable Mediator is an explaining variable between an independent (or predictor) variable and a dependent (or criterion) variable, explaining how or why certain effects occur.
Moderator variable Moderator is a variable that affects the direction and/or strength of the relation between an independent (or predictor) variable and a dependent (or criterion) variable. Moderators explain when certain effects occur.
Multicollinearity Extent to which a variable can be explained by the other variables in the analysis.
BP Business performance (objective and subjective)
Summated scales Method of combining several variables that measure the same concept into a single variable in an attempt to increase the reliability of the measurement.


Table of Contents
1 Introduction ....................................................................................... 5
1.1 Background ..............................................................................................5
1.2 Research gap and questions ...................................................................6
1.3 Objectives and delimitations ....................................................................9
1.4 Research methodology ..........................................................................10
1.5 Outline of the study ................................................................................11
2 Theoretical foundation and hypotheses........................................ 12
2.1 Strategic orientations .............................................................................12
2.1.1 Entrepreneurial orientation ......................................................................... 13
2.1.2 Learning orientation ................................................................................... 14
2.1.3 Market orientation ...................................................................................... 15
2.2 Marketing strategy standardization/adaptation ......................................16
2.2.1 Adaptation vs standardization .................................................................... 17
2.2.2 International marketing mix ........................................................................ 18
2.3 Business performance ...........................................................................21
2.3.1 Performance dilemma of SME’s................................................................. 22
2.3.2 SME performance assessment .................................................................. 23
2.4 Theoretical framework and hypothesis ..................................................24
2.4.1 Strategic orientations and performance ..................................................... 25
2.4.2 Marketing strategy and performance ......................................................... 28
2.4.3 Strategic orientations and marketing strategy ............................................ 32
2.4.4 Moderating and mediating effects of marketing strategy ........................... 33
2.4.5 Framework ................................................................................................. 33
3 Research methodology ................................................................... 35
3.1 Research design ....................................................................................35
3.2 Data collection .......................................................................................35
3.3 Measurement scales ..............................................................................38
3.4 Analytical methods and tools .................................................................40
3.5 Reliability and validity .............................................................................45
4 Results and findings ....................................................................... 49
4.1 Descriptives ...........................................................................................49
4.2 Scale descriptive analysis ......................................................................57
4.3 Construct operationalization ..................................................................59
4.4 Antecedents to business performance ...................................................62
4.4.1 Hierarchical multiple regression for business performance ....................... 62
4.4.2 Correlation tables for business performance ............................................. 70
4.4.3 Strategic orientations - marketing strategy linear regression ..................... 73
4.4.4 Moderator regression analysis ................................................................... 76
4.4.5 Mediation regression Analysis ................................................................... 78
4.5 Summary of the results ......................................................................... 79
5 Discussion ....................................................................................... 80
5.1 Discussion of the results ....................................................................... 80
5.2 Answering research questions .............................................................. 83
5.3 Implications ........................................................................................... 84
5.4 Reliability and validity ............................................................................ 85
5.5 Limitations and suggestions for future research ................................... 86
6 Conclusions ..................................................................................... 87
Bibliography .......................................................................................... 88
Appendixes ............................................................................................ 97
Questionnaire .................................................................................................. 97
List of Figures
Figure 1. A vertical overview of the layered business concept. ........................................................ 6
Figure 2. General framework for the study (the dotted line refers to business context potentially affecting the relationships). ............................................................................................................... 8
Figure 3. Degree of standardization for marketing strategy elements (left), and related contextual factors and influence on standardization (right), (Birnik & Bowman, 2007, 311). ............................ 30
Figure 4. General framework showing hypotheses (the dotted line refers to business context potentially affecting the relationships). ............................................................................................ 34
Figure 5. General research structure .............................................................................................. 35
Figure 6. Moderating effect of Mo on the relationship between X and Y (left) and Mediating effect on Me on the relationship between X and Y (right). ........................................................................ 44
Figure 7. Mean values for strategic orientation dimensions for different industries in domestic context ............................................................................................................................................ 52
Figure 8. Mean values for strategic orientation dimensions for different industries in international context ............................................................................................................................................ 52
Figure 9. Mean values for marketing strategy items for different industries in domestic (left) and international (right) context. ............................................................................................................ 54
Figure 10. Mean values for business performance items for different industries in domestic context. ....................................................................................................................................................... 56
Figure 11. Mean values for business performance items for different industries in international context. ........................................................................................................................................... 56

List of tables
Table 1. Main meta-analysis used for the hypotheses .................................................................... 24
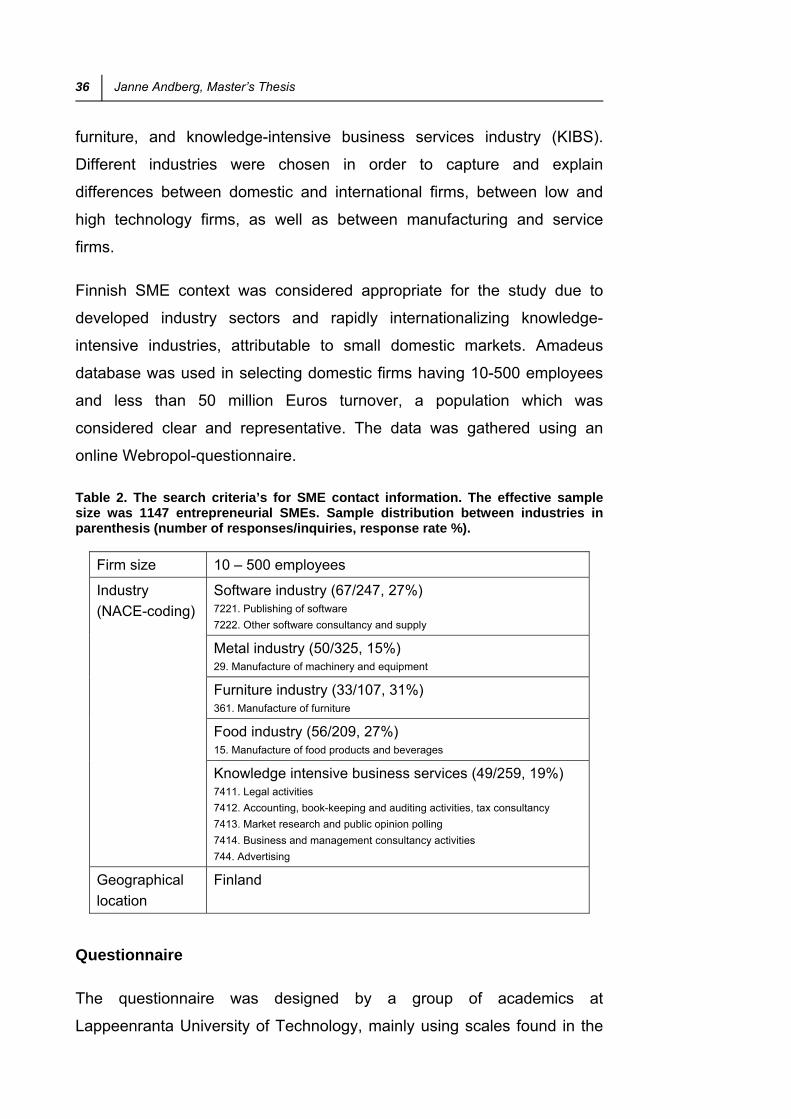
Table 2. The search criteria’s for SME contact information. The effective sample size was 1147 entrepreneurial SMEs. Sample distribution between industries in parenthesis (number of responses/inquiries, response rate %). .......................................................................................... 36
Table 3. Elements of reliability, validity, and generalizability (based on Salvendy & Carayon 1997 and Babbie 1990). .......................................................................................................................... 46
Table 4. General comparison between the companies ................................................................... 50
Table 5. Descriptive statistics for strategic orientations .................................................................. 51
Table 6. Descriptives for marketing strategy items ......................................................................... 53
Table 7. Correlation table for marketing strategy adaptation/standardization ................................. 54
Table 8. Descriptives for business performance items ................................................................... 55
Table 9. Correlation table for strategic orientation dimensions ....................................................... 58
Table 10. Results for the extraction of component factors .............................................................. 59
Table 11. Final factor solutions for strategic orientations ................................................................ 60
Table 12. Model summary, operational revenue per employee (logarithmic) ................................. 63
Table 13. Model coefficients, operational revenue per employee (logarithmic) .............................. 63
Table 14. Model summary, profit/loss per employee ...................................................................... 64
Table 15. Model coefficients, profit/loss per employee ................................................................... 65
Table 16. Model summary, return on assets................................................................................... 65
Table 17. Model coefficients, return on assets ............................................................................... 66
Table 18. Model summary, profit margin ........................................................................................ 67
Table 19. Model coefficients, profit margin ..................................................................................... 67
Table 20. Model summary, growth ................................................................................................. 68
Table 21. Model coefficients, growth .............................................................................................. 68
Table 22. Model summary, subjective profitability .......................................................................... 69
Table 23. Model coefficients, subjective profitability ....................................................................... 69
Table 24. Correlation table for domestic business performance ..................................................... 70
Table 25. Correlation table for international business performance ................................................ 71
Table 26. Correlation table for business performance industry wise .............................................. 72
Table 27. Linear regression analysis, product adaptation (domestic) ............................................. 73
Table 28. Regression analysis, Product adaptation (international) ................................................. 74
Table 29. Regression analysis, Promotion adaptation (domestic) .................................................. 74
Table 30. Regression analysis, Promotion adaptation (international) ............................................. 75
Table 31. Regression analysis, Distribution adaptation (international) ........................................... 75
Table 32. Moderator regression analysis, Operating revenue per employee (log) ......................... 76
Table 33. Moderator regression analysis, Profit/loss per employeee ............................................. 76
Table 34. Moderator regression analysis, Return on assets ........................................................... 77
Table 35. Moderator regression analysis, Profit margin ................................................................. 77
Table 36. Moderator regression analysis, Average growth ............................................................. 77
Table 37. Summary of the results ................................................................................................... 79


1. Introduction 5
1 Introduction
1.1 Background
The increasing globalization of markets and businesses is playing a major
role on small and medium size enterprise’s (SME’s) business situation
and internationalization process. SMEs are confronted by the fact that
globalization opens opportunities in potential international markets but
same time increases home market competition.
In the research field, strategic orientations have received increasing
attention as a potential determinant of a firm’s performance. Although the
relationship between international marketing strategy and performance is
less known, the same mechanisms shall apply. The thesis aims to clarify
whether there are situations in which adaptation or standardization is
more profitable. However, in both research areas the lack of consistency
in findings might be attributed, at least partly, to a lack of precision in
defining performance, especially in the case of SMEs.
The thesis aims at contributing to the international marketing research by
investigating the relationship between different strategic orientations and
marketing mix standardization/adaptation, and their influence on firm’s
business performance. The study specifically focuses on understanding
the drivers for exceptional business performance, and how it would help
SMEs in small countries, like Finland, to be more competitive globally.
Therefore the topic is not only theoretically interesting but could offer
practical approaches for SMEs of small import/export nations.
A vertical view of a layered business concept is presented in Figure 1. At
the bottom there are general underlying factors, i.e. culture, industry,
internationalization, and other general strategies, influencing business
performance. Above the general level there are firm specific strategic
orientations of which entrepreneurial orientation, learning orientation and
market orientation are studied. The next level summarizes company

6 Janne Andberg, Master’s Thesis
specific international marketing strategy from the view point of adaptation
or standardization. In this study four basic components, product, price
promotion and place, are studied. Finally on the top there is financial
perspective explaining business performance of a firm. In this layered
structure, it appears that there shall be causal effects explaining the
business performance.
Figure 1. A vertical overview of the layered business concept.
1.2 Research gap and questions
The purpose of this thesis is to examine business performance of Finnish
SMEs from the viewpoint of their strategic orientations and international
marketing strategy. In present literature there is a very limited
understanding of the mechanism through which strategic orientations
influence international marketing strategy and its influence further on
performance.
Industry characteristics
Internationalization scope and scale
Culture of international market(s)
EntrepreneurialorientationRisk taking,
Innovativeness,Proactiveness
Learningorientation
Commitment to learning,Shared vision,
Open mindedness
MarketorientationCustomer,Competitor,
Inter functional cooperation
General strategies
Adaptation / standardization
Price
Promotion Distribution
ProductTargeting
Positioning
Business performance
Revenue Profit Growth % Int’l salesROCE
UnderlyingFactors
StrategicOrientations
InternationalMarketingStrategy
FinancialPerspective
SalesBrand
1. Introduction 7
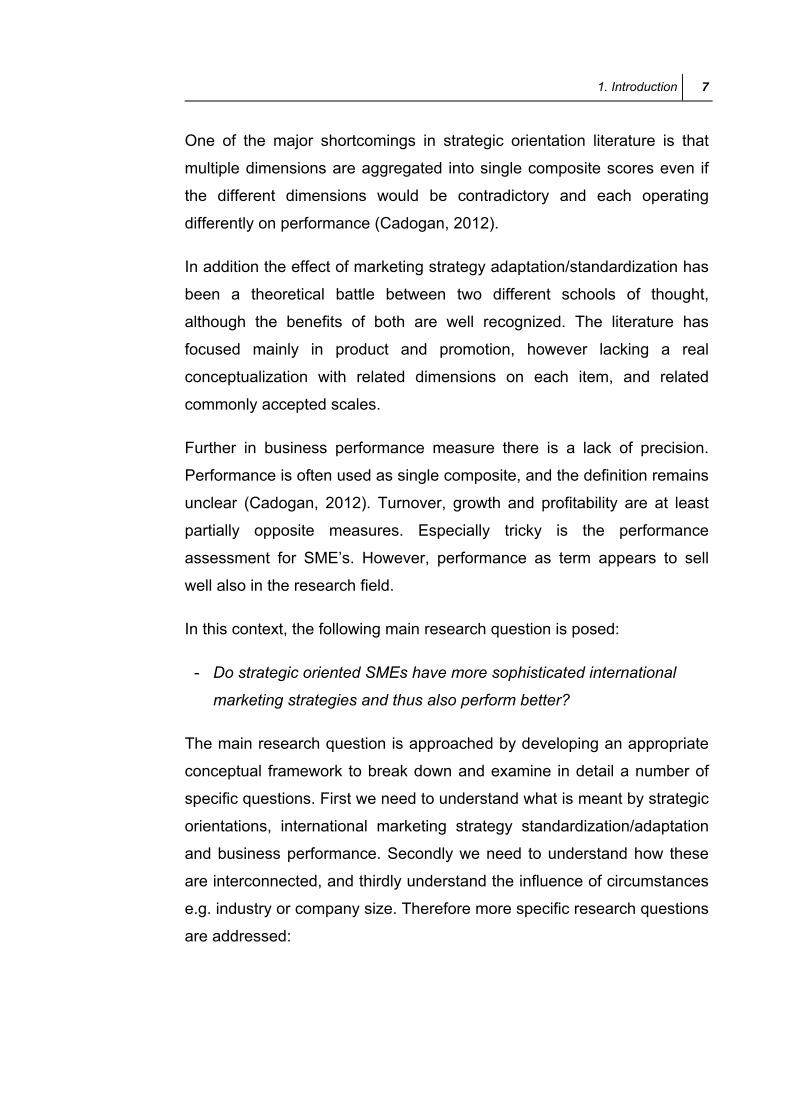
One of the major shortcomings in strategic orientation literature is that
multiple dimensions are aggregated into single composite scores even if
the different dimensions would be contradictory and each operating
differently on performance (Cadogan, 2012).
In addition the effect of marketing strategy adaptation/standardization has
been a theoretical battle between two different schools of thought,
although the benefits of both are well recognized. The literature has
focused mainly in product and promotion, however lacking a real
conceptualization with related dimensions on each item, and related
commonly accepted scales.
Further in business performance measure there is a lack of precision.
Performance is often used as single composite, and the definition remains
unclear (Cadogan, 2012). Turnover, growth and profitability are at least
partially opposite measures. Especially tricky is the performance
assessment for SME’s. However, performance as term appears to sell
well also in the research field.
In this context, the following main research question is posed:
- Do strategic oriented SMEs have more sophisticated international
marketing strategies and thus also perform better?
The main research question is approached by developing an appropriate
conceptual framework to break down and examine in detail a number of
specific questions. First we need to understand what is meant by strategic
orientations, international marketing strategy standardization/adaptation
and business performance. Secondly we need to understand how these
are interconnected, and thirdly understand the influence of circumstances
e.g. industry or company size. Therefore more specific research questions
are addressed:

8 Janne Andberg, Master’s Thesis
- How is business performance defined for SMEs?
- Does a relationship between strategic orientation(s) and business
performance exist?
- Does international marketing strategy standardization/adaptation
affect SME’s business performance?
- Does international marketing strategy moderate the relationship
between strategic orientation(s) and performance?
- Is the relationship meditated by international marketing strategy?
- Is there any difference in national vs. international context?
The general framework is presented below in figure 2, showing the
different relationships under study. Further on it shows that for each firm
an individual business context exists, potentially affecting the relationships
between and within the constructs under study.
Figure 2. General framework for the study (the dotted line refers to business context potentially affecting the relationships).
STRATEGIC ORIENTATIONS
LearningOrientation
MarketingOrientation
EntrepreneurialOrientation
BUSINESSPERFORMANCEObjective/subjective
INT’L MARKETING STRATEGY
Standardization vs. adaptation of
Product, Price, Place and Promotion
INTERNATIONAL BUSINESS CONTEXT

1. Introduction 9
1.3 Objectives and delimitations
The overall objective of this thesis is to identify some of the mechanisms
through which international marketing strategy influence the expected
relationship between strategic orientations and business performance of
SMEs. More specifically, the study aims at understanding how strategic
orientations relate to different performance measures, both objective and
subjective, and what is the role of international marketing strategy in this
phenomenon.
The conceptual framework and related hypotheses have been developed
based on an extensive literature review and the theoretical constructs
mainly adopted from scales used in previous studies.
Delimitations
The thesis does not focus on summarizing literature available but
introducing the conceptualizations and creating hypotheses based on the
concluding studies available in the literature.
Learning orientation, entrepreneurial orientation and market orientation
were the selected strategic orientations, as market orientation has
confirmed positive effect on performance, and market-oriented firms are
likely to combine market orientation with learning and/or entrepreneurial
orientations (Matsuno et al., 2002), (Grinstein, 2008).
This study focuses on independent firms operating in five different
industry sectors: software, metal, food, furniture, and knowledge-intensive
business services industry (KIBS). The empirical data of the study is
restricted to a single country, Finland. As the data set is part of a larger
research project, it is mainly restricted by the number of questions per
construct.
Although the cultural difference between home and international market
influence the degree of adaptation needed, the degree of
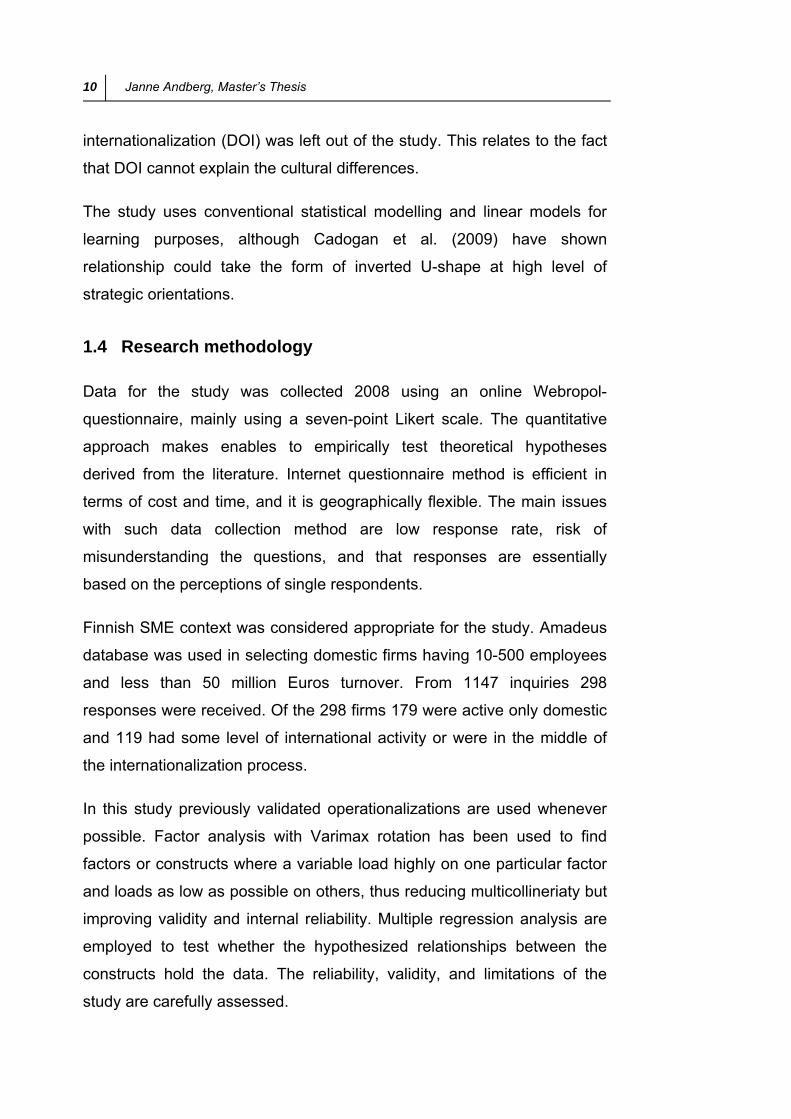
10 Janne Andberg, Master’s Thesis
internationalization (DOI) was left out of the study. This relates to the fact
that DOI cannot explain the cultural differences.
The study uses conventional statistical modelling and linear models for
learning purposes, although Cadogan et al. (2009) have shown
relationship could take the form of inverted U-shape at high level of
strategic orientations.
1.4 Research methodology
Data for the study was collected 2008 using an online Webropol-
questionnaire, mainly using a seven-point Likert scale. The quantitative
approach makes enables to empirically test theoretical hypotheses
derived from the literature. Internet questionnaire method is efficient in
terms of cost and time, and it is geographically flexible. The main issues
with such data collection method are low response rate, risk of
misunderstanding the questions, and that responses are essentially
based on the perceptions of single respondents.
Finnish SME context was considered appropriate for the study. Amadeus
database was used in selecting domestic firms having 10-500 employees
and less than 50 million Euros turnover. From 1147 inquiries 298
responses were received. Of the 298 firms 179 were active only domestic
and 119 had some level of international activity or were in the middle of
the internationalization process.
In this study previously validated operationalizations are used whenever
possible. Factor analysis with Varimax rotation has been used to find
factors or constructs where a variable load highly on one particular factor
and loads as low as possible on others, thus reducing multicollineriaty but
improving validity and internal reliability. Multiple regression analysis are
employed to test whether the hypothesized relationships between the
constructs hold the data. The reliability, validity, and limitations of the
study are carefully assessed.

1. Introduction 11
1.5 Outline of the study
The thesis is divided into six main chapters of which Chapter 1 is the
introduction part for reviewing and analyzing the fundamentals of strategic
orientations, international marketing strategy standardization/adaptation
and the definition of business performance. Chapter 2 defines the central
concepts used and reviews the previous research. The same chapter
further on presents the theoretical framework and related hypotheses to
be investigated.
Chapter 3 presents the research design and methodology of the empirical
study. It also discusses reliability and validity of the study. Chapter 4
presents descriptive statistics, scale developments, hypotheses tests and
their results. Chapter 5 answers the research questions, discusses the
theoretical and practical implications, and identifies limitations and future
areas for research. Finally chapter 6 concludes the findings.
12 Janne Andberg, Master’s Thesis
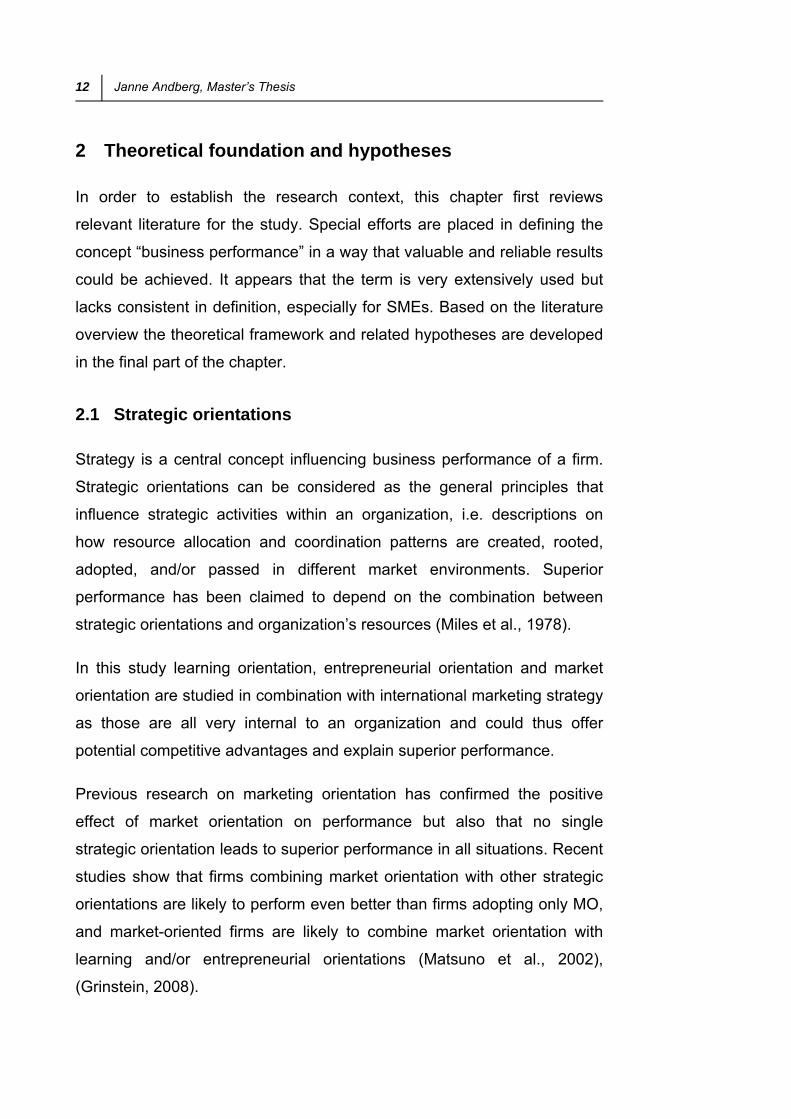
2 Theoretical foundation and hypotheses
In order to establish the research context, this chapter first reviews
relevant literature for the study. Special efforts are placed in defining the
concept “business performance” in a way that valuable and reliable results
could be achieved. It appears that the term is very extensively used but
lacks consistent in definition, especially for SMEs. Based on the literature
overview the theoretical framework and related hypotheses are developed
in the final part of the chapter.
2.1 Strategic orientations
Strategy is a central concept influencing business performance of a firm.
Strategic orientations can be considered as the general principles that
influence strategic activities within an organization, i.e. descriptions on
how resource allocation and coordination patterns are created, rooted,
adopted, and/or passed in different market environments. Superior
performance has been claimed to depend on the combination between
strategic orientations and organization’s resources (Miles et al., 1978).
In this study learning orientation, entrepreneurial orientation and market
orientation are studied in combination with international marketing strategy
as those are all very internal to an organization and could thus offer
potential competitive advantages and explain superior performance.
Previous research on marketing orientation has confirmed the positive
effect of market orientation on performance but also that no single
strategic orientation leads to superior performance in all situations. Recent
studies show that firms combining market orientation with other strategic
orientations are likely to perform even better than firms adopting only MO,
and market-oriented firms are likely to combine market orientation with
learning and/or entrepreneurial orientations (Matsuno et al., 2002),
(Grinstein, 2008).
2. Theoretical foundation and hypotheses 13
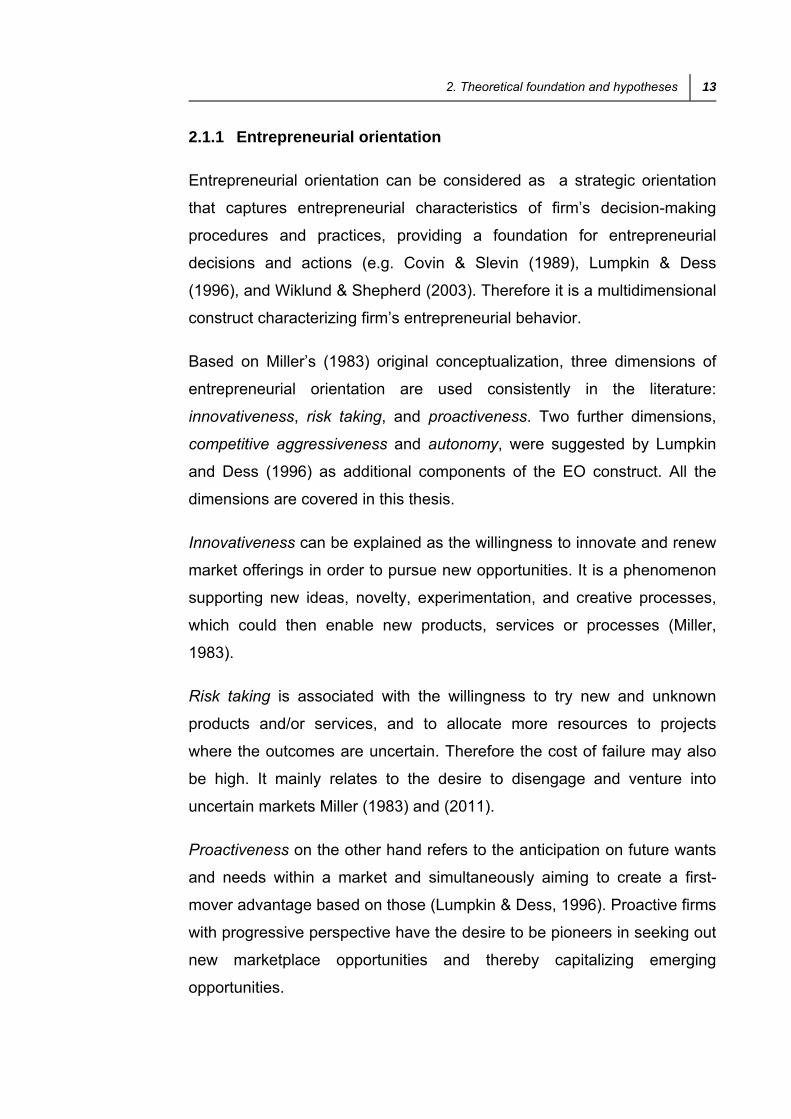
2.1.1 Entrepreneurial orientation
Entrepreneurial orientation can be considered as a strategic orientation
that captures entrepreneurial characteristics of firm’s decision-making
procedures and practices, providing a foundation for entrepreneurial
decisions and actions (e.g. Covin & Slevin (1989), Lumpkin & Dess
(1996), and Wiklund & Shepherd (2003). Therefore it is a multidimensional
construct characterizing firm’s entrepreneurial behavior.
Based on Miller’s (1983) original conceptualization, three dimensions of
entrepreneurial orientation are used consistently in the literature:
innovativeness, risk taking, and proactiveness. Two further dimensions,
competitive aggressiveness and autonomy, were suggested by Lumpkin
and Dess (1996) as additional components of the EO construct. All the
dimensions are covered in this thesis.
Innovativeness can be explained as the willingness to innovate and renew
market offerings in order to pursue new opportunities. It is a phenomenon
supporting new ideas, novelty, experimentation, and creative processes,
which could then enable new products, services or processes (Miller,
1983).
Risk taking is associated with the willingness to try new and unknown
products and/or services, and to allocate more resources to projects
where the outcomes are uncertain. Therefore the cost of failure may also
be high. It mainly relates to the desire to disengage and venture into
uncertain markets Miller (1983) and (2011).
Proactiveness on the other hand refers to the anticipation on future wants
and needs within a market and simultaneously aiming to create a first-
mover advantage based on those (Lumpkin & Dess, 1996). Proactive firms
with progressive perspective have the desire to be pioneers in seeking out
new marketplace opportunities and thereby capitalizing emerging
opportunities.
14 Janne Andberg, Master’s Thesis
Competitive aggressiveness means the strength a firm tries to outperform
their industry rivals, characterized by the position and forceful response to
competitor’s actions. Whereas autonomy is refers to an independent
action aiming to bring forward a business concept or vision, and also
completing the action (Lumpkin & Dess, 1996).
2.1.2 Learning orientation
Learning orientation can be understood as an organization-wide activity
which aims at creating and utilizing knowledge in order to improve
competitive position and/or advantage. Companies committed to learning
recognize and exploit opportunities, as well as proactively create new
opportunities. Learning orientation changes organization culture so that
information is acquired, disseminated and shared internally, so that
individual knowledge is turned into organizational knowledge (Belohlav,
1996), (Wang, 2008), (Nonaka & Takeuchi, 1995).
Based on the conceptualization proposed Sinkula et al. (1997), learning
orientation consists of three dimensions: commitment to learning, shared
vision and open-mindedness. The main dimensions influence the
information that the organization gathers, interprets, evaluates, and
shares, as well as finally accepts or rejects. Commitment to learning and
open-mindedness are covered in this study.
Commitment to learning, creates a learning climate in which the
individuals consider learning to be an important investment for the firm’s
long-term existence. When organization values learning, the more likely
individual learning will happen. Commitment to learning is therefore a
long-term strategic orientation.
Shared vision means organization-wide focus on learning which further
enhances the quality of learning. If there is no shared vision, individuals
are less likely to share information and thus have also lower learning
motivation. Shared vision forms an organizational strength or even a core
2. Theoretical foundation and hypotheses 15
competence whereas diverse interests in the organization will cause great
ideas to fail.
Open-mindedness can be considered as the willingness to accept new
ideas and critically evaluate operational routines. In turbulent markets
firms must cope with rapidly changing technology. Often as important as
the new knowledge is the capability of unlearning, that is paramount for
organizational change.
Further on intra-organizational knowledge sharing refers to collective
routines used to spread learning among different organizational units.
According to Moorman & Miner (1998) learning takes place when the
organization has an effective and efficient information sharing system.
Intra-organizational knowledge sharing includes systematic reevaluation,
structuring and storing of information.
2.1.3 Market orientation
Market orientation has been a popular research subject during the last
decade’s (Kirca et al., 2005) and (Cano et al., 2004), although Drucker
(1954) wrote six decades ago that the entire organization shall be viewed
from the customer’s point of view and thus be customer oriented. The two
most well-known conceptualizations of market orientation are divided into
cultural (Narver & Slater, 1990) and behavioral (Kohli & Jaworski, 1990)
dimensions.
Narver and Slater (1990) define market orientation as "the organization
culture that most effectively and efficiently creates the necessary
behaviors for the creation of superior value for buyers and, thus,
continuous superior performance for the business", whereas Kohli and
Jaworski (1990) defines market orientation as "the organization-wide
generation of market intelligence, dissemination of the intelligence across
departments and organization-wide responsiveness to it". The later shares
to some extend the principle of learning orientation.

16 Janne Andberg, Master’s Thesis
The view of Narver and Slater (1990) divides MO into customer
orientation, competitor orientation, and inter-functional coordination which
utilizes the market information.
Customer orientation is the capability to create superior customer value
continuously, either by increasing benefits in relation to cost or reducing
costs in relation to the benefits. It is important to understand customer’s
entire value chain as it is but also how it will evolve over time, under
internal and external dynamics. By understanding also the economic and
political constraints, potential future customer’s perceptions can be
assessed.
Competitor orientation refers to finding current and potential key
competitor’s long-term capabilities and strategies as well as short-term
strengths and weaknesses, in combination with technologies capable of
satisfying both present and anticipated needs.
Interfunctional coordination refers to coordinated utilization of company’s
resources in order to create superior value for target customers. Any
individual or subgroup shall therefore be integrated effectively for synergy
and focus of the entire business. Effective leadership and encouragement
are needed in achieving interfunctional coordination.
The behavioral dimension of market orientation used in this thesis is
adopted from Matsuno et al. (2002, 23, 28 and 29), which is a modification
of the original scale (Kohli & Jaworski, 1990) dividing market orientation
into intelligence generation and intelligence dissemination.
2.2 Marketing strategy standardization/adaptation
Zou & Cavusgil (2002, 42) conceptualize global marketing strategy as “the
degree to which a firm globalizes its marketing behaviors in various
countries through standardization of the marketing-mix variables,
concentration and coordination of marketing activities, and integration of
competitive moves across the markets”.

2. Theoretical foundation and hypotheses 17
The last fifty decades (Elinder, 1965) international marketing research has
focused on understanding whether to use a standardized or an adapted
marketing strategy on foreign markets, and under what circumstances,
and to what degree it is more appropriate.
Levitt's (1983) controversial article enhanced the ongoing international
marketing standardization/adaptation strategy debate. He argued that
technology, communication, transport, and travel have caused the
emergence of global markets for standardized consumer products.
2.2.1 Adaptation vs standardization
International and global marketing decisions are commonly different for
regional market since many countries or regions have a distinctive
business environment. When a company decides to offer products and/or
services abroad, it has the possibility either to use a standardized
marketing strategy (product, price, place, promotion, people, physical
evidence, process management) in foreign countries or to adapt the
marketing mix for the unique environment of the local market.
The literature identifies three schools of thought:
1. standardization school
2. adaptation school, and
3. contingency perspective (Cavusgil & Zou, 1994)
Supporters of standardization believe that globalization trends cause
market similarity, consumer needs, tastes, and preferences, as well as
technological uniformity. Growth of international communication channels,
internet, and the emergence of global market segments further promotes
standardization. (Codita, 2011)
Standardization strategy offers several benefits such as: (1) economies of
scale in all value-adding activities, and essential means in achieving a low-
cost competitive position; (2) consistent corporate/brand image across

18 Janne Andberg, Master’s Thesis
countries; and (3) reduced managerial complexity as a consequence of
better coordination and control. (Codita, 2011).
Standardization strategy has been claimed to oversimplify the international
marketing concept. The main objective of any firm shall be the long-term
profitability through understanding customer preferences and thus
increasing sales across countries, and not only reducing cost through
standardization. (Theodosiou & Leonidou, 2003)
Supporters of the international adaptation approach argue that differences
between countries still make the standardized approach difficult. These
differences include consumer needs, usage, purchasing power,
commercial infrastructure, culture and traditions, laws and regulations, and
technological development. (Terpstra & Sarathy, 2000).
According to contingency perspective, adaptation and standardization
shall be viewed as two extremes of the same scale. The contingency
perspective recognizes both advantages and disadvantages associated
with each of the two extremes (Lages & Montgomery, 2004). Later
international marketing research is mainly based on this perspective.
2.2.2 International marketing mix
Product
Product is considered to be the marketing-mix element which has the
strongest effect on competitive success in international markets (Czinkota
& Ronkainen, 2013, 248). High degree of product standardization allows
economies of scale in production and R&D, as well as higher level internal
production controls and quality standards.
The product itself often consists of several sub products, or modules.
Modularization splits a product into smaller modules that can be
independently created and used in different products. A modular system
uses industry standards for interfaces. Besides lower cost and flexibility in
design and user interphase, modularity offers the possibility for mass

2. Theoretical foundation and hypotheses 19
customization. The concept of modularity has been discussed in detail
elsewhere (Rajahonka, 2013).
In addition to above, Kotler & Armstrong (2010, 279) divide product into
three levels. First there is the core benefit which addresses purchase
reasons. Secondly the actual product consists of features, style and
design, quality level, brand name, labeling, and the packaging. Finally, the
augmented product which consists of additional consumer services and
other benefits, such as warranties, after-sale service, delivery and credit,
installation etc.
A strong brand however enables higher standardization possibility for
product offerings (Czinkota & Ronkainen, 2013, 338). Therefore brand
name standardization could allow higher cost savings within the whole
marketing strategy, including e.g. positioning, product design and features,
packaging and labeling, services, and warranty (Theodosiou & Leonidou,
2003, 145). As noted earlier, national regulations, market conditions and
habits can make implementation of standardized packaging and labeling
difficult.
Pricing
Globalization requires international pricing strategies. Developing an
effective strategy is challenging, even though price is a fundamental
determinant of performance and profitability. A review of the literature
indicates that little attention has been devoted to this (Theodosiou &
Leonidou, 2003), resulting in missed opportunities and lower profits
(Lancioni, 2005).
Researchers generally divide pricing strategies into three groups, based
on the main drivers:
1. Cost-based pricing (more standardized)
2. Competition-based pricing
3. Customer value-based pricing (more adapted)
20 Janne Andberg, Master’s Thesis
These various approaches are summarized by Hinterhuber (2008, 42).
Management is usually concerned with the profit margins while salesforce
tends to focus on sales volumes and thus competition. Hinterhuber (2008,
43) found that competition-based pricing is the dominant pricing strategy,
followed by cost-based pricing. Customer sophistication and intense
competition dictate competition-based pricing (Myers et al., 2002, 170).
Further on pricing objectives can be targeted differently e.g. either profit or
competitive positioning.
Value-based pricing practice has been proclaimed to be the most
profitable pricing strategy (Anderson & Narus, 1998, 54). However, the
main challenges in value-based pricing, value assessment and value
communication, limit its usage as pricing strategy.
An extensive overview on international pricing framework has been
presented by Hollensen (2004, 496). Several external factors i.e. price
escalation, inflation, exchange rate fluctuations, import policies, trade
barriers, governmental regulations, influence international pricing
strategies. (Cavusgil, 1996)
Further on pricing objectives change within the international market as
product lifecycle, internationalization phase and competitive levels change,
e.g. when competitors enter with similar products but new process
technologies which could result in price competition.
Pricing strategy may differ between B2B and B2C markets and depend on
uniqueness of the product. Business-to-business sector rely both on value
identification of different segments and customer-unique demands, and
adaptations to such demands.
Promotion
Promotion includes advertising, sales promotion, public relations, personal
selling and direct marketing tools. Because promotion is commonly culture
driven its adaptation is often necessary. Longer cultural distance
2. Theoretical foundation and hypotheses 21
necessitates adaptation of product names, packaging, and sales
promotions. Communication methods and language require local
adaptation for advertising messages, formats, and promotional
approaches (Cavusgil & Zou, 1994).
Although market conditions indicate the requirement for promotion
adaptation, availability, suitability, and cost of advertising channels define
the economical level of adaptation. Branding, positioning, and promotion
can be used to superficially adapt a product to local conditions, making the
adaptation of the product itself less necessary (Still & Hill, 1984).
Place (distribution)
Although the principle of distribution channels follows rather standardized
approach, several factors may require adaptation of distribution in global
markets, e.g. availability and affordability, size and functionality, legal
restrictions, inventories, purchasing habits, competition, form of
international business, and service requirements (Cavusgil & Zou, 1994)
(Theodosiou & Katsikeas, 2001).
Rapid international expansion typically increases both distribution costs
and delivery times significantly due to increased transportation distance,
local distribution structure and practicalities. Through limiting delivery
terms or co-operating with local distribution specialists, SMEs can better
standardize its own distribution strategy.
2.3 Business performance
Business performance is a key concept in a firm’s strategic management.
It is a unidimensional concept consisting of different sub-dimensions, and
thus often hides the underlying relationships, e.g. the conflicting nature of
long-term growth and short-term profitability. Business performance
depends upon the indicators used to assess performance.
The most common categorization between business performance
measures is the one of objective and subjective performance measures
22 Janne Andberg, Master’s Thesis
(Cano et al., 2004). Financial measures are commonly used as objective
indicators of performance. A broader conceptualization would also include
operational performance indicators (i.e. nonfinancial) in addition to
financial performance indicators (Julian & Ahmed, 2005).
Financial indicators include revenue-based performance measures, e.g.
sales revenue, growth and market share, and cost-based performance
measures, e.g. profit measures. The most commonly used financial
indicators are profit/loss (in absolute terms or relative to net sales) and
profitability (profit relative to investment). Financial measures are mostly
targeted to serve the interests of stock market participants.
It is difficult to conceptualize financial performance, as no single
performance construct is able to explain business performance. For
example growth and profitability measures are presenting two contrasting
phenomena. Further on the business as such varies between and within
industries.
In addition to the financial measurements, non-financial objective
measures first emerged in areas like Total Quality Management. Thе well
known Balanced Scorecard (Kaplan & Norton, 1992) monitors critical
areas of performance (financial, customer, internal business processes,
learning and growth) in а balanced manner.
2.3.1 Performance dilemma of SME’s
Most of the research related to performance has been done in terms of
large firms. This contradicts with the size and significance of the small firm
sector in our economy as most of the firms are owner-managed.
Performance can have а different set of meanings for small firms than for
large firms. As long as the content of organizational performance remains
undefined, it is problematic to claim that certain measures would be more
objective than others.

2. Theoretical foundation and hypotheses 23
Profit based performance measures are potentially unrеliаblе in small
business context, because the profit rates of the income statements сan
be incomparable between various forms of enterprises (sole trader,
partnership, limited partnership, or limited соmрanу) and sometimes also
between succeeding years in single firms because different methods of
owner compensation can be used in succeeding years.
In small companies the owner-manager is financially tightly bonded with
the firm. The main reason for the unreliability of profit based measures lies
in the differing practices in owner-compensation. Normally, the owner-
management receives salaries, which reduce the profit rate in the income
statement. Alternatively, depending оn the form of enterprise, the owners
may choose to receive dividends, or commit plain cash withdrawals. The
taxation gives the owner-managers an option to choose between
alternative methods of compensation.
2.3.2 SME performance assessment
From lack of comparability, it follows that profit-based indicators of
performance may be subject to potential misinterpretation in SME
research. Financial performance measures are often elaborate or difficult
to understand in order to become widely accepted by SMEs. Smaller firm
size means fewer personnel and more informal but fast and efficient
information flow. Therefore, control type measurement systems have less
significance in small firms and also accounting systems are often informal
and underdeveloped.
In this thesis both objective and subjective performance measures are
used. International performance measures found in literature seem to be
mainly subjective (Leonidou et al., 2002). The subjective performance
here is assessed as defined in Appendix 1. In order to overcome the effect
of company size, following effective objective measures are used in this
thesis: profit margin in percentage, sales revenue per employee, profit/loss
per employee, average growth per year and return on capital employed
(ROCE).
24 Janne Andberg, Master’s Thesis
2.4 Theoretical framework and hypothesis
Considering the literature on the subjects, there is already plenty of
existing information available. As in many areas if the existing information
is analyzed properly, the result could be foreseen. Therefore
understanding the discrepancy between the knowledge obtained from
individual studies is essential. Denyer et al. (2008) argue that rather than
conducting new empirical studies, consensus can be created through
combining existing research.
Meta-analysis is a statistical technique used in synthesizing empirical
results, in order to gain information about the relationships between
different constructs. A meta-analysis aims to group conflicting results and
thus establish an empirical generalization. It is like an analysis of the
analyses.
This study employs results from meta-analysis found in the literature on
the subjects. The following discussion and hypotheses are based on the
findings from more than 550 individual studies, found in the following
articles.
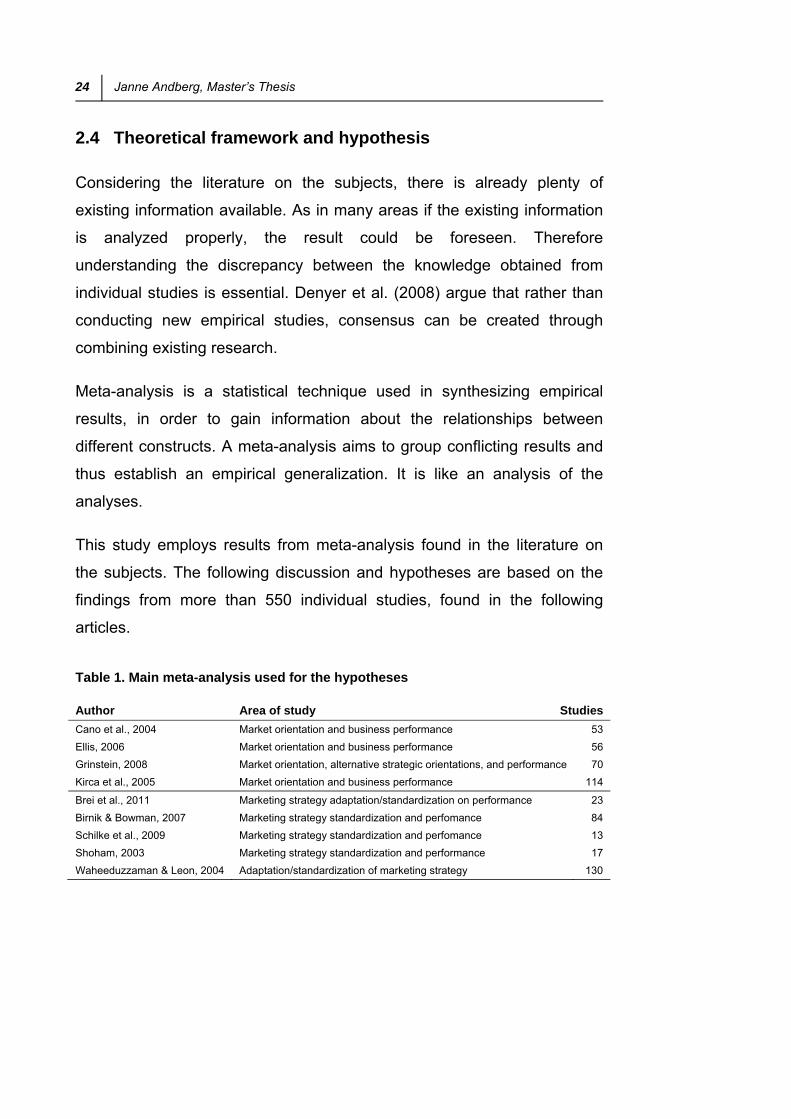
Table 1. Main meta-analysis used for the hypotheses
Author Area of study Studies
Cano et al., 2004 Market orientation and business performance 53
Ellis, 2006 Market orientation and business performance 56
Grinstein, 2008 Market orientation, alternative strategic orientations, and performance 70
Kirca et al., 2005 Market orientation and business performance 114
Brei et al., 2011 Marketing strategy adaptation/standardization on performance 23
Birnik & Bowman, 2007 Marketing strategy standardization and perfomance 84
Schilke et al., 2009 Marketing strategy standardization and perfomance 13
Shoham, 2003 Marketing strategy standardization and performance 17
Waheeduzzaman & Leon, 2004 Adaptation/standardization of marketing strategy 130

2. Theoretical foundation and hypotheses 25
2.4.1 Strategic orientations and performance
Market orientation
Majority of strategic orientation studies have focused on the market
orientation business performance relationship. Market orientation has
been shown to be a significant antecedent of performance and therefore
also to contribute for long-term success of a firm. (Cadogan, 2012, 341)
(Kirca et al., 2005) (Cano et al., 2004, 180), (Ellis, 2006, 3).
Superior ability of the market-oriented firms to understand markets
(sensing emerging opportunities, anticipating competitor’s moves, and
making fact-based decisions) and both attract and keep customers (deliver
superior value and encourage loyalty) explain the positive effects on
performance (Day, 1999). According to Cano et al. (2004) higher
performance can be achieved by satisfying customer’s needs more
efficiently and effectively than competitors.
Based on the findings of most empirical studies, it is hypnotized that:
H1a There is a positive relationship between market orientation and
performance
Regarding different performance dimension, it has been shown, that
market orientation-performance relationship is stronger in terms of
subjective measures, and that market orientation would enhance
especially revenue-based objective performance (i.e., sales and market
share), but cost of its implementation could reduce the cost-based
performance (i.e., profits) (Jaworski & Kohli, 1993) (Harris, 2001) (Cano et
al., 2004) (Kirca et al., 2005).
Based on the findings, following hypothesis are:
H1b Market orientation–performance relationship is stronger for
subjective than objective performance measures.

26 Janne Andberg, Master’s Thesis
H1c Market orientation–performance relationship is stronger for
revenue-based than cost-based objective performance measures.
Although it is generally accepted that the relationship between market
orientation and business performance is both positive and linear, Cadogan
et al., (2009, 71) have shown that high levels of market orientation may
reduce performance, meaning that at high end the relationship would not
be not linear.
Even if the greater dependence on person-to-person interactions within
service sector is expected to result in stronger market orientation–
performance correlation for service than manufacturing firms (Gray &
Hooley, 2002), However, Kirca et al. (2005, 34) have shown the opposite,
i.e. both objective measures have been stronger in manufacturing than in
service firms.
Market orientation studies show that combining with other strategic
orientations the business performance may further be improved (Bhuian et
al., 2005). Grinstein (2008, 115) therefore suggest that various
combinations of strategic orientations in relation to business performance
shall be studied.
Learning orientation
Combining market-oriented firm’s attempt to satisfy customer’s needs and
observe competitors strategic maneuvers with the ability to learn faster
than competitors, would be offer e.g. better product differentiation and thus
a source for sustainable competitive advantage (Baker & Sinkula, 1999)
and (Narver et al., 2004). It has been suggested that learning orientation is
the basis for well-working marketing orientation (Baker & Sinkula, 1999)
(Slater & Narver, 1995).
Organizational members with learning orientation would not only gather
and disseminate information about the market but also examine the quality
and its dominant logic. In more turbulent markets, organizations would

2. Theoretical foundation and hypotheses 27
need to have a greater learning orientation to both monitor and respond to
changing consumer preferences (Farrell, 1999, 3).
As noted earlier, learning orientation both produces market information
and develops knowledge within an organization, which further enables
continuous organizational-wide learning values and skills (Slater & Narver,
1995).
Based on the above discussion it is hypothesized that:
H1d There is a positive relationship between learning orientation and
performance.
H1e There is relationship is weaker than the relationship between
market orientation and performance
H1f Market orientation combined with learning orientation results in
stronger positive relationship than using only market orientation
Entrepreneurial orientation
Entrepreneurial orientation business performance relationship has be
shown to be relatively strong in meta-analysis (Rauch et al., 2004). It is
expected that entrepreneurially acting firms can better adjust their
operations in dynamic competitive environments (Covin & Slevin, 1989),
which results in positive effects on firm performance (Keh et al., 2007)
(Wiklund & Shepherd, 2005).
In order to satisfy customer needs, to pursue market expansions, and to
capitalize the emerging opportunities, market information and knowledge
are central also for the entrepreneurial process (Bhuian et al., 2005).
Market orientation is considered essential for new ventures at their early
stages, when adaptation to the environment and rapid reaction to
opportunities and threats are needed (Luo et al., 2005).
Similar to learning orientation, empirical studies show higher level of
performance for firms combining the synergetic effect of both market and

28 Janne Andberg, Master’s Thesis
entrepreneurial orientation. It has however be shown that high levels of
entrepreneurial orientation could influence this relationship negatively
especially for highly technology-driven firm. (Grinstein, 2008); (Luo et al.,
2005)
It is thus hypnotized that:
H1g There is a positive relationship between entrepreneurial orientation
and performance.
H1h The relationship is weaker than the relationship between market
orientation and performance
H1i Market orientation combined with entrepreneurial orientation results
in stronger positive relationship than using only market orientation
Strategic orientations
According to the above discussion, different strategic orientations would
intercorrelate. Grinstein (2008) found that market orientation is strongly
linked to both learning and entrepreneurial orientations, an in-depth
analysis of the data confirms that the association of market orientation with
learning orientation is stronger. This leads to the following hypotheses:
H2a There is a positive relationship between market orientation and
learning orientation
H2b There is a positive relationship between market orientation and
entrepreneurial orientation
H2c There is a positive relationship between learning orientation and
entrepreneurial orientation
2.4.2 Marketing strategy and performance
The main purpose of international marketing strategy is to determine
which marketing mix elements to adapt or standardize, and to what
degree. As the world has been changing a lot, theories which have been

2. Theoretical foundation and hypotheses 29
valid several decades ago may not be valid for today’s international
markets and related businesses. Waheeduzzaman & Leon (2004)
summarized historical trends in adaptation-standardization research in
international marketing. For further reading a very broad view on the
contingency factors of marketing-mix standardization has been discussed
by Codita (2011).
Using meta-analysis technique Birnik & Bowman (2007) systematically
reviewed marketing mix standardization related literature, in order to find
and combine contextual variables related to marketing mix standardization
practices in multinational corporations, and to understand the performance
impact of marketing mix standardization.
They found that type of product (industrial, consumer, high-tech, culture-
bound), product/market similarity, level of local competitive intensity and
ownership control over subsidiaries are the most influential to higher
standardization.
Based on these findings product and brand would be the most
standardized ones, followed by advertising, distribution, promotions and
finally pricing being the most adapted element. This view is supported by
several other studies. (see Birnik & Bowman (2007)).
Product and promotion (including advertising) have also been the most
investigated elements (Waheeduzzaman & Leon, 2004, 32). Research has
covered mainly manufacturing firms but not service firms (Chung, 2003,
50). The figure 3 below summarizes the findings on standardization
degree of different elements and the contextual factors influencing
standardization.
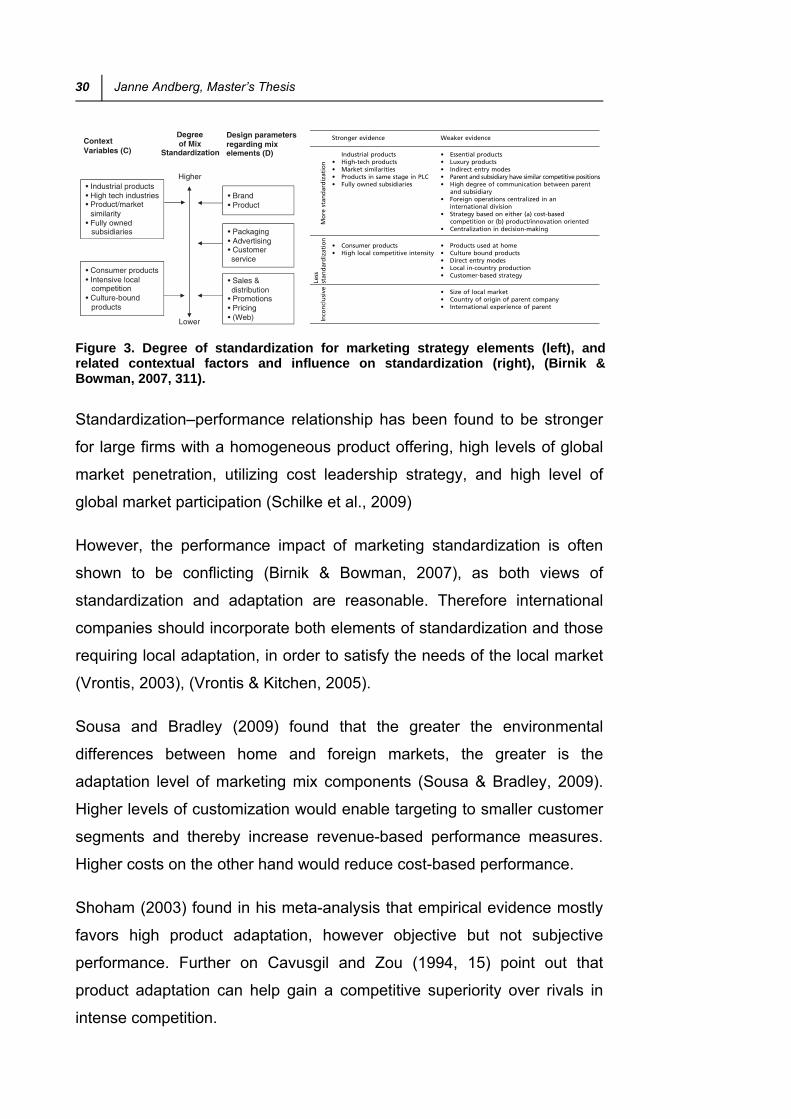
30 Janne Andberg, Master’s Thesis
Figure 3. Degree of standardization for marketing strategy elements (left), and related contextual factors and influence on standardization (right), (Birnik & Bowman, 2007, 311).
Standardization–performance relationship has been found to be stronger
for large firms with a homogeneous product offering, high levels of global
market penetration, utilizing cost leadership strategy, and high level of
global market participation (Schilke et al., 2009)
However, the performance impact of marketing standardization is often
shown to be conflicting (Birnik & Bowman, 2007), as both views of
standardization and adaptation are reasonable. Therefore international
companies should incorporate both elements of standardization and those
requiring local adaptation, in order to satisfy the needs of the local market
(Vrontis, 2003), (Vrontis & Kitchen, 2005).
Sousa and Bradley (2009) found that the greater the environmental
differences between home and foreign markets, the greater is the
adaptation level of marketing mix components (Sousa & Bradley, 2009).
Higher levels of customization would enable targeting to smaller customer
segments and thereby increase revenue-based performance measures.
Higher costs on the other hand would reduce cost-based performance.
Shoham (2003) found in his meta-analysis that empirical evidence mostly
favors high product adaptation, however objective but not subjective
performance. Further on Cavusgil and Zou (1994, 15) point out that
product adaptation can help gain a competitive superiority over rivals in
intense competition.
Stronger evidence Weaker evidence
Mo
re s
tan
dar
diz
atio
n
Industrial products • Essential products• High-tech products • Luxury products• Market similarities • Indirect entry modes• Products in same stage in PLC• Fully owned subsidiaries
• Parent and subsidiary have similar competitive positions• High degree of communication between parent
and subsidiary• Foreign operations centralized in an
international division• Strategy based on either (a) cost-based
competition or (b) product/innovation oriented• Centralization in decision-making
Less
st
and
ard
izat
ion
• Consumer products • Products used at home• High local competitive intensity • Culture bound products
• Direct entry modes• Local in-country production• Customer-based strategy
Inco
ncl
usi
ve • Size of local market• Country of origin of parent company• International experience of parent
2. Theoretical foundation and hypotheses 31
Brei et al. (2011) found the existence of a positive impact of both
marketing mix adaptation and standardization on performance. Their
results suggest that price should be the most adapted, followed by
promotion, product, and distribution.
Based on the discussion above, it is thus hypothesized that:
H3a There is a positive relationship between product adaptation and
revenue-based performance but negative with cost-based performance
Price standardization has also produced mixed results. Shoham (2003)
found that the degree of price standardization is unrelated to performance.
This could be related to earlier discussion, indicating that more adapted
pricing could increase sales and thus turnover but same time reduce
margins and thus profitability.
H3b There is a positive relationship between price adaptation and
revenue-based performance but negative with cost-based performance
The degree of adaptation of promotion strategies did not affect objective
neither subjective export performance.
H3c There is a positive relationship between promotion adaptation and
revenue-based performance but negative with cost-based performance.
Higher degree of distribution standardization harmed both objective and
subjective performance significantly.
H3d There is a positive relationship between distribution adaptation and
revenue-based performance but negative with cost-based performance
Based on the very mixed results, also from different meta-analysis, one
could conclude that no impact, negative impact, mixed results as well as
positive results can be found for both standardization and adaptation,
The research focuses mainly on the individual marketing mix components
leaving thus potential interrelationships unexplored. In order to understand

32 Janne Andberg, Master’s Thesis
the degree of adaptation/standardization and cover intercorrelation
between the items, the following hypotheses are proposed:
H4a Although product is known to be the most standardized element, for
small and medium-sized enterprises with low level of global market
penetration and participation, product is expected to be mainly adapted.
H4b Pricing elements will exhibit the lowest degree of standardization
among the marketing mix elements
H4c Promotion will be standardized to a higher degree than pricing.
H4d The distribution elements will have a low degree of standardization,
showing a similar standardization level as the pricing elements.
2.4.3 Strategic orientations and marketing strategy
Both strategic orientations and marketing strategy have been studied in
relation to business performance but very limited information about their
relationship exists. However, expecting the causal relationship between
strategic orientations, marketing strategy adaptation/standardization and
business performance, it should be possible to explain marketing strategy
decisions by the strategic orientations, e.g. better understanding on
market demands or competitive situation would allow higher/lower
adaption of marketing strategy elements.
Therefore the following hypotheses are proposed:
H5a Higher level of learning orientation increases marketing strategy
adaptation.
H5b Higher level of entrepreneurial orientation increases marketing
strategy adaptation.
H5c Higher level of market orientation increases marketing strategy
adaptation.

2. Theoretical foundation and hypotheses 33
2.4.4 Moderating and mediating effects of marketing strategy
Following the idea of causal relationship between strategic orientations,
marketing strategy adaptation/standardization and business performance,
further two phenomena shall be covered, namely moderating and
mediating effects.
Moderator would affect the direction and/or strength of the relation
between strategic orientations and business performance, i.e. explain
when certain effects occur. Marketing strategy as mediator would be an
explaining variable between strategic orientations and business
performance, explaining how or why certain effects occur.
H6 Marketing strategy will moderate strategic orientation performance
relationship.
H7 Marketing strategy will mediate strategic orientation performance
relationship.
2.4.5 Framework
Four firm-level concepts are central to this thesis: strategic orientations,
marketing strategy adaptation/standardization, business performance, and
business context. For the sake of clarity, business context is considered
only as control variable although it could also moderate strategic
orientations and marketing strategy.
According to Cadogan (2012, 342) researchers need to match
performance metrics and strategic orientations carefully when developing
their conceptual models. The thesis intends to study separately all factors
shown below, in order to avoid errors related to composite scores, such as
contradictory operation on performance. Figure 4 shows the general
framework with related hypotheses’ groups.

34 Janne Andberg, Master’s Thesis
Figure 4. General framework showing hypotheses (the dotted line refers to business context potentially affecting the relationships).
STRATEGIC ORIENTATIONS
LearningOrientation
MarketingOrientation
EntrepreneurialOrientation
BUSINESSPERFORMANCEObjective/subjective
INT’L MARKETING STRATEGY
Standardization vs. adaptation of
Product, Price, Place and Promotion
INTERNATIONAL BUSINESS CONTEXT
H2
H5
H1
H3
H6
H4
H7

3. Research methodology 35
3 Research methodology
This chapter describes the methodology of the present study. First, the
research design is shortly described before target population and sampling
criteria are defined. Thereafter the questionnaire, data collection process,
and non-response analyses are presented. Further scales development
process and main statistical methods employed are briefly explained. The
final section discusses reliability and validity related to the study.
3.1 Research design
This study aims to examine the effect of different strategic orientations and
marketing mix standardization/adaptation strategy on international
performance of small and medium-sized entrepreneurial firms (SMEs).
The study follows the general design presented below:
1. Data collection: questionnaire, response rate, scales, controls
2. Data screening: missing data, outliers, normality, homoscedasticity, linearity
3. Descriptive analysis: averages, deviations, correlation, scales
4. Construct operationalization: factor analysis with Varimax, multicollinearity
5. Regression analysis: linear, moderator, and mediator
Figure 5. General research structure
The thesis is part of a larger research program carried out at
Lappeenranta University of technology during 2008 and 2009. In this study
particular focus is set on understanding the role of marketing mix
standardization/adaptation strategy. Other theses have focused on the
role of network competence in internationalization of SMEs (Torkkeli,
2009) as well as market orientation and performance relationship within
entrepreneurial SMEs (Falck, 2008).
3.2 Data collection
The data were collected during a time span of 6 months (February 2008-
July 2008) from Finnish SMEs in five industries: software, metal, food,
36 Janne Andberg, Master’s Thesis
furniture, and knowledge-intensive business services industry (KIBS).
Different industries were chosen in order to capture and explain
differences between domestic and international firms, between low and
high technology firms, as well as between manufacturing and service
firms.
Finnish SME context was considered appropriate for the study due to
developed industry sectors and rapidly internationalizing knowledge-
intensive industries, attributable to small domestic markets. Amadeus
database was used in selecting domestic firms having 10-500 employees
and less than 50 million Euros turnover, a population which was
considered clear and representative. The data was gathered using an
online Webropol-questionnaire.
Table 2. The search criteria’s for SME contact information. The effective sample size was 1147 entrepreneurial SMEs. Sample distribution between industries in parenthesis (number of responses/inquiries, response rate %).
Firm size 10 – 500 employees
Industry
(NACE-coding)
Software industry (67/247, 27%) 7221. Publishing of software
7222. Other software consultancy and supply
Metal industry (50/325, 15%) 29. Manufacture of machinery and equipment
Furniture industry (33/107, 31%) 361. Manufacture of furniture
Food industry (56/209, 27%) 15. Manufacture of food products and beverages
Knowledge intensive business services (49/259, 19%) 7411. Legal activities
7412. Accounting, book-keeping and auditing activities, tax consultancy
7413. Market research and public opinion polling
7414. Business and management consultancy activities
744. Advertising
Geographical
location
Finland
Questionnaire
The questionnaire was designed by a group of academics at
Lappeenranta University of Technology, mainly using scales found in the
3. Research methodology 37
literature. Preliminary scales were pre-tested and reviewed by three
industrial managing directors. Final alterations were made according to the
comments and notions given, in order to improve reliability and validity of
the item scales. The questionnaire was strategic and tactic oriented and
thus sent primarily to top-level management.
In order to minimize response time and respondent effort, all constructs
were measured using a seven-point Likert scale ranging from “strongly
disagree” (1) to “strongly agree” (7), following the original scales from
previously published studies. Some of the items were negatively worded in
order to reduce pattern response bias, although negatively worded items
are known to lower item loadings (Hinkin, 1995, 972). The survey included
also additional items on internationalization indicators for internationalized
firms.
Response rate
From 1147 inquiries 298 responses were received, as indicated in table 2.
The 26% response rate is considered sufficient rate for a web survey. Of
the 298 firms 179 were active only domestic and 119 had some level of
international activity or were in the middle of the internationalization
process. Both types of SMEs were thus sufficiently represented.
The respondents were first contacted by phone for participation
agreement. The link to the questionnaire was sent thereafter by the means
of an e-mail if an agreement of participation was reached. The
respondents were hereafter given a period of two weeks to reply after
which the first reminder was sent. In case of no response, two reminders
were sent at one week intervals after the previous reminder.
A clear majority of the respondents (66%) were managing directors.
Moreover, 20% indicated themselves as owners and 14% as other key
persons in the company.

38 Janne Andberg, Master’s Thesis
3.3 Measurement scales
Scales developed shall assess various attitudes, perceptions, or opinions
in order to examine their relationships. The generation of items is an
important part in developing measures and linking those with the
theoretical domain and content validity. However, in survey research
measures are many times used before adequate data exist regarding their
reliability and validity (Hinkin, 1995). In this study mainly established
scales were used.
Regarding sample size, a sample having less than 50 observations shall
not be not factor analyzed. Preferably the sample size should be 100 or
larger. As a general rule, a sample shall have at least five times as many
observations as the number of variables to be analyzed, and a more
acceptable sample size would have a 10:1 ratio. (Hair et al, p.101)
Regarding scale length, scales shall generate sufficient variance among
respondents for following statistical analysis. Scales containing five or six
items that utilize five or seven point Likert scales would assure adequate
domain sampling, and provide adequate internal consistency reliability for
most measures. Scales with too few items may lack content and construct
validity, internal consistency and test-retest reliability (Hinkin, 1995).
Coefficient alpha reliability has been shown to increase up to five points
Likert-type scales, but then levelling off.
In this survey items were adapted from the original scales found in the
literature. All constructs were measured with multi-item scales, with the
exception of adaptation/standardization items, which included only one
item per construct.
Four dimensions of entrepreneurial orientation (innovativeness, risk-
taking, proactiveness, and competitive aggressiveness) were measured
using scales developed and tested for reliability by Miller (1983), Covin
and Slevin (1989) and Covin and Covin (1990).
3. Research methodology 39
The items for learning orientation (commitment to learning and open-
mindedness were adapted from Sinkula et al. (1997). Market orientation
scale MKTOR was adapted partially from Narver and Slater (1990),
including the three dimensions (customer orientation, competitor
orientation, and interfunctional coordination) and partially from Matsuno et
al. (2002), including market intelligence and dissemination constructs.
Prior literature identified both subjective and objective approaches to
evaluate business performance and therefore both are used in this thesis.
Effective objective performance measures are:
- sales revenue per employee
- profit/loss per employee
- profit margin
- return on capital employed
- average growth per year
The subjective aspect of performance was attained by the respondents’
estimation of performance during the three precedent years (2005-2007).
The objective aspect on the other hand was captured by the financial
information collected from the Amadeus-database for the period 2005-
2007. The reason for using data from those years only, is the fact that the
amount of missing data increased remarkably for 2008-2009.
Control variables
In addition to the main explanatory factors, we also included some control
variables to the analyses. Firstly, we controlled for firm age. Secondly, we
controlled for industry. Industry might have an effect on the market
orientation–performance relationship, since that relationship has been
found to be stronger in manufacturing firms (Kirca et al., 2005). This was
done both for each industry separate and by dividing the firms to low and
high knowledge-intensive firms. Finally, we controlled also for environment
dividing it into domestic and international.
40 Janne Andberg, Master’s Thesis
3.4 Analytical methods and tools
Multivariate analysis techniques are used to find relationships between
constructs and to create new knowledge, in order to improve future
decision making. The properties of the constructs in this study were
evaluated by conducting multivariate analyses using SPSS software.
The data was first screened for missing data and outliers, and tested for
the assumptions underlying most multivariate techniques, such as
normality, homoscedasticity, and linearity. As some of the firms were
either lacking all strategic orientation data or performance related data,
related data sets were removed from the analysis.
The most fundamental assumption for multivariate analysis, normality, was
tested using both statistical assessment, skewness and kurtosis, as well
as visually checked data distribution, as recommended by Hair et al.
(2009).
The following assumption, homoscedasticity, refers to the assumption that
dependent variable(s) exhibit equal levels of variance across the range of
predictor variable(s). Homoscedasticity is desirable because then the
explaining variance is equally spread.
The assumption of all multivariate techniques based on correlational
measures of association is linearity. The most common way to assess
linearity is to examine scatterplots of the variables and to identify any
nonlinear patterns in the data. An alternative approach is to run a simple
regression analysis and to examine the residuals which reflect the
unexplained portion of the dependent variable. After data screening
process, measures were subjected to a purification process.
Summated scales
In the present study, summated scales are used to combine dimensions of
different strategic orientations into single constructs, in order to compare
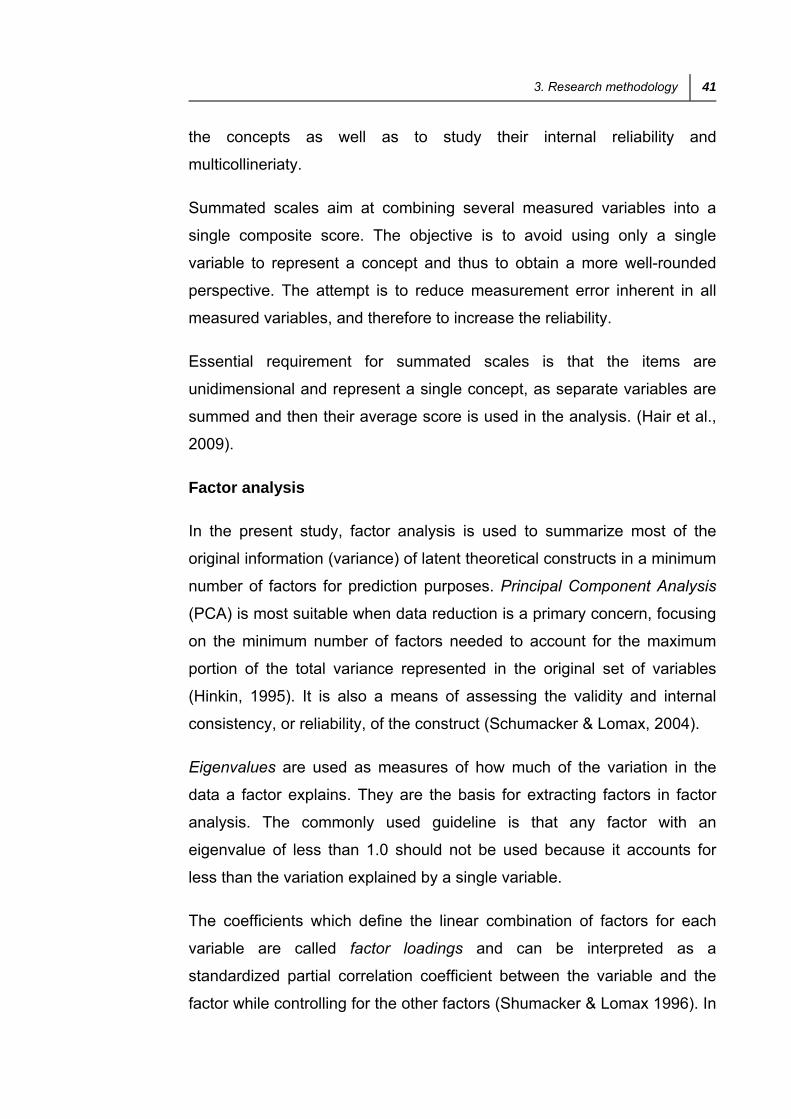
3. Research methodology 41
the concepts as well as to study their internal reliability and
multicollineriaty.
Summated scales aim at combining several measured variables into a
single composite score. The objective is to avoid using only a single
variable to represent a concept and thus to obtain a more well-rounded
perspective. The attempt is to reduce measurement error inherent in all
measured variables, and therefore to increase the reliability.
Essential requirement for summated scales is that the items are
unidimensional and represent a single concept, as separate variables are
summed and then their average score is used in the analysis. (Hair et al.,
2009).
Factor analysis
In the present study, factor analysis is used to summarize most of the
original information (variance) of latent theoretical constructs in a minimum
number of factors for prediction purposes. Principal Component Analysis
(PCA) is most suitable when data reduction is a primary concern, focusing
on the minimum number of factors needed to account for the maximum
portion of the total variance represented in the original set of variables
(Hinkin, 1995). It is also a means of assessing the validity and internal
consistency, or reliability, of the construct (Schumacker & Lomax, 2004).
Eigenvalues are used as measures of how much of the variation in the
data a factor explains. They are the basis for extracting factors in factor
analysis. The commonly used guideline is that any factor with an
eigenvalue of less than 1.0 should not be used because it accounts for
less than the variation explained by a single variable.
The coefficients which define the linear combination of factors for each
variable are called factor loadings and can be interpreted as a
standardized partial correlation coefficient between the variable and the
factor while controlling for the other factors (Shumacker & Lomax 1996). In
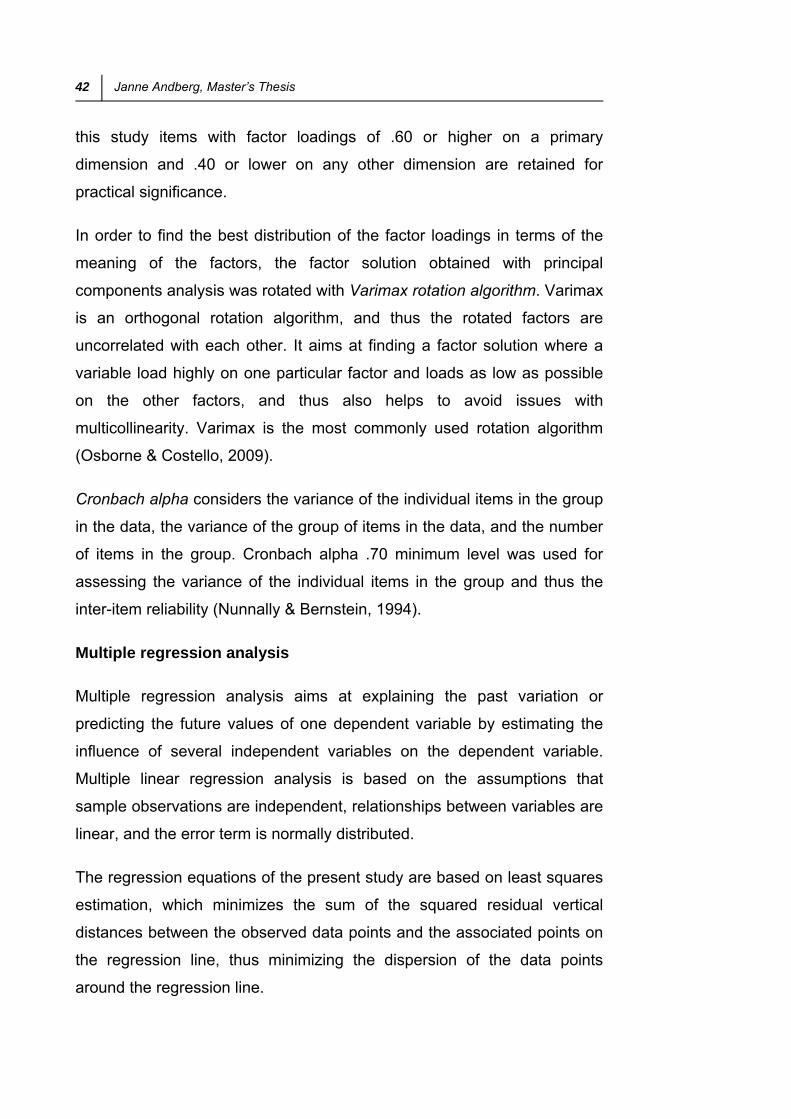
42 Janne Andberg, Master’s Thesis
this study items with factor loadings of .60 or higher on a primary
dimension and .40 or lower on any other dimension are retained for
practical significance.
In order to find the best distribution of the factor loadings in terms of the
meaning of the factors, the factor solution obtained with principal
components analysis was rotated with Varimax rotation algorithm. Varimax
is an orthogonal rotation algorithm, and thus the rotated factors are
uncorrelated with each other. It aims at finding a factor solution where a
variable load highly on one particular factor and loads as low as possible
on the other factors, and thus also helps to avoid issues with
multicollinearity. Varimax is the most commonly used rotation algorithm
(Osborne & Costello, 2009).
Cronbach alpha considers the variance of the individual items in the group
in the data, the variance of the group of items in the data, and the number
of items in the group. Cronbach alpha .70 minimum level was used for
assessing the variance of the individual items in the group and thus the
inter-item reliability (Nunnally & Bernstein, 1994).
Multiple regression analysis
Multiple regression analysis aims at explaining the past variation or
predicting the future values of one dependent variable by estimating the
influence of several independent variables on the dependent variable.
Multiple linear regression analysis is based on the assumptions that
sample observations are independent, relationships between variables are
linear, and the error term is normally distributed.
The regression equations of the present study are based on least squares
estimation, which minimizes the sum of the squared residual vertical
distances between the observed data points and the associated points on
the regression line, thus minimizing the dispersion of the data points
around the regression line.
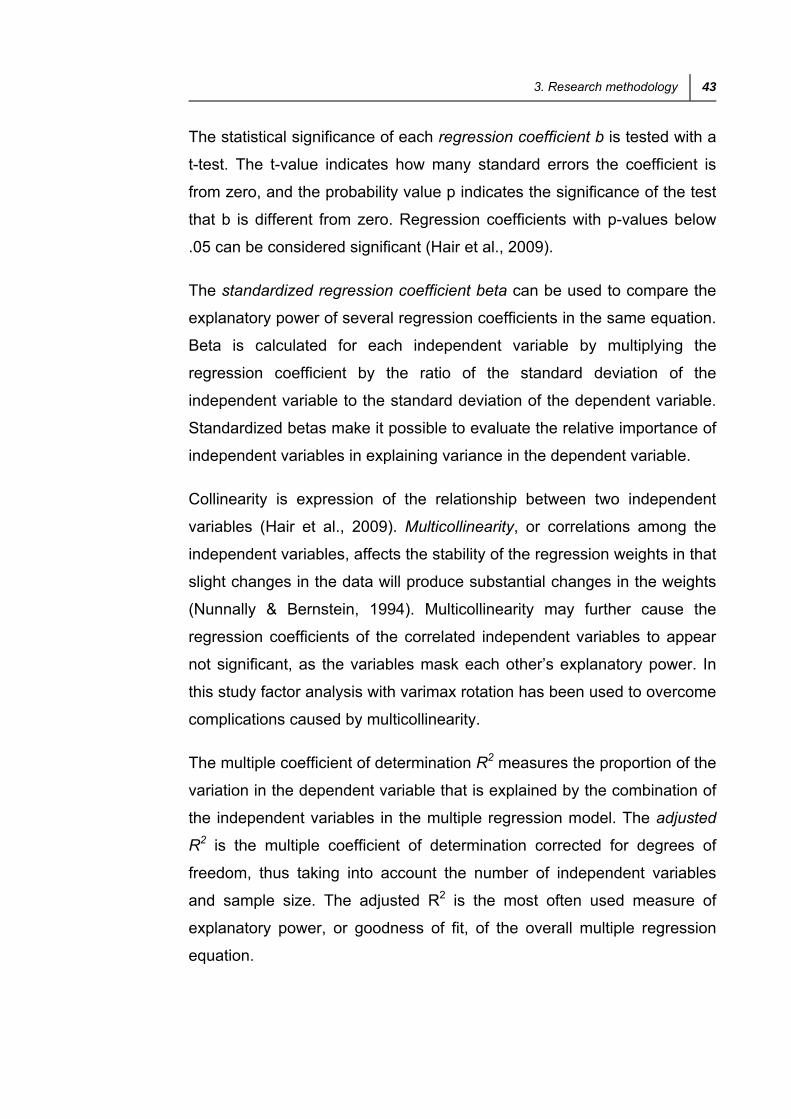
3. Research methodology 43
The statistical significance of each regression coefficient b is tested with a
t-test. The t-value indicates how many standard errors the coefficient is
from zero, and the probability value p indicates the significance of the test
that b is different from zero. Regression coefficients with p-values below
.05 can be considered significant (Hair et al., 2009).
The standardized regression coefficient beta can be used to compare the
explanatory power of several regression coefficients in the same equation.
Beta is calculated for each independent variable by multiplying the
regression coefficient by the ratio of the standard deviation of the
independent variable to the standard deviation of the dependent variable.
Standardized betas make it possible to evaluate the relative importance of
independent variables in explaining variance in the dependent variable.
Collinearity is expression of the relationship between two independent
variables (Hair et al., 2009). Multicollinearity, or correlations among the
independent variables, affects the stability of the regression weights in that
slight changes in the data will produce substantial changes in the weights
(Nunnally & Bernstein, 1994). Multicollinearity may further cause the
regression coefficients of the correlated independent variables to appear
not significant, as the variables mask each other’s explanatory power. In
this study factor analysis with varimax rotation has been used to overcome
complications caused by multicollinearity.
The multiple coefficient of determination R2 measures the proportion of the
variation in the dependent variable that is explained by the combination of
the independent variables in the multiple regression model. The adjusted
R2 is the multiple coefficient of determination corrected for degrees of
freedom, thus taking into account the number of independent variables
and sample size. The adjusted R2 is the most often used measure of
explanatory power, or goodness of fit, of the overall multiple regression
equation.

44 Janne Andberg, Master’s Thesis
Sample size has a direct effect on the explanatory power of multiple
regression analysis. Hair et al. (2009) have suggested a minimum of 15 to
20 times as many observations as there are independent variables in the
model. Multiple regression analysis is not recommended for sample sizes
of less than 20-30 observations. Also, in large samples with more than
1000 observations, regression analysis can be overly sensitive.
In the present study, also two main types of indirect effects are examined,
namely moderation and mediation.
Moderator Regression Analysis
Moderated multiple regression is the most standard way to investigate
possible slope and intercept differences (Nunnally Bernstein 1994).
Sharma et al. (1981) classify moderator variables into two main types: first
type affects the strength of the relationship and second modifies the form.
Figure 6 illustrates a moderating effect: the relationship between X and Y
varies as a function of Mo. In testing for moderation effects, regression
analyses are usually carried out in two stages. In the first equation, the
direct effects of X and Mo on Y are examined. In the second equation the
interaction term XMo is included. A significant effect of the interaction term
on Y indicates a moderating effect.
Figure 6. Moderating effect of Mo on the relationship between X and Y (left) and Mediating effect on Me on the relationship between X and Y (right).
X Y
Mo
X Y
Me

3. Research methodology 45
Mediation Regression Analysis
Figure 6 illustrates a mediating effect: the influence of X on Y takes place
through Me. In regression analysis, mediation effects can be tested by
using a staged approach. First, in a regression equation where Me is the
dependent variable and X is the independent variable, X should have a
significant effect on Me. In the second equation, Y is the dependent
variable and X is the independent variable. In order for mediation to be
possible X should have a significant effect on Y. In the third stage, Me is
added as an independent variable into the second equation. In the case of
full mediation, the effect of X on Y is no longer significant and instead, Me
has a significant effect on Y. Often, mediation is partial, that is, X has both
a direct effect and a mediated effect on Y. In this case, the effect of X
decreases but is still significant in the third equation.
3.5 Reliability and validity
In order to contribute to the theoretical development of a research field, a
study must demonstrate sufficient reliability, validity, and also
generalizability. Reliability refers to the replicability of the results of the
study in a repeated measurement, while validity is the extent to which the
study measures and tests the phenomenon that it is assumed to examine
Generalizability, or external validity, refers to how broadly the findings of a
study can be generalized into contexts outside the setting of the study.
Table 3 illustrates the elements of reliability, validity, and generalizability
used to evaluate the quality of the present study. In this section, the
reliability and validity are assessed. Generalizability is addressed in the
discussion chapter.

46 Janne Andberg, Master’s Thesis
Table 3. Elements of reliability, validity, and generalizability (based on Salvendy & Carayon 1997 and Babbie 1990).
Reliability Reliability of measures: inter-item reliability
Reliability of data sources: stability over time
Validity Face validity: conforms to common understanding of concept
Content validity: covers all relevant facets of a concept
Construct validity: theoretically reflects phenomenon under study
- Discriminant validity: constructs conceptually distinct - Convergent validity: different measures of same are correlated
Criterion-related validity: results support theory and previous results
Generalizability (External validity)
Representativeness: sample is representative of population
Generalizability to other contexts
Reliability
Reliability is an important indicator of the measure's quality because it
determines the impact of inconsistencies in measurement on the results.
The concept of reliability addresses whether or not the results of a
measurement are the same when similar measurement operations are
carried out or when the operation is repeated (Hinkin, 1995).
The empirical data of this study were collected from one respondent in
each sample firm. This method of using single-respondent, self-reported
data poses the problem of potential bias in the data. The reliance on this
method in the study was motivated by two main factors. First, the
respondents needed to have overall knowledge of the firm's operations.
Accordingly, the respondents were the managing directors or other
executive directors of the firms. Second, the use of self-reported data was
motivated by the lack of objective sources of information.
The use of single respondents means that the data are essentially based
on the perceptions of the respondents. In order to ensure reliable answers
to the questionnaire and to thereby minimize potential bias in the data,
questionnaire was properly designed and pre-tested, and items were
clearly formulated to measure tangible matters rather than opinions,
whenever possible. The coverage and quality of the obtained
questionnaire data was good as discussed earlier.

3. Research methodology 47
Inter-item reliability depicts the internal consistency of a set of items
measuring a construct. It reflects the degree to which the items represent
a common latent unobserved construct. The most commonly used
methods of assessing inter-item reliability are factor analysis and the
Cronbach alpha coefficient with .70 minimum level (Nunnally & Bernstein,
1994).
Multiple measurement items were used for all of the strategic orientation
constructs. Single measures were used for adaptation/standardization
variables as well as for quantifiable performance measures, measuring
different construct. The results of the factor analyses and the Cronbach
alpha coefficients are presented in the results chapter.
Validity
In the present study, previously validated measures were adopted
whenever possible to help ensure their validity. In the following, the validity
of the constructs of this study is assessed in detail along four dimensions:
face, content, construct, and internal validity. External validity is discussed
in discussion chapter.
Face validity is the extent to which a test is subjectively viewed as
covering the concept it purports to measure. It refers to the degree to
which constructs and empirical measures are consistent with common
agreements and generally accepted notions regarding the underlying
concepts. In this study, all of the constructs were theoretically derived
following an extensive literature review. They are in line with the general
usage and understanding of the concepts and should therefore have high
face validity.
Content validity refers to the degree to which a measure covers various
facets of a construct within the underlying concept. Content validity must
be built into the measures to include all of the facets. In this study, the
measures were mainly based on measures found in the literature and also
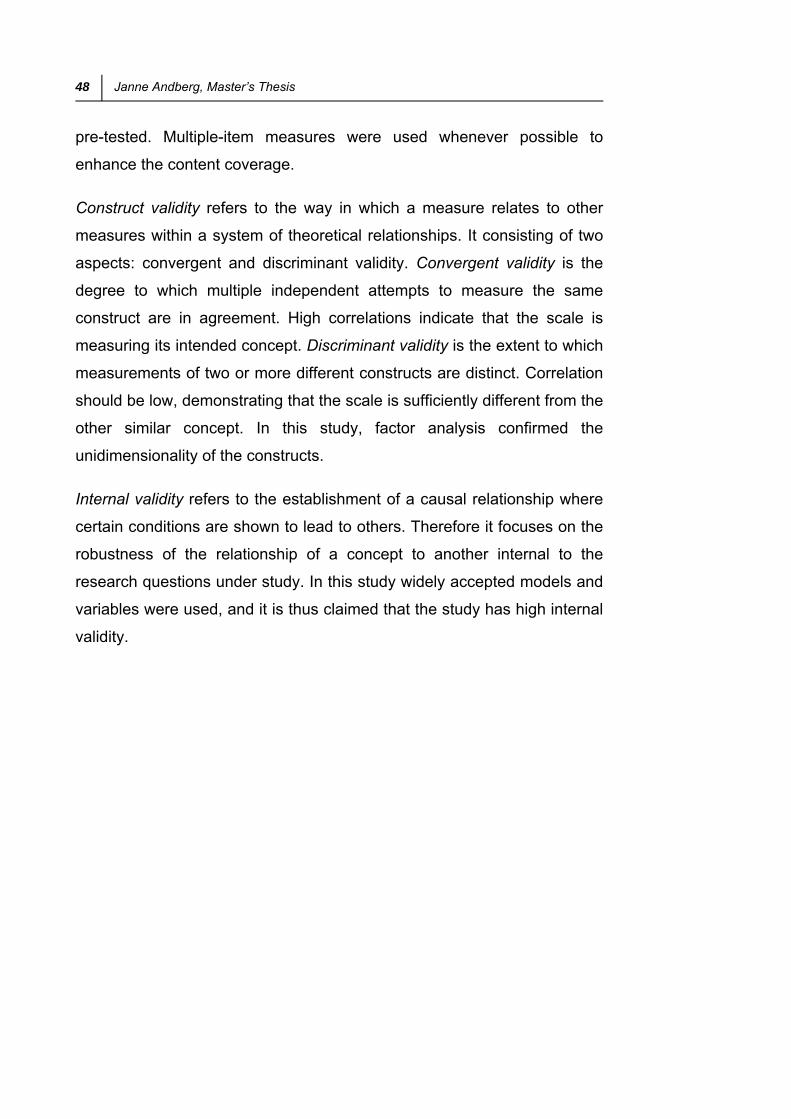
48 Janne Andberg, Master’s Thesis
pre-tested. Multiple-item measures were used whenever possible to
enhance the content coverage.
Construct validity refers to the way in which a measure relates to other
measures within a system of theoretical relationships. It consisting of two
aspects: convergent and discriminant validity. Convergent validity is the
degree to which multiple independent attempts to measure the same
construct are in agreement. High correlations indicate that the scale is
measuring its intended concept. Discriminant validity is the extent to which
measurements of two or more different constructs are distinct. Correlation
should be low, demonstrating that the scale is sufficiently different from the
other similar concept. In this study, factor analysis confirmed the
unidimensionality of the constructs.
Internal validity refers to the establishment of a causal relationship where
certain conditions are shown to lead to others. Therefore it focuses on the
robustness of the relationship of a concept to another internal to the
research questions under study. In this study widely accepted models and
variables were used, and it is thus claimed that the study has high internal
validity.
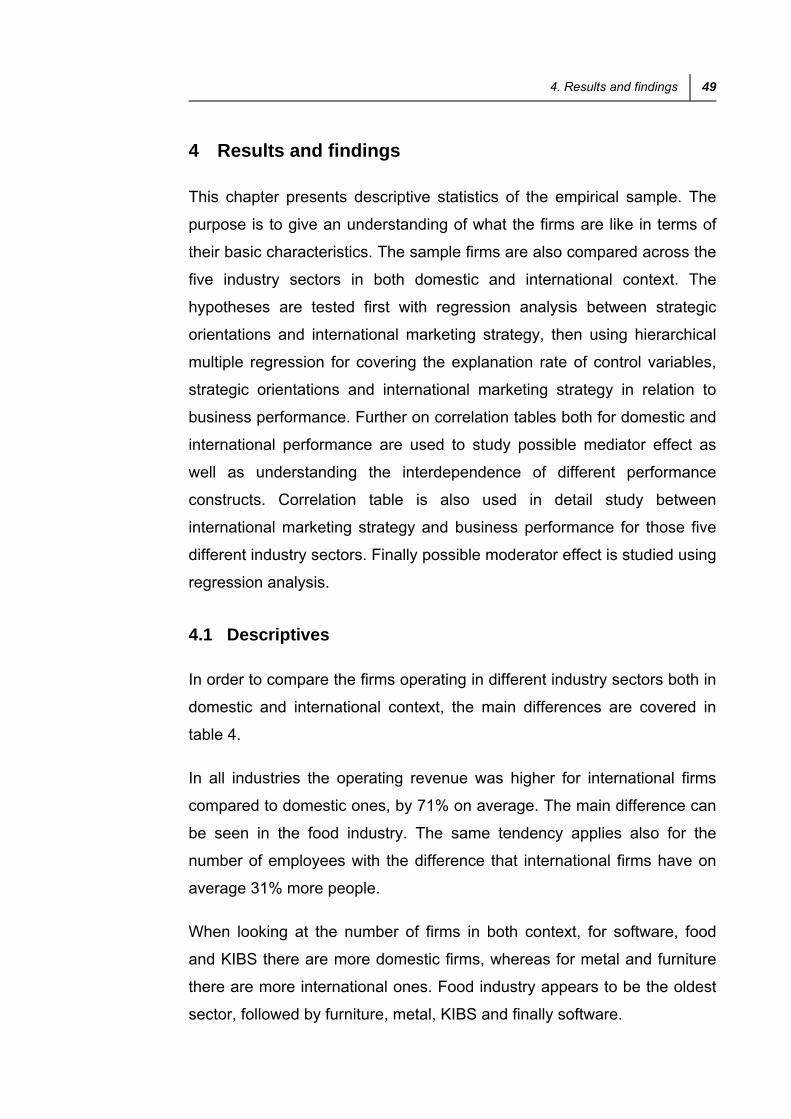
4. Results and findings 49
4 Results and findings
This chapter presents descriptive statistics of the empirical sample. The
purpose is to give an understanding of what the firms are like in terms of
their basic characteristics. The sample firms are also compared across the
five industry sectors in both domestic and international context. The
hypotheses are tested first with regression analysis between strategic
orientations and international marketing strategy, then using hierarchical
multiple regression for covering the explanation rate of control variables,
strategic orientations and international marketing strategy in relation to
business performance. Further on correlation tables both for domestic and
international performance are used to study possible mediator effect as
well as understanding the interdependence of different performance
constructs. Correlation table is also used in detail study between
international marketing strategy and business performance for those five
different industry sectors. Finally possible moderator effect is studied using
regression analysis.
4.1 Descriptives
In order to compare the firms operating in different industry sectors both in
domestic and international context, the main differences are covered in
table 4.
In all industries the operating revenue was higher for international firms
compared to domestic ones, by 71% on average. The main difference can
be seen in the food industry. The same tendency applies also for the
number of employees with the difference that international firms have on
average 31% more people.
When looking at the number of firms in both context, for software, food
and KIBS there are more domestic firms, whereas for metal and furniture
there are more international ones. Food industry appears to be the oldest
sector, followed by furniture, metal, KIBS and finally software.

50 Janne Andberg, Master’s Thesis
Table 4. General comparison between the companies
Software Metal Furniture Food KIBS
Operating revenue DOM 946 1294 2191 1490 778
Operating revenue INTL' 1370 3565 3224 12583 2297
Employees DOM 12 15 19 18 14
Employees INTL' 18 21 34 32 18
Number of firms DOM 47 30 12 47 42
Number of firms INTL' 28 48 19 10 12
Age (in 2011) DOM 16 23 33 30 20
Age (in 2011) INTL' 12 23 25 46 23
Data validation
The importance of valid data is explicit for statistical analysis. Therefore in
the following, the mean values and related distributions are shortly
inspected and discussed for each group: strategic orientations,
international marketing strategy and business performance. Further on the
differences in strategic orientation dimensions between industries and
domestic vs. international context are covered.
Visual inspection of the histograms showed that the exam scores were
approximately normally distributed for the samples. However, as table 5
shows, there are several items which have high mean value with a
skewness >1 and also kurtosis >1. Obviously this indicates that the not
normally distributed but in order to keep the results understandable, no
transformation for these items was made.
The form of the histogram is especially skewed for all “learning orientation”
items (LO_01-05) as well as for “customer orientation” items (MO_01-005),
meaning that most of the companies are both highly learning and
customer oriented.

4. Results and findings 51
Table 5. Descriptive statistics for strategic orientations
N Minimum Maximum Mean Std.
Deviation Skewness Kurtosis
Statistic Statistic Statistic Statistic Statistic Statistic Std. Error Statistic Std. Error
LO_01 280 0 7 5,78 1,042 -1,128 ,146 3,055 ,290
LO_02 280 0 7 5,70 1,190 -1,319 ,146 2,817 ,290
LO_03 280 0 7 5,71 1,087 -1,260 ,146 3,211 ,290
LO_04 280 0 7 5,67 1,201 -1,077 ,146 1,865 ,290
LO_05 280 0 7 5,85 1,118 -1,241 ,146 3,072 ,290
EO_01 279 1 7 4,27 1,491 -,161 ,146 -,712 ,291
EO_02 280 1 7 4,24 1,611 -,166 ,146 -,911 ,290
EO_03 280 1 7 4,54 1,456 -,440 ,146 -,426 ,290
EO_04 280 1 7 4,28 1,637 -,143 ,146 -,894 ,290
EO_05 279 1 7 3,95 1,624 -,061 ,146 -,934 ,291
EO_06 280 1 7 3,03 1,397 ,527 ,146 -,175 ,290
EO_07 280 1 7 2,59 1,378 ,701 ,146 -,265 ,290
EO_08 280 1 7 3,21 1,654 ,286 ,146 -,980 ,290
EO_09 279 1 7 4,10 1,426 -,238 ,146 -,569 ,291
EO_10 280 1 7 2,55 1,401 ,799 ,146 -,144 ,290
EO_11 280 1 7 3,19 1,527 ,243 ,146 -,922 ,290
EO_12 279 1 7 3,99 1,573 -,272 ,146 -,923 ,291
EO_13 279 1 7 4,35 1,359 -,243 ,146 -,462 ,291
EO_14 280 1 7 3,83 1,515 -,005 ,146 -,789 ,290
EO_15 279 1 7 4,80 1,254 -,754 ,146 ,252 ,291
MO_01 278 3 7 6,41 ,720 -1,217 ,146 1,782 ,291
MO_02 277 1 7 6,31 ,778 -1,712 ,146 7,487 ,292
MO_03 278 4 7 6,61 ,619 -1,519 ,146 2,000 ,291
MO_04 278 3 7 6,37 ,703 -1,039 ,146 1,504 ,291
MO_05 276 1 7 5,18 1,297 -,647 ,147 ,182 ,292
MO_06 274 1 7 5,15 1,403 -,796 ,147 ,333 ,293
MO_07 275 1 7 3,55 1,668 ,041 ,147 -1,017 ,293
MO_08 278 1 7 4,27 1,545 -,181 ,146 -,634 ,291
MO_09 277 1 7 4,62 1,536 -,486 ,146 -,226 ,292
MO_10 277 1 7 5,05 1,486 -,708 ,146 ,047 ,292
MO_11 277 1 7 5,53 1,273 -1,126 ,146 1,549 ,292
MO_12 278 1 7 5,48 1,251 -,906 ,146 ,915 ,291
MO_13 278 2 7 5,95 1,001 -,944 ,146 ,786 ,291
MO_27 277 0 7 3,13 1,653 ,393 ,146 -,811 ,292
MO_28 276 0 7 2,91 1,658 ,535 ,147 -,781 ,292
MO_29 276 0 7 3,44 1,625 ,067 ,147 -,903 ,292
MO_30 276 0 7 3,43 1,560 ,133 ,147 -,743 ,292
MO_31 276 0 7 3,52 1,617 ,131 ,147 -,763 ,292
MO_32 275 0 7 3,71 1,595 -,043 ,147 -,743 ,293
MO_33 273 0 7 3,60 1,547 -,044 ,147 -,677 ,294
MO_34 276 0 7 4,37 1,447 -,405 ,147 -,269 ,292
Valid N (listwise)
257
The figure 7 summarizes differences between industries for all strategic
orientation dimensions used in this study for domestic context and figure 8
for international context. As indicated above all industries are highly
learning, customer and also interfunctional oriented. Domestic firms are
generally less entrepreneurial, competitor and intelligence oriented. Of the
domestic firms main differences can be found in their tendency to be
entrepreneurial. Software companies are clearly more entrepreneurial.
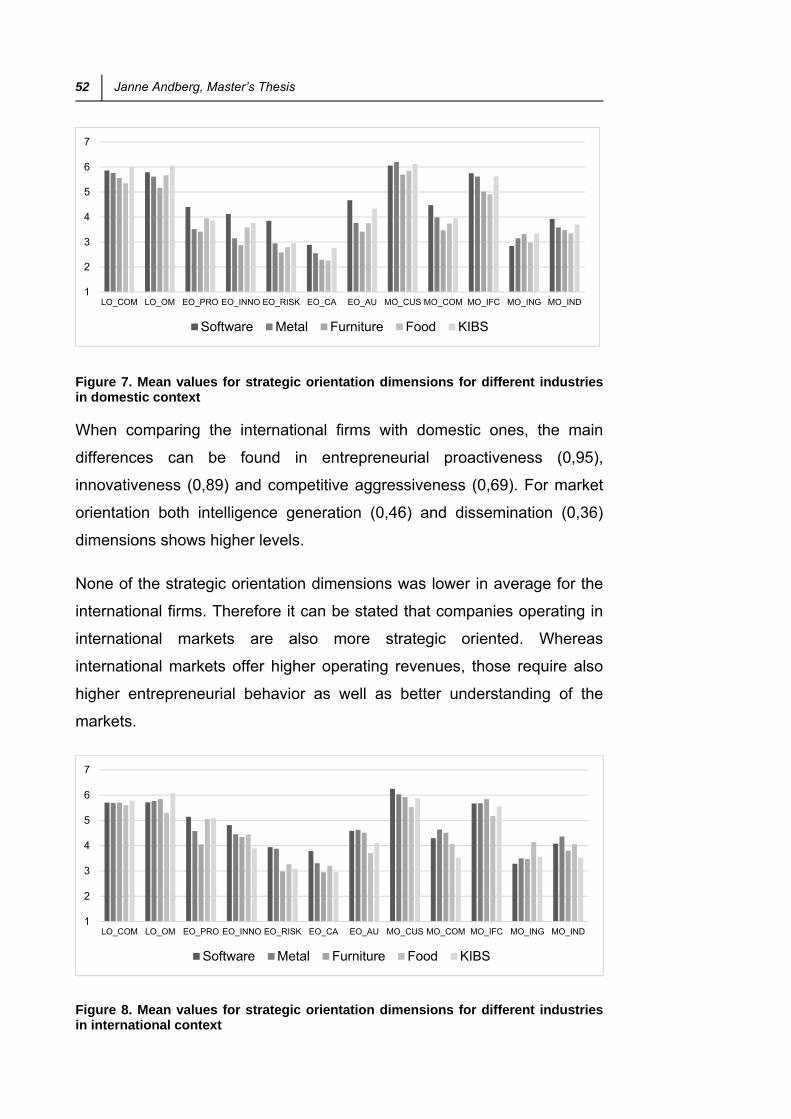
52 Janne Andberg, Master’s Thesis
Figure 7. Mean values for strategic orientation dimensions for different industries in domestic context
When comparing the international firms with domestic ones, the main
differences can be found in entrepreneurial proactiveness (0,95),
innovativeness (0,89) and competitive aggressiveness (0,69). For market
orientation both intelligence generation (0,46) and dissemination (0,36)
dimensions shows higher levels.
None of the strategic orientation dimensions was lower in average for the
international firms. Therefore it can be stated that companies operating in
international markets are also more strategic oriented. Whereas
international markets offer higher operating revenues, those require also
higher entrepreneurial behavior as well as better understanding of the
markets.
Figure 8. Mean values for strategic orientation dimensions for different industries in international context
1
2
3
4
5
6
7
LO_COM LO_OM EO_PRO EO_INNO EO_RISK EO_CA EO_AU MO_CUS MO_COM MO_IFC MO_ING MO_IND
Software Metal Furniture Food KIBS
1
2
3
4
5
6
7
LO_COM LO_OM EO_PRO EO_INNO EO_RISK EO_CA EO_AU MO_CUS MO_COM MO_IFC MO_ING MO_IND
Software Metal Furniture Food KIBS

4. Results and findings 53
Marketing strategy adaptation/standardization
For the marketing strategy adaptation/standardization only single items
were available for describing each construct of marketing decision four Ps.
As can be found in the appendix, the statements are almost as short as in
the table 6 below, leaving the meaning possibly quite unclear. This could
be the case especially for the product.
Table 6 shows that the mean values for product, price and promotion are
on high level and the distributions, particularly for the product, slightly
skewed and peaked. The distribution of distribution adaptation is totally
different. The level is low as well as skewness, and the form is rather flat.
This is interesting, as this question was reversed and located in different
part of the questionnaire. Therefore data is also available only for the
international firms.
Table 6. Descriptives for marketing strategy items
N Minimum Maximum Mean Std.
Deviation Skewness Kurtosis
Statistic Statistic Statistic Statistic Statistic Statistic Std. Error Statistic
Std. Error
Product adaptation 276 1 7 5,63 1,086 -1,036 ,147 1,620 ,292
Price adaptation 278 1 7 5,27 1,107 -,671 ,146 ,833 ,291
Promotion adaptation 273 1 7 5,04 1,293 -,600 ,147 ,217 ,294
Distribution adaptation 87 1 7 2,34 2,118 -,255 ,258 -1,154 ,511
Valid N (listwise) 82
Table 8 shows Pearson correlation values for marketing strategy
adaptation/standardization. It can be seen that product, price and
promotion all correlated significantly with each other. This indicates that
when one of the marketing strategy components is adapted, also other
components will be more adapted. This however does not apply to the
distribution adaptation, which as can be seen, has no significant
correlation to the other ones. This may depend on the data collection as
described above.
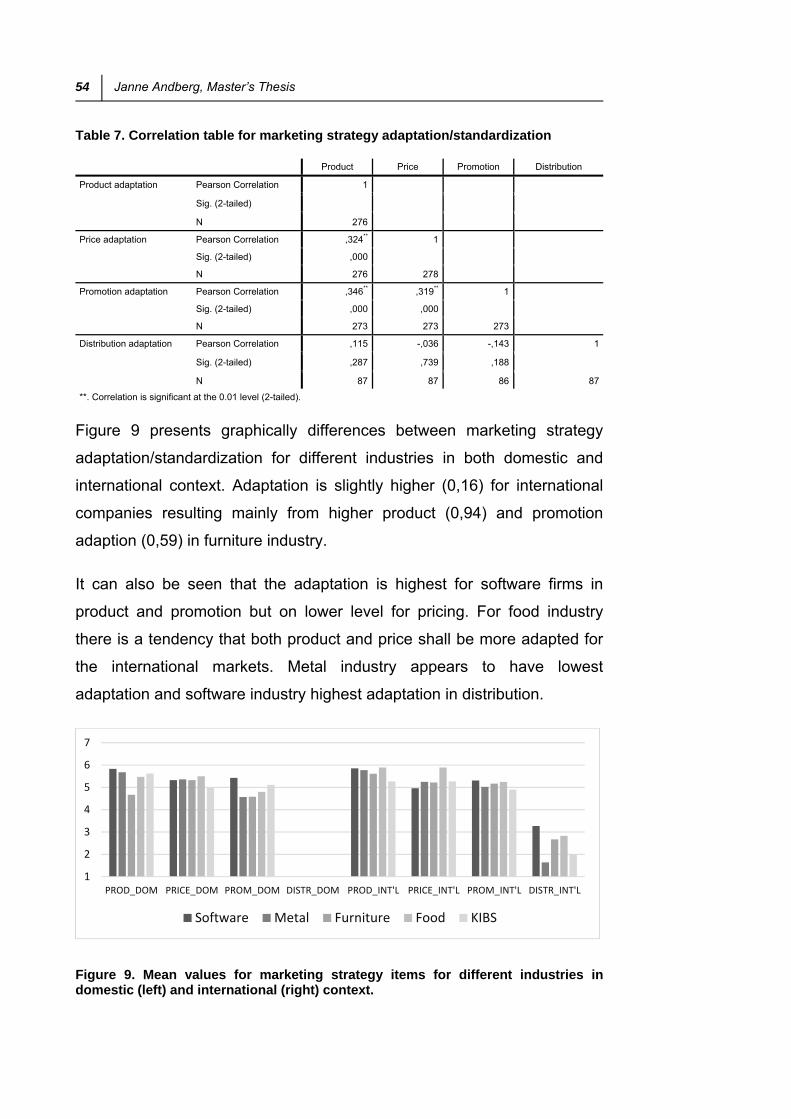
54 Janne Andberg, Master’s Thesis
Table 7. Correlation table for marketing strategy adaptation/standardization
Product Price Promotion Distribution
Product adaptation Pearson Correlation 1
Sig. (2-tailed)
N 276
Price adaptation Pearson Correlation ,324** 1
Sig. (2-tailed) ,000
N 276 278
Promotion adaptation Pearson Correlation ,346** ,319** 1
Sig. (2-tailed) ,000 ,000
N 273 273 273
Distribution adaptation Pearson Correlation ,115 -,036 -,143 1
Sig. (2-tailed) ,287 ,739 ,188
N 87 87 86 87
**. Correlation is significant at the 0.01 level (2-tailed).
Figure 9 presents graphically differences between marketing strategy
adaptation/standardization for different industries in both domestic and
international context. Adaptation is slightly higher (0,16) for international
companies resulting mainly from higher product (0,94) and promotion
adaption (0,59) in furniture industry.
It can also be seen that the adaptation is highest for software firms in
product and promotion but on lower level for pricing. For food industry
there is a tendency that both product and price shall be more adapted for
the international markets. Metal industry appears to have lowest
adaptation and software industry highest adaptation in distribution.
Figure 9. Mean values for marketing strategy items for different industries in domestic (left) and international (right) context.
1
2
3
4
5
6
7
PROD_DOM PRICE_DOM PROM_DOM DISTR_DOM PROD_INT'L PRICE_INT'L PROM_INT'L DISTR_INT'L
Software Metal Furniture Food KIBS
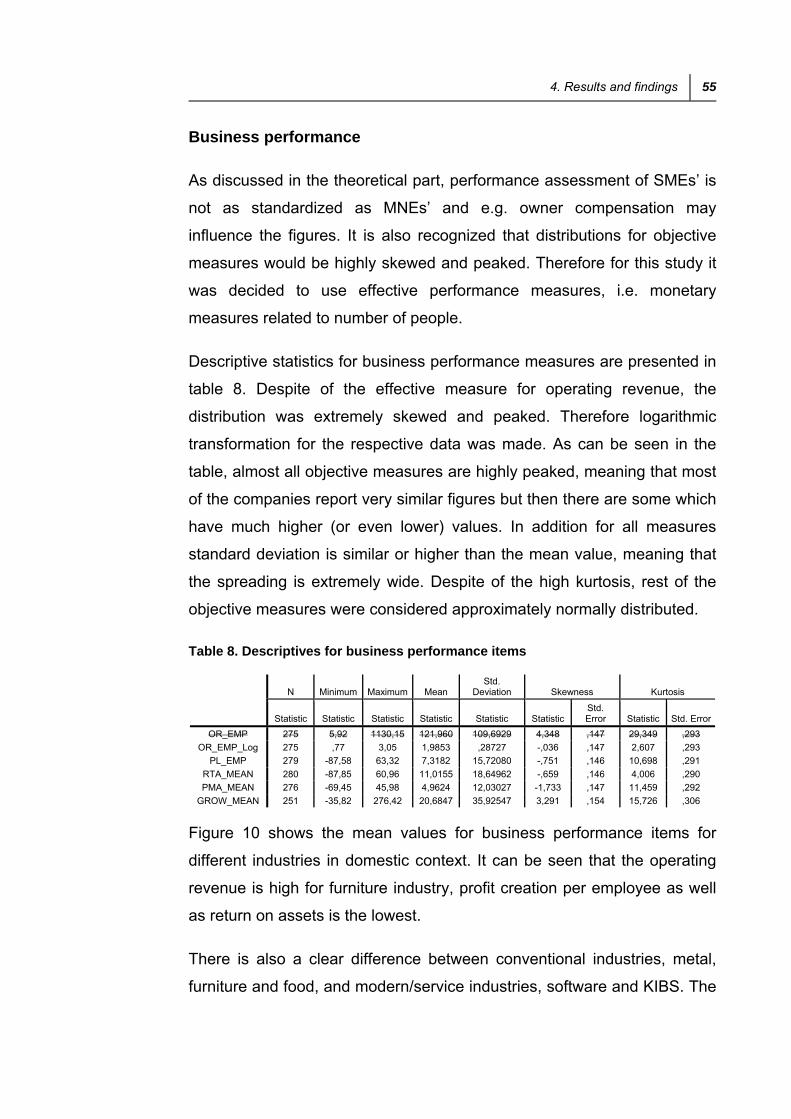
4. Results and findings 55
Business performance
As discussed in the theoretical part, performance assessment of SMEs’ is
not as standardized as MNEs’ and e.g. owner compensation may
influence the figures. It is also recognized that distributions for objective
measures would be highly skewed and peaked. Therefore for this study it
was decided to use effective performance measures, i.e. monetary
measures related to number of people.
Descriptive statistics for business performance measures are presented in
table 8. Despite of the effective measure for operating revenue, the
distribution was extremely skewed and peaked. Therefore logarithmic
transformation for the respective data was made. As can be seen in the
table, almost all objective measures are highly peaked, meaning that most
of the companies report very similar figures but then there are some which
have much higher (or even lower) values. In addition for all measures
standard deviation is similar or higher than the mean value, meaning that
the spreading is extremely wide. Despite of the high kurtosis, rest of the
objective measures were considered approximately normally distributed.
Table 8. Descriptives for business performance items
N Minimum Maximum Mean Std.
Deviation Skewness Kurtosis
Statistic Statistic Statistic Statistic Statistic Statistic Std. Error Statistic Std. Error
OR_EMP 275 5,92 1130,15 121,960 109,6929 4,348 ,147 29,349 ,293
OR_EMP_Log 275 ,77 3,05 1,9853 ,28727 -,036 ,147 2,607 ,293
PL_EMP 279 -87,58 63,32 7,3182 15,72080 -,751 ,146 10,698 ,291
RTA_MEAN 280 -87,85 60,96 11,0155 18,64962 -,659 ,146 4,006 ,290
PMA_MEAN 276 -69,45 45,98 4,9624 12,03027 -1,733 ,147 11,459 ,292
GROW_MEAN 251 -35,82 276,42 20,6847 35,92547 3,291 ,154 15,726 ,306
Figure 10 shows the mean values for business performance items for
different industries in domestic context. It can be seen that the operating
revenue is high for furniture industry, profit creation per employee as well
as return on assets is the lowest.
There is also a clear difference between conventional industries, metal,
furniture and food, and modern/service industries, software and KIBS. The

56 Janne Andberg, Master’s Thesis
later shows much higher profit rates per employee, higher return on
assets, as well as higher growth rates.
Figure 10. Mean values for business performance items for different industries in domestic context.
Figure 11 indicates the situation for international companies, which is
rather similar. Profit levels per employee are on clearly higher level (26%
on average), only furniture industry showing lower values (-35%). Return
on assets and profit margins are clearly lower for metal and furniture
industries, which could be explained by high growth levels (60% average
on both). It is interesting to see that KIBS growth is high for domestic
market but rather low for international market.
Figure 11. Mean values for business performance items for different industries in international context.
0
5
10
15
20
25
30
35
OR_EMP_Log P/L_EMP RTA_MEAN PMA_MEAN GROW_MEAN
Software Metal Furniture Food KIBS
0
5
10
15
20
25
30
35
OR_EMP_Log P/L_EMP RTA_MEAN PMA_MEAN GROW_MEAN
Software Metal Furniture Food KIBS

4. Results and findings 57
4.2 Scale descriptive analysis
Summated scales are formed by combining several variables into a single
composite measure according to the strategic orientation dimensions, in
order to represent multiple aspects of a concept in a single measure.
Summated scales have already been used for the previous descriptive
analysis, as it makes the comparison relatively simple.
As indicated in the theory, there is a high risk for multicollinearity when
using summated scales for strategic orientation. Meaning that the different
strategic orientation dimensions would measure same construct and thus
correlate with each other. This would increase the variance of the
coefficient estimates and make the estimates very sensitive to minor
changes.
Table 9 presents pearson correlation values for the different strategic
orientation dimensions. Cronbach's alpha coefficients for inter-item
reliability are on the diagonal in parentheses.
It can be seen that the alpha values are all above required 0,7. However,
the correlation between the dimensions is not only significant but also on
rather high level. Both learning orientation dimensions correlate with
entrepreneurial orientation (especially innovativeness, risk-taking and
autonomy) and market orientation (especially customer orientation and
interfunctional coordination).
Similar way entrepreneurial orientation correlates on average ,346 with
market orientation. The highest correlation is found for EO competitive
aggressiveness and competitor orientation.
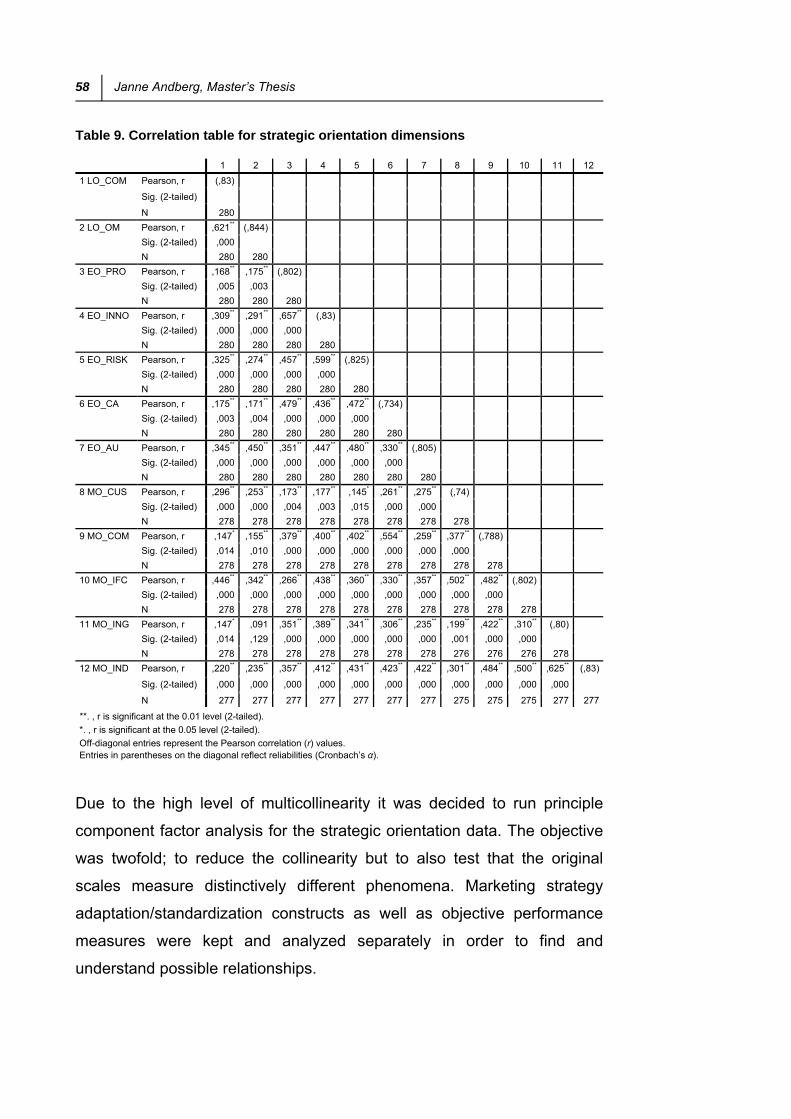
58 Janne Andberg, Master’s Thesis
Table 9. Correlation table for strategic orientation dimensions
1 2 3 4 5 6 7 8 9 10 11 12
1 LO_COM Pearson, r (,83)
Sig. (2-tailed)
N 280
2 LO_OM Pearson, r ,621** (,844)
Sig. (2-tailed) ,000
N 280 280
3 EO_PRO Pearson, r ,168** ,175** (,802)
Sig. (2-tailed) ,005 ,003
N 280 280 280
4 EO_INNO Pearson, r ,309** ,291** ,657** (,83)
Sig. (2-tailed) ,000 ,000 ,000
N 280 280 280 280
5 EO_RISK Pearson, r ,325** ,274** ,457** ,599** (,825)
Sig. (2-tailed) ,000 ,000 ,000 ,000
N 280 280 280 280 280
6 EO_CA Pearson, r ,175** ,171** ,479** ,436** ,472** (,734)
Sig. (2-tailed) ,003 ,004 ,000 ,000 ,000
N 280 280 280 280 280 280
7 EO_AU Pearson, r ,345** ,450** ,351** ,447** ,480** ,330** (,805)
Sig. (2-tailed) ,000 ,000 ,000 ,000 ,000 ,000
N 280 280 280 280 280 280 280
8 MO_CUS Pearson, r ,296** ,253** ,173** ,177** ,145* ,261** ,275** (,74)
Sig. (2-tailed) ,000 ,000 ,004 ,003 ,015 ,000 ,000
N 278 278 278 278 278 278 278 278
9 MO_COM Pearson, r ,147* ,155** ,379** ,400** ,402** ,554** ,259** ,377** (,788)
Sig. (2-tailed) ,014 ,010 ,000 ,000 ,000 ,000 ,000 ,000
N 278 278 278 278 278 278 278 278 278
10 MO_IFC Pearson, r ,446** ,342** ,266** ,438** ,360** ,330** ,357** ,502** ,482** (,802)
Sig. (2-tailed) ,000 ,000 ,000 ,000 ,000 ,000 ,000 ,000 ,000
N 278 278 278 278 278 278 278 278 278 278
11 MO_ING Pearson, r ,147* ,091 ,351** ,389** ,341** ,306** ,235** ,199** ,422** ,310** (,80)
Sig. (2-tailed) ,014 ,129 ,000 ,000 ,000 ,000 ,000 ,001 ,000 ,000
N 278 278 278 278 278 278 278 276 276 276 278
12 MO_IND Pearson, r ,220** ,235** ,357** ,412** ,431** ,423** ,422** ,301** ,484** ,500** ,625** (,83)
Sig. (2-tailed) ,000 ,000 ,000 ,000 ,000 ,000 ,000 ,000 ,000 ,000 ,000
N 277 277 277 277 277 277 277 275 275 275 277 277
**. , r is significant at the 0.01 level (2-tailed).
*. , r is significant at the 0.05 level (2-tailed).
Off-diagonal entries represent the Pearson correlation (r) values. Entries in parentheses on the diagonal reflect reliabilities (Cronbach’s α).
Due to the high level of multicollinearity it was decided to run principle
component factor analysis for the strategic orientation data. The objective
was twofold; to reduce the collinearity but to also test that the original
scales measure distinctively different phenomena. Marketing strategy
adaptation/standardization constructs as well as objective performance
measures were kept and analyzed separately in order to find and
understand possible relationships.

4. Results and findings 59
4.3 Construct operationalization
Principle component analysis (PCA) with Varimax orthogonal rotation was
conducted for all items measuring the respective dimensions of each
strategic orientation construct, in order to assess the underlying factor
structure of the items and to improve unidimensionality, validity, and
reliability of the measures.
Scales were purified by eliminating all items, which displayed low factor
loadings on their theoretically assigned dimensions (i.e., EO:
innovativeness, proactiveness, risk-taking; MO: intelligence generation,
intelligence dissemination, responsiveness; LO: commitment to learning,
shared vision, open mindedness) and/or high cross-loadings on other
dimensions of the focal construct or of other constructs.
Table 10. Results for the extraction of component factors
Component
Initial Eigenvalues Extraction Sums of Squared
Loadings Rotation Sums of Squared
Loadings
Total % of
Variance Cumulative
% Total % of
Variance Cumulative
% Total % of
Variance Cumulative
%
1 11,311 27,588 27,588 11,311 27,588 27,588 3,564 8,692 8,692
2 3,557 8,676 36,263 3,557 8,676 36,263 3,415 8,330 17,023
3 2,882 7,030 43,293 2,882 7,030 43,293 3,163 7,714 24,736
4 2,132 5,200 48,493 2,132 5,200 48,493 3,142 7,663 32,399
5 1,745 4,257 52,750 1,745 4,257 52,750 2,832 6,908 39,308
6 1,592 3,882 56,632 1,592 3,882 56,632 2,812 6,858 46,165
7 1,399 3,411 60,043 1,399 3,411 60,043 2,681 6,540 52,705
8 1,220 2,977 63,019 1,220 2,977 63,019 2,660 6,487 59,192
9 1,025 2,499 65,519 1,025 2,499 65,519 2,594 6,326 65,519
10 ,959 2,339 67,858
... ... ... ...
41 ,157 ,382 100,000
Extraction Method: Principal Component Analysis with Varimax orthogonal rotation and Kaiser Normalization.
Table 10 shows the results for the extraction of component factors. Totally
nine factors have Eigenvalues >1 and explain cumulatively more than
65,5% of the variance. Varimax rotated final factor solutions are presented
in table 11. Of all the factors only one combines both entrepreneurial and
market orientation. However both strongly related to market competition.

60 Janne Andberg, Master’s Thesis
Table 11. Final factor solutions for strategic orientations
Component
1 2 3 4 5 6 7 8 9
LO_01 ,764
LO_02 ,732
LO_03 ,791
LO_04 ,784
LO_05 ,711
EO_01 ,764
EO_02 ,802
EO_03 ,763
EO_04
EO_05 ,643
EO_06
EO_07 ,779
EO_08 ,736
EO_09 ,636
EO_10 ,713
EO_11 ,607
EO_12 ,717
EO_13 ,746
EO_14 ,750
EO_15
MO_01 ,746
MO_02 ,778
MO_03 ,772
MO_04 ,700
MO_05
MO_06
MO_07 ,675
MO_08 ,687
MO_09
MO_10 ,660
MO_11 ,772
MO_12 ,676
MO_13
MO_27 ,726
MO_28 ,794
MO_29 ,737
MO_30
MO_31 ,660
MO_32 ,752
MO_33 ,612
MO_34 ,643
Extraction Method: Principal Component Analysis.
a. Varimax rotation converged in 8 iterations.
Factor analysis using the principal component analysis method yielded
nine factors, explaining 65,5% of the total variation. Communalities were
all above 0.50, and all factor loadings were above 0.60, indicating a
sufficient factoring result. Items EO_04, EO_06, EO_15, MO_05, MO_06,
MO_9, MO_13, and MO_ 30 were excluded from the further analysis.
4. Results and findings 61
Nine components extracted were:
1. LO commitment to learning and open-mindedness
2. EO proactiveness and innovativeness
3. EO risk-taking
4. EO competitive aggressiveness and MO competitor orientation
5. EO autonomy
6. MO customer orientation
7. MO interfunctional coordination
8. MO intelligence generation
9. MO intelligence dissemination
Kaiser-Meyer-Olkin measure of sampling adequacy was ,881 and Barlett’s
test Chi-Square 5589. Cronbach’s alpha values for the resulting subjective
scales were above 0.8. As inter-item and item-to-total-correlations all
exceeded 0.30 and 0.50, respectively, the measure was deemed
sufficiently reliable to be used in the analysis.
62 Janne Andberg, Master’s Thesis
4.4 Antecedents to business performance
The purpose of this chapter is to give an understanding for different
relationships in order to explain both strategic marketing decisions and
which variables lead to higher business performance. First strategic
orientations – marketing strategy relationship was studied using stepwise
linear regression analysis. Secondly the relationship between control
variables, strategic orientations, and marketing strategy with business
performance was studied using hierarchical multiple regression analysis.
Further on correlation tables are used for understanding the collinearity
between business performance constructs, and their relationship to
strategic orientations as well as marketing strategy in both
domestic/international context but also for different international industries
with the purpose to find mediating effect of marketing strategy on business
performance.
4.4.1 Hierarchical multiple regression for business performance
After studying the strategic orientations – marketing strategy models, the
possible relationship between strategic orientations, marketing strategy
and different performance indicators was studied. Stepwise hierarchical
multiple regression technique was used in order to capture also the effect
of control variables age and industry.
Operational revenue per employee (logarithmic)
Table 12 shows the model summary for predicting operational revenue per
employee. The first model (industry and firm age) explain 7,3% of the
variability significantly. The combined model explain 20% of variability in
the dependent variable that can be accounted for by all the predictors
together. However the combined model is not significant.

4. Results and findings 63
Table 12. Model summary, operational revenue per employee (logarithmic)
Model R R
Square Adjusted R
Square Std. Error of the Estimate
Change Statistics
R Square Change
F Change df1 df2
Sig. F Change
1 ,270a ,073 ,050 ,28001 ,073 3,155 2 80 ,048
2 ,447b ,200 ,021 ,28421 ,127 ,819 13 67 ,638
a. Predictors: (Constant), Industry, Age
b. Predictors: (Constant), Industry, Age, Strategic orientations (PCA), and marketing strategy adaptation/standardization
In this case most of the predictors were not statistically significant (table
13) and therefore only some of the coefficients are interpretable.
Table 13. Model coefficients, operational revenue per employee (logarithmic)
Model
Unstandardized
Coefficients
Standardized
Coefficients
t Sig. B Std. Error Beta
1 (Constant) 1,989 ,070 28,511 ,000
AGE_2011 ,003 ,001 ,261 2,317 ,023
Indust_5_fixed -,035 ,022 -,181 -1,610 ,111
2 (Constant) 1,731 ,260 6,652 ,000
AGE_2011 ,004 ,002 ,295 2,376 ,020
Indust_5_fixed -,052 ,025 -,265 -2,042 ,045
LO commitment and open-mindedness -,014 ,039 -,048 -,351 ,726
EO proactiveness and innovativeness ,020 ,036 ,068 ,545 ,587
EO risk-taking -,022 ,038 -,077 -,579 ,565
EO aggressiveness and MO competitor orientation ,059 ,037 ,205 1,593 ,116
EO autonomy ,010 ,037 ,034 ,263 ,794
MO customer orientation ,009 ,035 ,030 ,251 ,802
MO interfunctional coordination -,015 ,040 -,053 -,386 ,701
MO intelligence generation -,032 ,040 -,113 -,813 ,419
MO intelligence dissemination ,038 ,036 ,132 1,051 ,297
Product adaptation -,020 ,035 -,075 -,564 ,575
Price adaptation ,007 ,031 ,026 ,215 ,830
Adaptation of promotional approach ,028 ,030 ,127 ,928 ,356
Adaptation of channel structure ,048 ,018 ,355 2,640 ,010
The results indicate that older companies would have higher turnover per
employee and thus be more efficient. Also the type of industry makes a
significant difference. The last but maybe the most interesting is the
significant influence of channel structure (distribution) adaptation, meaning
that higher level distribution adaptation will result in higher turnover per
employee as well.

64 Janne Andberg, Master’s Thesis
Profit/loss per employee
Regression results for the next model are presented in table 14. The first
model accounted for 0,9% of the variation and the combined model only
8,6%. Neither the first model nor the second model predicted scores to a
statistically significant degree.
Table 14. Model summary, profit/loss per employee
Model R R
Square Adjusted R
Square Std. Error of the Estimate
Change Statistics
R Square Change
F Change df1 df2
Sig. F Change
1 ,097a ,009 -,015 15,84127 ,009 ,379 2 80 ,686
2 ,293b ,086 -,118 16,62584 ,077 ,433 13 67 ,952
a. Predictors: (Constant), Industry, Age
b. Predictors: (Constant), Industry, Age, Strategic orientations (PCA), and marketing strategy adaptation/standardization
The same can be found when looking at the model coefficients in table 15.
None of the predictors were statistically significant and therefore the
coefficients are not interpretable. Beta values for the independent
variables are on low level but related significance levels high, on average
,581.

4. Results and findings 65
Table 15. Model coefficients, profit/loss per employee
Model
Unstandardized
Coefficients
Standardized
Coefficients
t Sig. B Std. Error Beta
1 (Constant) 6,907 3,946 1,750 ,084
AGE_2011 ,072 ,085 ,098 ,845 ,400
Indust_5_fixed -,556 1,243 -,052 -,447 ,656
2 (Constant) -2,144 15,222 -,141 ,888
AGE_2011 ,090 ,097 ,124 ,935 ,353
Indust_5_fixed -,659 1,480 -,062 -,446 ,657
LO commitment and open-mindedness -3,038 2,280 -,193 -1,332 ,187
EO proactiveness and innovativeness ,781 2,105 ,050 ,371 ,712
EO risk-taking -,572 2,243 -,036 -,255 ,799
EO aggressiveness and MO competitor orientation 1,940 2,167 ,123 ,895 ,374
EO autonomy 2,155 2,150 ,137 1,002 ,320
MO customer orientation 1,188 2,038 ,076 ,583 ,562
MO interfunctional coordination ,327 2,327 ,021 ,141 ,889
MO intelligence generation -1,353 2,332 -,086 -,580 ,564
MO intelligence dissemination -1,074 2,118 -,068 -,507 ,614
Product adaptation 1,018 2,052 ,070 ,496 ,621
Price adaptation ,896 1,843 ,063 ,486 ,628
Adaptation of promotional approach -,951 1,780 -,078 -,534 ,595
Adaptation of channel structure ,680 1,068 ,092 ,637 ,526
Return on assets
Table 16 shows the model summary for predicting return on assets. The
first model (industry and firm age) explain only 0,4% of the variability and
not significantly. The combined model accounts for 8,3% of variability in
the dependent variable that can be accounted for by all the predictors
together. However also the combined model is not significant.
Table 16. Model summary, return on assets
Model R R
Square Adjusted R
Square Std. Error of the Estimate
Change Statistics
R Square Change
F Change df1 df2
Sig. F Change
1 ,066a ,004 -,020 18,83956 ,004 ,177 2 80 ,838
2 ,288b ,083 -,122 19,75506 ,079 ,443 13 67 ,947
a. Predictors: (Constant), Industry, Age
b. Predictors: (Constant), Industry, Age, Strategic orientations (PCA), and marketing strategy adaptation/standardization
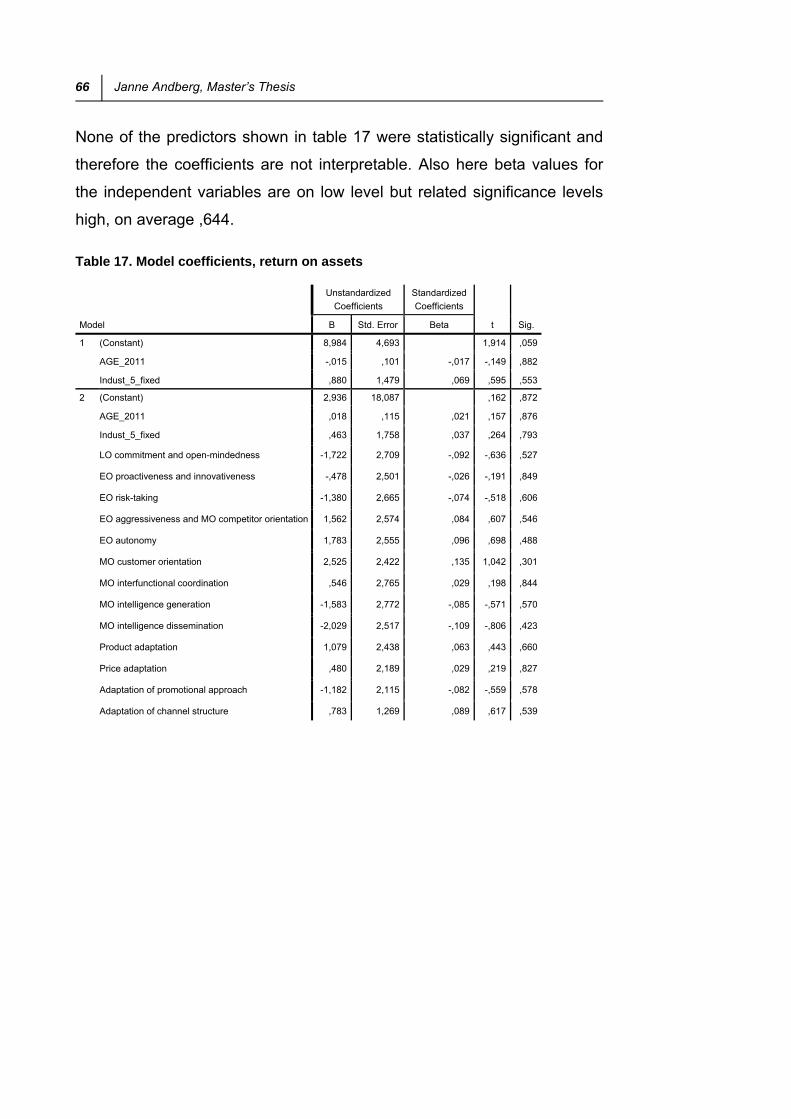
66 Janne Andberg, Master’s Thesis
None of the predictors shown in table 17 were statistically significant and
therefore the coefficients are not interpretable. Also here beta values for
the independent variables are on low level but related significance levels
high, on average ,644.
Table 17. Model coefficients, return on assets
Model
Unstandardized
Coefficients
Standardized
Coefficients
t Sig. B Std. Error Beta
1 (Constant) 8,984 4,693 1,914 ,059
AGE_2011 -,015 ,101 -,017 -,149 ,882
Indust_5_fixed ,880 1,479 ,069 ,595 ,553
2 (Constant) 2,936 18,087 ,162 ,872
AGE_2011 ,018 ,115 ,021 ,157 ,876
Indust_5_fixed ,463 1,758 ,037 ,264 ,793
LO commitment and open-mindedness -1,722 2,709 -,092 -,636 ,527
EO proactiveness and innovativeness -,478 2,501 -,026 -,191 ,849
EO risk-taking -1,380 2,665 -,074 -,518 ,606
EO aggressiveness and MO competitor orientation 1,562 2,574 ,084 ,607 ,546
EO autonomy 1,783 2,555 ,096 ,698 ,488
MO customer orientation 2,525 2,422 ,135 1,042 ,301
MO interfunctional coordination ,546 2,765 ,029 ,198 ,844
MO intelligence generation -1,583 2,772 -,085 -,571 ,570
MO intelligence dissemination -2,029 2,517 -,109 -,806 ,423
Product adaptation 1,079 2,438 ,063 ,443 ,660
Price adaptation ,480 2,189 ,029 ,219 ,827
Adaptation of promotional approach -1,182 2,115 -,082 -,559 ,578
Adaptation of channel structure ,783 1,269 ,089 ,617 ,539

4. Results and findings 67
Profit margin
Unfortunately the situation for profit margin is very similar to the previous
ones, table 18. The first model (industry and firm age) explain only 0,2% of
the variability and the combined model 8,9%. Neither of the models is
significant.
Table 18. Model summary, profit margin
Model R R
Square Adjusted R
Square Std. Error of the Estimate
Change Statistics
R Square Change
F Change df1 df2
Sig. F Change
1 ,048a ,002 -,023 12,16591 ,002 ,091 2 80 ,913
2 ,298b ,089 -,115 12,70474 ,086 ,489 13 67 ,923
a. Predictors: (Constant), Industry, Age
b. Predictors: (Constant), Industry, Age, Strategic orientations (PCA), and marketing strategy adaptation/standardization
None of the predictors (table 19) were statistically significant and therefore
the coefficients are not interpretable. Beta values are on low level but
related significance levels high, on average ,638.
Table 19. Model coefficients, profit margin
Model
Unstandardized
Coefficients
Standardized
Coefficients
t Sig. B Std. Error Beta
1 (Constant) 4,123 3,031 1,361 ,177
AGE_2011 ,025 ,065 ,045 ,387 ,700
Indust_5_fixed ,055 ,955 ,007 ,057 ,954
2 (Constant) 1,308 11,632 ,112 ,911
AGE_2011 ,036 ,074 ,064 ,487 ,628
Indust_5_fixed ,038 1,131 ,005 ,033 ,973
LO commitment and open-mindedness -1,816 1,742 -,151 -1,042 ,301
EO proactiveness and innovativeness -,331 1,609 -,027 -,206 ,838
EO risk-taking -,861 1,714 -,072 -,502 ,617
EO aggressiveness and MO competitor orientation ,249 1,656 ,021 ,150 ,881
EO autonomy 1,575 1,643 ,131 ,959 ,341
MO customer orientation 1,239 1,557 ,103 ,795 ,429
MO interfunctional coordination ,350 1,778 ,029 ,197 ,845
MO intelligence generation -,550 1,782 -,046 -,308 ,759
MO intelligence dissemination -,981 1,619 -,082 -,606 ,546
Product adaptation 1,398 1,568 ,126 ,892 ,376
Price adaptation ,489 1,408 ,045 ,347 ,729
Adaptation of promotional approach -1,230 1,360 -,132 -,904 ,369
Adaptation of channel structure -,363 ,816 -,064 -,445 ,658
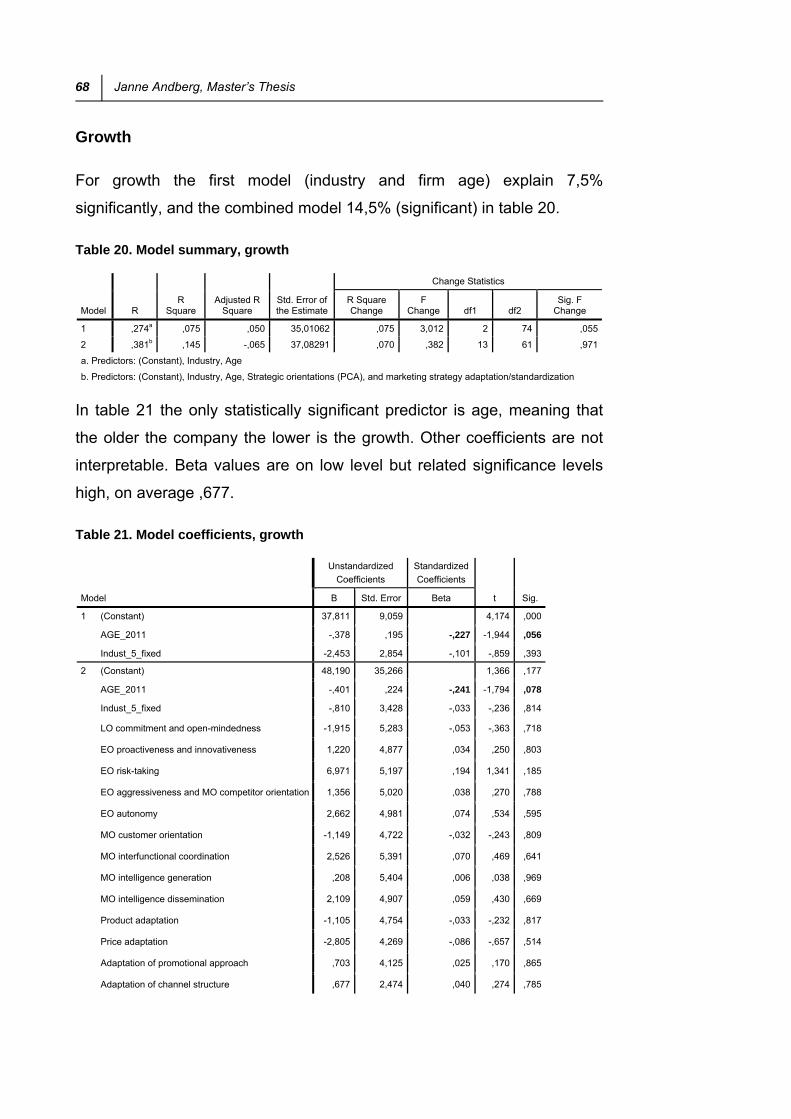
68 Janne Andberg, Master’s Thesis
Growth
For growth the first model (industry and firm age) explain 7,5%
significantly, and the combined model 14,5% (significant) in table 20.
Table 20. Model summary, growth
Model R R
Square Adjusted R
Square Std. Error of the Estimate
Change Statistics
R Square Change
F Change df1 df2
Sig. F Change
1 ,274a ,075 ,050 35,01062 ,075 3,012 2 74 ,055
2 ,381b ,145 -,065 37,08291 ,070 ,382 13 61 ,971
a. Predictors: (Constant), Industry, Age
b. Predictors: (Constant), Industry, Age, Strategic orientations (PCA), and marketing strategy adaptation/standardization
In table 21 the only statistically significant predictor is age, meaning that
the older the company the lower is the growth. Other coefficients are not
interpretable. Beta values are on low level but related significance levels
high, on average ,677.
Table 21. Model coefficients, growth
Model
Unstandardized
Coefficients
Standardized
Coefficients
t Sig. B Std. Error Beta
1 (Constant) 37,811 9,059 4,174 ,000
AGE_2011 -,378 ,195 -,227 -1,944 ,056
Indust_5_fixed -2,453 2,854 -,101 -,859 ,393
2 (Constant) 48,190 35,266 1,366 ,177
AGE_2011 -,401 ,224 -,241 -1,794 ,078
Indust_5_fixed -,810 3,428 -,033 -,236 ,814
LO commitment and open-mindedness -1,915 5,283 -,053 -,363 ,718
EO proactiveness and innovativeness 1,220 4,877 ,034 ,250 ,803
EO risk-taking 6,971 5,197 ,194 1,341 ,185
EO aggressiveness and MO competitor orientation 1,356 5,020 ,038 ,270 ,788
EO autonomy 2,662 4,981 ,074 ,534 ,595
MO customer orientation -1,149 4,722 -,032 -,243 ,809
MO interfunctional coordination 2,526 5,391 ,070 ,469 ,641
MO intelligence generation ,208 5,404 ,006 ,038 ,969
MO intelligence dissemination 2,109 4,907 ,059 ,430 ,669
Product adaptation -1,105 4,754 -,033 -,232 ,817
Price adaptation -2,805 4,269 -,086 -,657 ,514
Adaptation of promotional approach ,703 4,125 ,025 ,170 ,865
Adaptation of channel structure ,677 2,474 ,040 ,274 ,785

4. Results and findings 69
Subjective profitability
Table 22 shows the model summary for predicting subjective profitability,
which would be one of the most interesting parameters. The first model
(industry and firm age) does not explain any (0,0%) of the variability. The
combined model explain 8,5% of variability in the dependent variable. The
combined model is not significant.
Table 22. Model summary, subjective profitability
Model R R
Square Adjusted R
Square Std. Error of the Estimate
Change Statistics
R Square Change
F Change df1 df2
Sig. F Change
1 ,021a ,000 -,025 1,357 ,000 ,017 2 80 ,983
2 ,292b ,085 -,119 1,419 ,085 ,478 13 67 ,929
a. Predictors: (Constant), Industry, Age
b. Predictors: (Constant), Industry, Age, Strategic orientations (PCA), and marketing strategy adaptation/standardization
In table 23 none of the coefficients are interpretable. Beta values are on
low level but related significance levels high, on average ,617.
Table 23. Model coefficients, subjective profitability
Model
Unstandardized
Coefficients
Standardized
Coefficients
t Sig. B Std. Error Beta
1 (Constant) 4,442 ,338 13,136 ,000
AGE_2011 ,001 ,007 ,013 ,110 ,913
Indust_5_fixed -,018 ,107 -,020 -,174 ,863
2 (Constant) 4,153 1,299 3,197 ,002
AGE_2011 ,004 ,008 ,069 ,518 ,606
Indust_5_fixed -,098 ,126 -,108 -,779 ,439
LO commitment and open-mindedness ,151 ,195 ,112 ,774 ,442
EO proactiveness and innovativeness ,028 ,180 ,021 ,154 ,878
EO risk-taking -,281 ,191 -,209 -1,466 ,147
EO aggressiveness and MO competitor orientation ,213 ,185 ,159 1,154 ,253
EO autonomy ,093 ,183 ,069 ,507 ,614
MO customer orientation ,076 ,174 ,056 ,435 ,665
MO interfunctional coordination -,015 ,199 -,011 -,075 ,940
MO intelligence generation -,138 ,199 -,103 -,691 ,492
MO intelligence dissemination -,032 ,181 -,024 -,179 ,858
Product adaptation ,009 ,175 ,007 ,049 ,961
Price adaptation ,034 ,157 ,028 ,217 ,829
Adaptation of promotional approach -,041 ,152 -,040 -,271 ,787
Adaptation of channel structure ,085 ,091 ,134 ,932 ,355

70 Janne Andberg, Master’s Thesis
4.4.2 Correlation tables for business performance
Due to the fact that it was almost impossible to find any correlation in
regression models for strategic orientations and business performance, as
well as marketing strategy adaptation/standardization and business
performance, it was decided to study the correlations in detail for domestic
and international context. Further correlations between marketing strategy
adaptation/standardization and business performance were studied in
detail for the different industries.
Table 24 indicates first of all that subjective profitability significantly
correlates with profitability related objective measures, effective profit/loss,
return on assets and profit margin (R ~,5), and effective operating revenue
(R ,24).
Table 24. Correlation table for domestic business performance
1
OR_EM_Log
2
PL_EMP
3
RTA
4
PMA
5
GROW
6
SUBJ_PRO
1 Operating revenue per employee (log) 1
2 Profit/loss per employeee ,367** 1
3 Return on assets ,130 ,779** 1
4 Profit margin ,154* ,839** ,904** 1
5 Average growth -,164* -,126 -,078 -,182* 1
6 Subjective profitability ,239** ,488** ,509** ,512** -,097 1
LO commitment and open-mindedness -,018 -,123 -,052 -,099 -,022 -,006
EO proactiveness and innovativeness -,048 -,085 -,105 -,100 ,000 ,002
EO risk-taking ,021 -,155* -,187* -,190* ,147 -,261**
EO aggressiveness and MO competitor orientation ,153 ,071 ,027 ,008 ,109 ,097
EO autonomy ,038 ,057 ,039 ,062 ,073 ,080
MO customer orientation ,022 -,036 ,082 ,047 -,064 ,058
MO interfunctional coordination ,179* ,071 ,023 ,003 -,010 -,027
MO intelligence generation ,068 -,037 -,057 -,035 ,038 ,001
MO intelligence dissemination ,085 -,065 -,105 -,065 ,126 -,068
Product adaptation -,011 ,094 ,066 ,092 ,025 ,034
Price adaptation ,029 ,071 ,085 ,082 -,066 -,033
Adaptation of promotional approach ,111 -,010 -,037 -,040 ,029 -,047
Adaptation of channel structure .d .d .d .d .d .d
**. Correlation is significant at the 0.01 level (2-tailed).
*. Correlation is significant at the 0.05 level (2-tailed).
d. Cannot be computed because at least one of the variables is constant.
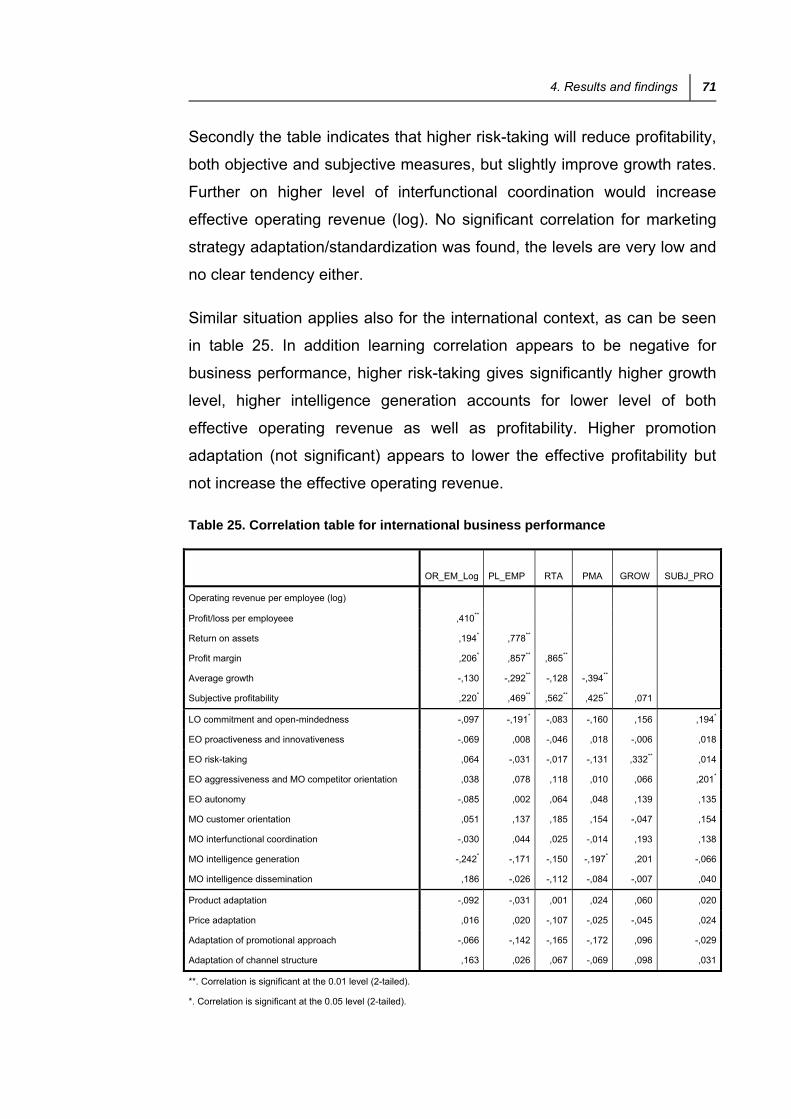
4. Results and findings 71
Secondly the table indicates that higher risk-taking will reduce profitability,
both objective and subjective measures, but slightly improve growth rates.
Further on higher level of interfunctional coordination would increase
effective operating revenue (log). No significant correlation for marketing
strategy adaptation/standardization was found, the levels are very low and
no clear tendency either.
Similar situation applies also for the international context, as can be seen
in table 25. In addition learning correlation appears to be negative for
business performance, higher risk-taking gives significantly higher growth
level, higher intelligence generation accounts for lower level of both
effective operating revenue as well as profitability. Higher promotion
adaptation (not significant) appears to lower the effective profitability but
not increase the effective operating revenue.
Table 25. Correlation table for international business performance
OR_EM_Log PL_EMP RTA PMA GROW SUBJ_PRO
Operating revenue per employee (log)
Profit/loss per employeee ,410**
Return on assets ,194* ,778**
Profit margin ,206* ,857** ,865**
Average growth -,130 -,292** -,128 -,394**
Subjective profitability ,220* ,469** ,562** ,425** ,071
LO commitment and open-mindedness -,097 -,191* -,083 -,160 ,156 ,194*
EO proactiveness and innovativeness -,069 ,008 -,046 ,018 -,006 ,018
EO risk-taking ,064 -,031 -,017 -,131 ,332** ,014
EO aggressiveness and MO competitor orientation ,038 ,078 ,118 ,010 ,066 ,201*
EO autonomy -,085 ,002 ,064 ,048 ,139 ,135
MO customer orientation ,051 ,137 ,185 ,154 -,047 ,154
MO interfunctional coordination -,030 ,044 ,025 -,014 ,193 ,138
MO intelligence generation -,242* -,171 -,150 -,197* ,201 -,066
MO intelligence dissemination ,186 -,026 -,112 -,084 -,007 ,040
Product adaptation -,092 -,031 ,001 ,024 ,060 ,020
Price adaptation ,016 ,020 -,107 -,025 -,045 ,024
Adaptation of promotional approach -,066 -,142 -,165 -,172 ,096 -,029
Adaptation of channel structure ,163 ,026 ,067 -,069 ,098 ,031
**. Correlation is significant at the 0.01 level (2-tailed).
*. Correlation is significant at the 0.05 level (2-tailed).
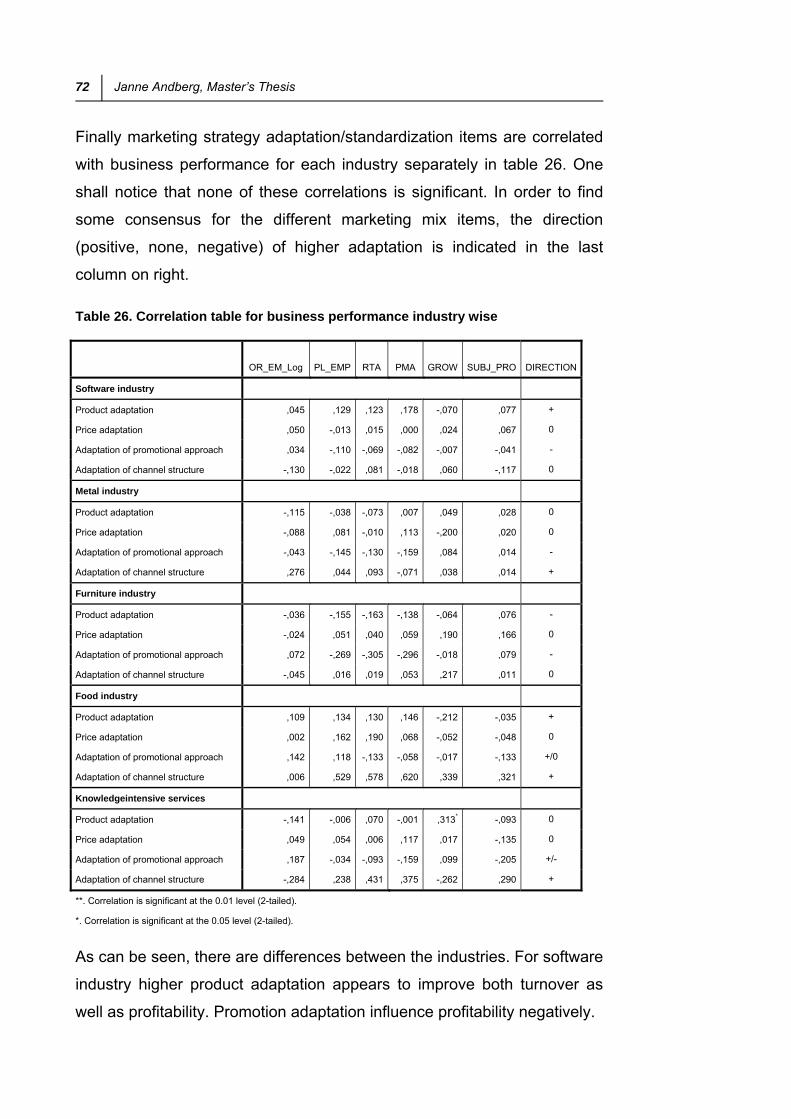
72 Janne Andberg, Master’s Thesis
Finally marketing strategy adaptation/standardization items are correlated
with business performance for each industry separately in table 26. One
shall notice that none of these correlations is significant. In order to find
some consensus for the different marketing mix items, the direction
(positive, none, negative) of higher adaptation is indicated in the last
column on right.
Table 26. Correlation table for business performance industry wise
OR_EM_Log PL_EMP RTA PMA GROW SUBJ_PRO DIRECTION
Software industry
Product adaptation ,045 ,129 ,123 ,178 -,070 ,077 +
Price adaptation ,050 -,013 ,015 ,000 ,024 ,067 0
Adaptation of promotional approach ,034 -,110 -,069 -,082 -,007 -,041 -
Adaptation of channel structure -,130 -,022 ,081 -,018 ,060 -,117 0
Metal industry
Product adaptation -,115 -,038 -,073 ,007 ,049 ,028 0
Price adaptation -,088 ,081 -,010 ,113 -,200 ,020 0
Adaptation of promotional approach -,043 -,145 -,130 -,159 ,084 ,014 -
Adaptation of channel structure ,276 ,044 ,093 -,071 ,038 ,014 +
Furniture industry
Product adaptation -,036 -,155 -,163 -,138 -,064 ,076 -
Price adaptation -,024 ,051 ,040 ,059 ,190 ,166 0
Adaptation of promotional approach ,072 -,269 -,305 -,296 -,018 ,079 -
Adaptation of channel structure -,045 ,016 ,019 ,053 ,217 ,011 0
Food industry
Product adaptation ,109 ,134 ,130 ,146 -,212 -,035 +
Price adaptation ,002 ,162 ,190 ,068 -,052 -,048 0
Adaptation of promotional approach ,142 ,118 -,133 -,058 -,017 -,133 +/0
Adaptation of channel structure ,006 ,529 ,578 ,620 ,339 ,321 +
Knowledgeintensive services
Product adaptation -,141 -,006 ,070 -,001 ,313* -,093 0
Price adaptation ,049 ,054 ,006 ,117 ,017 -,135 0
Adaptation of promotional approach ,187 -,034 -,093 -,159 ,099 -,205 +/-
Adaptation of channel structure -,284 ,238 ,431 ,375 -,262 ,290 +
**. Correlation is significant at the 0.01 level (2-tailed).
*. Correlation is significant at the 0.05 level (2-tailed).
As can be seen, there are differences between the industries. For software
industry higher product adaptation appears to improve both turnover as
well as profitability. Promotion adaptation influence profitability negatively.

4. Results and findings 73
For metal industry the promotion adaptation does not increase revenue
but reduces profitability. Adaptation of channel structure increases
turnover.
Product adaptation in furniture industry influence both revenue and
profitability negatively, whereas for the food industry the effect is vis-a-
versa. In addition promotion adaptation in furniture industry reduces
profitability.
For KIBS adaptation of promotional approach appears to increase
turnover but tends to influence profitability negatively. Finally the
adaptation of channel structure reduces turnover but gives higher
profitability.
4.4.3 Strategic orientations - marketing strategy linear regression
In this part tries to capture and explain how strategic orientations are
influencing marketing strategy decisions in both domestic and international
context.
Product adaptation
Based on the table 27 there are in total three significant strategic
orientations which can explain domestic product adaptation decision (R
,446). The strongest variable is the intelligence generation (Beta ,319), the
second variable customer orientation (Beta ,256) and third one
interfunctional coordination (Beta ,146).
Table 27. Linear regression analysis, product adaptation (domestic)
Dependent variable R R2 Adj. R2 Std.Error
Product adaptation ,446 ,199 ,183 ,941
Independent variable B Beta t Sig.
MO intelligence generation ,306 ,319 4,357 ,000
MO customer orientation ,284 ,256 3,495 ,001
MO interfunctional coordination ,161 ,146 1,989 ,049

74 Janne Andberg, Master’s Thesis
Similar relationships with lower explanation rate was found for
international product adaptation decision (R ,299) in table 28. The
strongest variable being interfunctional coordination (Beta ,231) and the
second intelligence generation (Beta ,204).
Table 28. Regression analysis, Product adaptation (international)
Dependent variable R R2 Adj. R2 Std.Error
Product adaptation ,299 ,090 ,071 1,109
Independent variable B Beta t Sig.
MO interfunctional coordination ,246 ,231 2,420 ,017
MO intelligence generation ,279 ,204 2,130 ,036
Price adaptation
Price adaptation was modeled the same way using linear regression. No
significant variables were found to explain pricing decisions neither for
domestic nor international firms.
Promotion adaptation
Promotion adaptation model for domestic firms has a rather good
explanation rate (R ,502) again with the same independent variables;
intelligence generation (Beta ,390) and interfunctional coordination (Beta
,309), as seen in table 29.
Table 29. Regression analysis, Promotion adaptation (domestic)
Dependent variable R R2 Adj. R2 Std.Error
Promotion adaptation ,502 ,252 ,242 1,186
Independent variable B Beta t Sig.
MO intelligence generation ,490 ,390 5,536 ,000
MO interfunctional coordination ,446 ,309 4,390 ,000

4. Results and findings 75
For the international companies the promotion adaptation model has even
higher explanation rate (R ,561) in table 30, but some new independent
variables; interfunctional coordination (Beta ,399), intelligence
dissemination (Beta ,334), competitive aggressiveness and competitor
orientation (Beta -,228), and proactiveness and innovativeness (Beta
,208).
Table 30. Regression analysis, Promotion adaptation (international)
Dependent variable R R2 Adj. R2 Std.Error
Promotion adaptation ,561 ,315 ,287 ,994
Independent variable B Beta t Sig.
MO interfunctional coordination ,435 ,399 4,455 ,000
MO intelligence dissemination ,421 ,334 3,972 ,000
EO aggressiveness and MO competitor orientation
-,267 -,228 -2,564 ,012
EO proactiveness and innovativeness ,293 ,208 2,456 ,016
Distribution adaptation
Finally distribution adaptation was also modeled using linear regression.
Data was only available for international market.
Table 31. Regression analysis, Distribution adaptation (international)
Dependent variable R R2 Adj. R2 Std.Error
Distribution adaptation ,308 ,095 ,084 2,027
Independent variable B Beta t Sig.
EO risk-taking ,602 ,308 2,952 ,004
In table 33 the explanation rate is relatively low (R ,308) and only a single
variable, risk-taking (Beta ,308) was significant for the model.

76 Janne Andberg, Master’s Thesis
4.4.4 Moderator regression analysis
Moderated multiple regression analysis was used to detect causal
moderators, meaning how the marketing strategy adaptation/
standardization would weaken or strengthen the relationship between
strategic orientations and business performance. Although the model
explanation rates are relatively high, none of the following models was
significant.
Table 32. Moderator regression analysis, Operating revenue per employee (log)
Dependent variable R R2 Adj. R2 Sig.
Operating revenue per employee (log) ,501 ,264 ,005 ,683
Independent variable B Beta t Sig.
Risk-taking * distribution adaptation ,449 ,044 4,70 ,003
Intelligence dissemination *
Promotion adaptation
-,673 -,077 2,85 ,096
Higher distribution adaptation in table 32 enhance the effect of risk-taking
on revenue per employee whereas promotion adaptation will diminish the
effect of intelligence dissemination on the effective revenue.
Table 33. Moderator regression analysis, Profit/loss per employeee
Dependent variable R R2 Adj. R2 Sig.
Profit/loss per employeee ,575 ,332 ,005 ,304
Independent variable B Beta T Sig.
EO proactiveness and innovativeness * Product adaptation
-68,43 -8,81 4,55 ,037
MO interfunctional coordination * Promotion adaptation
-28,94 -3,72 3,69 ,060
MO intelligence generation * Price adaptation 71,11 7,89 5,79 ,019
MO intelligence dissemination * Price adaptation
46,05 5,29 5,22 ,026
In table 33 product adaptation will diminish the effect of proactiveness and
innovativeness on effective profitability. The same applies to promotion
adaptation on interfunctional coordination, whereas price adaptation
enhances the effect of both intelligence generation and intelligence
dissemination on profit/loss per employee.
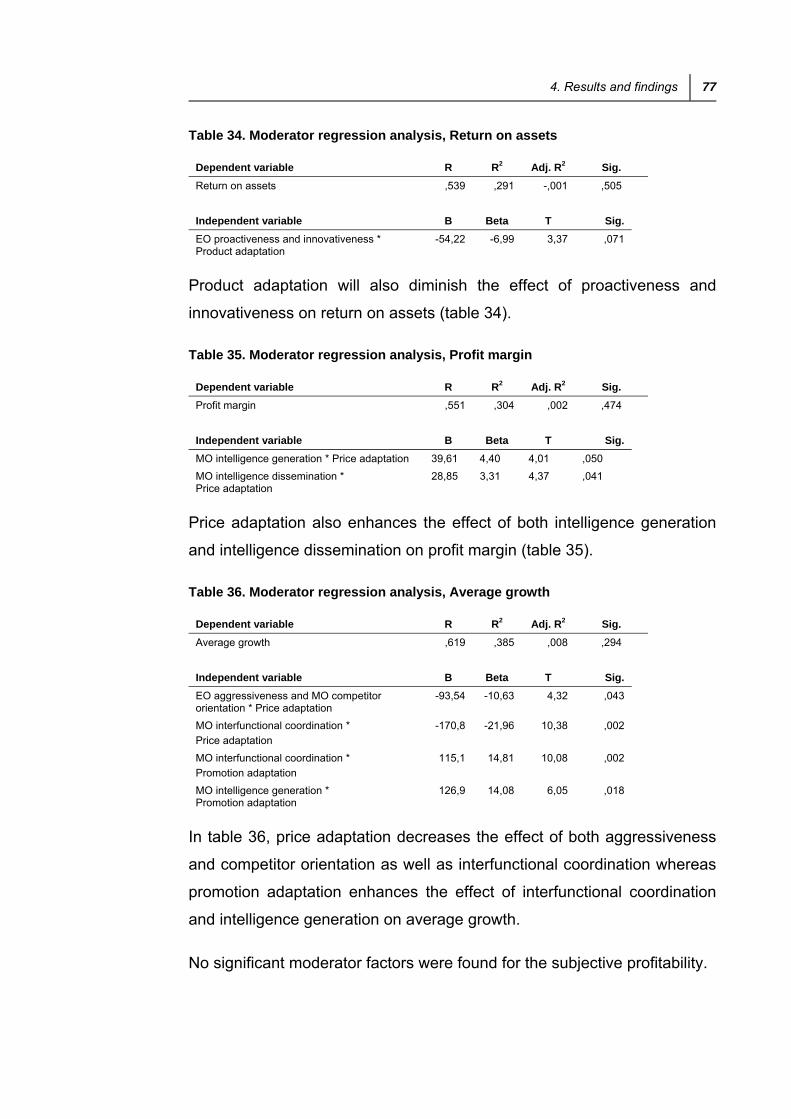
4. Results and findings 77
Table 34. Moderator regression analysis, Return on assets
Dependent variable R R2 Adj. R2 Sig.
Return on assets ,539 ,291 -,001 ,505
Independent variable B Beta T Sig.
EO proactiveness and innovativeness * Product adaptation
-54,22 -6,99 3,37 ,071
Product adaptation will also diminish the effect of proactiveness and
innovativeness on return on assets (table 34).
Table 35. Moderator regression analysis, Profit margin
Dependent variable R R2 Adj. R2 Sig.
Profit margin ,551 ,304 ,002 ,474
Independent variable B Beta T Sig.
MO intelligence generation * Price adaptation 39,61 4,40 4,01 ,050
MO intelligence dissemination * Price adaptation
28,85 3,31 4,37 ,041
Price adaptation also enhances the effect of both intelligence generation
and intelligence dissemination on profit margin (table 35).
Table 36. Moderator regression analysis, Average growth
Dependent variable R R2 Adj. R2 Sig.
Average growth ,619 ,385 ,008 ,294
Independent variable B Beta T Sig.
EO aggressiveness and MO competitor orientation * Price adaptation
-93,54 -10,63 4,32 ,043
MO interfunctional coordination *
Price adaptation
-170,8 -21,96 10,38 ,002
MO interfunctional coordination *
Promotion adaptation
115,1 14,81 10,08 ,002
MO intelligence generation * Promotion adaptation
126,9 14,08 6,05 ,018
In table 36, price adaptation decreases the effect of both aggressiveness
and competitor orientation as well as interfunctional coordination whereas
promotion adaptation enhances the effect of interfunctional coordination
and intelligence generation on average growth.
No significant moderator factors were found for the subjective profitability.

78 Janne Andberg, Master’s Thesis
4.4.5 Mediation regression Analysis
Due to the insignificant and low level of correlation, especially between
marketing strategy adaptation/standardization and business performance,
it was decided not to study the mediation effect.
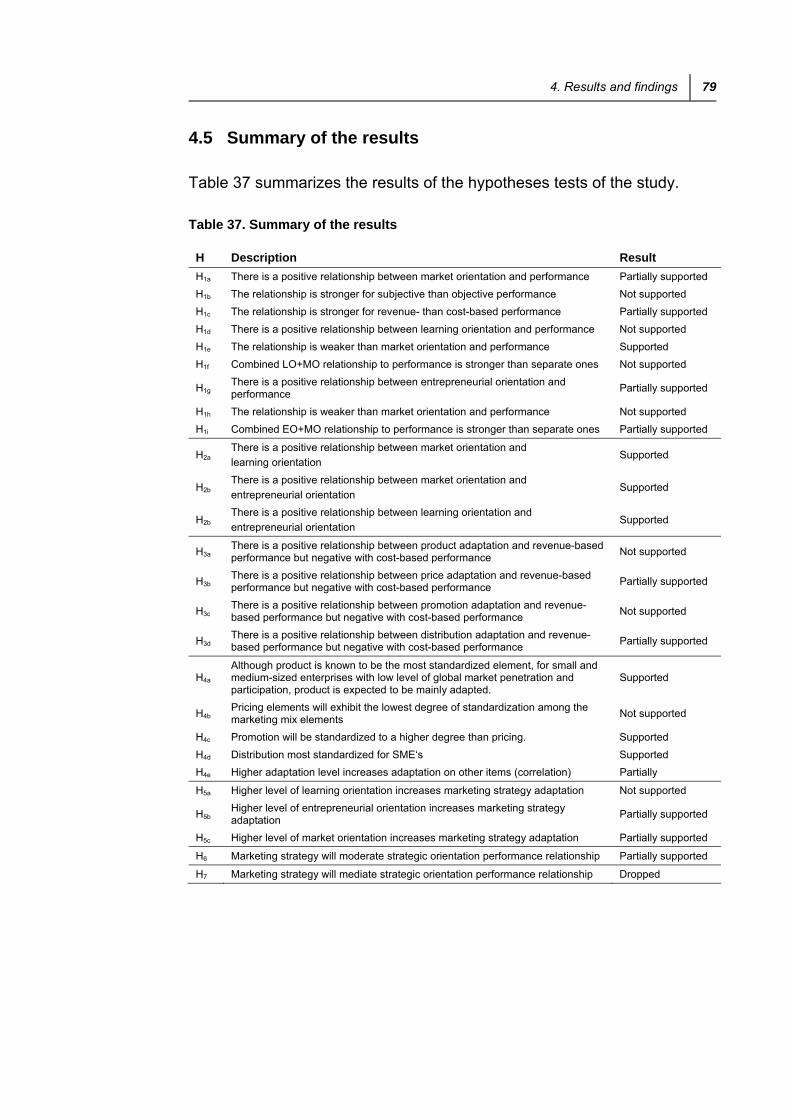
4. Results and findings 79
4.5 Summary of the results
Table 37 summarizes the results of the hypotheses tests of the study.
Table 37. Summary of the results
H Description Result
H1a There is a positive relationship between market orientation and performance Partially supported
H1b The relationship is stronger for subjective than objective performance Not supported
H1c The relationship is stronger for revenue- than cost-based performance Partially supported
H1d There is a positive relationship between learning orientation and performance Not supported
H1e The relationship is weaker than market orientation and performance Supported
H1f Combined LO+MO relationship to performance is stronger than separate ones Not supported
H1g There is a positive relationship between entrepreneurial orientation and performance
Partially supported
H1h The relationship is weaker than market orientation and performance Not supported
H1i Combined EO+MO relationship to performance is stronger than separate ones Partially supported
H2a There is a positive relationship between market orientation and
learning orientation Supported
H2b There is a positive relationship between market orientation and
entrepreneurial orientation Supported
H2b There is a positive relationship between learning orientation and
entrepreneurial orientation Supported
H3a There is a positive relationship between product adaptation and revenue-based performance but negative with cost-based performance
Not supported
H3b There is a positive relationship between price adaptation and revenue-based performance but negative with cost-based performance
Partially supported
H3c There is a positive relationship between promotion adaptation and revenue-based performance but negative with cost-based performance
Not supported
H3d There is a positive relationship between distribution adaptation and revenue-based performance but negative with cost-based performance
Partially supported
H4a Although product is known to be the most standardized element, for small and medium-sized enterprises with low level of global market penetration and participation, product is expected to be mainly adapted.
Supported
H4b Pricing elements will exhibit the lowest degree of standardization among the marketing mix elements
Not supported
H4c Promotion will be standardized to a higher degree than pricing. Supported
H4d Distribution most standardized for SME‘s Supported
H4e Higher adaptation level increases adaptation on other items (correlation) Partially
H5a Higher level of learning orientation increases marketing strategy adaptation Not supported
H5b Higher level of entrepreneurial orientation increases marketing strategy adaptation
Partially supported
H5c Higher level of market orientation increases marketing strategy adaptation Partially supported
H6 Marketing strategy will moderate strategic orientation performance relationship Partially supported
H7 Marketing strategy will mediate strategic orientation performance relationship Dropped

80 Janne Andberg, Master’s Thesis
5 Discussion
The thesis aims at contributing to the international marketing research by
investigating the relationship between different strategic orientation
dimensions and marketing mix standardization/adaptation, and their
influence on different concepts of business performance. In this final
chapter the results of the study and their implications to theory and
practice are discussed. Further, the limitations of the study and
suggestions for future research are presented.
5.1 Discussion of the results
As prior literature has demonstrated, a positive relationship between
market orientation and business performance was expected. Further on
entrepreneurial orientation are shown to associate positively with
performance but learning orientation not.
The relationship between marketing strategy and performance assumes
that a particular strategy (adaptation or standardization) enhances
performance, while the other inhibits it. This however seems theoretically
and pragmatically inappropriate.
As Cadogan (2012) points out, business performance is often used as
single composite although a clear difference between revenue,
profitability, and growth related measures exist. In this study each
performance component is studied separately which makes interpretation
challenging.
In this study market orientation dimensions, customer orientation and
interfunctional coordination, are positively associated with revenue and
profitability related performance, whereas negatively with growth. High
level of intelligence generation and dissemination influences negatively
especially profitability related performance. Above tendencies are not
stronger for subjective performance, and neither clearly stronger for
revenue based performance.

5. Discussion 81
Slightly surprisingly learning orientation correlates negatively with most of
the business performance measures, except with subjective profitability in
international context. This could be explained by the high level of learning
orientation in the sample data, meaning that too high level of learning
orientation would start to decrease the performance measures, as
suggested by Cadogan et al. (2009). At least the data is suggesting that
combining learning orientation with market orientation, would give reduced
level of business performance.
Entrepreneurial orientation proactiveness and innovativeness give mixed
and insignificant low level explanation rates, meaning that there is no clear
evidence. Higher level of risk-taking however increases growth,
significantly on international companies, and reduces profitability
measures. Risk-taking appears to slightly improve turnover per employee.
Entrepreneurial autonomy and entrepreneurial aggressiveness combined
with competitor orientation both give positive low level correlation between
all business performance measures. Therefor it appears that
entrepreneurial orientation combined with market orientation gives higher
level of business performance.
When studying all strategic orientations in relation to each other, it was
found that all strategic orientation dimensions (summated scales)
correlated positively and significantly with each other, indicating
multicollinearity issues.
For the marketing strategy adaptation/standardization it could not be
proved that either adaptation or standardization is better in terms of
business performance. For product and pricing the result was mixed at
insignificant low level of explanation rate. Adaptation of promotional
approach in tendency reduced profitability but increased sales and growth.
It is important to notice that there were remarkable variation on the
explanation rate and direction between the industries, meaning that higher
adaptation was shown to be more profitable for software, food and KIBS
82 Janne Andberg, Master’s Thesis
industries, whereas higher standardization was more beneficial for
furniture industry.
Although it was expected that either learning orientation and
entrepreneurial orientation in combination with market orientation would
result in better business performance, it could not be proved for learning
orientation. Entrepreneurial orientation dimensions were showing clear
tendencies as discussed above.
Marketing strategy adaptation/standardization was found to moderate
strategic orientation – performance relationship. Both higher promotion
and price adaptation either enhanced or diminished the strength of SO
business performance relationship on high level, whereas distribution
adaptation strengthens and product adaptation reduces related
relationships.
Due to the insignificant and lower correlation level between marketing
strategy adaptation/standardization and business performance, compared
to strategic orientations and business performance, the meditation
analysis was dropped. Based on the values, no meditation effect was
expected.
Of the control parameters, age explains partially the difference in revenue
per employee, meaning that older companies have higher revenue levels
and these at higher efficiency. Different industries were also find to explain
differences in revenue per employee but mainly explaining differences in
marketing strategy adaptation/standardization and business performance.
Although differences between domestic and international companies exist,
the differences were found to be relatively low.

5. Discussion 83
5.2 Answering research questions
One critical indication in this study is that the business performance
measure shall consist of both objective and subjective measures. These
measures shall also include both revenue, profitability and growth related
items. It is risky to combine those as they all represent different concepts,
and thus the interpretation of the result gets very complicated.
The relationship between strategic orientations and business performance
exists, and is shown to be positive. However, this study also shows that
different strategic orientations and their dimensions behave differently,
even contradictory. The thesis give further support for the assumption that
the relationship between SO’s and performance is not linear but starts to
decrease at certain level of the strategic orientation.
It is known that higher marketing strategy standardization reduces related
costs but the same time, especially in international markets, market
demand defines the level of adaptation required. Both adaptation and
standardization are known to improve business performance. In general it
could be expected that higher adaptation helps in increasing sales, thus
revenue, but increased cost would reduce profitability. As adaptation and
standardization are often conflicting factors, more detailed understanding,
conceptualization and measurement scales are needed.
In this study it has been shown that marketing strategy adaptation/
standardization moderates the relationship between strategic orientations
and performance. Though there are many strategic dimensions and
business performance variables, and thus the tendencies are not clear.
In general the differences between domestic and international companies
were surprisingly low.

84 Janne Andberg, Master’s Thesis
5.3 Implications
Managerial implications
This study has illustrated the variety and complexity of issues that the
research are covers. The findings suggest that the strategic orientations
have significant effects on business performance, and if appropriately
managed, those will provide valuable opportunities for small and medium
size enterprises.
The findings also suggest that still in this age of global markets, cultural
characteristics remain significant shapers of consumer behavior, meaning
that local practices and attitudes still need to be accommodated when
implementing marketing strategies.
The theory suggest that all of the strategic orientation dimensions are
expected to improve the performance of a firm. It is though important to
understand which strategic orientation dimension influence which
performance parameter. The same applies both for adaptation and
standardization. The main implication for managers is to understand to
what extent any strategic orientation dimension or marketing strategy
adaptation (or standardization) will enhance the performance and when
does the related additional cost start to reduce it.
Research implications
This study has aimed at developing a more comprehensive understanding
on the consequence of specific strategic orientation dimensions on
different business performance measures. Thereby the study has provided
both the need for studying and understanding the relationships separately.
The study has demonstrated difficulties in performance measures for small
and medium scale enterprises. Several company internal factors may
influence SME performance assessment, making measures possibly
unreliable, and partially explaining higher variation in explanation rates in
SME research.

5. Discussion 85
The study has further demonstrated the need for appropriate
measurement scales for marketing strategy adaptation/standardization
constructs, so that different aspects on the topic could be better clarified
and understood.
The results in general confirm the need for understanding the form of
relationship between strategic orientations, marketing strategy adaptation/
standardization, and business performance, as it appears not to be linear.
5.4 Reliability and validity
Concerning the reliability and validity of this study, generalizability of the
findings into a larger population is a critical concern.
The empirical data of this study were collected from one respondent in
each sample firm. This method of using single respondent self-reported
data poses the problem of potential bias in the data. The use of single
respondents means that the data are essentially based on the perceptions
of the respondents.
The reliance on this method in the study was motivated by two main
factors. First, the respondents needed to have overall knowledge of the
firm's operations as well as in-depth knowledge of the firm's key customer
relationship.
The questionnaire was carefully designed with several rounds of revision
and tested with a pilot sample. Further, questionnaire items were
formulated to measure tangible matters rather than opinions, whenever
possible.
Validity, in general, refers to the extent to which the study actually tests
the phenomenon it is assumed to examine or the extent to which a
measurement operation measures what it is intended to measure. In the
present study, previously validated measures were adopted whenever
possible to help ensure their validity. However, single questions for
marketing strategy adaptation/standardization were used. In addition

86 Janne Andberg, Master’s Thesis
adaptation of channel structure was taken from another scale, showing
clearly different levels and explanation rates, when compared with the
adaptation of product, price and promotion.
5.5 Limitations and suggestions for future research
Several limitations exist in terms of the generalizability and interpretation
of the results. First the study was made for single country (Finland) SME
context, at particular point of time, and representing only a small
proportion of the overall economy.
Secondly several industries were included both from domestic and
international context, making the number of samples per group relatively
small. Therefore some analysis were conducted combining the different
groups. As have been seen in the analysis the different firms behaved
quite differently, making the interpretation of the results more challenging.
Although research has made significant progress toward understanding
the relationship between strategic orientations and business performance,
multiple dimensions are typically combined to a single composite score,
making the interpretation challenging. This applies as well for the
performance measures as more knowledge is needed in understanding
how different strategic orientations operate on different performance
parameters.
Further the adaptation/standardization discussion shall be brought on a
new level, where the related parameters are clearly conceptualized for
current global situation and sound measurement scales created, so that
also differences between industries could be explained. Especially
important is to understand the point where adaptation related costs will
overcome its benefits.
6. Conclusions 87
6 Conclusions
Small businesses are important to most economies; therefore,
investigation of their performance is a worthwhile scholarly effort.
Consistent with previous research, it was found that some of the strategic
orientation dimensions correlate with revenue based performance
measures, some with profitability and some with growth, thus affecting
small business performance.
Marketing strategy adaptation/standardization was found to moderate the
way different strategic orientation dimensions associate with business
performance but not to explain performance as such. Further the findings
brought new insights to the importance of understanding different strategic
orientation dimensions as well as performance criteria.
I would encourage researchers to further examine the complex and
contingent role of adaptation/standardization in relation to business
performance and to develop a more complete understanding of the
phenomenon.

88 Janne Andberg, Master’s Thesis
7 Bibliography
Anderson, J.C. & Narus, J.A. (1998) Business marketing: Understand what
customers value. Harvard Business Review, 76, 6, p. 53–65.
Baker, W.E. & Sinkula, J.M. (1999) The synergistic effect of market
orientation and learning orientation on organizational performance. Journal
of the academy of marketing science, 27, 4, pp. 411-27.
Belohlav, J.A. (1996) The evolving competitive paradigm. Business
Horizons, 39, 2, pp. 11-19.
Bhuian, S.N., Menguc, B. & Bell, S.J. (2005) Just entrepreneurial enough:
the moderating effect of entrepreneurship on the relationship between
market orientation and performance. Journal of business research 58.1
(2005): 9-17., 58, 1, pp. 9-17.
Birnik, A. & Bowman, C. (2007) Marketing mix standardization in
multinational corporations: A review of the evidence. International Journal
of Management Reviews, 9, 4, pp. 303-24.
Brei, V.A., D'Avila, L., Camargo, L.F. & Engels, J. (2011) The influence of
adaptation and standardization of the marketing mix on performance: A
meta-analysis. BAR-Brazilian Administration Review, 8, 3, pp. 266-87.
Brettel, M., Engelen, A., Heinemann, F. & Vadhanasindhu, P. (2008)
Antecedents Of Market Orientation: A Cross-Cultural Comparison. Journal
of International Marketing, 16, 2, pp. 84-119.
Cadogan, J.W. (2012) International marketing, strategic orientations and
business success: Reflections on the path ahead. International Marketing
Review, 29, 4, pp. 340-48.
Cadogan, J.W., Kuivalainen, O. & Sundqvist, S. (2009) Export Market-
Oriented Behavior and Export Performance: Quadratic and Moderating
Effects Under Differing Degrees of Market Dynamism and
Internationalization. Journal of International Marketing, 17, 4, pp. 71-89.

7. Bibliography 89
Cano, C.R., Carrillat, F.A. & Jaramillo, F. (2004) A meta-analysis of the
relationship between market orientation and business performance:
evidence from five continents. International Journal of research in
Marketing, 21, 2, pp. 179-200.
Cavusgil, S.T. (1996) Pricing for global markets. The Columbia Journal of
World Business, 31, Winter, pp. 66-78.
Cavusgil, T.S. & Zou, S. (1994) Marketing strategy-performance
relationship: an investigation of the empirical link in export market
ventures. Journal of Marketing, 58, 1, pp. 1-21.
Chung, H.F.L. (2003) International standardization strategies: the
experiences of Australian and New Zealand firms operating in the greater
China markets. Journal of International Marketing, 11, 3, pp. 48-82.
Codita, R. (2011) Contingency factors of marketing-mix standardization..
1st ed. Gabler Research.
Covin, J.G. & Covin, T.J. (1990) Competitive aggressiveness,
environmental context, and small firm performance. Entrepreneurship
Theory and Practice, 14, 4, pp. 35-50.
Covin, J.G. & Lumpkin, G.T. (2011) Entrepreneurial Orientation Theory
and Research: Reflections on a Needed Construct. Entrepreneurship
Theory and Practice, 35, 5, pp. 855-72.
Covin, J.G. & Slevin, D.P. (1989) Strategic management of small firms in
hostile and benign environments. Strategic management, 10, 1, pp. 75-87.
Czinkota, M.R. & Ronkainen, I.A. (2013) International marketing. Cengage
Learning.
Day, G.S. (1999) Market driven strategy: process for creating value: with a
new information. Free.
90 Janne Andberg, Master’s Thesis
Denyer, D., Tranfield, D. & Van Aken, J.E. (2008) Developing design
propositions through research synthesis. Organization studies, 29, 3, pp.
393-413.
Drucker, P.F. (1954) The practice of management. New York, Harper &
Row.
Elinder, E. (1965) How International Can European Advertising Be?
Journal of Marketing, 29, 2, pp. 7-11.
Ellis, P.D. (2006) Market orientation and performance: A meta‐analysis
and cross‐national comparisons. Journal of Management studies, 43, 5,
pp. 1089-107.
Falck, A. (2008) Market orientation and performance in entrepreneurial
SMEs. Lappeenranta, Finland, Lappeenranta University of Technology.
Farrell, M.A. (1999) Antecedents and consequences of a learning
orientation. Marketing Bulletin-Department of Marketing Massey
University, 10, pp. 38-51.
Gray, B.J. & Hooley, G.J. (2002) Guest editorial: Market orientation and
service firm performance-a research agenda. European Journal of
marketing, 36, 9/10, pp. 980-89.
Grinstein, A. (2008) The relationships between market orientation and
alternative strategic orientations. European Journal of Marketing, 42, 1/2,
pp. 115-34.
Hair, J.F., Black, W.C., Babin, B.J. & Anderson, R.E. (2009) Multivariate
Data Analysis: A Global Perspective. 7th ed. Upper Saddle River, Prentice
Hall.
Harris, L.C. (2001) Market orientation and performance: objective and
subjective empirical evidence from UK companies. Journal of
Management studies, 38, 1, pp. 17-43.
7. Bibliography 91
Hinkin, T.R. (1995) A Review of Scale Development Practices in the Study
of Organizations. Journal of Management, 21, 5, pp. 967-88.
Hinterhuber, A. (2008) Customer Value-based Pricing Strategies: Why
Companies Resist. Journal of Business Strategy, 29, 4, pp. 41-50.
Hollensen, S. (2004) Global marketing: a decision-oriented approach. 3rd
ed. Harlow, England, Financial Times Prentice Hall.
Jaworski, B.J. & Kohli, A.K. (1993) Market orientation: antecedents and
consequences. The Journal of marketing, 57, 3, pp. 53-70.
Julian, C.C. & Ahmed, Z.U. (2005) The impact of barriers to export on
export marketing performance. Journal of Global Marketing, 19, 1, pp. 71-
94.
Kaplan, R.S. & Norton, D.P. (1992) The Balanced Scorecard - Measures
That Drive Performance. Harvard Business Review, January–February, p.
71–79.
Keh, H.T., Nguyen, T.T.M. & Ng, H.P. (2007) The effects of
entrepreneurial orientation and marketing information on the performance
of SMEs. Journal of business venturing, 22, 4, pp. 592-611.
Kirca, A.H., Jayachandran, S. & Bearden, W.O. (2005) Market orientation:
A meta-analytic review and assessment of its antecedents and impact on
performance. Journal of marketing, 69, 2, pp. 24-41.
Kohli, A.K. & Jaworski, B.J. (1990) Market orientation: the construct,
research propositions, and managerial implications. The Journal of
Marketing, 54, 2, pp. 1-18.
Kotler, P. & Armstrong, G.M. (2010) Principles of Marketing. Prentice Hall.
Lages , L. & Montgomery, D.B. (2004) Export performance as an
antecedent of export commitment and marketing strategy adaptation:

92 Janne Andberg, Master’s Thesis
Evidence from small and medium-sized exporters. European Journal of
Marketing, 38, 9/10, pp. 1186-214.
Lancioni, R. (2005) Pricing issues in industrial marketing. Industrial
Marketing Management, 34, 2, pp. 111-14.
Leonidou, L.C., Katsikeas, C.S. & Samiee, S. (2002) Marketing strategy
determinants of export performance: a meta-analysis. Journal of Business
Research, 55, 1, pp. 51-67.
Levitt, T. (1983) The globalization of markets. Harvard Business Review,
61, 3, pp. 92-102.
Lumpkin, T.G. & Dess, G.G. (1996) Clarifying the entrepreneurial
orientation construct and linking it to performance. Academy of
management Review, 21, 1, pp. 135-72.
Luo, X., Zhou, L. & Liu, S.S. (2005) Entrepreneurial firms in the context of
China's transition economy: an integrative framework and empirical
examination. Journal of Business Research, 58, 3, pp. 277-84.
Matsuno, K., Mentzer, J.T. & Özsomer, A. (2002) The effects of
entrepreneurial proclivity and market orientation on business performance.
Journal of marketing, 66, 3, pp. 18-32.
Miles, R.E., Snow, C.C., Meyer, A.D. & Coleman, H.J. (1978)
Organizational strategy, structure, and process. cademy of management
review, 3(3),., 3, 3, pp. 546-62.
Miller, D. (1983) The Correlates of Entrepreneurship in Three Types of
Firms. Management Science, 29, 7, pp. 770-91.
Miller, D. (2011) Miller (1983) Revisited: A Reflection on EO Research and
Some Suggestions for the Future. Entrepreneurship Theory and Practice,
35, 5, pp. 873-94.
7. Bibliography 93
Moorman, C. & Miner, A.S. (1998) Organizational Improvisation and
Organizational Memory. The Academy of Management Review, 23, 4 , pp.
698-723.
Myers, M.B., Cavusgil, S.T. & Diamantopoulos, A. (2002) Antecedents and
actions of export pricing strategy: A conceptual framework and research
propositions. European Journal of Marketing, 36, 1/2, pp. 159-88.
Narver, J.C. & Slater, S.F. (1990) The effect of a market orientation on
business profitability. The Journal of marketing, 54, 4, pp. 20-35.
Narver, J.C., Slater, S.F. & MacLachlan, D.L. (2004) Responsive and
proactive market orientation and new‐product success. Journal of product
innovation management, 21, 5, pp. 334-47.
Nonaka, I. & Takeuchi, H. (1995) The Knowledge Creating Company.
Oxford University Press.
Nunnally, J.C. & Bernstein, I.H. (1994) The assessment of reliability.
Psychometric theory, 3, 1, pp. 248-92.
Osborne, J.W. & Costello, A.B. (2009) Best practices in exploratory factor
analysis: Four recommendations for getting the most from your analysis.
Pan-Pacific Management Review, 12, 2, pp. 131-46.
Rajahonka, M. (2013) Doctoral dissertation: Towards service modularity -
service and business model development. Helsinki, Aalto University.
Rauch, A., Wiklund, J., Frese, M. & Lumpkin, G.T. (2004) Entrepreneurial
orientation and business performance: Cumulative empirical evidence.
23rd Babson College Entrepreneurship Research Conference. Glasgow,
UK.
Schilke, O., Reimann, M. & Thomas, J.S. (2009) When does international
marketing standardization matter to firm performance? Journal of
International Marketing, 17, 4, pp. 24-46.
94 Janne Andberg, Master’s Thesis
Schumacker, R.E. & Lomax, R.G. (2004) A beginner's guide to structural
equation modeling. Psychology Press.
Sharma, S., Durand, R.M. & Gur-Arie, O. (1981) Identification and analysis
of moderator variables. Journal of marketing research, pp. 291-300.
Shoham, A. (2003) Standardization of international strategy and export
performance: A meta-analysis. Journal of Global Marketing, 16, 1-2, pp.
97-120.
Shoham, A., Brencic, M.M., Virant, V. & Ruvio, A. (2008) International
Standardization of Channel Management and Its Behavioral and
Performance Outcomes. Journal of International Marketing, 16, 2, pp. 120-
51.
Sinkula, J.M., Baker, W.E. & Noordewier, T. (1997) A Framework for
Market-Based Organizational Learning: Linking Values, Knowledge, and
Behavior. Journal of the Academy of Marketing Science, 25, 4, pp. 305-18.
Slater, S.F. & Narver, J.C. (1995) Market orientation and the learning
organization. The Journal of marketing, 59, July, pp. 63-74.
Sousa, C.M.P. & Bradley, F. (2009) Price adaptation in export markets.
European Journal of Marketing, 43, 3/4, pp. 438-58.
Still, R.R. & Hill, J.S. (1984) Adapting consumer products to lesser-
developed markets. Journal of Business Research, 12, 1, pp. 51-61.
Terpstra, V. & Sarathy, R. (2000) International Marketing. Dryden Press.
Theodosiou, M. & Katsikeas, C.S. (2001) Factors influencing the degree of
international pricing strategy standardization of multinational corporations.
Journal of International Marketing, 9, 3, pp. 1-18.
Theodosiou, M. & Leonidou, L.C. (2003) Standardization Versus
Adaptation Of International Marketing Strategy: An Integrative Assessment
7. Bibliography 95
Of The Empirical Research. International Business Review, 12, 2, pp. 141-
71.
Torkkeli, L. (2009) The Role of Network Competence in
Internationalization of SMEs. Lappeenranta, Finland, Lappeenranta
University of Technology.
Waheeduzzaman, A.N. & Leon, D.F. (2004) Trends and development in
standardization adaptation research. Journal of global marketing, 17, 4,
pp. 23-52.
Wang, C.L. (2008) Entrepreneurial orientation, learning orientation, and
firm performance. Entrepreneurship Theory and Practice, 32, 4, pp. 635-
56.
Wiklund , J. & Shepherd, D. (2003) Knowledge‐based resources,
entrepreneurial orientation, and the performance of small and medium‐
sized businesses. Strategic management journal, 24, 13, pp. 1307-14.
Wiklund, J. & Shepherd, D. (2005) Entrepreneurial orientation and small
business performance: a configurational approach. Journal of business
venturing 20.1 , 20, 1, pp. 71-91.
Vrontis, D. (2003) Integrating adaptation and standardisation in
international marketing: the AdaptStand modelling process. Journal of
Marketing Management, 19, 3-4, pp. 283-305.
Vrontis, D. & Kitchen, P.J. (2005) Entry methods and international
marketing decision making: an empirical investigation. International
Journal of Business Studies, 13, 1, p. 87.
Vrontis, D., Thrassou, A. & Lamprianou, I. (2009) International marketing
adaptation versus standardisation of multinational companies.
International Marketing Review, 26, 4/5, pp. 477-500.

96 Janne Andberg, Master’s Thesis
Zou, S. & Cavusgil, T.S. (2002) The GMS: A broad conceptualization of
global marketing strategy and its effect on firm performance. Journal of
marketing, 66, 4, pp. 40-56.
.
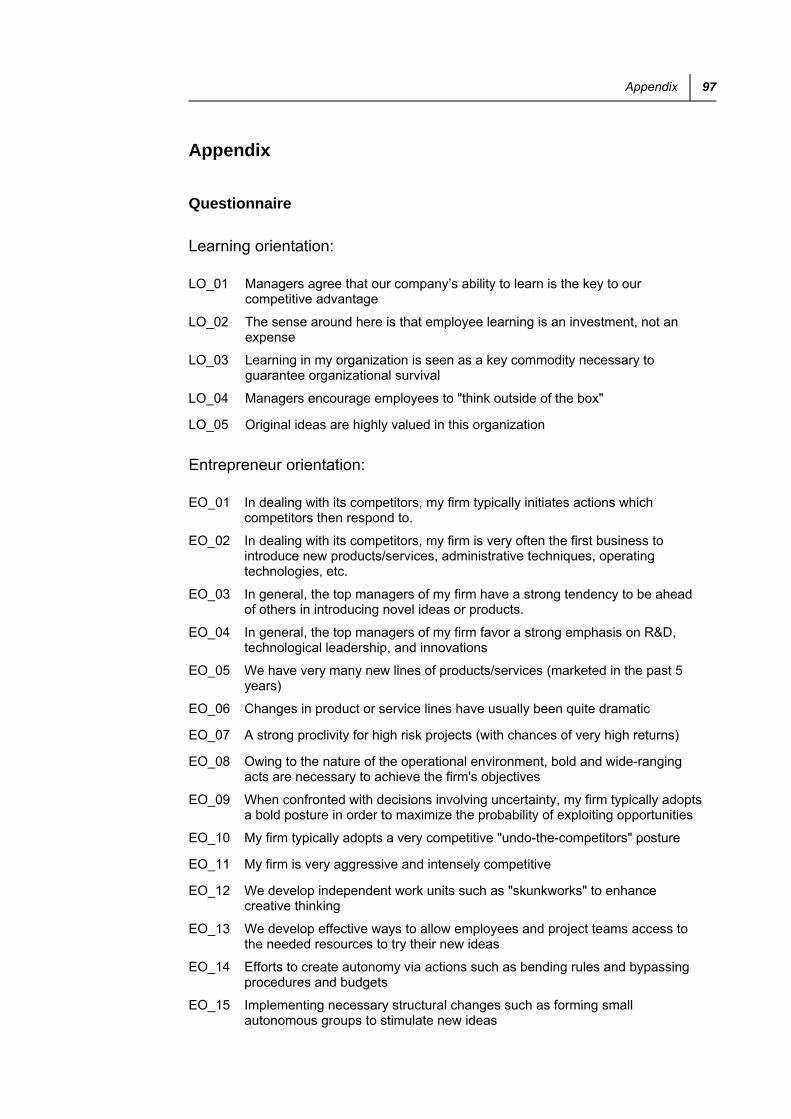
Appendix 97
Appendix
Questionnaire
Learning orientation:
LO_01 Managers agree that our company’s ability to learn is the key to our competitive advantage
LO_02 The sense around here is that employee learning is an investment, not an expense
LO_03 Learning in my organization is seen as a key commodity necessary to guarantee organizational survival
LO_04 Managers encourage employees to "think outside of the box"
LO_05 Original ideas are highly valued in this organization
Entrepreneur orientation:
EO_01 In dealing with its competitors, my firm typically initiates actions which competitors then respond to.
EO_02 In dealing with its competitors, my firm is very often the first business to introduce new products/services, administrative techniques, operating technologies, etc.
EO_03 In general, the top managers of my firm have a strong tendency to be ahead of others in introducing novel ideas or products.
EO_04 In general, the top managers of my firm favor a strong emphasis on R&D, technological leadership, and innovations
EO_05 We have very many new lines of products/services (marketed in the past 5 years)
EO_06 Changes in product or service lines have usually been quite dramatic
EO_07 A strong proclivity for high risk projects (with chances of very high returns)
EO_08 Owing to the nature of the operational environment, bold and wide-ranging acts are necessary to achieve the firm's objectives
EO_09 When confronted with decisions involving uncertainty, my firm typically adopts a bold posture in order to maximize the probability of exploiting opportunities
EO_10 My firm typically adopts a very competitive "undo-the-competitors" posture
EO_11 My firm is very aggressive and intensely competitive
EO_12 We develop independent work units such as "skunkworks" to enhance creative thinking
EO_13 We develop effective ways to allow employees and project teams access to the needed resources to try their new ideas
EO_14 Efforts to create autonomy via actions such as bending rules and bypassing procedures and budgets
EO_15 Implementing necessary structural changes such as forming small autonomous groups to stimulate new ideas
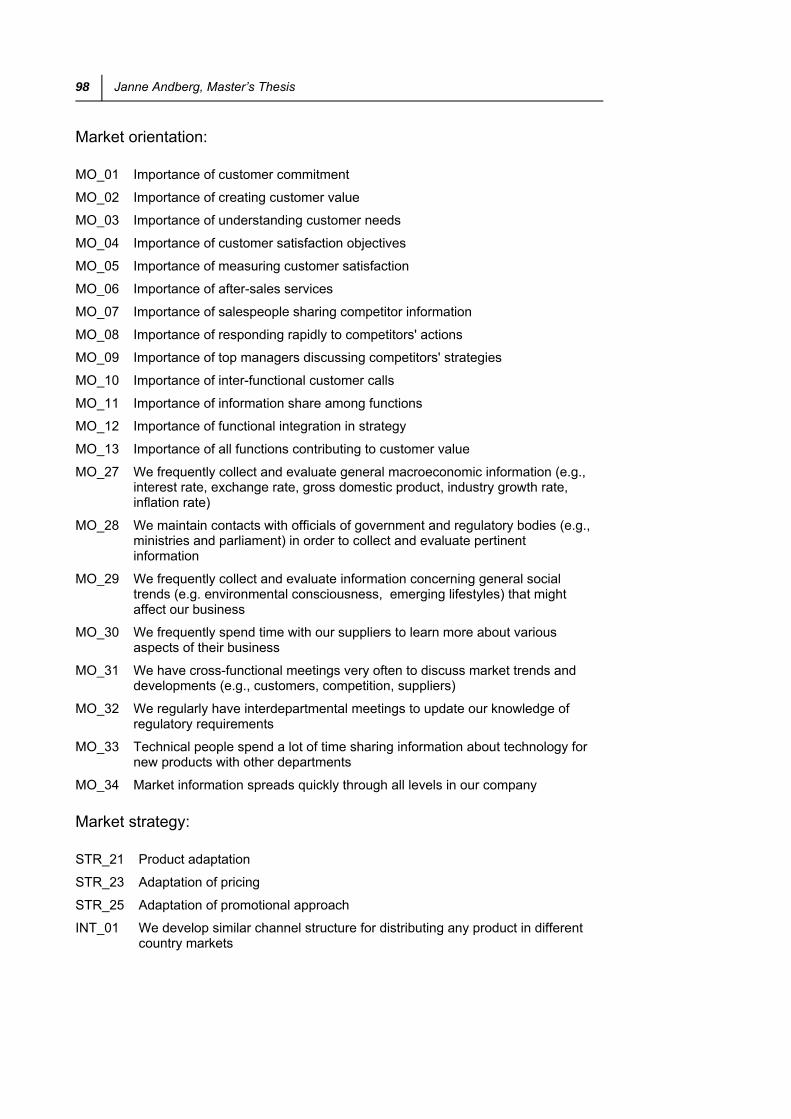
98 Janne Andberg, Master’s Thesis
Market orientation:
MO_01 Importance of customer commitment
MO_02 Importance of creating customer value
MO_03 Importance of understanding customer needs
MO_04 Importance of customer satisfaction objectives
MO_05 Importance of measuring customer satisfaction
MO_06 Importance of after-sales services
MO_07 Importance of salespeople sharing competitor information
MO_08 Importance of responding rapidly to competitors' actions
MO_09 Importance of top managers discussing competitors' strategies
MO_10 Importance of inter-functional customer calls
MO_11 Importance of information share among functions
MO_12 Importance of functional integration in strategy
MO_13 Importance of all functions contributing to customer value
MO_27 We frequently collect and evaluate general macroeconomic information (e.g., interest rate, exchange rate, gross domestic product, industry growth rate, inflation rate)
MO_28 We maintain contacts with officials of government and regulatory bodies (e.g., ministries and parliament) in order to collect and evaluate pertinent information
MO_29 We frequently collect and evaluate information concerning general social trends (e.g. environmental consciousness, emerging lifestyles) that might affect our business
MO_30 We frequently spend time with our suppliers to learn more about various aspects of their business
MO_31 We have cross-functional meetings very often to discuss market trends and developments (e.g., customers, competition, suppliers)
MO_32 We regularly have interdepartmental meetings to update our knowledge of regulatory requirements
MO_33 Technical people spend a lot of time sharing information about technology for new products with other departments
MO_34 Market information spreads quickly through all levels in our company
Market strategy:
STR_21 Product adaptation
STR_23 Adaptation of pricing
STR_25 Adaptation of promotional approach
INT_01 We develop similar channel structure for distributing any product in different country markets

Appendix 99
Subjective performance:
GO_Sat05 How well did your company reach its growth objectives in year 2005
GO_Sat06 How well did your company reach its growth objectives in year 2006
GO_Sat07 How well did your company reach its growth objectives in year 2007
Objective performance:
OR_TO05 Operating Revenue / Turnover th EUR 2005
OR_TO06 Operating Revenue / Turnover th EUR 2006
OR_TO07 Operating Revenue / Turnover th EUR 2007
PL_05 Profit (loss) before tax th EUR 2005
PL_06 Profit (loss) before tax th EUR 2006
PL_07 Profit (loss) before tax th EUR 2007
PMA_05 Profit margin (%) 2005
PMA_06 Profit margin (%) 2006
PMA_07 Profit margin (%) 2007
RTA_05 Return on total assets (%) 2005
RTA_06 Return on total assets (%) 2006
RTA_07 Return on total assets (%) 2007
EMP_05 Employees 2005
EMP_06 Employees 2006
EMP_07 Employees 2007