Embed Size (px)
Citation preview
THE EFFECT OF SMALL ADDITIONS OF RUTHENIUM
ON THE PITTING CORROSION RESISTANCE OF
LDX2101 DUPLEX STAINLESS STEEL
Shem Chiliungu Kandodo Banda
A Dissertation submitted to the Faculty of Engineering and the Built Environment, University
of the Witwatersrand, in fulfilment of the requirement of the degree of Master of Science in
Engineering.
Johannesburg 2013
i
DECLARATION
I declare that this dissertation is my own, unaided work. It is being submitted for the Degree
of Masters of Science (MSc) in Engineering, in the Faculty of Engineering, University of the
Witwatersrand, Johannesburg. It has not been submitted before for any degree or examination
in any other university.
Shem Chiliungu Kandodo Banda
22 MAY 2013
ii
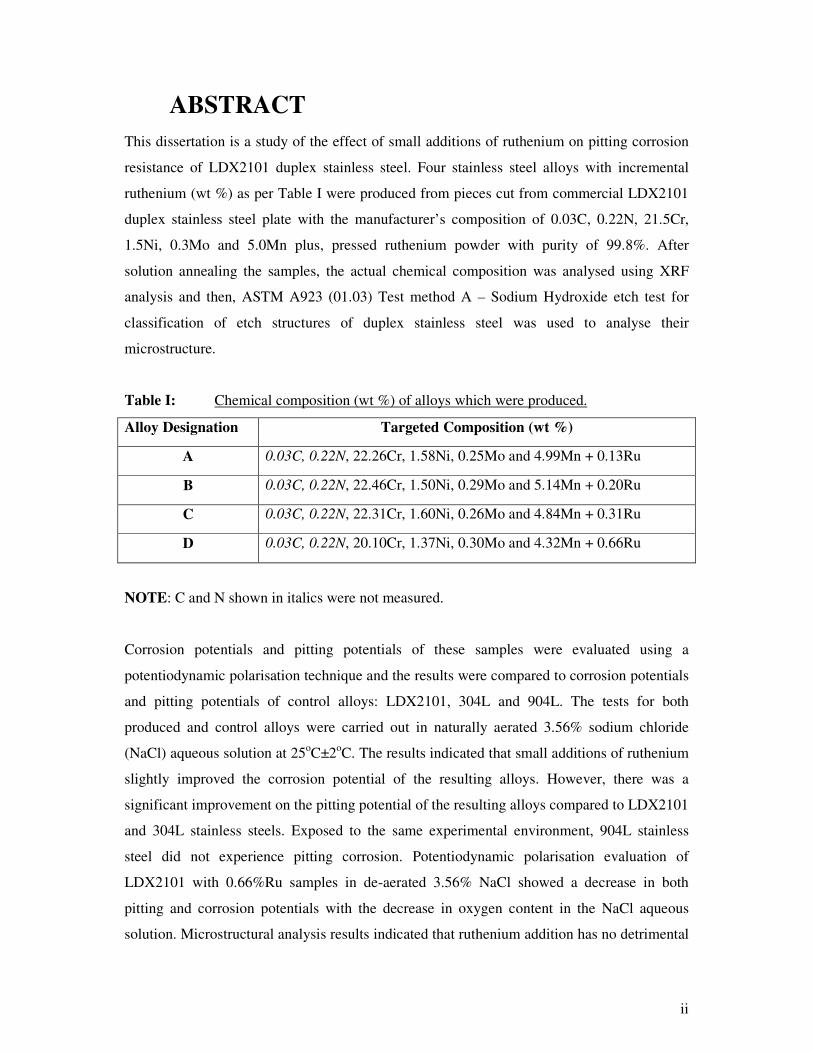
ABSTRACT
This dissertation is a study of the effect of small additions of ruthenium on pitting corrosion
resistance of LDX2101 duplex stainless steel. Four stainless steel alloys with incremental
ruthenium (wt %) as per Table I were produced from pieces cut from commercial LDX2101
duplex stainless steel plate with the manufacturer’s composition of 0.03C, 0.22N, 21.5Cr,
1.5Ni, 0.3Mo and 5.0Mn plus, pressed ruthenium powder with purity of 99.8%. After
solution annealing the samples, the actual chemical composition was analysed using XRF
analysis and then, ASTM A923 (01.03) Test method A – Sodium Hydroxide etch test for
classification of etch structures of duplex stainless steel was used to analyse their
microstructure.
Table I: Chemical composition (wt %) of alloys which were produced.
Alloy Designation Targeted Composition (wt %)
A 0.03C, 0.22N, 22.26Cr, 1.58Ni, 0.25Mo and 4.99Mn + 0.13Ru
B 0.03C, 0.22N, 22.46Cr, 1.50Ni, 0.29Mo and 5.14Mn + 0.20Ru
C 0.03C, 0.22N, 22.31Cr, 1.60Ni, 0.26Mo and 4.84Mn + 0.31Ru
D 0.03C, 0.22N, 20.10Cr, 1.37Ni, 0.30Mo and 4.32Mn + 0.66Ru
NOTE: C and N shown in italics were not measured.
Corrosion potentials and pitting potentials of these samples were evaluated using a
potentiodynamic polarisation technique and the results were compared to corrosion potentials
and pitting potentials of control alloys: LDX2101, 304L and 904L. The tests for both
produced and control alloys were carried out in naturally aerated 3.56% sodium chloride
(NaCl) aqueous solution at 25oC±2oC. The results indicated that small additions of ruthenium
slightly improved the corrosion potential of the resulting alloys. However, there was a
significant improvement on the pitting potential of the resulting alloys compared to LDX2101
and 304L stainless steels. Exposed to the same experimental environment, 904L stainless
steel did not experience pitting corrosion. Potentiodynamic polarisation evaluation of
LDX2101 with 0.66%Ru samples in de-aerated 3.56% NaCl showed a decrease in both
pitting and corrosion potentials with the decrease in oxygen content in the NaCl aqueous
solution. Microstructural analysis results indicated that ruthenium addition has no detrimental

iii
effect to the microstructure of the resulting alloys. However, alloys containing ruthenium
were not commercially viable as the pitting corrosion resistance benefit ruthenium brought
did not offset the cost of adding the ruthenium to LDX2101 stainless steel.
iv
ACKNOWLEDGEMENTS
First, I would like to thank the Lord God Almighty for the grace He afforded me to complete
these studies. You have been my source of encouragement and hope.
Secondly my appreciation goes to my Supervisor, Mr. Josias van der Merwe. Without his
guidance, advice and patience this day would not have arrived.
Thirdly, I would like to thank Edson Muhuma (MINTEK) for sharing his technical
knowledge on melting and Brayner (WITS) for sharing his experience on preparing and
examining of samples.
The following very important people also deserve my appreciation: my wife Nandi Nyingi
Ngosi-Banda, your love, understanding and forbearing cannot be matched, especially when it
was necessary to work long hours and my daughter Nzeru-Bohlale Banda born, at the climax
of my studies.
Last but not least, my appreciation goes to MSA Africa for sponsoring my studies, The
School of Chemical and Metallurgical Engineering at the University of the Witwatersrand for
allowing me to conduct my studies there and providing all necessary equipment and materials
and, MINTEK for allowing me to use their equipment.
v
Table of contents
DECLARATION ------------------------------------------------------------------------------------------ i
ABSTRACT ----------------------------------------------------------------------------------------- ii
ACKNOWLEDGEMENTS ---------------------------------------------------------------------------- iv
LIST OF FIGURES --------------------------------------------------------------------------------------- x
LIST OF TABLES -------------------------------------------------------------------------------------- xiv
1. INTRODUCTION ------------------------------------------------------------------ 1
1.1 BACKGROUND AND MOTIVATION -------------------------------------------------- 1
1.2 PROJECT DESCRIPTION ------------------------------------------------------------------ 4
1.3 OTHER OBJECTIVES----------------------------------------------------------------------- 5
1.4 METHODOLOGY ---------------------------------------------------------------------------- 5
1.5 HYPOTHESIS --------------------------------------------------------------------------------- 5
1.6 RESEARCH QUESTIONS ------------------------------------------------------------------ 5
1.7 EXPECTED CONTRIBUTION TO KNOWLEDGE ----------------------------------- 6
2. LITERATURE REVIEW ---------------------------------------------------------- 7
2.1 IRON AND STEEL BACKGROUND ---------------------------------------------------- 7
2.1.1 Tungsten Steel ------------------------------------------------------------------------------ 8
2.1.2 Manganese Steel ---------------------------------------------------------------------------- 8
2.1.3 Silicon Steel --------------------------------------------------------------------------------- 8
2.1.4 Steel for Military Application ------------------------------------------------------------ 8
2.2 STAINLESS STEELS ------------------------------------------------------------------------ 9
2.2.1 Austenitic Stainless Steels ---------------------------------------------------------------11
2.2.2 Ferritic Stainless Steels -------------------------------------------------------------------11
2.2.3 Martensitic Stainless Steels --------------------------------------------------------------12
2.2.4 Austenitic-Ferritic Stainless Steels -----------------------------------------------------13
2.2.5 Control Alloys -----------------------------------------------------------------------------14
2.2.5.1 304L Stainless Steel ---------------------------------------------------------------14
2.2.5.2 904L Stainless Steel ---------------------------------------------------------------15
2.2.5.3 LDX2101 Stainless Steel ---------------------------------------------------------16
vi
2.3 PITTING CORROSION AND PITTING CORROSION RESISTANCE OF
STAINLESS STEELS -----------------------------------------------------------------------17
2.3.1 Surface passivity and pitting corrosion ------------------------------------------------17
2.3.2 Pitting corrosion propagation mechanism ---------------------------------------------19
2.3.3 Susceptibility to pitting -------------------------------------------------------------------21
2.3.3.1 Characterisation of pitting potentials --------------------------------------------21
2.3.3.2 Critical pitting temperature -------------------------------------------------------22
2.3.3.3 Other methods ----------------------------------------------------------------------23
2.3.4 Factors affecting pitting corrosion ------------------------------------------------------23
2.3.4.1 Effects of external factors on pitting corrosion --------------------------------23
2.3.4.1.1 Effect of pH -------------------------------------------------------------------------24
2.3.4.1.2 Electrolyte Composition ----------------------------------------------------------24
2.3.4.1.3 Temperature -------------------------------------------------------------------------25
2.3.4.1.4 Oxygen-------------------------------------------------------------------------------26
2.3.4.2 Effects of internal factors on pitting corrosion of Stainless Steels ----------27
2.3.4.2.1 Effects of stainless steel production processes ---------------------------------27
2.3.4.2.1.1 Cold working ----------------------------------------------------------------------28
2.3.4.2.1.2 Sensitisation -----------------------------------------------------------------------28
2.3.4.2.2 The effect of the surface condition ----------------------------------------------28
2.3.4.2.2.1 Surface Roughness ----------------------------------------------------------------29
2.3.4.2.2.2 Chemical surface treatment (Pickling and Passivation) ---------------------29
2.3.4.2.3 The effect of the microstructure --------------------------------------------------30
2.3.4.2.4 Alloying Elements/Composition -------------------------------------------------31
2.3.4.2.4.1 Chromium --------------------------------------------------------------------------32
2.3.4.2.4.2 Molybdenum -----------------------------------------------------------------------32
2.3.4.2.4.3 Nickel -------------------------------------------------------------------------------33
2.3.4.2.4.4 Manganese -------------------------------------------------------------------------33
2.3.4.2.4.5 Nitrogen ----------------------------------------------------------------------------34
vii
2.3.4.2.4.6 Copper ------------------------------------------------------------------------------34
2.3.4.2.4.7 Platinum Group Metals (PGM) - Cathodic Modification -------------------35
3. PROCEDURES AND METHODOLOGIES ----------------------------------37
3.1 ALLOYS PRODUCTION ------------------------------------------------------------------37
3.2 MATERIALS USED TO PRODUCE THE ALLOYS ---------------------------------37
3.3 MELTING PROCEDURE ------------------------------------------------------------------38
3.4 HEAT TREATMENT PROCEDURE ----------------------------------------------------39
3.5 CHEMICAL COMPOSITION ANALYSIS PROCEDURE --------------------------39
3.5.1 Specimen preparation ---------------------------------------------------------------------39
3.5.2 Analysis -------------------------------------------------------------------------------------39
3.6 MICROSTRUCTURAL ANALYSIS PROCEDURE ----------------------------------40
3.6.1 Specimen preparation ---------------------------------------------------------------------40
3.6.2 Analysis -------------------------------------------------------------------------------------40
3.7 POTENTIODYNAMIC POLARISATION PROCEDURE ---------------------------41
3.7.1 Specimen preparation ---------------------------------------------------------------------41
3.7.2 Potentiodynamic test ----------------------------------------------------------------------42
3.7.3 Solution Purging Procedure--------------------------------------------------------------42
3.8 Corrosion rate calculations ------------------------------------------------------------------42
4. RESULTS ---------------------------------------------------------------------------44
4.1 PRODUCED ALLOYS ---------------------------------------------------------------------44
4.2 CHEMICAL COMPOSITION ANALYSIS RESULTS -------------------------------44
4.3 MICROSTRUCTURAL ANALYSIS RESULTS ---------------------------------------45
4.3.1 Microstructure results for LDX2101 Stainless steel ---------------------------------45
4.3.2 Microstructure results for LDX2101+0.13%wt Ru ----------------------------------46
4.3.3 Microstructure results for LDX2101+0.2%wt Ru ------------------------------------47
4.3.4 Microstructure results for LDX2101+0.31%wt Ru ----------------------------------47
4.3.5 Microstructure results for LDX2101+0.66%wt Ru ----------------------------------48
4.4 POTENTIODYNAMIC POLARISATION RESULTS --------------------------------48
4.4.1 Potentiodynamic Polarisation results of 304L Stainless Steel ----------------------48
4.4.2 Potentiodynamic Polarisation Results of 904L Stainless Steel ---------------------49
viii
4.4.3 Potentiodynamic Polarisation Results of LDX2101 Stainless Steel ---------------50
4.4.4 Potentiodynamic Polarisation Results of LDX2101+0.13%wt Ru Alloy ---------51
4.4.5 Potentiodynamic Polarisation Results of LDX2101+0.20%wt Ru Alloy ---------52
4.4.6 Potentiodynamic Polarisation Results of LDX2101+0.31%wt Ru Alloy ---------53
4.4.7 Potentiodynamic Polarisation Results of LDX2101+0.66%wt Ru Alloy ---------54
4.4.8 Summary of Potentiodynamic Polarisation Results ----------------------------------56
4.5 MICROSCOPY OF CORRODED SURFACES AFTER POTENTIODYNAMIC
POLARISATION ----------------------------------------------------------------------------57
4.5.1 Pits observed on LDX2101 samples ----------------------------------------------------57
4.5.2 Pits observed on LDX2101+0.13%wt Ru samples -----------------------------------58
4.5.3 Pits observed on LDX2101+0.20%wt Ru samples -----------------------------------58
4.5.4 Pits observed on LDX2101+0.31%wt Ru samples -----------------------------------59
4.5.5 Pits observed on LDX2101+0.66%wt Ru samples -----------------------------------60
4.5.6 Summary of microscopy results ---------------------------------------------------------60
4.6 PASSIVATION RESULTS OF LDX2101 STAINLESS STEEL AND LDX2101
WITH UP TO 0.66%WT RU ---------------------------------------------------------------61
5. DISCUSSIONS, CONCLUSIONS AND RECOMMENDATION ---------62
5.1 MICROSTRUCTURE -----------------------------------------------------------------------62
5.2 CORROSION RATE, CORROSION POTENTIAL & POLARISATION
RESISTANCE --------------------------------------------------------------------------------63
5.1 PASSIVATION OF LDX2101 STAINLESS STEEL AND LDX2101 WITH UP
TO 0.66%WT RU ----------------------------------------------------------------------------66
5.1.1 Passivation current density---------------------------------------------------------------66
5.1.2 Passive potential range -------------------------------------------------------------------67
5.2 PITTING CORROSION --------------------------------------------------------------------67
5.3 COMPARISON WITH CONTROL ALLOY --------------------------------------------71
5.4 EFFECT OF OXYGEN CONTENT IN THE NaCl AQUEOUS SOLUTION -----72
5.5 COMMERCIAL VIABILITY --------------------------------------------------------------74
5.6 CONCLUSIONS AND RECOMMENDATIONS --------------------------------------76
REFERENCES ----------------------------------------------------------------------------------------78

ix
APPENDICES ----------------------------------------------------------------------------------------87
APPENDIX A: POTENTIODYNAMIC POLARISATION CURVES -----------------------87
APPENDIX B: 2012 PRICES FOR CONTROL ALLOYS AND RUTHENIUM --------95
x
LIST OF FIGURES
Figure 1.1 Pits developing on casing/enclosure for mine application safety equipment. ..... 2
Figure 1.2 Typical critical pitting corrosion temperatures (CPT) determined according to
ASTM G 48 Method E (OUTOKUMPU 2009). ............................................... 3
Figure 2.1 Fe-Cr and Fe-Cr-Ni phase diagrams (Kovach 2011, p. 11). ............................ 10
Figure 2.2 Microstructure image of an austenitic stainless steel (OUTOKUMPU 2008). . 11
Figure 2.3 Microstructure image of ferritic stainless steel (OUTOKUMPU 2008). .......... 12
Figure 2.4 Microstructure image of a martensitic stainless steel (OUTOKUMPU 2008). 12
Figure 2.5 Duplex (austenitic-ferritic) well balanced two-phase structure with ferrite
content between 30-50% (OUTOKUMPU 2008). .......................................... 13
Figure 2.6 A schematic of typical electrochemical polarization curve of stainless steel in
an aqueous solution (Sedriks 1979). ............................................................... 18
Figure 2.7 Schematic illustration of pitting corrosion (Key to metals 1999). ................... 20
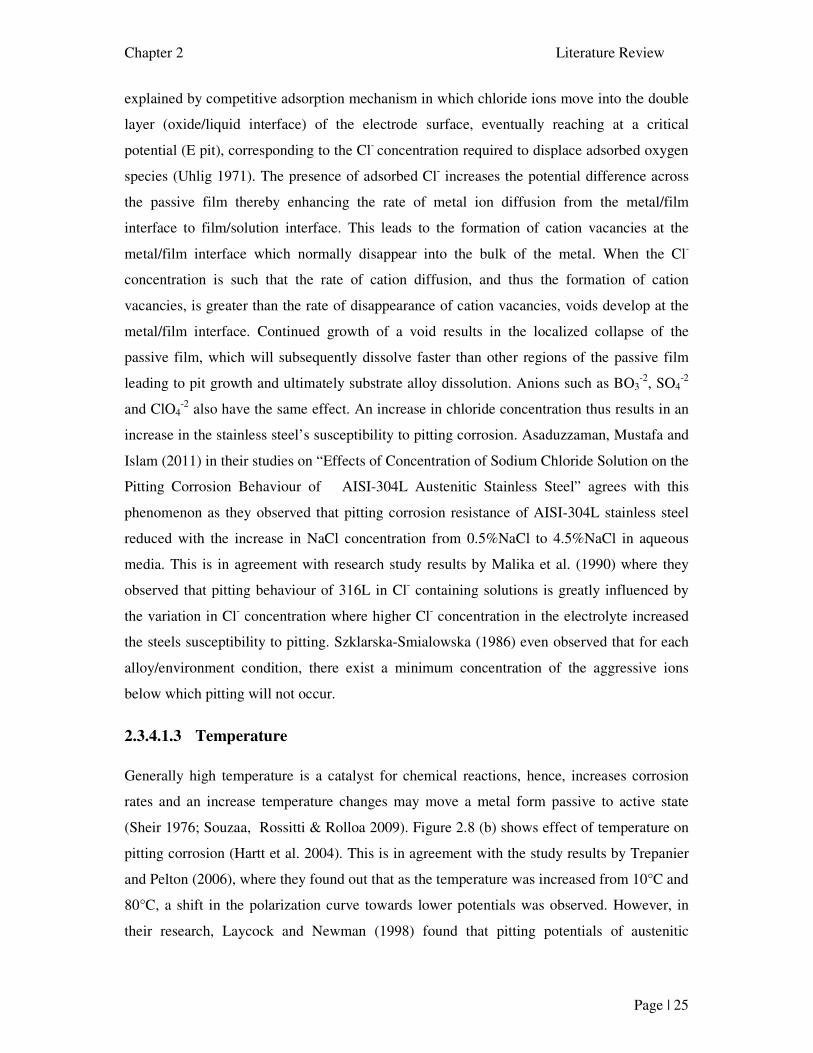
Figure 2.8 An illustration on how a stainless steel’s susceptibility to pitting increases with
an increase in temperature and chloride concentration (Hartt et al. 2004). ...... 26
Figure 2.9 Schematic polarisation diagram illustrating the influence of (a) Cr and (b) Mo
on the pitting corrosion resistance of stainless steel (Hartt et al. 2004)............ 32
Figure 2.10 Summary of nickel prices in USD/Tonne (cash buyer) for the year 2010
(London Metal Exchange 2003 - 2011). ......................................................... 33
Figure 2.11 A schematic of typical electrochemical polarization curve of stainless steel in
aqueous solution, showing the effect of cathodic modification (Wolff 1999) .. 35
Figure 3.1 A small section of stainless steel alloy mounted in bakelite. ........................... 39
Figure 3.2 Mounting of sample for potentiodynamic polarisation measurements ............. 41
Figure 4.1 A representation of the produced samples ...................................................... 44
Figure 4.2 Transverse microstructure of LDX2101 as examined at 500X magnification. . 46
Figure 4.3 Microstructure of LDX2101 with 0.13% Ruthenium, obtained at different
points on the same sample, as examined at 500X magnification. .................... 46
Figure 4.4 Microstructure of LDX2101 with 0.20% Ruthenium, obtained at different
points on the same sample, as examined at 500X magnification. .................... 47
Figure 4.5 Microstructure of LDX2101 with 0.31% Ruthenium, obtained at different
points on the same sample, as examined at 500X magnification. .................... 47
Figure 4.6 Microstructure of LDX2101 with 0.66% Ruthenium, obtained at different
points on the same sample, as examined at 500X magnification. .................... 48
xi
Figure 4.7 Potentiodynamic polarisation curves of 304L stainless steel samples in 3.5%
NaCl aerated solution at 25oC ±1oC. ............................................................... 49
Figure 4.8 Potentiodynamic polarisation curves of 904L stainless steel samples in 3.5%
NaCl aerated solution at 25oC ±1oC. ............................................................... 50
Figure 4.9 Potentiodynamic polarisation curves of LDX2101 stainless steel samples in
3.5% NaCl aerated solution at 25oC ±1oC. ...................................................... 50
Figure 4.10 Potentiodynamic polarisation curves of LDX2101+0.13%wt Ru alloy samples
in 3.5% NaCl aerated solution at 25oC ±1oC. .................................................. 51
Figure 4.11 Potentiodynamic polarisation curves of LDX2101+0.20%wt Ru alloy samples
in 3.5% NaCl aerated solution at 25oC ±1oC. .................................................. 52
Figure 4.12 Potentiodynamic polarisation curves of LDX2101+0.31%wt Ru alloy samples
in 3.5% NaCl aerated solution at 25oC ±1oC. .................................................. 53
Figure 4.13 Potentiodynamic polarisation curves of LDX2101+0.66%wt Ru alloy samples
in 3.5% NaCl aerated solution at 25oC ±1oC. .................................................. 54
Figure 4.14 Potentiodynamic polarisation curves of LDX2101+0.66%wt Ru alloy samples
in 3.5% NaCl de-aerated solution at 25oC ±1oC. ............................................. 55
Figure 4.15 Pits observed on LDX2101 samples after potentiodynamic polarisation
examined at 100X magnification. ................................................................... 57
Figure 4.16 Pits observed on LDX2101 with 0.13% Ruthenium samples after
potentiodynamic polarisation examined at 100X magnification. ..................... 58
Figure 4.17 Pits observed on LDX2101 with 0.20% Ruthenium samples after
potentiodynamic polarisation examined at 100X magnification. ..................... 59
Figure 4.18 Pits observed on LDX2101 with 0.31% Ruthenium sample after
potentiodynamic polarisation examined at 100X magnification. ..................... 59
Figure 4.19 Pits observed on LDX2101 with 0.66% Ruthenium samples after
potentiodynamic polarisation examined at 100X magnification. ..................... 60
Figure 5.1 Comparison of microstructures obtained from analysing the alloys as examined
at 500X magnification. ................................................................................... 62
Figure 5.2 Comparison of corrosion potentials of LDX2101 without Ru to LDX2101 with
up to 0.66%wt Ru. ......................................................................................... 63
Figure 5.3 Comparison of corrosion current density of LDX2101 without Ru to LDX2101
with up to 0.66%wt Ru................................................................................... 64
Figure 5.4 Comparison of polarisation resistance of LDX2101 without Ru to LDX2101
with up to 0.66%wt Ru................................................................................... 64
xii
Figure 5.5 Comparison of polarisation resistance of LDX2101 without Ru to LDX2101
with up to 0.66%wt Ru................................................................................... 65
Figure 5.6 Comparison of passive current density of LDX2101 without Ru to LDX2101
with up to 0.66%wt Ru................................................................................... 66
Figure 5.7 Comparison of passive potential range of LDX2101 without Ru to LDX2101
with up to 0.66%wt Ru................................................................................... 67
Figure 5.8 Potentiodynamic polarisation results of produced alloys and 2101LDX samples
in 3.5% NaCl aerated solution at 25°C±1°C. .................................................. 68
Figure 5.9 Comparison of pitting potentials of LDX2101 without Ru to LDX2101 with up
to 0.66%wt Ru. .............................................................................................. 69
Figure 5.10 Results of microscopy of corroded surfaces showing the area that suffered
pitting for every 1 mm2 of the sample in consideration. .................................. 70
Figure 5.11 Comparison of pitting potentials of control alloys to LDX2101 with
0.66%wt Ru. .................................................................................................. 71
Figure 5.12 Potentiodynamic polarisation results of control alloys as compared to 2101LDX
with 0.66% Ru in 3.5% NaCl aerated solution at 25°C±1°C ........................... 72
Figure 5.13 Performance of 2101LDX with 0.66% ruthenium performed in oxygen staved
3.56 NaCl aqueous solution in comparison to aerated 3.56% NaCl aqueous
solution .......................................................................................................... 73
Figure 5.14 Comparison of corrosion and pitting potentials of LDX2101+0.66%wt Ru alloy
with different solution oxygen content. .......................................................... 74
Figure A.1 Comparison of potentiodynamic polarisation curve of two 304L stainless steel
samples in 3.5% NaCl aerated solution at 25oC ±1oC………………………. 87
Figure A.2 Comparison of potentiodynamic polarisation curve of two 2101LDX stainless
steel samples in 3.5% NaCl aerated solution at 25oC ±1oC………………… 88
Figure A.3 Comparison of potentiodynamic polarisation curves of two high alloyed
austenitic stainless steel 904L samples in 3.5% NaCl aerated solution at 25oC
±1oC…………………………………………………………………………. 89
Figure A.4 Comparison of potentiodynamic polarisation curves of two 2101LDX stainless
steel samples with 0.13% Ruthenium in 3.5% NaCl aerated solution at 25oC
±1oC…………………………………………………………………………. 90
Figure A.5 Comparison of potentiodynamic polarisation curves of two 2101LDX stainless
steel samples with 0.20% Ruthenium in 3.5% NaCl aerated solution at 25oC
±1oC………………………………………………………………………… 91
xiii
Figure A.6 Comparison of potentiodynamic polarisation curves of two 2101LDX stainless
steel samples with 0.31% Ruthenium in 3.5% NaCl aerated solution at 25oC
±1oC…………………………………………………………………………. 92
Figure A.7 Comparison of potentiodynamic polarisation curves of two 2101LDX stainless
steel samples with 0.66% Ruthenium in 3.5% NaCl aerated solution at 25oC
±1oC…………………………………………………………………………. 93
Figure A.8 Comparison of potentiodynamic polarisation curves of two 2101LDX stainless
steel samples with 0.66% Ruthenium in 3.5% NaCl de-aerated solution at
25oC ±1oC…………………………………………………………………… 94
Figure B.1 One Year Ruthenium Prices and Price Charts (InvestmentMine 1990 – 2012)………………………………………………………………………… 95
xiv
LIST OF TABLES
Table I: Targeted chemical composition (wt %) of alloys which were produced…..…ii
Table 1.1 Chemical composition and PER number of some stainless steels
(OUTOKUMPU 2009, p. I:48)........................................................................... 2
Table 2.1 Typical chemical composition of stainless steel 304L grade (OUTOKUMPU
2008) ............................................................................................................... 14
Table 2.2 Typical mechanical and physical properties of stainless steel grade 304L
(OUTOKUMPU 2008). ................................................................................... 15
Table 2.3 Typical chemical composition of stainless steel grade 904L (OUTOKUMPU
2008). .............................................................................................................. 15
Table 2.4 Typical mechanical and physical properties of stainless steel grade 904L
(OUTOKUMPU 2008). ................................................................................... 15
Table 2.5 Typical chemical composition of stainless steel grade LDX2101
(OUTOKUMPU 2008). ................................................................................... 16
Table 2.6 Typical mechanical and physical properties of stainless steel grade LDX2101
(OUTOKUMPU 2008). ................................................................................... 16
Table 2.7 Comparison of the typical aimed chromium, nickel and molybdenum content in
control alloys. .................................................................................................. 17
Table 2.8 Comparison of the typical mechanical and physical properties of control alloys. ..
........................................................................................................................ 17
Table 2.9 Summary of electrochemical polarisation techniques for estimating the metal’s
or alloy’s susceptibility to pitting (Yang 2008). ................................................ 22
Table 2.10 Summary of the Effect Secondary Phases (Sedriks 1979). .............................. 31
Table 3.1 Targeted composition (wt %) of alloys which were produced. .......................... 37
Table 3.2 Typical manufacturer’s composition of LDX2101 stainless steel. ..................... 38
Table 3.3 LDX2101 stainless steel and ruthenium used for samples production. .............. 38
Table 4.1 Summary of XRF composition analysis results of the produced samples. ......... 45
Table 4.2 Table of results for all potentiodynamic polarisation tests in 3.5%NaCl aqueous
solution. ......................................................................................................... 56
Table 4.3 Oxygen content before and after solution purging. ........................................... 57
Table 4.4 Summary of results from microscopy of corroded surfaces. ............................ 60
xv
Table 4.5 Passivation current density, passivation potential and passive potential range of
LDX2101 stainless steel and LDX2101 with up to 0.66%wt Ru obtained from
potentiodynamic polarisation curves. ............................................................. 61
Table 5.1 Commercial viability of the produced alloys as compared to the gain made in the
increase of the alloys pitting corrosion resistance. ............................................ 75
Table B.1 Summary of 2012 AAF Prices for 304L, 904L and LDX2101
(OUTOKUMP 2012) .……………………………………………………… 95
Chapter 1 Introduction
Page | 1
1. INTRODUCTION
1.1 BACKGROUND AND MOTIVATION
Failure of stainless steel structures or components due to corrosion is still prevailing in
various industries. Such failures have both economic implications and significant safety
issues (Jones 1992, p. 1-4). Stainless steel manufacturer, Outokumpu Stainless AB,
(OUTOKUMPU 2009) defined corrosion as the physiochemical interaction between a metal
and its environment that results in changes in the properties of the metal, and which may lead
to significant impairment of the function of the metal, the environment, or technical system,
of which these form a part. Corrosion does not refer to deterioration caused by physical
causes (Uhlig 1971). Since stainless steels are not fundamentally noble materials in the same
way as gold or platinum, their corrosion resistance rely mainly on surface passivity. Thus, the
resistance to corrosion of stainless steels results from the presence of a thin oxide or hydrate
film on the surface of the metal, which is considered insoluble, nonporous and self-healing
(Lyman 1984). If the film is broken, it will repair itself when re-exposed to an oxidising
agent. However, under certain environments, permanent breakdown of the film can take place
i.e. the passive layer cannot be rebuilt hence, corrosion occurs on the unprotected surface
(OUTOKUMPU 2004). Depending on the environment or media, the corrosion of stainless
steels can take any of the following forms: general corrosion, pitting corrosion, crevice
corrosion, stress corrosion cracking, sulphide stress corrosion cracking, intergranular
corrosion, galvanic corrosion and contact corrosion (Jones 1992; Kadry 2008).
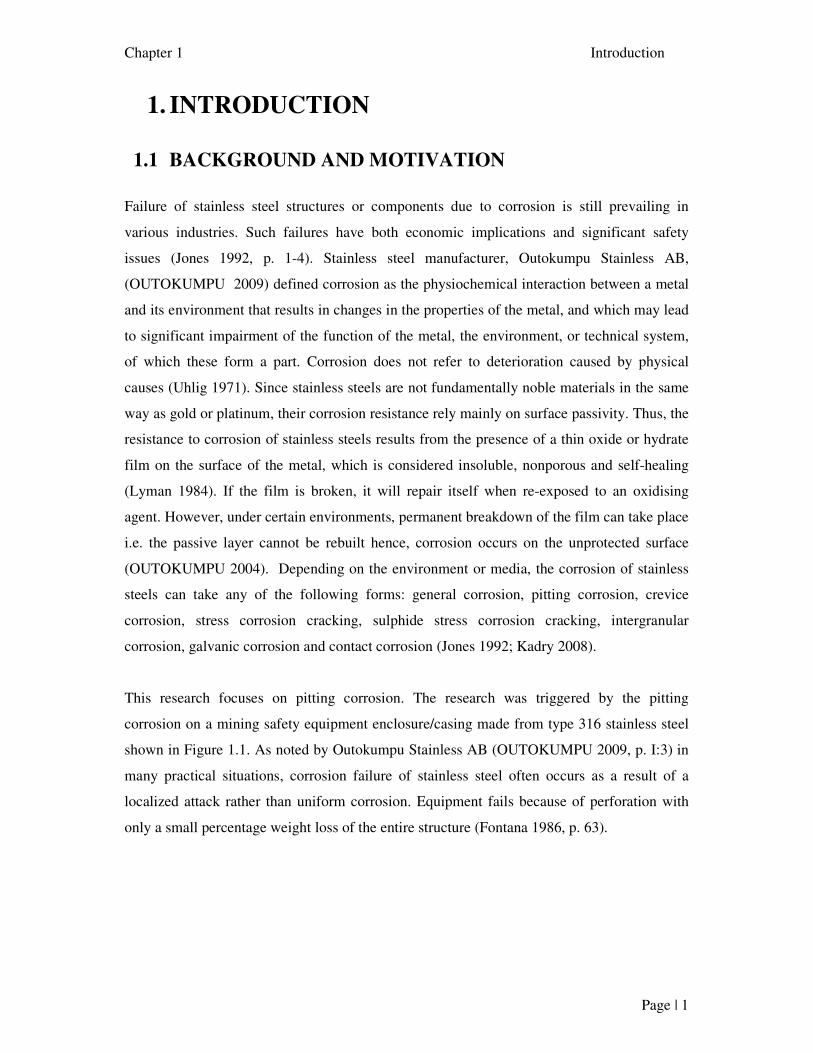
This research focuses on pitting corrosion. The research was triggered by the pitting
corrosion on a mining safety equipment enclosure/casing made from type 316 stainless steel
shown in Figure 1.1. As noted by Outokumpu Stainless AB (OUTOKUMPU 2009, p. I:3) in
many practical situations, corrosion failure of stainless steel often occurs as a result of a
localized attack rather than uniform corrosion. Equipment fails because of perforation with
only a small percentage weight loss of the entire structure (Fontana 1986, p. 63).
Chapter 1 Introduction
Page | 2
Figure 1.1 Pits developing on casing/enclosure for mine application safety equipment.
Different measures have been taken to combat pitting corrosion in stainless steels, which
involve either decreasing the aggressiveness of the environment, or increasing the pitting
corrosion resistance of materials. Decreasing the aggressiveness of the environment is not
always practical in most applications and a significant number of studies have been
performed to increase the pitting corrosion resistance of materials. Such efforts includes:
evaluating the effect of the surface condition, the effect of the microstructure of the stainless
steels and the effect of the composition of stainless steels (Sedriks 1979, p. 70-86). In order to
quantify the influence of alloying elements the Pitting Resistance Equivalent number, PREN,
was developed for stainless steels. This uses the concentrations of chromium, molybdenum
and nitrogen as the beneficial elements to increase the pitting corrosion resistance of stainless
steels. The PRE number is calculated using the equation (1) below (OUTOKUMPU 2004,
p. I:96):
16%N + 3.3%Mo +%Cr = PREN ………………………………………………………… (1)
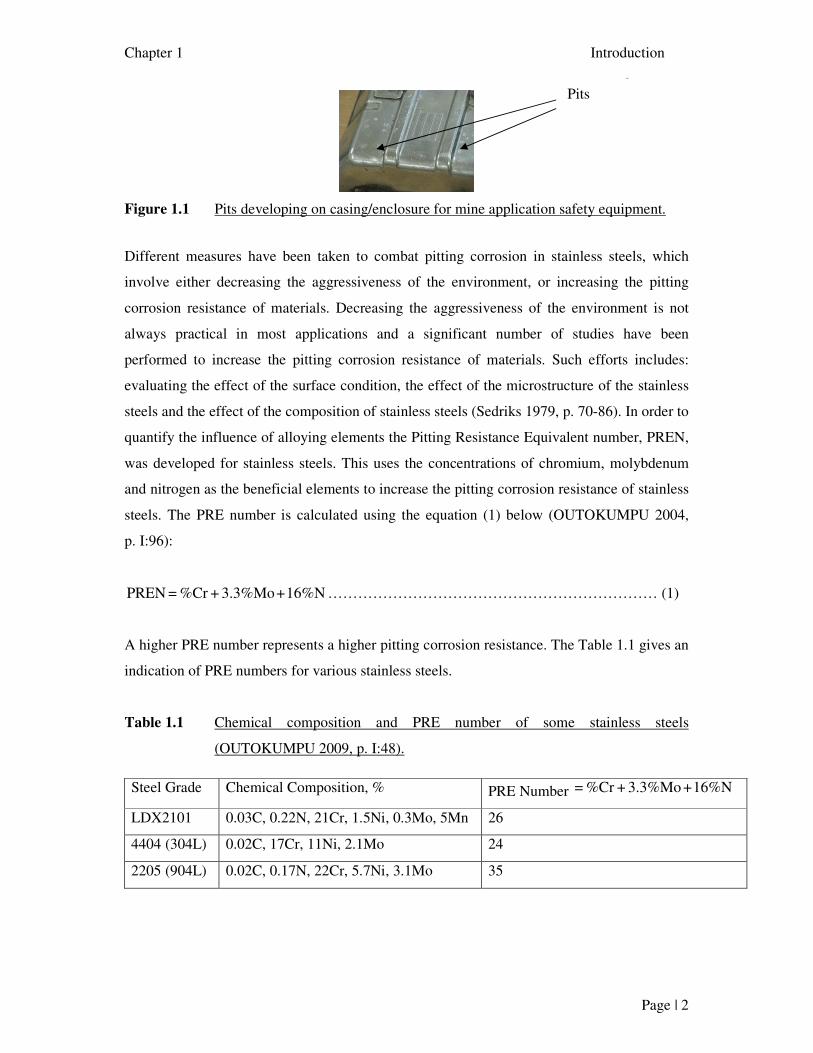
A higher PRE number represents a higher pitting corrosion resistance. The Table 1.1 gives an
indication of PRE numbers for various stainless steels.
Table 1.1 Chemical composition and PRE number of some stainless steels
(OUTOKUMPU 2009, p. I:48).
Steel Grade Chemical Composition, % PRE Number 16%N + 3.3%Mo +%Cr =
LDX2101 0.03C, 0.22N, 21Cr, 1.5Ni, 0.3Mo, 5Mn 26
4404 (304L) 0.02C, 17Cr, 11Ni, 2.1Mo 24
2205 (904L) 0.02C, 0.17N, 22Cr, 5.7Ni, 3.1Mo 35
Pits
Chapter 1 Introduction
Page | 3
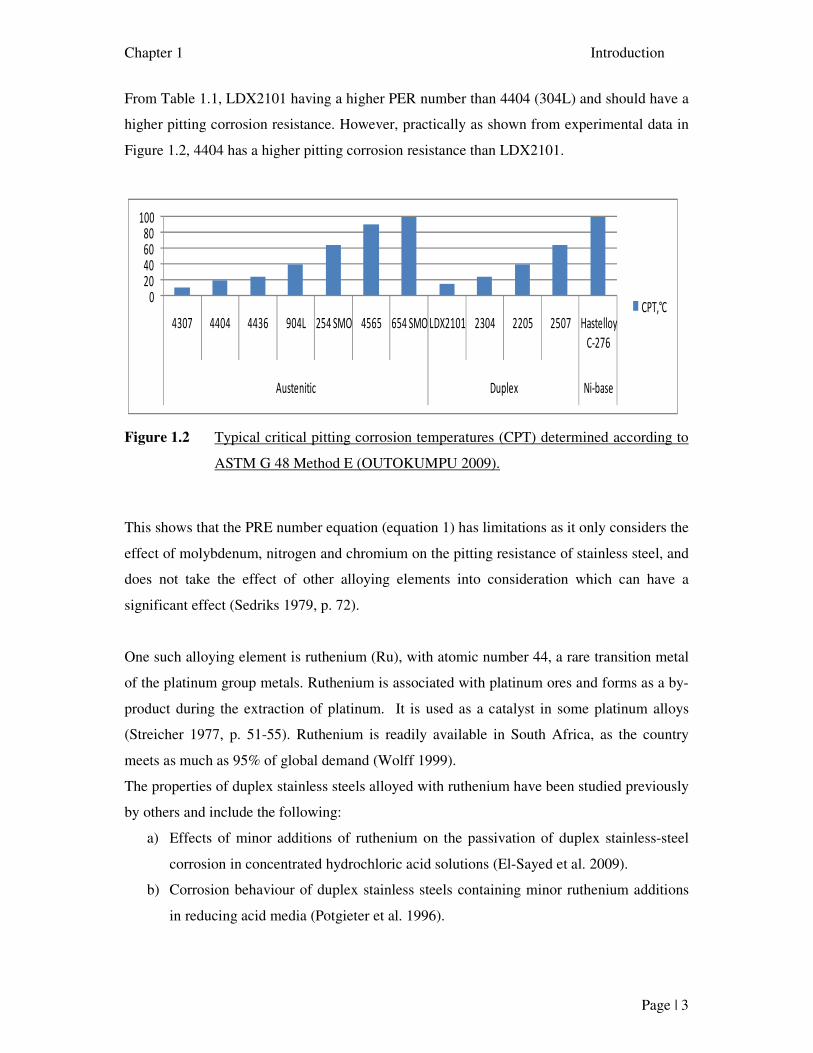
From Table 1.1, LDX2101 having a higher PER number than 4404 (304L) and should have a
higher pitting corrosion resistance. However, practically as shown from experimental data in
Figure 1.2, 4404 has a higher pitting corrosion resistance than LDX2101.
020406080
100
4307 4404 4436 904L 254 SMO 4565 654 SMO LDX2101 2304 2205 2507 Hastelloy
C-276
Austenitic Duplex Ni-base
CPT,°C
Figure 1.2 Typical critical pitting corrosion temperatures (CPT) determined according to
ASTM G 48 Method E (OUTOKUMPU 2009).
This shows that the PRE number equation (equation 1) has limitations as it only considers the
effect of molybdenum, nitrogen and chromium on the pitting resistance of stainless steel, and
does not take the effect of other alloying elements into consideration which can have a
significant effect (Sedriks 1979, p. 72).
One such alloying element is ruthenium (Ru), with atomic number 44, a rare transition metal
of the platinum group metals. Ruthenium is associated with platinum ores and forms as a by-
product during the extraction of platinum. It is used as a catalyst in some platinum alloys
(Streicher 1977, p. 51-55). Ruthenium is readily available in South Africa, as the country
meets as much as 95% of global demand (Wolff 1999).
The properties of duplex stainless steels alloyed with ruthenium have been studied previously
by others and include the following:
a) Effects of minor additions of ruthenium on the passivation of duplex stainless-steel
corrosion in concentrated hydrochloric acid solutions (El-Sayed et al. 2009).
b) Corrosion behaviour of duplex stainless steels containing minor ruthenium additions
in reducing acid media (Potgieter et al. 1996).
Chapter 1 Introduction
Page | 4
These investigations and others have yielded positive results for the inhibition of corrosion of
stainless steels by alloying with ruthenium.
1.2 PROJECT DESCRIPTION
Various studies on adding platinum group metals (PGM) to stainless steels by different
groups and individuals resulted in producing spontaneous passivated alloys with consequent
decreased corrosion rate (Higginson 1989; Mcgill 1990; Streicher 1977, p. 51-55; Wolff
1999). While there is agreement in literature that small additions of PGMs to stainless steels
brings about cathodic modification which improves general corrosion in reducing acidic
environments, pitting corrosion evaluation of such alloys has not produced encouraging
results (Mcgill 1990; Higginson 1989). Mcgill (1990) reviewing various studies, concluded
that only ruthenium, iridium and osmium can be added to stainless steel alloys without
adversely affecting their pitting corrosion resistance. However, a recent study by El-Sayed et
al. (2009), found that small additions of ruthenium to a duplex stainless steel did not only
improved the alloy’s passivation, but also shifted the corrosion and pitting potentials to
higher noble values. Another factor that hindered researches on cathodic modification is cost.
Higginson argued that ‘even 0.2% weight of the alloy, PGMs would account for the major
component of material cost of the cathodically modified alloy’ rendering the alloy
commercially unviable (Higginson 1989). Higginson even recommended future studies to
aim at alloys containing less than 0.2% alloy weight of PGMs (Higginson 1989). However,
El-Sayed et al. suggested a prospect of commercially viable stainless steel alloyed with
ruthenium, since ruthenium is the least expensive of the PGMs (El-Sayed et al. 2009).
Another point of consideration is the readily availability of PGMs in South Africa, as the
country meets as much as 95% of global demand of PGMs (Wolff 1999). Therefore,
contextually, it remains important to focus research on stainless steels alloyed with PGMs. It
should also be noted that LDX2101 is a new low cost stainless steel grade developed by
Outokumpu Stainless and less work has been done in this regard (OUTOKUMPU 2004, p.
I:96 – I:97). It is therefore the objective of this research to evaluate the effect of small
additions of ruthenium on pitting corrosion resistance of LDX2101 duplex stainless steel
alloyed with up to 0.6%wt Ru.
Chapter 1 Introduction
Page | 5
1.3 OTHER OBJECTIVES
Other objectives of this research includes: (a) compare the pitting corrosion resistance of
LDX2101 stainless steel alloyed with ruthenium to pitting corrosion resistance of commercial
grade 304L and grade 904L; (b) evaluate the general corrosion of LDX2101 stainless steel
alloyed with ruthenium and compare the results with the general corrosion of commercial
grades 304L and 904L; (c) evaluate the effect of ruthenium addition to LDX2101 stainless
steel on the microstructure of the resulting alloys; (d) evaluate the effect of oxygen on pitting
corrosion resistance of LDX2010 stainless steel alloyed with ruthenium; and (e) evaluate the
commercial viability of LDX2101 stainless steel alloyed with ruthenium up to 0.6%wt Ru.
1.4 METHODOLOGY
Potentiodynamic polarisation technique will be adopted for this research work in order to
evaluate both general and pitting corrosion. Scanning electron microscopy will be adopted for
microstructure evaluation and any surface imaging requirements. X-ray Fluorescence
Spectroscopy (XRF) technique will be used to verify the composition of the alloys.
1.5 HYPOTHESIS
Since investigations on other duplex stainless steels alloyed with a small percentage of
ruthenium yielded positive results for the inhibition of pitting corrosion, it is therefore much
anticipated that alloying LDX2101 duplex stainless steel with a small percentage of
ruthenium leads to significant pitting corrosion reduction.
1.6 RESEARCH QUESTIONS
This research work will answer the following questions:
(a) Will the small additions of ruthenium to LDX2101 stainless steel have beneficial
effects on general and pitting corrosion of the resulting alloy?
(b) Will the small addictions of ruthenium to LDX2101 stainless steel have detrimental
effect to the microstructure of the resulting alloy?
Chapter 1 Introduction
Page | 6
(c) How will the resulting alloys from alloying LDX2101 stainless steel with ruthenium
perform in oxygen deprived environment?
(d) Even if the results in (a) to (c) are positive, will the resulting alloy be commercially
viable?
1.7 EXPECTED CONTRIBUTION TO KNOWLEDGE
The research study on the effect of small additions of ruthenium on the pitting corrosion
resistance of LDX2101 duplex stainless steel is expected to provide information on:
• Comparative general and pitting corrosion behaviour of stainless steels LDX2101,
304L and 904L to alloys resulting from alloying LDX2101 stainless steel with
ruthenium up to 0.6%wt Ru.
• Performance of LDX2101 stainless steel alloyed with ruthenium up to 0.6%wt Ru in
oxygen deprived environment.
• The commercial viability of LDX2101 stainless steel alloyed with ruthenium up to
0.6%wt Ru.
Chapter 2 Literature Review
Page | 7
2. LITERATURE REVIEW
As pointed out in the project description, this research project is looking at the effect of small
ruthenium additions on the pitting corrosion resistance of duplex stainless steel LDX2101.
This literature survey provides information on: (a) the background history of iron and steel
development. The brief history shows that most inventions were chance discoveries hence,
emphasizing the importance of open minded in research work to be able to observe any
trends in experiments; (b) the general properties of stainless steels based on microstructure,
with more details on stainless steel grades 304L, 904L and LDX2101 which forms the
reference point/control alloys of this research work; (c) corrosion of stainless steels, with
more details provided on pitting corrosion and internal and external factors affecting pitting;
(d) passivity and its influence on pitting corrosion; (e) the effect of alloying elements
(chromium, molybdenum, nickel, manganese, nitrogen and copper) which are found in the
control alloys (304L, 316L, 904L and 2101) on pitting corrosion of steels. The effect of
alloying stainless steels with platinum group metals on pitting corrosion of such alloys has
also been discussed with more details provided on stainless steels alloyed with ruthenium; (f)
methods available to determine an alloy’s susceptibility to pitting corrosion and their
limitations; and (g) methods available to analyse an alloy’s microstructure and composition
of oxide films formed during corrosion
2.1 IRON AND STEEL BACKGROUND
Since the beginning of smelting iron in the early centres of civilization (Egypt, Chaldea,
Babylonia, Assyria and China) which dates back as far as 4000BC (Fisher 1963), man has put
considerable effort to improve iron properties to make iron suitable for different applications.
The earliest improvement was the production of steel. Historians and archaeologists trace
back the origin of relatively high quality steel to India, referred to as wootz steel
(Fisher 1963; McGannon 1971). The advancement in smelting skills such as the invention of
the Bessemer process, the open hearth process (Rollason 1973) in the middle of the
nineteenth century eased and increased the production of steel and hence its applications.
This, in turn, triggered further investigations aimed at improving the properties of steel.
Chapter 2 Literature Review
Page | 8
Amongst others, these investigation lead to the development of steels grouped in certain
categories as discussed in the following sections.
2.1.1 Tungsten Steel
High speed machine tools require hard end steels with a sharp cutting edge that will not blunt
quickly. This resulted in alloying steel with titanium, chromium and tungsten. Tungsten
alloyed steel succeeded considerably in this application, and it is credited to an Austrian
chemist, Franz Koller who inverted it in 1855 (Fisher 1963). Present standard of which,
contain 70% to 80% of tungsten and a maximum of 0.6% carbon (McGannon 1971, p. 258).
2.1.2 Manganese Steel
Machinery which must withstand severe knocks and abrasive action like power shovels,
bulldozers, dipper dredges, ore crushers and similar earth-moving and mining equipment
have their jaws made of manganese steel. In 1882 Hadfield discovered that whereas 1% to
1.5% manganese made a good grade of ordinary steel and 3% to 7% made the steel too brittle
to be of any use, 10% to 15% manganese steel possesses the peculiar property of acquiring
hardness under repeated impact. Robert made this discovery while experimenting with the
objective of producing a hard steel for tramway wheels, and also as a substitute for emery in
grinding wheels (Fisher 1963).
2.1.3 Silicon Steel
In the same search for a hard material to substitute for emery grinding wheels, in 1886 Robert
Hadfield invented a low carbon steel containing from about 1.5% to 5% silicon which found
its use in the cores of transformers and generators of the electricity industry (Fisher 1963).
2.1.4 Steel for Military Application
Between 1877 and 1886, a Frenchman, A. Brustlein advanced the use of chromium steel for
armaments. In 1885, steels alloyed with chromium and nickel, were used for guns, armour
and projectiles in Europe with nickel favoured in guns of heavy calibre (Fisher 1963).
A good observation is that most of these inventions were chance discoveries hence,
emphasizing the importance of open minded in research work to be able to observe any
trends in experiments. Streicher (American Society for Metals 1979) observed the following
three requirements which must be met if a chance observation is to lead to the actual use of
Chapter 2 Literature Review
Page | 9
the new material of construction, a new phenomenon, or a new substance: a) the alertness of
mind to recognize a new phenomenon or effect when it occurs as an unexpected result; b) the
concept or idea for applying this observation for the solution of at least one concrete problem
and; c) the will, opportunity, and skill to apply the new solution in practice within the
available economic framework or the ability and opportunity to find others who will do this.
2.2 STAINLESS STEELS
Stainless steel, as the name implies, are more resistant to rusting and staining than are plain
carbon and low alloy steels (McGannon 1971, p. 1163). Stainless steel was discovered more
or less contemporaneously around 1913 by researchers in Britain and Germany from an early
research, which was originally intended to enable the development of gun barrels for the
military powers (OUTOKUMPU 2008). Stainless steels are ferrous alloys which contain a
minimum of 12% chromium for corrosion and oxidation resistance (Sheir 1976). In stainless
steel development studies, it is important to understand the microstructure and main alloying
composition of the stainless steels as these have a direct influence on pitting corrosion
resistance of the stainless steels. Based on chemical composition and response to heat
treatment, hence the microstructure, there are four major types of stainless steels namely:
martensitic, austenic, ferritic and austenitic-ferritic (duplex) stainless steels (OUTOKUMPU
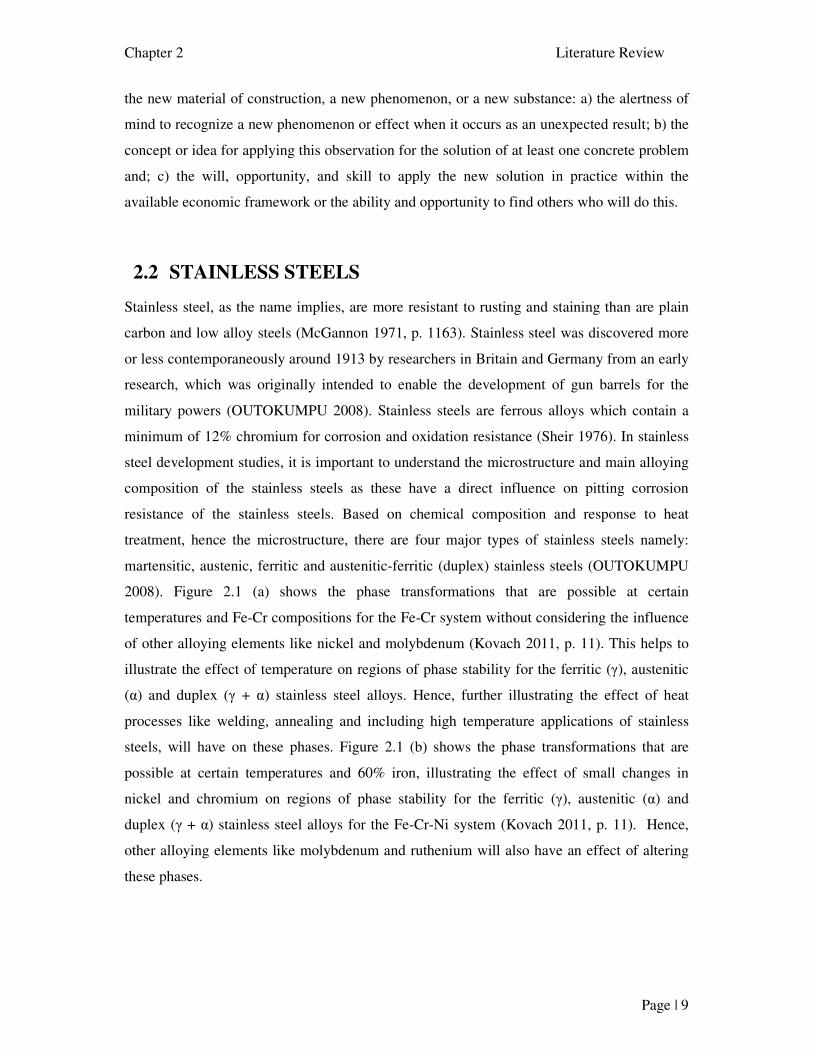
2008). Figure 2.1 (a) shows the phase transformations that are possible at certain
temperatures and Fe-Cr compositions for the Fe-Cr system without considering the influence
of other alloying elements like nickel and molybdenum (Kovach 2011, p. 11). This helps to
illustrate the effect of temperature on regions of phase stability for the ferritic (γ), austenitic
(α) and duplex (γ + α) stainless steel alloys. Hence, further illustrating the effect of heat
processes like welding, annealing and including high temperature applications of stainless
steels, will have on these phases. Figure 2.1 (b) shows the phase transformations that are
possible at certain temperatures and 60% iron, illustrating the effect of small changes in
nickel and chromium on regions of phase stability for the ferritic (γ), austenitic (α) and
duplex (γ + α) stainless steel alloys for the Fe-Cr-Ni system (Kovach 2011, p. 11). Hence,
other alloying elements like molybdenum and ruthenium will also have an effect of altering
these phases.
Chapter 2 Literature Review
Page | 10
(a) Fe-Cr phase diagram
(b) Fe-Cr-Ni phase diagram at 60% Fe
Figure 2.1 Fe-Cr and Fe-Cr-Ni phase diagrams (Kovach 2011, p. 11).
Chapter 2 Literature Review
Page | 11
2.2.1 Austenitic Stainless Steels
Austenite or gamma phase (γ) in Figure 2.1, exists between 910°C and 1400°C where iron is
face-centred cubic (fcc) (Peckner & Bernstein 1977). Austenitic stainless steels are therefore
produced when this structure (fcc) is maintained to lower temperatures hence rendering them
paramagnetic properties. This type of stainless steel is dominant in the market. Examples
include grade 302, 303, 304 and 316 stainless steels. Austenitic steels are characterized by
their high content of austenite-formers, especially nickel. They are also alloyed with
chromium, molybdenum and sometimes with copper, titanium, niobium and nitrogen.
Alloying with nitrogen raises the yield strength of the steels (OUTOKUMPU 2008). Typical
applications of austenitic stainless steels include: chemical industry and the food processing
industry. The molybdenum-free austenite stainless steels have very good high-temperature
properties, and are therefore used in furnaces and heat exchangers (OUTOKUMPU 2008).
Their good impact strength at low temperatures is often exploited in apparatus such as vessels
for cryogenic liquids. Austenitic steels cannot be hardened by heat treatment. They are
normally quench-annealed, which means that they are soft and highly formable. Cold
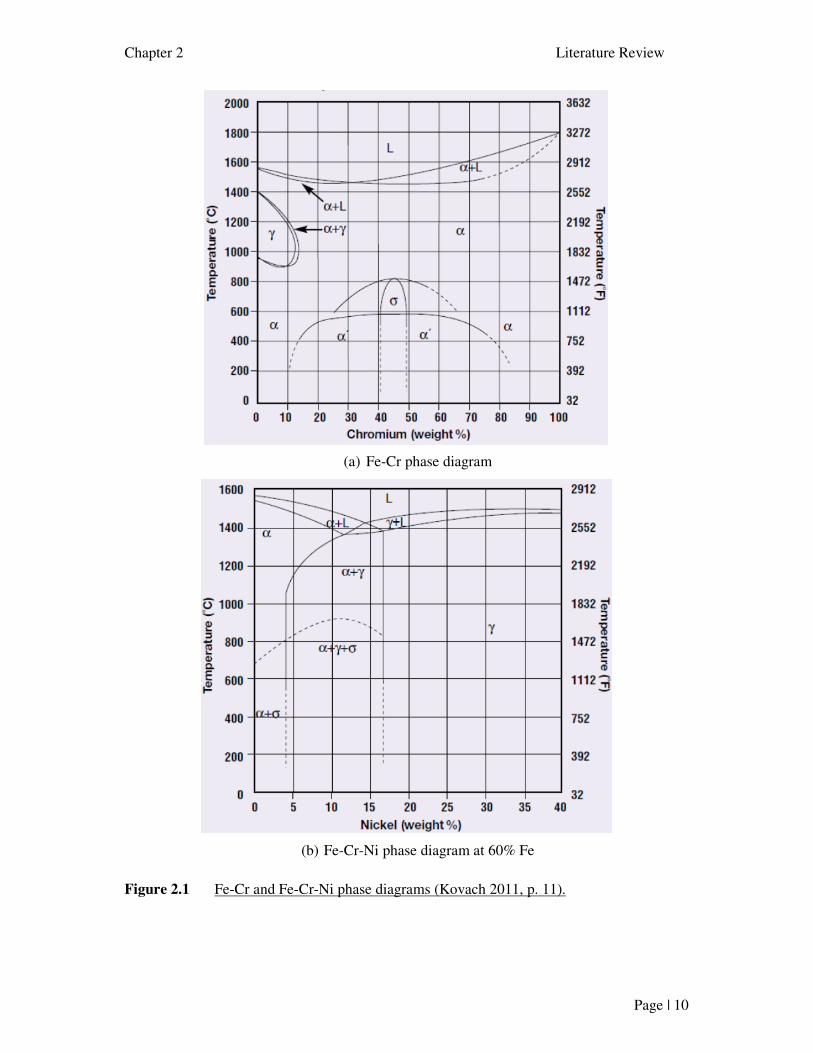
working increases their hardness and strength (OUTOKUMPU 2008). Figure 2.2 is a
microstructure image of an austenitic stainless steel produced by Outokumpu.
Figure 2.2 Microstructure image of an austenitic stainless steel (OUTOKUMPU 2008).
Mechanical/physical properties and typical chemical compositions of the following specific
austenitic steel grades 304L, and 904L, which are control alloys in this research, will be
discussed in detail in section 2.2.5.
2.2.2 Ferritic Stainless Steels
Ferritic stainless steels, consisting of Cr-Fe alpha (α) in Figure 2.1, are in principle ferritic at
room temperature. They have a body-centred cubic (bcc) structure (Peckner &
Chapter 2 Literature Review
Page | 12
Bernstein 1977). This is achieved by a low content of austenite forming elements, mainly
nickel, and a high content of ferrite forming elements, mainly chromium. Typical
applications of ferritic stainless steels include: application in household utensils, catering
equipment and other purposes where corrosion conditions are not particularly demanding.
Ferritic stainless steels with high chromium content, such as 4762 with 24% chromium, are
used at high temperatures where their resistance to sulphurous flue gages is an advantage.
Ferritic steels, such as 4521 with extremely low carbon and nitrogen contents, find greatest
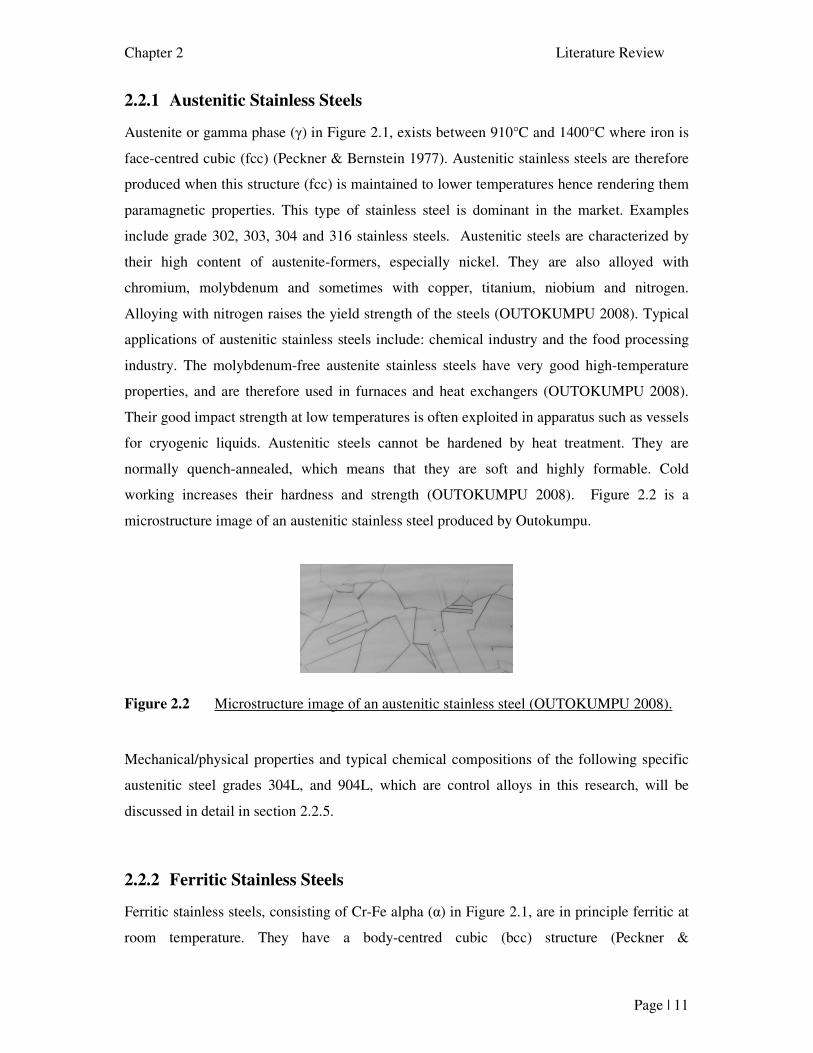
use where there is a risk of stress-corrosion cracking (OUTOKUMPU 2008). Figure 2.3
shows the microstructure of a ferritic stainless steel produced by Outokumpu.
Figure 2.3 Microstructure image of ferritic stainless steel (OUTOKUMPU 2008).
2.2.3 Martensitic Stainless Steels
Martensitic stainless steels are primarily chromium steels which can be hardened by heat
treatment (Lyman 1984). They mostly contain 12% to 13% chromium and are both strong
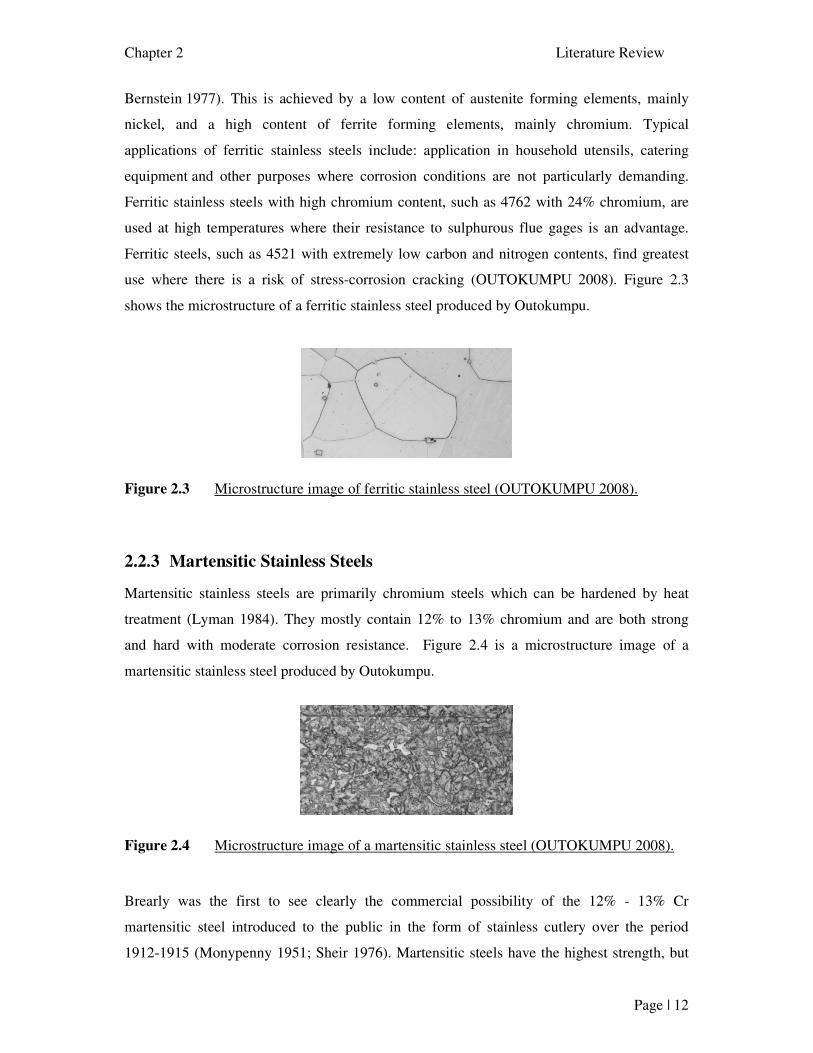
and hard with moderate corrosion resistance. Figure 2.4 is a microstructure image of a
martensitic stainless steel produced by Outokumpu.
Figure 2.4 Microstructure image of a martensitic stainless steel (OUTOKUMPU 2008).
Brearly was the first to see clearly the commercial possibility of the 12% - 13% Cr
martensitic steel introduced to the public in the form of stainless cutlery over the period
1912-1915 (Monypenny 1951; Sheir 1976). Martensitic steels have the highest strength, but
Chapter 2 Literature Review
Page | 13
also the lowest corrosion resistance of the stainless steels. Martensitic steels with high carbon
contents are used for tool steels (OUTOKUMPU 2008). Due to their high strength in
combination with some corrosion resistance, martensitic steels are suitable for applications
where the material is subjected to both corrosion and wear like in hydroelectric turbines.
2.2.4 Austenitic-Ferritic Stainless Steels
Commonly known as duplex stainless steels, this group of steels is intermediate in terms of
structure and alloy content between ferritic and austenitic stainless steels (Alvarez-
Armas 2007). Duplex stainless steels are popularly increasing in their application due to their
excellent combined ferritic and austenic steels properties (Alvarez-Armas 2007; Zhang et al.
2009). Factors which have advanced the development and use of duplex alloys include:
(a) high demand of nickel as an alloying element that pushed up the price of austenitic steels;
(b) increasing activity in the offshore oil industry, an aggressive environment which demands
stainless steels with combined good strength and corrosion properties; (c) the great
improvement in steel production techniques with the introduction of the vacuum and argon
oxygen decarburization practices and; (d) the introduction of continuous casting in stainless
steel production which has contributed to lower production costs and higher quality (Alvarez-
Armas 2007). The main characteristic that differentiates austenitic-ferritic stainless steels
from austenitic and ferritic stainless steels is that they have a higher yield strength and tensile
strength. They are therefore often used in dynamically stressed machine parts, e.g. suction
rolls for paper machines. As already pointed out, new areas of application are within the oil,
gas and petrochemical sector, seawater-bearing systems and the offshore industry
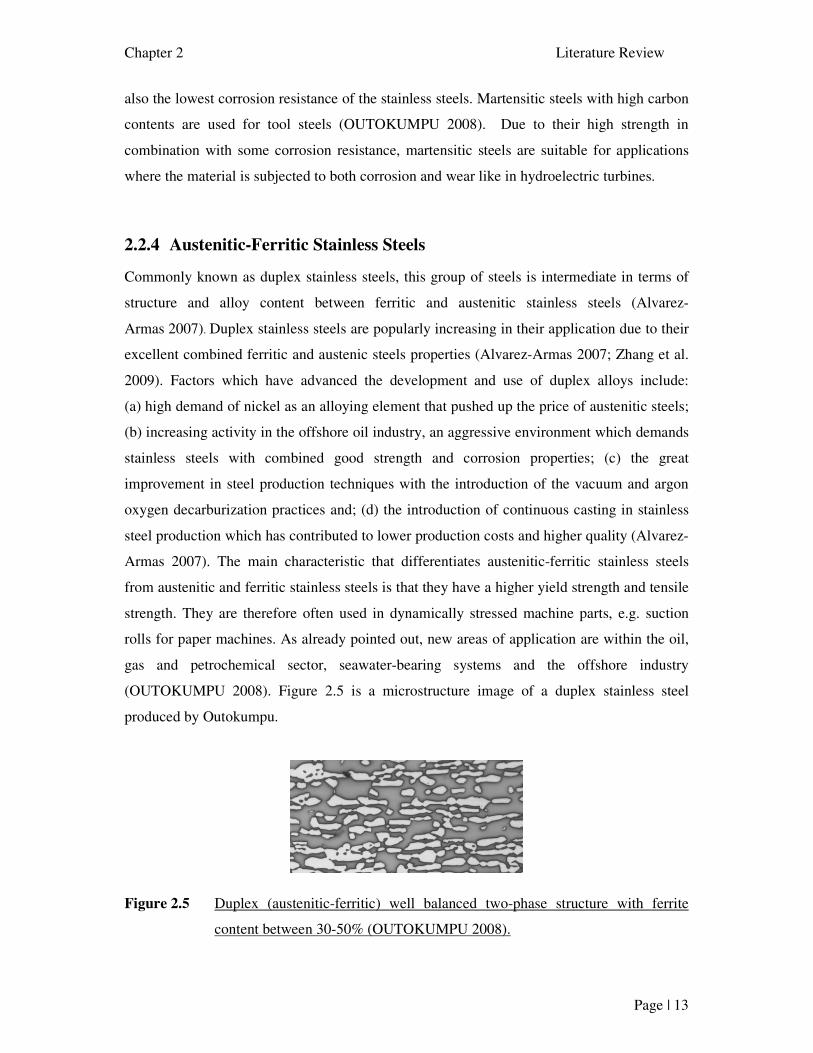
(OUTOKUMPU 2008). Figure 2.5 is a microstructure image of a duplex stainless steel
produced by Outokumpu.
Figure 2.5 Duplex (austenitic-ferritic) well balanced two-phase structure with ferrite
content between 30-50% (OUTOKUMPU 2008).
Chapter 2 Literature Review
Page | 14
Mechanical/physical properties and chemical composition of lean duplex stainless steel
LDX2101 which is also control alloys in this research will be discussed in detail in section
2.2.5.
2.2.5 Control Alloys
Stainless steel grades 304L, 904L and LDX2101 forms the reference point/control alloys of
this research work. Details of their chemical composition, mechanical/physical properties and
their suggested applications which have a bearing on pitting corrosion have been discussed in
sections 2.2.5.1, 2.2.5.2 and 2.2.5.3. The critical pitting temperature and the relative pitting
corrosion resistance of all the control alloys are shown in Figure 1.2.
2.2.5.1 304L Stainless Steel
The 304L stainless steel is a low carbon version of the austenitic 304 stainless steel grade and
is normally used in heavy gauge components for improved weldability. Type 304 stainless
steel is the most versatile and widely used stainless steel. It is still sometimes referred to by
its old name 18/8, which is derived from the nominal composition of type 304 stainless steel
being 18% chromium and 8% nickel (OUTOKUMPU 2008). Type 304 stainless steel is an
austenitic grade that can be severely deep drawn. This property has resulted in 304 stainless
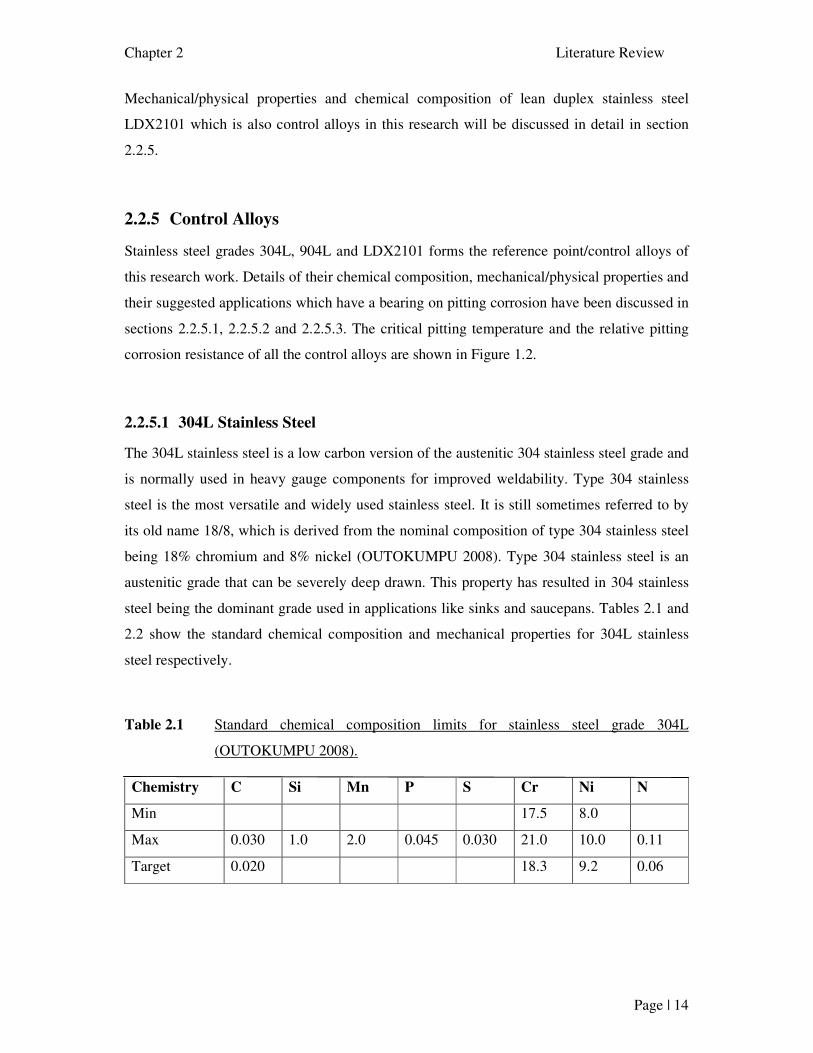
steel being the dominant grade used in applications like sinks and saucepans. Tables 2.1 and
2.2 show the standard chemical composition and mechanical properties for 304L stainless
steel respectively.
Table 2.1 Standard chemical composition limits for stainless steel grade 304L
(OUTOKUMPU 2008).
Chemistry C Si Mn P S Cr Ni N
Min 17.5 8.0
Max 0.030 1.0 2.0 0.045 0.030 21.0 10.0 0.11
Target 0.020 18.3 9.2 0.06
Chapter 2 Literature Review
Page | 15
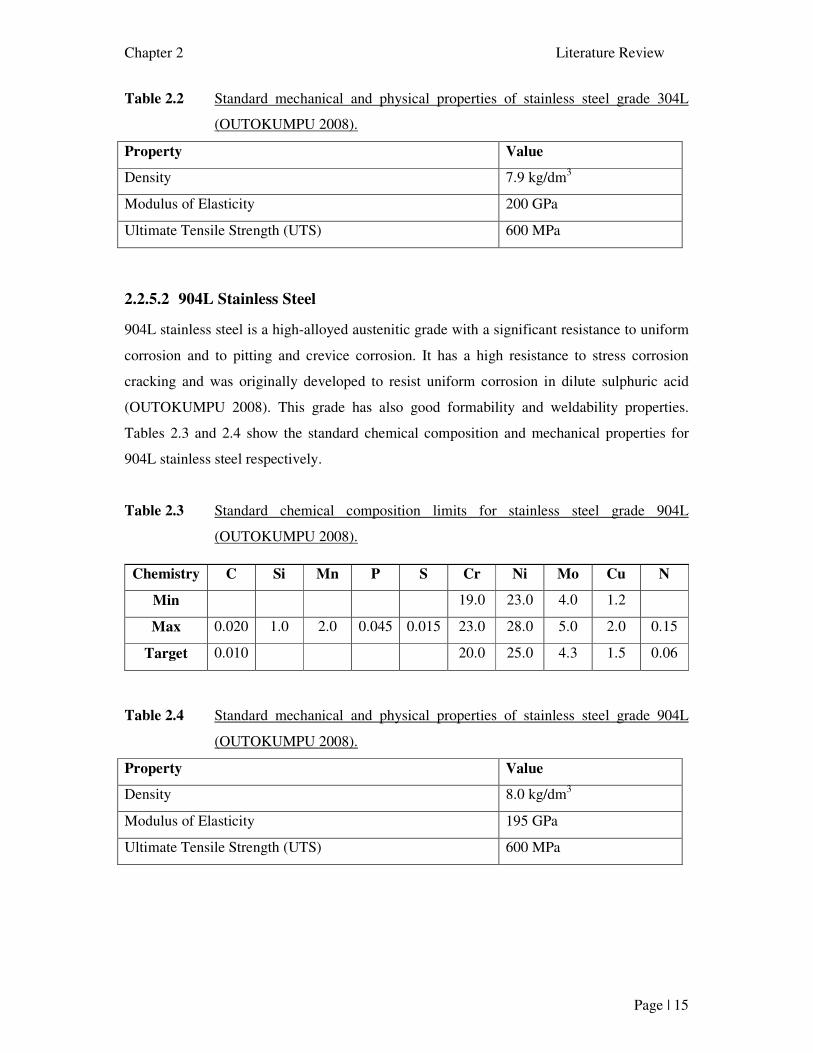
Table 2.2 Standard mechanical and physical properties of stainless steel grade 304L
(OUTOKUMPU 2008).
Property Value
Density 7.9 kg/dm3
Modulus of Elasticity 200 GPa
Ultimate Tensile Strength (UTS) 600 MPa
2.2.5.2 904L Stainless Steel
904L stainless steel is a high-alloyed austenitic grade with a significant resistance to uniform
corrosion and to pitting and crevice corrosion. It has a high resistance to stress corrosion
cracking and was originally developed to resist uniform corrosion in dilute sulphuric acid
(OUTOKUMPU 2008). This grade has also good formability and weldability properties.
Tables 2.3 and 2.4 show the standard chemical composition and mechanical properties for
904L stainless steel respectively.
Table 2.3 Standard chemical composition limits for stainless steel grade 904L
(OUTOKUMPU 2008).
Chemistry C Si Mn P S Cr Ni Mo Cu N
Min 19.0 23.0 4.0 1.2
Max 0.020 1.0 2.0 0.045 0.015 23.0 28.0 5.0 2.0 0.15
Target 0.010 20.0 25.0 4.3 1.5 0.06
Table 2.4 Standard mechanical and physical properties of stainless steel grade 904L
(OUTOKUMPU 2008).
Property Value
Density 8.0 kg/dm3
Modulus of Elasticity 195 GPa
Ultimate Tensile Strength (UTS) 600 MPa
Chapter 2 Literature Review
Page | 16
2.2.5.3 LDX2101 Stainless Steel
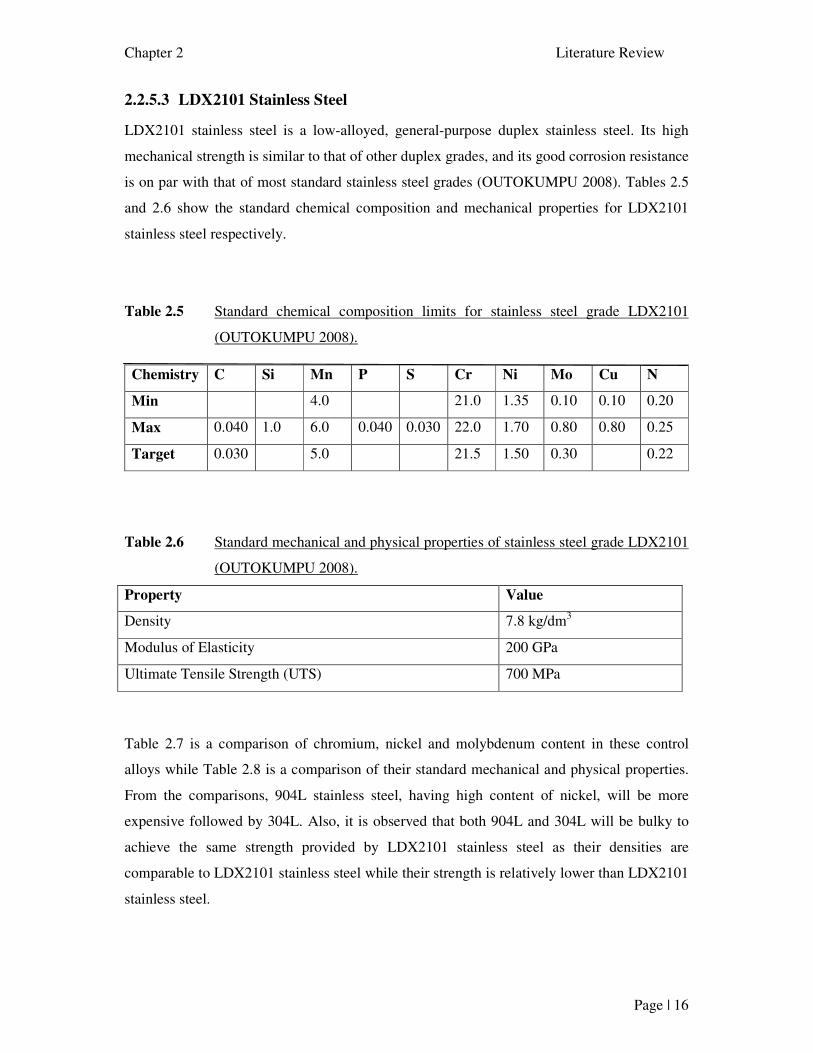
LDX2101 stainless steel is a low-alloyed, general-purpose duplex stainless steel. Its high
mechanical strength is similar to that of other duplex grades, and its good corrosion resistance
is on par with that of most standard stainless steel grades (OUTOKUMPU 2008). Tables 2.5
and 2.6 show the standard chemical composition and mechanical properties for LDX2101
stainless steel respectively.
Table 2.5 Standard chemical composition limits for stainless steel grade LDX2101
(OUTOKUMPU 2008).
Chemistry C Si Mn P S Cr Ni Mo Cu N
Min 4.0 21.0 1.35 0.10 0.10 0.20
Max 0.040 1.0 6.0 0.040 0.030 22.0 1.70 0.80 0.80 0.25
Target 0.030 5.0 21.5 1.50 0.30 0.22
Table 2.6 Standard mechanical and physical properties of stainless steel grade LDX2101
(OUTOKUMPU 2008).
Property Value
Density 7.8 kg/dm3
Modulus of Elasticity 200 GPa
Ultimate Tensile Strength (UTS) 700 MPa
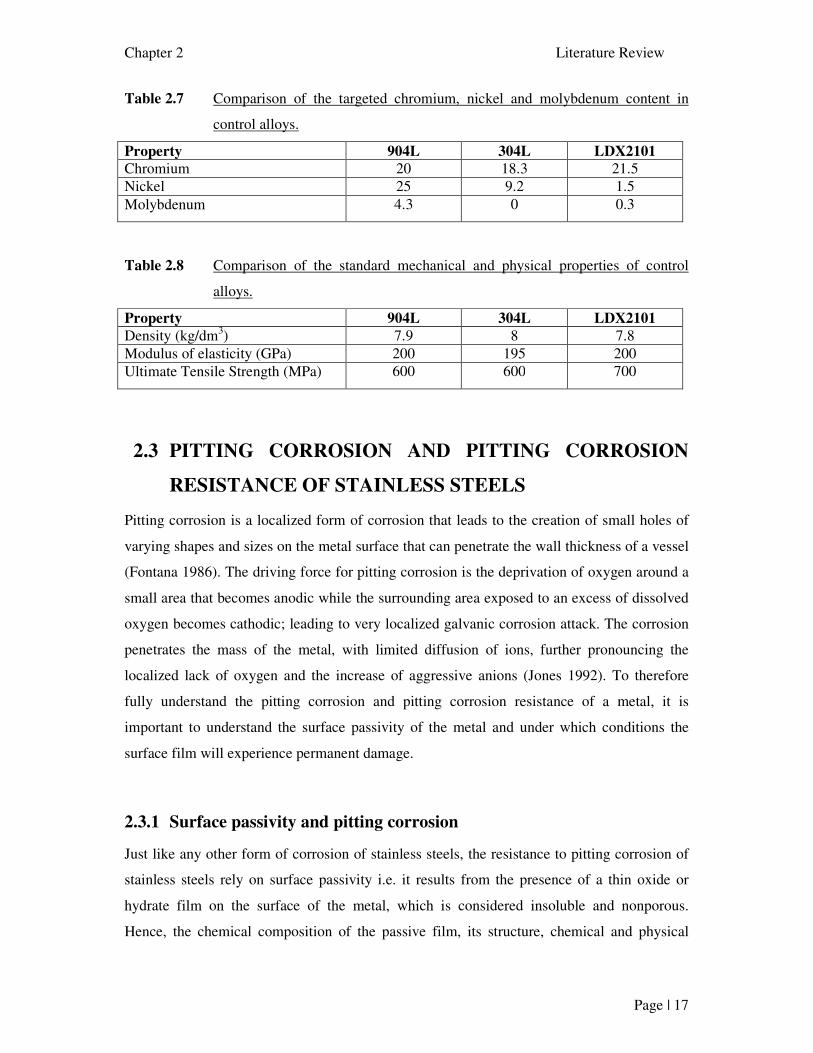
Table 2.7 is a comparison of chromium, nickel and molybdenum content in these control
alloys while Table 2.8 is a comparison of their standard mechanical and physical properties.
From the comparisons, 904L stainless steel, having high content of nickel, will be more
expensive followed by 304L. Also, it is observed that both 904L and 304L will be bulky to
achieve the same strength provided by LDX2101 stainless steel as their densities are
comparable to LDX2101 stainless steel while their strength is relatively lower than LDX2101
stainless steel.
Chapter 2 Literature Review
Page | 17
Table 2.7 Comparison of the targeted chromium, nickel and molybdenum content in
control alloys.
Property 904L 304L LDX2101
Chromium 20 18.3 21.5 Nickel 25 9.2 1.5 Molybdenum 4.3 0 0.3
Table 2.8 Comparison of the standard mechanical and physical properties of control
alloys.
Property 904L 304L LDX2101
Density (kg/dm3) 7.9 8 7.8 Modulus of elasticity (GPa) 200 195 200 Ultimate Tensile Strength (MPa) 600 600 700
2.3 PITTING CORROSION AND PITTING CORROSION
RESISTANCE OF STAINLESS STEELS
Pitting corrosion is a localized form of corrosion that leads to the creation of small holes of
varying shapes and sizes on the metal surface that can penetrate the wall thickness of a vessel
(Fontana 1986). The driving force for pitting corrosion is the deprivation of oxygen around a
small area that becomes anodic while the surrounding area exposed to an excess of dissolved
oxygen becomes cathodic; leading to very localized galvanic corrosion attack. The corrosion
penetrates the mass of the metal, with limited diffusion of ions, further pronouncing the
localized lack of oxygen and the increase of aggressive anions (Jones 1992). To therefore
fully understand the pitting corrosion and pitting corrosion resistance of a metal, it is
important to understand the surface passivity of the metal and under which conditions the
surface film will experience permanent damage.
2.3.1 Surface passivity and pitting corrosion
Just like any other form of corrosion of stainless steels, the resistance to pitting corrosion of
stainless steels rely on surface passivity i.e. it results from the presence of a thin oxide or
hydrate film on the surface of the metal, which is considered insoluble and nonporous.
Hence, the chemical composition of the passive film, its structure, chemical and physical
Chapter 2 Literature Review
Page | 18
properties, coherence, and thickness are of important in the initiation and propagation of
pitting corrosion although there is still considerable controversy in literature regarding its
nature (Szklarska-Smialowska 1986; Yang 2008). It can therefore be deduced that any
alloying element introduced to a stainless steel which will improve these characteristics of the
passive film would also improve the resistance of the steel to corrosion including pitting.
The composition of the oxide film or corrosion inhibiters can be evaluated using the Raman
Spectroscopy. Raman spectroscopy is a powerful surface analysis technique to study the film
that forms on a metal surface during its corrosion or corrosion inhibition in an aggressive
environment (Sherifa, Erasmus & Comins 2010).
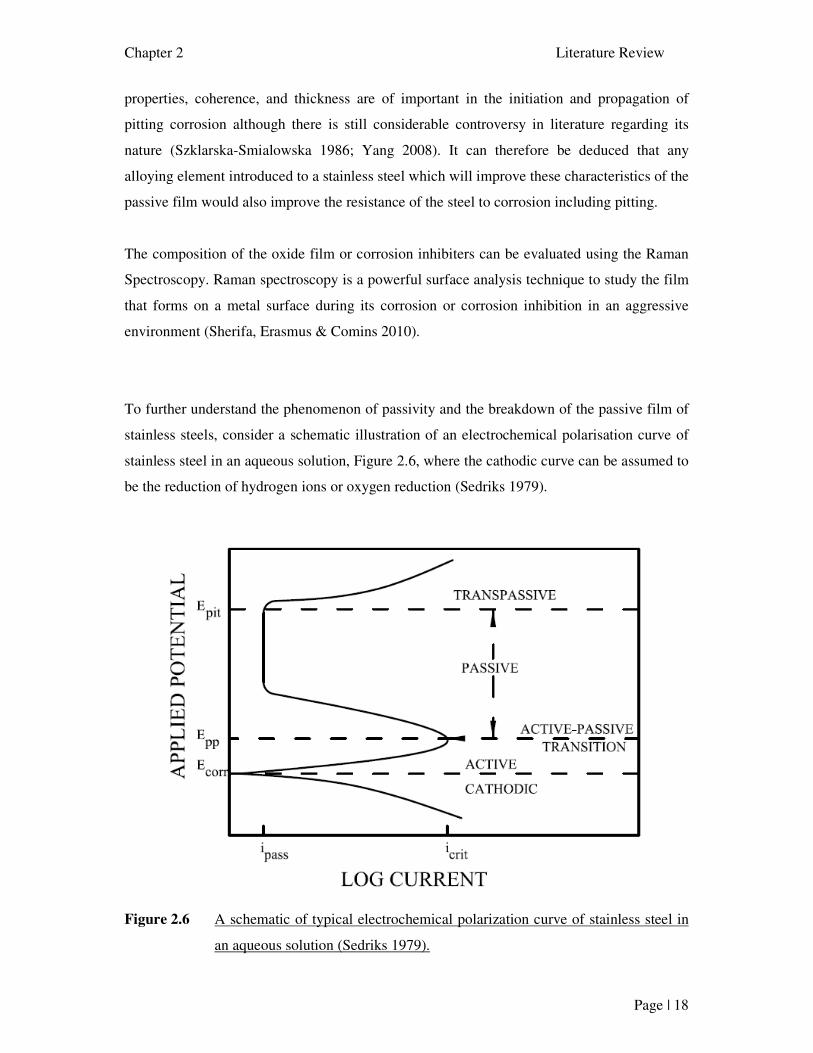
To further understand the phenomenon of passivity and the breakdown of the passive film of
stainless steels, consider a schematic illustration of an electrochemical polarisation curve of
stainless steel in an aqueous solution, Figure 2.6, where the cathodic curve can be assumed to
be the reduction of hydrogen ions or oxygen reduction (Sedriks 1979).
Figure 2.6 A schematic of typical electrochemical polarization curve of stainless steel in
an aqueous solution (Sedriks 1979).
Chapter 2 Literature Review
Page | 19
When the applied potential is increased in the noble direction from the corrosion potential
(Ecorr), the measured current density first ceases to increase with the applied potential at a
potential usually referred to as the primary passivation potential (Epp) (Sedriks 1979; Yang
2008). From Ecorr to Epp (active region) the stainless steel will experience active dissolution
and it is normally susceptible to general corrosion (Wrisley et al. 1990). The current density
corresponding to Epp is referred to as critical current density icrit. When the potential is
increased further, the current density will decrease significantly to a current referred to as the
passivation current (ipass) due to the formation of a passive layer on the stainless steel which
prohibits further active dissolution hence, bringing the stainless steel into a passive state
(passivity) (Frankenthal & Kruger 1978). Epp is therefore a demarcation between the active
region and the passive region hence, it also corresponds to the active-passive transition.
When the applied potential is increased further, the current density or ipass remains constant.
The potential range corresponding to ipass, called the passive potential range, defines passivity
of a given stainless steel/environment combination (Sedriks 1979) and, most of the literature
attributes this to the energy being used to improve the characteristics of the passive film
(Frankenthal & Kruger 1978; Yang 2008) which agrees with the law of conservation of
energy. At high enough potentials the current density would experience a spontaneous
increase with a small increase in applied potential. This sudden current density increase is
mostly associated with localized corrosion, generally pitting corrosion. This passive film
breakdown potential, where sudden current density increases starts, is referred to as pitting
potential (Epit) i.e. the potential where pits are initiated (Frankenthal & Kruger 1978;
Sedriks 1979; Yang 2008; Wrisley et al. 1990).
2.3.2 Pitting corrosion propagation mechanism
The mechanism of pitting corrosion of stainless steel can be divided into three consecutive
steps as follows: initiation, metastable propagation and stable propagation (Qvarfort 1998;
Szklarska-Smialowska 1986). The initiation step is a local breakdown of the passivating
oxide layer by aggressive ions in the environment. The corrosion process can then continue in
the unprotected metal revealed by the initiation step. The corrosion rate is increased by the
fact that an even more aggressive environment is produced by the corrosion reaction itself.
However, at the earlier stages of pit propagation, when the pits are still very small, the pits
can repassivate spontaneously. This stage is often referred to as metastable pit growth. The
Chapter 2 Literature Review
Page | 20
stage of stable propagation is reached when spontaneous repassivation is no longer possible
hence pitting corrosion takes place.
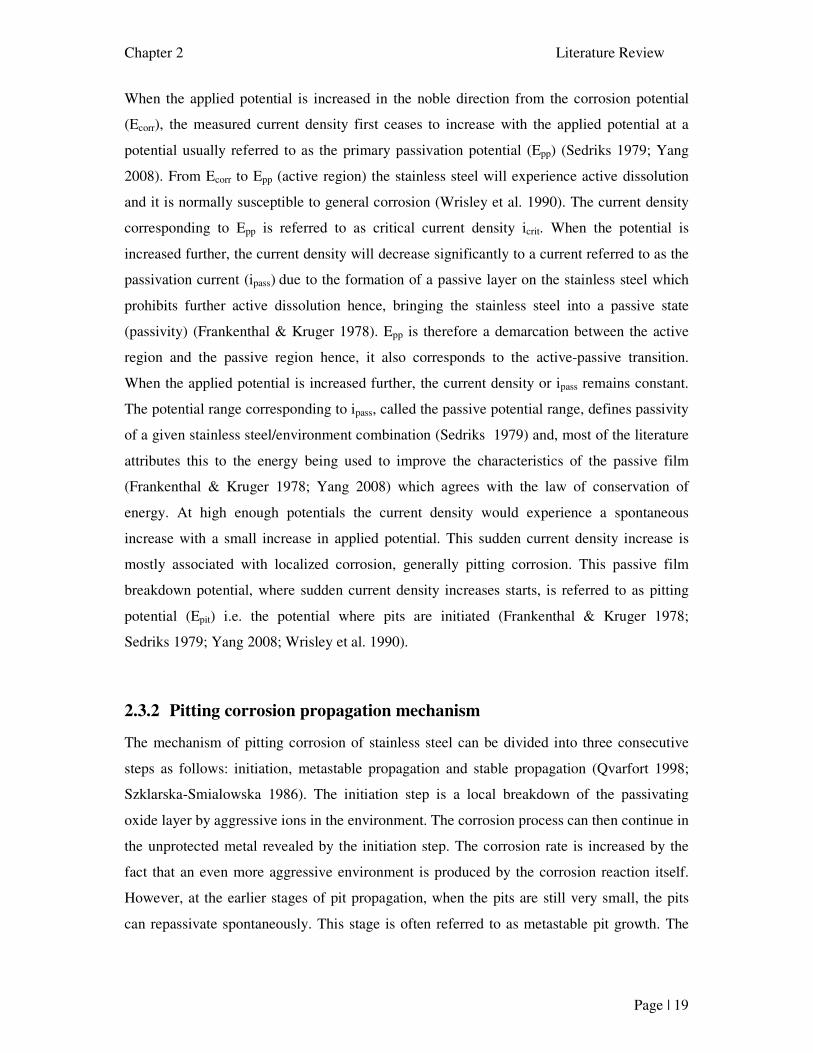
Figure 2.7 is an illustration of the relatively wide accepted mechanism of propagation of the
pitting process (Key to metals 1999; Sedriks 1979). This illustration does not include the
metal oxide cap that form on top of the pit and further inhibits the diffusion of oxygen into
the pit. Up to recently, there is no consensus on mechanism of pit initiation. However, the
initiation of pitting has long been associated with the presence of manganese sulphides (MnS)
inclusions which are difficult to avoid in the steel making process (Key to metals 1999;
Matter-University of Liverpool 2000 ; Schmuki et al. 2004).
Figure 2.7 Schematic illustration of pitting corrosion (Key to metals 1999).
The anodic dissolution of the steel leads to introduction of M+ in solution within the pit. The
increased concentration of these M+ within the pit causes migration of Cl- ions in order to
maintain neutrality. In turn, metal chloride formed M+Cl- is hydrolysed by water to the
hydroxide and free acid:
M + Cl- + H2O ⇒ MOH + H + Cl- (Sedriks 1979)
The generation of the acid causes the drop of pH. The cathodic reaction, on the surface near
the pit follows:
O2 + 2H2O + 4e ⇒ MOH + 4OH- (Sedriks 1979)
Chapter 2 Literature Review
Page | 21
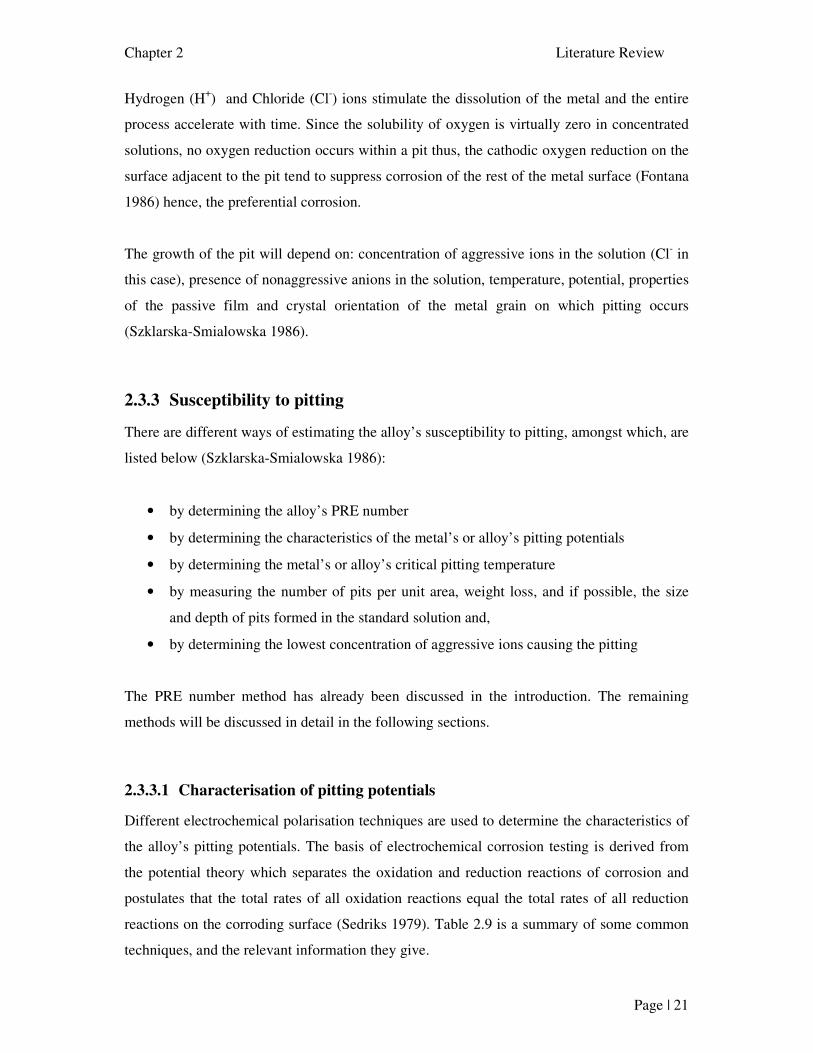
Hydrogen (H+) and Chloride (Cl-) ions stimulate the dissolution of the metal and the entire
process accelerate with time. Since the solubility of oxygen is virtually zero in concentrated
solutions, no oxygen reduction occurs within a pit thus, the cathodic oxygen reduction on the
surface adjacent to the pit tend to suppress corrosion of the rest of the metal surface (Fontana
1986) hence, the preferential corrosion.
The growth of the pit will depend on: concentration of aggressive ions in the solution (Cl- in
this case), presence of nonaggressive anions in the solution, temperature, potential, properties
of the passive film and crystal orientation of the metal grain on which pitting occurs
(Szklarska-Smialowska 1986).
2.3.3 Susceptibility to pitting
There are different ways of estimating the alloy’s susceptibility to pitting, amongst which, are
listed below (Szklarska-Smialowska 1986):
• by determining the alloy’s PRE number
• by determining the characteristics of the metal’s or alloy’s pitting potentials
• by determining the metal’s or alloy’s critical pitting temperature
• by measuring the number of pits per unit area, weight loss, and if possible, the size
and depth of pits formed in the standard solution and,
• by determining the lowest concentration of aggressive ions causing the pitting
The PRE number method has already been discussed in the introduction. The remaining
methods will be discussed in detail in the following sections.
2.3.3.1 Characterisation of pitting potentials
Different electrochemical polarisation techniques are used to determine the characteristics of
the alloy’s pitting potentials. The basis of electrochemical corrosion testing is derived from
the potential theory which separates the oxidation and reduction reactions of corrosion and
postulates that the total rates of all oxidation reactions equal the total rates of all reduction
reactions on the corroding surface (Sedriks 1979). Table 2.9 is a summary of some common
techniques, and the relevant information they give.
Chapter 2 Literature Review
Page | 22
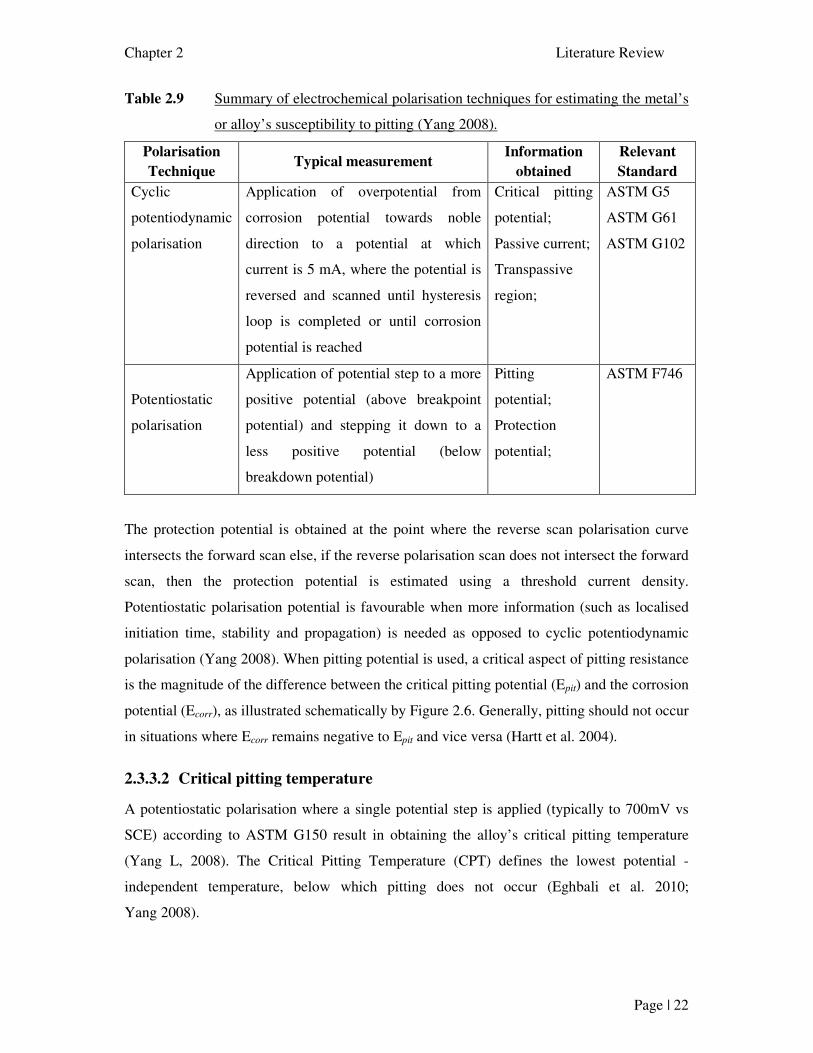
Table 2.9 Summary of electrochemical polarisation techniques for estimating the metal’s
or alloy’s susceptibility to pitting (Yang 2008).
Polarisation
Technique Typical measurement
Information
obtained
Relevant
Standard
Cyclic
potentiodynamic
polarisation
Application of overpotential from
corrosion potential towards noble
direction to a potential at which
current is 5 mA, where the potential is
reversed and scanned until hysteresis
loop is completed or until corrosion
potential is reached
Critical pitting
potential;
Passive current;
Transpassive
region;
ASTM G5
ASTM G61
ASTM G102
Potentiostatic
polarisation
Application of potential step to a more
positive potential (above breakpoint
potential) and stepping it down to a
less positive potential (below
breakdown potential)
Pitting
potential;
Protection
potential;
ASTM F746
The protection potential is obtained at the point where the reverse scan polarisation curve
intersects the forward scan else, if the reverse polarisation scan does not intersect the forward
scan, then the protection potential is estimated using a threshold current density.
Potentiostatic polarisation potential is favourable when more information (such as localised
initiation time, stability and propagation) is needed as opposed to cyclic potentiodynamic
polarisation (Yang 2008). When pitting potential is used, a critical aspect of pitting resistance
is the magnitude of the difference between the critical pitting potential (Epit) and the corrosion
potential (Ecorr), as illustrated schematically by Figure 2.6. Generally, pitting should not occur
in situations where Ecorr remains negative to Epit and vice versa (Hartt et al. 2004).
2.3.3.2 Critical pitting temperature
A potentiostatic polarisation where a single potential step is applied (typically to 700mV vs
SCE) according to ASTM G150 result in obtaining the alloy’s critical pitting temperature
(Yang L, 2008). The Critical Pitting Temperature (CPT) defines the lowest potential -
independent temperature, below which pitting does not occur (Eghbali et al. 2010;
Yang 2008).
Chapter 2 Literature Review
Page | 23
2.3.3.3 Other methods
Pitting corrosion can also be estimated by measuring the number of pits per unit area, weight
loss, and if possible, the size and depth of pits formed in the standard solution and, by
determining the lowest concentration of aggressive ions causing the pitting.
In their study, Berner, Liu and Olsson (2008), recommended potentiodynamic polarisation
method for ranking the relative corrosion resistance of lean duplex stainless steel. This is the
method which will be adopted for this research to rank the relative corrosion resistance of
LDX 2101 stainless steel alloyed with ruthenium compared to the control alloys.
2.3.4 Factors affecting pitting corrosion
Both external and internal factors affect pitting corrosion. Hence, combat pitting corrosion in
stainless steels is targeted at addressing these factors by either decreasing the aggressiveness
of the environment (external factors) or increasing the pitting corrosion resistance of the
materials (internal factors). Decreasing the aggressiveness of the environment is not always
practical in some applications, and hence a significant number of studies have been
developed focusing on increasing the pitting corrosion resistance of stainless steel alloys.
However, understanding of the environment is important in order to develop a solution to any
corrosion problem. Hence, efforts to combat pitting corrosion in stainless steels includes
evaluating the effect of both external (environment composition, temperature, electrode
potential) and internal parameters (alloy composition, heat treatment, microstructure and
surface preparation) among others (Sedriks 1979; Szklarska-Smialowska 1986). The
following paragraphs will discuss these factors affecting pitting corrosion in detail.
2.3.4.1 Effects of external factors on pitting corrosion
These are mostly environmental factors which affects pitting corrosion of stainless steels.
They include: temperature, pH and, availability of aggressive ions and their concentration in
the electrolyte and oxygen content in the electrolyte. These factors are discussed in detail in
the following sections.
Chapter 2 Literature Review
Page | 24
2.3.4.1.1 Effect of pH
According to Szklarska-Smialowska (1986), the most available literature indicates that pitting
corrosion is much less dependent on pH values. However, in their recent studies, Trepanier
and Pelton (2006) found that corrosion test results for stainless steel tested at pH of 1.0, 7.4
and 9.0 indicated both general and pitting corrosion resistance are negatively affected by a
decrease in pH. They also found that although the general and pitting corrosion resistance of
the stainless steel severely deteriorated by exposure to low pH solution, repassivation of the
stainless steel was possible. However, repassivation of the stainless steel at a pH of 7.4 and
9.0 was not observed. They concluded that repassivation may have been possible at low pH
because the samples in this group were polarized to low potentials. Trepanier and Pelton
(2006) further found that increase in the pH from 7.4 to 9.0 did not affect the corrosion
resistance of the stainless steel. This suggests that there is a pH threshold above which
general and pitting corrosion resistance of stainless steel is less dependent on pH. Trepanier
and Pelton (2006) results and observations agrees with research study results by Malik et al.
(1990) where they found that low pH and stagnancy provided most favourable conditions for
pit growth. Under conditions of 4-5 ppm dissolved oxygen and 25° C, Malik et al. (1990)
observed that pits grew between 450 and 325 microns at pH 4 under static and dynamic
conditions, when 316L stainless steel specimens were immersed in 300 ppm chloride
solutions for 4 months. At higher pH’s (7 and 10), and the same conditions, the depth rarely
exceeded 70 microns.
2.3.4.1.2 Electrolyte Composition
As discussed, pitting corrosion is caused by aggressive ions present in the electrolyte. The
most common aggressive ion which attacks stainless steels is chloride (British Stainless Steel
Association 2007 – 2012). Figure 2.8 (a) shows the effect of chloride concentration on pitting
corrosion (Hartt et al. 2004). Szklarska-Smialowska (1986) found that the majority of
construction materials suffer from pitting corrosion only in solutions containing Cl- or other
halogen ions. Three main reasons are given for the specific effects of chloride and its ability
to produce pitting as follows: (i) chloride forming a complex with cation and hydroxide (ii)
its ability to increase the activity of hydrogen ions in the pit electrolyte and, (iii) forming a
salt layer at the bottom of pits. The third factor appears to explain the specific role of halides
in pitting attack. It is suggested that transmission from passivity to pitting condition can be
Chapter 2 Literature Review
Page | 25
explained by competitive adsorption mechanism in which chloride ions move into the double
layer (oxide/liquid interface) of the electrode surface, eventually reaching at a critical
potential (E pit), corresponding to the Cl- concentration required to displace adsorbed oxygen
species (Uhlig 1971). The presence of adsorbed Cl- increases the potential difference across
the passive film thereby enhancing the rate of metal ion diffusion from the metal/film
interface to film/solution interface. This leads to the formation of cation vacancies at the
metal/film interface which normally disappear into the bulk of the metal. When the Cl-
concentration is such that the rate of cation diffusion, and thus the formation of cation
vacancies, is greater than the rate of disappearance of cation vacancies, voids develop at the
metal/film interface. Continued growth of a void results in the localized collapse of the
passive film, which will subsequently dissolve faster than other regions of the passive film
leading to pit growth and ultimately substrate alloy dissolution. Anions such as BO3-2, SO4
-2
and ClO4-2 also have the same effect. An increase in chloride concentration thus results in an
increase in the stainless steel’s susceptibility to pitting corrosion. Asaduzzaman, Mustafa and
Islam (2011) in their studies on “Effects of Concentration of Sodium Chloride Solution on the
Pitting Corrosion Behaviour of AISI-304L Austenitic Stainless Steel” agrees with this
phenomenon as they observed that pitting corrosion resistance of AISI-304L stainless steel
reduced with the increase in NaCl concentration from 0.5%NaCl to 4.5%NaCl in aqueous
media. This is in agreement with research study results by Malika et al. (1990) where they
observed that pitting behaviour of 316L in Cl- containing solutions is greatly influenced by
the variation in Cl- concentration where higher Cl- concentration in the electrolyte increased
the steels susceptibility to pitting. Szklarska-Smialowska (1986) even observed that for each
alloy/environment condition, there exist a minimum concentration of the aggressive ions
below which pitting will not occur.
2.3.4.1.3 Temperature
Generally high temperature is a catalyst for chemical reactions, hence, increases corrosion
rates and an increase temperature changes may move a metal form passive to active state
(Sheir 1976; Souzaa, Rossitti & Rolloa 2009). Figure 2.8 (b) shows effect of temperature on
pitting corrosion (Hartt et al. 2004). This is in agreement with the study results by Trepanier
and Pelton (2006), where they found out that as the temperature was increased from 10°C and
80°C, a shift in the polarization curve towards lower potentials was observed. However, in
their research, Laycock and Newman (1998) found that pitting potentials of austenitic
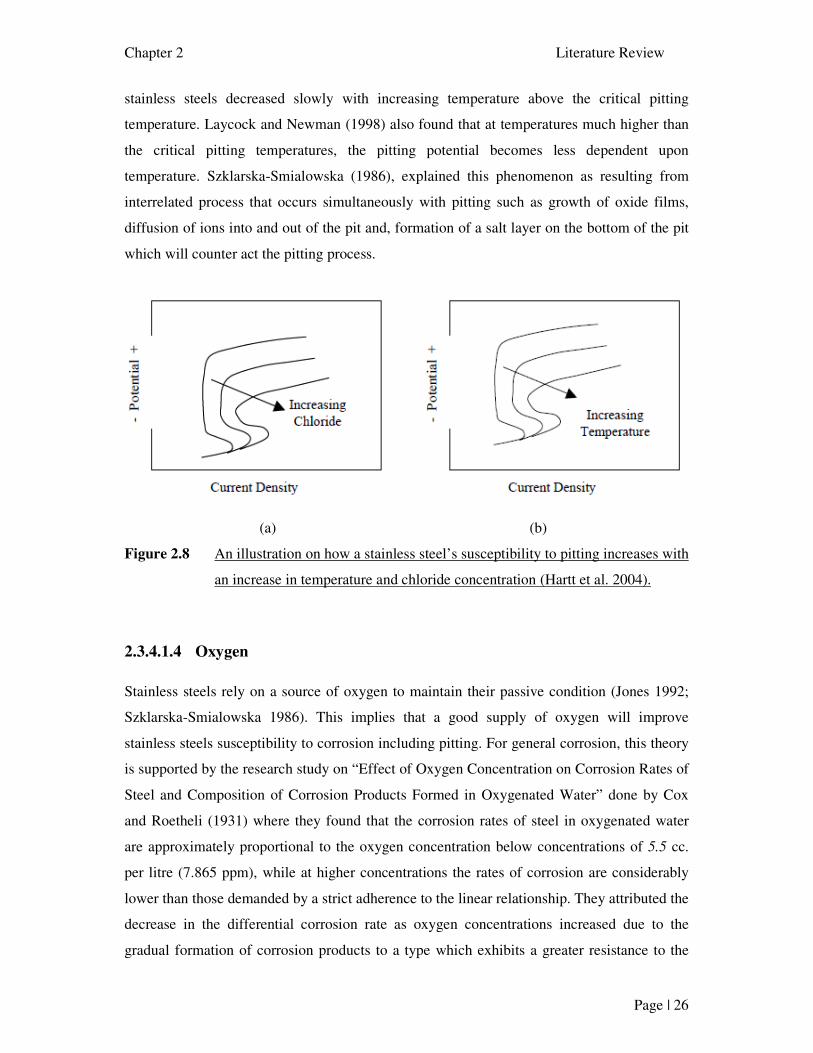
Chapter 2 Literature Review
Page | 26
stainless steels decreased slowly with increasing temperature above the critical pitting
temperature. Laycock and Newman (1998) also found that at temperatures much higher than
the critical pitting temperatures, the pitting potential becomes less dependent upon
temperature. Szklarska-Smialowska (1986), explained this phenomenon as resulting from
interrelated process that occurs simultaneously with pitting such as growth of oxide films,
diffusion of ions into and out of the pit and, formation of a salt layer on the bottom of the pit
which will counter act the pitting process.
(a) (b)
Figure 2.8 An illustration on how a stainless steel’s susceptibility to pitting increases with
an increase in temperature and chloride concentration (Hartt et al. 2004).
2.3.4.1.4 Oxygen
Stainless steels rely on a source of oxygen to maintain their passive condition (Jones 1992;
Szklarska-Smialowska 1986). This implies that a good supply of oxygen will improve
stainless steels susceptibility to corrosion including pitting. For general corrosion, this theory
is supported by the research study on “Effect of Oxygen Concentration on Corrosion Rates of
Steel and Composition of Corrosion Products Formed in Oxygenated Water” done by Cox
and Roetheli (1931) where they found that the corrosion rates of steel in oxygenated water
are approximately proportional to the oxygen concentration below concentrations of 5.5 cc.
per litre (7.865 ppm), while at higher concentrations the rates of corrosion are considerably
lower than those demanded by a strict adherence to the linear relationship. They attributed the
decrease in the differential corrosion rate as oxygen concentrations increased due to the
gradual formation of corrosion products to a type which exhibits a greater resistance to the
Chapter 2 Literature Review
Page | 27
transfer of oxygen. At low oxygen concentrations the corrosion product formed consists
largely of a granular black magnetic oxide of iron which is not resistant to the transfer of the
oxygen, while at higher oxygen concentrations the protective gelatinous ferric hydroxide is
formed. At low oxygen concentrations the rate of oxidation of ferrous ions to form ferric
hydroxide is slow enough to permit the precipitation of both the ferrous and ferric hydroxides
with the subsequent formation of magnetic oxide. On the other hand at high oxygen
concentrations the rate of oxidation of ferrous ions to ferric is high enough to prevent the
accumulation of ferrous ions so that only the protective ferric hydroxide is precipitated.
Aerated seawater however can be more corrosive than de-aerated seawater. It has been found
that very low levels of oxygen, such as those found at sea depths of around 200 metres, make
seawater less aggressive. This is associated with the slowing down of pitting corrosion rates
(British Stainless Steel Association 2007 – 2012) The observations by the British Stainless
Steel Association is also backed by the research study results by Vasilenko (2007) on “The
Effect of Oxygen Concentration on the Corrosion of Heat Supply Networks and Heat
Exchangers” where he observed that higher oxygen concentrations in the heating network
water resulted in higher pitting corrosion experienced by the tubes during down time. This
disagreement in literature confirms the complexity of the pitting corrosion process which is
dependent on more than one variable hence, the need to consider an alloy/environment
combination in corrosion evaluations.
2.3.4.2 Effects of internal factors on pitting corrosion of Stainless Steels
These are factors inhibited by the stainless steel alloy which includes composition,
microstructure, and surface conditions. These are normally directly linked to the stainless
steel production processes. The following sections will discuss these factors in detail.
2.3.4.2.1 Effects of stainless steel production processes
Processes used in the production of stainless steels have a direct influence on microstructure
and hence pitting corrosion of the steel. It has already been shown in Section 2.2 that not only
based on composition, but also at different heat treatment procedures how ferritic, austenitic,
martensitic and duplex stainless steels are produced. It is therefore important to verify that the
processes adopted in the production of stainless steels achieve the intended alloy to be
Chapter 2 Literature Review
Page | 28
produced. The following are some other processes in steel production and their effect on
pitting corrosion:
2.3.4.2.1.1 Cold working
In their study, Peguet, Malki and Baroux (2006) showed that altering the metal shape by
plastic deformation (cold working) generally increased the stainless steel susceptibility to
pitting. This is due to the fact that both thickness and composition of passive films are likely
to be modified in many ways by cold working. However, the transfer resistance and
interfacial capacitance do not appear to change linearly as a function of cold reduction.
Although there is no agreement in literature that cold working reduces the alloys pitting
potential, Szklarska-Smialowska (1986) agrees with the findings of Peguet, Malki and
Baroux (2006) that the density of pits distribution was likely substantially increased on cold
worked samples.
2.3.4.2.1.2 Sensitisation
If a stainless steel is heat-treated to exhibit the susceptibility of intergranular corrosion in an
aqueous media, it is referred to as sensitization. Generally, sensitization has an adverse
influence on pitting corrosion resistance stainless steels (Ebrahimi et al. 2010; Torres et
al. 1998). This is due to the depletion of Cr along the stainless steel grain boundaries hence,
rendering the passive film less protective along these regions (Szklarska-Smialowska 1986).
2.3.4.2.2 The effect of the surface condition
As discussed, corrosion of stainless steels, including pitting corrosion, starts form the surface
of the metal. As such, the surface finish of the stainless steel alloy plays a major role in
preventing or enhancing pitting. Sedriks (1979) pointed that it is meaningless to compare the
pitting tendencies of different alloys having different surface finishes. Generally, pitting
corrosion resistance increases with improved surface conditions both chemically and
physically (Szklarska-Smialowska 1986). Such surface conditions include surface roughness
and chemical surface treatment like pickling and passivation and they have been discussed
further in the following sections.
Chapter 2 Literature Review
Page | 29
2.3.4.2.2.1 Surface Roughness
Surface roughness is the finish on the stainless steel which results from different mechanical
processes used in production of stainless steel and stainless steel products such as milling. A
research study by Mathiesen, Nielsen and Frantsen (2006) on the “Influence of Various
Surface Conditions on Pitting Corrosion Resistance of Stainless Steel Tubes Type EN
1.4404” showed improvement on critical pitting temperature and fewer pits on the surface of
the tested specimen on electro-polished finish samples as compared to ground finish samples.
This is in agreement with the research study results by Zatkalikova and Liptakova (2011) on
“Pitting Corrosion of Stainless Steel at the Various Surface Treatment” where they found that
the size and the shape of pits formed on their test samples were evidently related to the form
of mechanical finishing (blasting and turning).This is why when ranking pitting corrosion
resistance of different alloys, it is important to ensure that the samples being compared have
the same surface finish.
2.3.4.2.2.2 Chemical surface treatment (Pickling and Passivation)
Pickling is the removal of any high temperature scale and any adjacent low chromium layer
of metal from the surface of stainless steel by chemical means (ASSDA 2010). Where the
steel has been heated by welding, heat treatments or other means, to the point where a
coloured oxide layer can be seen, there is a chromium depleted layer on the surface of the
steel underneath the oxide layer. The lower chromium content gives lower corrosion
resistance. To restore the best corrosion resistant performance, the damaged metal layer must
be removed, exposing a fully alloyed stainless steel surface. Mechanical removal may leave
abrasive or other particles embedded (interfering with corrosion performance) or may be
impractical, so chemical means are usually employed. Procedures incorporating pickling
solutions of nitric (HNO3) and hydrofluoric (HF) acids remove the scale and the underlying
chromium depleted layer and restore the corrosion resistance. Pickling solutions also remove
contaminants such as ferrous and ferric oxide particles. Pickling solutions other than mixtures
of nitric and hydrofluoric acids exist and can be used for specialized applications. Pickling
pastes, where the solution is mixed with an inert carrier, are commonly used to treat selected
areas such as welds. Pickling involves metal removal and a change or dulling in the visual
brightness of the metal. Electro-polishing is a useful alternative to pickling.
Chapter 2 Literature Review
Page | 30
Passivation is the treatment of the surface of stainless steels, often with acid solutions or
pastes, to remove contaminants and promote the formation of the passive film on a freshly
created surface through grinding, machining or mechanical damage (ASSDA 2010).
Common passivation treatments include nitric acid (HNO3) solutions or pastes which will
clean the steel surface of free iron contaminants. Care must be taken in selecting and using
passivation treatments to ensure the selected treatment will target the contaminant.
Passivation will also aid in the rapid development of the passive oxide film on the steel's
surface. Passivation does not usually result in a marked change in appearance of the steel
surface.
Pickling and passivation are both acid treatments and neither will remove grease or oil. If the
fabrication is dirty, it may be necessary to use a detergent or alkaline clean before pickling or
passivation. Also, both pickling and passivation solutions can employ dangerous acids that
can damage both the operator and the environment if not handled correctly. Stainless pickling
acids are highly corrosive to carbon steel. It is essential that all acids are thoroughly removed
by rinsing the component after completing the process. Residual hydrofluoric acid will
initiate pitting corrosion. It may be advantageous to neutralize the acid with an alkali before
the rinsing step. ASTM A380 Standard Practice for Cleaning, De-scaling and Passivation of
Stainless Steel Parts, Equipment and Systems is a valuable source of information on pickling
and passivation treatments.
In their research, Zatkalikova and Liptakova (2011) also found that chemical surface
treatment (pickling and passivation) improved the protective passive film of stainless steels.
Pickling and passivation transformed the roughness and segmentation of variously
mechanically treated surfaces, thereby creating the capillary effect in close crevices which
changed kinetics of the pitting corrosion.
2.3.4.2.3 The effect of the microstructure
How stainless steels are structured on a microscopic level plays an important part in
determining pitting resistance of an alloy. Stainless steel microstructures are influenced by
composition and, processes/methods used to produce and treat stainless steels. The effect of
composition, which in turn also influences the microstructure, will be discussed separately.
Studies have shown that secondary phases, such as sulphides, delta ferrite, sigma and
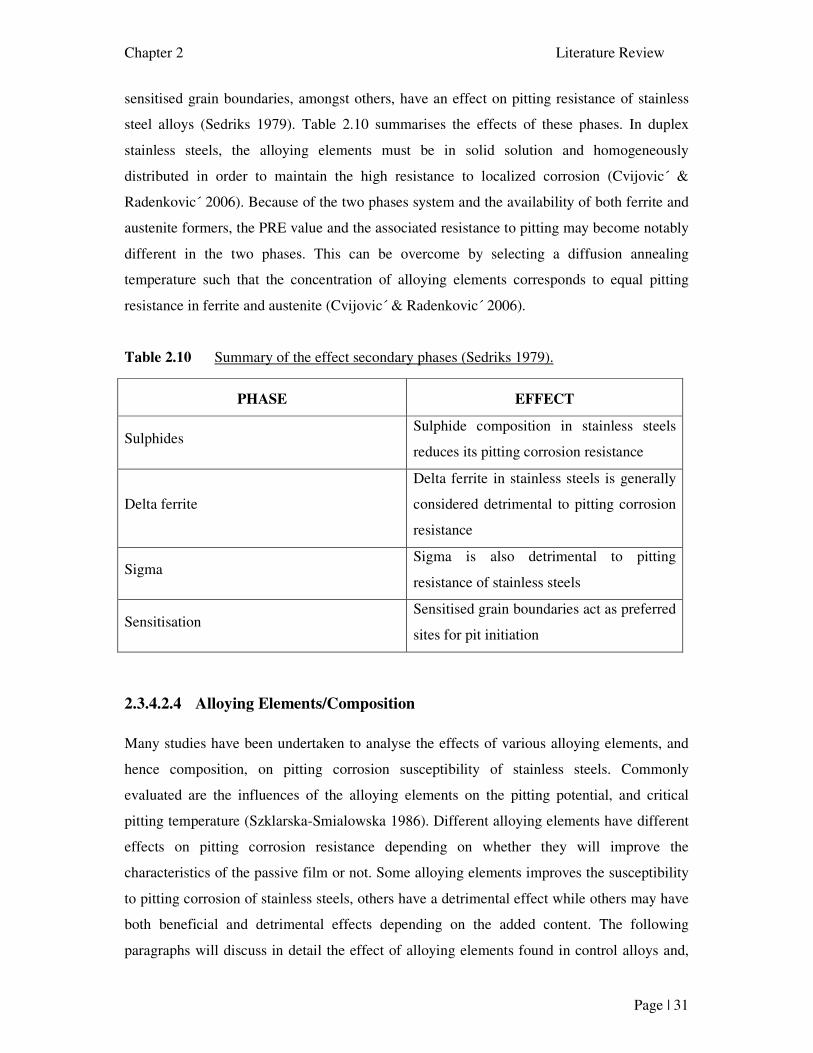
Chapter 2 Literature Review
Page | 31
sensitised grain boundaries, amongst others, have an effect on pitting resistance of stainless
steel alloys (Sedriks 1979). Table 2.10 summarises the effects of these phases. In duplex
stainless steels, the alloying elements must be in solid solution and homogeneously
distributed in order to maintain the high resistance to localized corrosion (Cvijovic´ &
Radenkovic´ 2006). Because of the two phases system and the availability of both ferrite and
austenite formers, the PRE value and the associated resistance to pitting may become notably
different in the two phases. This can be overcome by selecting a diffusion annealing
temperature such that the concentration of alloying elements corresponds to equal pitting
resistance in ferrite and austenite (Cvijovic´ & Radenkovic´ 2006).
Table 2.10 Summary of the effect secondary phases (Sedriks 1979).
PHASE EFFECT
Sulphides Sulphide composition in stainless steels
reduces its pitting corrosion resistance
Delta ferrite
Delta ferrite in stainless steels is generally
considered detrimental to pitting corrosion
resistance
Sigma Sigma is also detrimental to pitting
resistance of stainless steels
Sensitisation Sensitised grain boundaries act as preferred
sites for pit initiation
2.3.4.2.4 Alloying Elements/Composition
Many studies have been undertaken to analyse the effects of various alloying elements, and
hence composition, on pitting corrosion susceptibility of stainless steels. Commonly
evaluated are the influences of the alloying elements on the pitting potential, and critical
pitting temperature (Szklarska-Smialowska 1986). Different alloying elements have different
effects on pitting corrosion resistance depending on whether they will improve the
characteristics of the passive film or not. Some alloying elements improves the susceptibility
to pitting corrosion of stainless steels, others have a detrimental effect while others may have
both beneficial and detrimental effects depending on the added content. The following
paragraphs will discuss in detail the effect of alloying elements found in control alloys and,
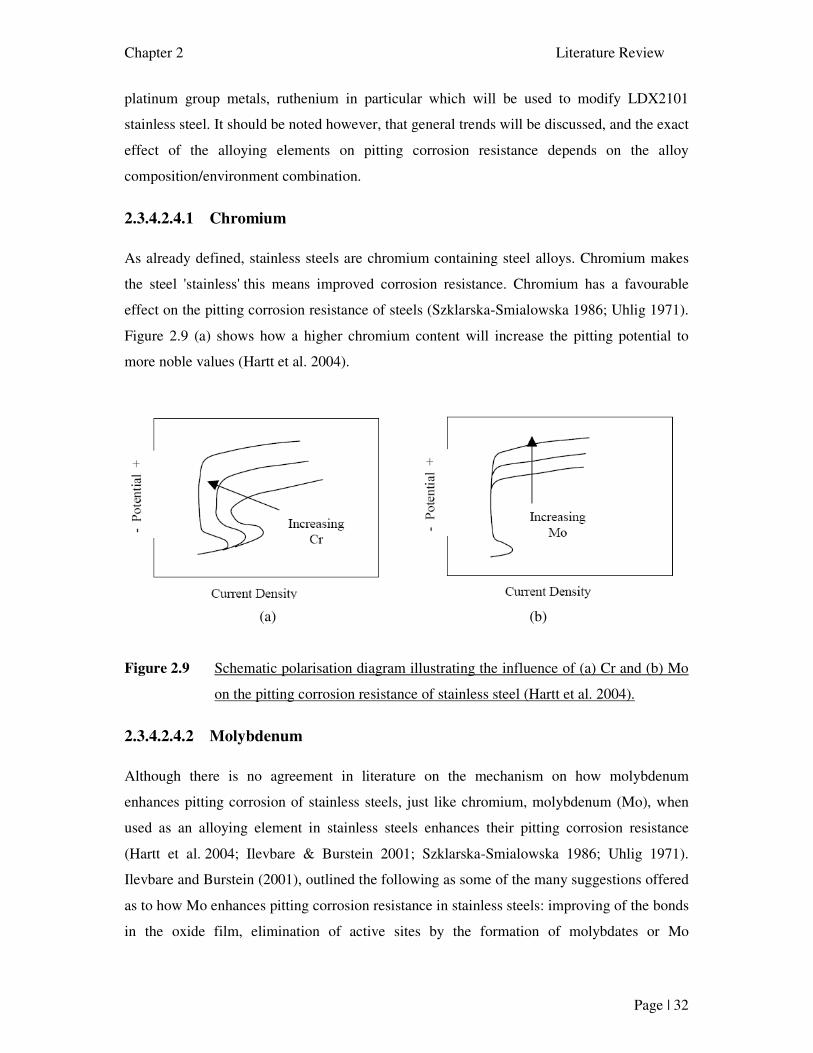
Chapter 2 Literature Review
Page | 32
platinum group metals, ruthenium in particular which will be used to modify LDX2101
stainless steel. It should be noted however, that general trends will be discussed, and the exact
effect of the alloying elements on pitting corrosion resistance depends on the alloy
composition/environment combination.
2.3.4.2.4.1 Chromium
As already defined, stainless steels are chromium containing steel alloys. Chromium makes
the steel 'stainless' this means improved corrosion resistance. Chromium has a favourable
effect on the pitting corrosion resistance of steels (Szklarska-Smialowska 1986; Uhlig 1971).
Figure 2.9 (a) shows how a higher chromium content will increase the pitting potential to
more noble values (Hartt et al. 2004).
(a) (b)
Figure 2.9 Schematic polarisation diagram illustrating the influence of (a) Cr and (b) Mo
on the pitting corrosion resistance of stainless steel (Hartt et al. 2004).
2.3.4.2.4.2 Molybdenum
Although there is no agreement in literature on the mechanism on how molybdenum
enhances pitting corrosion of stainless steels, just like chromium, molybdenum (Mo), when
used as an alloying element in stainless steels enhances their pitting corrosion resistance
(Hartt et al. 2004; Ilevbare & Burstein 2001; Szklarska-Smialowska 1986; Uhlig 1971).
Ilevbare and Burstein (2001), outlined the following as some of the many suggestions offered
as to how Mo enhances pitting corrosion resistance in stainless steels: improving of the bonds
in the oxide film, elimination of active sites by the formation of molybdates or Mo
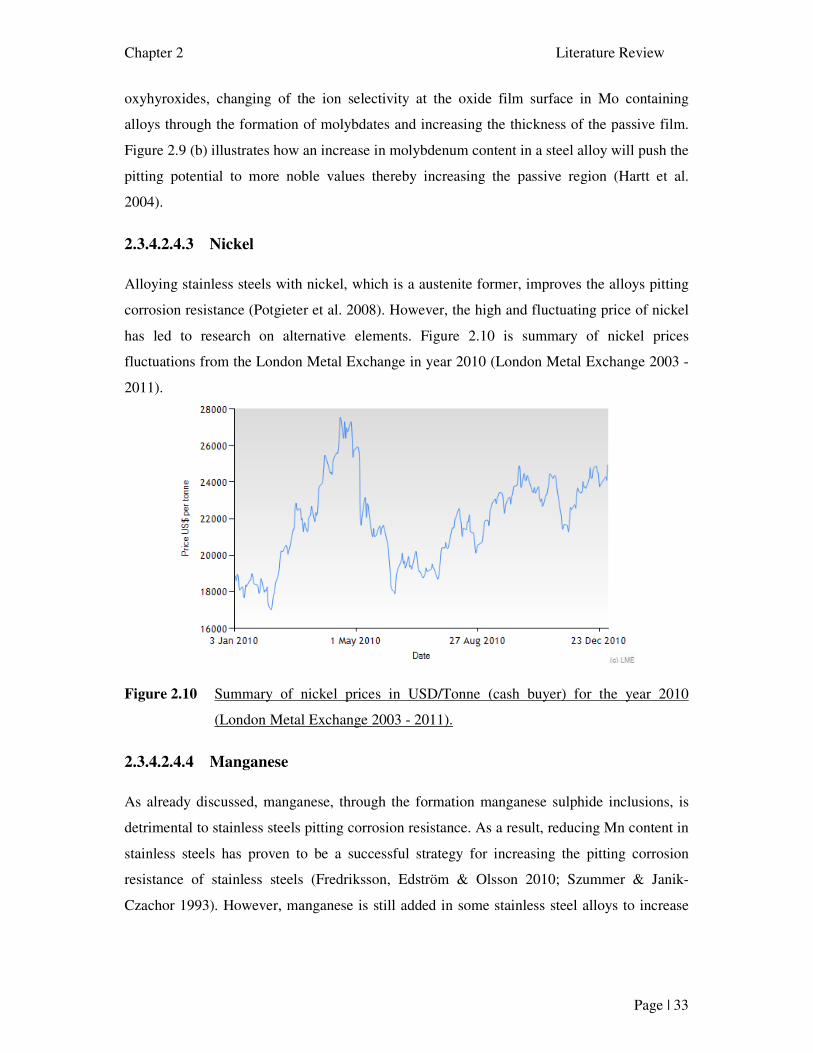
Chapter 2 Literature Review
Page | 33
oxyhyroxides, changing of the ion selectivity at the oxide film surface in Mo containing
alloys through the formation of molybdates and increasing the thickness of the passive film.
Figure 2.9 (b) illustrates how an increase in molybdenum content in a steel alloy will push the
pitting potential to more noble values thereby increasing the passive region (Hartt et al.
2004).
2.3.4.2.4.3 Nickel
Alloying stainless steels with nickel, which is a austenite former, improves the alloys pitting
corrosion resistance (Potgieter et al. 2008). However, the high and fluctuating price of nickel
has led to research on alternative elements. Figure 2.10 is summary of nickel prices
fluctuations from the London Metal Exchange in year 2010 (London Metal Exchange 2003 -
2011).
Figure 2.10 Summary of nickel prices in USD/Tonne (cash buyer) for the year 2010
(London Metal Exchange 2003 - 2011).
2.3.4.2.4.4 Manganese
As already discussed, manganese, through the formation manganese sulphide inclusions, is
detrimental to stainless steels pitting corrosion resistance. As a result, reducing Mn content in
stainless steels has proven to be a successful strategy for increasing the pitting corrosion
resistance of stainless steels (Fredriksson, Edström & Olsson 2010; Szummer & Janik-
Czachor 1993). However, manganese is still added in some stainless steel alloys to increase
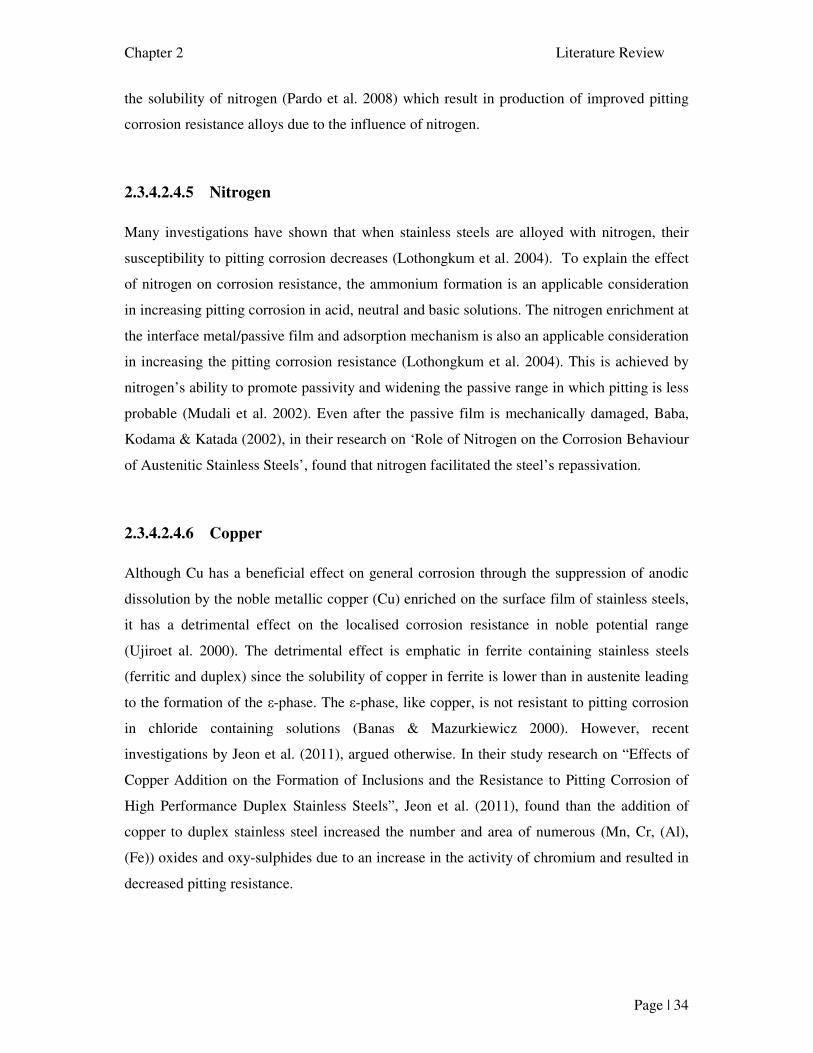
Chapter 2 Literature Review
Page | 34
the solubility of nitrogen (Pardo et al. 2008) which result in production of improved pitting
corrosion resistance alloys due to the influence of nitrogen.
2.3.4.2.4.5 Nitrogen
Many investigations have shown that when stainless steels are alloyed with nitrogen, their
susceptibility to pitting corrosion decreases (Lothongkum et al. 2004). To explain the effect
of nitrogen on corrosion resistance, the ammonium formation is an applicable consideration
in increasing pitting corrosion in acid, neutral and basic solutions. The nitrogen enrichment at
the interface metal/passive film and adsorption mechanism is also an applicable consideration
in increasing the pitting corrosion resistance (Lothongkum et al. 2004). This is achieved by
nitrogen’s ability to promote passivity and widening the passive range in which pitting is less
probable (Mudali et al. 2002). Even after the passive film is mechanically damaged, Baba,
Kodama & Katada (2002), in their research on ‘Role of Nitrogen on the Corrosion Behaviour
of Austenitic Stainless Steels’, found that nitrogen facilitated the steel’s repassivation.
2.3.4.2.4.6 Copper
Although Cu has a beneficial effect on general corrosion through the suppression of anodic
dissolution by the noble metallic copper (Cu) enriched on the surface film of stainless steels,
it has a detrimental effect on the localised corrosion resistance in noble potential range
(Ujiroet al. 2000). The detrimental effect is emphatic in ferrite containing stainless steels
(ferritic and duplex) since the solubility of copper in ferrite is lower than in austenite leading
to the formation of the ε-phase. The ε-phase, like copper, is not resistant to pitting corrosion
in chloride containing solutions (Banas & Mazurkiewicz 2000). However, recent
investigations by Jeon et al. (2011), argued otherwise. In their study research on “Effects of
Copper Addition on the Formation of Inclusions and the Resistance to Pitting Corrosion of
High Performance Duplex Stainless Steels”, Jeon et al. (2011), found than the addition of
copper to duplex stainless steel increased the number and area of numerous (Mn, Cr, (Al),
(Fe)) oxides and oxy-sulphides due to an increase in the activity of chromium and resulted in
decreased pitting resistance.
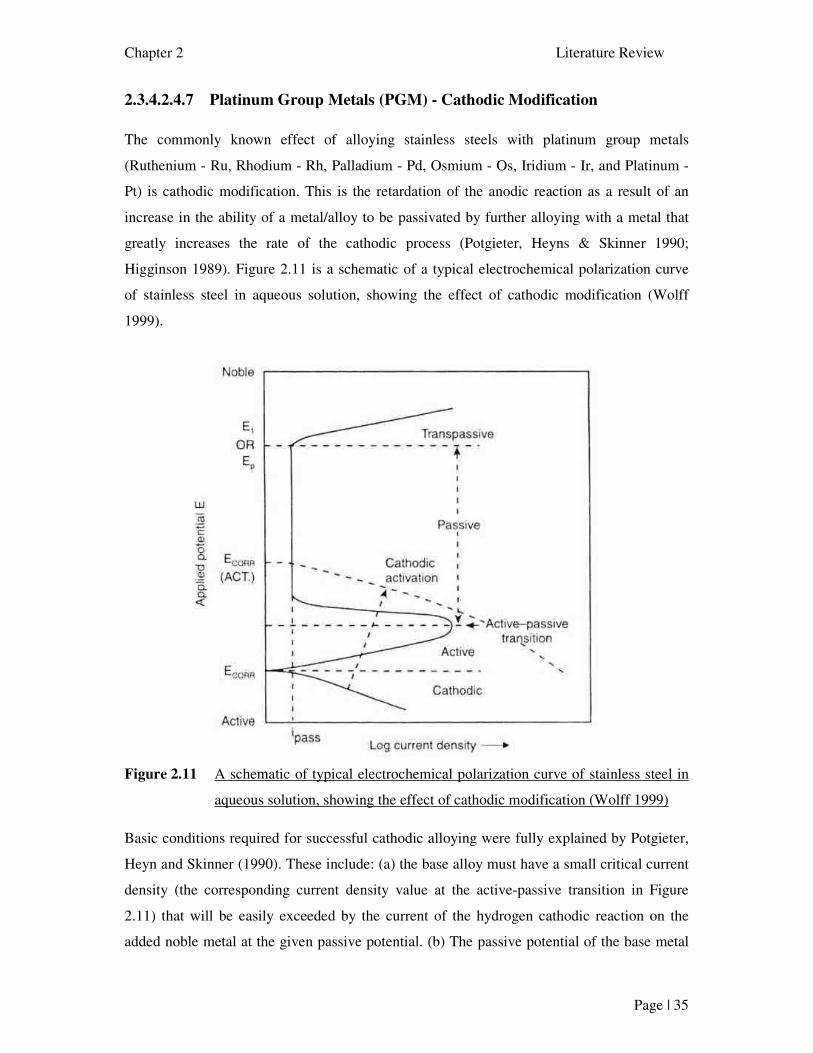
Chapter 2 Literature Review
Page | 35
2.3.4.2.4.7 Platinum Group Metals (PGM) - Cathodic Modification
The commonly known effect of alloying stainless steels with platinum group metals
(Ruthenium - Ru, Rhodium - Rh, Palladium - Pd, Osmium - Os, Iridium - Ir, and Platinum -
Pt) is cathodic modification. This is the retardation of the anodic reaction as a result of an
increase in the ability of a metal/alloy to be passivated by further alloying with a metal that
greatly increases the rate of the cathodic process (Potgieter, Heyns & Skinner 1990;
Higginson 1989). Figure 2.11 is a schematic of a typical electrochemical polarization curve
of stainless steel in aqueous solution, showing the effect of cathodic modification (Wolff
1999).
Figure 2.11 A schematic of typical electrochemical polarization curve of stainless steel in
aqueous solution, showing the effect of cathodic modification (Wolff 1999)
Basic conditions required for successful cathodic alloying were fully explained by Potgieter,
Heyn and Skinner (1990). These include: (a) the base alloy must have a small critical current
density (the corresponding current density value at the active-passive transition in Figure
2.11) that will be easily exceeded by the current of the hydrogen cathodic reaction on the
added noble metal at the given passive potential. (b) The passive potential of the base metal
Chapter 2 Literature Review
Page | 36
must be sufficiently negative to allow the cathodic component that has been introduced to
change the corrosion potential of the alloy to a value in the passive range that is more positive
than pitting potential but less positive than the potential associated with the onset of the
transpassive processes. (c) the transpassive potential of the base alloy should be sufficiently
electropositive to allow a wide passive range. Further to this, Potgieter, Heyn and Skinner
(1990) also noted that the cathodic alloying component needs to have a higher exchange
current density (and a lower overvoltage) for the cathodic process of hydrogen evolution than
the base metal or the alloy, and it should be corrosion resistant under the given conditions.
In addition to cathodic modification, as already pointed out in the introduction, a recent study
by El-Sayed et al. (2009), found that small additions of ruthenium to a duplex stainless steel
did not only improved the alloy’s passivation, but also shifted the corrosion and pitting
potentials to higher noble values. Also of importance to note is that literature indicates that
alloying stainless steels with platinum group metals does not affect their mechanical
properties. Actually, in some instances, it was observed that PGMs enhance the mechanical
properties of the resulting stainless steel alloys (Higginson 1989).
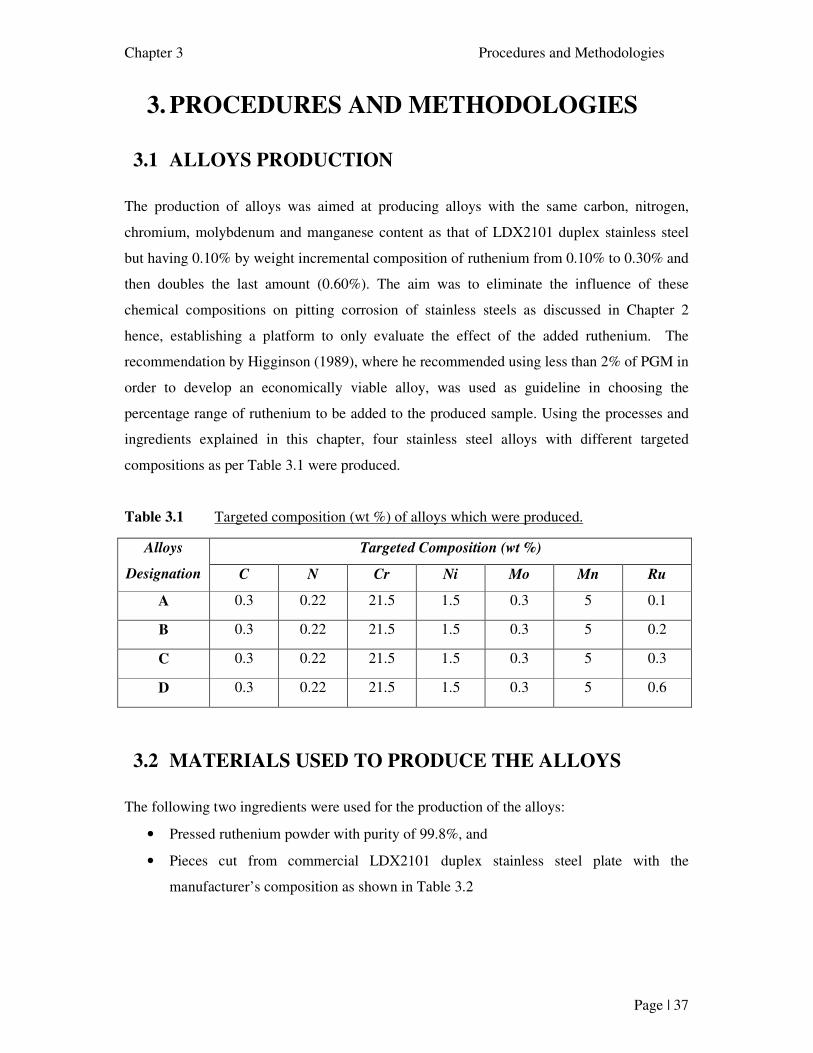
Chapter 3 Procedures and Methodologies
Page | 37
3. PROCEDURES AND METHODOLOGIES
3.1 ALLOYS PRODUCTION
The production of alloys was aimed at producing alloys with the same carbon, nitrogen,
chromium, molybdenum and manganese content as that of LDX2101 duplex stainless steel
but having 0.10% by weight incremental composition of ruthenium from 0.10% to 0.30% and
then doubles the last amount (0.60%). The aim was to eliminate the influence of these
chemical compositions on pitting corrosion of stainless steels as discussed in Chapter 2
hence, establishing a platform to only evaluate the effect of the added ruthenium. The
recommendation by Higginson (1989), where he recommended using less than 2% of PGM in
order to develop an economically viable alloy, was used as guideline in choosing the
percentage range of ruthenium to be added to the produced sample. Using the processes and
ingredients explained in this chapter, four stainless steel alloys with different targeted
compositions as per Table 3.1 were produced.
Table 3.1 Targeted composition (wt %) of alloys which were produced.
Alloys
Designation
Targeted Composition (wt %)
C N Cr Ni Mo Mn Ru
A 0.3 0.22 21.5 1.5 0.3 5 0.1
B 0.3 0.22 21.5 1.5 0.3 5 0.2
C 0.3 0.22 21.5 1.5 0.3 5 0.3
D 0.3 0.22 21.5 1.5 0.3 5 0.6
3.2 MATERIALS USED TO PRODUCE THE ALLOYS
The following two ingredients were used for the production of the alloys:
• Pressed ruthenium powder with purity of 99.8%, and
• Pieces cut from commercial LDX2101 duplex stainless steel plate with the
manufacturer’s composition as shown in Table 3.2
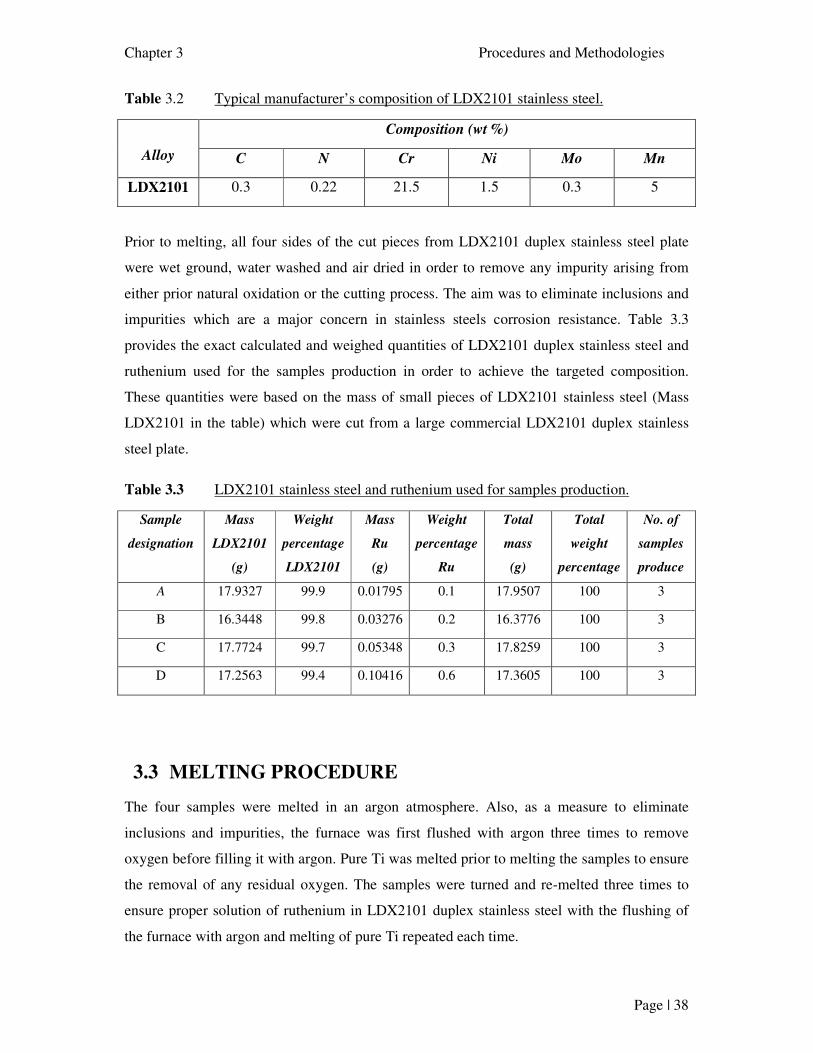
Chapter 3 Procedures and Methodologies
Page | 38
Table 3.2 Typical manufacturer’s composition of LDX2101 stainless steel.
Alloy
Composition (wt %)
C N Cr Ni Mo Mn
LDX2101 0.3 0.22 21.5 1.5 0.3 5
Prior to melting, all four sides of the cut pieces from LDX2101 duplex stainless steel plate
were wet ground, water washed and air dried in order to remove any impurity arising from
either prior natural oxidation or the cutting process. The aim was to eliminate inclusions and
impurities which are a major concern in stainless steels corrosion resistance. Table 3.3
provides the exact calculated and weighed quantities of LDX2101 duplex stainless steel and
ruthenium used for the samples production in order to achieve the targeted composition.
These quantities were based on the mass of small pieces of LDX2101 stainless steel (Mass
LDX2101 in the table) which were cut from a large commercial LDX2101 duplex stainless
steel plate.
Table 3.3 LDX2101 stainless steel and ruthenium used for samples production.
Sample
designation
Mass
LDX2101
(g)
Weight
percentage
LDX2101
Mass
Ru
(g)
Weight
percentage
Ru
Total
mass
(g)
Total
weight
percentage
No. of
samples
produce
A 17.9327 99.9 0.01795 0.1 17.9507 100 3
B 16.3448 99.8 0.03276 0.2 16.3776 100 3
C 17.7724 99.7 0.05348 0.3 17.8259 100 3
D 17.2563 99.4 0.10416 0.6 17.3605 100 3
3.3 MELTING PROCEDURE
The four samples were melted in an argon atmosphere. Also, as a measure to eliminate
inclusions and impurities, the furnace was first flushed with argon three times to remove
oxygen before filling it with argon. Pure Ti was melted prior to melting the samples to ensure
the removal of any residual oxygen. The samples were turned and re-melted three times to
ensure proper solution of ruthenium in LDX2101 duplex stainless steel with the flushing of
the furnace with argon and melting of pure Ti repeated each time.
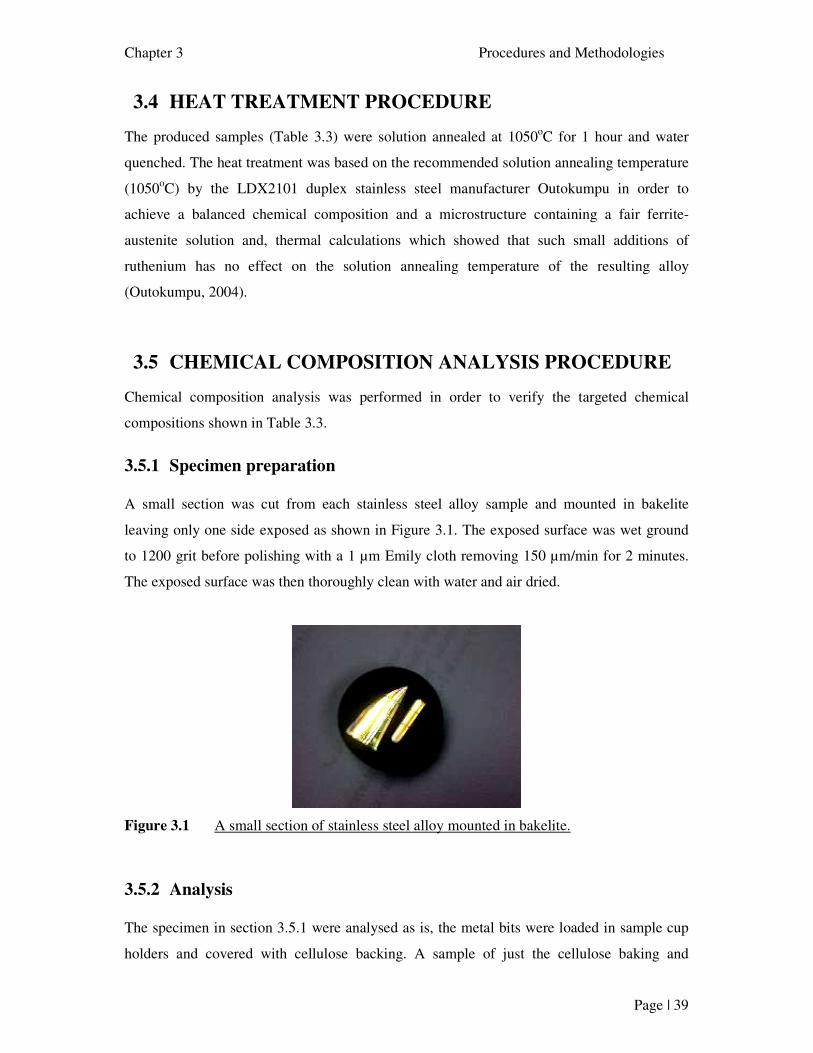
Chapter 3 Procedures and Methodologies
Page | 39
3.4 HEAT TREATMENT PROCEDURE
The produced samples (Table 3.3) were solution annealed at 1050oC for 1 hour and water
quenched. The heat treatment was based on the recommended solution annealing temperature
(1050oC) by the LDX2101 duplex stainless steel manufacturer Outokumpu in order to
achieve a balanced chemical composition and a microstructure containing a fair ferrite-
austenite solution and, thermal calculations which showed that such small additions of
ruthenium has no effect on the solution annealing temperature of the resulting alloy
(Outokumpu, 2004).
3.5 CHEMICAL COMPOSITION ANALYSIS PROCEDURE
Chemical composition analysis was performed in order to verify the targeted chemical
compositions shown in Table 3.3.
3.5.1 Specimen preparation
A small section was cut from each stainless steel alloy sample and mounted in bakelite
leaving only one side exposed as shown in Figure 3.1. The exposed surface was wet ground
to 1200 grit before polishing with a 1 µm Emily cloth removing 150 µm/min for 2 minutes.
The exposed surface was then thoroughly clean with water and air dried.
Figure 3.1 A small section of stainless steel alloy mounted in bakelite.
3.5.2 Analysis
The specimen in section 3.5.1 were analysed as is, the metal bits were loaded in sample cup
holders and covered with cellulose backing. A sample of just the cellulose baking and
Chapter 3 Procedures and Methodologies
Page | 40
bakelite were analysed separately and the results were used to make background corrections
for the samples analysed. The instrumentation used is an ARL 9400XP+Wavelength
dispersive XRF Spectrometer with a Rliodium tube, LÍF200, LÍF220, GER. AXO6 (a 50Â
synthetic multilayer) and PKT analysing crystals, with a flow proportional and scintÜlation
detector and Uniquant software was used for analyses (Loubser & Verryn 2008). The
software enables the qualitative and quantitative analysis of an unknown sample with or
without sample preparation. Elements from fluorine to uranium in the periodic table can be
analysed with detection limits varying from 0.5 ppm for heavier elements like Mo to 100 ppm
for the lightest element F. With the fundamental parameter approach, everything in the
sample is analysed to enable accurate matrix corrections. The software allows for manual
input of elements not determinable by XRF, like carbon, oxygen and hydrogen in different
compounds and this data is then used in the matrix correction model. For higher accuracy,
matrix matched calibration curves can be set up for specific matrices with specific sample
preparation protocols followed. Only elements found above the detection limits were
reported. The values were normalised, as no percentage loss on ignition (LOI) was done to
determine crystal water and oxidation state changes. All elements were expressed as oxides.
3.6 MICROSTRUCTURAL ANALYSIS PROCEDURE
The microstructural analysis was performed in order to verify that the small addition of
ruthenium to LDX2101 and the samples melting procedure did not have any negative effect
on the resulting alloys. ASTM A923 Test method A – Sodium Hydroxide etch test for
classification of etch structures of duplex stainless steel was used to analyse the
microstructure for acceptance of the samples (ASTM Standard A923 2008).
3.6.1 Specimen preparation
Specimen for microstructural analysis were prepared using the procedure in section 3.5.1
3.6.2 Analysis
The specimen as in section 3.6.1 were etched at 3 V dc for 30 seconds in a 40% sodium
hydroxide solution which was prepared by adding 40 g of sodium hydroxide in 100 ml of
distilled water. Following etching, samples were thoroughly rinsed in hot water and air dried.
The etched surfaces were examined on a metallurgical microscope at 500X magnification.
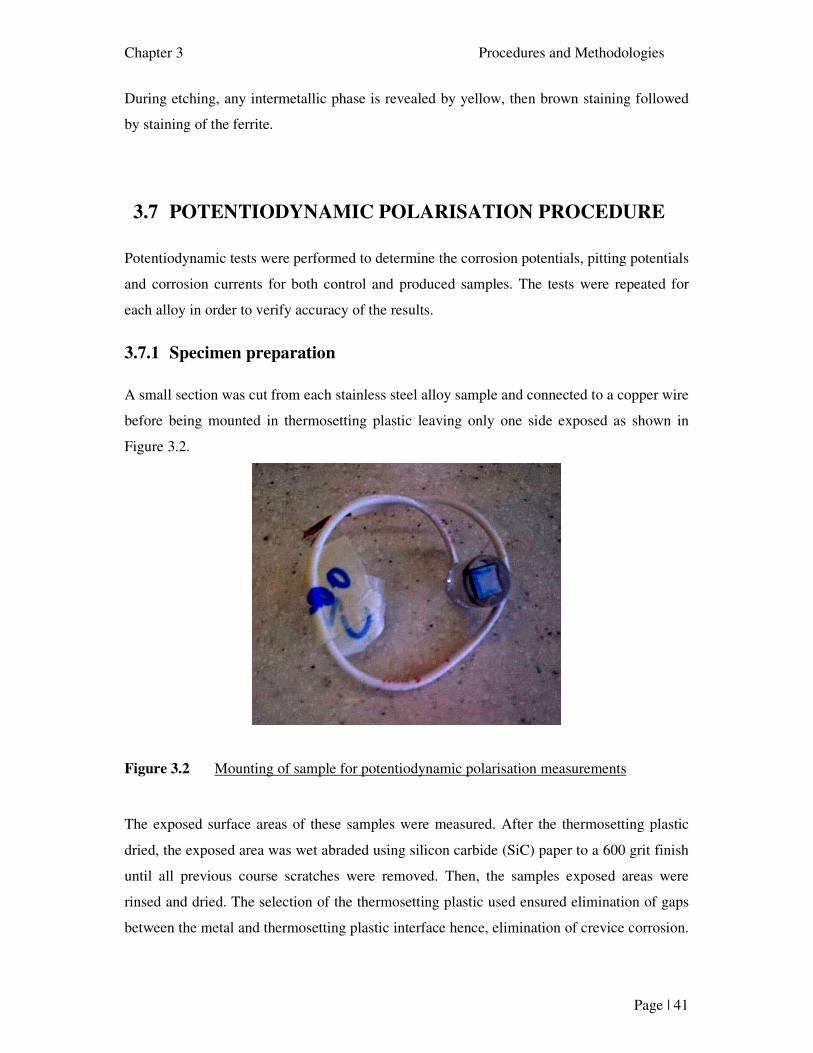
Chapter 3 Procedures and Methodologies
Page | 41
During etching, any intermetallic phase is revealed by yellow, then brown staining followed
by staining of the ferrite.
3.7 POTENTIODYNAMIC POLARISATION PROCEDURE
Potentiodynamic tests were performed to determine the corrosion potentials, pitting potentials
and corrosion currents for both control and produced samples. The tests were repeated for
each alloy in order to verify accuracy of the results.
3.7.1 Specimen preparation
A small section was cut from each stainless steel alloy sample and connected to a copper wire
before being mounted in thermosetting plastic leaving only one side exposed as shown in
Figure 3.2.
Figure 3.2 Mounting of sample for potentiodynamic polarisation measurements
The exposed surface areas of these samples were measured. After the thermosetting plastic
dried, the exposed area was wet abraded using silicon carbide (SiC) paper to a 600 grit finish
until all previous course scratches were removed. Then, the samples exposed areas were
rinsed and dried. The selection of the thermosetting plastic used ensured elimination of gaps
between the metal and thermosetting plastic interface hence, elimination of crevice corrosion.
Chapter 3 Procedures and Methodologies
Page | 42
Before each test, the testing surface was wet abraded again with a 600 silicon carbide grit
paper, rinsed and dried.
3.7.2 Potentiodynamic test
The potentiodynamic tests were conducted mostly by following ASTM G61-86 (ASTM
Standard G61 1986 -1998), using the cyclic voltammetry potentiostatic technique of
Metrohm Autolab Nova software in a naturally aerated 3.56% NaCl aqueous solution at a
controlled temperature of 25oC±2oC. A glassy carbon counter electrode and silver/silver
chloride [Ag/AgCl, KCl (3M)] reference electrode were used as in the testing cell. The
specimens in section 5.1.1 were connected to the working electrode of the cell. The open
circuit potential for each scan was determined 1hour after immersing the sample in the
solution. Each sample was anodically polarized separately at a scan rate of 0.000167 mV/s
from 200 mV below its open circuit potential/corrosion potential, passing through the
corrosion potential to more noble values. For each scan, the scan was reversed at 1 mA/cm2
and, where applicable, the repassivation potentials of the alloys were determined accordingly.
Fresh solution was used for each scan.
3.7.3 Solution Purging Procedure
For the experiments where it was necessary to remove oxygen from the prepared 3.5% NaCl
aqueous solution, the solution was purged with nitrogen gas for 1 hour and the oxygen
content in the solution was measured before and after purging. On all experiments requiring
solution purging, air tightness was ensured on the test cell.
3.8 Corrosion rate calculations
Corrosion rate was determined using the Faraday’s Law (Metrohm Autolab 2011),
Equation (2).
corrM inF
MR
ρ= …………………………………………………………………………… (2)
Where RM is the corrosion rate, M is the atomic weight of the metal, ρ is the density, n is the
valance electrons and F is the Faraday constant (96.485 C/mol). The ratio M/n is also referred
to as equivalent weight.
Chapter 3 Procedures and Methodologies
Page | 43
For an alloy like LDX2101, the equivalent was calculated by the equation (3), disregarding
all elements below 1 mass percentage in the alloy.
Equivalent weight =
∑i
ii
W
fn1 ………………………………………………………… (3)
Where fi is the mass fraction of the ith element in the alloy, Wi is the atomic weight of the ith
element in the alloy, and ni is the valence of the ith element in the alloy.
Applying equation (2) and obtaining the valence electrons for stable phases as a function of
corrosion potential (Ecorr) and p-H of 8 for elements Fe, Cr, Mn and Ni in the Atlas of Eh-pH
diagrams (13) the equivalent weight of LDX2101 is 24.75.
Using this equivalent weight, the exposed surface area of each sample and the density of
LDX2101 (7.8 kg/dm3), the corrosion current Icorr, corrosion potential Ecorr, and corrosion rate
as presented in Table 4.2 were directly extracted from the Metrohm Autolab Nova software
for each potentiodynamic curve. Correct estimates of the Tafel slopes was possible by
choosing two point on the linear Tafel region of each slop which were at least a decade in
current apart.
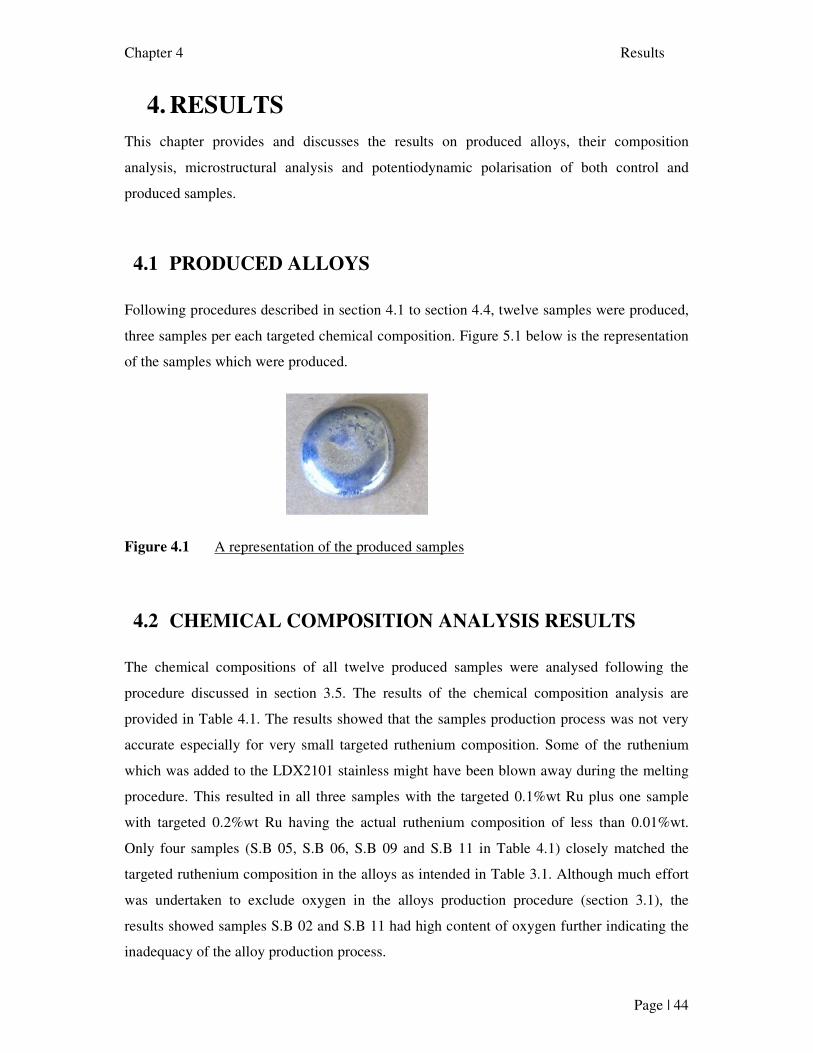
Chapter 4 Results
Page | 44
4. RESULTS
This chapter provides and discusses the results on produced alloys, their composition
analysis, microstructural analysis and potentiodynamic polarisation of both control and
produced samples.
4.1 PRODUCED ALLOYS
Following procedures described in section 4.1 to section 4.4, twelve samples were produced,
three samples per each targeted chemical composition. Figure 5.1 below is the representation
of the samples which were produced.
Figure 4.1 A representation of the produced samples
4.2 CHEMICAL COMPOSITION ANALYSIS RESULTS
The chemical compositions of all twelve produced samples were analysed following the
procedure discussed in section 3.5. The results of the chemical composition analysis are
provided in Table 4.1. The results showed that the samples production process was not very
accurate especially for very small targeted ruthenium composition. Some of the ruthenium
which was added to the LDX2101 stainless might have been blown away during the melting
procedure. This resulted in all three samples with the targeted 0.1%wt Ru plus one sample
with targeted 0.2%wt Ru having the actual ruthenium composition of less than 0.01%wt.
Only four samples (S.B 05, S.B 06, S.B 09 and S.B 11 in Table 4.1) closely matched the
targeted ruthenium composition in the alloys as intended in Table 3.1. Although much effort
was undertaken to exclude oxygen in the alloys production procedure (section 3.1), the
results showed samples S.B 02 and S.B 11 had high content of oxygen further indicating the
inadequacy of the alloy production process.
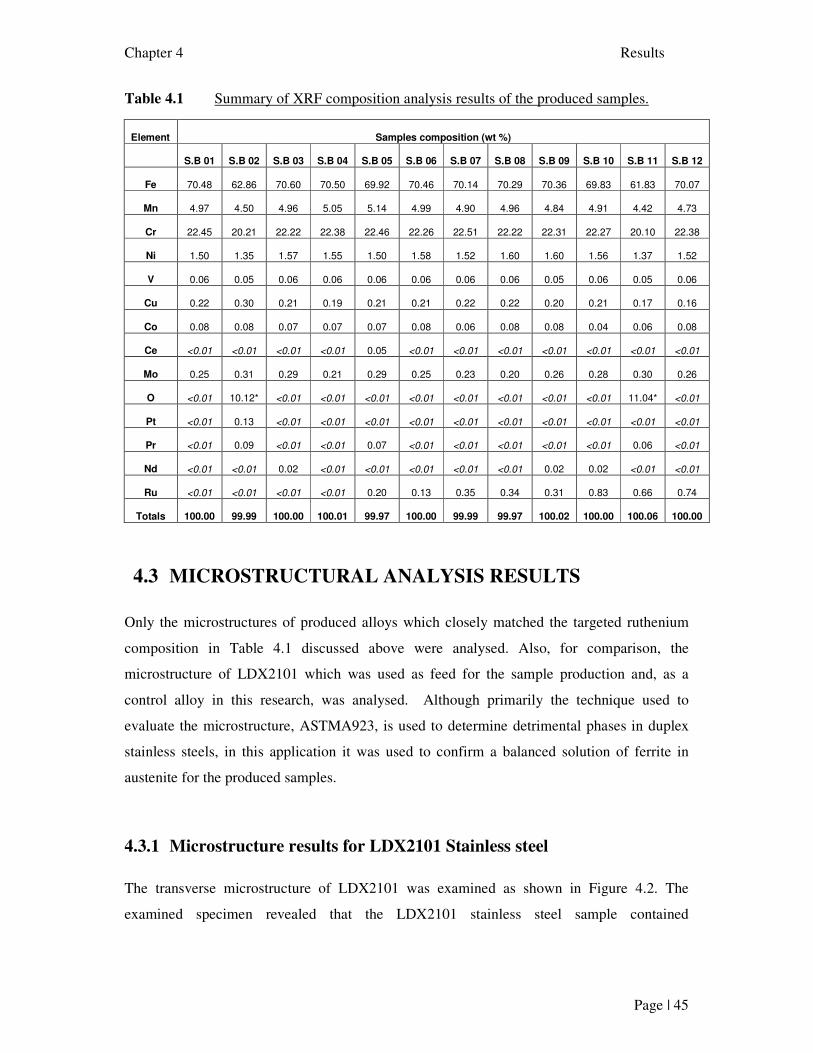
Chapter 4 Results
Page | 45
Table 4.1 Summary of XRF composition analysis results of the produced samples.
Element Samples composition (wt %)
S.B 01 S.B 02 S.B 03 S.B 04 S.B 05 S.B 06 S.B 07 S.B 08 S.B 09 S.B 10 S.B 11 S.B 12
Fe 70.48 62.86 70.60 70.50 69.92 70.46 70.14 70.29 70.36 69.83 61.83 70.07
Mn 4.97 4.50 4.96 5.05 5.14 4.99 4.90 4.96 4.84 4.91 4.42 4.73
Cr 22.45 20.21 22.22 22.38 22.46 22.26 22.51 22.22 22.31 22.27 20.10 22.38
Ni 1.50 1.35 1.57 1.55 1.50 1.58 1.52 1.60 1.60 1.56 1.37 1.52
V 0.06 0.05 0.06 0.06 0.06 0.06 0.06 0.06 0.05 0.06 0.05 0.06
Cu 0.22 0.30 0.21 0.19 0.21 0.21 0.22 0.22 0.20 0.21 0.17 0.16
Co 0.08 0.08 0.07 0.07 0.07 0.08 0.06 0.08 0.08 0.04 0.06 0.08
Ce <0.01 <0.01 <0.01 <0.01 0.05 <0.01 <0.01 <0.01 <0.01 <0.01 <0.01 <0.01
Mo 0.25 0.31 0.29 0.21 0.29 0.25 0.23 0.20 0.26 0.28 0.30 0.26
O <0.01 10.12* <0.01 <0.01 <0.01 <0.01 <0.01 <0.01 <0.01 <0.01 11.04* <0.01
Pt <0.01 0.13 <0.01 <0.01 <0.01 <0.01 <0.01 <0.01 <0.01 <0.01 <0.01 <0.01
Pr <0.01 0.09 <0.01 <0.01 0.07 <0.01 <0.01 <0.01 <0.01 <0.01 0.06 <0.01
Nd <0.01 <0.01 0.02 <0.01 <0.01 <0.01 <0.01 <0.01 0.02 0.02 <0.01 <0.01
Ru <0.01 <0.01 <0.01 <0.01 0.20 0.13 0.35 0.34 0.31 0.83 0.66 0.74
Totals 100.00 99.99 100.00 100.01 99.97 100.00 99.99 99.97 100.02 100.00 100.06 100.00
4.3 MICROSTRUCTURAL ANALYSIS RESULTS
Only the microstructures of produced alloys which closely matched the targeted ruthenium
composition in Table 4.1 discussed above were analysed. Also, for comparison, the
microstructure of LDX2101 which was used as feed for the sample production and, as a
control alloy in this research, was analysed. Although primarily the technique used to
evaluate the microstructure, ASTMA923, is used to determine detrimental phases in duplex
stainless steels, in this application it was used to confirm a balanced solution of ferrite in
austenite for the produced samples.
4.3.1 Microstructure results for LDX2101 Stainless steel
The transverse microstructure of LDX2101 was examined as shown in Figure 4.2. The
examined specimen revealed that the LDX2101 stainless steel sample contained
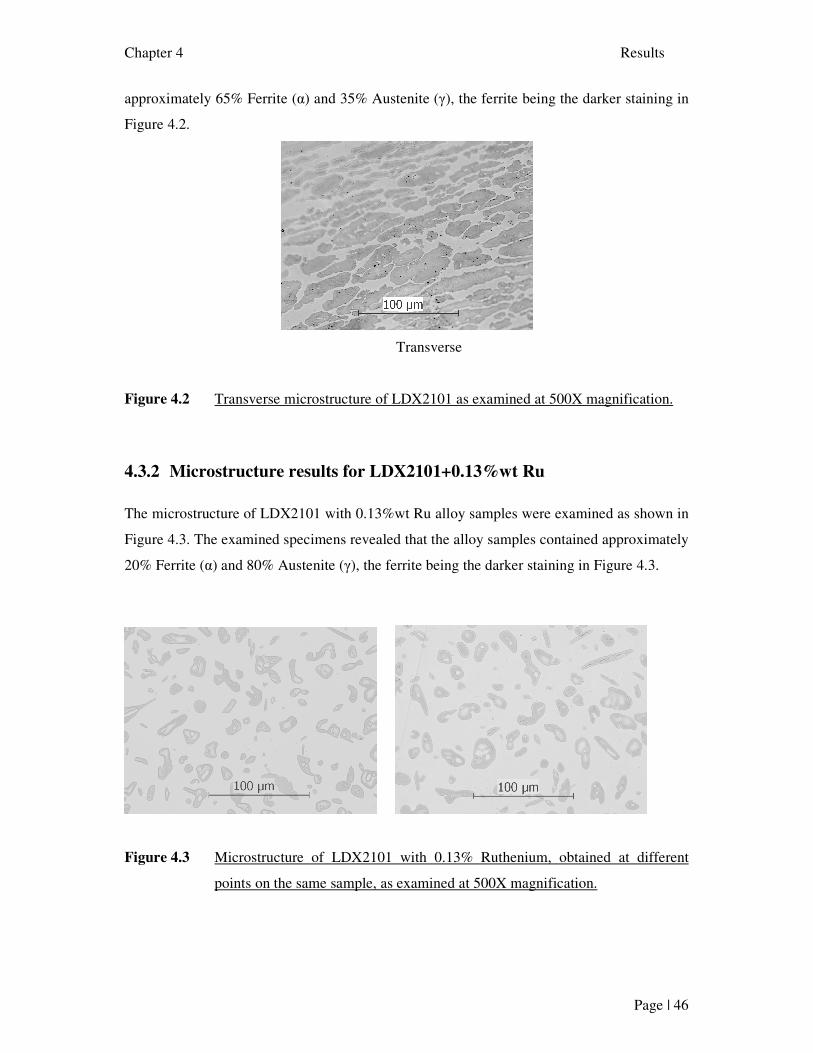
Chapter 4 Results
Page | 46
approximately 65% Ferrite (α) and 35% Austenite (γ), the ferrite being the darker staining in
Figure 4.2.
Transverse
Figure 4.2 Transverse microstructure of LDX2101 as examined at 500X magnification.
4.3.2 Microstructure results for LDX2101+0.13%wt Ru
The microstructure of LDX2101 with 0.13%wt Ru alloy samples were examined as shown in
Figure 4.3. The examined specimens revealed that the alloy samples contained approximately
20% Ferrite (α) and 80% Austenite (γ), the ferrite being the darker staining in Figure 4.3.
Figure 4.3 Microstructure of LDX2101 with 0.13% Ruthenium, obtained at different
points on the same sample, as examined at 500X magnification.
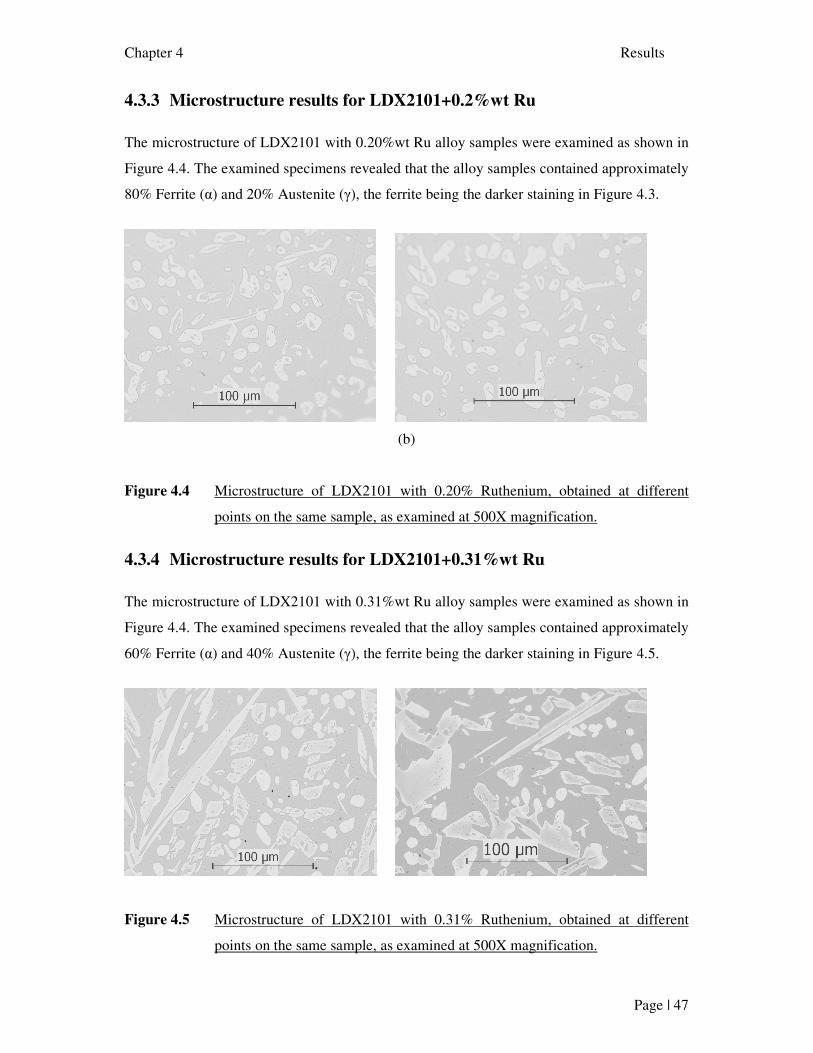
Chapter 4 Results
Page | 47
4.3.3 Microstructure results for LDX2101+0.2%wt Ru
The microstructure of LDX2101 with 0.20%wt Ru alloy samples were examined as shown in
Figure 4.4. The examined specimens revealed that the alloy samples contained approximately
80% Ferrite (α) and 20% Austenite (γ), the ferrite being the darker staining in Figure 4.3.
(b)
Figure 4.4 Microstructure of LDX2101 with 0.20% Ruthenium, obtained at different
points on the same sample, as examined at 500X magnification.
4.3.4 Microstructure results for LDX2101+0.31%wt Ru
The microstructure of LDX2101 with 0.31%wt Ru alloy samples were examined as shown in
Figure 4.4. The examined specimens revealed that the alloy samples contained approximately
60% Ferrite (α) and 40% Austenite (γ), the ferrite being the darker staining in Figure 4.5.
Figure 4.5 Microstructure of LDX2101 with 0.31% Ruthenium, obtained at different
points on the same sample, as examined at 500X magnification.
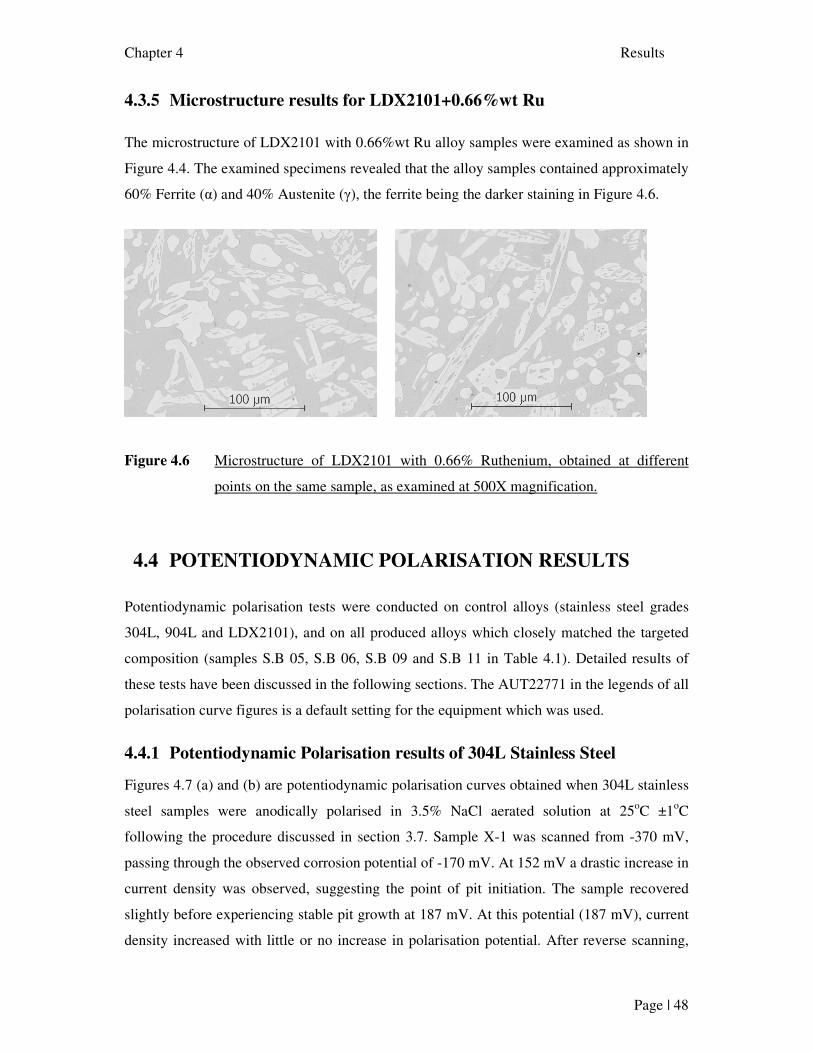
Chapter 4 Results
Page | 48
4.3.5 Microstructure results for LDX2101+0.66%wt Ru
The microstructure of LDX2101 with 0.66%wt Ru alloy samples were examined as shown in
Figure 4.4. The examined specimens revealed that the alloy samples contained approximately
60% Ferrite (α) and 40% Austenite (γ), the ferrite being the darker staining in Figure 4.6.
Figure 4.6 Microstructure of LDX2101 with 0.66% Ruthenium, obtained at different
points on the same sample, as examined at 500X magnification.
4.4 POTENTIODYNAMIC POLARISATION RESULTS
Potentiodynamic polarisation tests were conducted on control alloys (stainless steel grades
304L, 904L and LDX2101), and on all produced alloys which closely matched the targeted
composition (samples S.B 05, S.B 06, S.B 09 and S.B 11 in Table 4.1). Detailed results of
these tests have been discussed in the following sections. The AUT22771 in the legends of all
polarisation curve figures is a default setting for the equipment which was used.
4.4.1 Potentiodynamic Polarisation results of 304L Stainless Steel
Figures 4.7 (a) and (b) are potentiodynamic polarisation curves obtained when 304L stainless
steel samples were anodically polarised in 3.5% NaCl aerated solution at 25oC ±1oC
following the procedure discussed in section 3.7. Sample X-1 was scanned from -370 mV,
passing through the observed corrosion potential of -170 mV. At 152 mV a drastic increase in
current density was observed, suggesting the point of pit initiation. The sample recovered
slightly before experiencing stable pit growth at 187 mV. At this potential (187 mV), current
density increased with little or no increase in polarisation potential. After reverse scanning,
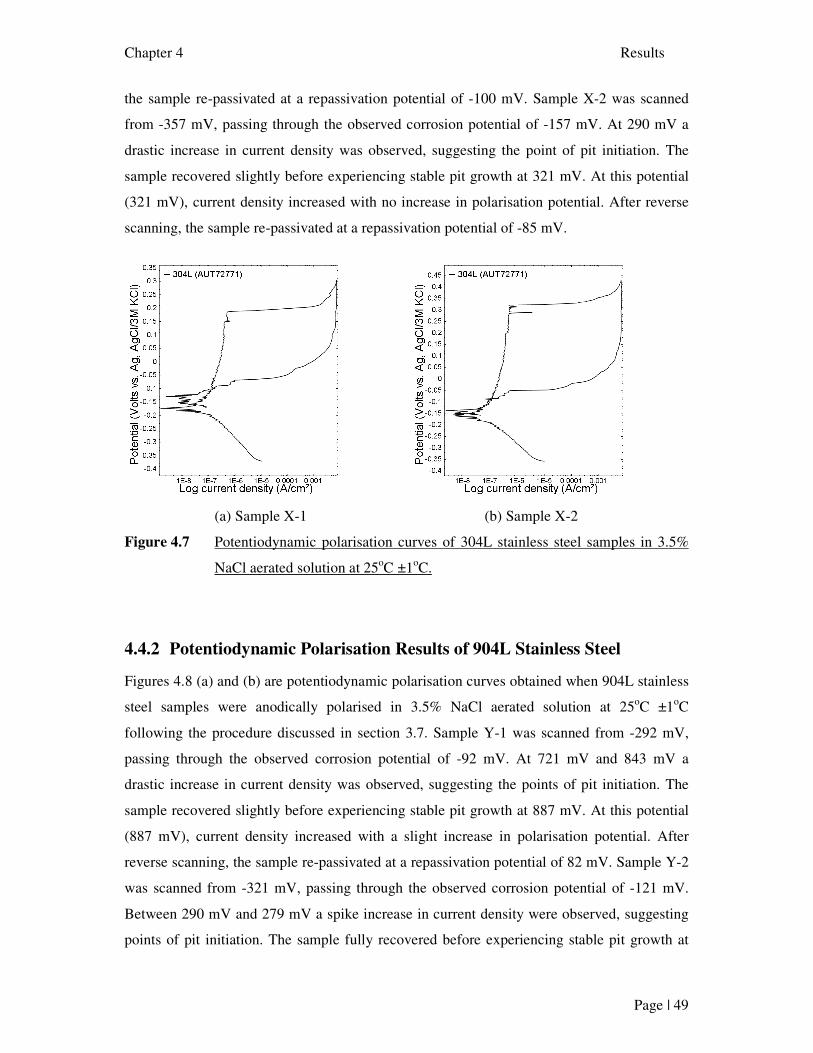
Chapter 4 Results
Page | 49
the sample re-passivated at a repassivation potential of -100 mV. Sample X-2 was scanned
from -357 mV, passing through the observed corrosion potential of -157 mV. At 290 mV a
drastic increase in current density was observed, suggesting the point of pit initiation. The
sample recovered slightly before experiencing stable pit growth at 321 mV. At this potential
(321 mV), current density increased with no increase in polarisation potential. After reverse
scanning, the sample re-passivated at a repassivation potential of -85 mV.
(a) Sample X-1 (b) Sample X-2
Figure 4.7 Potentiodynamic polarisation curves of 304L stainless steel samples in 3.5%
NaCl aerated solution at 25oC ±1oC.
4.4.2 Potentiodynamic Polarisation Results of 904L Stainless Steel
Figures 4.8 (a) and (b) are potentiodynamic polarisation curves obtained when 904L stainless
steel samples were anodically polarised in 3.5% NaCl aerated solution at 25oC ±1oC
following the procedure discussed in section 3.7. Sample Y-1 was scanned from -292 mV,
passing through the observed corrosion potential of -92 mV. At 721 mV and 843 mV a
drastic increase in current density was observed, suggesting the points of pit initiation. The
sample recovered slightly before experiencing stable pit growth at 887 mV. At this potential
(887 mV), current density increased with a slight increase in polarisation potential. After
reverse scanning, the sample re-passivated at a repassivation potential of 82 mV. Sample Y-2
was scanned from -321 mV, passing through the observed corrosion potential of -121 mV.
Between 290 mV and 279 mV a spike increase in current density were observed, suggesting
points of pit initiation. The sample fully recovered before experiencing stable pit growth at
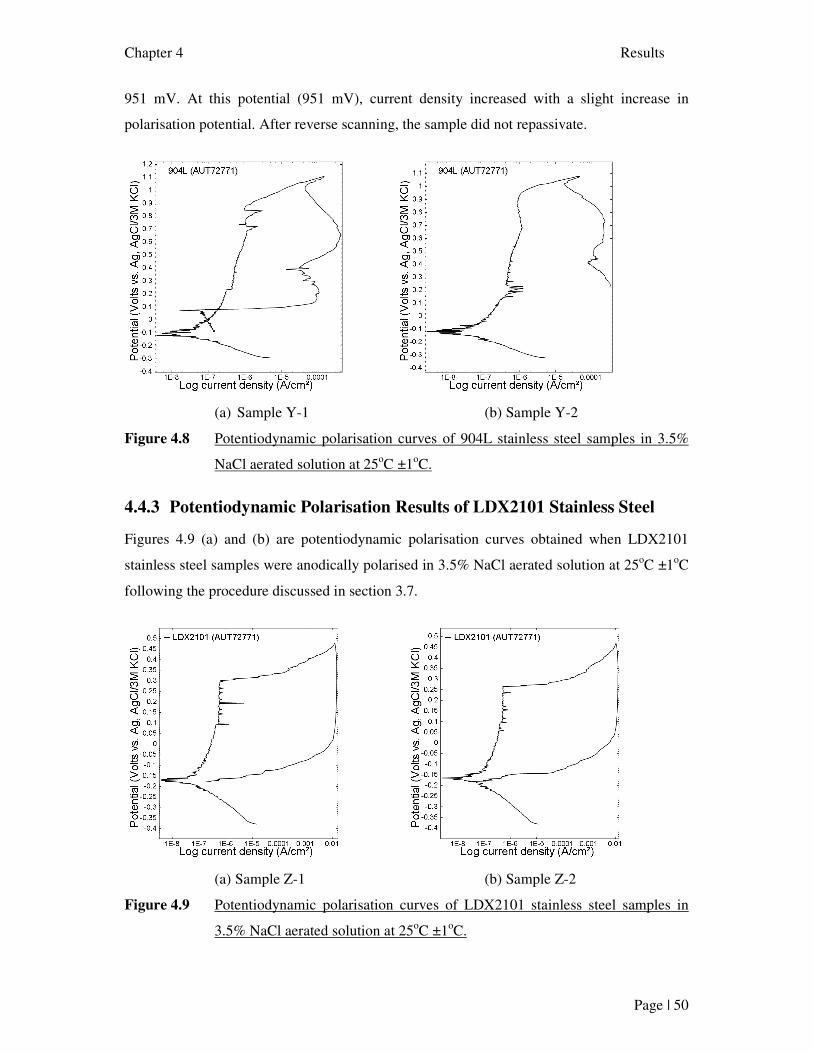
Chapter 4 Results
Page | 50
951 mV. At this potential (951 mV), current density increased with a slight increase in
polarisation potential. After reverse scanning, the sample did not repassivate.
(a) Sample Y-1 (b) Sample Y-2
Figure 4.8 Potentiodynamic polarisation curves of 904L stainless steel samples in 3.5%
NaCl aerated solution at 25oC ±1oC.
4.4.3 Potentiodynamic Polarisation Results of LDX2101 Stainless Steel
Figures 4.9 (a) and (b) are potentiodynamic polarisation curves obtained when LDX2101
stainless steel samples were anodically polarised in 3.5% NaCl aerated solution at 25oC ±1oC
following the procedure discussed in section 3.7.
(a) Sample Z-1 (b) Sample Z-2
Figure 4.9 Potentiodynamic polarisation curves of LDX2101 stainless steel samples in
3.5% NaCl aerated solution at 25oC ±1oC.
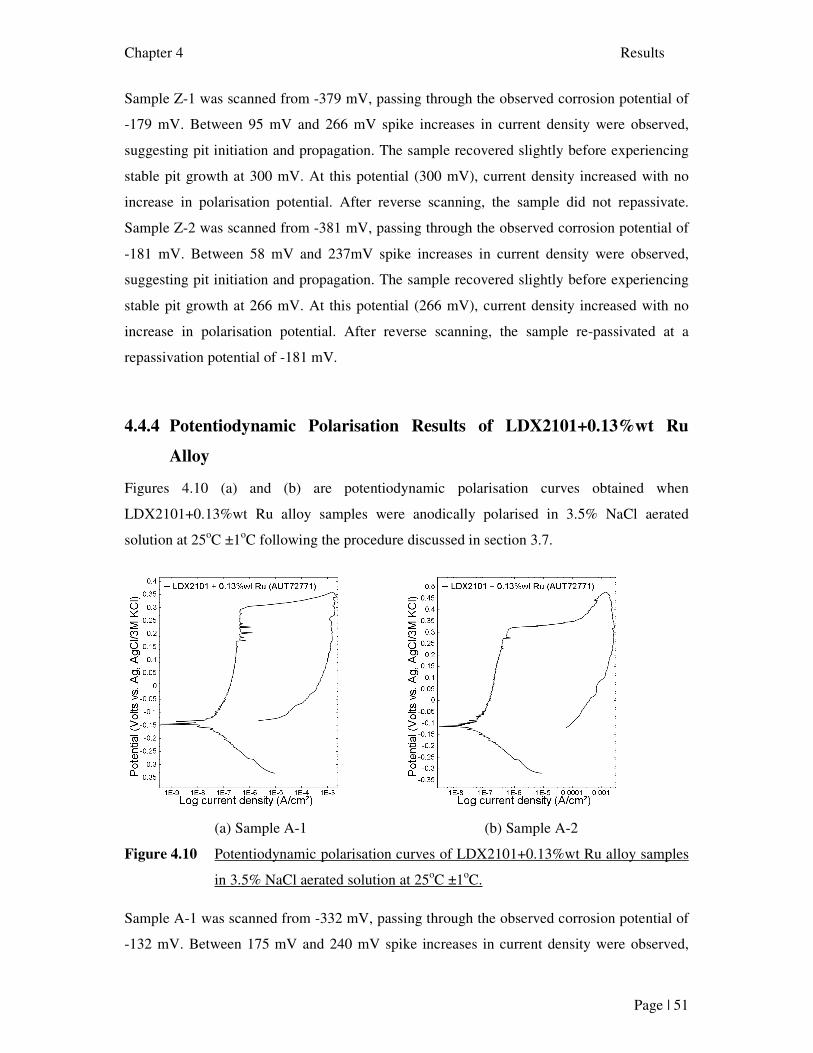
Chapter 4 Results
Page | 51
Sample Z-1 was scanned from -379 mV, passing through the observed corrosion potential of
-179 mV. Between 95 mV and 266 mV spike increases in current density were observed,
suggesting pit initiation and propagation. The sample recovered slightly before experiencing
stable pit growth at 300 mV. At this potential (300 mV), current density increased with no
increase in polarisation potential. After reverse scanning, the sample did not repassivate.
Sample Z-2 was scanned from -381 mV, passing through the observed corrosion potential of
-181 mV. Between 58 mV and 237mV spike increases in current density were observed,
suggesting pit initiation and propagation. The sample recovered slightly before experiencing
stable pit growth at 266 mV. At this potential (266 mV), current density increased with no
increase in polarisation potential. After reverse scanning, the sample re-passivated at a
repassivation potential of -181 mV.
4.4.4 Potentiodynamic Polarisation Results of LDX2101+0.13%wt Ru
Alloy
Figures 4.10 (a) and (b) are potentiodynamic polarisation curves obtained when
LDX2101+0.13%wt Ru alloy samples were anodically polarised in 3.5% NaCl aerated
solution at 25oC ±1oC following the procedure discussed in section 3.7.
(a) Sample A-1 (b) Sample A-2
Figure 4.10 Potentiodynamic polarisation curves of LDX2101+0.13%wt Ru alloy samples
in 3.5% NaCl aerated solution at 25oC ±1oC.
Sample A-1 was scanned from -332 mV, passing through the observed corrosion potential of
-132 mV. Between 175 mV and 240 mV spike increases in current density were observed,
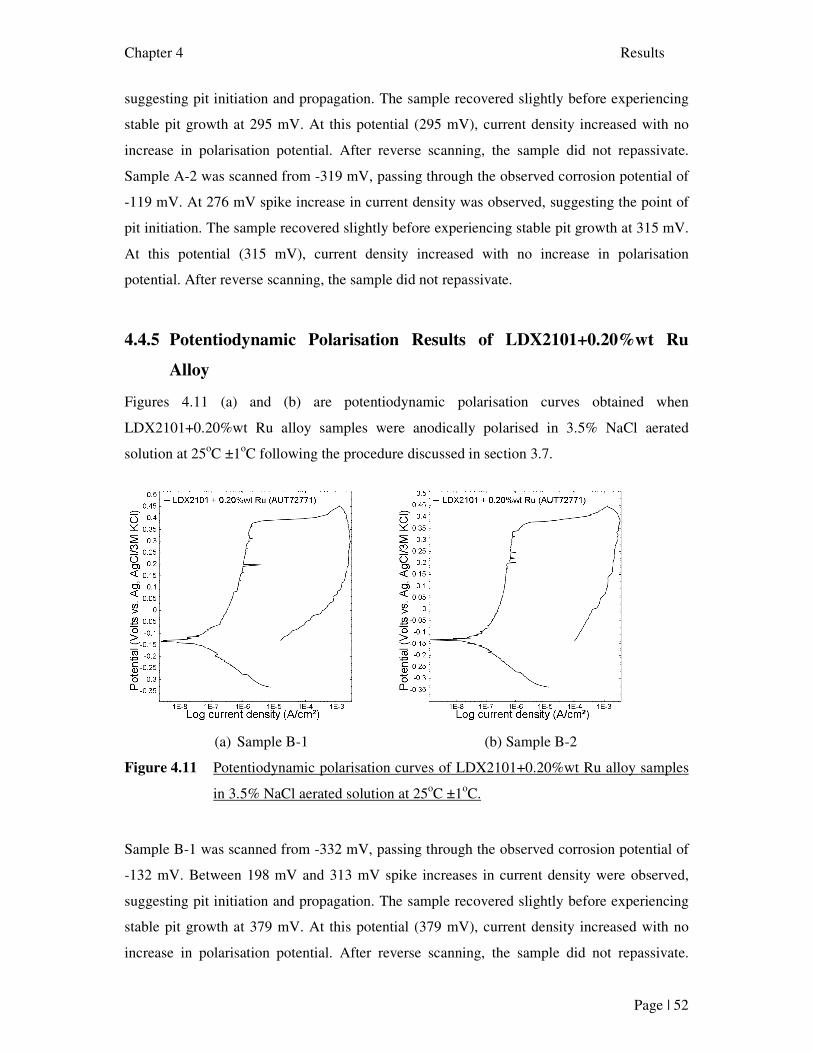
Chapter 4 Results
Page | 52
suggesting pit initiation and propagation. The sample recovered slightly before experiencing
stable pit growth at 295 mV. At this potential (295 mV), current density increased with no
increase in polarisation potential. After reverse scanning, the sample did not repassivate.
Sample A-2 was scanned from -319 mV, passing through the observed corrosion potential of
-119 mV. At 276 mV spike increase in current density was observed, suggesting the point of
pit initiation. The sample recovered slightly before experiencing stable pit growth at 315 mV.
At this potential (315 mV), current density increased with no increase in polarisation
potential. After reverse scanning, the sample did not repassivate.
4.4.5 Potentiodynamic Polarisation Results of LDX2101+0.20%wt Ru
Alloy
Figures 4.11 (a) and (b) are potentiodynamic polarisation curves obtained when
LDX2101+0.20%wt Ru alloy samples were anodically polarised in 3.5% NaCl aerated
solution at 25oC ±1oC following the procedure discussed in section 3.7.
(a) Sample B-1 (b) Sample B-2
Figure 4.11 Potentiodynamic polarisation curves of LDX2101+0.20%wt Ru alloy samples
in 3.5% NaCl aerated solution at 25oC ±1oC.
Sample B-1 was scanned from -332 mV, passing through the observed corrosion potential of
-132 mV. Between 198 mV and 313 mV spike increases in current density were observed,
suggesting pit initiation and propagation. The sample recovered slightly before experiencing
stable pit growth at 379 mV. At this potential (379 mV), current density increased with no
increase in polarisation potential. After reverse scanning, the sample did not repassivate.
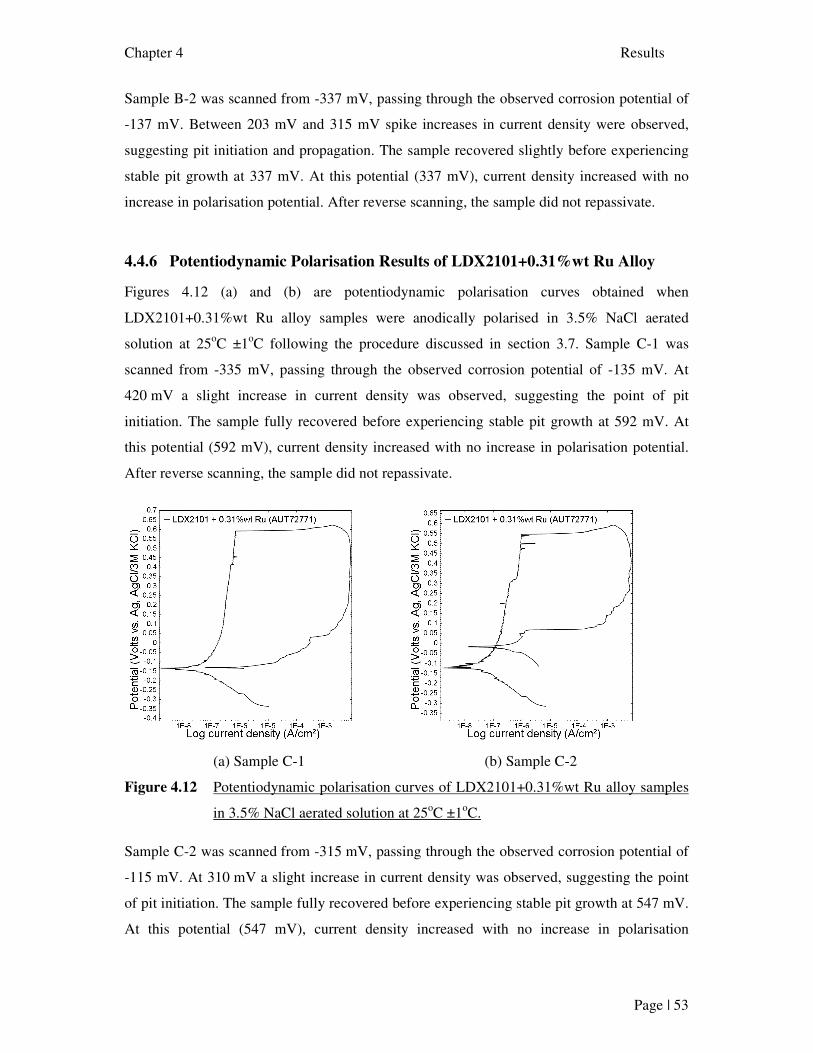
Chapter 4 Results
Page | 53
Sample B-2 was scanned from -337 mV, passing through the observed corrosion potential of
-137 mV. Between 203 mV and 315 mV spike increases in current density were observed,
suggesting pit initiation and propagation. The sample recovered slightly before experiencing
stable pit growth at 337 mV. At this potential (337 mV), current density increased with no
increase in polarisation potential. After reverse scanning, the sample did not repassivate.
4.4.6 Potentiodynamic Polarisation Results of LDX2101+0.31%wt Ru Alloy
Figures 4.12 (a) and (b) are potentiodynamic polarisation curves obtained when
LDX2101+0.31%wt Ru alloy samples were anodically polarised in 3.5% NaCl aerated
solution at 25oC ±1oC following the procedure discussed in section 3.7. Sample C-1 was
scanned from -335 mV, passing through the observed corrosion potential of -135 mV. At
420 mV a slight increase in current density was observed, suggesting the point of pit
initiation. The sample fully recovered before experiencing stable pit growth at 592 mV. At
this potential (592 mV), current density increased with no increase in polarisation potential.
After reverse scanning, the sample did not repassivate.
(a) Sample C-1 (b) Sample C-2
Figure 4.12 Potentiodynamic polarisation curves of LDX2101+0.31%wt Ru alloy samples
in 3.5% NaCl aerated solution at 25oC ±1oC.
Sample C-2 was scanned from -315 mV, passing through the observed corrosion potential of
-115 mV. At 310 mV a slight increase in current density was observed, suggesting the point
of pit initiation. The sample fully recovered before experiencing stable pit growth at 547 mV.
At this potential (547 mV), current density increased with no increase in polarisation
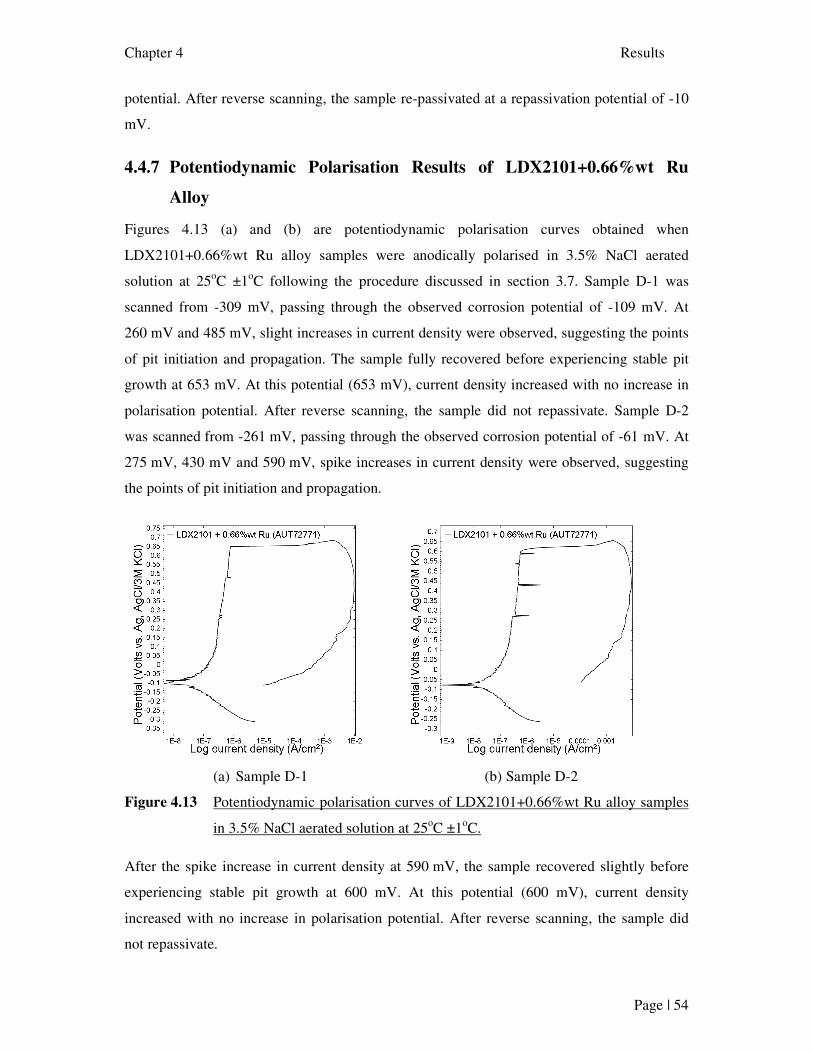
Chapter 4 Results
Page | 54
potential. After reverse scanning, the sample re-passivated at a repassivation potential of -10
mV.
4.4.7 Potentiodynamic Polarisation Results of LDX2101+0.66%wt Ru
Alloy
Figures 4.13 (a) and (b) are potentiodynamic polarisation curves obtained when
LDX2101+0.66%wt Ru alloy samples were anodically polarised in 3.5% NaCl aerated
solution at 25oC ±1oC following the procedure discussed in section 3.7. Sample D-1 was
scanned from -309 mV, passing through the observed corrosion potential of -109 mV. At
260 mV and 485 mV, slight increases in current density were observed, suggesting the points
of pit initiation and propagation. The sample fully recovered before experiencing stable pit
growth at 653 mV. At this potential (653 mV), current density increased with no increase in
polarisation potential. After reverse scanning, the sample did not repassivate. Sample D-2
was scanned from -261 mV, passing through the observed corrosion potential of -61 mV. At
275 mV, 430 mV and 590 mV, spike increases in current density were observed, suggesting
the points of pit initiation and propagation.
(a) Sample D-1 (b) Sample D-2
Figure 4.13 Potentiodynamic polarisation curves of LDX2101+0.66%wt Ru alloy samples
in 3.5% NaCl aerated solution at 25oC ±1oC.
After the spike increase in current density at 590 mV, the sample recovered slightly before
experiencing stable pit growth at 600 mV. At this potential (600 mV), current density
increased with no increase in polarisation potential. After reverse scanning, the sample did
not repassivate.
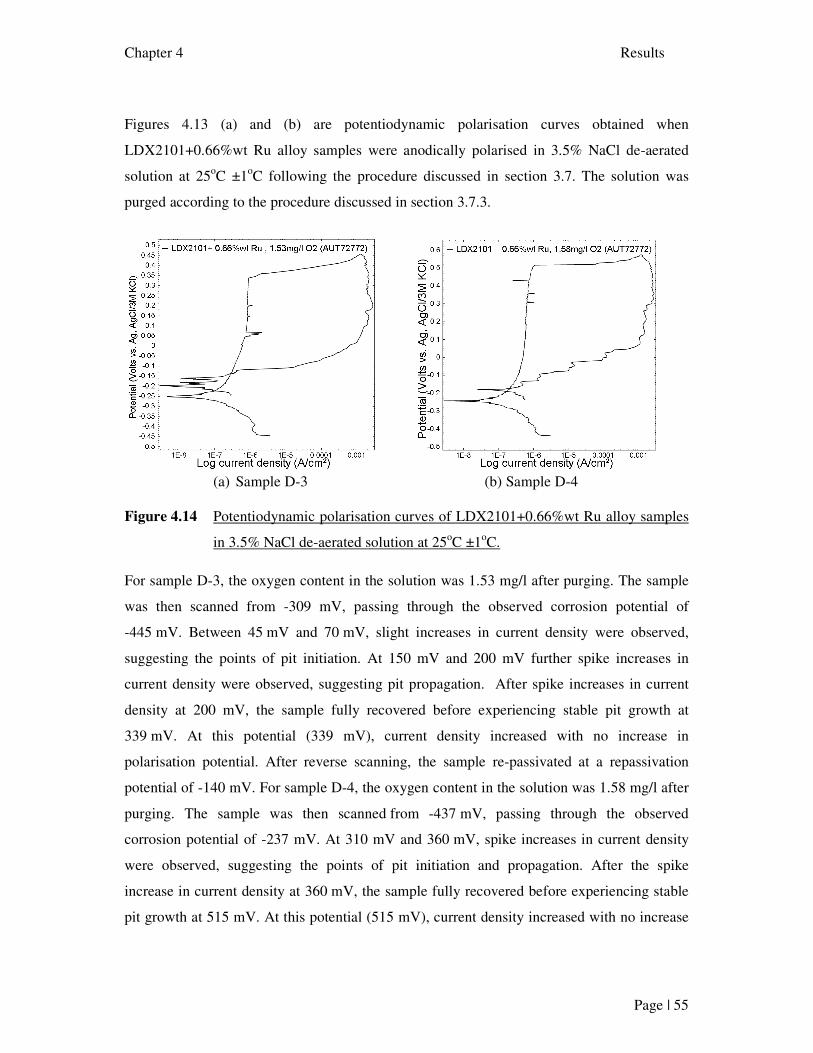
Chapter 4 Results
Page | 55
Figures 4.13 (a) and (b) are potentiodynamic polarisation curves obtained when
LDX2101+0.66%wt Ru alloy samples were anodically polarised in 3.5% NaCl de-aerated
solution at 25oC ±1oC following the procedure discussed in section 3.7. The solution was
purged according to the procedure discussed in section 3.7.3.
(a) Sample D-3 (b) Sample D-4
Figure 4.14 Potentiodynamic polarisation curves of LDX2101+0.66%wt Ru alloy samples
in 3.5% NaCl de-aerated solution at 25oC ±1oC.
For sample D-3, the oxygen content in the solution was 1.53 mg/l after purging. The sample
was then scanned from -309 mV, passing through the observed corrosion potential of
-445 mV. Between 45 mV and 70 mV, slight increases in current density were observed,
suggesting the points of pit initiation. At 150 mV and 200 mV further spike increases in
current density were observed, suggesting pit propagation. After spike increases in current
density at 200 mV, the sample fully recovered before experiencing stable pit growth at
339 mV. At this potential (339 mV), current density increased with no increase in
polarisation potential. After reverse scanning, the sample re-passivated at a repassivation
potential of -140 mV. For sample D-4, the oxygen content in the solution was 1.58 mg/l after
purging. The sample was then scanned from -437 mV, passing through the observed
corrosion potential of -237 mV. At 310 mV and 360 mV, spike increases in current density
were observed, suggesting the points of pit initiation and propagation. After the spike
increase in current density at 360 mV, the sample fully recovered before experiencing stable
pit growth at 515 mV. At this potential (515 mV), current density increased with no increase
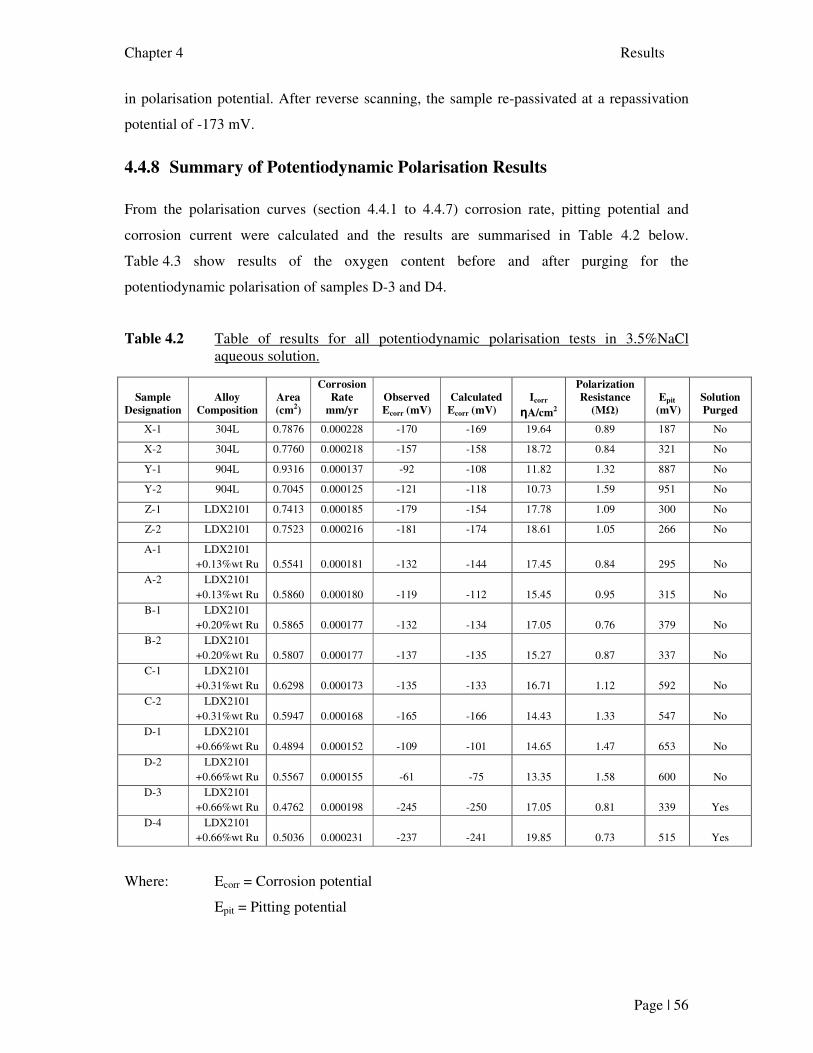
Chapter 4 Results
Page | 56
in polarisation potential. After reverse scanning, the sample re-passivated at a repassivation
potential of -173 mV.
4.4.8 Summary of Potentiodynamic Polarisation Results
From the polarisation curves (section 4.4.1 to 4.4.7) corrosion rate, pitting potential and
corrosion current were calculated and the results are summarised in Table 4.2 below.
Table 4.3 show results of the oxygen content before and after purging for the
potentiodynamic polarisation of samples D-3 and D4.
Table 4.2 Table of results for all potentiodynamic polarisation tests in 3.5%NaCl aqueous solution.
Sample
Designation
Alloy
Composition
Area
(cm2)
Corrosion
Rate
mm/yr
Observed
Ecorr (mV)
Calculated
Ecorr (mV)
Icorr
ηA/cm2
Polarization
Resistance
(MΩ)
Epit
(mV)
Solution
Purged
X-1 304L 0.7876 0.000228 -170 -169 19.64 0.89 187 No
X-2 304L 0.7760 0.000218 -157 -158 18.72 0.84 321 No
Y-1 904L 0.9316 0.000137 -92 -108 11.82 1.32 887 No
Y-2 904L 0.7045 0.000125 -121 -118 10.73 1.59 951 No
Z-1 LDX2101 0.7413 0.000185 -179 -154 17.78 1.09 300 No
Z-2 LDX2101 0.7523 0.000216 -181 -174 18.61 1.05 266 No
A-1 LDX2101 +0.13%wt Ru
0.5541
0.000181
-132
-144
17.45
0.84
295
No
A-2 LDX2101 +0.13%wt Ru
0.5860
0.000180
-119
-112
15.45
0.95
315
No
B-1 LDX2101 +0.20%wt Ru
0.5865
0.000177
-132
-134
17.05
0.76
379
No
B-2 LDX2101 +0.20%wt Ru
0.5807
0.000177
-137
-135
15.27
0.87
337
No
C-1 LDX2101 +0.31%wt Ru
0.6298
0.000173
-135
-133
16.71
1.12
592
No
C-2 LDX2101 +0.31%wt Ru
0.5947
0.000168
-165
-166
14.43
1.33
547
No
D-1 LDX2101 +0.66%wt Ru
0.4894
0.000152
-109
-101
14.65
1.47
653
No
D-2 LDX2101 +0.66%wt Ru
0.5567
0.000155
-61
-75
13.35
1.58
600
No
D-3 LDX2101 +0.66%wt Ru
0.4762
0.000198
-245
-250
17.05
0.81
339
Yes
D-4 LDX2101 +0.66%wt Ru
0.5036
0.000231
-237
-241
19.85
0.73
515
Yes
Where: Ecorr = Corrosion potential
Epit = Pitting potential
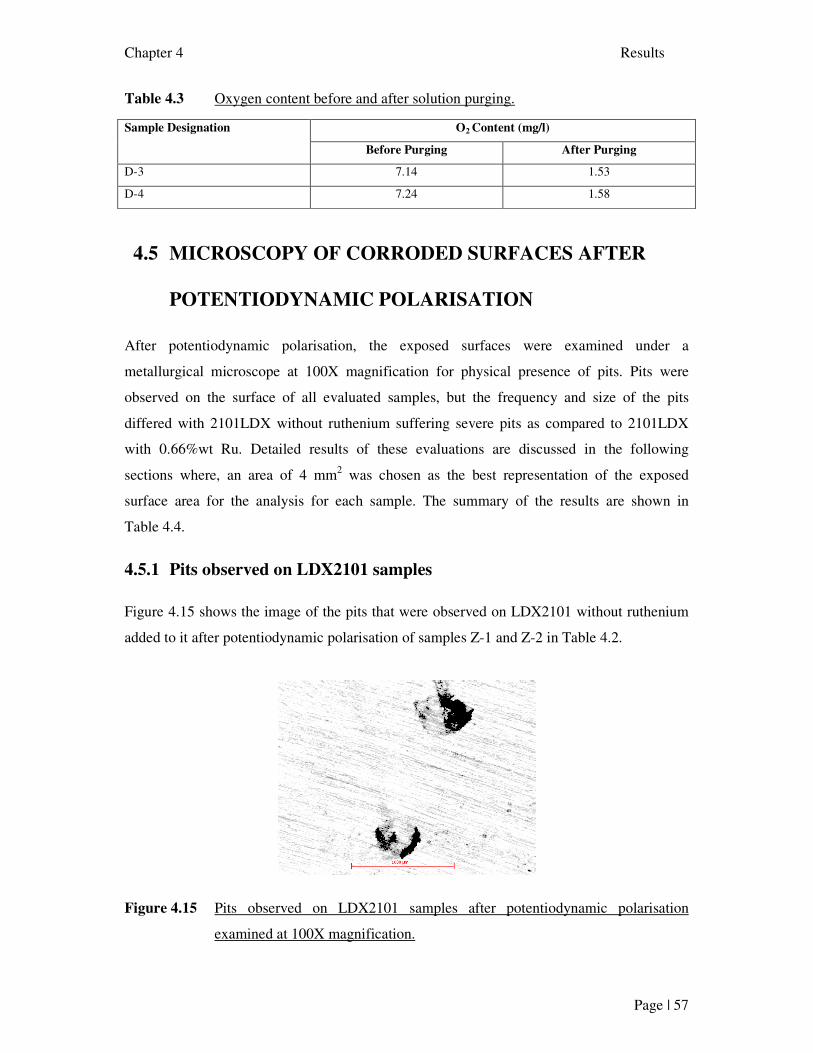
Chapter 4 Results
Page | 57
Table 4.3 Oxygen content before and after solution purging.
Sample Designation O2 Content (mg/l)
Before Purging After Purging
D-3 7.14 1.53
D-4 7.24 1.58
4.5 MICROSCOPY OF CORRODED SURFACES AFTER
POTENTIODYNAMIC POLARISATION
After potentiodynamic polarisation, the exposed surfaces were examined under a
metallurgical microscope at 100X magnification for physical presence of pits. Pits were
observed on the surface of all evaluated samples, but the frequency and size of the pits
differed with 2101LDX without ruthenium suffering severe pits as compared to 2101LDX
with 0.66%wt Ru. Detailed results of these evaluations are discussed in the following
sections where, an area of 4 mm2 was chosen as the best representation of the exposed
surface area for the analysis for each sample. The summary of the results are shown in
Table 4.4.
4.5.1 Pits observed on LDX2101 samples
Figure 4.15 shows the image of the pits that were observed on LDX2101 without ruthenium
added to it after potentiodynamic polarisation of samples Z-1 and Z-2 in Table 4.2.
Figure 4.15 Pits observed on LDX2101 samples after potentiodynamic polarisation
examined at 100X magnification.
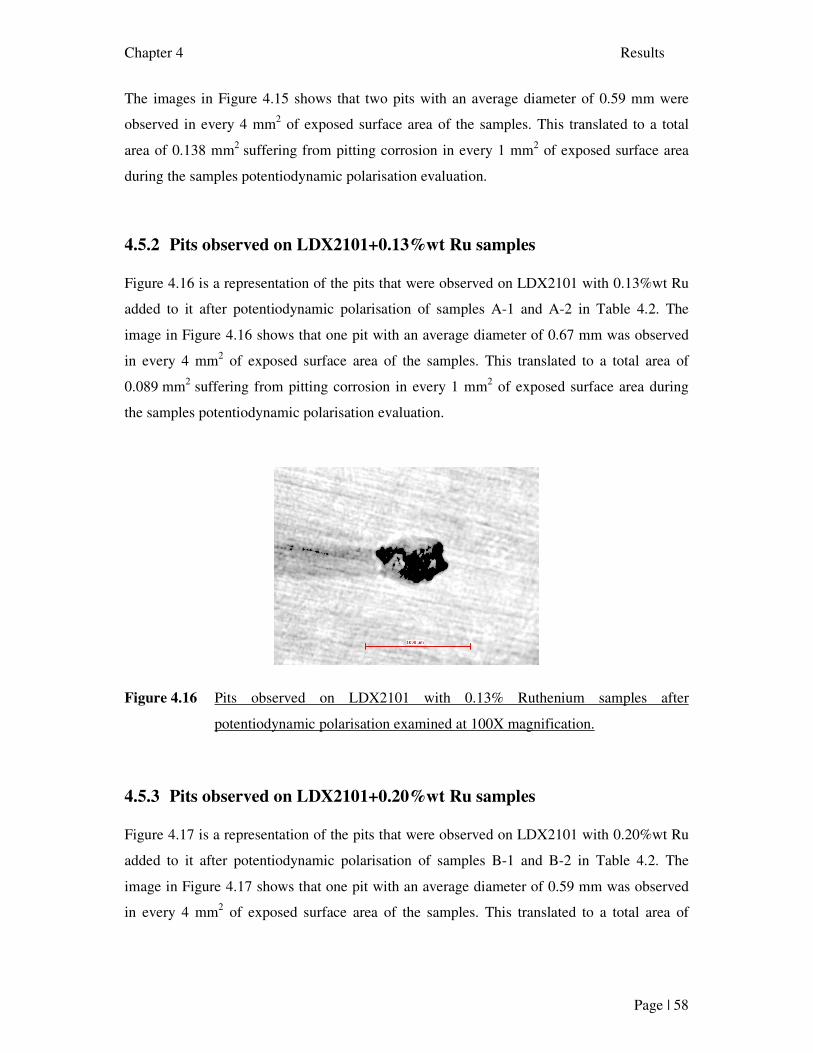
Chapter 4 Results
Page | 58
The images in Figure 4.15 shows that two pits with an average diameter of 0.59 mm were
observed in every 4 mm2 of exposed surface area of the samples. This translated to a total
area of 0.138 mm2 suffering from pitting corrosion in every 1 mm2 of exposed surface area
during the samples potentiodynamic polarisation evaluation.
4.5.2 Pits observed on LDX2101+0.13%wt Ru samples
Figure 4.16 is a representation of the pits that were observed on LDX2101 with 0.13%wt Ru
added to it after potentiodynamic polarisation of samples A-1 and A-2 in Table 4.2. The
image in Figure 4.16 shows that one pit with an average diameter of 0.67 mm was observed
in every 4 mm2 of exposed surface area of the samples. This translated to a total area of
0.089 mm2 suffering from pitting corrosion in every 1 mm2 of exposed surface area during
the samples potentiodynamic polarisation evaluation.
Figure 4.16 Pits observed on LDX2101 with 0.13% Ruthenium samples after
potentiodynamic polarisation examined at 100X magnification.
4.5.3 Pits observed on LDX2101+0.20%wt Ru samples
Figure 4.17 is a representation of the pits that were observed on LDX2101 with 0.20%wt Ru
added to it after potentiodynamic polarisation of samples B-1 and B-2 in Table 4.2. The
image in Figure 4.17 shows that one pit with an average diameter of 0.59 mm was observed
in every 4 mm2 of exposed surface area of the samples. This translated to a total area of
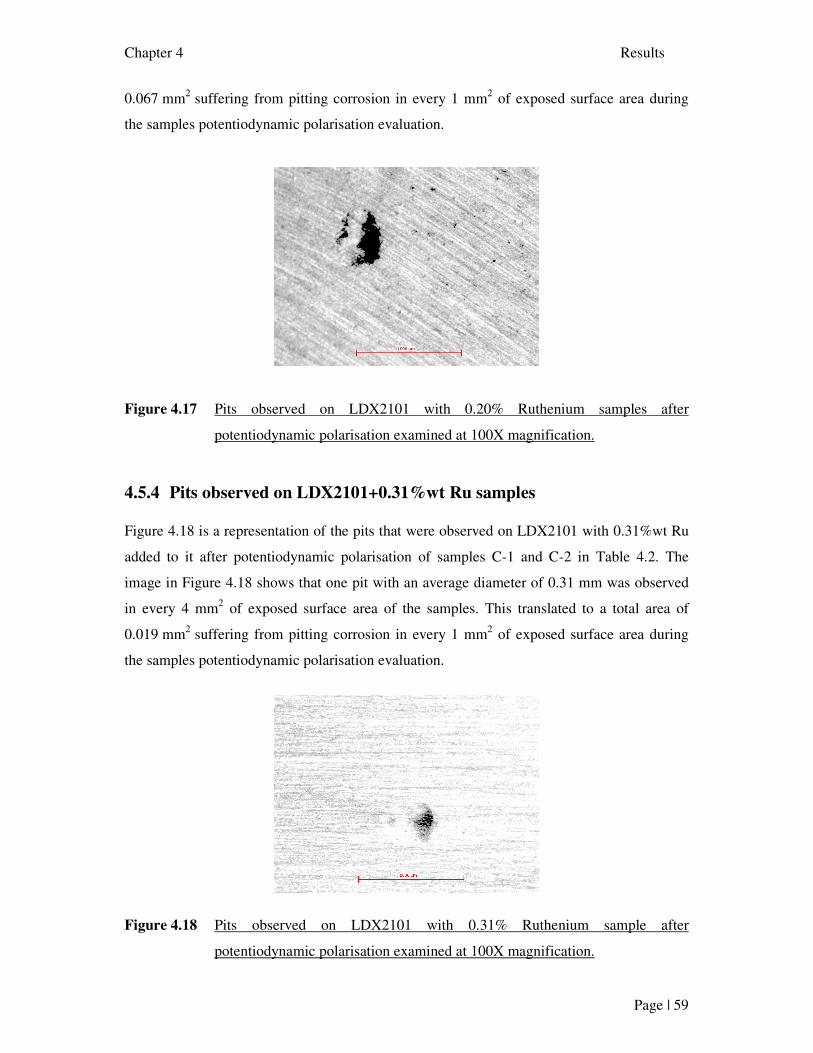
Chapter 4 Results
Page | 59
0.067 mm2 suffering from pitting corrosion in every 1 mm2 of exposed surface area during
the samples potentiodynamic polarisation evaluation.
Figure 4.17 Pits observed on LDX2101 with 0.20% Ruthenium samples after
potentiodynamic polarisation examined at 100X magnification.
4.5.4 Pits observed on LDX2101+0.31%wt Ru samples
Figure 4.18 is a representation of the pits that were observed on LDX2101 with 0.31%wt Ru
added to it after potentiodynamic polarisation of samples C-1 and C-2 in Table 4.2. The
image in Figure 4.18 shows that one pit with an average diameter of 0.31 mm was observed
in every 4 mm2 of exposed surface area of the samples. This translated to a total area of
0.019 mm2 suffering from pitting corrosion in every 1 mm2 of exposed surface area during
the samples potentiodynamic polarisation evaluation.
Figure 4.18 Pits observed on LDX2101 with 0.31% Ruthenium sample after
potentiodynamic polarisation examined at 100X magnification.
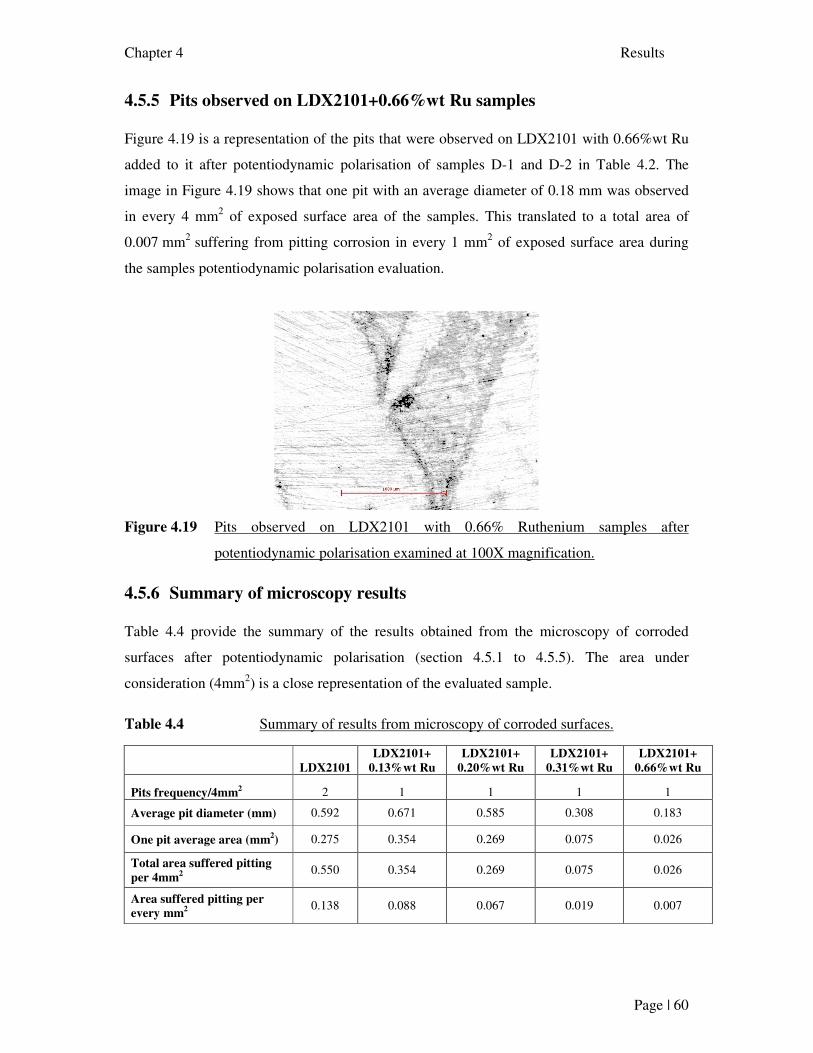
Chapter 4 Results
Page | 60
4.5.5 Pits observed on LDX2101+0.66%wt Ru samples
Figure 4.19 is a representation of the pits that were observed on LDX2101 with 0.66%wt Ru
added to it after potentiodynamic polarisation of samples D-1 and D-2 in Table 4.2. The
image in Figure 4.19 shows that one pit with an average diameter of 0.18 mm was observed
in every 4 mm2 of exposed surface area of the samples. This translated to a total area of
0.007 mm2 suffering from pitting corrosion in every 1 mm2 of exposed surface area during
the samples potentiodynamic polarisation evaluation.
Figure 4.19 Pits observed on LDX2101 with 0.66% Ruthenium samples after
potentiodynamic polarisation examined at 100X magnification.
4.5.6 Summary of microscopy results
Table 4.4 provide the summary of the results obtained from the microscopy of corroded
surfaces after potentiodynamic polarisation (section 4.5.1 to 4.5.5). The area under
consideration (4mm2) is a close representation of the evaluated sample.
Table 4.4 Summary of results from microscopy of corroded surfaces.
LDX2101
LDX2101+
0.13%wt Ru
LDX2101+
0.20%wt Ru
LDX2101+
0.31%wt Ru
LDX2101+
0.66%wt Ru
Pits frequency/4mm2 2 1 1 1 1
Average pit diameter (mm) 0.592 0.671 0.585 0.308 0.183
One pit average area (mm2) 0.275 0.354 0.269 0.075 0.026
Total area suffered pitting
per 4mm2 0.550 0.354 0.269 0.075 0.026
Area suffered pitting per
every mm2
0.138 0.088 0.067 0.019 0.007
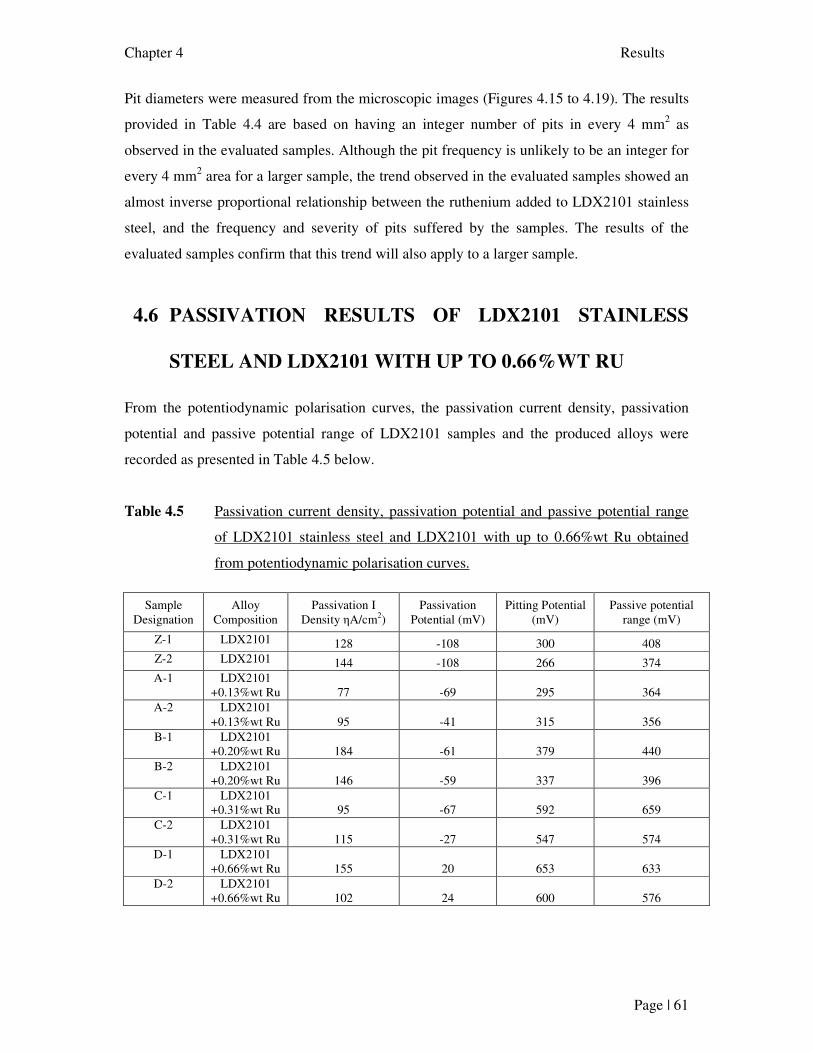
Chapter 4 Results
Page | 61
Pit diameters were measured from the microscopic images (Figures 4.15 to 4.19). The results
provided in Table 4.4 are based on having an integer number of pits in every 4 mm2 as
observed in the evaluated samples. Although the pit frequency is unlikely to be an integer for
every 4 mm2 area for a larger sample, the trend observed in the evaluated samples showed an
almost inverse proportional relationship between the ruthenium added to LDX2101 stainless
steel, and the frequency and severity of pits suffered by the samples. The results of the
evaluated samples confirm that this trend will also apply to a larger sample.
4.6 PASSIVATION RESULTS OF LDX2101 STAINLESS
STEEL AND LDX2101 WITH UP TO 0.66%WT RU
From the potentiodynamic polarisation curves, the passivation current density, passivation
potential and passive potential range of LDX2101 samples and the produced alloys were
recorded as presented in Table 4.5 below.
Table 4.5 Passivation current density, passivation potential and passive potential range
of LDX2101 stainless steel and LDX2101 with up to 0.66%wt Ru obtained
from potentiodynamic polarisation curves.
Sample Designation
Alloy Composition
Passivation I Density ηA/cm2)
Passivation Potential (mV)
Pitting Potential (mV)
Passive potential range (mV)
Z-1 LDX2101 128 -108 300 408 Z-2 LDX2101 144 -108 266 374 A-1 LDX2101
+0.13%wt Ru 77 -69 295 364 A-2 LDX2101
+0.13%wt Ru 95 -41 315 356 B-1 LDX2101
+0.20%wt Ru 184 -61 379 440 B-2 LDX2101
+0.20%wt Ru 146 -59 337 396 C-1 LDX2101
+0.31%wt Ru 95 -67 592 659 C-2 LDX2101
+0.31%wt Ru 115 -27 547 574 D-1 LDX2101
+0.66%wt Ru 155 20 653 633 D-2 LDX2101
+0.66%wt Ru 102 24 600 576
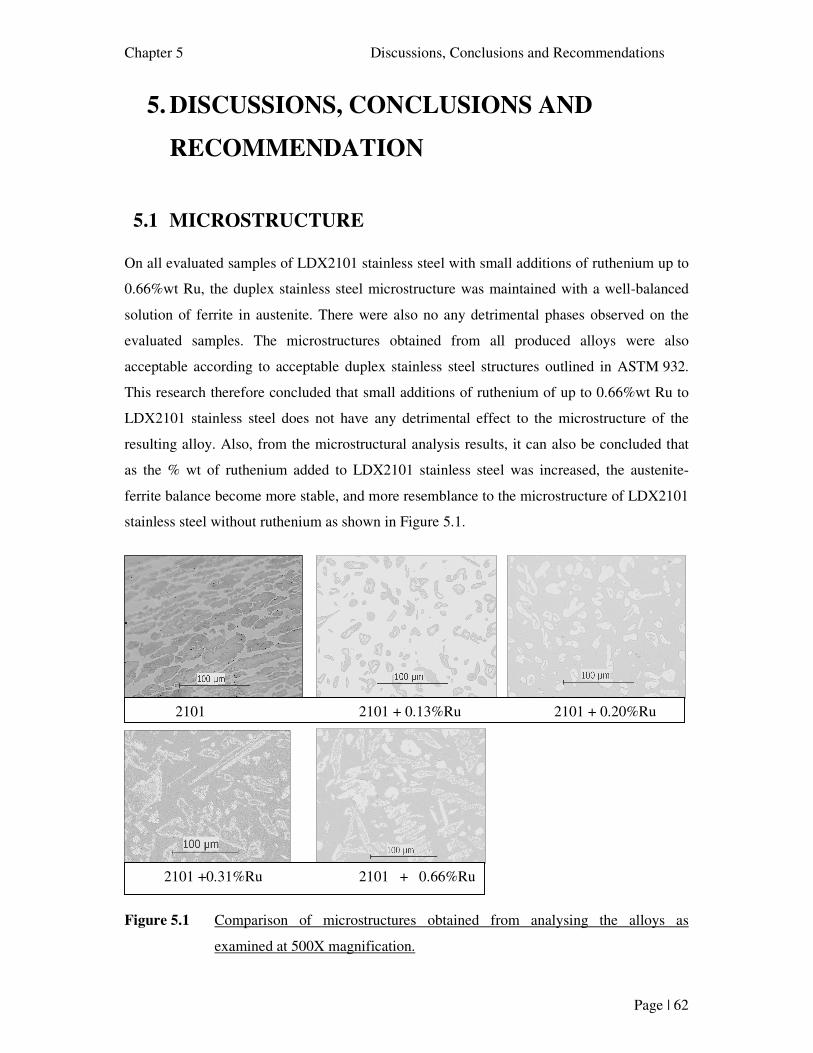
Chapter 5 Discussions, Conclusions and Recommendations
Page | 62
5. DISCUSSIONS, CONCLUSIONS AND
RECOMMENDATION
5.1 MICROSTRUCTURE
On all evaluated samples of LDX2101 stainless steel with small additions of ruthenium up to
0.66%wt Ru, the duplex stainless steel microstructure was maintained with a well-balanced
solution of ferrite in austenite. There were also no any detrimental phases observed on the
evaluated samples. The microstructures obtained from all produced alloys were also
acceptable according to acceptable duplex stainless steel structures outlined in ASTM 932.
This research therefore concluded that small additions of ruthenium of up to 0.66%wt Ru to
LDX2101 stainless steel does not have any detrimental effect to the microstructure of the
resulting alloy. Also, from the microstructural analysis results, it can also be concluded that
as the % wt of ruthenium added to LDX2101 stainless steel was increased, the austenite-
ferrite balance become more stable, and more resemblance to the microstructure of LDX2101
stainless steel without ruthenium as shown in Figure 5.1.
Figure 5.1 Comparison of microstructures obtained from analysing the alloys as
examined at 500X magnification.
2101 2101 + 0.13%Ru 2101 + 0.20%Ru
2101 +0.31%Ru 2101 + 0.66%Ru
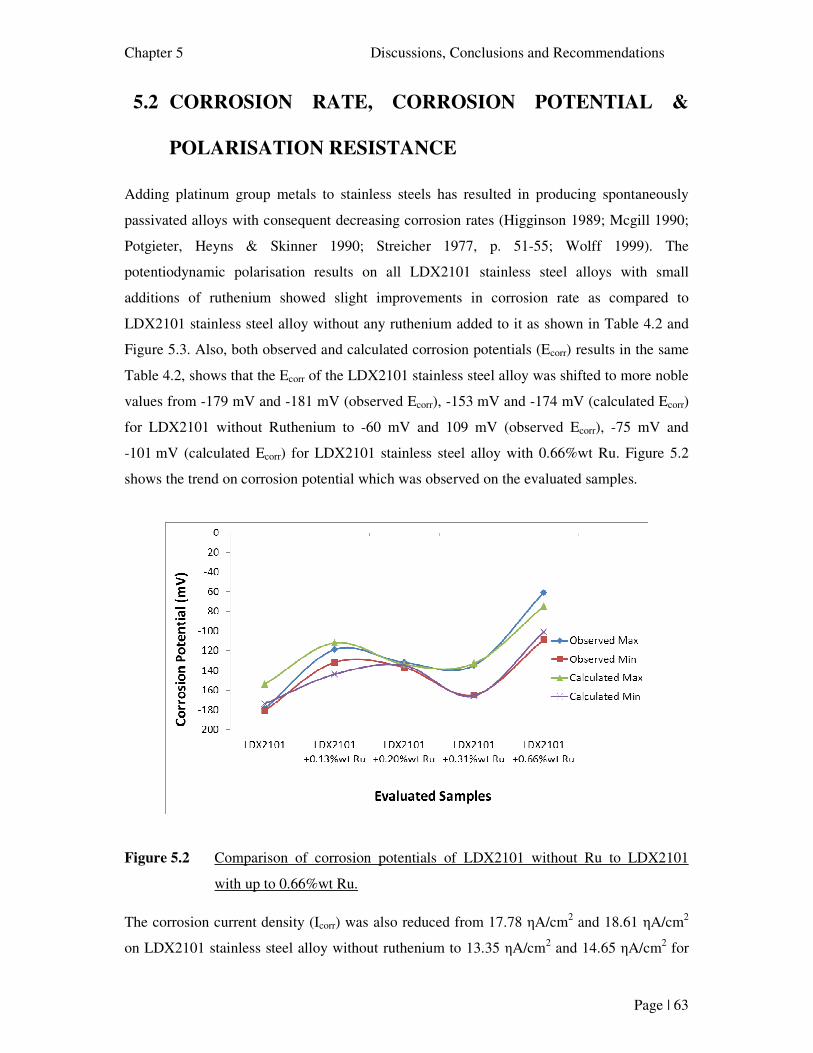
Chapter 5 Discussions, Conclusions and Recommendations
Page | 63
5.2 CORROSION RATE, CORROSION POTENTIAL &
POLARISATION RESISTANCE
Adding platinum group metals to stainless steels has resulted in producing spontaneously
passivated alloys with consequent decreasing corrosion rates (Higginson 1989; Mcgill 1990;
Potgieter, Heyns & Skinner 1990; Streicher 1977, p. 51-55; Wolff 1999). The
potentiodynamic polarisation results on all LDX2101 stainless steel alloys with small
additions of ruthenium showed slight improvements in corrosion rate as compared to
LDX2101 stainless steel alloy without any ruthenium added to it as shown in Table 4.2 and
Figure 5.3. Also, both observed and calculated corrosion potentials (Ecorr) results in the same
Table 4.2, shows that the Ecorr of the LDX2101 stainless steel alloy was shifted to more noble
values from -179 mV and -181 mV (observed Ecorr), -153 mV and -174 mV (calculated Ecorr)
for LDX2101 without Ruthenium to -60 mV and 109 mV (observed Ecorr), -75 mV and
-101 mV (calculated Ecorr) for LDX2101 stainless steel alloy with 0.66%wt Ru. Figure 5.2
shows the trend on corrosion potential which was observed on the evaluated samples.
Figure 5.2 Comparison of corrosion potentials of LDX2101 without Ru to LDX2101
with up to 0.66%wt Ru.
The corrosion current density (Icorr) was also reduced from 17.78 ηA/cm2 and 18.61 ηA/cm2
on LDX2101 stainless steel alloy without ruthenium to 13.35 ηA/cm2 and 14.65 ηA/cm2 for
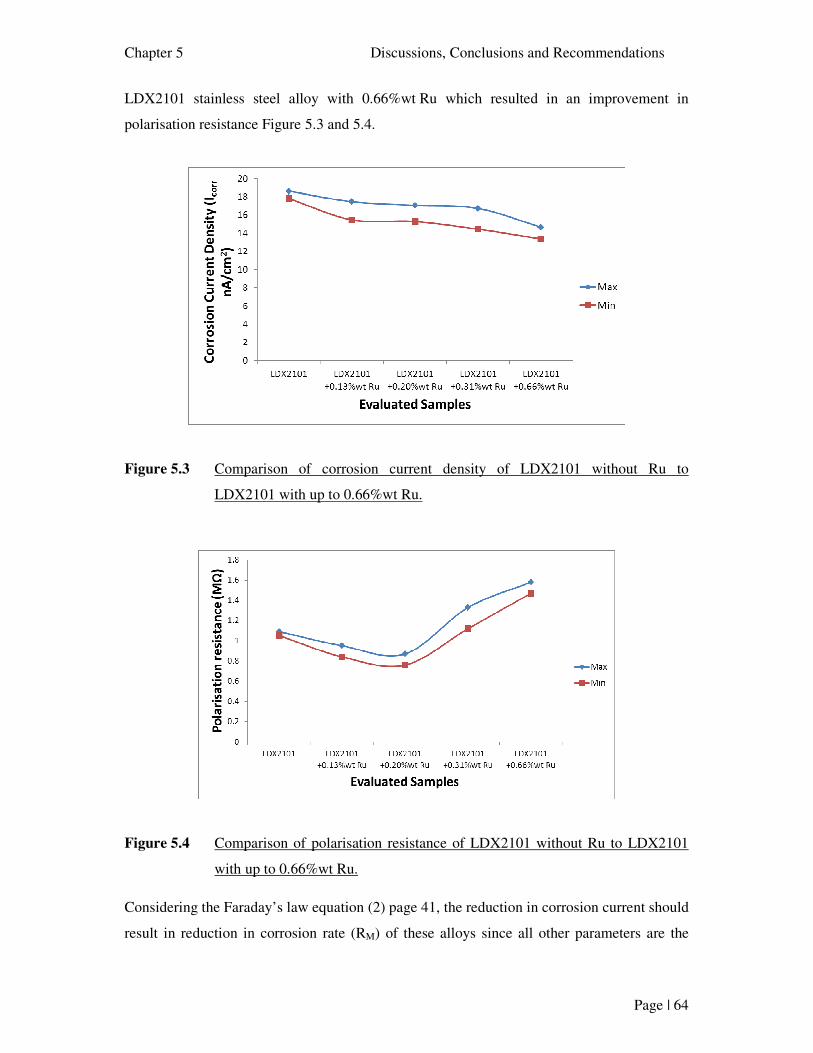
Chapter 5 Discussions, Conclusions and Recommendations
Page | 64
LDX2101 stainless steel alloy with 0.66%wt Ru which resulted in an improvement in
polarisation resistance Figure 5.3 and 5.4.
Figure 5.3 Comparison of corrosion current density of LDX2101 without Ru to
LDX2101 with up to 0.66%wt Ru.
Figure 5.4 Comparison of polarisation resistance of LDX2101 without Ru to LDX2101
with up to 0.66%wt Ru.
Considering the Faraday’s law equation (2) page 41, the reduction in corrosion current should
result in reduction in corrosion rate (RM) of these alloys since all other parameters are the
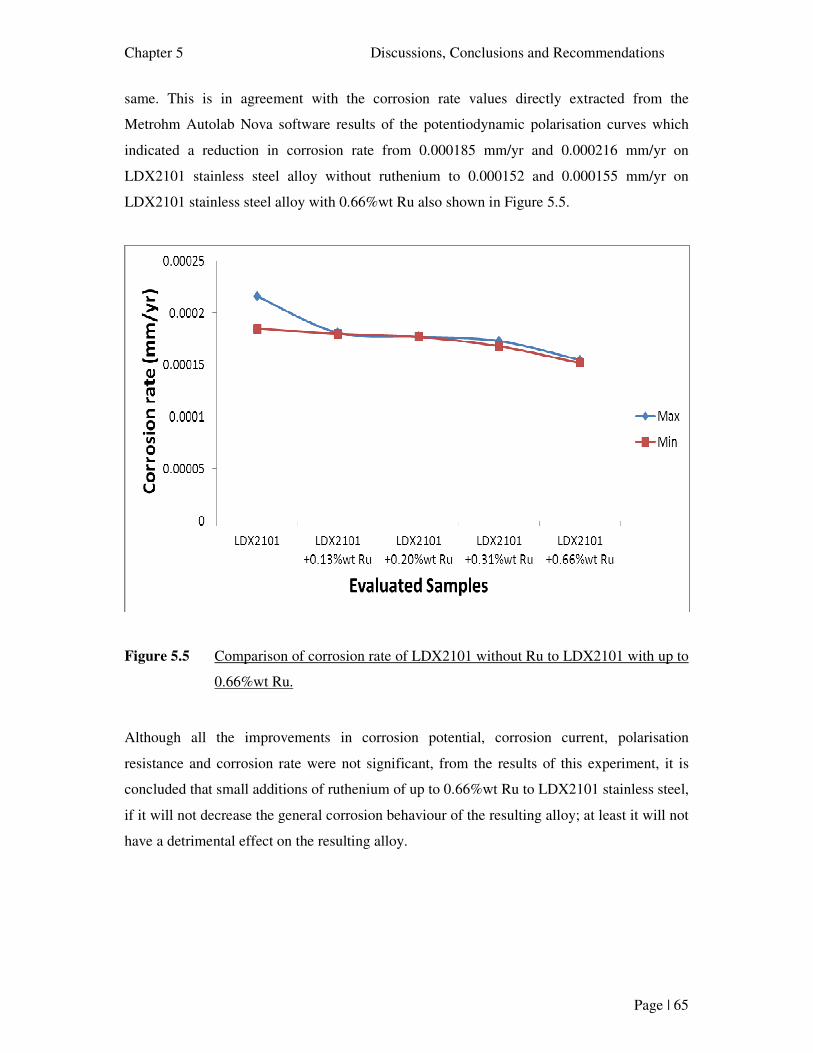
Chapter 5 Discussions, Conclusions and Recommendations
Page | 65
same. This is in agreement with the corrosion rate values directly extracted from the
Metrohm Autolab Nova software results of the potentiodynamic polarisation curves which
indicated a reduction in corrosion rate from 0.000185 mm/yr and 0.000216 mm/yr on
LDX2101 stainless steel alloy without ruthenium to 0.000152 and 0.000155 mm/yr on
LDX2101 stainless steel alloy with 0.66%wt Ru also shown in Figure 5.5.
Figure 5.5 Comparison of corrosion rate of LDX2101 without Ru to LDX2101 with up to
0.66%wt Ru.
Although all the improvements in corrosion potential, corrosion current, polarisation
resistance and corrosion rate were not significant, from the results of this experiment, it is
concluded that small additions of ruthenium of up to 0.66%wt Ru to LDX2101 stainless steel,
if it will not decrease the general corrosion behaviour of the resulting alloy; at least it will not
have a detrimental effect on the resulting alloy.
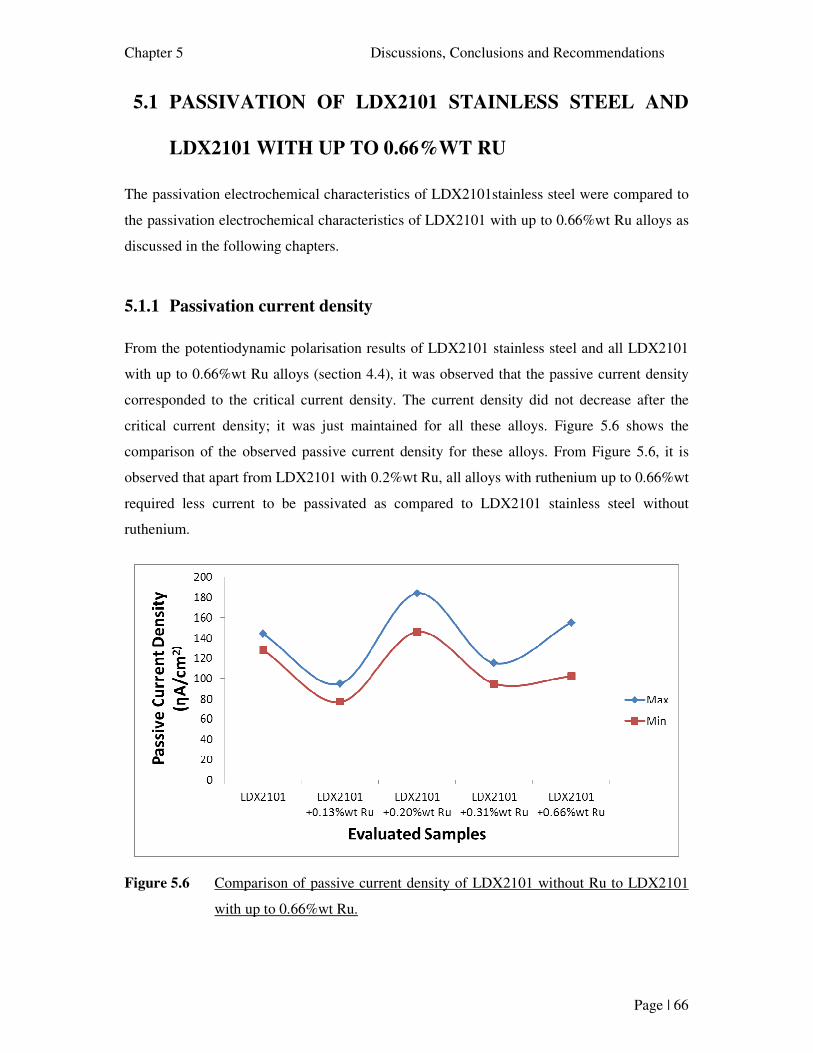
Chapter 5 Discussions, Conclusions and Recommendations
Page | 66
5.1 PASSIVATION OF LDX2101 STAINLESS STEEL AND
LDX2101 WITH UP TO 0.66%WT RU
The passivation electrochemical characteristics of LDX2101stainless steel were compared to
the passivation electrochemical characteristics of LDX2101 with up to 0.66%wt Ru alloys as
discussed in the following chapters.
5.1.1 Passivation current density
From the potentiodynamic polarisation results of LDX2101 stainless steel and all LDX2101
with up to 0.66%wt Ru alloys (section 4.4), it was observed that the passive current density
corresponded to the critical current density. The current density did not decrease after the
critical current density; it was just maintained for all these alloys. Figure 5.6 shows the
comparison of the observed passive current density for these alloys. From Figure 5.6, it is
observed that apart from LDX2101 with 0.2%wt Ru, all alloys with ruthenium up to 0.66%wt
required less current to be passivated as compared to LDX2101 stainless steel without
ruthenium.
Figure 5.6 Comparison of passive current density of LDX2101 without Ru to LDX2101
with up to 0.66%wt Ru.
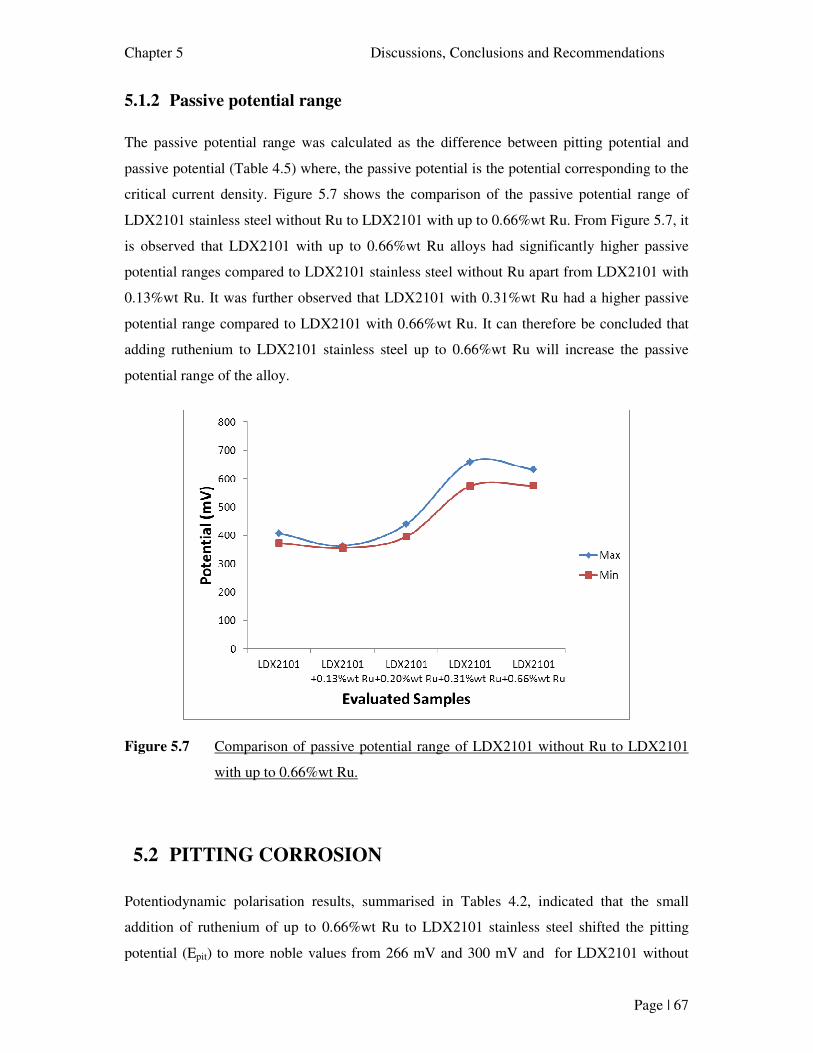
Chapter 5 Discussions, Conclusions and Recommendations
Page | 67
5.1.2 Passive potential range
The passive potential range was calculated as the difference between pitting potential and
passive potential (Table 4.5) where, the passive potential is the potential corresponding to the
critical current density. Figure 5.7 shows the comparison of the passive potential range of
LDX2101 stainless steel without Ru to LDX2101 with up to 0.66%wt Ru. From Figure 5.7, it
is observed that LDX2101 with up to 0.66%wt Ru alloys had significantly higher passive
potential ranges compared to LDX2101 stainless steel without Ru apart from LDX2101 with
0.13%wt Ru. It was further observed that LDX2101 with 0.31%wt Ru had a higher passive
potential range compared to LDX2101 with 0.66%wt Ru. It can therefore be concluded that
adding ruthenium to LDX2101 stainless steel up to 0.66%wt Ru will increase the passive
potential range of the alloy.
Figure 5.7 Comparison of passive potential range of LDX2101 without Ru to LDX2101
with up to 0.66%wt Ru.
5.2 PITTING CORROSION
Potentiodynamic polarisation results, summarised in Tables 4.2, indicated that the small
addition of ruthenium of up to 0.66%wt Ru to LDX2101 stainless steel shifted the pitting
potential (Epit) to more noble values from 266 mV and 300 mV and for LDX2101 without
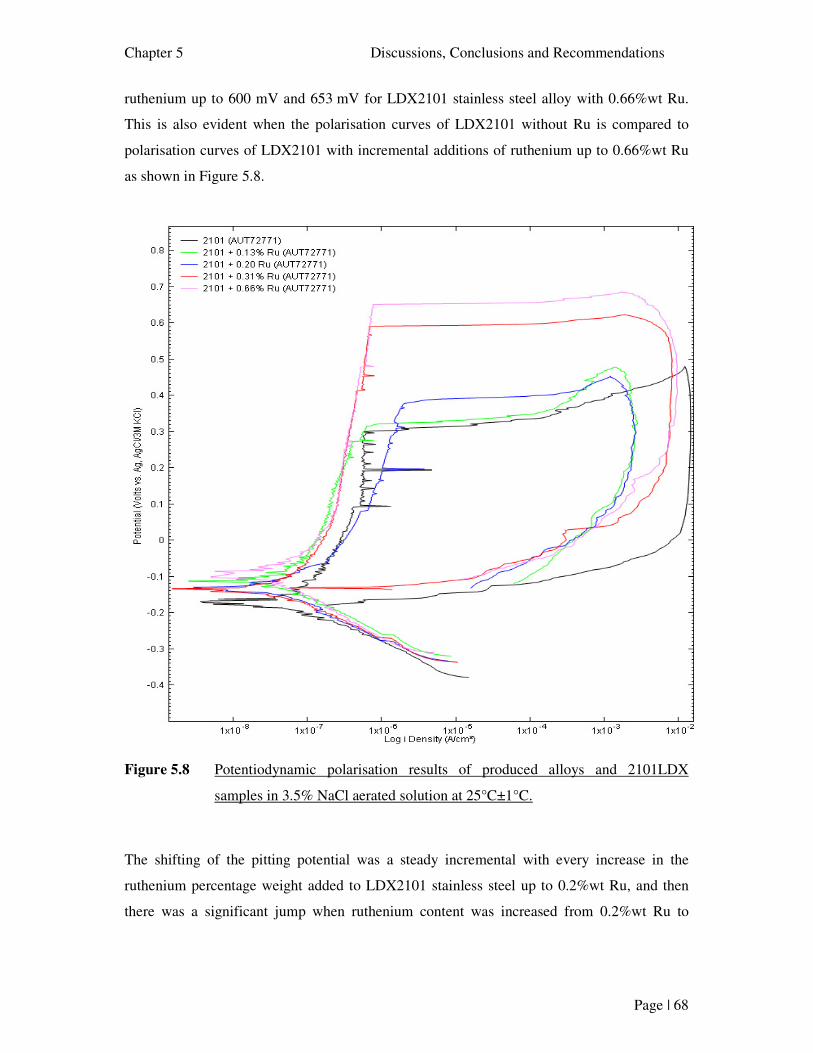
Chapter 5 Discussions, Conclusions and Recommendations
Page | 68
ruthenium up to 600 mV and 653 mV for LDX2101 stainless steel alloy with 0.66%wt Ru.
This is also evident when the polarisation curves of LDX2101 without Ru is compared to
polarisation curves of LDX2101 with incremental additions of ruthenium up to 0.66%wt Ru
as shown in Figure 5.8.
Figure 5.8 Potentiodynamic polarisation results of produced alloys and 2101LDX
samples in 3.5% NaCl aerated solution at 25°C±1°C.
The shifting of the pitting potential was a steady incremental with every increase in the
ruthenium percentage weight added to LDX2101 stainless steel up to 0.2%wt Ru, and then
there was a significant jump when ruthenium content was increased from 0.2%wt Ru to
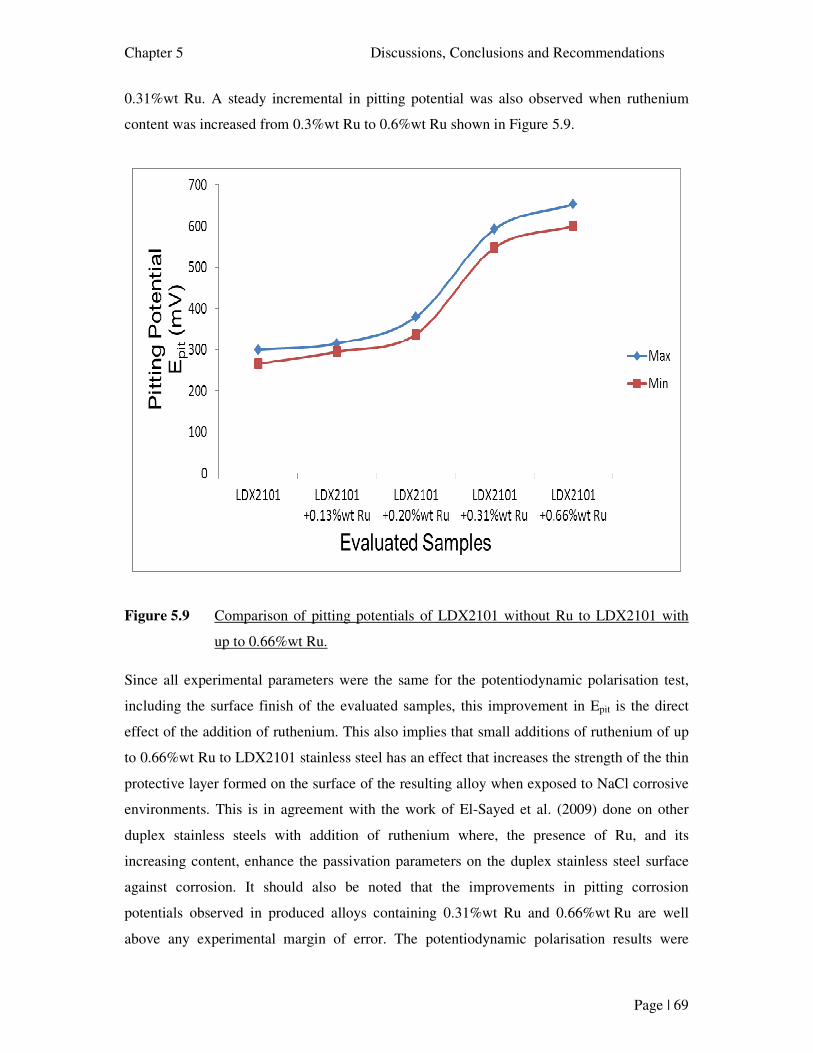
Chapter 5 Discussions, Conclusions and Recommendations
Page | 69
0.31%wt Ru. A steady incremental in pitting potential was also observed when ruthenium
content was increased from 0.3%wt Ru to 0.6%wt Ru shown in Figure 5.9.
Figure 5.9 Comparison of pitting potentials of LDX2101 without Ru to LDX2101 with
up to 0.66%wt Ru.
Since all experimental parameters were the same for the potentiodynamic polarisation test,
including the surface finish of the evaluated samples, this improvement in Epit is the direct
effect of the addition of ruthenium. This also implies that small additions of ruthenium of up
to 0.66%wt Ru to LDX2101 stainless steel has an effect that increases the strength of the thin
protective layer formed on the surface of the resulting alloy when exposed to NaCl corrosive
environments. This is in agreement with the work of El-Sayed et al. (2009) done on other
duplex stainless steels with addition of ruthenium where, the presence of Ru, and its
increasing content, enhance the passivation parameters on the duplex stainless steel surface
against corrosion. It should also be noted that the improvements in pitting corrosion
potentials observed in produced alloys containing 0.31%wt Ru and 0.66%wt Ru are well
above any experimental margin of error. The potentiodynamic polarisation results were
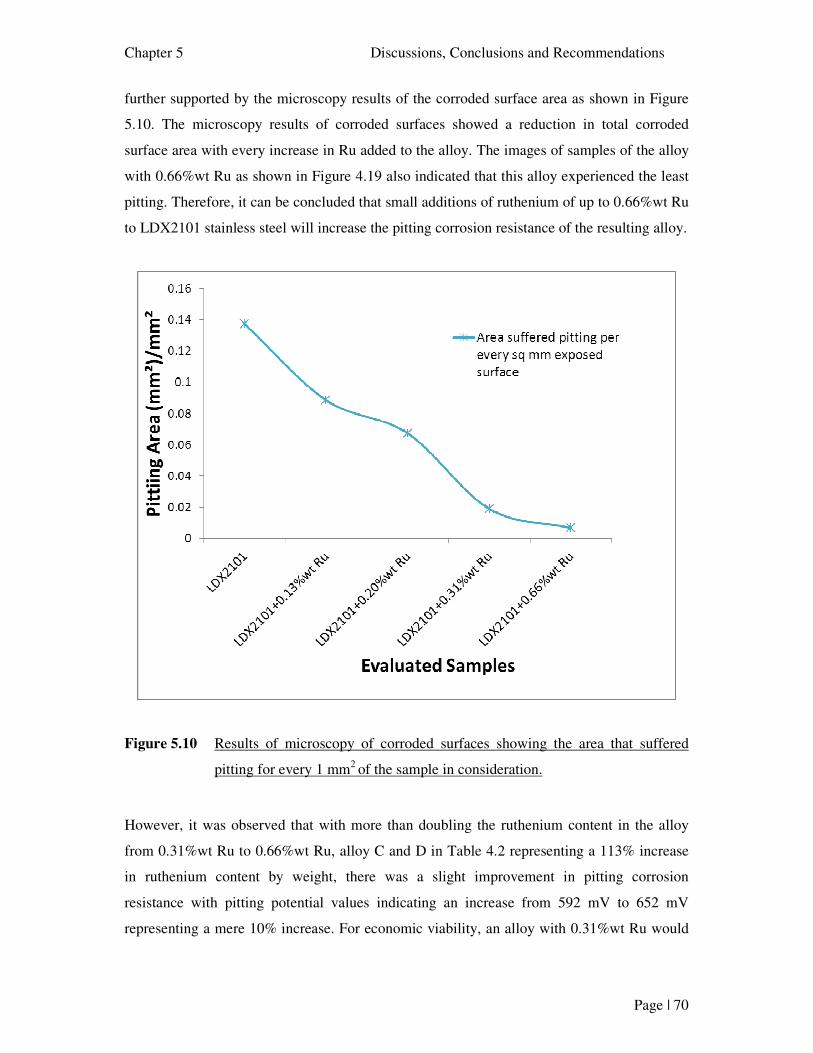
Chapter 5 Discussions, Conclusions and Recommendations
Page | 70
further supported by the microscopy results of the corroded surface area as shown in Figure
5.10. The microscopy results of corroded surfaces showed a reduction in total corroded
surface area with every increase in Ru added to the alloy. The images of samples of the alloy
with 0.66%wt Ru as shown in Figure 4.19 also indicated that this alloy experienced the least
pitting. Therefore, it can be concluded that small additions of ruthenium of up to 0.66%wt Ru
to LDX2101 stainless steel will increase the pitting corrosion resistance of the resulting alloy.
Figure 5.10 Results of microscopy of corroded surfaces showing the area that suffered
pitting for every 1 mm2 of the sample in consideration.
However, it was observed that with more than doubling the ruthenium content in the alloy
from 0.31%wt Ru to 0.66%wt Ru, alloy C and D in Table 4.2 representing a 113% increase
in ruthenium content by weight, there was a slight improvement in pitting corrosion
resistance with pitting potential values indicating an increase from 592 mV to 652 mV
representing a mere 10% increase. For economic viability, an alloy with 0.31%wt Ru would
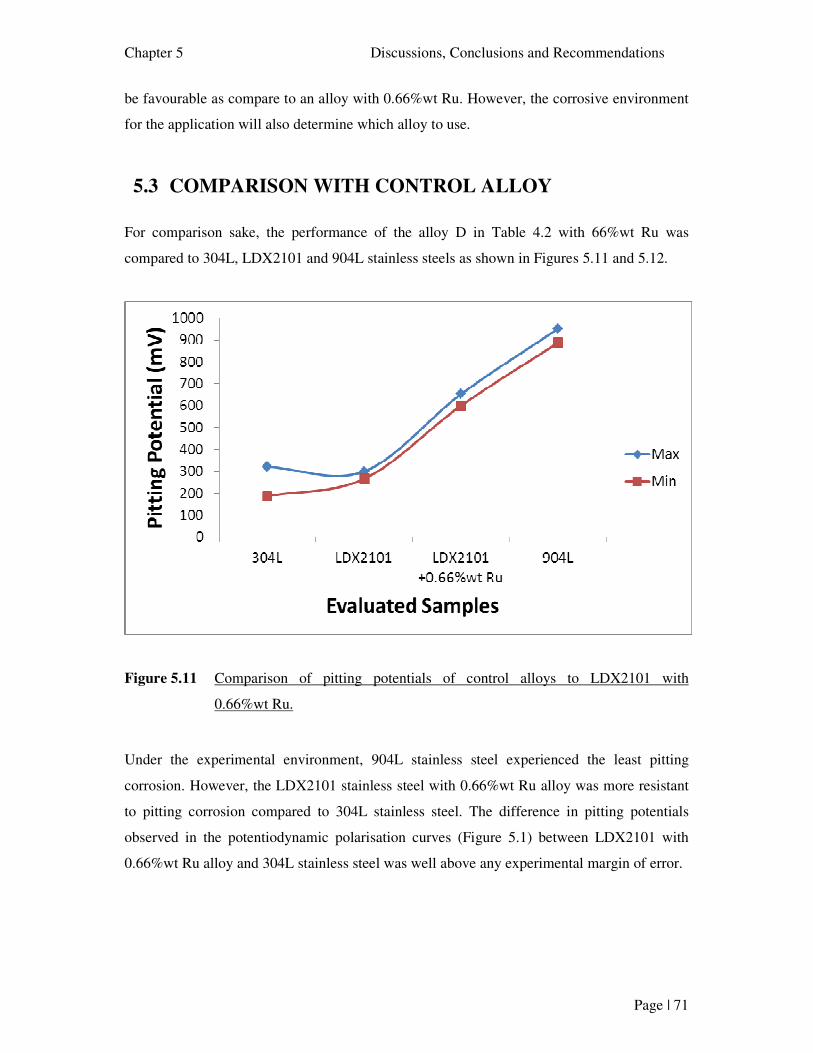
Chapter 5 Discussions, Conclusions and Recommendations
Page | 71
be favourable as compare to an alloy with 0.66%wt Ru. However, the corrosive environment
for the application will also determine which alloy to use.
5.3 COMPARISON WITH CONTROL ALLOY
For comparison sake, the performance of the alloy D in Table 4.2 with 66%wt Ru was
compared to 304L, LDX2101 and 904L stainless steels as shown in Figures 5.11 and 5.12.
Figure 5.11 Comparison of pitting potentials of control alloys to LDX2101 with
0.66%wt Ru.
Under the experimental environment, 904L stainless steel experienced the least pitting
corrosion. However, the LDX2101 stainless steel with 0.66%wt Ru alloy was more resistant
to pitting corrosion compared to 304L stainless steel. The difference in pitting potentials
observed in the potentiodynamic polarisation curves (Figure 5.1) between LDX2101 with
0.66%wt Ru alloy and 304L stainless steel was well above any experimental margin of error.
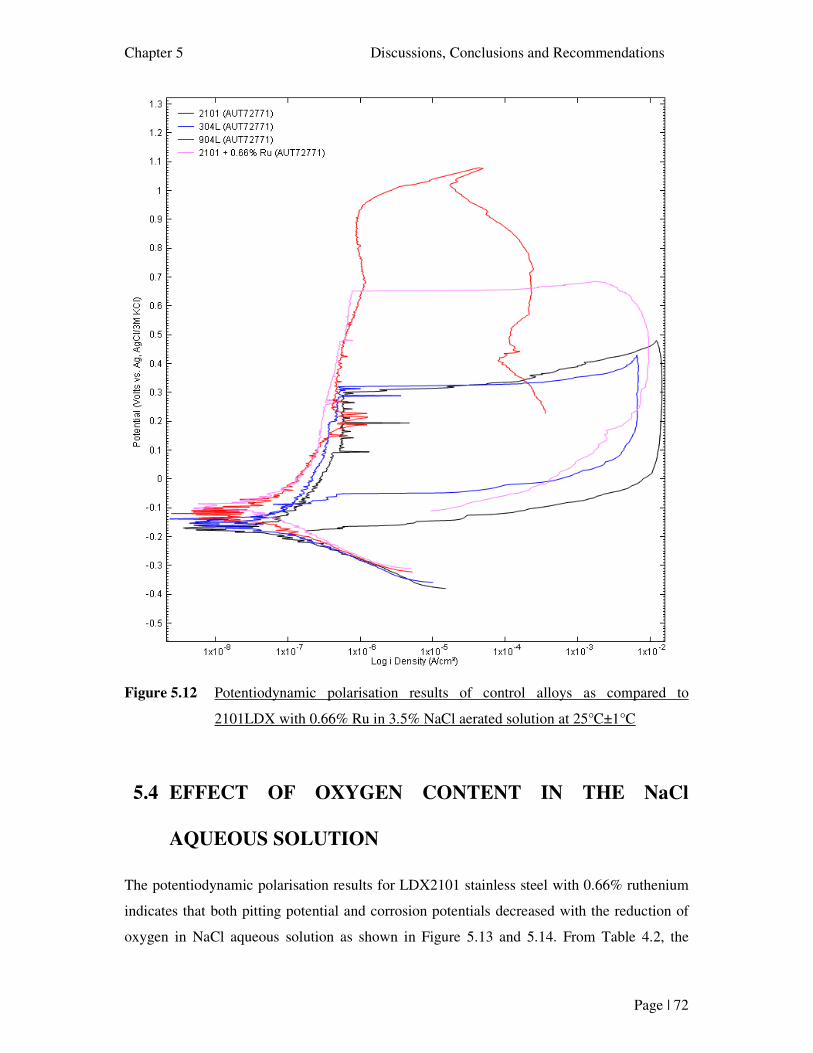
Chapter 5 Discussions, Conclusions and Recommendations
Page | 72
Figure 5.12 Potentiodynamic polarisation results of control alloys as compared to
2101LDX with 0.66% Ru in 3.5% NaCl aerated solution at 25°C±1°C
5.4 EFFECT OF OXYGEN CONTENT IN THE NaCl
AQUEOUS SOLUTION
The potentiodynamic polarisation results for LDX2101 stainless steel with 0.66% ruthenium
indicates that both pitting potential and corrosion potentials decreased with the reduction of
oxygen in NaCl aqueous solution as shown in Figure 5.13 and 5.14. From Table 4.2, the
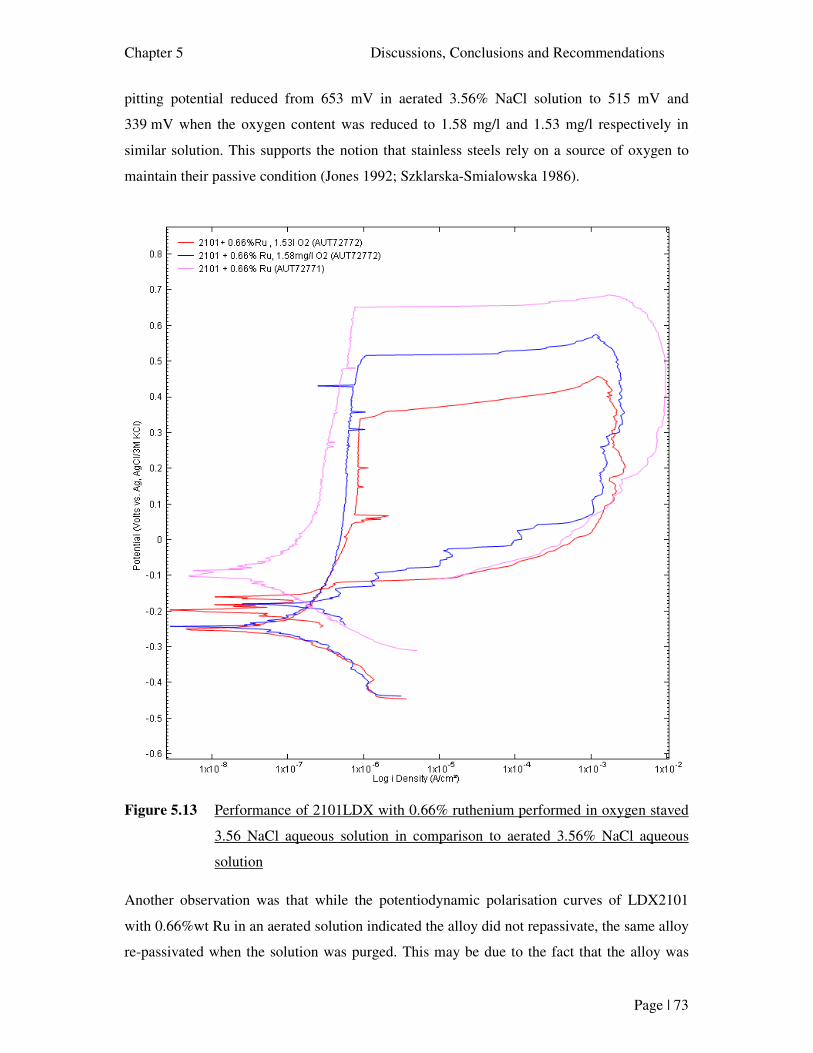
Chapter 5 Discussions, Conclusions and Recommendations
Page | 73
pitting potential reduced from 653 mV in aerated 3.56% NaCl solution to 515 mV and
339 mV when the oxygen content was reduced to 1.58 mg/l and 1.53 mg/l respectively in
similar solution. This supports the notion that stainless steels rely on a source of oxygen to
maintain their passive condition (Jones 1992; Szklarska-Smialowska 1986).
Figure 5.13 Performance of 2101LDX with 0.66% ruthenium performed in oxygen staved
3.56 NaCl aqueous solution in comparison to aerated 3.56% NaCl aqueous
solution
Another observation was that while the potentiodynamic polarisation curves of LDX2101
with 0.66%wt Ru in an aerated solution indicated the alloy did not repassivate, the same alloy
re-passivated when the solution was purged. This may be due to the fact that the alloy was
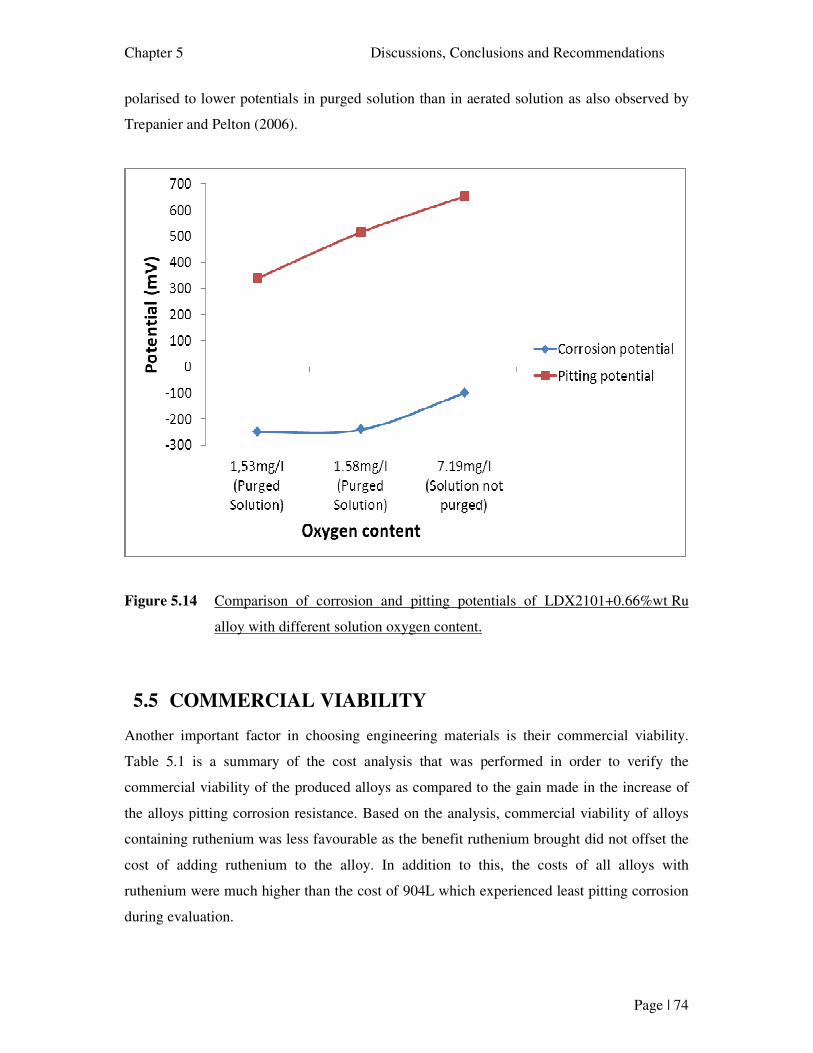
Chapter 5 Discussions, Conclusions and Recommendations
Page | 74
polarised to lower potentials in purged solution than in aerated solution as also observed by
Trepanier and Pelton (2006).
Figure 5.14 Comparison of corrosion and pitting potentials of LDX2101+0.66%wt Ru
alloy with different solution oxygen content.
5.5 COMMERCIAL VIABILITY
Another important factor in choosing engineering materials is their commercial viability.
Table 5.1 is a summary of the cost analysis that was performed in order to verify the
commercial viability of the produced alloys as compared to the gain made in the increase of
the alloys pitting corrosion resistance. Based on the analysis, commercial viability of alloys
containing ruthenium was less favourable as the benefit ruthenium brought did not offset the
cost of adding ruthenium to the alloy. In addition to this, the costs of all alloys with
ruthenium were much higher than the cost of 904L which experienced least pitting corrosion
during evaluation.
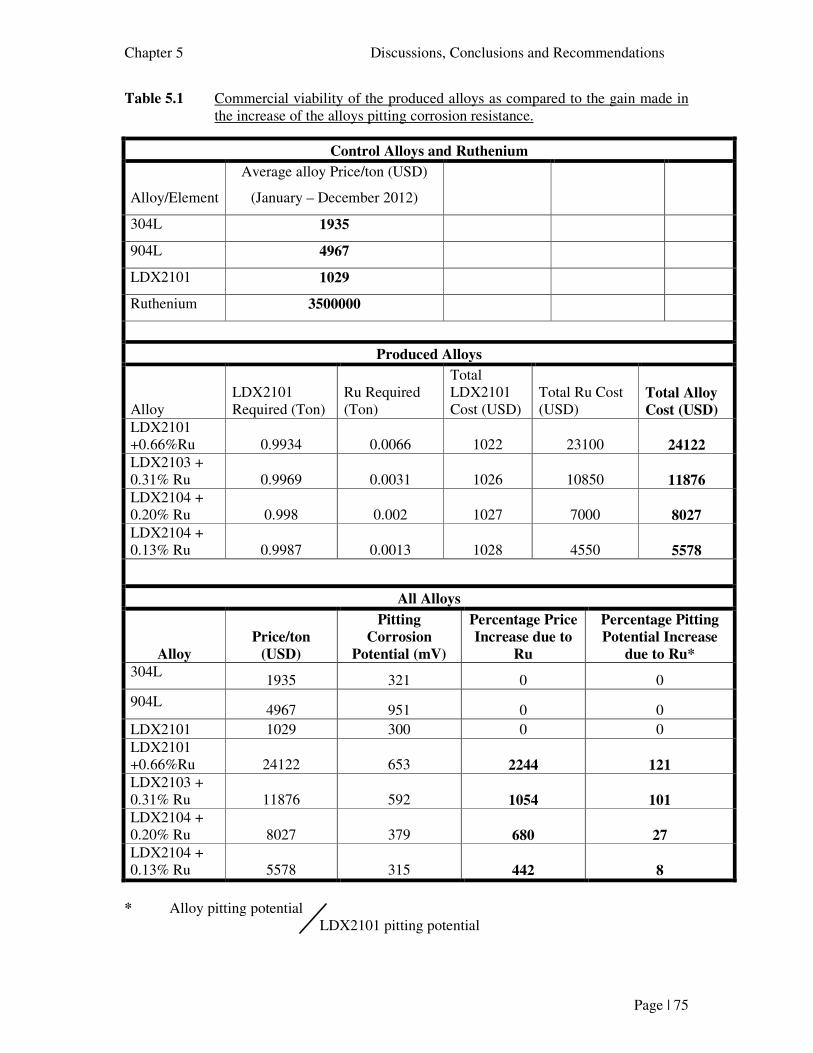
Chapter 5 Discussions, Conclusions and Recommendations
Page | 75
Table 5.1 Commercial viability of the produced alloys as compared to the gain made in the increase of the alloys pitting corrosion resistance.
Control Alloys and Ruthenium
Alloy/Element
Average alloy Price/ton (USD)
(January – December 2012)
304L 1935 904L 4967 LDX2101 1029 Ruthenium 3500000
Produced Alloys
Alloy LDX2101 Required (Ton)
Ru Required (Ton)
Total LDX2101 Cost (USD)
Total Ru Cost (USD)
Total Alloy
Cost (USD)
LDX2101 +0.66%Ru 0.9934 0.0066 1022 23100 24122
LDX2103 + 0.31% Ru 0.9969 0.0031 1026 10850 11876
LDX2104 + 0.20% Ru 0.998 0.002 1027 7000 8027
LDX2104 + 0.13% Ru 0.9987 0.0013 1028 4550 5578
All Alloys
Alloy
Price/ton
(USD)
Pitting
Corrosion
Potential (mV)
Percentage Price
Increase due to
Ru
Percentage Pitting
Potential Increase
due to Ru* 304L
1935 321 0 0
904L 4967 951 0 0
LDX2101 1029 300 0 0 LDX2101 +0.66%Ru 24122 653 2244 121 LDX2103 + 0.31% Ru 11876 592 1054 101 LDX2104 + 0.20% Ru 8027 379 680 27 LDX2104 + 0.13% Ru 5578 315 442 8
* Alloy pitting potential LDX2101 pitting potential
Chapter 5 Discussions, Conclusions and Recommendations
Page | 76
Ideally, for commercially viable alloy, the beneficial effect of alloying LDX2101 stainless
steel with ruthenium should offset the cost of adding ruthenium to the LDX2101 stainless
steel. However, it is important to note that corrosion is a complex process which is dependent
on more than one variable. Hence, there is still a possibility of getting a commercially viable
alloy of LDX2101 alloyed with ruthenium in a different reducing media. Further to this, the
alloy with 0.66%wt Ru showed a significant improvement for the inhibition of pitting
corrosion during all evaluations. Such positive results also suggest a possibility of a better
alloy with a little more increase in %wt Ru added to the LDX2101 stainless steel.
5.6 CONCLUSIONS AND RECOMMENDATIONS
The Potentiodynamic polarization test, mostly following ASTM G61-86 procedure, was
conducted on control alloys LDX2101, 904L and 304L stainless steels, as well as produced
alloys LDX2101+0.13%wt Ru, LDX2101+0.20%wt Ru, LDX2101+0.31%wt Ru and
LDX2101+0.66%wt Ru in aerated 3.5% NaCl aqueous solution. Further to these tests,
potentiodynamic tests were conducted on LDX2101+0.66%wt Ru in a de-aerated 3.5% NaCl
aqueous solution. An XRF Spectrometer was used to verify the chemical composition of
produced alloys. Also, the microstructural analysis was conducted on the produced alloys
following ASTM932 procedure and the results were compared to the microstructure of
LDX2101 stainless steel. Based on the results obtained in this study, the following
conclusions could be drawn:
Small additions of ruthenium of up to 0.66%wt Ru to LDX2101 stainless steel will improve
the pitting corrosion resistance of the resulting alloy as the pitting potentials of all LDX2101
stainless steel alloys containing ruthenium were shifted to more noble values. Also, if such
small additions of ruthenium will not improve the general corrosion of the resulting alloy, it
will at least not have any detrimental effect on the resulting alloy as the corrosion potential,
corrosion current and corrosion rate of all LDX2101 stainless steel alloys containing
ruthenium were equal to or better than that of LDX2101 without ruthenium . The duplex
stainless steel microstructure will also be maintained without introducing any detrimental
phases as observed through optical microscopy. All LDX2101 containing ruthenium up to
0.66% by weight will have a better pitting corrosion resistance compared to 304L stainless
steel but, their pitting corrosion resistance will be inferior compared to 904L stainless steel.
Chapter 5 Discussions, Conclusions and Recommendations
Page | 77
The pitting corrosion resistance of LDX2101 alloys containing ruthenium up to 0.66% by
weight will be reduced in chloride containing environment with a depleted oxygen supply.
Ruthenium will also lower the current required to maintain the passive state of LDX2101
stainless steel as it was observed that generally, the passive current densities of LDX2101
with up to 66%wt Ru alloys were lower than LDX2101 stainless steel without Ru. In addition
to reduced current to maintain the passivity of LDX2101 stainless steel, ruthenium also
increased the passive range of LDX2101 stainless steel.
Finally, the resulting alloys from alloying LDX2101 with ruthenium up to 0.66% by weight
are not commercially viable as the benefit ruthenium brought did not offset the cost of adding
ruthenium to LDX2101stainless steel. Therefore, for economic reasons, should the
application demand a duplex stainless steel with a better pitting corrosion resistance than that
of LDX2101 stainless steel, it would be recommended to use other duplex stainless steels
which will cost less and have better pitting corrosion resistance than LDX2101 stainless steel
alloyed with up to 0.66%wt Ru.
The results of this research study on LDX2101 stainless steel alloyed with ruthenium,
concurred with the investigations on other duplex stainless steel also alloyed with ruthenium
by El-Sayed et al. (2009) and Potgieter et al. (1996) which, also yielded positive results for
the inhibition of pitting corrosion as pointed out in the hypothesis.
Following the results of this study, it is recommended that future studies on LDX2101
alloyed with ruthenium should look at the performance of the alloy in other reducing media
other than chloride containing media. Also, since the alloy with 0.66%wt Ru showed a
significantly higher passive potential range and pitting potential was significantly pushed to
more noble values, indicating a significant improvement for the inhibition of pitting corrosion
for this alloy in NaCl aqueous solution, it is further recommended that future studies look at
alloying LDX2101 stainless steel with relatively higher %wt Ru. Further studies should also
adopt better samples production process like using the vacuum furnace and produce larger
samples. The samples production process used in these studies where small samples were
produced in a button arc furnace resulted in missing of same elements which were contained
in feed material, and oxygen contamination.
References
Page | 78
REFERENCES
Alvarez-Armas, I. 2007. Duplex Stainless Steels: Brief History and Some Recent Alloys. Recent
Alvarez-Armas, I. 2007. Duplex Stainless Steels: Brief History and Some Recent Alloys. Recent
Patents on Mechanical Engineering, 2008(1): 51 – 57.
American Society for Metals. 1979. The metallurgical evolution of stainless steels. Metals Park,
Ohio 44073, USA: American Society for Metals.
Asaduzzaman, M.D., Mustafa, C.M., Islam, M. 2011. Effects of concentration of sodium chloride
solution on the pitting corrosion behavior of AISI-304L austenitic stainless steel. Chemical
Industry & Chemical Engineering Quarterly 17 (4) (2011):477−483.
ASTM Standard A923, 2008, Standard Test Methods for Detecting Detrimental Inter-metallic
Phase in Duplex Austenic/Ferritic Stainless Steels, ASTM International, West Conshohocken,
PA 19428-2959, United States.
ASTM Standard G61, 1986 (1998), Conducting Cyclic Potentiodynamic Polarisation
Measurements for Localised Corrosion Susceptibility of Iron-, Nickel-, or Cobalt-Based Alloys,
ASTM International, West Conshohocken, PA 19428-2959, United States.
ASSDA. 2010. Pickling and Passivation [online]. Available at www.assda.asn.au [accessed 16
January 2014]
Baba, H., Kodama, T., Katada, Y. 2002. Role of nitrogen on the corrosion behavior of austenitic
stainless steels. Corrosion Science, 44 (2002): 2393–2407.
Banas, J., Mazurkiewicz, A. 2000. The effect of copper on passivity and corrosion behaviour of
ferritic and ferritic–austenitic stainless steels. Materials Science and Engineering , A277 (2000):
183–191.
Barringer, F. 2006. Large oil spill in Alaska went undetected for days. The New York Times
[online], March 15. Available at: www.nytimes.com [accessed 26 February 2011].
References
Page | 79
Berner, M., Liu H., Olsson, C. 2008. Estimating localised corrosion resistance of low alloy
stainless steels: comparison of pitting potentials and critical pitting temperatures measured on
lean duplex stainless steel LDX 2101 after sensitization. Corrosion Engineering, Science and
Technology, 43(2): 111 – 116.
British Stainless Steel Association. 2007 -2012. Selection of 316, 304 and 303 Types of Stainless
Steels for Seawater Applications [Online]. Available at: www.bssa.org.uk [Accessed 19th
December 2012]
BP. 2006. BP to Shutdown Prudhoe Bay Oil Field. Press release [online]. Available at:
http://www.bp.com [Accessed 28 February 2011]
Cox G. L., Roetheli B. E. 1931. Effect of Oxygen Concentration on Corrosion Rates of Steel and
Composition of Corrosion Products Formed in Oxygenated Water. Industrial & Engineering
Chemistry, 23 (9): 1012 – 1016.
Cvijovic´, Z., Radenkovic´, G. 2006. Microstructure and pitting corrosion resistance of
annealed duplex stainless steel. Corrosion Science, 48 (2006): 3887 – 3906.
Ebrahimi, N., Momeni, M., Moayed, M.H., Davoodi, A. 2010. Correlation between critical
pitting temperature and degree of sensitization on alloy 2205 duplex stainless steel. Corrosion
Science, 53 (2011): 637–644.
Eghbali, F., Moayed, M.H., Davoodi, A., Ebrahimi, N. 2010. Critical pitting temperature (CPT)
assessment of 2205 duplex stainless steel in 0.1 M NaCl at various molybdate concentrations.
Corrosion Science, 53 (2011): 513 – 522.
El-Sayed M., Sherif, E.M., Potgieter, J. H., Comins, J. D., Cornish, L., Olubambi, P. A., Machio,
C. N. 2009. Effects of minor additions of ruthenium on the passivation of duplex stainless-steel
corrosion in concentrated hydrochloric acid solutions. Journal of Applied Electrochemistry,
39(8): 1385 -1392.
References
Page | 80
Fisher, D.A. 1963. The epic of steel. 1st ed. 49 East 33rd Street, New York: Harper & Row
Publishers Incorporated.
Fontana, M.G. 1986. Corrosion engineering. 3rd ed. United States of America: McGraw-Hill Inc.
Frankenthal, R., Kruger, J. (ed.) 1978. Passivity of Metals. Princeton, New Jersey: The
Electrochemical Society, Inc.
Fredriksson, W., Edström, K., Olsson C.A. 2010. XPS analysis of manganese in stainless steel
passive films on 1.4432 and the lean duplex 1.4162. Corrosion Science, 52 (2010): 2505–2510.
Hartt, W. H., Powers, R.G., Leroux, V., Lysogorski, D.K. 2004. Critical Literature Review of
High-Performance Corrosion Reinforcements in Concrete Bridge Applications. (FHWA- HRT-
04-093) [online]. United States. Department of Transport - Federal Highway Administration.
Available at: http://www.fhwa.dot.gov [Accessed 12th January 2011].
Higginson, A. 1989. Passivation of cathodically modified alloys. British Corrosion Journal,
24(4): 297 – 302.
Ilevbare, G.O., Burstein, G.T. 2001. The role of alloyed molybdenum in the inhibition of pitting
corrosion in stainless steels. Corrosion Science, 43(2001) 485 – 513.
InvestmentMine. 1990 – 2012. 1 Year Ruthenium Prices and Price Charts [online]. Available at:
http://www.infomine.com/investment/metal-prices/ruthenium/1-year [accessed 19th December
2012]
Jeon, S-H., Kim, S-T., Lee, I-S., Park, J-H., Kim, K-T., Kim, J-S., Park, Y-S. 2011. Effects of
copper addition on the formation of inclusions and the resistance to pitting corrosion of high
performance duplex stainless steels. Corrosion Science, 53 (2011) 1408 – 1416.
Jones, D.A. 1992. Principles and prevention of corrosion. 2nd ed. Upper Saddle River, NJ 07458:
Prentice-Hall Inc.
Kadry, S. 2008. Corrosion Analysis of Stainless Steel. European Journal of Scientific Research,
22 (4): 508 – 516.
References
Page | 81
Karlberg, G., Wranglen, G. 1971. On the mechanism of crevice corrosion of stainless Cr
steels. Corrosion Science, 11(7): 499 – 510.
Key to metals. 1999. Corrosion and Corrosion Properties of Stainless Steels: Part One [online].
Available at: http://www.keytometals.com [accessed 1st December 2010].
Kovach C.W. 2011. High-performance stainless steels. [Online]. Parr Instrument Company.
Available at: www.parrinst.com/downloads/Corrosion-Information [Accessed 15th January
2013].
Laycock, N.J., Newman, R.C. 1998. Temperature dependence of pitting potentials for austenitic
stainless steels above their critical pitting temperature. Corrosion Science, 40 (6) 887–902.
London Metal Exchange. 2003 – 2011. LME Nickel price graph [online]. Available at:
http://www.lme.com/nickel_graphs.asp [accessed 18th January 2011].
Lothongkum, G., Wongpanya, P., Morito, S., Furuhara, T., Maki, T. 2004. Effect of nitrogen on
corrosion behavior of 28Cr–7Ni duplex and microduplex stainless steels in air-saturated 3.5wt%
NaCl solution. Corrosion Science, 48 (2006) 137–153.
Loubser, M., Verryn, S. 2008. Reference for preparation of samples and sample analyses:
Combining XRF and XRD analyses and sample preparation to solve mineralogical problems.
South African Journal of Geology, 111: 229 – 238.
Lyman, T. (ed.) 1984. Metals Handbook. 1984 ed. Cleveland 3, Ohio: The American Society for
Metals.
Malik, A.U., Kutty, M., Siddiqi, N.A., Andijani, I. N., Ahmad, S. 1990. Corrosion studies on SS
316 l in low pH high chloride product water medium [online]. Available at: www.swcc.gov.sa
[accessed 10th January 2013].
Mathiesen, T., Nielsen, T. S., Frantsen, J. E. 2006. Influence of Various Surface Conditions on
Pitting Corrosion Resistance of Stainless Steel Tubes Type EN 1.4404. NACE Corrosion
(06095).
References
Page | 82
Matter-University of Liverpool. 2000. Steel making: Removal of impurities [online]. Available
at: http://www.matter.org.uk [accessed 5th January 2011].
McEwan, J.J. (ed.) 2004. Corrosion Control in Southern Africa. 2nd ed. Johannesburg, South
Africa: Corrosion Institute of Southern Africa.
McGannon, H.E. (ed.) 1971. The Making, Shaping and Treating of Steel. 9th ed. Pittsburg,
Pennsylvania, USA: Herbick & Held.
Mcgill, I.R. 1990. Platinum Metals in Stainless Steels: A Review of Corrosion and Mechanical
Properties. Platinum Metals Review, 34(2): 85-97.
Mcgill, I.R. 1990. Platinum Metals in Stainless Steels: A Review of Corrosion and Mechanical
Properties Part II. Platinum Metals Review, 34(3): 144 – 154.
Metrohm Autolab B.V. 2011. Autolab Application Note COR02:Corrosion Part 2-Measurement
of corrosion rates.[online]. Metrohm Autolab B.V. Available at:
www.ecochemie.nl/Applications/ [Accessed 5th December 2011].
Monypenny, J.H. 1951. Stainless Iron and Steel volume 1, Stainless steels in Industry. 37 Esses
Street, London: Chapman & Hall Ltd.
Mudali, U.K., Shankar, P., Ningshen, S., Dayal, R.K., Khatak, H.S., Raj, B. 2002. On the
pitting corrosion resistance of nitrogen alloyed cold worked austenitic stainless steels. Corrosion
Science, 44 (2002) 2183–2198.
Naoto TAKENO. 2005. Intercomparison of thermodynamic databases. (419) [online]. Japan.
Geological Survey of Japan. Available at: typhoon.jaea.go.jp [Accessed 5th December 2011].
Outokumpu. 2004. LDX2101- Duplex Stainless Steel [online]. Available at:
http://www.outokumpu.de/29143.epibrw [accessed 10 May 2011].
Outokumpu. 2008. A brief history of stainless steel [online]. Available at:
http://www.outokumpu.com [accessed 7 April 2010].
References
Page | 83
Outokumpu Stainless Steel Oy. 2004. Outokumpu stainless corrosion handbook. 9th ed. Finland:
Outokumpu Stainless Steel Oy.
Outokumpu Oyj. 2009. Outokumpu corrosion handbook. 10th ed. Finland: Outokumpu Oyj.
Outokumpu. 2012. Pricing/AAF [online]. Available at:
http://www.outokumpu.com/en/Products/Pricing-aaf/Pages/Pricing-AAF.aspx [accessed 20th
December 2012]
Parkins, R. (ed.), 1981. Corrosion Processes. Ripple Road, Barking, Essex, England: Applied
Science Publishers LTD.
Pardo, A., Merino, M.C., Coy, A.E., Viejo, F., Arrabal, R., Matykina, A.E. 2008. Effect of Mo
and Mn additions on the corrosion behavior of AISI 304 and 316 stainless steels in H2SO4.
Corrosion Science [online], 50(2008): 780 – 794. Available at:
http://www.sciencedirect.com/science [accessed 5th January 2011].
Pardo, A., Merino, M.C., Coy, A.E., Viejo, F., Arrabal, R., Matykina, A.E. 2008. Pitting
corrosion behaviour of austenitic stainless steels – combining effects of Mn and Mo additions.
Corrosion Science, 50(2008): 1796 – 1806.
Peckner, D., Bernstein, I.M. 1977. Handbook of Stainless Steels. New York: McGraw-Hill Book
Company.
Peguet, L., Malki, B., Baroux, B. 2006. Influence of cold working on the pitting corrosion
resistance of stainless steels. Corrosion Science, 49(2007): 1933 – 1948.
Potgieter, J.H. 1991. Alloys cathodically modified with noble metals. Journal of Applied
Electrochemistry, 21(6): 471 – 482.
Potgieter, J. H., Barnard, W. O., Myburg, G., Varga, K., Baradlai, P., Tomcsanyi, L. 1996.
Corrosion behaviour of duplex stainless steels containing minor ruthenium additions in reducing
acid media. Journal of Applied Electrochemistry, 26(11): 1103 -1110.
References
Page | 84
Potgieter J. H., Heyns A.M., Skinner W. 1990. Cathodic modification as a means of improving
the corrosion resistance of alloys. Journal of Applied Electrochemistry, 20: 711 - 715.
Potgieter, J.H., Olubambi, P.A., Cornish, L., Machio, C.N., Sherif, E.M. 2008. Influence of
nickel additions on the corrosion behaviour of low nitrogen 22% Cr series duplex stainless
steels. Corrosion Science, 50(2008): 2572–2579.
Qvarfort, R. 1998. Some Observations Regarding the Influence of Molybdenum on the Pitting
Corrosion Resistance of Stainless Steels. Corrosion Science, 40(2/3): 215 – 223.
Rollason, E. 1973. Metallurgy fro engineers. 4th ed. London: Edward Arnold Publishers.
Scully, J. 1990. The Fundamentals of Corrosion. 3rd ed. Headington Hill Hall, Oxford OX3
OBW, England: Pergamon Press plc.
Schmuki, P., Hildebrand H., Friedrich A., Virtanen S. 2004. The composition of the boundary
region of MnS inclusions in stainless steel and its relevance in triggering pitting corrosion.
Corrosion Science, 47(2005): 1239 – 1250.
Schweitzer, P. 2010. Fundamentals of corrosion: mechanism, causes and prevention method.
Florida, USA: CRC Press.
Sedriks, A. 1979. Corrosion of stainless steel. New York: John Wiley & Sons.
Sheir, L.L. (ed.) 1976. Corrosion volume 1, metal/environment reactions. 2nd ed. London:
Newnes-Butterworths.
Sherif, E. M., Erasmus, R.M., Comins, J.D. 2010. In situ Raman spectroscopy and
electrochemical techniques for studying corrosion and corrosion inhibition of iron in sodium
chloride solutions. Electrochimica Acta, 55 (2010): 3657–3663.
Sherif, E. M., Potgieter, J. H., Comins, J. D., Cornish, L., Olubambi, P. A., Machio, C. N. 2009.
The beneficial effect of ruthenium additions on the passivation of duplex stainless steel corrosion
in sodium chloride solutions. Corrosion Science, 51 (2009): 1364–1371.
References
Page | 85
Souzaa, E.C., Rossitti, S.M., Rolloa, J.M. 2009. Influence of chloride ion concentration and
temperature on the electrochemical properties of passive films formed on a superduplex stainless
steel. Materials Characterization, 61 (2010): 240 – 244.
Streicher, M.A. 1977. Alloying stainless steels with the platinum metals: Increased resistance to
corrosion in acids. Platinum Metal Rev, 21(2): 51 – 55.
Szklarska-Smialowska, Z. 1986. Pitting Corrosion of Metals. Houston, Texas 77084: National
Association of Corrosion Engineers.
Szummer, A., Janik-Czachor, M., 1993. Corrosion behaviour of low-manganese Stainless steels.
Corrosion Science, 25(1-4): 317 – 327.
Torres, F., Panyayong, W., Rogers, W., Velasquez-Plata, D., Oshida, Y., Moore, B. 1998.
Corrosion behavior of sensitized duplex stainless steel. Corrosion Science, 52(3): 950 – 959.
Trepanier C., Pelton A.R. 2006. Effect of temperature and pH on the corrosion corrosion
resistance of nitinol and stainless steel. Proceddings of SMST-2004: 361-366.
Uhlig, H. 1971. Corrosion and Corrosion Control: an introduction to corrosion science and
engineering. 2nd ed. New York: John Wiley & Sons Inc.
Ujiro, T., Satoh, S., Staehle, R.W., Smyrl, W.H. 2000. Effect of alloying Cu on the corrosion
resistance of stainless steels in chloride media. Corrosion Science, 43 (2001) 2185–2200.
Vasilenko, G. V. 2007. The Effect of Oxygen Concentration on the Corrosion of Heat Supply
Networks and Heat Exchangers. Thermal Engineering 2(54): 156 – 158.
Wolff, I.M. 1999. New applications for ruthenium: Platinum in South Africa. South African
Journal of Science, 95 (11/12): 539 – 542.
Wrisley, K.L., Duquette, D.J., Steiner, D., Motyka, E.F., Coomer, E.D. 1990. Corrosion studies
of a stainless steel structure for the ITER aqueous lithium salt blanket concept. Fusion
Engineering and Design, 13 (1990): 45 – 52.
References
Page | 86
Yang, L. (ed.) 2008. Techniques for corrosion monitoring. Boca Raton, FL 33487: CRC Press
LLC.
Zatkalikova, V., Liptakova, T. 2011. Pitting Corrosion of Stainless Steel at the Various Surface
Treatment. Materials Engineering - Materiálové inžinierstvo, 18 (2011): 115 – 120.
Zhang, L., Jiang, Y., Deng, B., Zhang, W., Xu, J., Li, J. 2009. Effect of aging on the corrosion
resistance of 2101 lean duplex stainless steel. Materials Characterization, 60 (2009): 1522–1528.
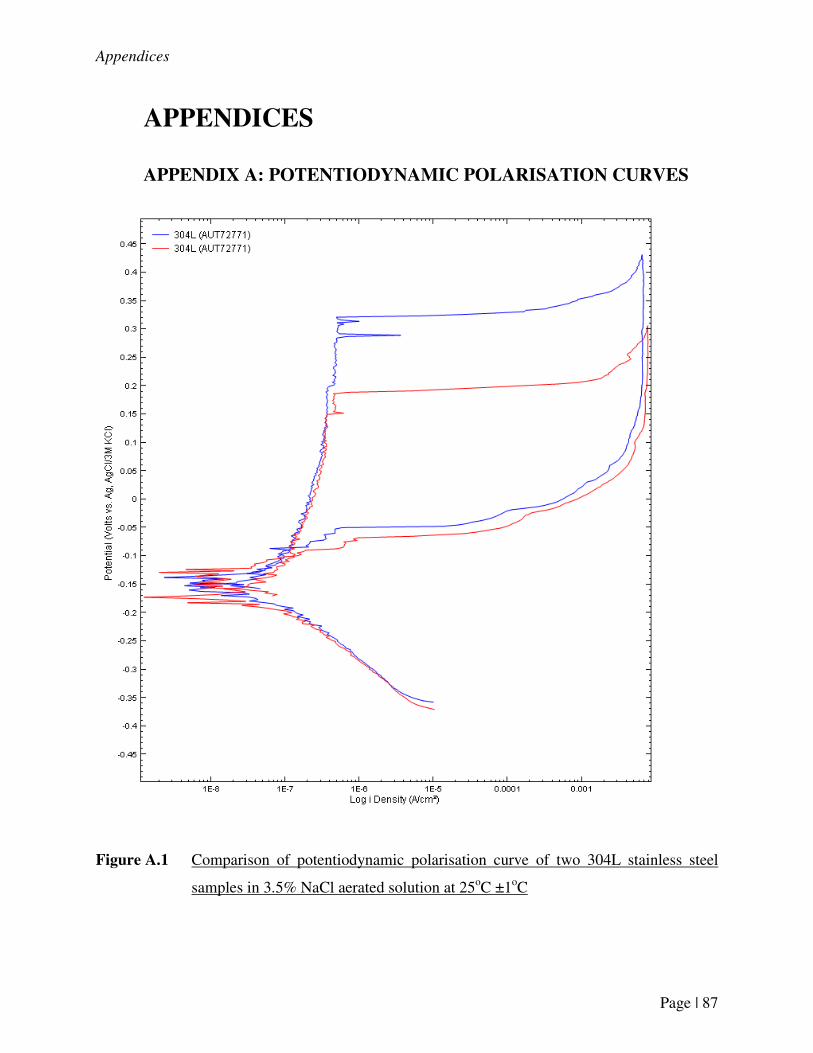
Appendices
Page | 87
APPENDICES
APPENDIX A: POTENTIODYNAMIC POLARISATION CURVES
Figure A.1 Comparison of potentiodynamic polarisation curve of two 304L stainless steel
samples in 3.5% NaCl aerated solution at 25oC ±1oC
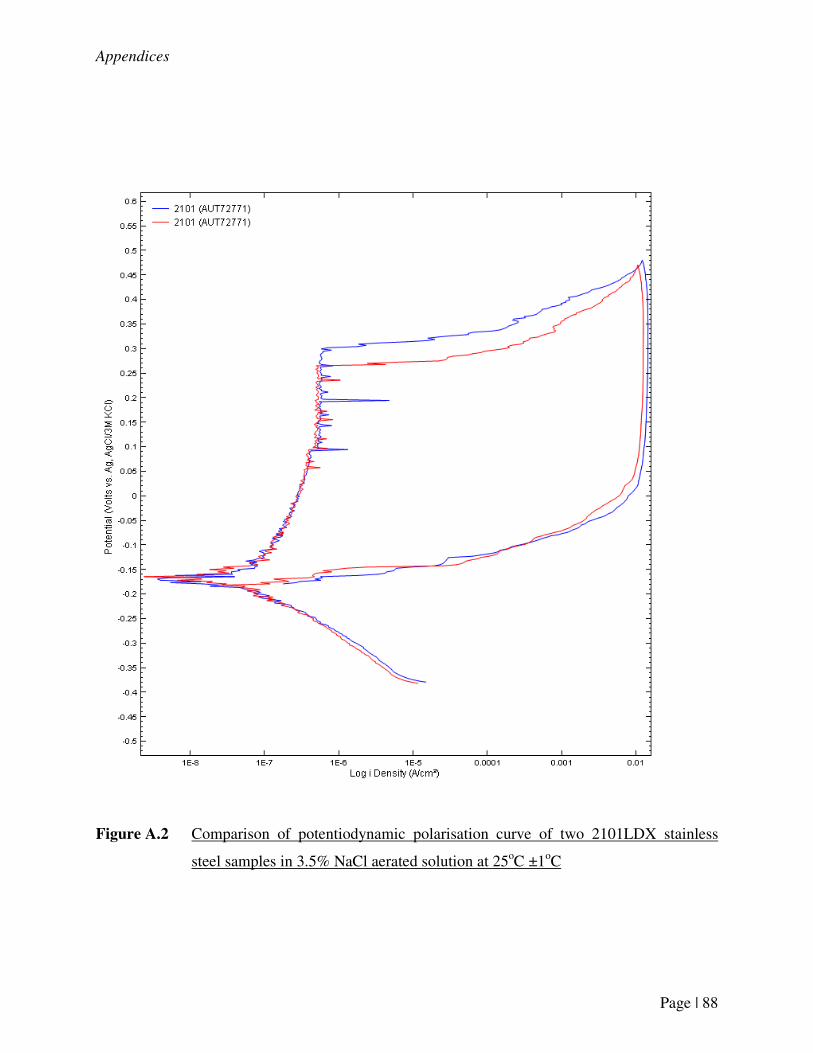
Appendices
Page | 88
Figure A.2 Comparison of potentiodynamic polarisation curve of two 2101LDX stainless
steel samples in 3.5% NaCl aerated solution at 25oC ±1oC
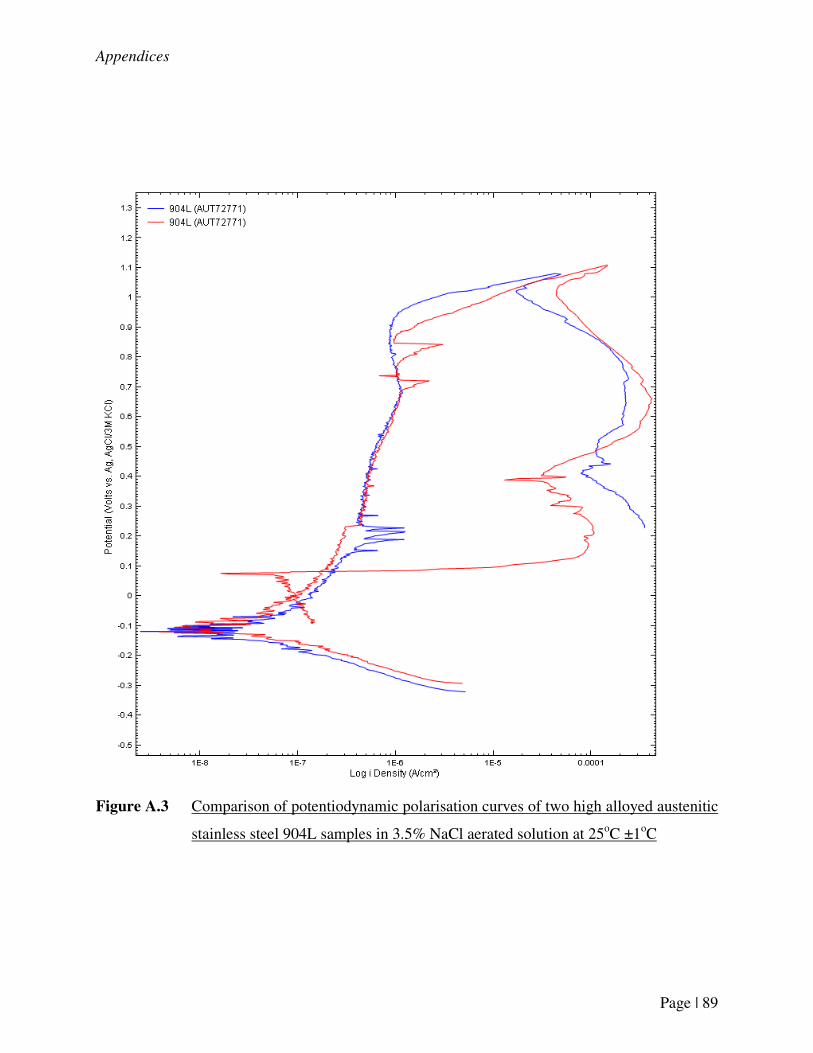
Appendices
Page | 89
Figure A.3 Comparison of potentiodynamic polarisation curves of two high alloyed austenitic
stainless steel 904L samples in 3.5% NaCl aerated solution at 25oC ±1oC
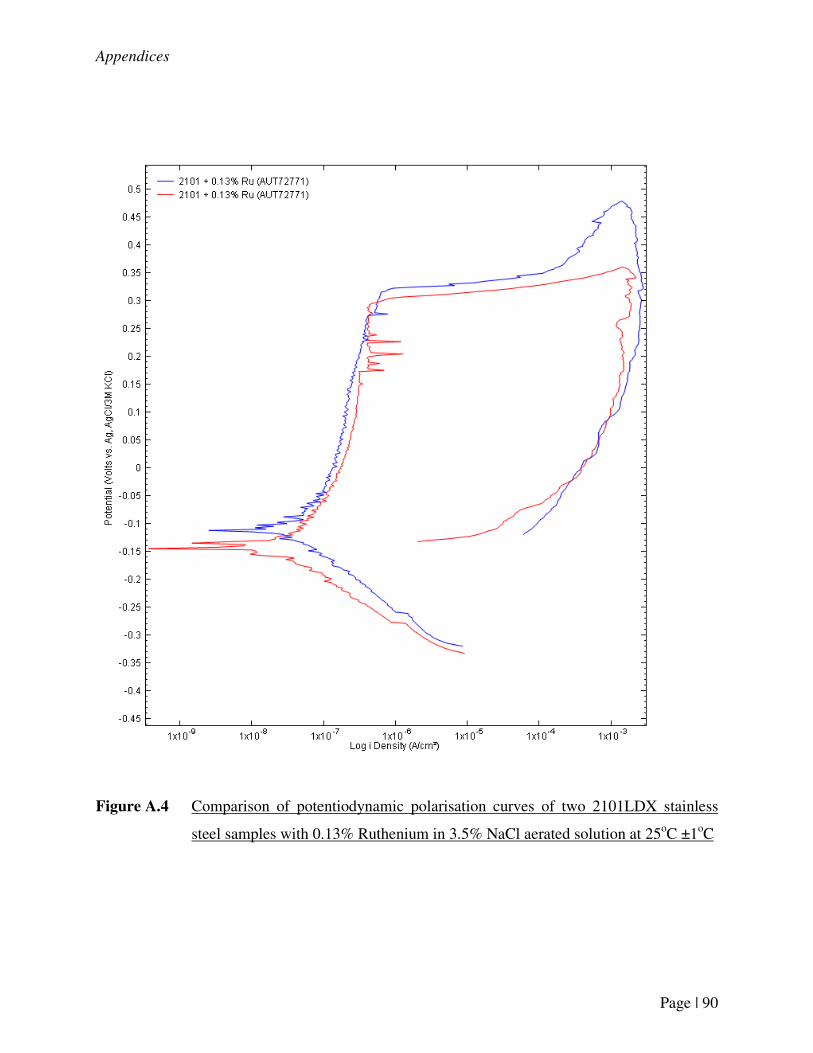
Appendices
Page | 90
Figure A.4 Comparison of potentiodynamic polarisation curves of two 2101LDX stainless
steel samples with 0.13% Ruthenium in 3.5% NaCl aerated solution at 25oC ±1oC
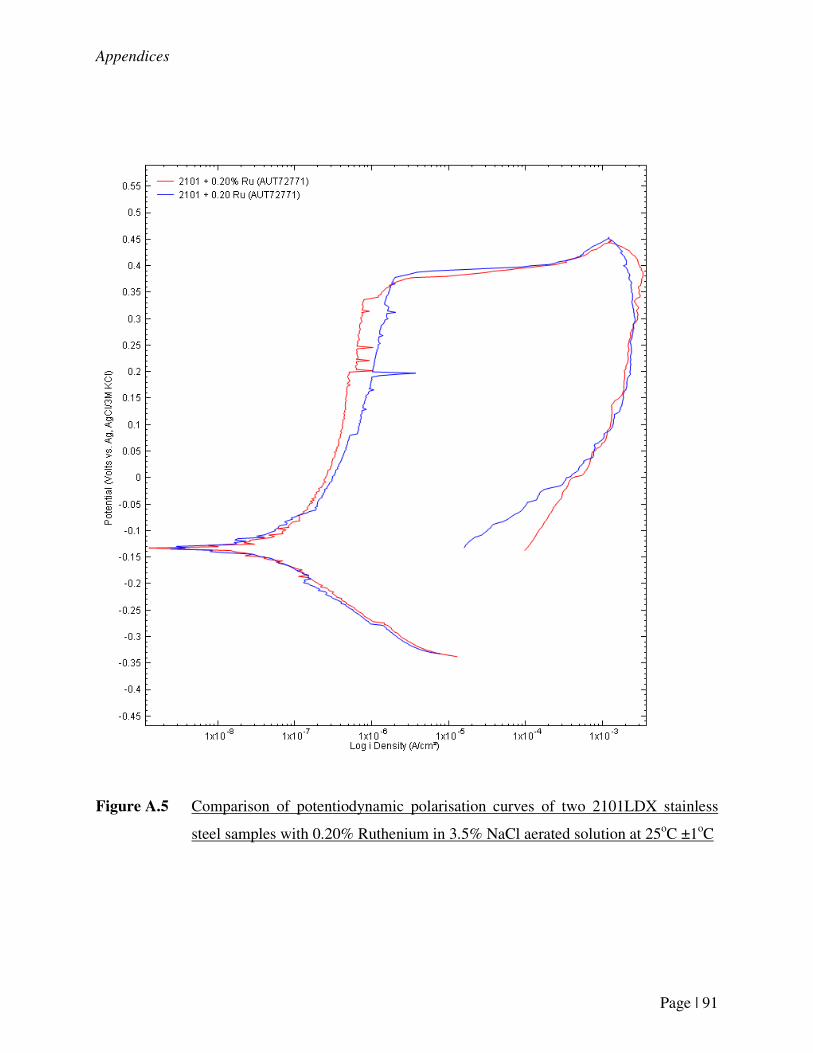
Appendices
Page | 91
Figure A.5 Comparison of potentiodynamic polarisation curves of two 2101LDX stainless
steel samples with 0.20% Ruthenium in 3.5% NaCl aerated solution at 25oC ±1oC
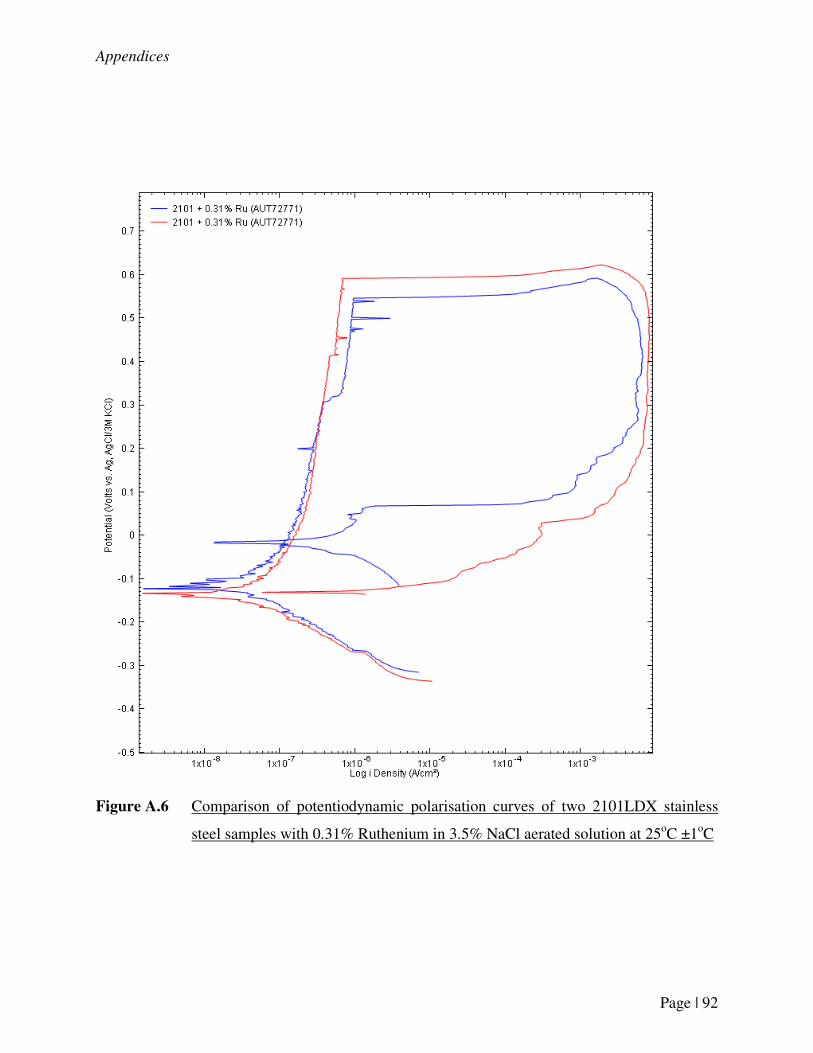
Appendices
Page | 92
Figure A.6 Comparison of potentiodynamic polarisation curves of two 2101LDX stainless
steel samples with 0.31% Ruthenium in 3.5% NaCl aerated solution at 25oC ±1oC
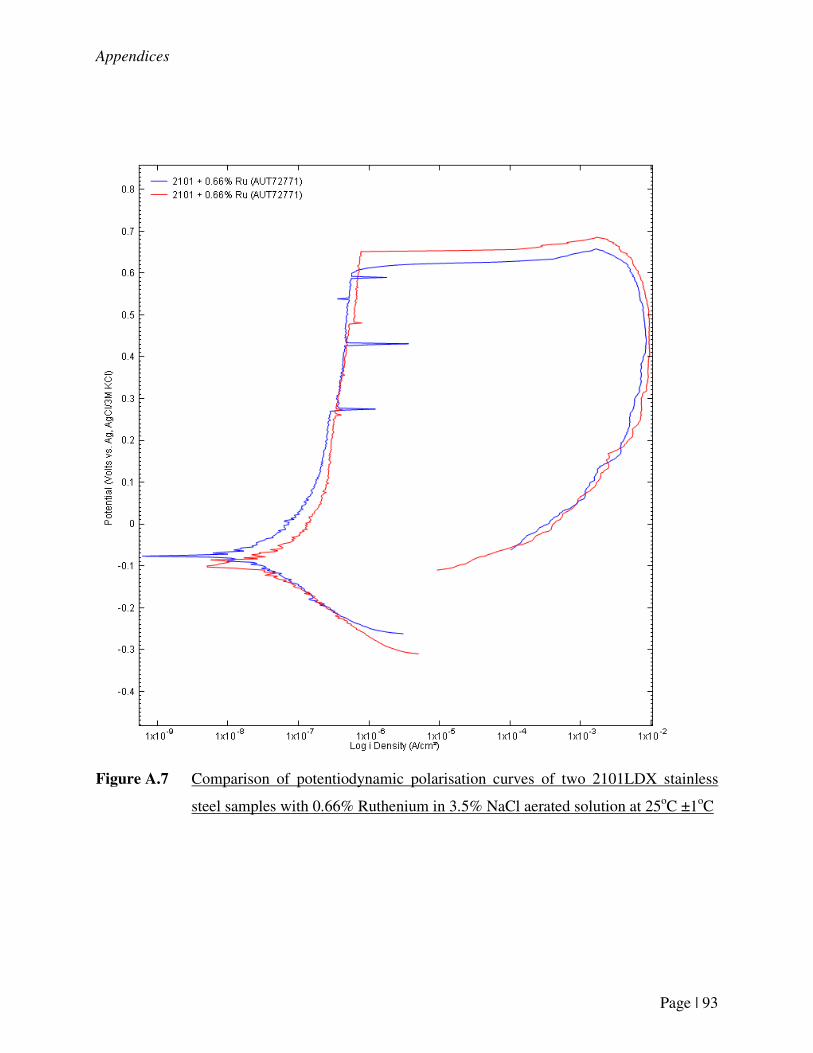
Appendices
Page | 93
Figure A.7 Comparison of potentiodynamic polarisation curves of two 2101LDX stainless
steel samples with 0.66% Ruthenium in 3.5% NaCl aerated solution at 25oC ±1oC
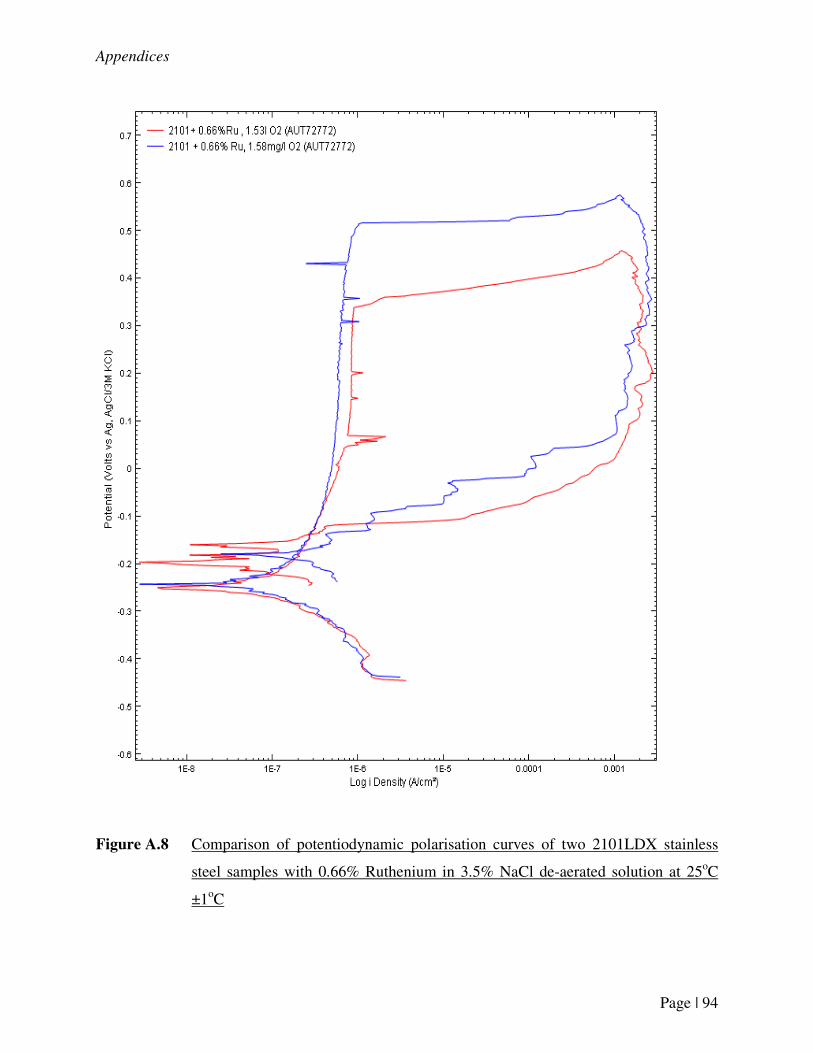
Appendices
Page | 94
Figure A.8 Comparison of potentiodynamic polarisation curves of two 2101LDX stainless
steel samples with 0.66% Ruthenium in 3.5% NaCl de-aerated solution at 25oC
±1oC
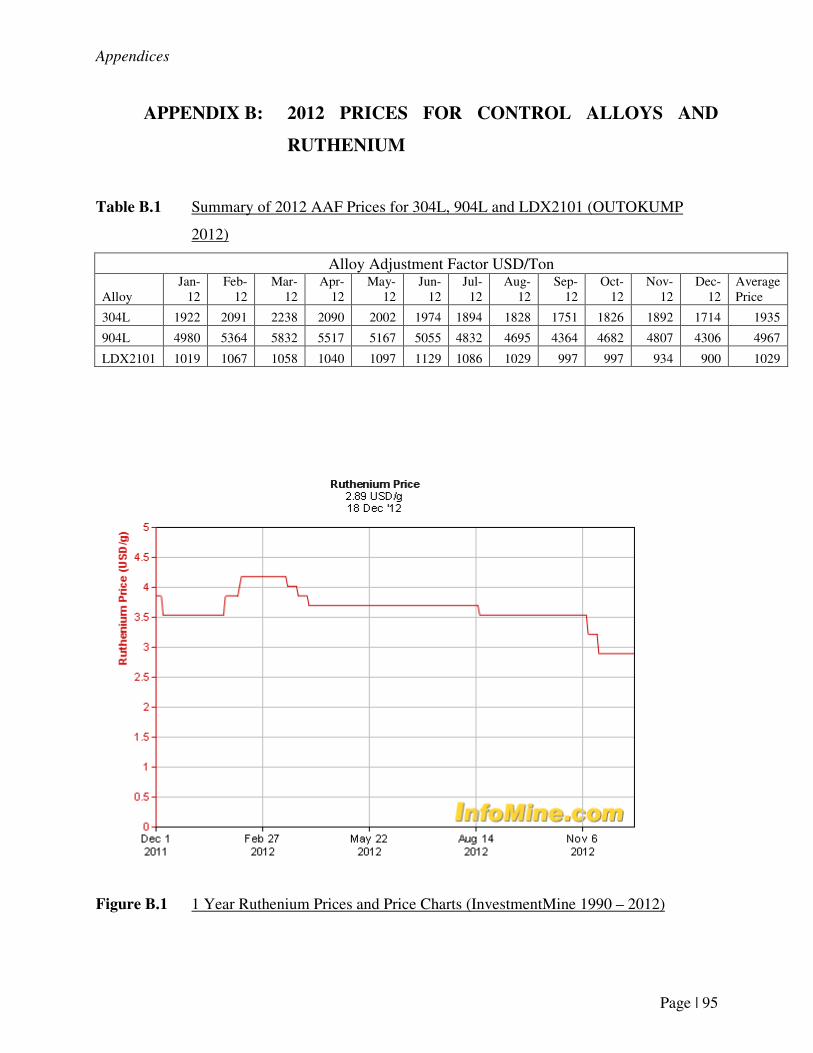
Appendices
Page | 95
APPENDIX B: 2012 PRICES FOR CONTROL ALLOYS AND
RUTHENIUM
Table B.1 Summary of 2012 AAF Prices for 304L, 904L and LDX2101 (OUTOKUMP
2012)
Alloy Adjustment Factor USD/Ton
Alloy Jan-
12 Feb-
12 Mar-
12 Apr-
12 May-
12 Jun-
12 Jul-
12 Aug-
12 Sep-
12 Oct-
12 Nov-
12 Dec-
12 Average Price
304L 1922 2091 2238 2090 2002 1974 1894 1828 1751 1826 1892 1714 1935
904L 4980 5364 5832 5517 5167 5055 4832 4695 4364 4682 4807 4306 4967
LDX2101 1019 1067 1058 1040 1097 1129 1086 1029 997 997 934 900 1029
Figure B.1 1 Year Ruthenium Prices and Price Charts (InvestmentMine 1990 – 2012)