Embed Size (px)
Citation preview
The effect of reinforcement configuration
on crack widths in concrete deep beams
RAHIMEH HOSSEINI AND ANITA NOLSJÖ
Master of Science Thesis
Stockholm, Sweden 2017

TRITA-BKN. Master Thesis 506, 2017
ISSN 1103-4297
ISRN KTH/BKN/EX--506--SE
KTH School of ABE
SE-100 44 Stockholm
SWEDEN
© Rahimeh Hosseini and Anita Nolsjö 2017
KTH Royal Institute of Technology
Department of Civil and Architectural Engineering
Division of Concrete Structures
i
Abstract
Reinforced concrete deep beams are known for applications in tall buildings, foundations and
offshore structures. Deep beams are structural elements with length and height within the same
magnitude and have significantly smaller thickness compared to a conventional concrete beam.
Deep beams in bending have non-linear strain distribution compared to conventional beams
where Bernoulli’s hypothesis is valid.
Crack formation is a common problem in reinforced concrete structures, which reduce the
durability of the structure. Once the concrete cracks the tension reinforcement carry the tensile
forces instead of the concrete. Therefore, the design of tension reinforcement is important since
the serviceability should be retained even after the structure cracks. The crack widths can be
limited by using proper reinforcement and one alternative is to combine tensile reinforcement
with crack reinforcement. The function of the reinforcement is to distribute the cracks over the
cross section which leads to that many smaller cracks occur instead of fewer, wider cracks.
Small cracks are seen as less of a problem compared to large cracks since larger cracks reduce
the durability significantly. For deep beams, there is at the present no well-substantiated
analysis model for how crack widths shall be calculated when having reinforcement in multiple
layers with different diameters. The use of crack reinforcement in the outer bottom layer has by
tradition been considered as a cost efficient way to achieve small crack widths.
In this work the crack width in deep beams have been analysed using the finite element program
Atena 2D. The numerical results have been verified by analytical calculations based on
Eurocode 2. The aim is to achieve reduced crack widths by analysing the combination of crack-
and tensile reinforcement compared to the case with tensile reinforcement only. Tensile
reinforcement has a larger diameter, for example ø25 mm, and crack reinforcement has smaller
diameters, often between ø10 and ø16 mm.
The result from the calculations with Atena showed that there was an improvement regarding
the reduction of crack widths when using crack reinforcement in combination with tensile
reinforcement compared to using tensile reinforcement only. However, this improvement
decreased by using reinforcement in multiple layers since a tensile reinforcement bar 1ø25 mm
needed to be replaced by approximately six crack reinforcement bars 6ø10 mm in order to
achieve the same total reinforcement area. The main disadvantage was that more space was
required to place all reinforcement bars in the cross section, which reduced the lever arm. The
reduction of the lever arm resulted in a reduced capacity for the reinforcement and the cracks
might unintentionally become wider than expected. Furthermore, significant reduction of both
crack widths and reinforcement stresses were obtained when the total area for a case with 7ø25
mm was increased to 9ø25 mm. The increased total area of only tensile reinforcement ø25 mm
reduced the crack width more compared to using a combination of crack- and tensile
reinforcement, which could simplify the construction work at building sites and minimize time
consumption.
Keywords: crack widths, crack development, conventional beams, deep beams,
reinforcement stress, tensile- and crack reinforcement, minimum reinforcement,
reinforcement configuration, external loads, non-linear analysis

iii
Sammanfattning
Armerade höga betongbalkar är kända för tillämpningar i höga byggnader, grundsulor och
offshore konstruktioner. Höga balkar är konstruktionselement med längd och höjd i samma
storleksordning och har betydligt mindre tjocklek jämfört med en konventionell betongbalk.
Höga balkar i böjning har en icke-linjär töjningsfördelning jämfört med konventionella balkar
där Bernoullis hypotes gäller.
Sprickbildning är ett vanligt problem i armerade betongkonstruktioner, vilket minskar
beständigheten hos konstruktionen. När betongbalken spricker kommer armeringen att ta upp
dragkraften istället för betongen därför är utformningen av böjarmering viktig eftersom
bruksgränstillståndet bör behållas även efter att konstruktionen spricker. Sprickvidderna kan
begränsas genom att använda korrekt armering och ett alternativ är att kombinera kraftarmering
med sprickarmering. Armeringens funktion är att sprida ut sprickorna över tvärsnittet vilket
leder till att många små sprickor uppkommer i stället för färre, bredare sprickor. Små sprickor
ses som ett mindre problem jämfört med stora sprickor eftersom större sprickor minskar
beständigheten avsevärt. För höga balkar finns det för närvarande ingen välunderbyggd
analysmodell för hur sprickvidder ska beräknas när de har armering i flera lager och med olika
diametrar. Användningen av sprickarmering har traditionellt ansetts vara ett kostnadseffektivt
sätt att uppnå små sprickvidder.
I detta arbete har sprickvidden i höga balkar analyserats med hjälp av finita elementprogrammet
Atena 2D. De numeriska resultaten har verifierats med analytiska beräkningar baserade på
Eurokod 2. Syftet är att uppnå reducerade sprickvidder genom att analysera kombinationen av
sprick- och kraftarmering jämfört med fallet med endast kraftarmering. Kraftarmeringen har en
större diameter, till exempel ø25 mm och sprickarmering har mindre diametrar, ofta mellan ø10
och ø16 mm.
Resultaten från beräkningarna i Atena visade att sprickvidderna minskade vid användning av
sprickarmering i kombination med kraftarmering jämfört med användning av endast
kraftarmering. Denna förbättring minskade emellertid i och med användning av armering i flera
lager. En kraftarmeringsstång 1ø25 mm behöver ersättas med ungefär sex
sprickarmeringsstänger, 6ø10 mm, för att uppnå samma totala armeringsarea. Den största
nackdelen var att det krävdes mer utrymme för att placera alla sprickarmeringsstänger i
tvärsnittet, vilket minskade hävarmen. Minskningen av hävarmen medförde en reducerad
kapacitet i armeringen och sprickorna blev bredare än förväntat. Vidare erhölls signifikant
reduktion av både sprickvidder och armeringsspänningar när den totala arean för ett fall med
7ø25 mm ökades till 9ø25 mm. Den ökade totalarean av endast kraftarmeringsstänger ø25 mm
minskade sprickvidden mer jämfört med att använda en kombination av sprick- och
kraftarmering vilket skulle kunna förenkla byggarbetet på byggarbetsplatser och minimera
tidsförbrukningen.
Nyckelord: sprickvidder, ordinära balkar, höga balkar, armeringsspänning, kraft- och
sprickarmering, minimiarmering, armeringsutformning, externa laster, icke
linjär analys

v
Preface
This master thesis is written for the Department of Civil and Architectural Engineering at KTH
Royal Institute of Technology. The work has been performed in collaboration with WSP
Construction Design during the spring term 2017.
We would like to thank our supervisors Tech. Dr. Kent Arvidsson for his guidance and interest
throughout the work, Professor Anders Ansell for his support and advice and Adjunct Professor
Mikael Hallgren for his useful advices on the finite element software Atena.
Stockholm, June 2017
Rahimeh Hosseini & Anita Nolsjö

vii
Symbols
Latin upper case letters
𝐴𝑎 The area of the tensile reinforcement
𝐴𝑒𝑓 Effective concrete area
𝐴𝑐𝑡 The area of concrete within the tensile zone
𝐴𝑝′ Area of tendons (pre or post-tensioned)
𝐴𝑐,𝑒𝑓𝑓 Effective area of concrete in tension
𝐴𝑠 Reinforcement area
𝐴𝑠,𝑚𝑖𝑛 Minimum area of reinforcing steel within the tensile zone
𝐸 Modulus of elasticity
𝐸𝑎 Modulus of elasticity
𝐸𝑐𝑚 Mean elastic modulus of concrete
𝐸𝑠 Elastic modulus of reinforcement steel
𝐹 Force
𝐹𝑐 Concrete compressive force
𝐹𝑠 Reinforcement tension force
𝐺𝐹 Fracture energy
𝐿 Length
𝐿𝑡′ The failure bands for tension
𝑀 Moment
𝑅 Reaction force
𝑉 Shear force
𝑊𝑏 The plastic bending resistance
viii
Latin lower case letters
𝑐 Concrete cover
𝑐1 Constant that describes the curve of Hordjik’s exponential model for describing
the fracture energy
𝑐2 Constant
𝑐𝑐𝑙𝑒𝑎𝑟 Clear distance between the ribs
𝑑 The diameter of the reinforcement bar
𝑑𝑚𝑎𝑥 Maximum aggregate size
𝑒 Mathematical constant
𝑓𝑐𝑘 Characteristic concrete compressive strength
𝑓𝑐𝑚 Mean concrete compressive strength
𝑓𝑐𝑢 Mean concrete cube compressive strength
𝑓𝑐𝑡,𝑒𝑓𝑓 Mean value of the tensile strength of the concrete
𝑓𝑐𝑡ℎ High tension strength for the concrete
𝑓𝑐𝑡𝑚 Mean concrete characteristic compressive strength
𝑓𝑡 Effective concrete tensile strength
ℎ Height
𝑘 Constant
𝑘𝑐 Coefficient taking the stress distribution in the cross section before cracking in to
account and the change of level arm
𝑘𝑡 Factor dependent on the load
𝑘1 Coefficient that takes the bond properties into account
𝑘2 Coefficient that takes the distribution of strain into account
𝑘3𝑐 7ø (according to national annex)
𝑘4 0.4254
𝑙𝑠,𝑚𝑎𝑥 The length over which slip between steel and concrete occurs
𝑞 Distributed load
𝑠1 Sliding when the shear stress 𝜏𝑚𝑎𝑥 is achieved with description of adhesion
ix
𝑠2 Sliding when the shear stress begins to decline after 𝜏𝑚𝑎𝑥 is reached at description
of adhesion
𝑠3 Sliding when the shear stress drops to 𝜏𝑚𝑎𝑥 with description of adhesion
𝑠𝑟𝑚 The mean value of the crack spacing
𝑠𝑟,𝑚𝑎𝑥 Maximum crack spacing
𝜈 Coefficient that accounts for the tensioned concrete between cracks
𝑤 Crack opening
𝑤𝑐 Crack opening at complete release of stress
𝑤𝑘 Characteristic crack width
𝑤𝑚 Mean crack width
𝑧 Lever arm
Greek lower case letters
𝛼 Constant when calculating the adhesion of the reinforcement
𝛼𝑒 𝐸𝑠/𝐸𝑐𝑚
𝛽 Coefficient that accounts for the duration of the load
𝛿 The nominal maximum crack width
휀𝑐𝑟 The crack opening
휀𝑠ℎ Shrinkage
휀𝑐𝑠 Drying and autogenous shrinkage
휀𝑠𝑚 Mean strain in the reinforcement
휀𝑐𝑚 Mean strain in the concrete between cracks
𝜅1 Coefficient that accounts the adhesion of the reinforcement
𝜉1 Adjusted ratio of bond strength taking into account the different diameters of
prestressing and reinforcing steel
𝜎 Stress
𝜎𝑎 Reinforcement stress assuming the cracked concrete cross section
𝜎𝑠 Stress in the tension reinforcement when assuming a cracked concrete section
x
𝜎𝑠2 Reinforcement stress at the crack
𝜎𝑠𝐸 Reinforcement stress at the point of zero slip
𝜎𝑠𝑟 The stress in the reinforcement in the crack directly after cracking
𝜌 Reinforcement content
𝜏 Bond stress
𝜏𝑏𝑘 Lower fractile value of the mean bond stress
𝜏𝑓 Bond stress when adhesion failure occurs
𝜏𝑚𝑎𝑥 Maximum bond stress
𝜏𝑢,𝑠𝑝𝑙𝑖𝑡 Peak local bond resistance
𝜋 Mathematical constant
ø Reinforcement diameter
ø𝑒𝑞 Equivalent reinforcement diameter
ø𝑠 Reinforcement diameter
xi
Contents
1 Introduction ..................................................................................................................1
1.1 Background ..........................................................................................................1
1.2 Aim and scope ......................................................................................................2
1.3 Limitations ...........................................................................................................2
2 Reinforced concrete structures ....................................................................................3
2.1 Concrete strength and deformation in Eurocode....................................................3
2.2 Shrinkage .............................................................................................................3
2.3 Theory of concrete cracking and fracture energy ..................................................5
2.4 Reinforced concrete and reinforcement bond ........................................................8
3 Deep beams ................................................................................................................. 13
3.1 Theoretical background ...................................................................................... 13
3.2 Stress distribution in deep beams ........................................................................ 13
3.3 Experimental investigations of deep beams ........................................................ 16
3.3.1 Deep beams loaded at the upper edge ..................................................... 16
3.3.2 Deep beams loaded at the lower edge ..................................................... 17
3.4 Design of deep beams ......................................................................................... 19
3.4.1 Calculation model .................................................................................. 19
3.4.2 Truss models ......................................................................................... 20
4 Method ........................................................................................................................ 23
4.1 Cracks according to Eurocode 2 ......................................................................... 23
4.1.1 Minimum reinforcement ........................................................................ 23
4.1.2 Flexural crack widths ............................................................................. 24
4.1.3 Concrete Section (WIN-Statik) .............................................................. 25
4.2 Cracks according to BBK04 ............................................................................... 25
4.2.1 Minimum reinforcement for crack control .............................................. 25
4.2.2 Calculations of crack width .................................................................... 25
4.3 Calculations of the crack width according to B7 ................................................. 26
4.4 Cracks according to Model Code 1990 ............................................................... 27
4.4.1 Minimum reinforcement for crack control .............................................. 27
4.4.2 Calculations of crack width .................................................................... 28
xii
4.5 Atena 2D ............................................................................................................ 29
4.5.1 Smeared crack model ............................................................................. 29
4.5.2 Cracks according to Atena ..................................................................... 30
4.5.3 Newton-Raphson method ....................................................................... 31
5 Prerequisite for analysed examples ........................................................................... 33
5.1 Geometry ........................................................................................................... 33
5.2 Mesh .................................................................................................................. 33
5.3 Loads ................................................................................................................. 34
5.4 Concrete properties ............................................................................................ 34
5.5 Reinforcement and position ................................................................................ 35
5.6 Theory behind the reinforcement distribution ..................................................... 36
6 Results ......................................................................................................................... 39
6.1 Verification of the results in Atena ..................................................................... 39
6.2 Deep beam with distributed load ........................................................................ 42
6.3 Deep beam with concentrated load ..................................................................... 44
6.4 Relationship between equivalent diameter and crack width ................................. 46
6.4.1 Concrete Section .................................................................................... 46
6.4.2 Atena ..................................................................................................... 47
6.5 The effect of the reinforcement diameter ............................................................ 49
6.6 A comparison of different calculation codes ....................................................... 50
6.7 Additional tensile reinforcement ......................................................................... 51
7 Discussion and conclusions ........................................................................................ 53
7.1 Verification of the results in Atena ..................................................................... 53
7.2 Load impact and crack development ................................................................... 53
7.3 Equivalent diameter ............................................................................................ 54
7.4 The relation between reinforcement and crack width .......................................... 54
7.4.1 Position of the bending reinforcement .................................................... 54
7.4.2 Minimum reinforcement ........................................................................ 55
7.5 The effect of increased total area ........................................................................ 55
7.6 Further studies .................................................................................................... 56
Bibliography ....................................................................................................................... 57
Appendix ............................................................................................................................. 59
A Control calculation ..................................................................................................... 59

xiii
B Calculation of the fracture energy ............................................................................. 65
C Calculations of the crack widths in Concrete Section and Atena ............................. 67

1.1. BACKGROUND
1
1 Introduction
Concrete deep beams are common as wall constructions in many types of buildings, but often
with significant cracks shown in the walls. The cracks are problematic because of increased
risk for moisture problems and reinforcement corrosion, which leads to reduced load carrying
capacity of the structure. When the concrete cracks the durability of the structure also reduces.
Lack of sufficient methods for analysing cracks in concrete deep beams makes it hard to
design for prevention of crack propagation (Ansell, et al., 2014).
1.1 Background
Reinforced concrete structures are relative brittle and therefore usually contain tensile
reinforcement. When the concrete cracks the tension reinforcement carry the tensile forces
instead of the concrete. With higher reinforcement content, the difference between the cracking
load and the ultimate load is expected to increase (Malm & Holmgren, 2008a). Therefore, the
design of tension reinforcement is important since the serviceability should be retained even
after the structure cracks. Cracks increase the risk for penetration of dangerous substances
which accelerate the degradation of both concrete and reinforcement (Bertolini, et al., 2013). It
is difficult to avoid the appearance of the cracks, however they can be limited e.g. by using
proper reinforcement. One alternative is to combine the tensile reinforcement with crack
reinforcement to minimize the crack width. The function of the reinforcement is to distribute
the cracks over the cross section; many smaller cracks occur instead of fewer, wider cracks.
In general, a deep beam is defined as “a structure with length and height in the same order of
magnitude” (Ansell, et al., 2014) and are an example of typical concrete structures where a
combination of tensile- and crack reinforcement is used. However, different guidelines define
deep beams differently. The ACI guideline (ACI, 1999) uses span/depth ratio less than 5 to
define concrete deep beams while Model Code 1990 (CEB-FIP, 1993) uses a span/depth ratio
less than 2.5. Eurocode 2 (SS-EN 1992-1-1, 2005) defines the deep beams using length/depth
ratio less than 3. Several researchers have investigated the behaviour of the deep beams
considering shear cracks and shear strength. In the report, Shear strength of RC deep beams
(Appa Rao, et al., 2017), the shear behaviour of deep beams has been studied. The investigation
shows that the increased depth of the beam increases the crack width, which can be reduced by
increasing the amount of shear reinforcement. However, for deep beams, there is at the present
no well-substantiated analysis model for how bending crack widths shall be calculated when
having reinforcement in multiple layers and with different diameters. The use of crack
reinforcement in the outer bottom layer has by tradition been considered as a cost efficient way
to achieve small crack widths. The outer layer consists of crack reinforcement and the layer
next to it of tensile reinforcement. The purpose is to achieve reduced crack widths compared to
with only tensile reinforcement. However, there is no standard for how to perform the
calculation in accordance with Eurocode 2 (SS-EN 1992-1-1, 2005), which is the design code
of concrete structures. Tensile reinforcement has a larger diameter, around ø25-ø32 mm, and
crack reinforcement has a smaller diameter, around ø10-ø16 mm. The content of this study
focuses on how the bending reinforcement affects the crack pattern of the beams. To optimize
1. THE EFFECT OF REINFORCEMENT CONFIGURATION ON CRACK WIDTHS IN CONCRETE DEEP BEAMS
2
this, the flexural shear force was minimized by using horizontal and vertical minimum
reinforcement, which in turn minimized the brittleness of the concrete (Arvidsson, 2016).
In Sweden, the dimensioning code for concrete structures is the Eurocode 2 in which the
formula for crack width calculations is presented. The prerequisite for Eurocode 2 is that
Bernoulli’s hypothesis is valid, i.e. the linear distribution of strain and stress in the cross-section
are retained during loading. However, for deep beams the hypothesis is not valid since larger
height in relation to the span, the larger the non-linear strain and stress distribution become. To
investigate the crack width of the deep beams, calculations were here done both numerically
and analytically. The numerical calculations were done using a finite element method program,
Atena (Cervenka Consulting, 2011), and the analytical calculations were based on Eurocode 2
using the program Concrete Section (StruSoft AB, 2015).
1.2 Aim and scope
The aim of this work is to study and explain the development of cracks in concrete deep beams
in order to investigate the most effective reinforcement configuration. Furthermore, studies are
performed to investigate how the use of crack reinforcement affects the crack behaviour, i.e. if
smaller crack widths occur for a combination of tensile reinforcement and crack reinforcement
compared to using tensile reinforcement only. The optimization of the amount of reinforcement
will improve the efficiency of construction work at building sites. The aim is also to suggest an
alternative solution that could work better for reducing the crack widths. It is not possible to
fully eliminate the appearance of cracks, but a more accurate reinforcement dimensioning could
lead to reduced risk of large cracks.
1.3 Limitations
As for all master projects, also this work had to be limited. Only cracking caused by external
loads in the serviceability limit state is included, analysed based on non-linear finite element
modelling in Atena 2D and calculations according to Eurocode 2 in Concrete Section. The study
included deep beams with dimensions 5.0×2.5×0.4 m where the cross section varied
considering reinforcement bars. The beams were considered as simply supported and cast from
concrete of class C30/37 with an aggregate size of 12 mm. These configurations were chosen
to represent a typical design for a wall structure. Furthermore, the beams have been analysed
with simple boundary conditions in an isolated environment without stress concentrations from
other surrounding structural parts that is normally present in a structure. The effect of shrinkage
and temperature loading on the material parameters were not considered. Additional parametric
studies were made regarding the best placement of the reinforcement for reducing cracks and
to find the most profitable element size. The element size of the model was selected based on a
mesh convergence analysis to a size that provides sufficiently good results without being
smaller than the biggest ballast grain. Furthermore, a convergence analysis was made using
both deep beams and conventional beams in order to investigate the different performances of
the beams regarding the crack widths.
2.1. CONCRETE STRENGTH AND DEFORMATION IN EUROCODE
3
2 Reinforced concrete structures
Concrete is a composite material that consists of cement, water, aggregate and additives. The
combination of cement and water, the cement paste, is the binder in the concrete matrix. The
aggregates consist of sand, shingle and stones, which are the filling materials. Additives are
often used to improve or achieve certain properties of the concrete. For instance,
superplasticizers are used to reduce the amount of water to achieve higher strength and lower
shrinkage without resulting in a more rigid concrete (Ansell, et al., 2014). The concrete strength
is highly dependent on the water-cement ratio. The concrete strength decreases with high water-
cement ratio and the concrete becomes more fluid while low water-cement ratio increase both
the concrete strength and the stiffness (Burström, 2006).
2.1 Concrete strength and deformation in Eurocode
Concrete is often characterized by its compressive strength which is significantly higher than
its tensile strength. The concrete’s brittleness is also the reason for the limited possibility of
fully using the material tensile strength. Reinforcement is normally used to compensate for the
poor tensile strength in concrete (Ansell, et al., 2014). Concrete is often considered as close to
fully cured after 28 days from casting, when stored at 20 °C. This is a practical limitation often
given in standards and guidelines for when the compressive strength of concrete should be
measured. However, in reality, concrete slowly continue to develop its strength for many years
after casting (Ansell, et al., 2014).
Concrete is divided into certain strength classes in the Eurocode (SS-EN 1992-1-1, 2005). One
example of a strength class is C20/25, where the first number represents the characteristic
cylinder compressive strength (at 5 % fractile) 28 days from casting and the second number the
corresponding characteristic cube compressive strength. Some examples of the different
concrete classes are listed in Table 2.1.
2.2 Shrinkage
Concrete shrinkage is a volume reduction phenomenon, which take place without any influence
from external loads. There are several types of shrinkage, namely plastic shrinkage, drying
shrinkage, autogenous shrinkage and carbonation shrinkage. Concrete behaves in a ductile
manner the first 24 hours after casting. Drying out during this time can lead to large movements,
which increase the risk of deep cracks to arise since the concrete at this stage has a low ability
to carry loads. The magnitude of the plastic shrinkage depends e.g. on the temperature, wind
speed and composition of concrete. The most common type of shrinkage is drying shrinkage
which is the result from that water evaporates from the concrete pore system causing a volume
reduction. This is usually as most notable around a month after casting and the magnitude of
the volume reduction here depends on the amount of water in the concrete and the relative
humidity of the surrounding environment. Another type of shrinkage is autogenous shrinkage
which occurs due to hydration of the cement paste. High cement content and low water cement
2. THE EFFECT OF REINFORCEMENT CONFIGURATION ON CRACK WIDTHS IN CONCRETE DEEP BEAMS
4
ratio increase the autogenous shrinkage but often in practice, the autogenous shrinkage can be
neglected. Furthermore, carbonation shrinkage occurs when cement reacts with water that leads
to the development of calcium hydroxide which reacts with carbon dioxide from the air, leading
to a volume reduction of the concrete. Autogenous shrinkage and carbonation shrinkage are
normally small compared to plastic shrinkage and drying shrinkage (Ansell, et al., 2014).
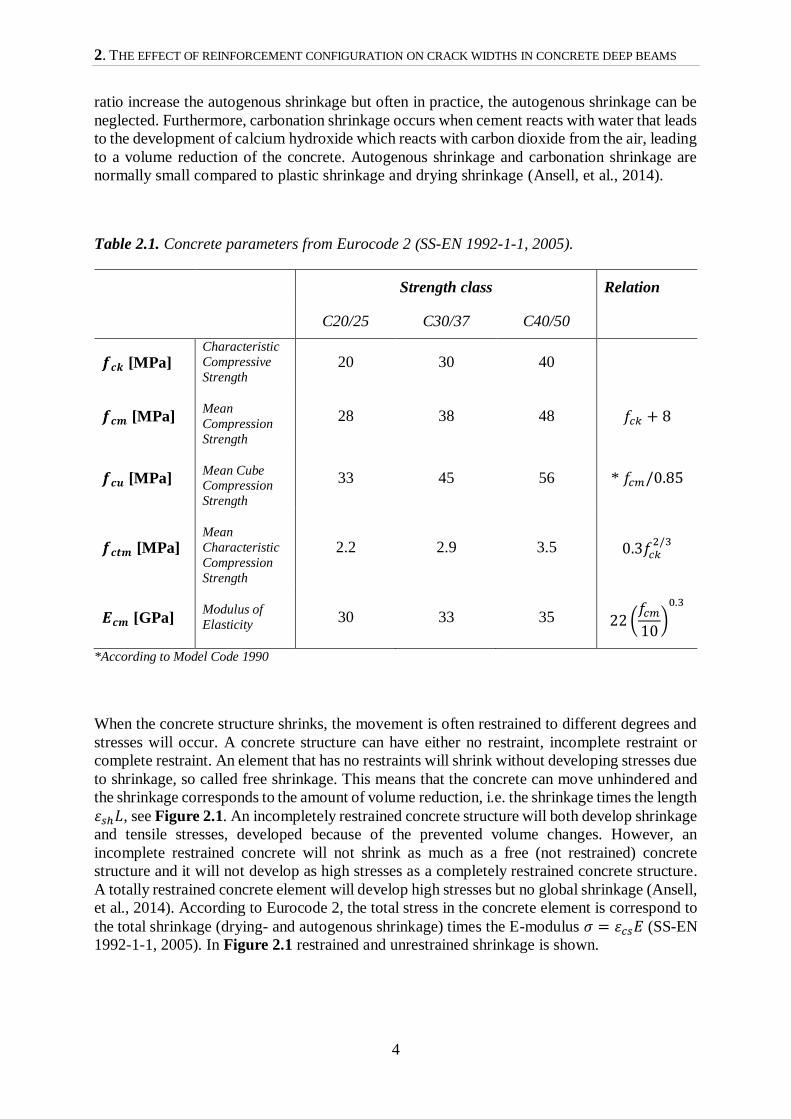
Table 2.1. Concrete parameters from Eurocode 2 (SS-EN 1992-1-1, 2005).
Strength class Relation
C20/25 C30/37 C40/50
𝒇𝒄𝒌 [MPa] Characteristic
Compressive
Strength
20 30 40
𝒇𝒄𝒎 [MPa] Mean
Compression
Strength
28 38 48 𝑓𝑐𝑘 + 8
𝒇𝒄𝒖 [MPa] Mean Cube Compression
Strength
33 45 56 * 𝑓𝑐𝑚/0.85
𝒇𝒄𝒕𝒎 [MPa] Mean
Characteristic
Compression
Strength
2.2 2.9 3.5 0.3𝑓𝑐𝑘2/3
𝑬𝒄𝒎 [GPa] Modulus of
Elasticity 30 33 35 22 (
𝑓𝑐𝑚
10)
0.3
*According to Model Code 1990
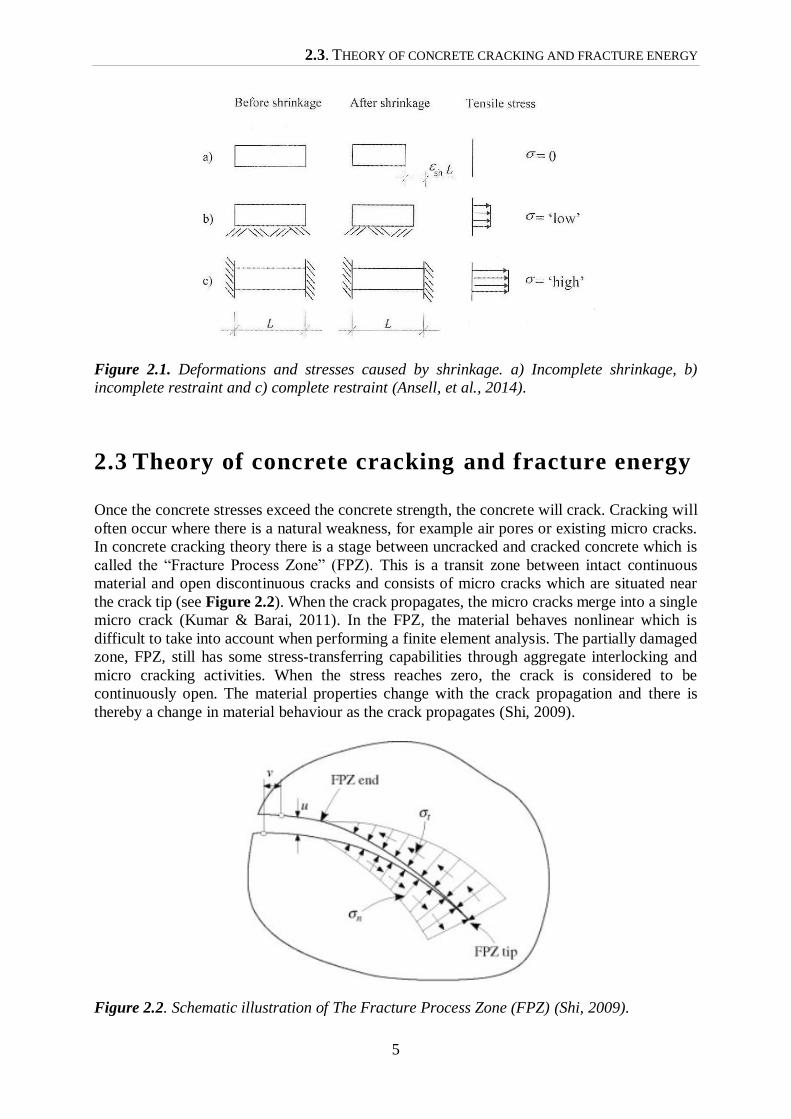
When the concrete structure shrinks, the movement is often restrained to different degrees and
stresses will occur. A concrete structure can have either no restraint, incomplete restraint or
complete restraint. An element that has no restraints will shrink without developing stresses due
to shrinkage, so called free shrinkage. This means that the concrete can move unhindered and
the shrinkage corresponds to the amount of volume reduction, i.e. the shrinkage times the length
휀𝑠ℎ𝐿, see Figure 2.1. An incompletely restrained concrete structure will both develop shrinkage
and tensile stresses, developed because of the prevented volume changes. However, an
incomplete restrained concrete will not shrink as much as a free (not restrained) concrete
structure and it will not develop as high stresses as a completely restrained concrete structure.
A totally restrained concrete element will develop high stresses but no global shrinkage (Ansell,
et al., 2014). According to Eurocode 2, the total stress in the concrete element is correspond to
the total shrinkage (drying- and autogenous shrinkage) times the E-modulus 𝜎 = 휀𝑐𝑠𝐸 (SS-EN
1992-1-1, 2005). In Figure 2.1 restrained and unrestrained shrinkage is shown.
2.3. THEORY OF CONCRETE CRACKING AND FRACTURE ENERGY
5
Figure 2.1. Deformations and stresses caused by shrinkage. a) Incomplete shrinkage, b)
incomplete restraint and c) complete restraint (Ansell, et al., 2014).
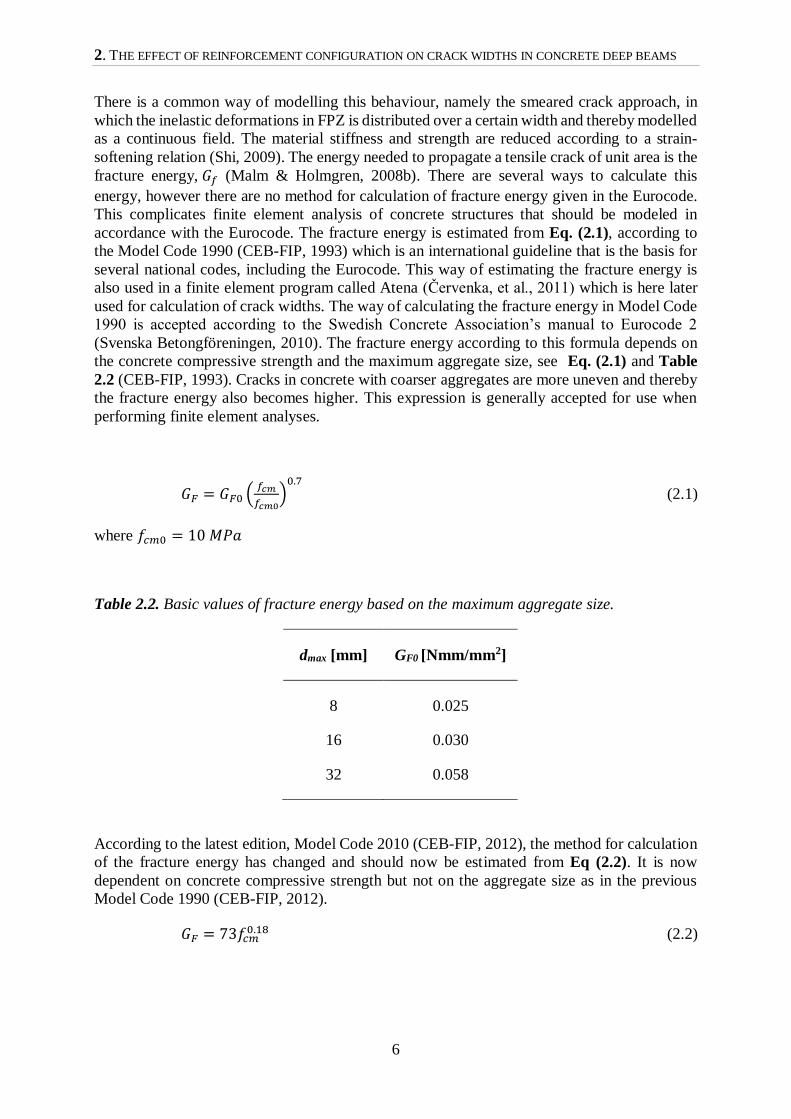
2.3 Theory of concrete cracking and fracture energy
Once the concrete stresses exceed the concrete strength, the concrete will crack. Cracking will
often occur where there is a natural weakness, for example air pores or existing micro cracks.
In concrete cracking theory there is a stage between uncracked and cracked concrete which is
called the “Fracture Process Zone” (FPZ). This is a transit zone between intact continuous
material and open discontinuous cracks and consists of micro cracks which are situated near
the crack tip (see Figure 2.2). When the crack propagates, the micro cracks merge into a single
micro crack (Kumar & Barai, 2011). In the FPZ, the material behaves nonlinear which is
difficult to take into account when performing a finite element analysis. The partially damaged
zone, FPZ, still has some stress-transferring capabilities through aggregate interlocking and
micro cracking activities. When the stress reaches zero, the crack is considered to be
continuously open. The material properties change with the crack propagation and there is
thereby a change in material behaviour as the crack propagates (Shi, 2009).
Figure 2.2. Schematic illustration of The Fracture Process Zone (FPZ) (Shi, 2009).
2. THE EFFECT OF REINFORCEMENT CONFIGURATION ON CRACK WIDTHS IN CONCRETE DEEP BEAMS
6
There is a common way of modelling this behaviour, namely the smeared crack approach, in
which the inelastic deformations in FPZ is distributed over a certain width and thereby modelled
as a continuous field. The material stiffness and strength are reduced according to a strain-
softening relation (Shi, 2009). The energy needed to propagate a tensile crack of unit area is the
fracture energy, 𝐺𝑓 (Malm & Holmgren, 2008b). There are several ways to calculate this
energy, however there are no method for calculation of fracture energy given in the Eurocode.
This complicates finite element analysis of concrete structures that should be modeled in
accordance with the Eurocode. The fracture energy is estimated from Eq. (2.1), according to
the Model Code 1990 (CEB-FIP, 1993) which is an international guideline that is the basis for
several national codes, including the Eurocode. This way of estimating the fracture energy is
also used in a finite element program called Atena (Červenka, et al., 2011) which is here later
used for calculation of crack widths. The way of calculating the fracture energy in Model Code
1990 is accepted according to the Swedish Concrete Association’s manual to Eurocode 2
(Svenska Betongföreningen, 2010). The fracture energy according to this formula depends on
the concrete compressive strength and the maximum aggregate size, see Eq. (2.1) and Table
2.2 (CEB-FIP, 1993). Cracks in concrete with coarser aggregates are more uneven and thereby
the fracture energy also becomes higher. This expression is generally accepted for use when
performing finite element analyses.
𝐺𝐹 = 𝐺𝐹0 (𝑓𝑐𝑚
𝑓𝑐𝑚0)
0.7
(2.1)
where 𝑓𝑐𝑚0 = 10 𝑀𝑃𝑎
Table 2.2. Basic values of fracture energy based on the maximum aggregate size.
dmax [mm] GF0 [Nmm/mm2]
8 0.025
16 0.030
32 0.058
According to the latest edition, Model Code 2010 (CEB-FIP, 2012), the method for calculation
of the fracture energy has changed and should now be estimated from Eq (2.2). It is now
dependent on concrete compressive strength but not on the aggregate size as in the previous
Model Code 1990 (CEB-FIP, 2012).
𝐺𝐹 = 73𝑓𝑐𝑚0.18 (2.2)
2.3. THEORY OF CONCRETE CRACKING AND FRACTURE ENERGY
7
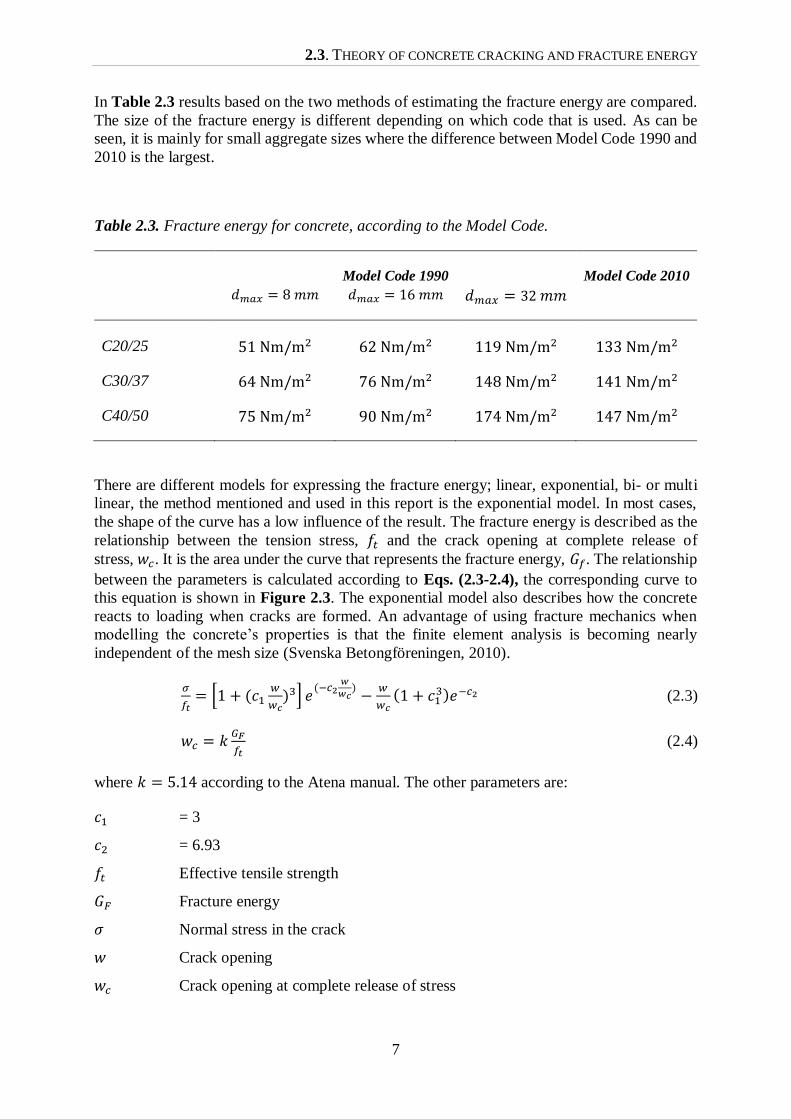
In Table 2.3 results based on the two methods of estimating the fracture energy are compared.
The size of the fracture energy is different depending on which code that is used. As can be
seen, it is mainly for small aggregate sizes where the difference between Model Code 1990 and
2010 is the largest.
Table 2.3. Fracture energy for concrete, according to the Model Code.
Model Code 1990 Model Code 2010
𝑑𝑚𝑎𝑥 = 8 𝑚𝑚 𝑑𝑚𝑎𝑥 = 16 𝑚𝑚 𝑑𝑚𝑎𝑥 = 32 𝑚𝑚
C20/25 51 Nm/m2 62 Nm/m2 119 Nm/m2 133 Nm/m2
C30/37 64 Nm/m2 76 Nm/m2 148 Nm/m2 141 Nm/m2
C40/50 75 Nm/m2 90 Nm/m2 174 Nm/m2 147 Nm/m2
There are different models for expressing the fracture energy; linear, exponential, bi- or multi
linear, the method mentioned and used in this report is the exponential model. In most cases,
the shape of the curve has a low influence of the result. The fracture energy is described as the
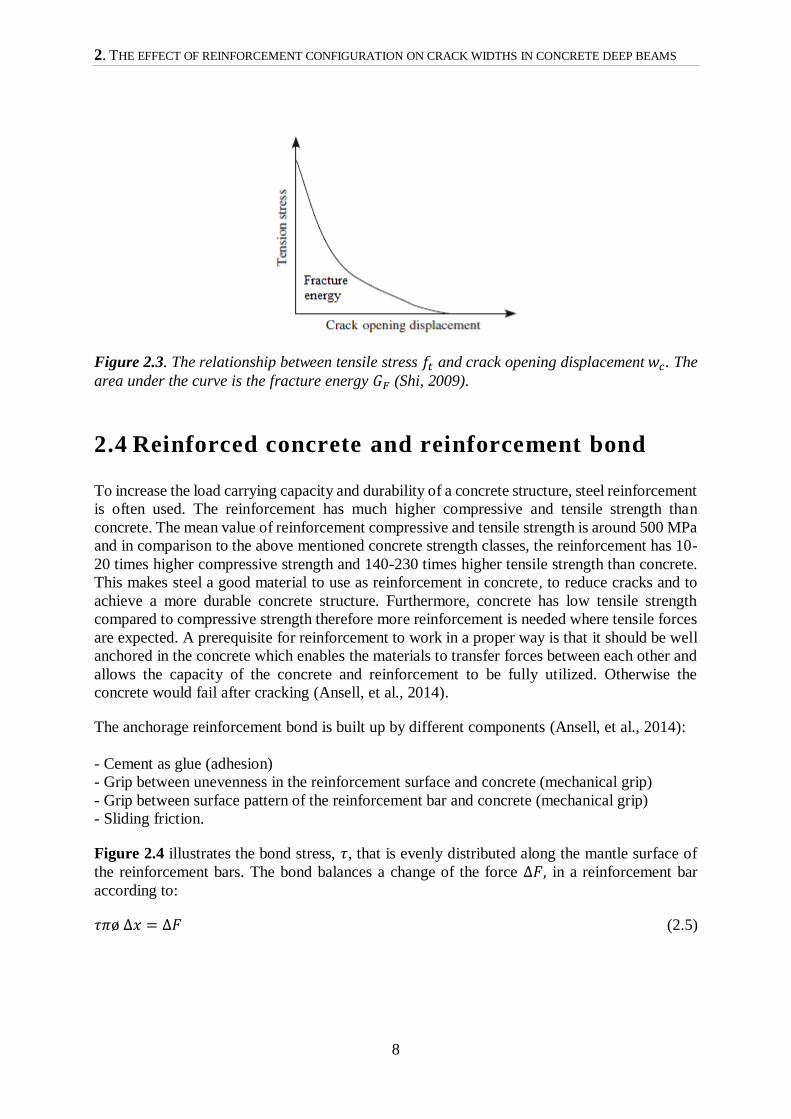
relationship between the tension stress, 𝑓𝑡 and the crack opening at complete release of
stress, 𝑤𝑐. It is the area under the curve that represents the fracture energy, 𝐺𝑓. The relationship
between the parameters is calculated according to Eqs. (2.3-2.4), the corresponding curve to
this equation is shown in Figure 2.3. The exponential model also describes how the concrete
reacts to loading when cracks are formed. An advantage of using fracture mechanics when
modelling the concrete’s properties is that the finite element analysis is becoming nearly
independent of the mesh size (Svenska Betongföreningen, 2010).
𝜎
𝑓𝑡= [1 + (𝑐1
𝑤
𝑤𝑐)3] 𝑒
(−𝑐2𝑤
𝑤𝑐)
−𝑤
𝑤𝑐(1 + 𝑐1
3)𝑒−𝑐2 (2.3)
𝑤𝑐 = 𝑘𝐺𝐹
𝑓𝑡 (2.4)
where 𝑘 = 5.14 according to the Atena manual. The other parameters are:
𝑐1 = 3
𝑐2 = 6.93
𝑓𝑡 Effective tensile strength
𝐺𝐹 Fracture energy
𝜎 Normal stress in the crack
𝑤 Crack opening
𝑤𝑐 Crack opening at complete release of stress
2. THE EFFECT OF REINFORCEMENT CONFIGURATION ON CRACK WIDTHS IN CONCRETE DEEP BEAMS
8
Figure 2.3. The relationship between tensile stress 𝑓𝑡 and crack opening displacement 𝑤𝑐. The
area under the curve is the fracture energy 𝐺𝐹 (Shi, 2009).
2.4 Reinforced concrete and reinforcement bond
To increase the load carrying capacity and durability of a concrete structure, steel reinforcement
is often used. The reinforcement has much higher compressive and tensile strength than
concrete. The mean value of reinforcement compressive and tensile strength is around 500 MPa
and in comparison to the above mentioned concrete strength classes, the reinforcement has 10-
20 times higher compressive strength and 140-230 times higher tensile strength than concrete.
This makes steel a good material to use as reinforcement in concrete, to reduce cracks and to
achieve a more durable concrete structure. Furthermore, concrete has low tensile strength
compared to compressive strength therefore more reinforcement is needed where tensile forces
are expected. A prerequisite for reinforcement to work in a proper way is that it should be well
anchored in the concrete which enables the materials to transfer forces between each other and
allows the capacity of the concrete and reinforcement to be fully utilized. Otherwise the
concrete would fail after cracking (Ansell, et al., 2014).
The anchorage reinforcement bond is built up by different components (Ansell, et al., 2014):
- Cement as glue (adhesion)
- Grip between unevenness in the reinforcement surface and concrete (mechanical grip)
- Grip between surface pattern of the reinforcement bar and concrete (mechanical grip)
- Sliding friction.
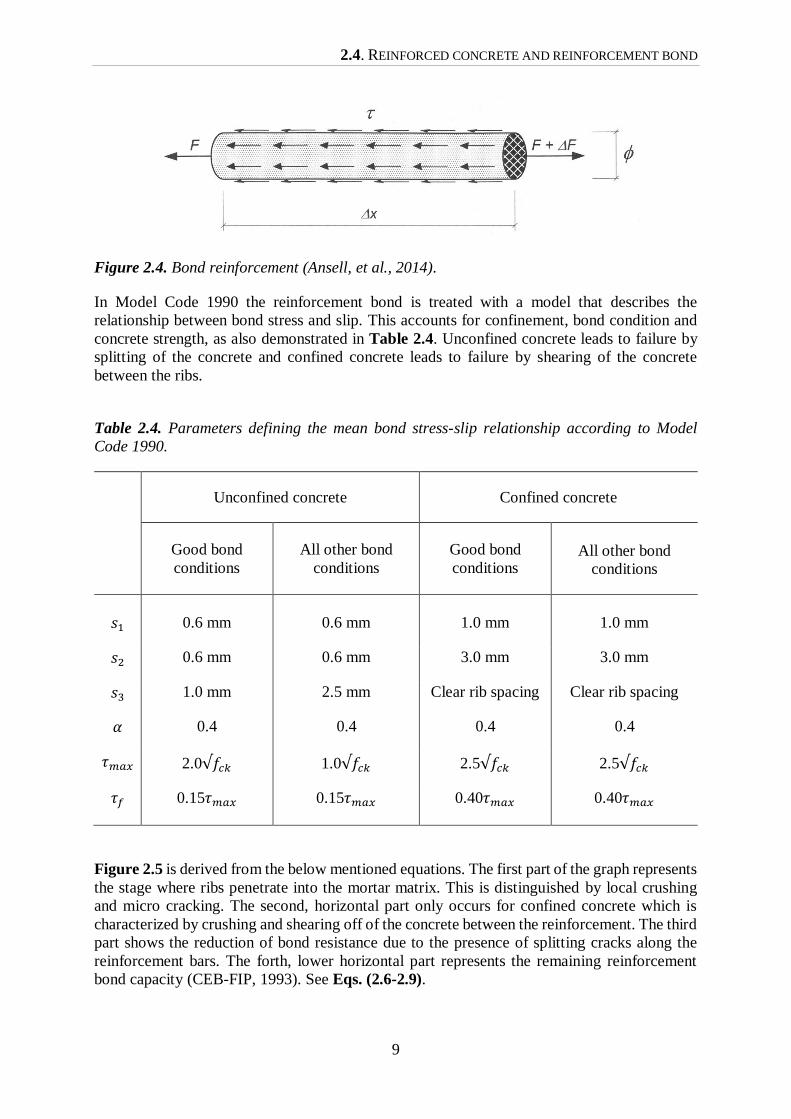
Figure 2.4 illustrates the bond stress, 𝜏, that is evenly distributed along the mantle surface of
the reinforcement bars. The bond balances a change of the force ∆𝐹, in a reinforcement bar
according to:
𝜏𝜋ø ∆𝑥 = ∆𝐹 (2.5)
2.4. REINFORCED CONCRETE AND REINFORCEMENT BOND
9
Figure 2.4. Bond reinforcement (Ansell, et al., 2014).
In Model Code 1990 the reinforcement bond is treated with a model that describes the
relationship between bond stress and slip. This accounts for confinement, bond condition and
concrete strength, as also demonstrated in Table 2.4. Unconfined concrete leads to failure by
splitting of the concrete and confined concrete leads to failure by shearing of the concrete
between the ribs.
Table 2.4. Parameters defining the mean bond stress-slip relationship according to Model
Code 1990.
Unconfined concrete Confined concrete
Good bond
conditions
All other bond
conditions
Good bond
conditions
All other bond
conditions
𝑠1
0.6 mm
0.6 mm
1.0 mm
1.0 mm
𝑠2 0.6 mm 0.6 mm 3.0 mm 3.0 mm
𝑠3 1.0 mm 2.5 mm Clear rib spacing Clear rib spacing
𝛼 0.4 0.4 0.4 0.4
𝜏𝑚𝑎𝑥 2.0√𝑓𝑐𝑘 1.0√𝑓𝑐𝑘 2.5√𝑓𝑐𝑘 2.5√𝑓𝑐𝑘
𝜏𝑓 0.15𝜏𝑚𝑎𝑥 0.15𝜏𝑚𝑎𝑥 0.40𝜏𝑚𝑎𝑥 0.40𝜏𝑚𝑎𝑥
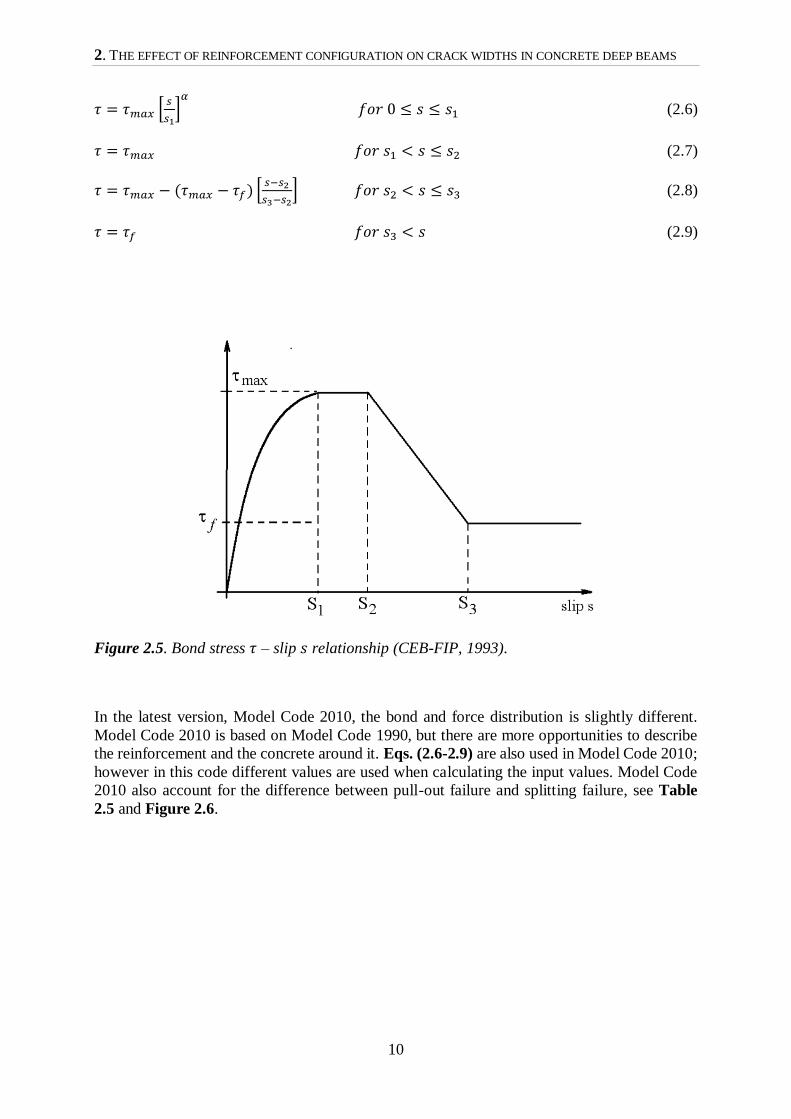
Figure 2.5 is derived from the below mentioned equations. The first part of the graph represents
the stage where ribs penetrate into the mortar matrix. This is distinguished by local crushing
and micro cracking. The second, horizontal part only occurs for confined concrete which is
characterized by crushing and shearing off of the concrete between the reinforcement. The third
part shows the reduction of bond resistance due to the presence of splitting cracks along the
reinforcement bars. The forth, lower horizontal part represents the remaining reinforcement
bond capacity (CEB-FIP, 1993). See Eqs. (2.6-2.9).
2. THE EFFECT OF REINFORCEMENT CONFIGURATION ON CRACK WIDTHS IN CONCRETE DEEP BEAMS
10
𝜏 = 𝜏𝑚𝑎𝑥 [𝑠
𝑠1]
𝛼
𝑓𝑜𝑟 0 ≤ 𝑠 ≤ 𝑠1 (2.6)
𝜏 = 𝜏𝑚𝑎𝑥 𝑓𝑜𝑟 𝑠1 < 𝑠 ≤ 𝑠2 (2.7)
𝜏 = 𝜏𝑚𝑎𝑥 − (𝜏𝑚𝑎𝑥 − 𝜏𝑓) [𝑠−𝑠2
𝑠3−𝑠2] 𝑓𝑜𝑟 𝑠2 < 𝑠 ≤ 𝑠3 (2.8)
𝜏 = 𝜏𝑓 𝑓𝑜𝑟 𝑠3 < 𝑠 (2.9)
Figure 2.5. Bond stress 𝜏 – slip 𝑠 relationship (CEB-FIP, 1993).
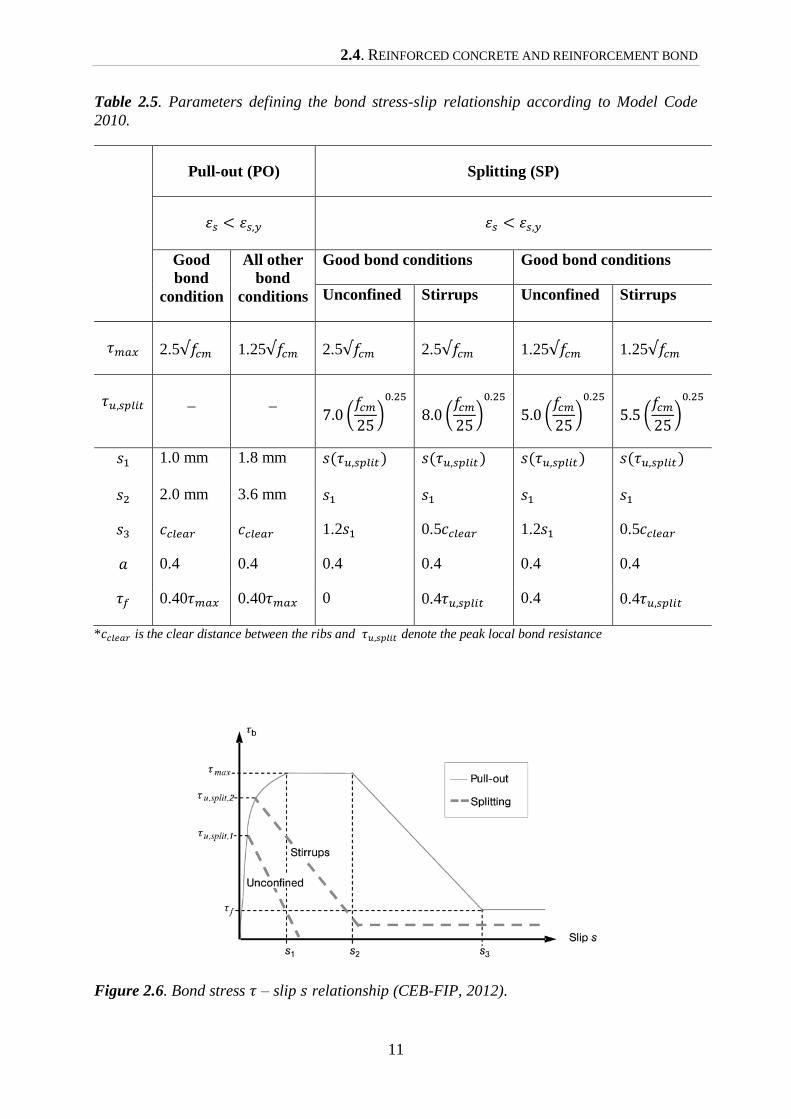
In the latest version, Model Code 2010, the bond and force distribution is slightly different.
Model Code 2010 is based on Model Code 1990, but there are more opportunities to describe
the reinforcement and the concrete around it. Eqs. (2.6-2.9) are also used in Model Code 2010;
however in this code different values are used when calculating the input values. Model Code
2010 also account for the difference between pull-out failure and splitting failure, see Table
2.5 and Figure 2.6.
2.4. REINFORCED CONCRETE AND REINFORCEMENT BOND
11
Table 2.5. Parameters defining the bond stress-slip relationship according to Model Code
2010.
Pull-out (PO) Splitting (SP)
휀𝑠 < 휀𝑠,𝑦 휀𝑠 < 휀𝑠,𝑦
Good
bond
condition
All other
bond
conditions
Good bond conditions Good bond conditions
Unconfined Stirrups Unconfined Stirrups
𝜏𝑚𝑎𝑥 2.5√𝑓𝑐𝑚 1.25√𝑓𝑐𝑚 2.5√𝑓𝑐𝑚 2.5√𝑓𝑐𝑚 1.25√𝑓𝑐𝑚 1.25√𝑓𝑐𝑚
𝜏𝑢,𝑠𝑝𝑙𝑖𝑡 _ _ 7.0 (
𝑓𝑐𝑚
25)
0.25
8.0 (𝑓𝑐𝑚
25)
0.25
5.0 (𝑓𝑐𝑚
25)
0.25
5.5 (𝑓𝑐𝑚
25)
0.25
𝑠1 1.0 mm 1.8 mm 𝑠(𝜏𝑢,𝑠𝑝𝑙𝑖𝑡 ) 𝑠(𝜏𝑢,𝑠𝑝𝑙𝑖𝑡 ) 𝑠(𝜏𝑢,𝑠𝑝𝑙𝑖𝑡) 𝑠(𝜏𝑢,𝑠𝑝𝑙𝑖𝑡)
𝑠2 2.0 mm 3.6 mm 𝑠1 𝑠1 𝑠1 𝑠1
𝑠3 𝑐𝑐𝑙𝑒𝑎𝑟 𝑐𝑐𝑙𝑒𝑎𝑟 1.2𝑠1 0.5𝑐𝑐𝑙𝑒𝑎𝑟 1.2𝑠1 0.5𝑐𝑐𝑙𝑒𝑎𝑟
𝑎 0.4 0.4 0.4 0.4 0.4 0.4
𝜏𝑓 0.40𝜏𝑚𝑎𝑥 0.40𝜏𝑚𝑎𝑥 0 0.4𝜏𝑢,𝑠𝑝𝑙𝑖𝑡 0.4 0.4𝜏𝑢,𝑠𝑝𝑙𝑖𝑡
*𝑐𝑐𝑙𝑒𝑎𝑟 is the clear distance between the ribs and 𝜏𝑢,𝑠𝑝𝑙𝑖𝑡 denote the peak local bond resistance
Figure 2.6. Bond stress 𝜏 – slip 𝑠 relationship (CEB-FIP, 2012).

2. THE EFFECT OF REINFORCEMENT CONFIGURATION ON CRACK WIDTHS IN CONCRETE DEEP BEAMS
12
3.1. THEORETICAL BACKGROUND
13
3 Deep beams
3.1 Theoretical background
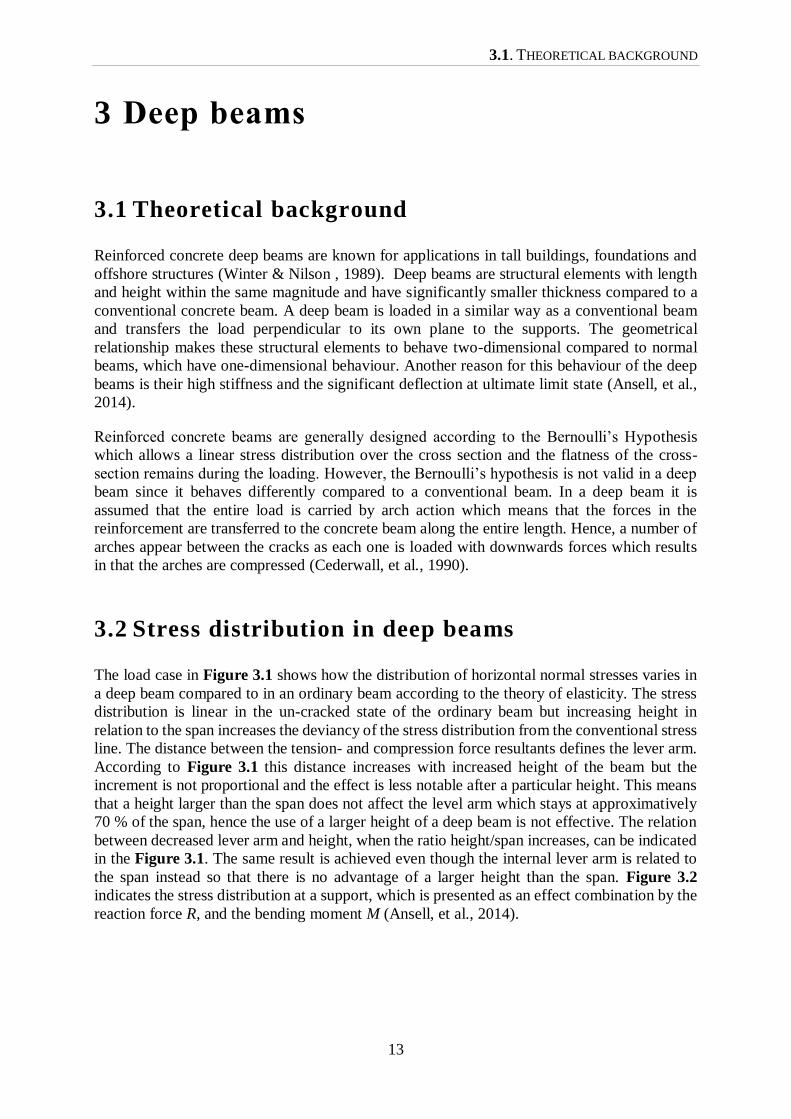
Reinforced concrete deep beams are known for applications in tall buildings, foundations and
offshore structures (Winter & Nilson , 1989). Deep beams are structural elements with length
and height within the same magnitude and have significantly smaller thickness compared to a
conventional concrete beam. A deep beam is loaded in a similar way as a conventional beam
and transfers the load perpendicular to its own plane to the supports. The geometrical
relationship makes these structural elements to behave two-dimensional compared to normal
beams, which have one-dimensional behaviour. Another reason for this behaviour of the deep
beams is their high stiffness and the significant deflection at ultimate limit state (Ansell, et al.,
2014).
Reinforced concrete beams are generally designed according to the Bernoulli’s Hypothesis
which allows a linear stress distribution over the cross section and the flatness of the cross-
section remains during the loading. However, the Bernoulli’s hypothesis is not valid in a deep
beam since it behaves differently compared to a conventional beam. In a deep beam it is
assumed that the entire load is carried by arch action which means that the forces in the
reinforcement are transferred to the concrete beam along the entire length. Hence, a number of
arches appear between the cracks as each one is loaded with downwards forces which results
in that the arches are compressed (Cederwall, et al., 1990).
3.2 Stress distribution in deep beams
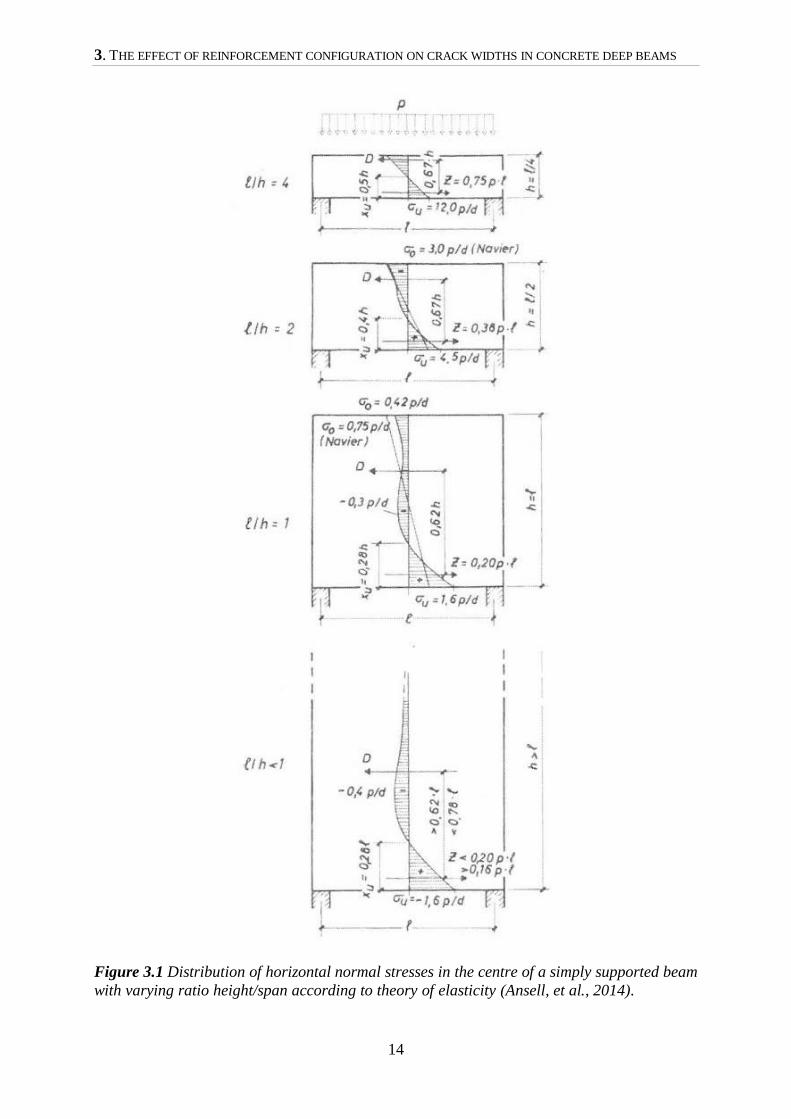
The load case in Figure 3.1 shows how the distribution of horizontal normal stresses varies in
a deep beam compared to in an ordinary beam according to the theory of elasticity. The stress
distribution is linear in the un-cracked state of the ordinary beam but increasing height in
relation to the span increases the deviancy of the stress distribution from the conventional stress
line. The distance between the tension- and compression force resultants defines the lever arm.
According to Figure 3.1 this distance increases with increased height of the beam but the
increment is not proportional and the effect is less notable after a particular height. This means
that a height larger than the span does not affect the level arm which stays at approximatively
70 % of the span, hence the use of a larger height of a deep beam is not effective. The relation
between decreased lever arm and height, when the ratio height/span increases, can be indicated
in the Figure 3.1. The same result is achieved even though the internal lever arm is related to
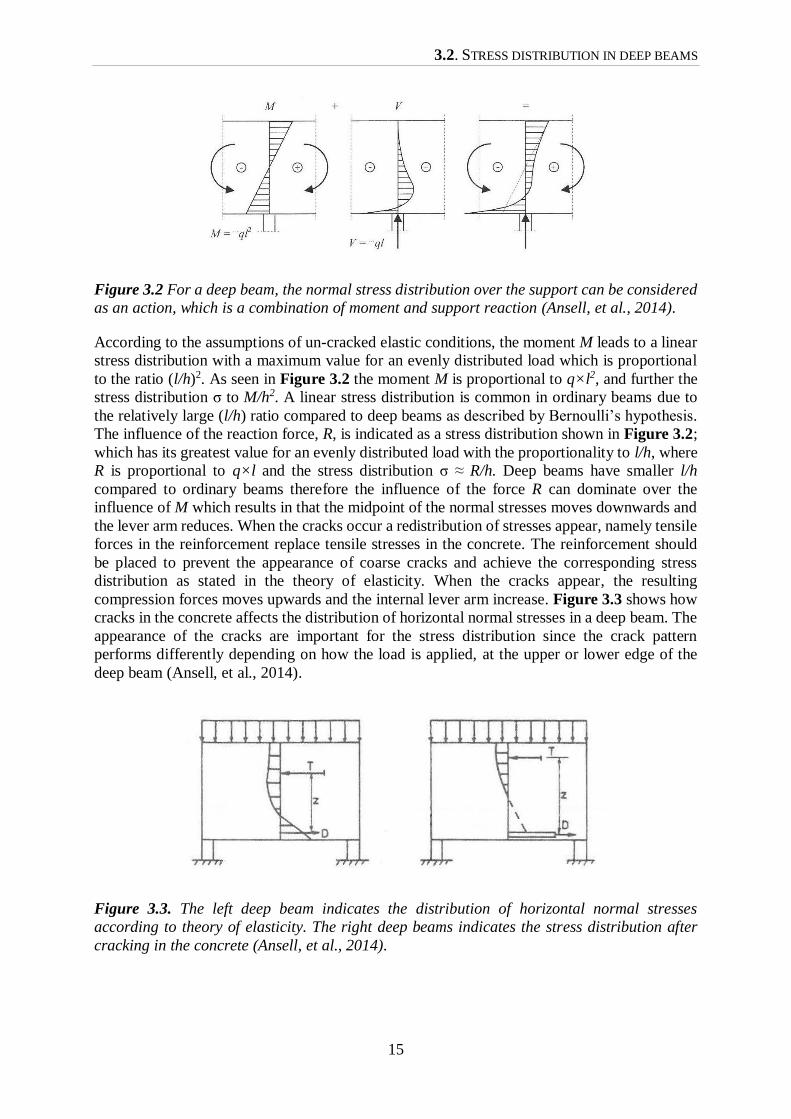
the span instead so that there is no advantage of a larger height than the span. Figure 3.2
indicates the stress distribution at a support, which is presented as an effect combination by the
reaction force R, and the bending moment M (Ansell, et al., 2014).
3. THE EFFECT OF REINFORCEMENT CONFIGURATION ON CRACK WIDTHS IN CONCRETE DEEP BEAMS
14
Figure 3.1 Distribution of horizontal normal stresses in the centre of a simply supported beam
with varying ratio height/span according to theory of elasticity (Ansell, et al., 2014).
3.2. STRESS DISTRIBUTION IN DEEP BEAMS
15
Figure 3.2 For a deep beam, the normal stress distribution over the support can be considered
as an action, which is a combination of moment and support reaction (Ansell, et al., 2014).
According to the assumptions of un-cracked elastic conditions, the moment M leads to a linear
stress distribution with a maximum value for an evenly distributed load which is proportional
to the ratio (l/h)2. As seen in Figure 3.2 the moment M is proportional to q×l2, and further the
stress distribution σ to M/h2. A linear stress distribution is common in ordinary beams due to
the relatively large (l/h) ratio compared to deep beams as described by Bernoulli’s hypothesis.
The influence of the reaction force, R, is indicated as a stress distribution shown in Figure 3.2;
which has its greatest value for an evenly distributed load with the proportionality to l/h, where
R is proportional to q×l and the stress distribution σ ≈ R/h. Deep beams have smaller l/h
compared to ordinary beams therefore the influence of the force R can dominate over the
influence of M which results in that the midpoint of the normal stresses moves downwards and
the lever arm reduces. When the cracks occur a redistribution of stresses appear, namely tensile
forces in the reinforcement replace tensile stresses in the concrete. The reinforcement should
be placed to prevent the appearance of coarse cracks and achieve the corresponding stress
distribution as stated in the theory of elasticity. When the cracks appear, the resulting
compression forces moves upwards and the internal lever arm increase. Figure 3.3 shows how
cracks in the concrete affects the distribution of horizontal normal stresses in a deep beam. The
appearance of the cracks are important for the stress distribution since the crack pattern
performs differently depending on how the load is applied, at the upper or lower edge of the
deep beam (Ansell, et al., 2014).
Figure 3.3. The left deep beam indicates the distribution of horizontal normal stresses
according to theory of elasticity. The right deep beams indicates the stress distribution after
cracking in the concrete (Ansell, et al., 2014).
3. THE EFFECT OF REINFORCEMENT CONFIGURATION ON CRACK WIDTHS IN CONCRETE DEEP BEAMS
16
3.3 Experimental investigations of deep beams
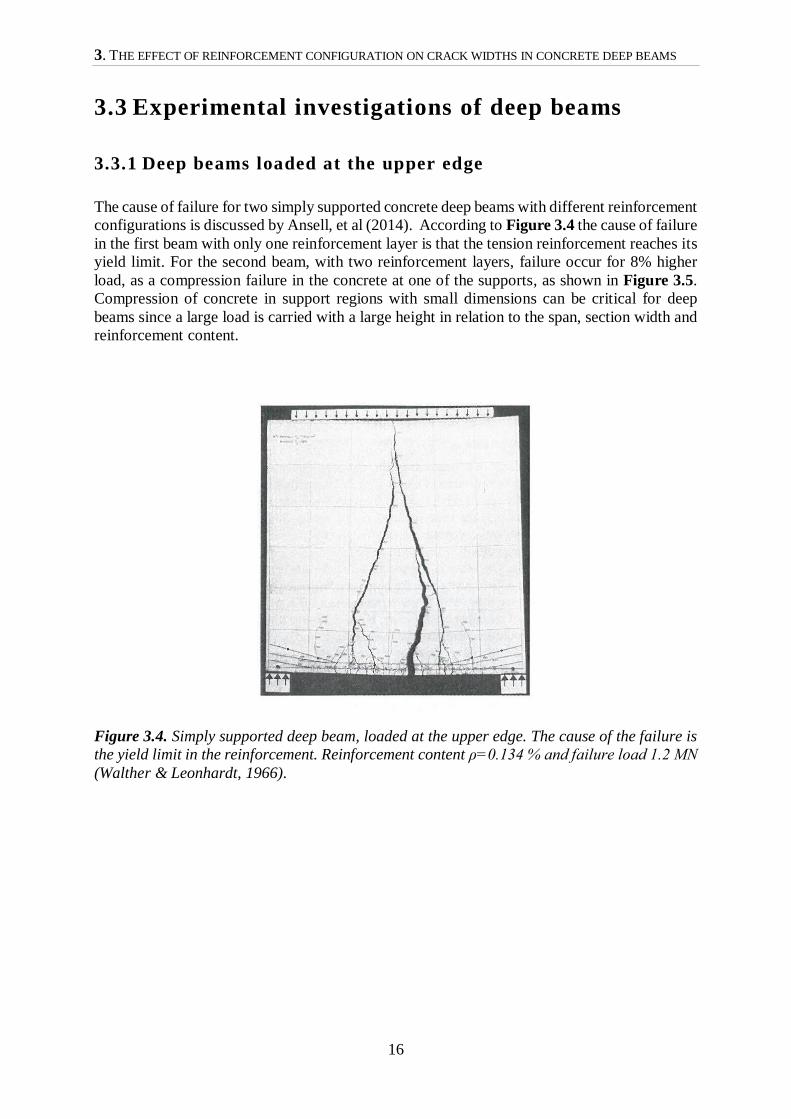
3.3.1 Deep beams loaded at the upper edge
The cause of failure for two simply supported concrete deep beams with different reinforcement
configurations is discussed by Ansell, et al (2014). According to Figure 3.4 the cause of failure
in the first beam with only one reinforcement layer is that the tension reinforcement reaches its
yield limit. For the second beam, with two reinforcement layers, failure occur for 8% higher
load, as a compression failure in the concrete at one of the supports, as shown in Figure 3.5.
Compression of concrete in support regions with small dimensions can be critical for deep
beams since a large load is carried with a large height in relation to the span, section width and
reinforcement content.
Figure 3.4. Simply supported deep beam, loaded at the upper edge. The cause of the failure is
the yield limit in the reinforcement. Reinforcement content ρ=0.134 % and failure load 1.2 MN
(Walther & Leonhardt, 1966).
3.3. EXPERIMENTAL INVESTIGATIONS OF DEEP BEAMS
17
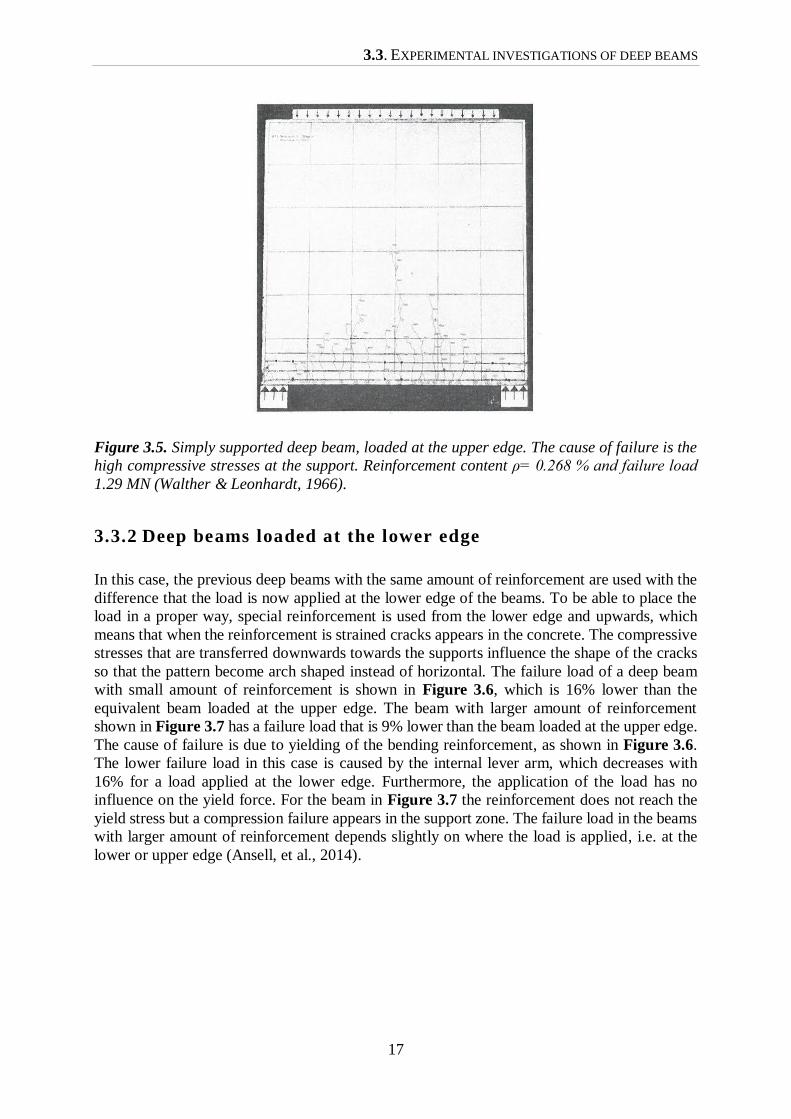
Figure 3.5. Simply supported deep beam, loaded at the upper edge. The cause of failure is the
high compressive stresses at the support. Reinforcement content ρ= 0.268 % and failure load
1.29 MN (Walther & Leonhardt, 1966).
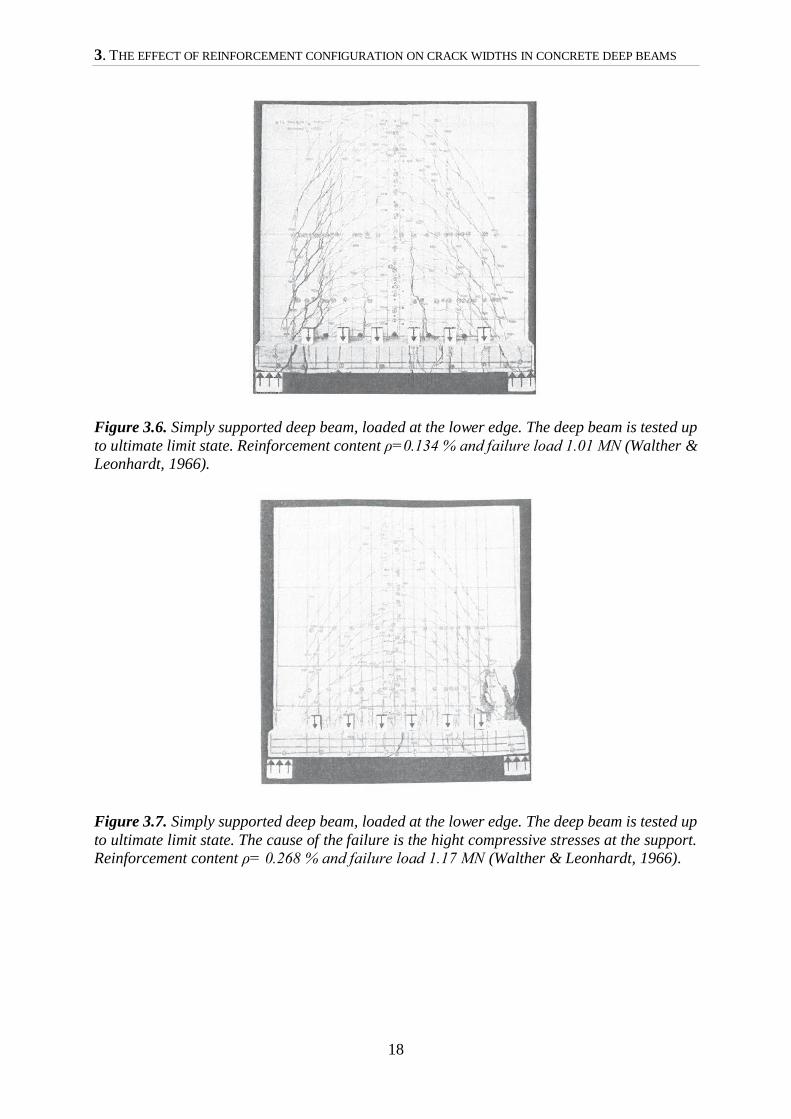
3.3.2 Deep beams loaded at the lower edge
In this case, the previous deep beams with the same amount of reinforcement are used with the
difference that the load is now applied at the lower edge of the beams. To be able to place the
load in a proper way, special reinforcement is used from the lower edge and upwards, which
means that when the reinforcement is strained cracks appears in the concrete. The compressive
stresses that are transferred downwards towards the supports influence the shape of the cracks
so that the pattern become arch shaped instead of horizontal. The failure load of a deep beam
with small amount of reinforcement is shown in Figure 3.6, which is 16% lower than the
equivalent beam loaded at the upper edge. The beam with larger amount of reinforcement
shown in Figure 3.7 has a failure load that is 9% lower than the beam loaded at the upper edge.
The cause of failure is due to yielding of the bending reinforcement, as shown in Figure 3.6.
The lower failure load in this case is caused by the internal lever arm, which decreases with
16% for a load applied at the lower edge. Furthermore, the application of the load has no
influence on the yield force. For the beam in Figure 3.7 the reinforcement does not reach the
yield stress but a compression failure appears in the support zone. The failure load in the beams
with larger amount of reinforcement depends slightly on where the load is applied, i.e. at the
lower or upper edge (Ansell, et al., 2014).
3. THE EFFECT OF REINFORCEMENT CONFIGURATION ON CRACK WIDTHS IN CONCRETE DEEP BEAMS
18
Figure 3.6. Simply supported deep beam, loaded at the lower edge. The deep beam is tested up
to ultimate limit state. Reinforcement content ρ=0.134 % and failure load 1.01 MN (Walther &
Leonhardt, 1966).
Figure 3.7. Simply supported deep beam, loaded at the lower edge. The deep beam is tested up
to ultimate limit state. The cause of the failure is the hight compressive stresses at the support.
Reinforcement content ρ= 0.268 % and failure load 1.17 MN (Walther & Leonhardt, 1966).
3.4. DESIGN OF DEEP BEAMS
19
3.4 Design of deep beams
3.4.1 Calculation model
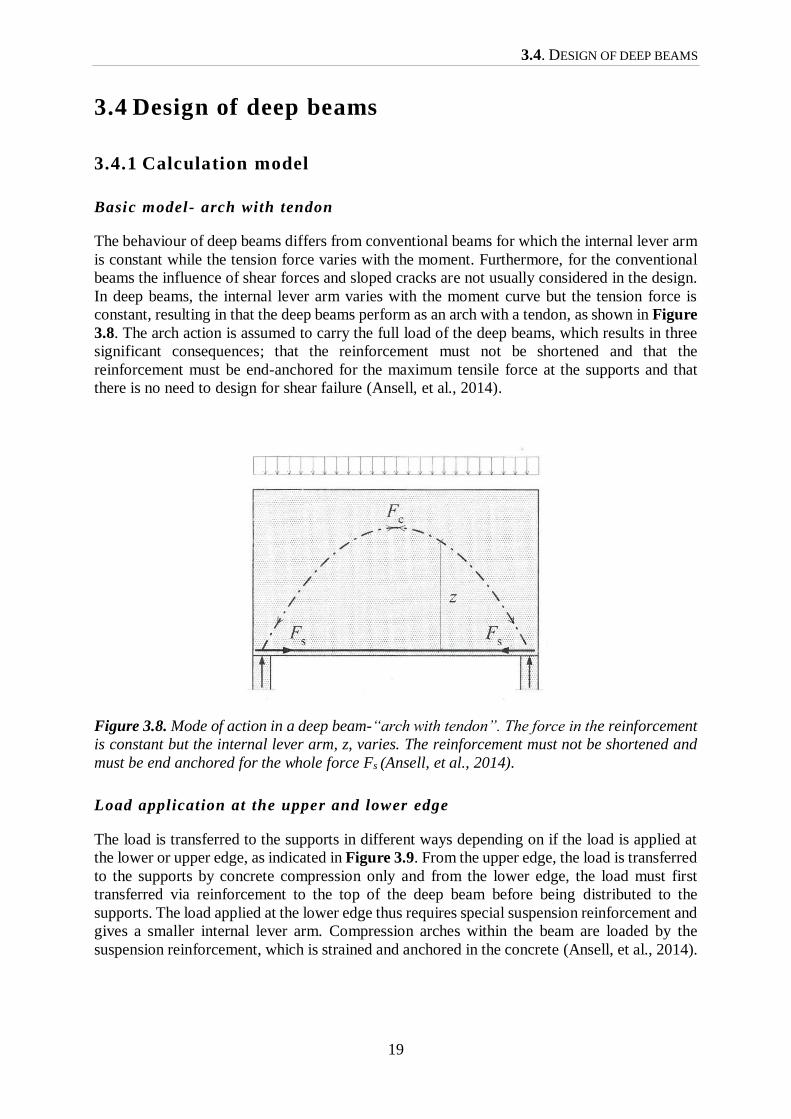
Basic model- arch with tendon
The behaviour of deep beams differs from conventional beams for which the internal lever arm
is constant while the tension force varies with the moment. Furthermore, for the conventional
beams the influence of shear forces and sloped cracks are not usually considered in the design.
In deep beams, the internal lever arm varies with the moment curve but the tension force is
constant, resulting in that the deep beams perform as an arch with a tendon, as shown in Figure
3.8. The arch action is assumed to carry the full load of the deep beams, which results in three
significant consequences; that the reinforcement must not be shortened and that the
reinforcement must be end-anchored for the maximum tensile force at the supports and that
there is no need to design for shear failure (Ansell, et al., 2014).
Figure 3.8. Mode of action in a deep beam-“arch with tendon”. The force in the reinforcement
is constant but the internal lever arm, z, varies. The reinforcement must not be shortened and
must be end anchored for the whole force Fs (Ansell, et al., 2014).
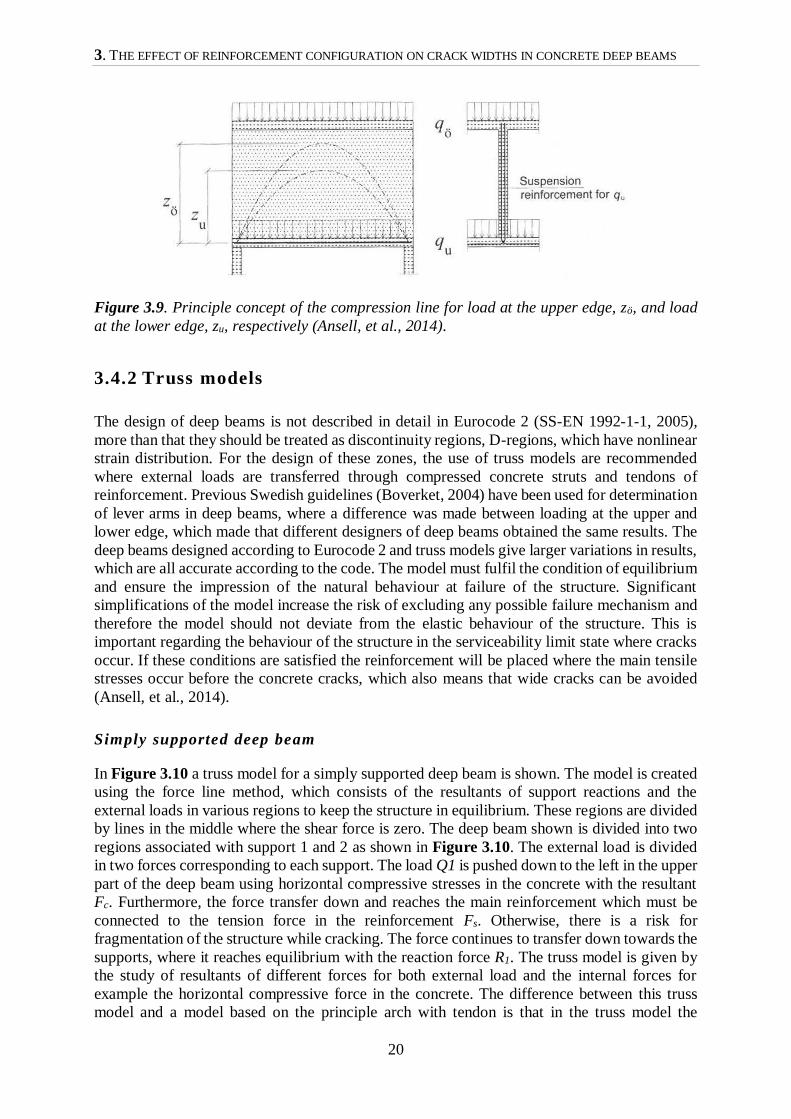
Load application at the upper and lower edge
The load is transferred to the supports in different ways depending on if the load is applied at
the lower or upper edge, as indicated in Figure 3.9. From the upper edge, the load is transferred
to the supports by concrete compression only and from the lower edge, the load must first
transferred via reinforcement to the top of the deep beam before being distributed to the
supports. The load applied at the lower edge thus requires special suspension reinforcement and
gives a smaller internal lever arm. Compression arches within the beam are loaded by the
suspension reinforcement, which is strained and anchored in the concrete (Ansell, et al., 2014).
3. THE EFFECT OF REINFORCEMENT CONFIGURATION ON CRACK WIDTHS IN CONCRETE DEEP BEAMS
20
Figure 3.9. Principle concept of the compression line for load at the upper edge, zö, and load
at the lower edge, zu, respectively (Ansell, et al., 2014).
3.4.2 Truss models
The design of deep beams is not described in detail in Eurocode 2 (SS-EN 1992-1-1, 2005),
more than that they should be treated as discontinuity regions, D-regions, which have nonlinear
strain distribution. For the design of these zones, the use of truss models are recommended
where external loads are transferred through compressed concrete struts and tendons of
reinforcement. Previous Swedish guidelines (Boverket, 2004) have been used for determination
of lever arms in deep beams, where a difference was made between loading at the upper and
lower edge, which made that different designers of deep beams obtained the same results. The
deep beams designed according to Eurocode 2 and truss models give larger variations in results,
which are all accurate according to the code. The model must fulfil the condition of equilibrium
and ensure the impression of the natural behaviour at failure of the structure. Significant
simplifications of the model increase the risk of excluding any possible failure mechanism and
therefore the model should not deviate from the elastic behaviour of the structure. This is
important regarding the behaviour of the structure in the serviceability limit state where cracks
occur. If these conditions are satisfied the reinforcement will be placed where the main tensile
stresses occur before the concrete cracks, which also means that wide cracks can be avoided
(Ansell, et al., 2014).
Simply supported deep beam
In Figure 3.10 a truss model for a simply supported deep beam is shown. The model is created
using the force line method, which consists of the resultants of support reactions and the
external loads in various regions to keep the structure in equilibrium. These regions are divided
by lines in the middle where the shear force is zero. The deep beam shown is divided into two
regions associated with support 1 and 2 as shown in Figure 3.10. The external load is divided
in two forces corresponding to each support. The load Q1 is pushed down to the left in the upper
part of the deep beam using horizontal compressive stresses in the concrete with the resultant
Fc. Furthermore, the force transfer down and reaches the main reinforcement which must be
connected to the tension force in the reinforcement Fs. Otherwise, there is a risk for
fragmentation of the structure while cracking. The force continues to transfer down towards the
supports, where it reaches equilibrium with the reaction force R1. The truss model is given by
the study of resultants of different forces for both external load and the internal forces for
example the horizontal compressive force in the concrete. The difference between this truss
model and a model based on the principle arch with tendon is that in the truss model the
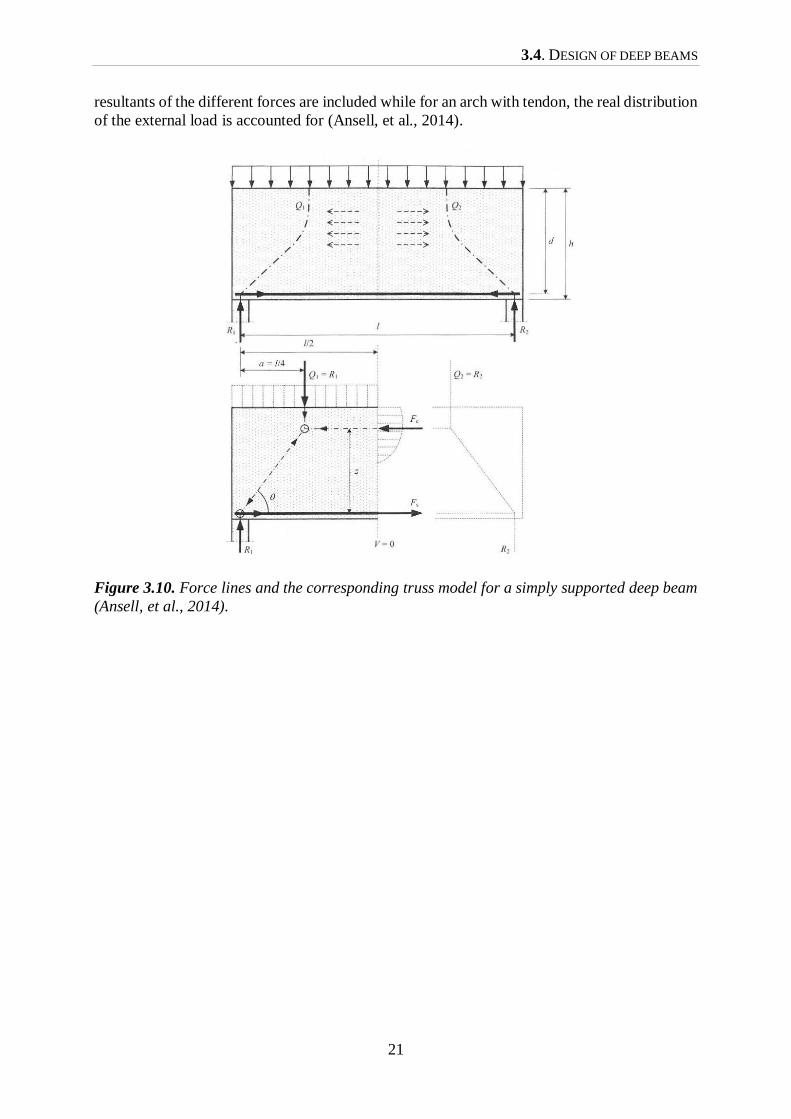
3.4. DESIGN OF DEEP BEAMS
21
resultants of the different forces are included while for an arch with tendon, the real distribution
of the external load is accounted for (Ansell, et al., 2014).
Figure 3.10. Force lines and the corresponding truss model for a simply supported deep beam
(Ansell, et al., 2014).

3. THE EFFECT OF REINFORCEMENT CONFIGURATION ON CRACK WIDTHS IN CONCRETE DEEP BEAMS
22
4.1. CRACKS ACCORDING TO EUROCODE 2
23
4 Method
In order to investigate which of the suggested combinations of amount, position and size of
reinforcement bars that is the most efficient for reducing crack widths, also accounting for
practical aspects, e.g. how easy it is to implement the proposed reinforcement layout on a
building site. To investigate the crack widths, the finite element program Atena was used. The
calculations was also made according to Eurocode 2 using a program called Concrete Section
as well as hand calculations. In the method chapter, different codes are presented for how to
calculate the required area of reinforcement and crack width. The mentioned codes are
Eurocode 2 (SS-EN 1992-1-1, 2005), BBK 04 (Boverket, 2004), B7 (Humble, 1969) and Model
Code 1990 (CEB-FIP, 1993). The codes BBK 04 and B7 are two old Swedish codes that were
replaced by Eurocode 2.
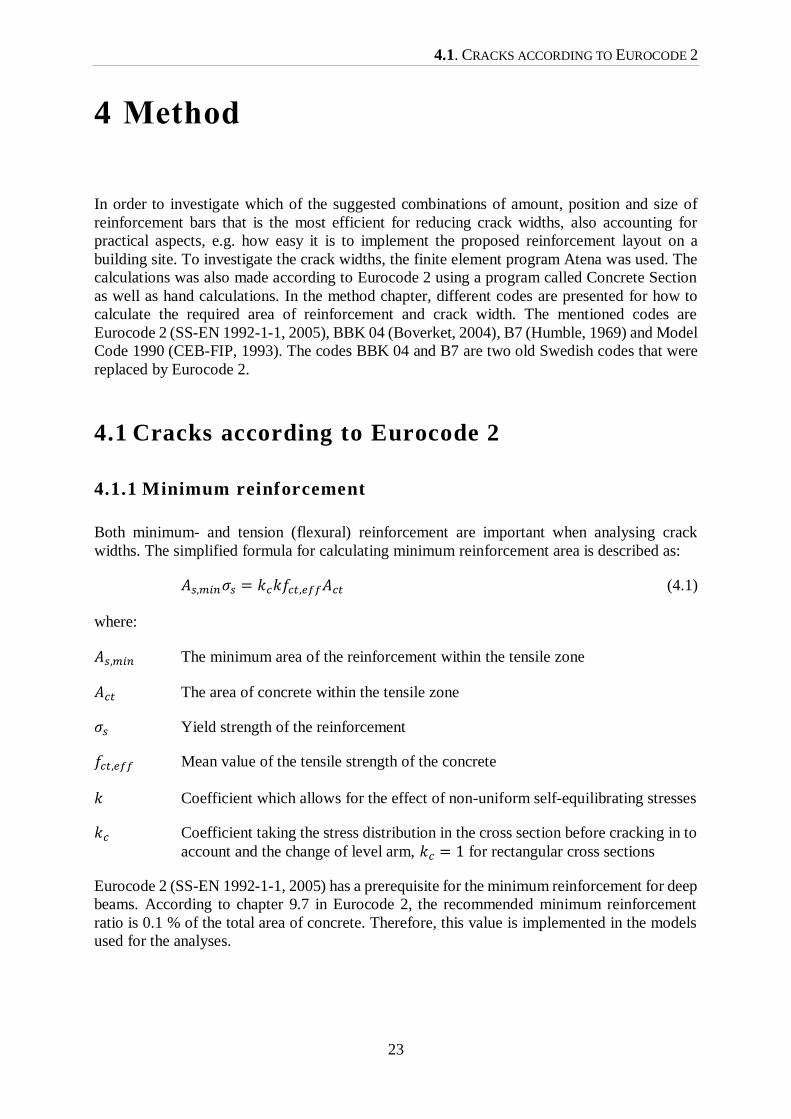
4.1 Cracks according to Eurocode 2
4.1.1 Minimum reinforcement
Both minimum- and tension (flexural) reinforcement are important when analysing crack
widths. The simplified formula for calculating minimum reinforcement area is described as:
𝐴𝑠,𝑚𝑖𝑛𝜎𝑠 = 𝑘𝑐𝑘𝑓𝑐𝑡,𝑒𝑓𝑓𝐴𝑐𝑡 (4.1)
where:
𝐴𝑠,𝑚𝑖𝑛 The minimum area of the reinforcement within the tensile zone
𝐴𝑐𝑡 The area of concrete within the tensile zone
𝜎𝑠 Yield strength of the reinforcement
𝑓𝑐𝑡,𝑒𝑓𝑓 Mean value of the tensile strength of the concrete
𝑘 Coefficient which allows for the effect of non-uniform self-equilibrating stresses
𝑘𝑐 Coefficient taking the stress distribution in the cross section before cracking in to
account and the change of level arm, 𝑘𝑐 = 1 for rectangular cross sections
Eurocode 2 (SS-EN 1992-1-1, 2005) has a prerequisite for the minimum reinforcement for deep
beams. According to chapter 9.7 in Eurocode 2, the recommended minimum reinforcement
ratio is 0.1 % of the total area of concrete. Therefore, this value is implemented in the models
used for the analyses.
4. THE EFFECT OF REINFORCEMENT CONFIGURATION ON CRACK WIDTHS IN CONCRETE DEEP BEAMS
24
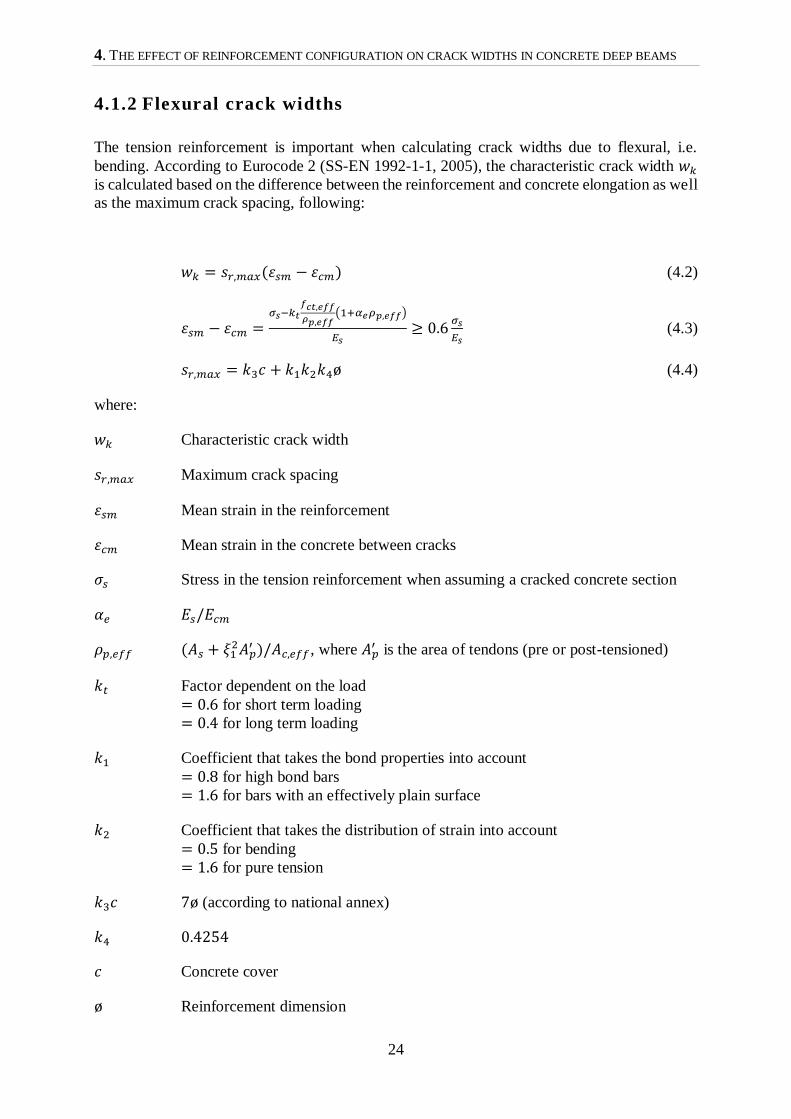
4.1.2 Flexural crack widths
The tension reinforcement is important when calculating crack widths due to flexural, i.e.
bending. According to Eurocode 2 (SS-EN 1992-1-1, 2005), the characteristic crack width 𝑤𝑘
is calculated based on the difference between the reinforcement and concrete elongation as well
as the maximum crack spacing, following:
𝑤𝑘 = 𝑠𝑟,𝑚𝑎𝑥(휀𝑠𝑚 − 휀𝑐𝑚) (4.2)
휀𝑠𝑚 − 휀𝑐𝑚 =𝜎𝑠−𝑘𝑡
𝑓𝑐𝑡,𝑒𝑓𝑓
𝜌𝑝,𝑒𝑓𝑓(1+𝛼𝑒𝜌𝑝,𝑒𝑓𝑓)
𝐸𝑠≥ 0.6
𝜎𝑠
𝐸𝑠 (4.3)
𝑠𝑟,𝑚𝑎𝑥 = 𝑘3𝑐 + 𝑘1𝑘2𝑘4ø (4.4)
where:
𝑤𝑘 Characteristic crack width
𝑠𝑟,𝑚𝑎𝑥 Maximum crack spacing
휀𝑠𝑚 Mean strain in the reinforcement
휀𝑐𝑚 Mean strain in the concrete between cracks
𝜎𝑠 Stress in the tension reinforcement when assuming a cracked concrete section
𝛼𝑒 𝐸𝑠/𝐸𝑐𝑚
𝜌𝑝,𝑒𝑓𝑓 (𝐴𝑠 + 𝜉12𝐴𝑝
′ )/𝐴𝑐,𝑒𝑓𝑓 , where 𝐴𝑝′ is the area of tendons (pre or post-tensioned)
𝑘𝑡 Factor dependent on the load
= 0.6 for short term loading
= 0.4 for long term loading
𝑘1 Coefficient that takes the bond properties into account
= 0.8 for high bond bars
= 1.6 for bars with an effectively plain surface
𝑘2 Coefficient that takes the distribution of strain into account
= 0.5 for bending
= 1.6 for pure tension
𝑘3𝑐 7ø (according to national annex)
𝑘4 0.4254
𝑐 Concrete cover
ø Reinforcement dimension
4.2. CRACKS ACCORDING TO BBK04
25
4.1.3 Concrete Section (WIN-Statik)
Concrete Section is an analytical program (StruSoft, 2015) for beam concrete sections in the
Ultimate and Serviceability Limit States. The program takes bending, shearing, axial forces and
torque into account. It also calculates the crack width 𝑤𝑘 as described in Eqs. (4.1-4.4) and thus
follows the Eurocode 2. The Swedish national standard for Eurocode 2 is also considered in the
program.
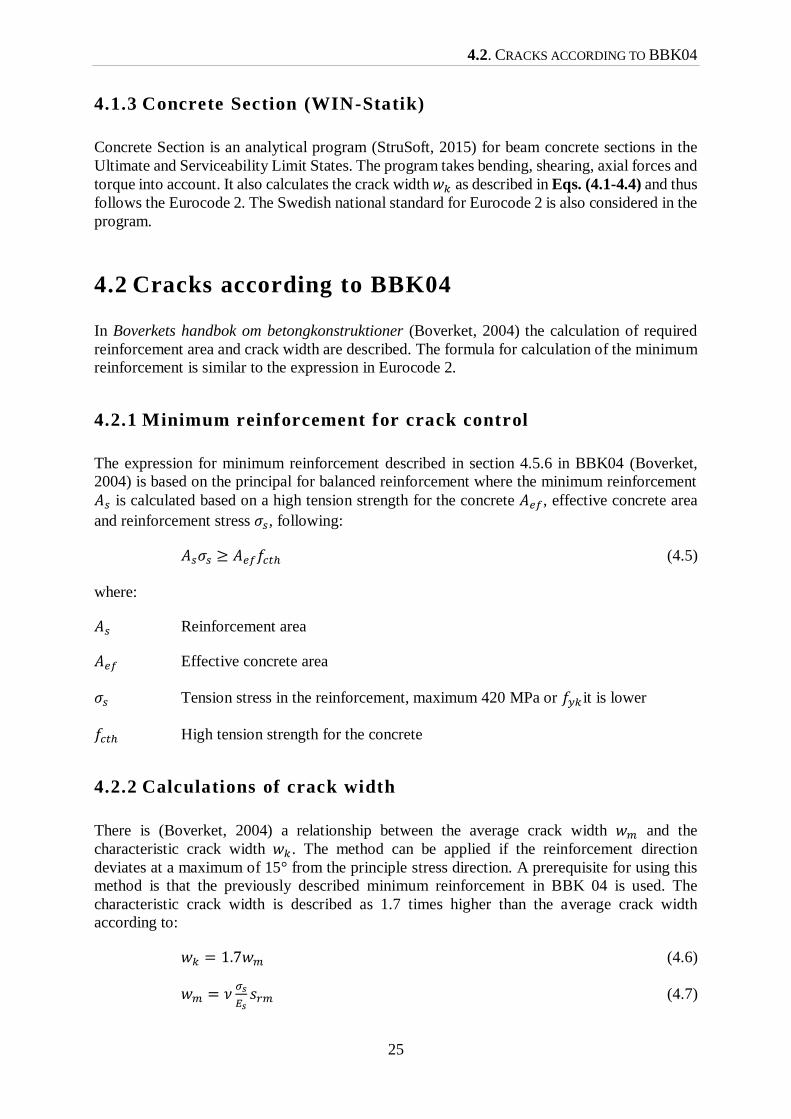
4.2 Cracks according to BBK04
In Boverkets handbok om betongkonstruktioner (Boverket, 2004) the calculation of required
reinforcement area and crack width are described. The formula for calculation of the minimum
reinforcement is similar to the expression in Eurocode 2.
4.2.1 Minimum reinforcement for crack control
The expression for minimum reinforcement described in section 4.5.6 in BBK04 (Boverket,
2004) is based on the principal for balanced reinforcement where the minimum reinforcement
𝐴𝑠 is calculated based on a high tension strength for the concrete 𝐴𝑒𝑓, effective concrete area
and reinforcement stress 𝜎𝑠, following:
𝐴𝑠𝜎𝑠 ≥ 𝐴𝑒𝑓𝑓𝑐𝑡ℎ (4.5)
where:
𝐴𝑠 Reinforcement area
𝐴𝑒𝑓 Effective concrete area
𝜎𝑠 Tension stress in the reinforcement, maximum 420 MPa or 𝑓𝑦𝑘 it is lower
𝑓𝑐𝑡ℎ High tension strength for the concrete
4.2.2 Calculations of crack width
There is (Boverket, 2004) a relationship between the average crack width 𝑤𝑚 and the
characteristic crack width 𝑤𝑘 . The method can be applied if the reinforcement direction
deviates at a maximum of 15° from the principle stress direction. A prerequisite for using this
method is that the previously described minimum reinforcement in BBK 04 is used. The
characteristic crack width is described as 1.7 times higher than the average crack width
according to:
𝑤𝑘 = 1.7𝑤𝑚 (4.6)
𝑤𝑚 = 𝜈𝜎𝑠
𝐸𝑠𝑠𝑟𝑚 (4.7)
4. THE EFFECT OF REINFORCEMENT CONFIGURATION ON CRACK WIDTHS IN CONCRETE DEEP BEAMS
26
𝜈 = 1 −𝛽
2.5𝜅1∙
𝜎𝑠𝑟
𝜎𝑠 if 𝜈 ≥ 0.4 (4.8)
where:
𝑤𝑚 Mean crack width
𝑤𝑘 Characteristic crack width
𝐸𝑠 The modulus of elasticity of reinforcement (200 GPa)
𝑠𝑟𝑚 The mean value of the crack spacing
𝛽 Coefficient that accounts for the duration of the load
𝜅1 Coefficient that accounts the adhesion of the reinforcement
𝜈 Coefficient that accounts for the tensioned concrete between cracks
𝜎𝑠 The stress in the reinforcement in the crack
𝜎𝑠𝑟 The stress in the reinforcement in the crack directly after cracking
The expression for the crack width is not explicitly described in Eurocode 2. However,
according to the Swedish Concrete Association's Guide to Eurocode 2 (Svenska
Betongföreningen, 2010) the factor 1.7 is included in the expression for the crack
distance 𝑠𝑟,𝑚𝑎𝑥, see Eq. (4.4).
4.3 Calculations of the crack width according to B7
The crack width due to pure bending is calculated according to B7 Bestämmelser för
betongkonstruktioner, which is an old Swedish guideline for concrete structures. The guideline
B7 was valid long before BBK 04.
The nominal maximum crack width 𝛿 in the same height with the tensile reinforcement at pure
bending should be calculated based on the formula according to Jonsson, Osterman, Wästlund,
see Eq. (4.9) (Humble, 1969).
𝛿 = 𝑘 ∙ 𝑑 (𝑊𝑏
𝐴𝑎∙ℎ∙
𝜎𝑎
𝐸𝑎)
23⁄
(4.9)
where:
𝑘 Coefficient according to Table 4.1
𝑑 The diameter of the reinforcement bar
4.4. CRACKS ACCORDING TO MODEL CODE 1990
27
𝑊𝑏 The plastic bending resistance of the concrete cross section considering the
tensioned edge without taking the reinforcement into account and with the
prerequisite that the entire cross section is un-cracked.
𝐴𝑎 The area of the tensile reinforcement
ℎ The effective height
𝜎𝑎 Reinforcement stress assuming the cracked concrete cross section
𝐸𝑎 Modulus of elasticity
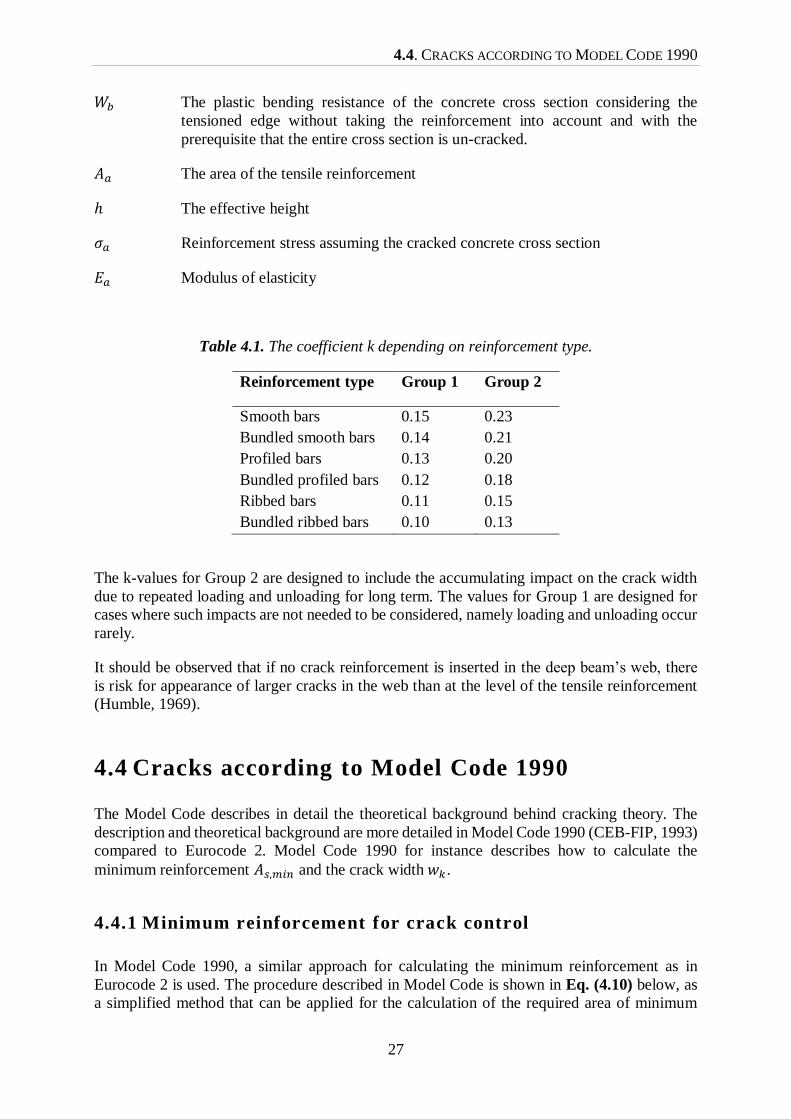
Table 4.1. The coefficient k depending on reinforcement type.
Reinforcement type Group 1 Group 2
Smooth bars 0.15 0.23
Bundled smooth bars 0.14 0.21
Profiled bars 0.13 0.20
Bundled profiled bars 0.12 0.18
Ribbed bars 0.11 0.15
Bundled ribbed bars 0.10 0.13
The k-values for Group 2 are designed to include the accumulating impact on the crack width
due to repeated loading and unloading for long term. The values for Group 1 are designed for
cases where such impacts are not needed to be considered, namely loading and unloading occur
rarely.
It should be observed that if no crack reinforcement is inserted in the deep beam’s web, there
is risk for appearance of larger cracks in the web than at the level of the tensile reinforcement
(Humble, 1969).
4.4 Cracks according to Model Code 1990
The Model Code describes in detail the theoretical background behind cracking theory. The
description and theoretical background are more detailed in Model Code 1990 (CEB-FIP, 1993)
compared to Eurocode 2. Model Code 1990 for instance describes how to calculate the
minimum reinforcement 𝐴𝑠,𝑚𝑖𝑛 and the crack width 𝑤𝑘 .
4.4.1 Minimum reinforcement for crack control
In Model Code 1990, a similar approach for calculating the minimum reinforcement as in
Eurocode 2 is used. The procedure described in Model Code is shown in Eq. (4.10) below, as
a simplified method that can be applied for the calculation of the required area of minimum
4. THE EFFECT OF REINFORCEMENT CONFIGURATION ON CRACK WIDTHS IN CONCRETE DEEP BEAMS
28
reinforcement within the tensioned concrete zone. The area 𝐴𝑠,𝑚𝑖𝑛 is considered dependent of
the tensile strength of concrete when the first crack occurs, for the stress 𝑓𝑐𝑡,𝑚𝑎𝑥. The area of
the tensioned concrete zone is 𝐴𝑐𝑡 and the concrete yield stress 𝜎𝑠2.
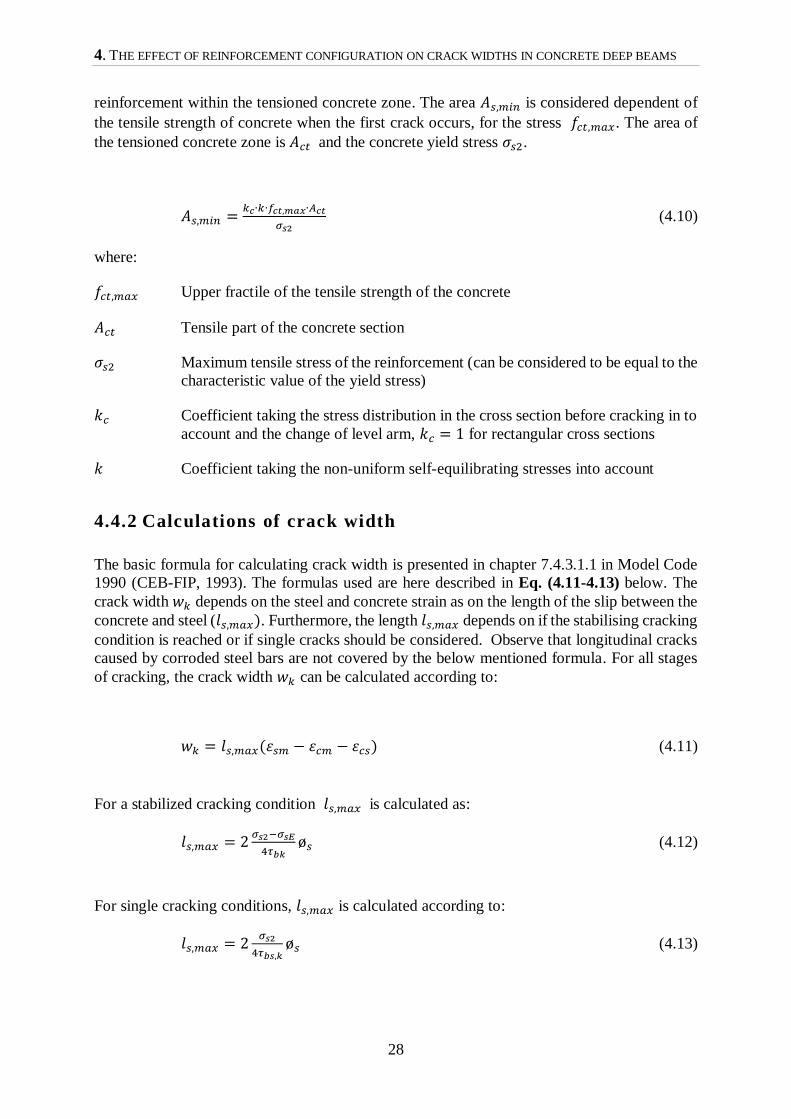
𝐴𝑠,𝑚𝑖𝑛 =𝑘𝑐∙𝑘∙𝑓𝑐𝑡,𝑚𝑎𝑥∙𝐴𝑐𝑡
𝜎𝑠2 (4.10)
where:
𝑓𝑐𝑡,𝑚𝑎𝑥 Upper fractile of the tensile strength of the concrete
𝐴𝑐𝑡 Tensile part of the concrete section
𝜎𝑠2 Maximum tensile stress of the reinforcement (can be considered to be equal to the
characteristic value of the yield stress)
𝑘𝑐 Coefficient taking the stress distribution in the cross section before cracking in to
account and the change of level arm, 𝑘𝑐 = 1 for rectangular cross sections
𝑘 Coefficient taking the non-uniform self-equilibrating stresses into account
4.4.2 Calculations of crack width
The basic formula for calculating crack width is presented in chapter 7.4.3.1.1 in Model Code
1990 (CEB-FIP, 1993). The formulas used are here described in Eq. (4.11-4.13) below. The
crack width 𝑤𝑘 depends on the steel and concrete strain as on the length of the slip between the
concrete and steel (𝑙𝑠,𝑚𝑎𝑥). Furthermore, the length 𝑙𝑠,𝑚𝑎𝑥 depends on if the stabilising cracking
condition is reached or if single cracks should be considered. Observe that longitudinal cracks
caused by corroded steel bars are not covered by the below mentioned formula. For all stages
of cracking, the crack width 𝑤𝑘 can be calculated according to:
𝑤𝑘 = 𝑙𝑠,𝑚𝑎𝑥(휀𝑠𝑚 − 휀𝑐𝑚 − 휀𝑐𝑠) (4.11)
For a stabilized cracking condition 𝑙𝑠,𝑚𝑎𝑥 is calculated as:
𝑙𝑠,𝑚𝑎𝑥 = 2𝜎𝑠2−𝜎𝑠𝐸
4𝜏𝑏𝑘ø𝑠 (4.12)
For single cracking conditions, 𝑙𝑠,𝑚𝑎𝑥 is calculated according to:
𝑙𝑠,𝑚𝑎𝑥 = 2𝜎𝑠2
4𝜏𝑏𝑠,𝑘ø𝑠 (4.13)
4.5. ATENA 2D
29
where:
𝑤𝑘 Characteristic crack width
𝑙𝑠,𝑚𝑎𝑥 The length over which slip between steel and concrete occurs
휀𝑠𝑚 Mean steel strain of the reinforcement within 𝑙𝑠,𝑚𝑎𝑥
휀𝑐𝑚 Mean strain of the concrete within 𝑙𝑠,𝑚𝑎𝑥
휀𝑐𝑠 Strain of the concrete due to shrinkage
𝜎𝑠2 Reinforcement stress at the crack
𝜎𝑠𝐸 Reinforcement stress at the point of zero slip
ø𝑠 Reinforcement diameter
𝜏𝑏𝑘 Lower fractile value of the mean bond stress. Assumed to be 1.8 ∙ 𝑓𝑐𝑡𝑚 for
stabilized cracking and single cracking for short term load. Assumed to be 1.35 ∙𝑓𝑐𝑡𝑚 for single cracking for long term load.
4.5 Atena 2D
The program Atena (Červenka, et al., 2011) is based on nonlinear finite element analysis, a
method that numerically solves differential equations. The structure is divided into elements
which are connected by nodes. Between those nodes a solution is interpolated using shape
functions that approximate the displacement between the nodes. The accuracy of the solution
depends on this interpolation, and thus also on the used mesh size, linear or quadratic
interpolation and size of the analysis time step. Concrete behaviour is modelled in a material
model called SBeta, in which a smeared crack approach is used, describing cracking of
tensioned and compressed concrete based on non-linear fracture mechanics. Many of the
calculations in Atena are based on Model Code 1990 (Alavala, 2008).
4.5.1 Smeared crack model
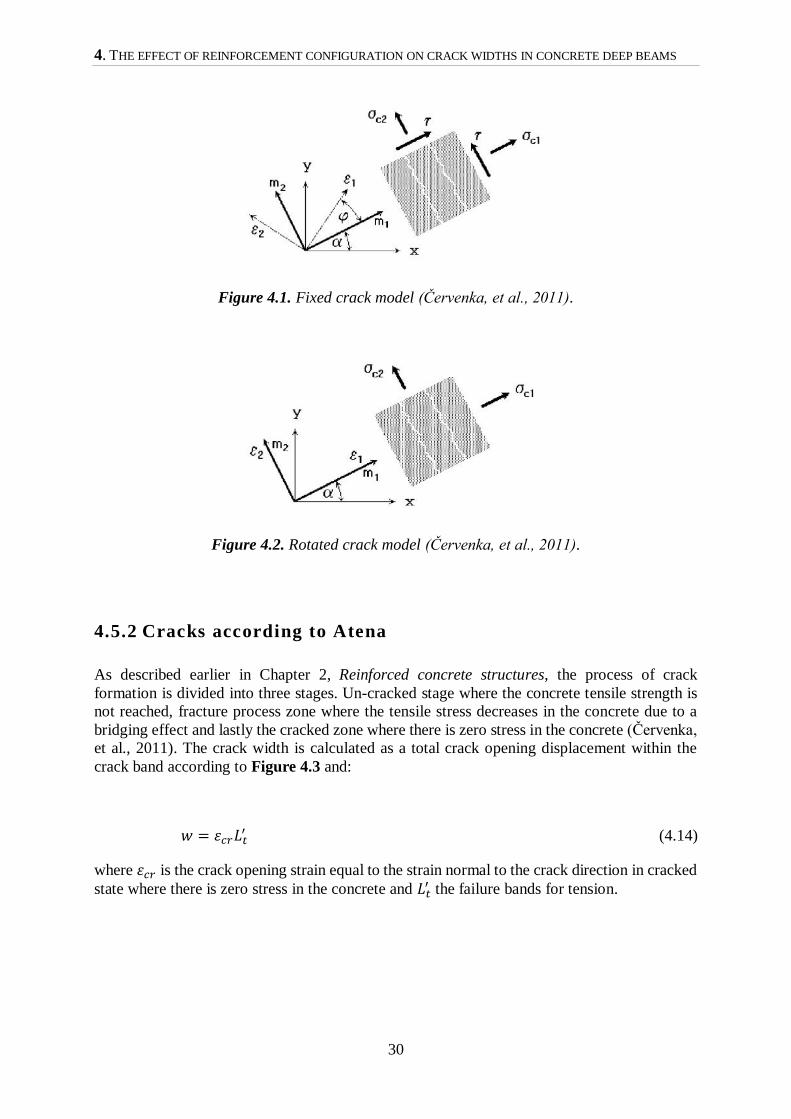
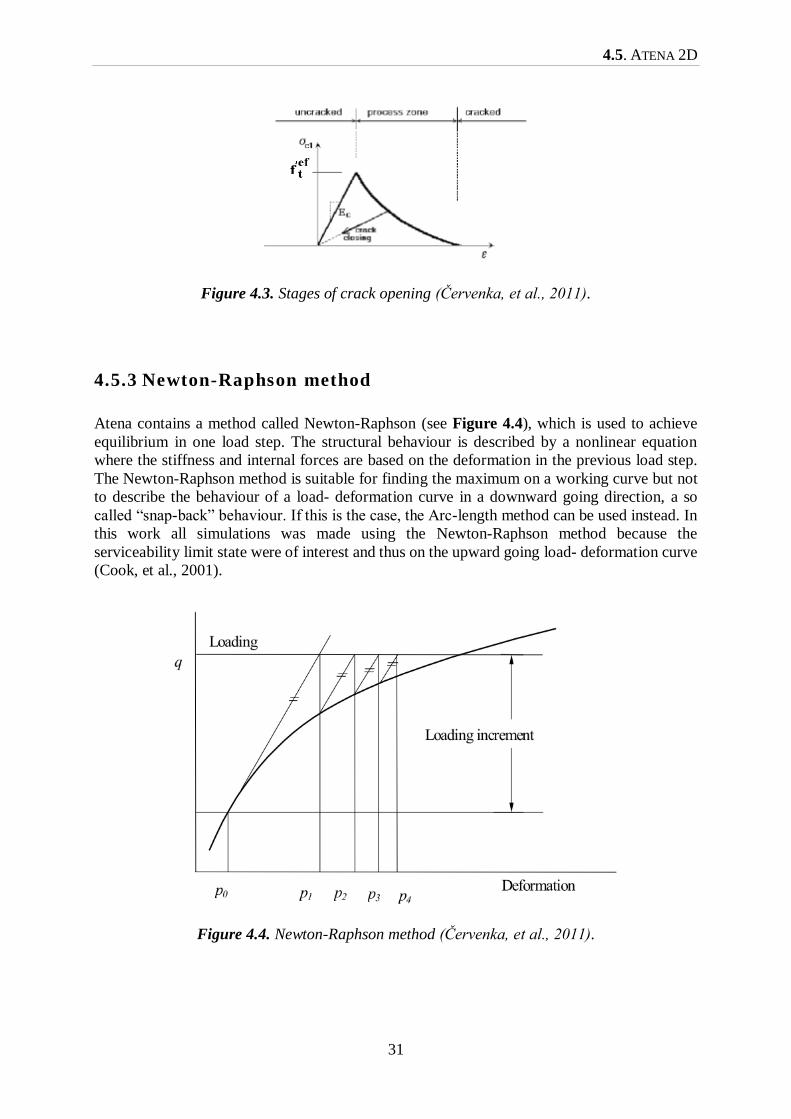
In Atena, there are two models of Smeared Crack type, namely, a fixed crack model and a
rotated crack model. For the fixed crack model the crack directions are given by the direction
the principal stresses of the model has at the moment of cracking and after the first crack the
direction is fixed. Rotated crack model means that the crack direction also rotates if the principal
strain axes rotates during loading (Červenka, et al., 2011). The two models are illustrated in
Figures 4.1 and 4.2.
4. THE EFFECT OF REINFORCEMENT CONFIGURATION ON CRACK WIDTHS IN CONCRETE DEEP BEAMS
30
Figure 4.1. Fixed crack model (Červenka, et al., 2011).
Figure 4.2. Rotated crack model (Červenka, et al., 2011).
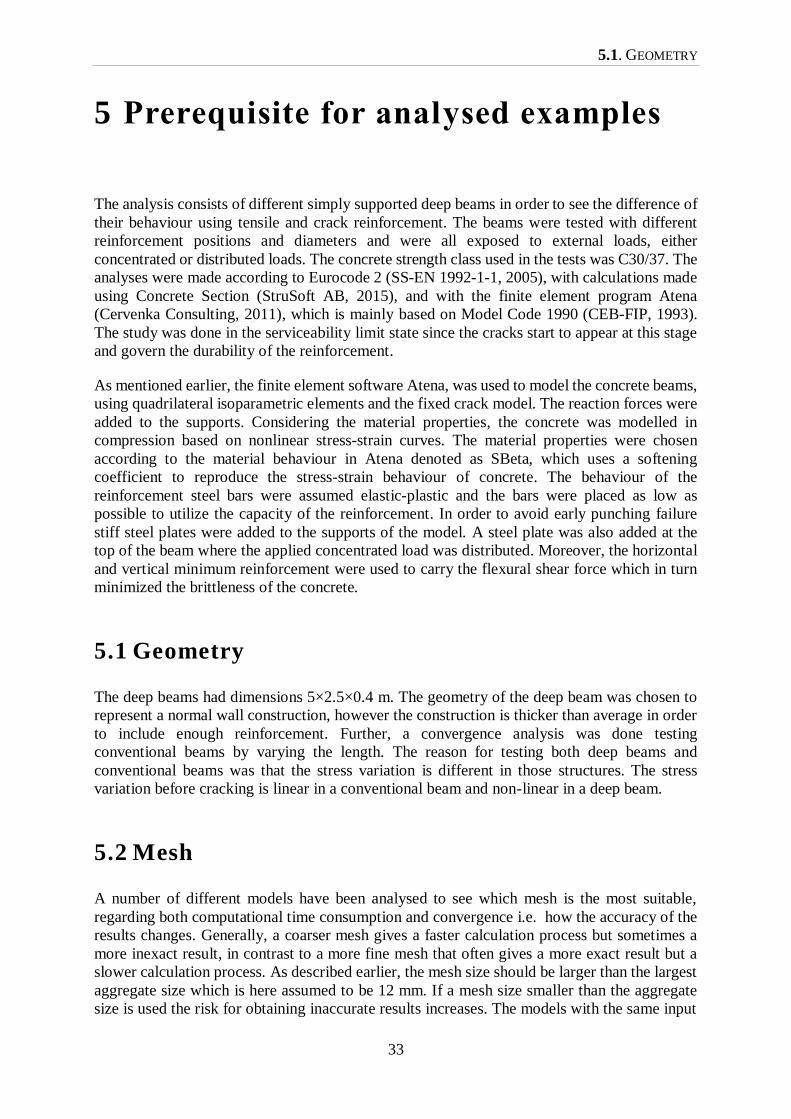
4.5.2 Cracks according to Atena
As described earlier in Chapter 2, Reinforced concrete structures, the process of crack
formation is divided into three stages. Un-cracked stage where the concrete tensile strength is
not reached, fracture process zone where the tensile stress decreases in the concrete due to a
bridging effect and lastly the cracked zone where there is zero stress in the concrete (Červenka,
et al., 2011). The crack width is calculated as a total crack opening displacement within the
crack band according to Figure 4.3 and:
𝑤 = 휀𝑐𝑟𝐿𝑡′ (4.14)
where 휀𝑐𝑟 is the crack opening strain equal to the strain normal to the crack direction in cracked
state where there is zero stress in the concrete and 𝐿𝑡′ the failure bands for tension.
4.5. ATENA 2D
31
Figure 4.3. Stages of crack opening (Červenka, et al., 2011).
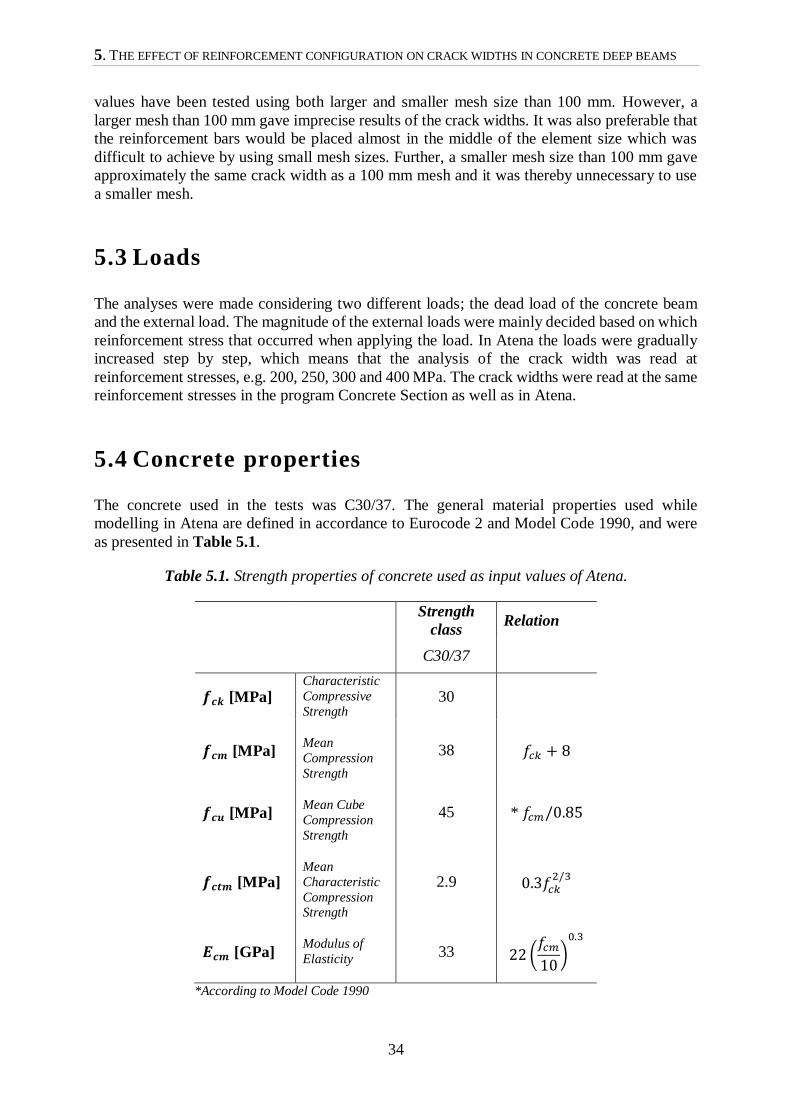
4.5.3 Newton-Raphson method
Atena contains a method called Newton-Raphson (see Figure 4.4), which is used to achieve
equilibrium in one load step. The structural behaviour is described by a nonlinear equation
where the stiffness and internal forces are based on the deformation in the previous load step.
The Newton-Raphson method is suitable for finding the maximum on a working curve but not
to describe the behaviour of a load- deformation curve in a downward going direction, a so
called “snap-back” behaviour. If this is the case, the Arc-length method can be used instead. In
this work all simulations was made using the Newton-Raphson method because the
serviceability limit state were of interest and thus on the upward going load- deformation curve
(Cook, et al., 2001).
Figure 4.4. Newton-Raphson method (Červenka, et al., 2011).

4. THE EFFECT OF REINFORCEMENT CONFIGURATION ON CRACK WIDTHS IN CONCRETE DEEP BEAMS
32
5.1. GEOMETRY
33
5 Prerequisite for analysed examples
The analysis consists of different simply supported deep beams in order to see the difference of
their behaviour using tensile and crack reinforcement. The beams were tested with different
reinforcement positions and diameters and were all exposed to external loads, either
concentrated or distributed loads. The concrete strength class used in the tests was C30/37. The
analyses were made according to Eurocode 2 (SS-EN 1992-1-1, 2005), with calculations made
using Concrete Section (StruSoft AB, 2015), and with the finite element program Atena
(Cervenka Consulting, 2011), which is mainly based on Model Code 1990 (CEB-FIP, 1993).
The study was done in the serviceability limit state since the cracks start to appear at this stage
and govern the durability of the reinforcement.
As mentioned earlier, the finite element software Atena, was used to model the concrete beams,
using quadrilateral isoparametric elements and the fixed crack model. The reaction forces were
added to the supports. Considering the material properties, the concrete was modelled in
compression based on nonlinear stress-strain curves. The material properties were chosen
according to the material behaviour in Atena denoted as SBeta, which uses a softening
coefficient to reproduce the stress-strain behaviour of concrete. The behaviour of the
reinforcement steel bars were assumed elastic-plastic and the bars were placed as low as
possible to utilize the capacity of the reinforcement. In order to avoid early punching failure
stiff steel plates were added to the supports of the model. A steel plate was also added at the
top of the beam where the applied concentrated load was distributed. Moreover, the horizontal
and vertical minimum reinforcement were used to carry the flexural shear force which in turn
minimized the brittleness of the concrete.
5.1 Geometry
The deep beams had dimensions 5×2.5×0.4 m. The geometry of the deep beam was chosen to
represent a normal wall construction, however the construction is thicker than average in order
to include enough reinforcement. Further, a convergence analysis was done testing
conventional beams by varying the length. The reason for testing both deep beams and
conventional beams was that the stress variation is different in those structures. The stress
variation before cracking is linear in a conventional beam and non-linear in a deep beam.
5.2 Mesh
A number of different models have been analysed to see which mesh is the most suitable,
regarding both computational time consumption and convergence i.e. how the accuracy of the
results changes. Generally, a coarser mesh gives a faster calculation process but sometimes a
more inexact result, in contrast to a more fine mesh that often gives a more exact result but a
slower calculation process. As described earlier, the mesh size should be larger than the largest
aggregate size which is here assumed to be 12 mm. If a mesh size smaller than the aggregate
size is used the risk for obtaining inaccurate results increases. The models with the same input
5. THE EFFECT OF REINFORCEMENT CONFIGURATION ON CRACK WIDTHS IN CONCRETE DEEP BEAMS
34
values have been tested using both larger and smaller mesh size than 100 mm. However, a
larger mesh than 100 mm gave imprecise results of the crack widths. It was also preferable that
the reinforcement bars would be placed almost in the middle of the element size which was
difficult to achieve by using small mesh sizes. Further, a smaller mesh size than 100 mm gave
approximately the same crack width as a 100 mm mesh and it was thereby unnecessary to use
a smaller mesh.
5.3 Loads
The analyses were made considering two different loads; the dead load of the concrete beam
and the external load. The magnitude of the external loads were mainly decided based on which
reinforcement stress that occurred when applying the load. In Atena the loads were gradually
increased step by step, which means that the analysis of the crack width was read at
reinforcement stresses, e.g. 200, 250, 300 and 400 MPa. The crack widths were read at the same
reinforcement stresses in the program Concrete Section as well as in Atena.
5.4 Concrete properties
The concrete used in the tests was C30/37. The general material properties used while
modelling in Atena are defined in accordance to Eurocode 2 and Model Code 1990, and were
as presented in Table 5.1.
Table 5.1. Strength properties of concrete used as input values of Atena.
Strength
class Relation
C30/37
𝒇𝒄𝒌 [MPa] Characteristic
Compressive
Strength
30
𝒇𝒄𝒎 [MPa] Mean
Compression
Strength
38 𝑓𝑐𝑘 + 8
𝒇𝒄𝒖 [MPa] Mean Cube
Compression
Strength
45 * 𝑓𝑐𝑚/0.85
𝒇𝒄𝒕𝒎 [MPa] Mean
Characteristic
Compression Strength
2.9 0.3𝑓𝑐𝑘2/3
𝑬𝒄𝒎 [GPa] Modulus of
Elasticity 33 22 (
𝑓𝑐𝑚
10)
0.3
*According to Model Code 1990
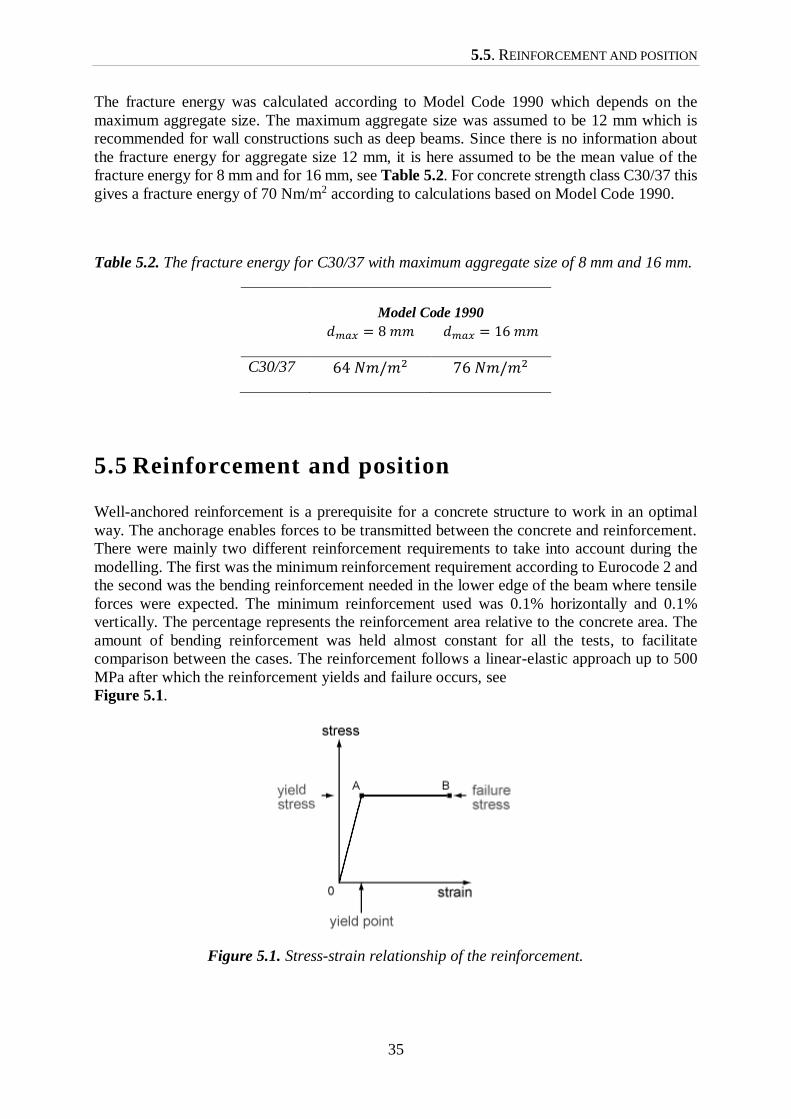
5.5. REINFORCEMENT AND POSITION
35
The fracture energy was calculated according to Model Code 1990 which depends on the
maximum aggregate size. The maximum aggregate size was assumed to be 12 mm which is
recommended for wall constructions such as deep beams. Since there is no information about
the fracture energy for aggregate size 12 mm, it is here assumed to be the mean value of the
fracture energy for 8 mm and for 16 mm, see Table 5.2. For concrete strength class C30/37 this
gives a fracture energy of 70 Nm/m2 according to calculations based on Model Code 1990.
Table 5.2. The fracture energy for C30/37 with maximum aggregate size of 8 mm and 16 mm.
Model Code 1990
𝑑𝑚𝑎𝑥 = 8 𝑚𝑚 𝑑𝑚𝑎𝑥 = 16 𝑚𝑚
C30/37 64 𝑁𝑚/𝑚2 76 𝑁𝑚/𝑚2
5.5 Reinforcement and position
Well-anchored reinforcement is a prerequisite for a concrete structure to work in an optimal
way. The anchorage enables forces to be transmitted between the concrete and reinforcement.
There were mainly two different reinforcement requirements to take into account during the
modelling. The first was the minimum reinforcement requirement according to Eurocode 2 and
the second was the bending reinforcement needed in the lower edge of the beam where tensile
forces were expected. The minimum reinforcement used was 0.1% horizontally and 0.1%
vertically. The percentage represents the reinforcement area relative to the concrete area. The
amount of bending reinforcement was held almost constant for all the tests, to facilitate
comparison between the cases. The reinforcement follows a linear-elastic approach up to 500
MPa after which the reinforcement yields and failure occurs, see
Figure 5.1.
Figure 5.1. Stress-strain relationship of the reinforcement.
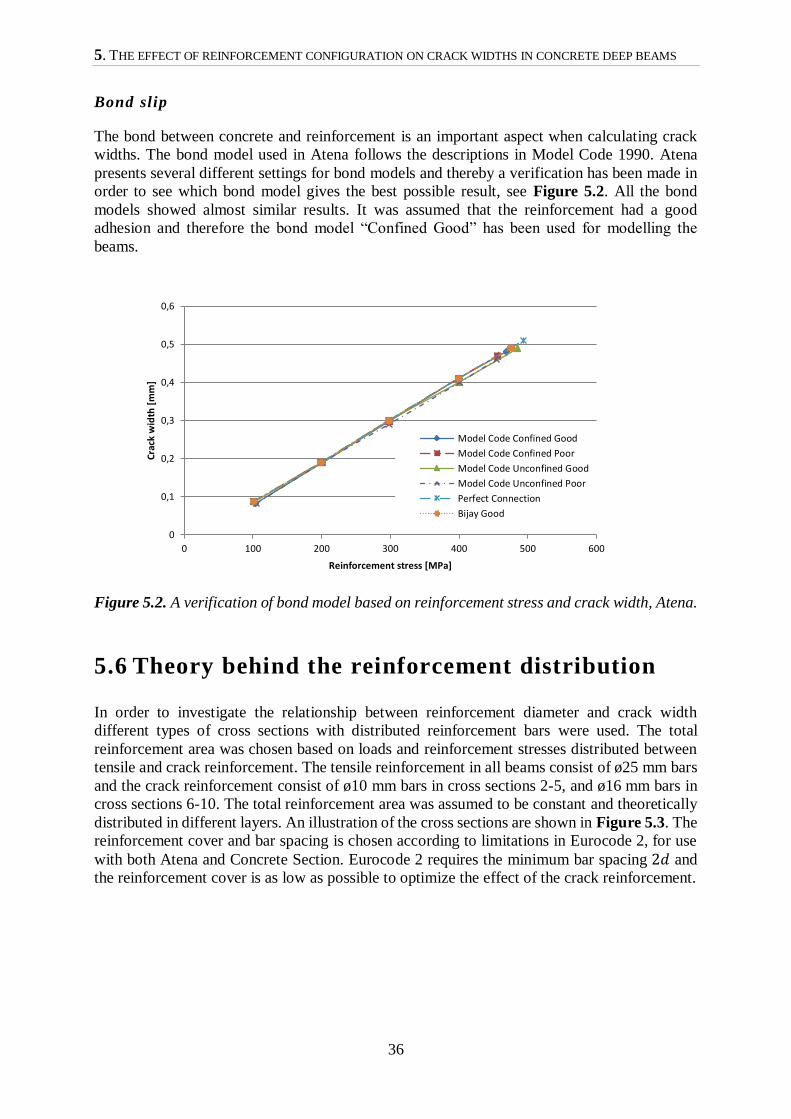
5. THE EFFECT OF REINFORCEMENT CONFIGURATION ON CRACK WIDTHS IN CONCRETE DEEP BEAMS
36
Bond slip
The bond between concrete and reinforcement is an important aspect when calculating crack
widths. The bond model used in Atena follows the descriptions in Model Code 1990. Atena
presents several different settings for bond models and thereby a verification has been made in
order to see which bond model gives the best possible result, see Figure 5.2. All the bond
models showed almost similar results. It was assumed that the reinforcement had a good
adhesion and therefore the bond model “Confined Good” has been used for modelling the
beams.
Figure 5.2. A verification of bond model based on reinforcement stress and crack width, Atena.
5.6 Theory behind the reinforcement distribution
In order to investigate the relationship between reinforcement diameter and crack width
different types of cross sections with distributed reinforcement bars were used. The total
reinforcement area was chosen based on loads and reinforcement stresses distributed between
tensile and crack reinforcement. The tensile reinforcement in all beams consist of ø25 mm bars
and the crack reinforcement consist of ø10 mm bars in cross sections 2-5, and ø16 mm bars in
cross sections 6-10. The total reinforcement area was assumed to be constant and theoretically
distributed in different layers. An illustration of the cross sections are shown in Figure 5.3. The
reinforcement cover and bar spacing is chosen according to limitations in Eurocode 2, for use
with both Atena and Concrete Section. Eurocode 2 requires the minimum bar spacing 2𝑑 and
the reinforcement cover is as low as possible to optimize the effect of the crack reinforcement.
0
0,1
0,2
0,3
0,4
0,5
0,6
0 100 200 300 400 500 600
Cra
ck w
idth
[m
m]
Reinforcement stress [MPa]
Model Code Confined Good
Model Code Confined Poor
Model Code Unconfined Good
Model Code Unconfined Poor
Perfect Connection
Bijay Good
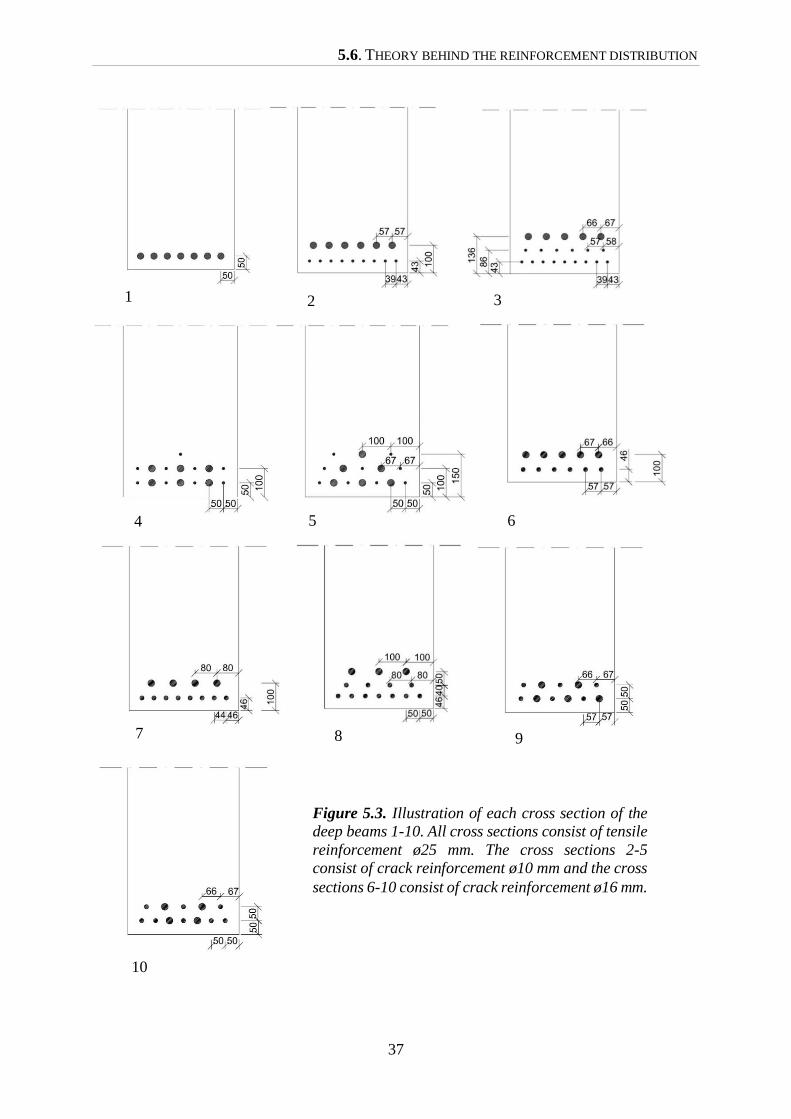
5.6. THEORY BEHIND THE REINFORCEMENT DISTRIBUTION
37
Figure 5.3. Illustration of each cross section of the
deep beams 1-10. All cross sections consist of tensile
reinforcement ø25 mm. The cross sections 2-5
consist of crack reinforcement ø10 mm and the cross
sections 6-10 consist of crack reinforcement ø16 mm.
1 2 3
4 5 6
7 8 9
10

5. THE EFFECT OF REINFORCEMENT CONFIGURATION ON CRACK WIDTHS IN CONCRETE DEEP BEAMS
38
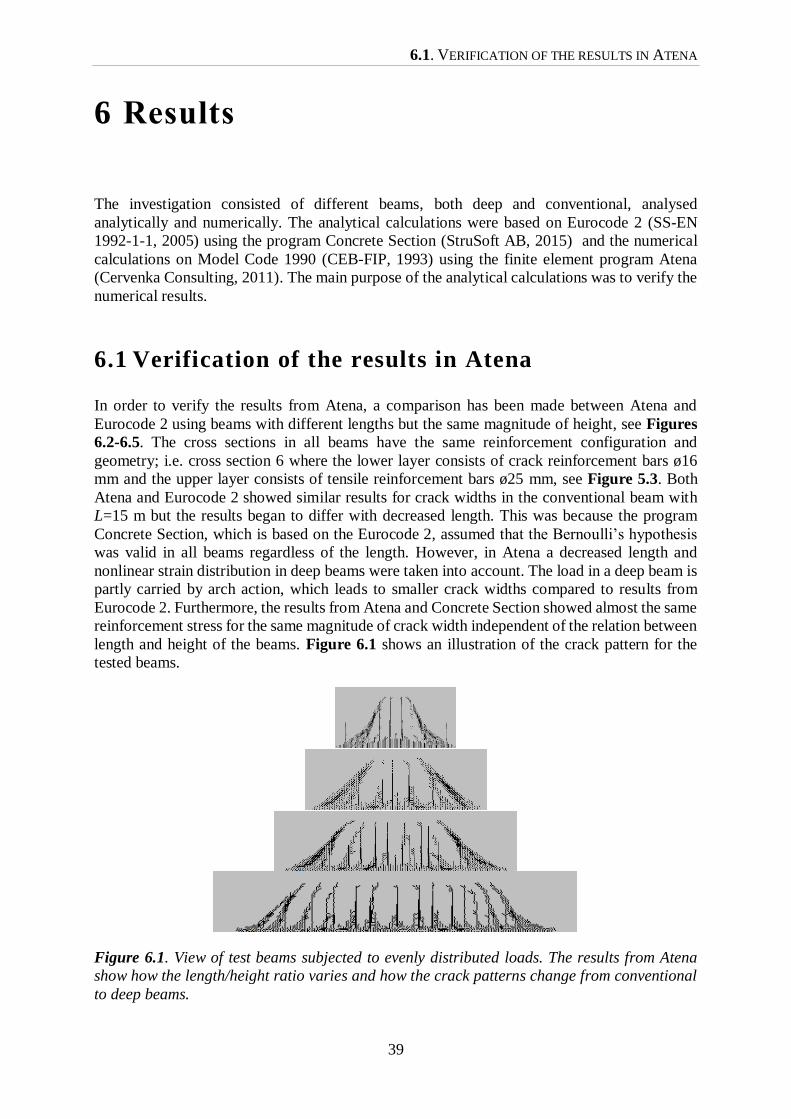
6.1. VERIFICATION OF THE RESULTS IN ATENA
39
6 Results
The investigation consisted of different beams, both deep and conventional, analysed
analytically and numerically. The analytical calculations were based on Eurocode 2 (SS-EN
1992-1-1, 2005) using the program Concrete Section (StruSoft AB, 2015) and the numerical
calculations on Model Code 1990 (CEB-FIP, 1993) using the finite element program Atena
(Cervenka Consulting, 2011). The main purpose of the analytical calculations was to verify the
numerical results.
6.1 Verification of the results in Atena
In order to verify the results from Atena, a comparison has been made between Atena and
Eurocode 2 using beams with different lengths but the same magnitude of height, see Figures
6.2-6.5. The cross sections in all beams have the same reinforcement configuration and
geometry; i.e. cross section 6 where the lower layer consists of crack reinforcement bars ø16
mm and the upper layer consists of tensile reinforcement bars ø25 mm, see Figure 5.3. Both
Atena and Eurocode 2 showed similar results for crack widths in the conventional beam with
L=15 m but the results began to differ with decreased length. This was because the program
Concrete Section, which is based on the Eurocode 2, assumed that the Bernoulli’s hypothesis
was valid in all beams regardless of the length. However, in Atena a decreased length and
nonlinear strain distribution in deep beams were taken into account. The load in a deep beam is
partly carried by arch action, which leads to smaller crack widths compared to results from
Eurocode 2. Furthermore, the results from Atena and Concrete Section showed almost the same
reinforcement stress for the same magnitude of crack width independent of the relation between
length and height of the beams. Figure 6.1 shows an illustration of the crack pattern for the
tested beams.
Figure 6.1. View of test beams subjected to evenly distributed loads. The results from Atena
show how the length/height ratio varies and how the crack patterns change from conventional
to deep beams.
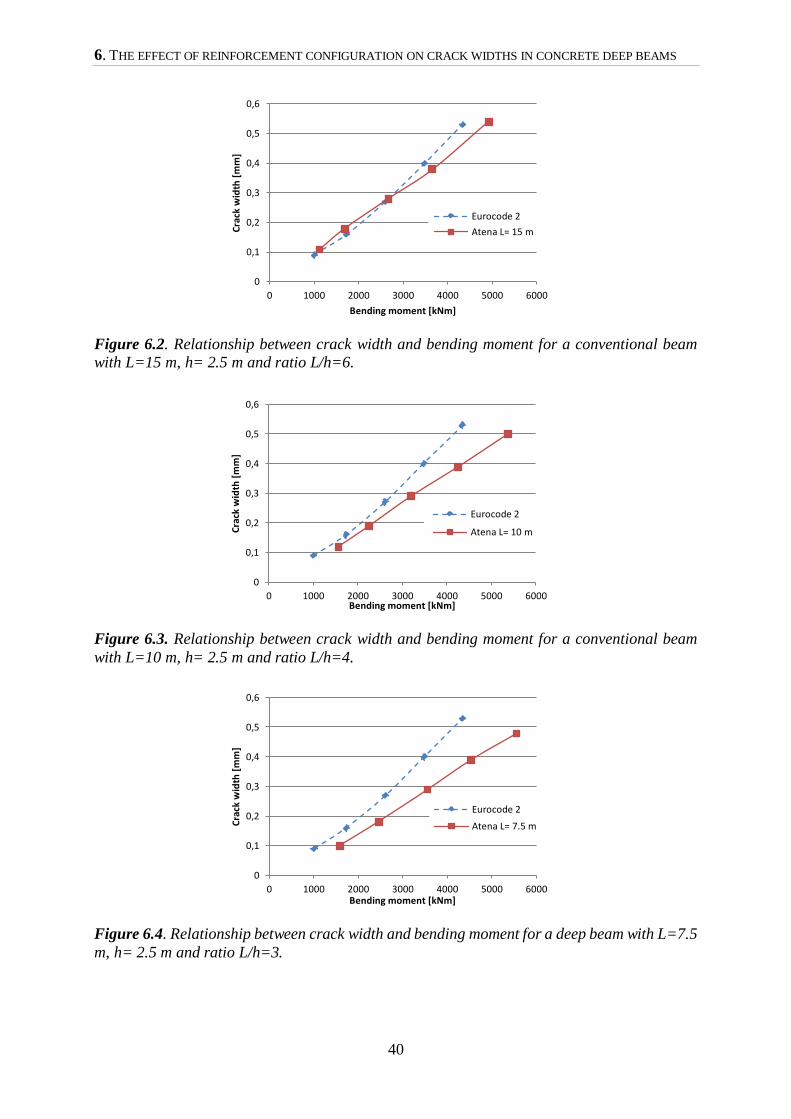
6. THE EFFECT OF REINFORCEMENT CONFIGURATION ON CRACK WIDTHS IN CONCRETE DEEP BEAMS
40
Figure 6.2. Relationship between crack width and bending moment for a conventional beam
with L=15 m, h= 2.5 m and ratio L/h=6.
Figure 6.3. Relationship between crack width and bending moment for a conventional beam
with L=10 m, h= 2.5 m and ratio L/h=4.
Figure 6.4. Relationship between crack width and bending moment for a deep beam with L=7.5
m, h= 2.5 m and ratio L/h=3.
0
0,1
0,2
0,3
0,4
0,5
0,6
0 1000 2000 3000 4000 5000 6000
Cra
ck w
idth
[m
m]
Bending moment [kNm]
Eurocode 2
Atena L= 15 m
0
0,1
0,2
0,3
0,4
0,5
0,6
0 1000 2000 3000 4000 5000 6000
Cra
ck w
idth
[m
m]
Bending moment [kNm]
Eurocode 2
Atena L= 10 m
0
0,1
0,2
0,3
0,4
0,5
0,6
0 1000 2000 3000 4000 5000 6000
Cra
ck w
idth
[m
m]
Bending moment [kNm]
Eurocode 2
Atena L= 7.5 m
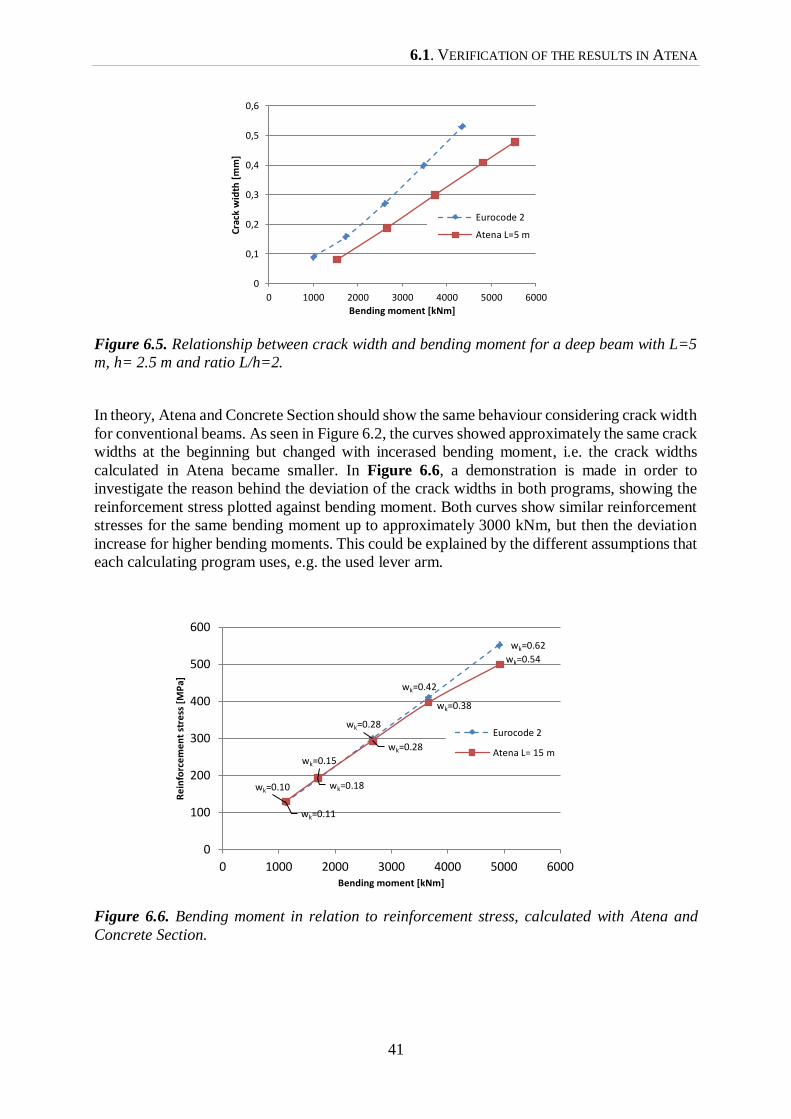
6.1. VERIFICATION OF THE RESULTS IN ATENA
41
Figure 6.5. Relationship between crack width and bending moment for a deep beam with L=5
m, h= 2.5 m and ratio L/h=2.
In theory, Atena and Concrete Section should show the same behaviour considering crack width
for conventional beams. As seen in Figure 6.2, the curves showed approximately the same crack
widths at the beginning but changed with incerased bending moment, i.e. the crack widths
calculated in Atena became smaller. In Figure 6.6, a demonstration is made in order to
investigate the reason behind the deviation of the crack widths in both programs, showing the
reinforcement stress plotted against bending moment. Both curves show similar reinforcement
stresses for the same bending moment up to approximately 3000 kNm, but then the deviation
increase for higher bending moments. This could be explained by the different assumptions that
each calculating program uses, e.g. the used lever arm.
Figure 6.6. Bending moment in relation to reinforcement stress, calculated with Atena and
Concrete Section.
0
0,1
0,2
0,3
0,4
0,5
0,6
0 1000 2000 3000 4000 5000 6000
Cra
ck w
idth
[m
m]
Bending moment [kNm]
Eurocode 2
Atena L=5 m
wk=0.10
wk=0.15
wk=0.28
wk=0.42
wk=0.62
wk=0.11
wk=0.18
wk=0.28
wk=0.38
wk=0.54
0
100
200
300
400
500
600
0 1000 2000 3000 4000 5000 6000
Re
info
rce
me
nt
stre
ss [
MP
a]
Bending moment [kNm]
Eurocode 2
Atena L= 15 m
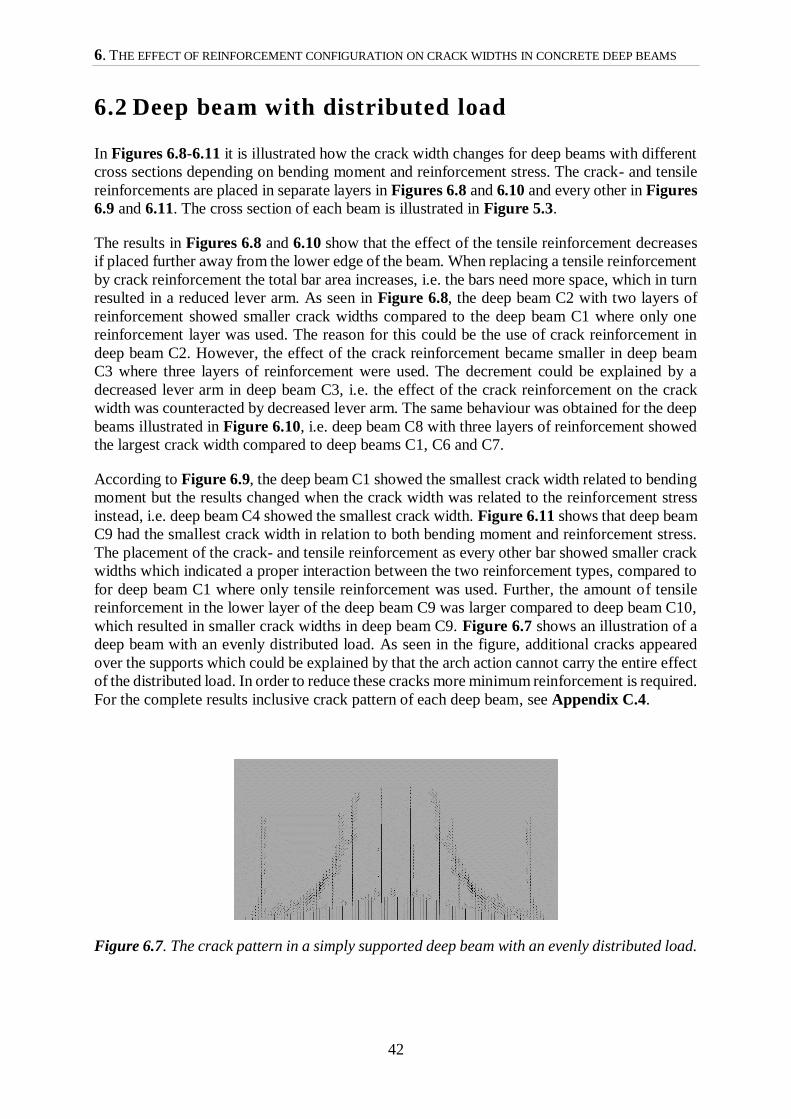
6. THE EFFECT OF REINFORCEMENT CONFIGURATION ON CRACK WIDTHS IN CONCRETE DEEP BEAMS
42
6.2 Deep beam with distributed load
In Figures 6.8-6.11 it is illustrated how the crack width changes for deep beams with different
cross sections depending on bending moment and reinforcement stress. The crack- and tensile
reinforcements are placed in separate layers in Figures 6.8 and 6.10 and every other in Figures
6.9 and 6.11. The cross section of each beam is illustrated in Figure 5.3.
The results in Figures 6.8 and 6.10 show that the effect of the tensile reinforcement decreases
if placed further away from the lower edge of the beam. When replacing a tensile reinforcement
by crack reinforcement the total bar area increases, i.e. the bars need more space, which in turn
resulted in a reduced lever arm. As seen in Figure 6.8, the deep beam C2 with two layers of
reinforcement showed smaller crack widths compared to the deep beam C1 where only one
reinforcement layer was used. The reason for this could be the use of crack reinforcement in
deep beam C2. However, the effect of the crack reinforcement became smaller in deep beam
C3 where three layers of reinforcement were used. The decrement could be explained by a
decreased lever arm in deep beam C3, i.e. the effect of the crack reinforcement on the crack
width was counteracted by decreased lever arm. The same behaviour was obtained for the deep
beams illustrated in Figure 6.10, i.e. deep beam C8 with three layers of reinforcement showed
the largest crack width compared to deep beams C1, C6 and C7.
According to Figure 6.9, the deep beam C1 showed the smallest crack width related to bending
moment but the results changed when the crack width was related to the reinforcement stress
instead, i.e. deep beam C4 showed the smallest crack width. Figure 6.11 shows that deep beam
C9 had the smallest crack width in relation to both bending moment and reinforcement stress.
The placement of the crack- and tensile reinforcement as every other bar showed smaller crack
widths which indicated a proper interaction between the two reinforcement types, compared to
for deep beam C1 where only tensile reinforcement was used. Further, the amount of tensile
reinforcement in the lower layer of the deep beam C9 was larger compared to deep beam C10,
which resulted in smaller crack widths in deep beam C9. Figure 6.7 shows an illustration of a
deep beam with an evenly distributed load. As seen in the figure, additional cracks appeared
over the supports which could be explained by that the arch action cannot carry the entire effect
of the distributed load. In order to reduce these cracks more minimum reinforcement is required.
For the complete results inclusive crack pattern of each deep beam, see Appendix C.4.
Figure 6.7. The crack pattern in a simply supported deep beam with an evenly distributed load.
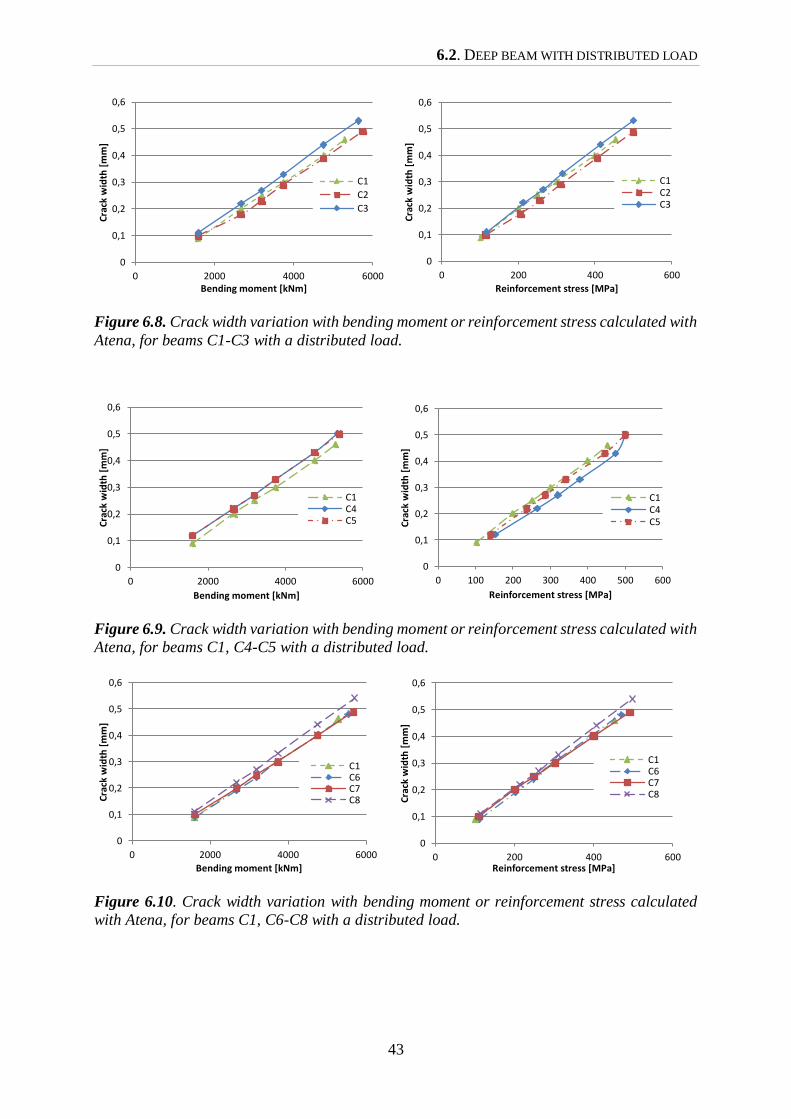
6.2. DEEP BEAM WITH DISTRIBUTED LOAD
43
Figure 6.8. Crack width variation with bending moment or reinforcement stress calculated with
Atena, for beams C1-C3 with a distributed load.
Figure 6.9. Crack width variation with bending moment or reinforcement stress calculated with
Atena, for beams C1, C4-C5 with a distributed load.
Figure 6.10. Crack width variation with bending moment or reinforcement stress calculated
with Atena, for beams C1, C6-C8 with a distributed load.
0
0,1
0,2
0,3
0,4
0,5
0,6
0 2000 4000 6000
Cra
ck w
idth
[m
m]
Bending moment [kNm]
C1
C2
C3
0
0,1
0,2
0,3
0,4
0,5
0,6
0 200 400 600
Cra
ck w
idth
[m
m]
Reinforcement stress [MPa]
C1C2C3
0
0,1
0,2
0,3
0,4
0,5
0,6
0 2000 4000 6000
Cra
ck w
idth
[m
m]
Bending moment [kNm]
C1C4C5
0
0,1
0,2
0,3
0,4
0,5
0,6
0 100 200 300 400 500 600
Cra
ck w
idth
[m
m]
Reinforcement stress [MPa]
C1C4C5
0
0,1
0,2
0,3
0,4
0,5
0,6
0 2000 4000 6000
Cra
ck w
idth
[m
m]
Bending moment [kNm]
C1C6C7C8
0
0,1
0,2
0,3
0,4
0,5
0,6
0 200 400 600
Cra
ck w
idth
[m
m]
Reinforcement stress [MPa]
C1C6C7C8
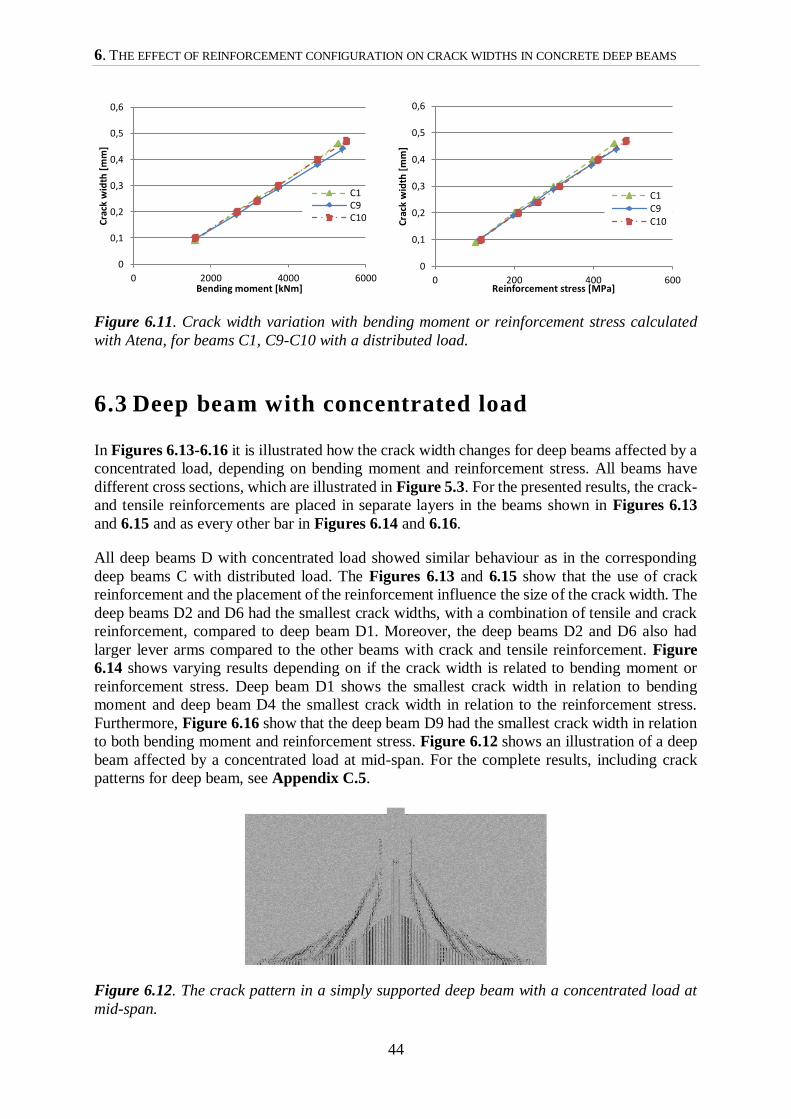
6. THE EFFECT OF REINFORCEMENT CONFIGURATION ON CRACK WIDTHS IN CONCRETE DEEP BEAMS
44
Figure 6.11. Crack width variation with bending moment or reinforcement stress calculated
with Atena, for beams C1, C9-C10 with a distributed load.
6.3 Deep beam with concentrated load
In Figures 6.13-6.16 it is illustrated how the crack width changes for deep beams affected by a
concentrated load, depending on bending moment and reinforcement stress. All beams have
different cross sections, which are illustrated in Figure 5.3. For the presented results, the crack-
and tensile reinforcements are placed in separate layers in the beams shown in Figures 6.13
and 6.15 and as every other bar in Figures 6.14 and 6.16.
All deep beams D with concentrated load showed similar behaviour as in the corresponding
deep beams C with distributed load. The Figures 6.13 and 6.15 show that the use of crack
reinforcement and the placement of the reinforcement influence the size of the crack width. The
deep beams D2 and D6 had the smallest crack widths, with a combination of tensile and crack
reinforcement, compared to deep beam D1. Moreover, the deep beams D2 and D6 also had
larger lever arms compared to the other beams with crack and tensile reinforcement. Figure
6.14 shows varying results depending on if the crack width is related to bending moment or
reinforcement stress. Deep beam D1 shows the smallest crack width in relation to bending
moment and deep beam D4 the smallest crack width in relation to the reinforcement stress.
Furthermore, Figure 6.16 show that the deep beam D9 had the smallest crack width in relation
to both bending moment and reinforcement stress. Figure 6.12 shows an illustration of a deep
beam affected by a concentrated load at mid-span. For the complete results, including crack
patterns for deep beam, see Appendix C.5.
Figure 6.12. The crack pattern in a simply supported deep beam with a concentrated load at
mid-span.
0
0,1
0,2
0,3
0,4
0,5
0,6
0 2000 4000 6000
Cra
ck w
idth
[m
m]
Bending moment [kNm]
C1C9C10
0
0,1
0,2
0,3
0,4
0,5
0,6
0 200 400 600
Cra
ck w
idth
[m
m]
Reinforcement stress [MPa]
C1C9C10
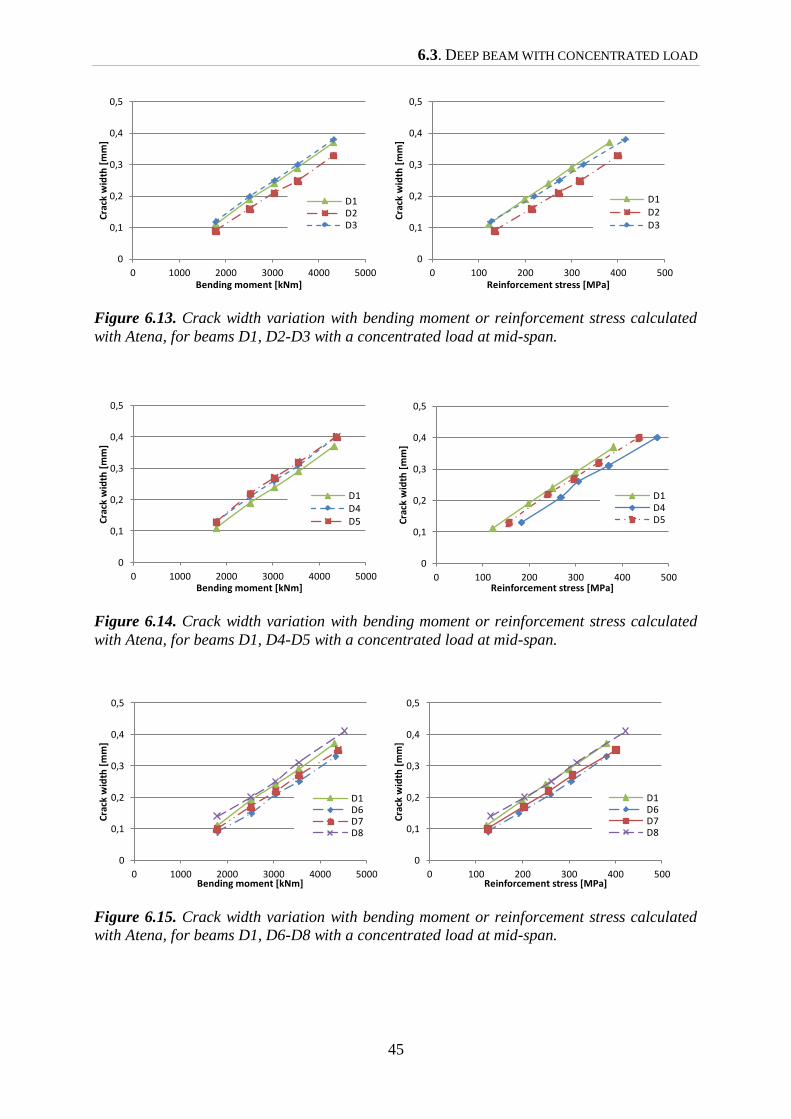
6.3. DEEP BEAM WITH CONCENTRATED LOAD
45
Figure 6.13. Crack width variation with bending moment or reinforcement stress calculated
with Atena, for beams D1, D2-D3 with a concentrated load at mid-span.
Figure 6.14. Crack width variation with bending moment or reinforcement stress calculated
with Atena, for beams D1, D4-D5 with a concentrated load at mid-span.
Figure 6.15. Crack width variation with bending moment or reinforcement stress calculated
with Atena, for beams D1, D6-D8 with a concentrated load at mid-span.
0
0,1
0,2
0,3
0,4
0,5
0 1000 2000 3000 4000 5000
Cra
ck w
idth
[m
m]
Bending moment [kNm]
D1D2D3
0
0,1
0,2
0,3
0,4
0,5
0 100 200 300 400 500
Cra
ck w
idth
[m
m]
Reinforcement stress [MPa]
D1D2D3
0
0,1
0,2
0,3
0,4
0,5
0 1000 2000 3000 4000 5000
Cra
ck w
idth
[m
m]
Bending moment [kNm]
D1D4D5
0
0,1
0,2
0,3
0,4
0,5
0 100 200 300 400 500
Cra
ck w
idth
[m
m]
Reinforcement stress [MPa]
D1D4D5
0
0,1
0,2
0,3
0,4
0,5
0 1000 2000 3000 4000 5000
Cra
ck w
idth
[m
m]
Bending moment [kNm]
D1D6D7D8
0
0,1
0,2
0,3
0,4
0,5
0 100 200 300 400 500
Cra
ck w
idth
[m
m]
Reinforcement stress [MPa]
D1D6D7D8
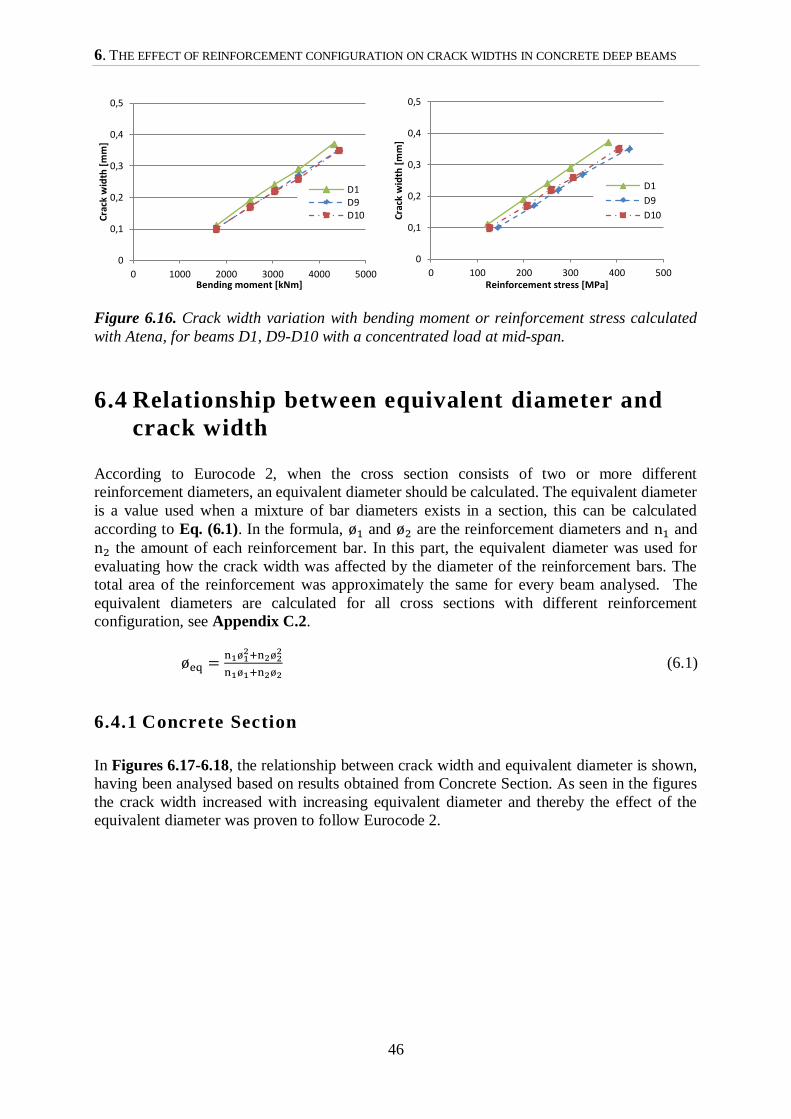
6. THE EFFECT OF REINFORCEMENT CONFIGURATION ON CRACK WIDTHS IN CONCRETE DEEP BEAMS
46
Figure 6.16. Crack width variation with bending moment or reinforcement stress calculated
with Atena, for beams D1, D9-D10 with a concentrated load at mid-span.
6.4 Relationship between equivalent diameter and
crack width
According to Eurocode 2, when the cross section consists of two or more different
reinforcement diameters, an equivalent diameter should be calculated. The equivalent diameter
is a value used when a mixture of bar diameters exists in a section, this can be calculated
according to Eq. (6.1). In the formula, ø1 and ø2 are the reinforcement diameters and n1 and
n2 the amount of each reinforcement bar. In this part, the equivalent diameter was used for
evaluating how the crack width was affected by the diameter of the reinforcement bars. The
total area of the reinforcement was approximately the same for every beam analysed. The
equivalent diameters are calculated for all cross sections with different reinforcement
configuration, see Appendix C.2.
øeq =n1ø1
2+n2ø22
n1ø1+n2ø2 (6.1)
6.4.1 Concrete Section
In Figures 6.17-6.18, the relationship between crack width and equivalent diameter is shown,
having been analysed based on results obtained from Concrete Section. As seen in the figures
the crack width increased with increasing equivalent diameter and thereby the effect of the
equivalent diameter was proven to follow Eurocode 2.
0
0,1
0,2
0,3
0,4
0,5
0 1000 2000 3000 4000 5000
Cra
ck w
idth
[m
m]
Bending moment [kNm]
D1D9D10
0
0,1
0,2
0,3
0,4
0,5
0 100 200 300 400 500
Cra
ck w
idth
[m
m]
Reinforcement stress [MPa]
D1
D9
D10
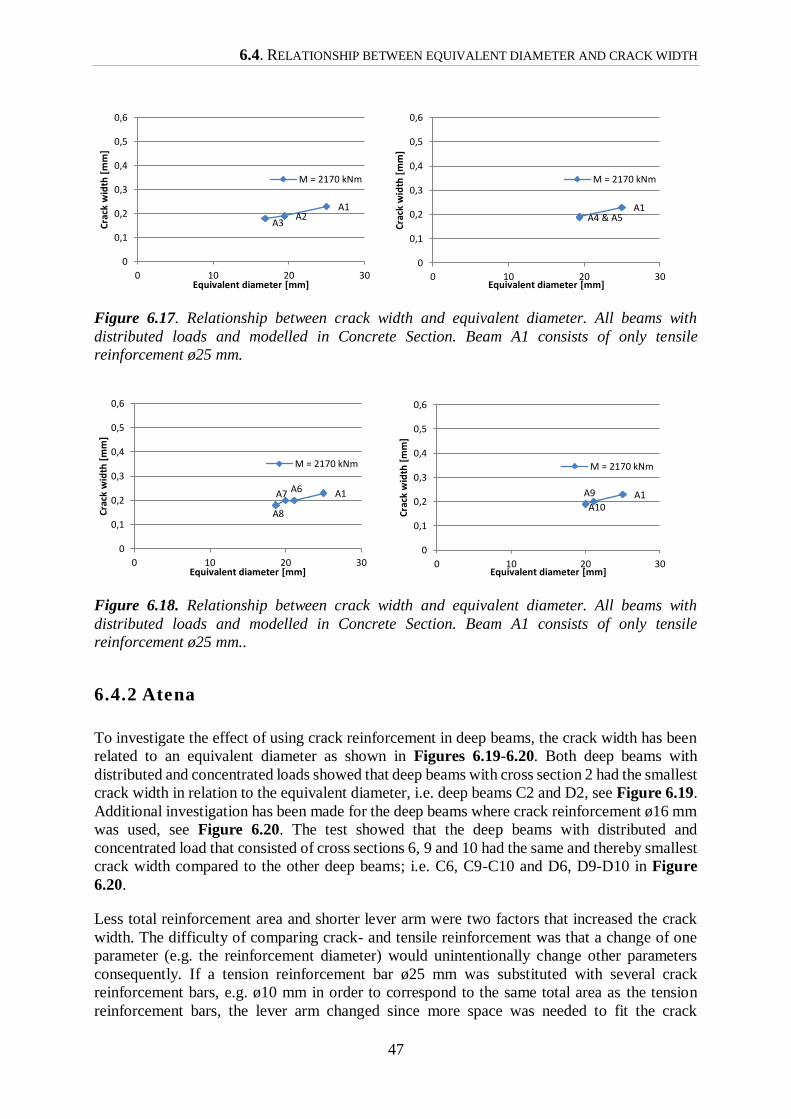
6.4. RELATIONSHIP BETWEEN EQUIVALENT DIAMETER AND CRACK WIDTH
47
Figure 6.17. Relationship between crack width and equivalent diameter. All beams with
distributed loads and modelled in Concrete Section. Beam A1 consists of only tensile
reinforcement ø25 mm.
Figure 6.18. Relationship between crack width and equivalent diameter. All beams with
distributed loads and modelled in Concrete Section. Beam A1 consists of only tensile
reinforcement ø25 mm..
6.4.2 Atena
To investigate the effect of using crack reinforcement in deep beams, the crack width has been
related to an equivalent diameter as shown in Figures 6.19-6.20. Both deep beams with
distributed and concentrated loads showed that deep beams with cross section 2 had the smallest
crack width in relation to the equivalent diameter, i.e. deep beams C2 and D2, see Figure 6.19.
Additional investigation has been made for the deep beams where crack reinforcement ø16 mm
was used, see Figure 6.20. The test showed that the deep beams with distributed and
concentrated load that consisted of cross sections 6, 9 and 10 had the same and thereby smallest
crack width compared to the other deep beams; i.e. C6, C9-C10 and D6, D9-D10 in Figure
6.20.
Less total reinforcement area and shorter lever arm were two factors that increased the crack
width. The difficulty of comparing crack- and tensile reinforcement was that a change of one
parameter (e.g. the reinforcement diameter) would unintentionally change other parameters
consequently. If a tension reinforcement bar ø25 mm was substituted with several crack
reinforcement bars, e.g. ø10 mm in order to correspond to the same total area as the tension
reinforcement bars, the lever arm changed since more space was needed to fit the crack
A1A2
A3
0
0,1
0,2
0,3
0,4
0,5
0,6
0 10 20 30
Cra
ck w
idth
[m
m]
Equivalent diameter [mm]
M = 2170 kNm
A1A4 & A5
0
0,1
0,2
0,3
0,4
0,5
0,6
0 10 20 30
Cra
ck w
idth
[m
m]
Equivalent diameter [mm]
M = 2170 kNm
A1A6A7
A8
0
0,1
0,2
0,3
0,4
0,5
0,6
0 10 20 30
Cra
ck w
idth
[m
m]
Equivalent diameter [mm]
M = 2170 kNm
A1A9
A10
0
0,1
0,2
0,3
0,4
0,5
0,6
0 10 20 30
Cra
ck w
idth
[m
m]
Equivalent diameter [mm]
M = 2170 kNm
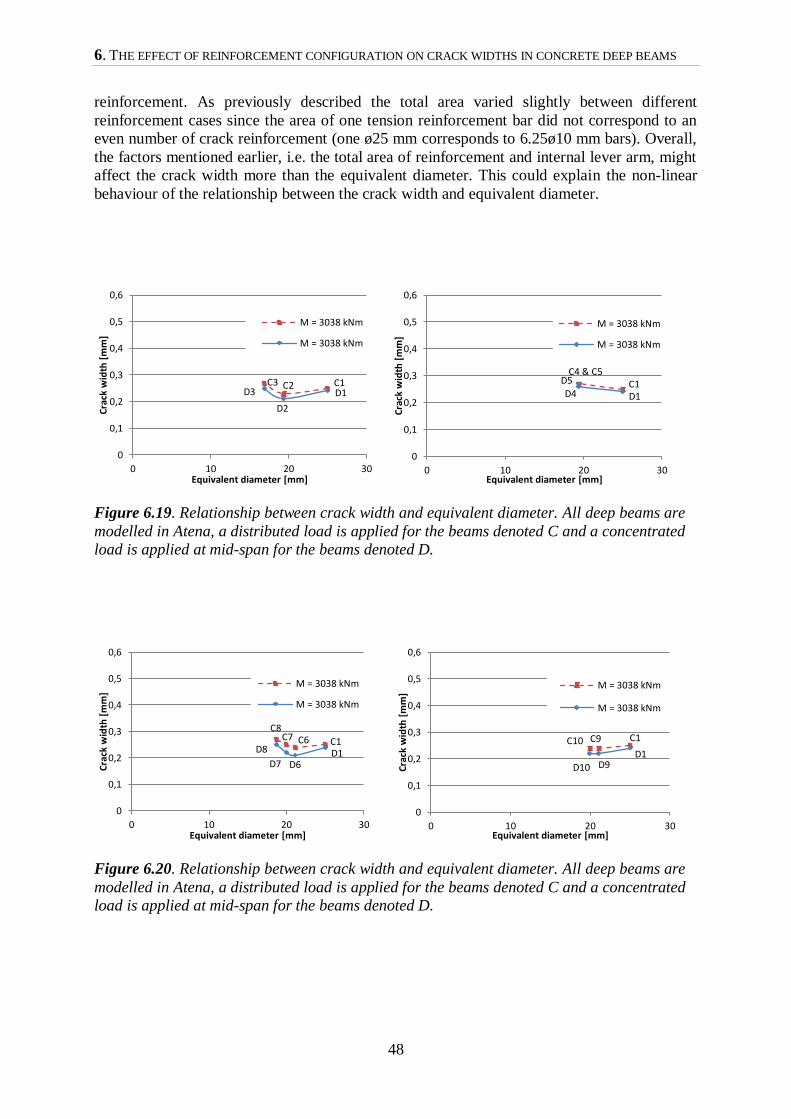
6. THE EFFECT OF REINFORCEMENT CONFIGURATION ON CRACK WIDTHS IN CONCRETE DEEP BEAMS
48
reinforcement. As previously described the total area varied slightly between different
reinforcement cases since the area of one tension reinforcement bar did not correspond to an
even number of crack reinforcement (one ø25 mm corresponds to 6.25ø10 mm bars). Overall,
the factors mentioned earlier, i.e. the total area of reinforcement and internal lever arm, might
affect the crack width more than the equivalent diameter. This could explain the non-linear
behaviour of the relationship between the crack width and equivalent diameter.
Figure 6.19. Relationship between crack width and equivalent diameter. All deep beams are
modelled in Atena, a distributed load is applied for the beams denoted C and a concentrated
load is applied at mid-span for the beams denoted D.
Figure 6.20. Relationship between crack width and equivalent diameter. All deep beams are
modelled in Atena, a distributed load is applied for the beams denoted C and a concentrated
load is applied at mid-span for the beams denoted D.
C1C2C3D1
D2
D3
0
0,1
0,2
0,3
0,4
0,5
0,6
0 10 20 30
Cra
ck w
idth
[m
m]
Equivalent diameter [mm]
M = 3038 kNm
M = 3038 kNm
C1C4 & C5
D1D4
D5
0
0,1
0,2
0,3
0,4
0,5
0,6
0 10 20 30
Cra
ck w
idth
[m
m]
Equivalent diameter [mm]
M = 3038 kNm
M = 3038 kNm
C1C6C7C8
D1D6D7
D8
0
0,1
0,2
0,3
0,4
0,5
0,6
0 10 20 30
Cra
ck w
idth
[m
m]
Equivalent diameter [mm]
M = 3038 kNm
M = 3038 kNm
C1C9C10
D1D9D10
0
0,1
0,2
0,3
0,4
0,5
0,6
0 10 20 30
Cra
ck w
idth
[m
m]
Equivalent diameter [mm]
M = 3038 kNm
M = 3038 kNm
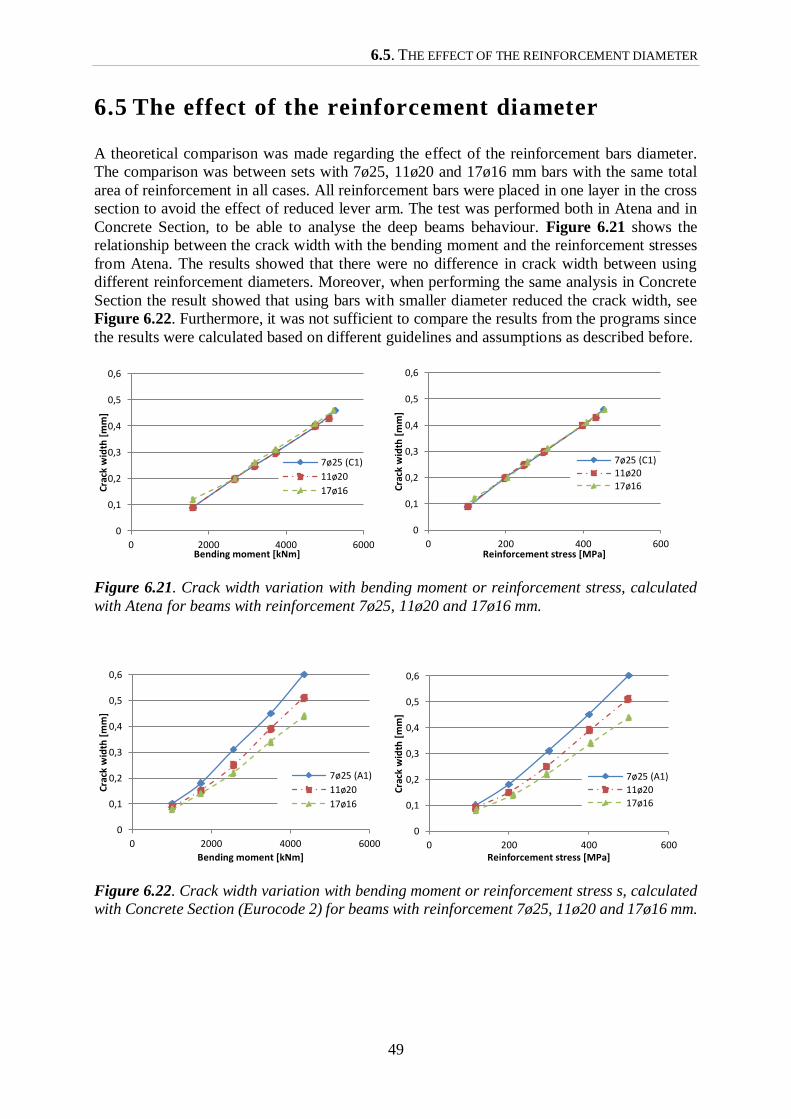
6.5. THE EFFECT OF THE REINFORCEMENT DIAMETER
49
6.5 The effect of the reinforcement diameter
A theoretical comparison was made regarding the effect of the reinforcement bars diameter.
The comparison was between sets with 7ø25, 11ø20 and 17ø16 mm bars with the same total
area of reinforcement in all cases. All reinforcement bars were placed in one layer in the cross
section to avoid the effect of reduced lever arm. The test was performed both in Atena and in
Concrete Section, to be able to analyse the deep beams behaviour. Figure 6.21 shows the
relationship between the crack width with the bending moment and the reinforcement stresses
from Atena. The results showed that there were no difference in crack width between using
different reinforcement diameters. Moreover, when performing the same analysis in Concrete
Section the result showed that using bars with smaller diameter reduced the crack width, see
Figure 6.22. Furthermore, it was not sufficient to compare the results from the programs since
the results were calculated based on different guidelines and assumptions as described before.
Figure 6.21. Crack width variation with bending moment or reinforcement stress, calculated
with Atena for beams with reinforcement 7ø25, 11ø20 and 17ø16 mm.
Figure 6.22. Crack width variation with bending moment or reinforcement stress s, calculated
with Concrete Section (Eurocode 2) for beams with reinforcement 7ø25, 11ø20 and 17ø16 mm.
0
0,1
0,2
0,3
0,4
0,5
0,6
0 2000 4000 6000
Cra
ck w
idth
[m
m]
Bending moment [kNm]
7ø25 (C1)
11ø20
17ø16
0
0,1
0,2
0,3
0,4
0,5
0,6
0 200 400 600
Cra
ck w
idth
[m
m]
Reinforcement stress [MPa]
7ø25 (C1)11ø2017ø16
0
0,1
0,2
0,3
0,4
0,5
0,6
0 2000 4000 6000
Cra
ck w
idth
[m
m]
Bending moment [kNm]
7ø25 (A1)
11ø20
17ø16
0
0,1
0,2
0,3
0,4
0,5
0,6
0 200 400 600
Cra
ck w
idth
[m
m]
Reinforcement stress [MPa]
7ø25 (A1)
11ø20
17ø16
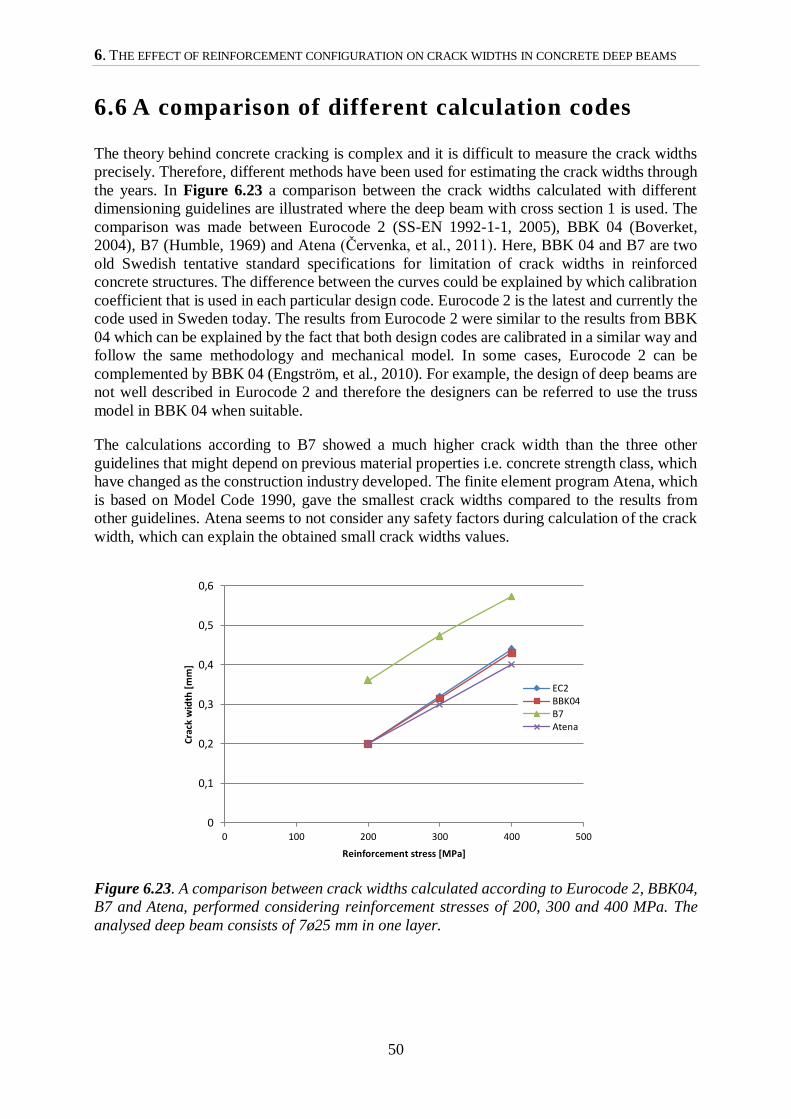
6. THE EFFECT OF REINFORCEMENT CONFIGURATION ON CRACK WIDTHS IN CONCRETE DEEP BEAMS
50
6.6 A comparison of different calculation codes
The theory behind concrete cracking is complex and it is difficult to measure the crack widths
precisely. Therefore, different methods have been used for estimating the crack widths through
the years. In Figure 6.23 a comparison between the crack widths calculated with different
dimensioning guidelines are illustrated where the deep beam with cross section 1 is used. The
comparison was made between Eurocode 2 (SS-EN 1992-1-1, 2005), BBK 04 (Boverket,
2004), B7 (Humble, 1969) and Atena (Červenka, et al., 2011). Here, BBK 04 and B7 are two
old Swedish tentative standard specifications for limitation of crack widths in reinforced
concrete structures. The difference between the curves could be explained by which calibration
coefficient that is used in each particular design code. Eurocode 2 is the latest and currently the
code used in Sweden today. The results from Eurocode 2 were similar to the results from BBK
04 which can be explained by the fact that both design codes are calibrated in a similar way and
follow the same methodology and mechanical model. In some cases, Eurocode 2 can be
complemented by BBK 04 (Engström, et al., 2010). For example, the design of deep beams are
not well described in Eurocode 2 and therefore the designers can be referred to use the truss
model in BBK 04 when suitable.
The calculations according to B7 showed a much higher crack width than the three other
guidelines that might depend on previous material properties i.e. concrete strength class, which
have changed as the construction industry developed. The finite element program Atena, which
is based on Model Code 1990, gave the smallest crack widths compared to the results from
other guidelines. Atena seems to not consider any safety factors during calculation of the crack
width, which can explain the obtained small crack widths values.
Figure 6.23. A comparison between crack widths calculated according to Eurocode 2, BBK04,
B7 and Atena, performed considering reinforcement stresses of 200, 300 and 400 MPa. The
analysed deep beam consists of 7ø25 mm in one layer.
0
0,1
0,2
0,3
0,4
0,5
0,6
0 100 200 300 400 500
Cra
ck w
idth
[m
m]
Reinforcement stress [MPa]
EC2BBK04B7Atena
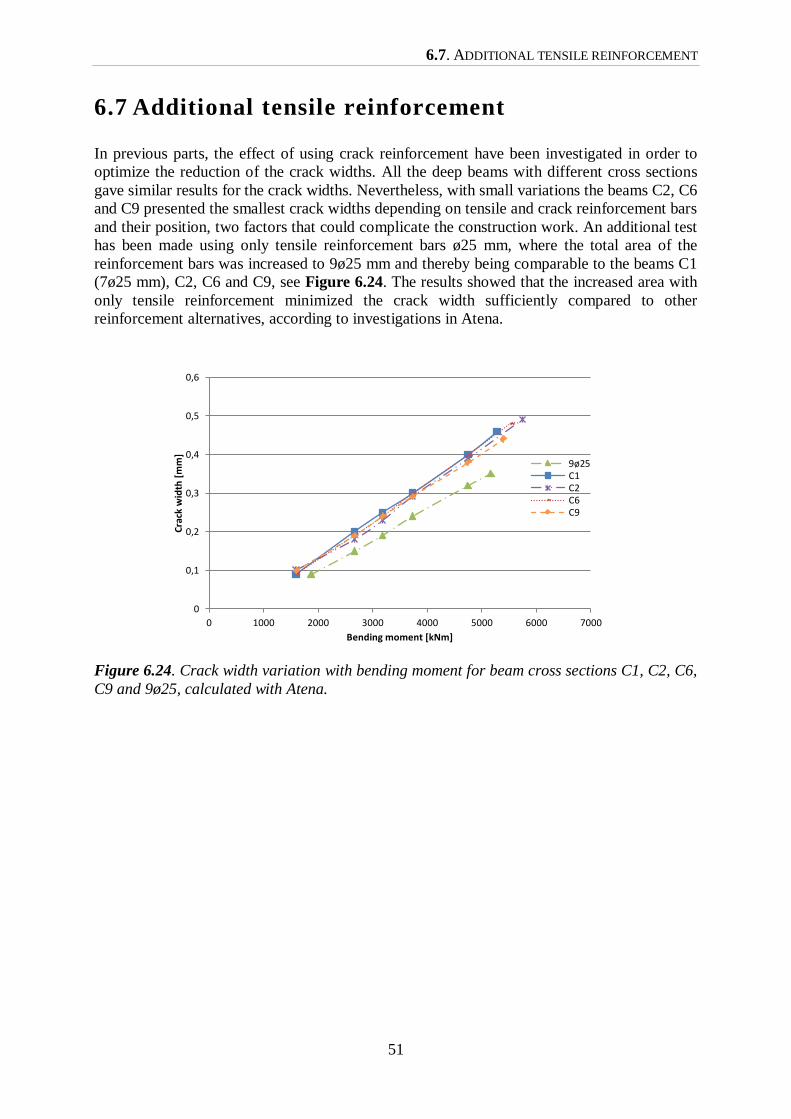
6.7. ADDITIONAL TENSILE REINFORCEMENT
51
6.7 Additional tensile reinforcement
In previous parts, the effect of using crack reinforcement have been investigated in order to
optimize the reduction of the crack widths. All the deep beams with different cross sections
gave similar results for the crack widths. Nevertheless, with small variations the beams C2, C6
and C9 presented the smallest crack widths depending on tensile and crack reinforcement bars
and their position, two factors that could complicate the construction work. An additional test
has been made using only tensile reinforcement bars ø25 mm, where the total area of the
reinforcement bars was increased to 9ø25 mm and thereby being comparable to the beams C1
(7ø25 mm), C2, C6 and C9, see Figure 6.24. The results showed that the increased area with
only tensile reinforcement minimized the crack width sufficiently compared to other
reinforcement alternatives, according to investigations in Atena.
Figure 6.24. Crack width variation with bending moment for beam cross sections C1, C2, C6,
C9 and 9ø25, calculated with Atena.
0
0,1
0,2
0,3
0,4
0,5
0,6
0 1000 2000 3000 4000 5000 6000 7000
Cra
ck w
idth
[m
m]
Bending moment [kNm]
9ø25C1C2C6C9

6. THE EFFECT OF REINFORCEMENT CONFIGURATION ON CRACK WIDTHS IN CONCRETE DEEP BEAMS
52
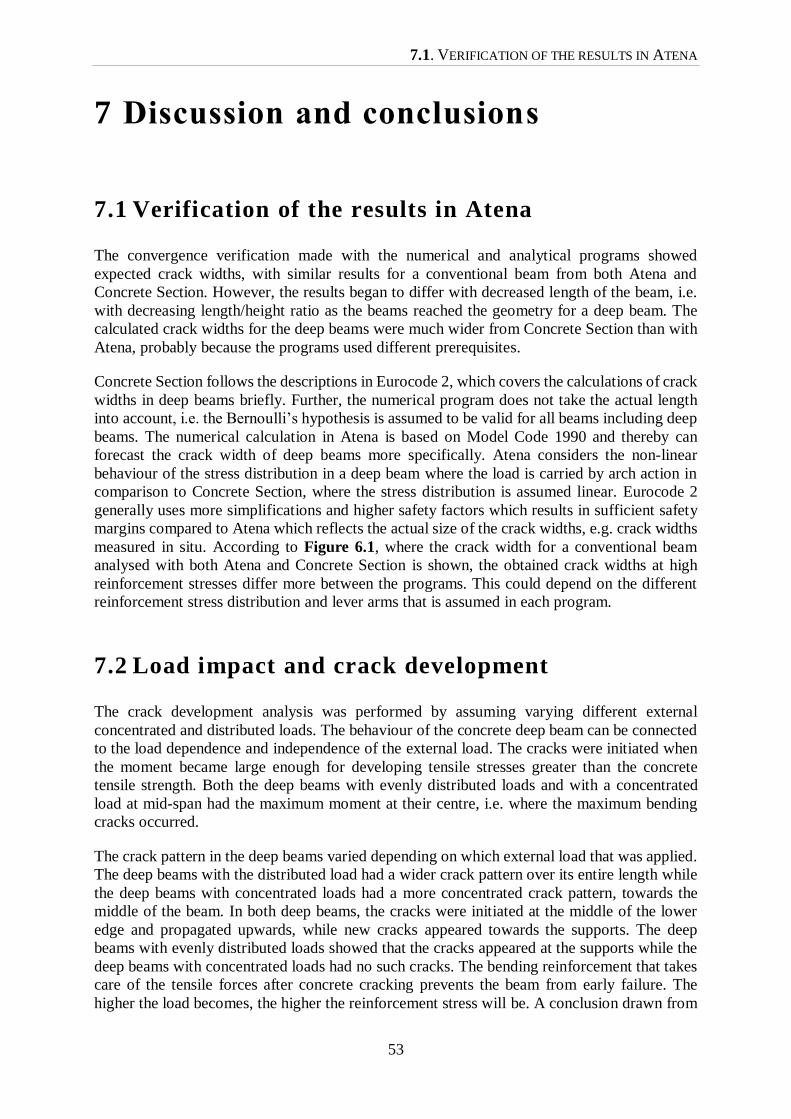
7.1. VERIFICATION OF THE RESULTS IN ATENA
53
7 Discussion and conclusions
7.1 Verification of the results in Atena
The convergence verification made with the numerical and analytical programs showed
expected crack widths, with similar results for a conventional beam from both Atena and
Concrete Section. However, the results began to differ with decreased length of the beam, i.e.
with decreasing length/height ratio as the beams reached the geometry for a deep beam. The
calculated crack widths for the deep beams were much wider from Concrete Section than with
Atena, probably because the programs used different prerequisites.
Concrete Section follows the descriptions in Eurocode 2, which covers the calculations of crack
widths in deep beams briefly. Further, the numerical program does not take the actual length
into account, i.e. the Bernoulli’s hypothesis is assumed to be valid for all beams including deep
beams. The numerical calculation in Atena is based on Model Code 1990 and thereby can
forecast the crack width of deep beams more specifically. Atena considers the non-linear
behaviour of the stress distribution in a deep beam where the load is carried by arch action in
comparison to Concrete Section, where the stress distribution is assumed linear. Eurocode 2
generally uses more simplifications and higher safety factors which results in sufficient safety
margins compared to Atena which reflects the actual size of the crack widths, e.g. crack widths
measured in situ. According to Figure 6.1, where the crack width for a conventional beam
analysed with both Atena and Concrete Section is shown, the obtained crack widths at high
reinforcement stresses differ more between the programs. This could depend on the different
reinforcement stress distribution and lever arms that is assumed in each program.
7.2 Load impact and crack development
The crack development analysis was performed by assuming varying different external
concentrated and distributed loads. The behaviour of the concrete deep beam can be connected
to the load dependence and independence of the external load. The cracks were initiated when
the moment became large enough for developing tensile stresses greater than the concrete
tensile strength. Both the deep beams with evenly distributed loads and with a concentrated
load at mid-span had the maximum moment at their centre, i.e. where the maximum bending
cracks occurred.
The crack pattern in the deep beams varied depending on which external load that was applied.
The deep beams with the distributed load had a wider crack pattern over its entire length while
the deep beams with concentrated loads had a more concentrated crack pattern, towards the
middle of the beam. In both deep beams, the cracks were initiated at the middle of the lower
edge and propagated upwards, while new cracks appeared towards the supports. The deep
beams with evenly distributed loads showed that the cracks appeared at the supports while the
deep beams with concentrated loads had no such cracks. The bending reinforcement that takes
care of the tensile forces after concrete cracking prevents the beam from early failure. The
higher the load becomes, the higher the reinforcement stress will be. A conclusion drawn from
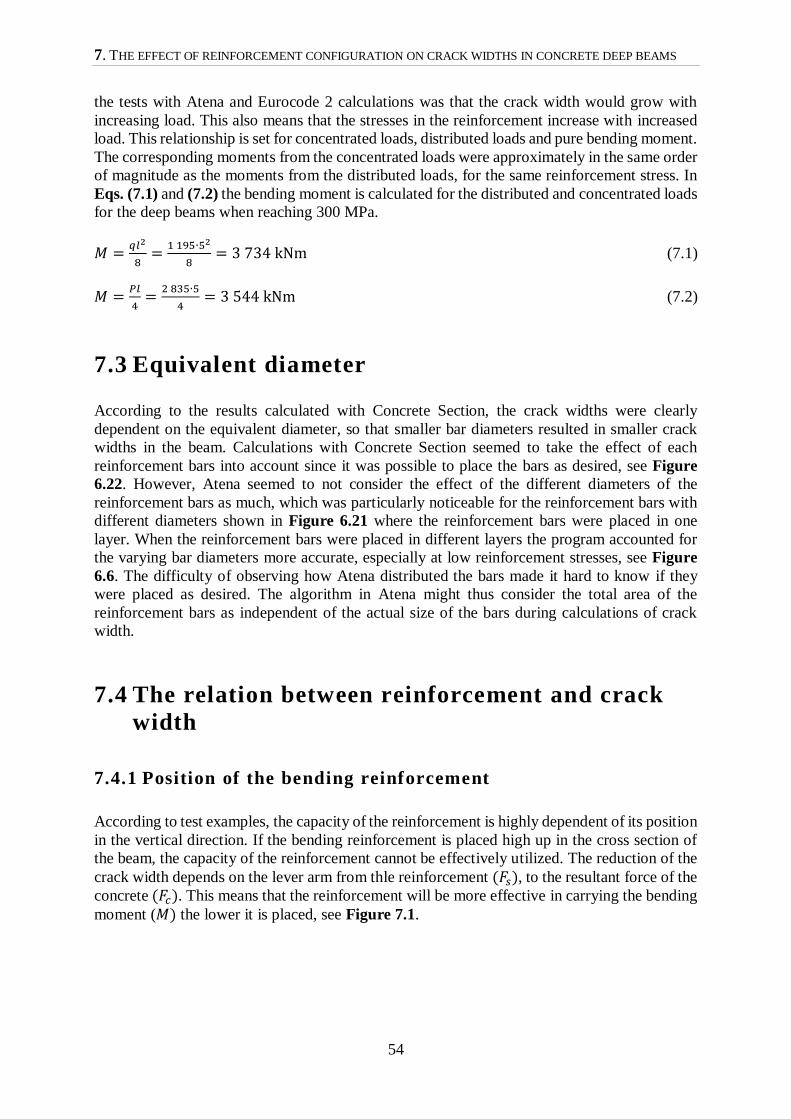
7. THE EFFECT OF REINFORCEMENT CONFIGURATION ON CRACK WIDTHS IN CONCRETE DEEP BEAMS
54
the tests with Atena and Eurocode 2 calculations was that the crack width would grow with
increasing load. This also means that the stresses in the reinforcement increase with increased
load. This relationship is set for concentrated loads, distributed loads and pure bending moment.
The corresponding moments from the concentrated loads were approximately in the same order
of magnitude as the moments from the distributed loads, for the same reinforcement stress. In
Eqs. (7.1) and (7.2) the bending moment is calculated for the distributed and concentrated loads
for the deep beams when reaching 300 MPa.
𝑀 =𝑞𝑙2
8=
1 195∙52
8= 3 734 kNm (7.1)
𝑀 =𝑃𝑙
4=
2 835∙5
4= 3 544 kNm (7.2)
7.3 Equivalent diameter
According to the results calculated with Concrete Section, the crack widths were clearly
dependent on the equivalent diameter, so that smaller bar diameters resulted in smaller crack
widths in the beam. Calculations with Concrete Section seemed to take the effect of each
reinforcement bars into account since it was possible to place the bars as desired, see Figure
6.22. However, Atena seemed to not consider the effect of the different diameters of the
reinforcement bars as much, which was particularly noticeable for the reinforcement bars with
different diameters shown in Figure 6.21 where the reinforcement bars were placed in one
layer. When the reinforcement bars were placed in different layers the program accounted for
the varying bar diameters more accurate, especially at low reinforcement stresses, see Figure
6.6. The difficulty of observing how Atena distributed the bars made it hard to know if they
were placed as desired. The algorithm in Atena might thus consider the total area of the
reinforcement bars as independent of the actual size of the bars during calculations of crack
width.
7.4 The relation between reinforcement and crack
width
7.4.1 Position of the bending reinforcement
According to test examples, the capacity of the reinforcement is highly dependent of its position
in the vertical direction. If the bending reinforcement is placed high up in the cross section of
the beam, the capacity of the reinforcement cannot be effectively utilized. The reduction of the
crack width depends on the lever arm from thle reinforcement (𝐹𝑠), to the resultant force of the
concrete (𝐹𝑐). This means that the reinforcement will be more effective in carrying the bending
moment (𝑀) the lower it is placed, see Figure 7.1.
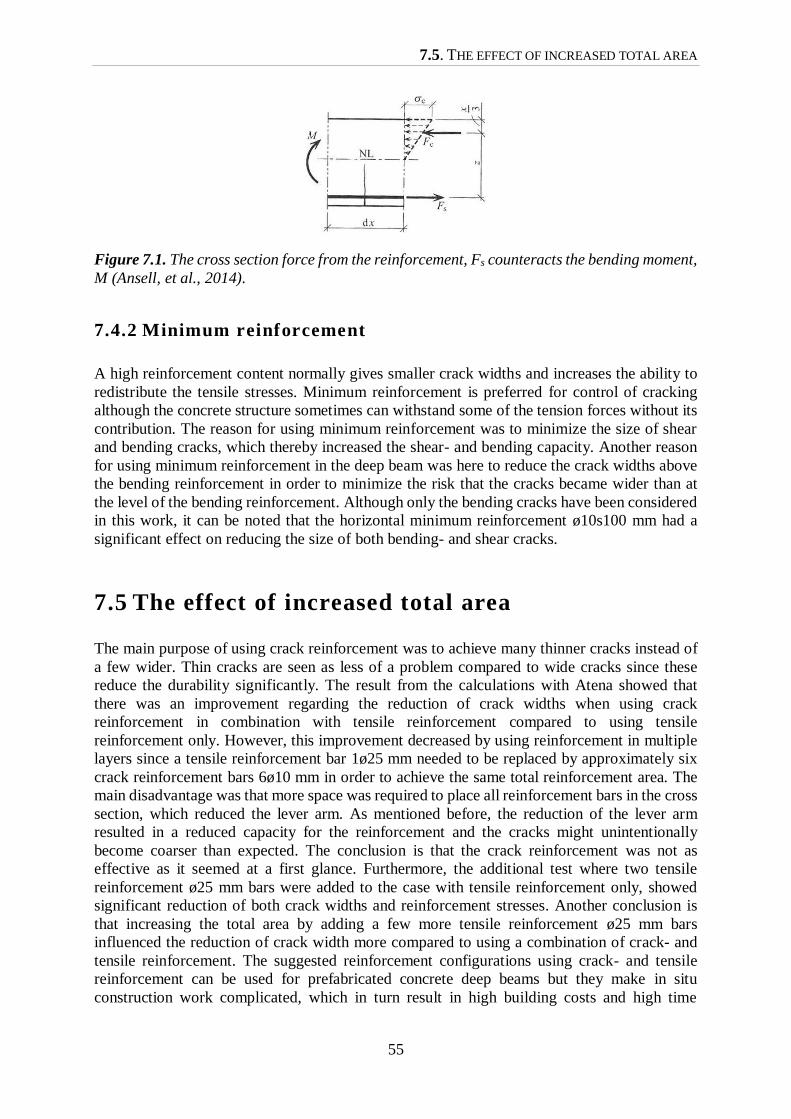
7.5. THE EFFECT OF INCREASED TOTAL AREA
55
Figure 7.1. The cross section force from the reinforcement, Fs counteracts the bending moment,
M (Ansell, et al., 2014).
7.4.2 Minimum reinforcement
A high reinforcement content normally gives smaller crack widths and increases the ability to
redistribute the tensile stresses. Minimum reinforcement is preferred for control of cracking
although the concrete structure sometimes can withstand some of the tension forces without its
contribution. The reason for using minimum reinforcement was to minimize the size of shear
and bending cracks, which thereby increased the shear- and bending capacity. Another reason
for using minimum reinforcement in the deep beam was here to reduce the crack widths above
the bending reinforcement in order to minimize the risk that the cracks became wider than at
the level of the bending reinforcement. Although only the bending cracks have been considered
in this work, it can be noted that the horizontal minimum reinforcement ø10s100 mm had a
significant effect on reducing the size of both bending- and shear cracks.
7.5 The effect of increased total area
The main purpose of using crack reinforcement was to achieve many thinner cracks instead of
a few wider. Thin cracks are seen as less of a problem compared to wide cracks since these
reduce the durability significantly. The result from the calculations with Atena showed that
there was an improvement regarding the reduction of crack widths when using crack
reinforcement in combination with tensile reinforcement compared to using tensile
reinforcement only. However, this improvement decreased by using reinforcement in multiple
layers since a tensile reinforcement bar 1ø25 mm needed to be replaced by approximately six
crack reinforcement bars 6ø10 mm in order to achieve the same total reinforcement area. The
main disadvantage was that more space was required to place all reinforcement bars in the cross
section, which reduced the lever arm. As mentioned before, the reduction of the lever arm
resulted in a reduced capacity for the reinforcement and the cracks might unintentionally
become coarser than expected. The conclusion is that the crack reinforcement was not as
effective as it seemed at a first glance. Furthermore, the additional test where two tensile
reinforcement ø25 mm bars were added to the case with tensile reinforcement only, showed
significant reduction of both crack widths and reinforcement stresses. Another conclusion is
that increasing the total area by adding a few more tensile reinforcement ø25 mm bars
influenced the reduction of crack width more compared to using a combination of crack- and
tensile reinforcement. The suggested reinforcement configurations using crack- and tensile
reinforcement can be used for prefabricated concrete deep beams but they make in situ
construction work complicated, which in turn result in high building costs and high time
7. THE EFFECT OF REINFORCEMENT CONFIGURATION ON CRACK WIDTHS IN CONCRETE DEEP BEAMS
56
consumption. Therefore, the increased total area and the use of tensile reinforcement only could
be a simpler alternative.
Moreover, a comparison was made considering crack widths calculated using different
dimensioning guidelines. The compared codes were B7, BBK 04 and Eurocode 2. These
calculations reflected the development of the material properties and the crack width estimation
in reinforced concrete structures through the years. The guideline B7 presented almost 1.5 times
higher values of crack widths as in the other guidelines. Eurocode 2 and BBK 04 presented
similar results of the crack widths. Further, the finite program Atena gave the smallest crack
widths compared to the other three guidelines. The difference between the results could be
explained by the fact that each guideline is based on specific assumptions and thereby uses
different safety margin. This means that Atena represents the real crack widths which means
that the structure should not be dimensioned according to these results and thereby it is
important that accurate safety margins are considered.
7.6 Further studies
To achieve a complete overview of the cracking process, additional studies has to be made. The
program Atena 2D is not entirely reliable because the user does not have complete control of
the exact placement of the reinforcement bars. This means that it would be preferable to analyze
some beams with another finite element program to investigate if there are any differences
between the results. Moreover, it would also be interesting to analyze the beams in Atena 3D
(Cervenka Consulting, 2011) to see if it is possible to achieve better control of the positions of
the reinforcement bars. Another solution could also be to improve the finite element model with
more data about the steel reinforcement since it plays a central role in the development of
cracks.
Furthermore, additional studies could be made to investigate if there are other options for
reducing the crack widths other than increased reinforcement area and the use of the crack
reinforcement. One suggestion to a further study is to investigate the influence of the minimum
reinforcement considering crack width. This would probably not only be profitable for reducing
bending cracks, but also for reducing shear cracks.
0. THE EFFECT OF REINFORCEMENT CONFIGURATION ON CRACK WIDTHS IN CONCRETE DEEP BEAMS
57
Bibliography
ACI, 1999. ACI 318-99. Michigan: American Concrete Insititute.
Alavala, C. R., 2008. Finite Element Methods: Basic Concepts and Applications. New Delhi:
PHI Learning.
Ansell, A. et al., 2014. Concrete Structures. Stockholm: KTH Civil and Architectural
Engineering.
Appa Rao, G., Kunal, K. & Eligehausen , R., 2017. Shear strength of RC deep beams,
Chennai: Indian Institute of Technology Madras.
Arvidsson, K., 2016. Personal communication [Interview] (September 2016).
Bertolini, L. et al., 2013. Corrosion of Steel in Concrete: Prevention, Diagnosis, Repair. 2nd
ed. Weinheim: Wiley-VCH.
Boverket, 2004. Boverkets handbok om betongkonstruktioner, BBK 04. Karlskrona: Boverket.
Burström, P. G., 2006. Byggnadsmaterial. 2 ed. Lund: Studentlitteratur AB.
CEB-FIP, 1993. Model Code 1990. Lausanne: International Federation for Structural
Concrete.
CEB-FIP, 2012. Model Code 2010, Lausanne : International Federation for Structural
Concrete.
Cederwall, K., Lorentsen, M. & Östlund, L., 1990. Betonghandbok. 2 ed. Örebro: AB Svensk
Byggtjänst och Cementa AB.
Cervenka Consulting, 2011. Atena, Prague: Červenka Consulting.
Červenka, V., Jendele, L. & Červenka, J., 2011. ATENA Program Documentation Part 1,
Theory. Prague: Červenka Consulting.
Cook, R. D., Malkus, D. S., Plesha, M. E. & Witt, J. R., 2001. Concepts and Applications of
Finite Element Analysis. 4 ed. New Delhi: John Wiley Sons.
Humble, O., 1969. Bygg handbok för hus-, väg- och vattenbyggnad Huvuddel. 3,
Konstruktionsteknik. Stockholm: AB Byggmästarens Förlag.
Kumar, S. & Barai, S. V., 2011. Concrete Farcture Models and Applications. Berlin:
Springer.
Malm, R. & Holmgren, J., 2008a. Cracking in deep beams owing to shear loading. Part 1:
Experimental study and assessment. Magazine of Concrete Research No. 5, June.pp. 371-379.
0. THE EFFECT OF REINFORCEMENT CONFIGURATION ON CRACK WIDTHS IN CONCRETE DEEP BEAMS
58
Malm, R. & Holmgren, J., 2008b. Cracking in deep beams owing to shear loading. Part 2:
Non-linear analysis. Magazine of Concrete Research No. 5, June.pp. 381-388.
PTC, 2015. Mathcad Prime 3.1. [Online]
Available at: http://www.ptc.com/news/2015/ptc-introduces-mathcad-prime3-1
Shi, Z., 2009. Crack Analysis in Structural Concrete. Oxford: Butterworth-Heinemann.
SS-EN 1992-1-1, 2005. Eurokod 2: Dimensionering av betongkonstruktioner-Del 1-1
Allmänna regeler och regeler för byggnader, Stockholm: SIS.
StruSoft AB, 2015. Concrete Section [Computer program]. [Online]
Available at: http://www.strusoft.com/products/win-statik
StruSoft, 2015. Theory Manual for Concrete Section. Stockholm: StruSoft.
Svenska Betongföreningen, 2010. Svenska Betongföreningens handbok till Eurokod 2.
Betongrapport nr 15 Volume I. Stockholm: Svenska Betongföreningen.
Walther, R. & Leonhardt, F., 1966. Wandartige Träger. Berlin: Deutscher Ausschuss für
Stahlbeton.
Winter, G. & Nilson , A. H., 1989. Design of Concrete Structure. 11th ed. New York:
McGraw-Hill Company.
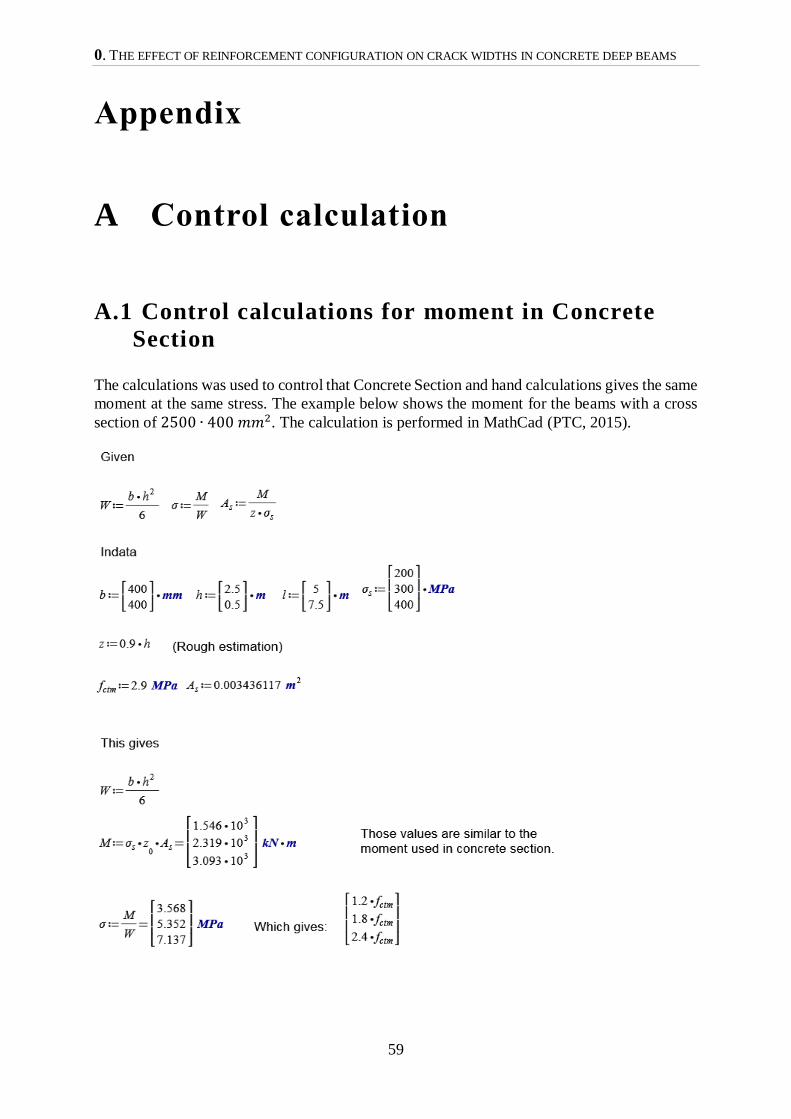
0. THE EFFECT OF REINFORCEMENT CONFIGURATION ON CRACK WIDTHS IN CONCRETE DEEP BEAMS
59
Appendix
A Control calculation
A.1 Control calculations for moment in Concrete
Section
The calculations was used to control that Concrete Section and hand calculations gives the same
moment at the same stress. The example below shows the moment for the beams with a cross
section of 2500 ∙ 400 𝑚𝑚2. The calculation is performed in MathCad (PTC, 2015).
Appendix
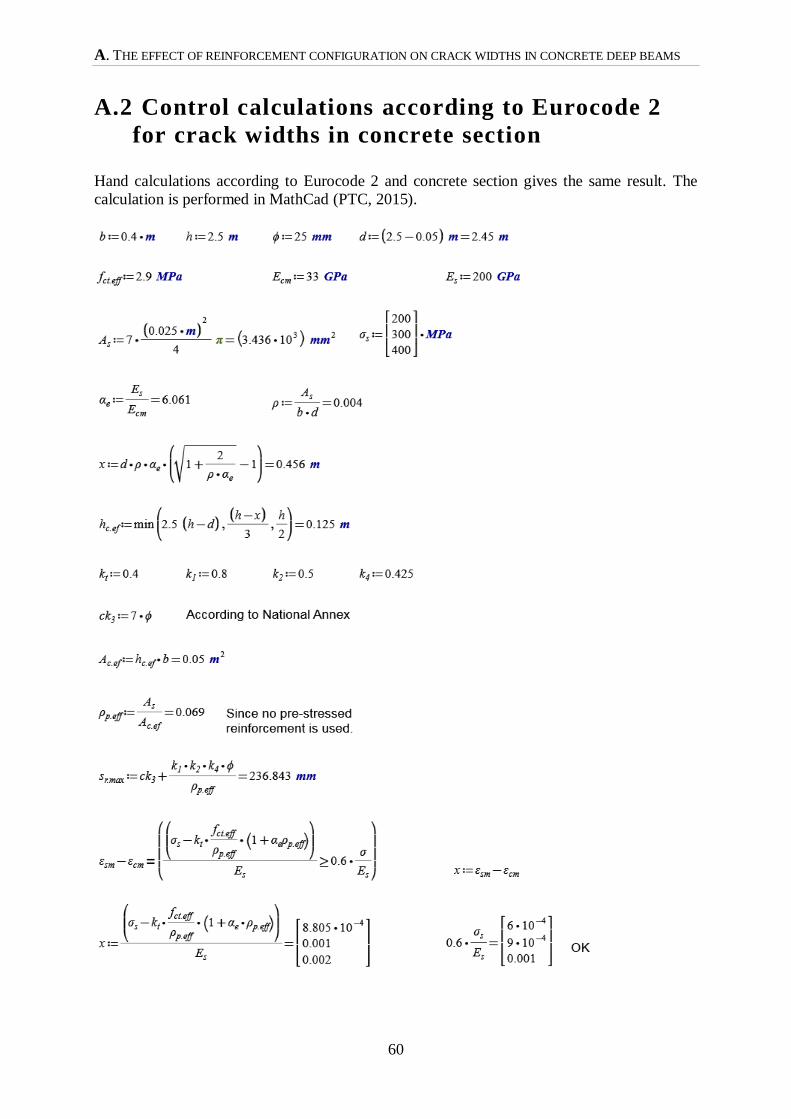
A. THE EFFECT OF REINFORCEMENT CONFIGURATION ON CRACK WIDTHS IN CONCRETE DEEP BEAMS
60
A.2 Control calculations according to Eurocode 2
for crack widths in concrete section
Hand calculations according to Eurocode 2 and concrete section gives the same result. The
calculation is performed in MathCad (PTC, 2015).
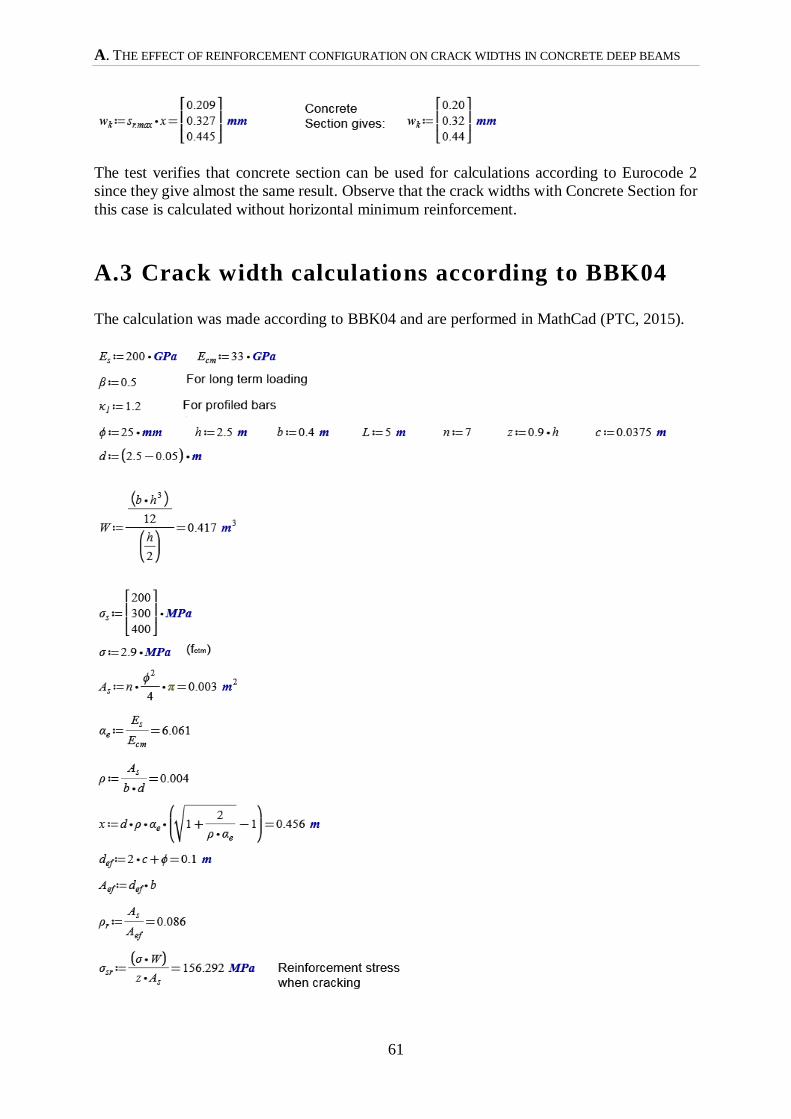
A. THE EFFECT OF REINFORCEMENT CONFIGURATION ON CRACK WIDTHS IN CONCRETE DEEP BEAMS
61
The test verifies that concrete section can be used for calculations according to Eurocode 2
since they give almost the same result. Observe that the crack widths with Concrete Section for
this case is calculated without horizontal minimum reinforcement.
A.3 Crack width calculations according to BBK04
The calculation was made according to BBK04 and are performed in MathCad (PTC, 2015).
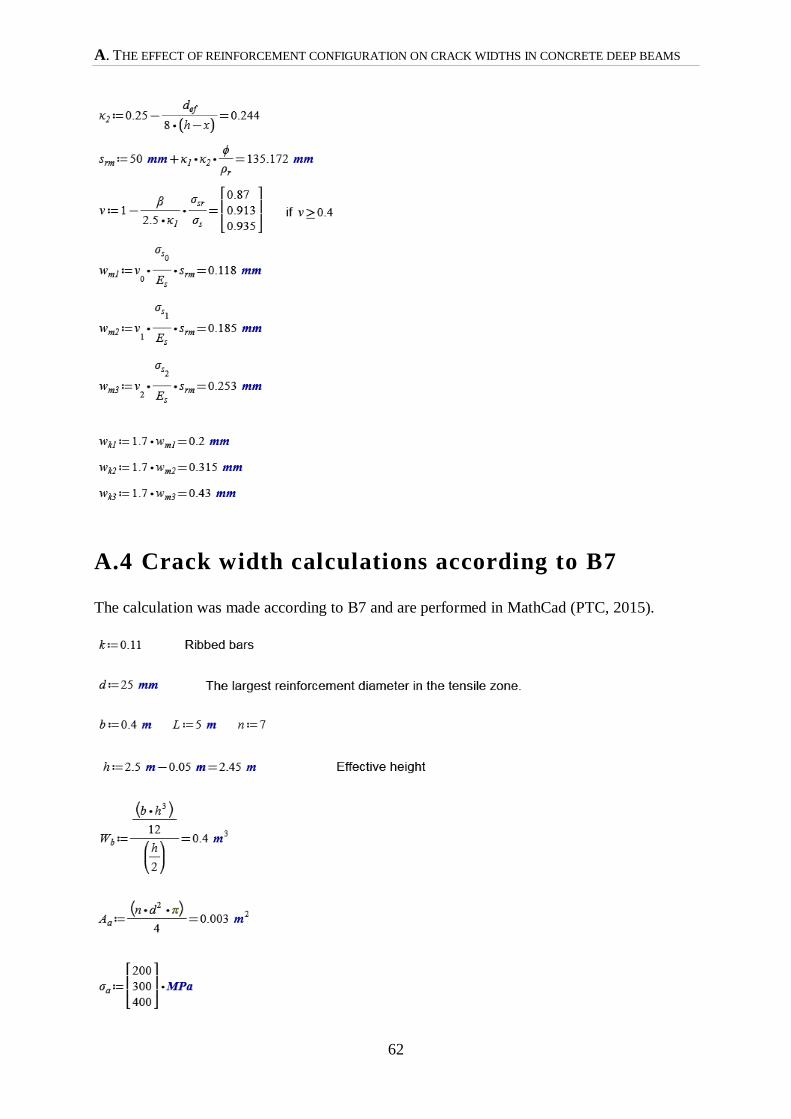
A. THE EFFECT OF REINFORCEMENT CONFIGURATION ON CRACK WIDTHS IN CONCRETE DEEP BEAMS
62
A.4 Crack width calculations according to B7
The calculation was made according to B7 and are performed in MathCad (PTC, 2015).
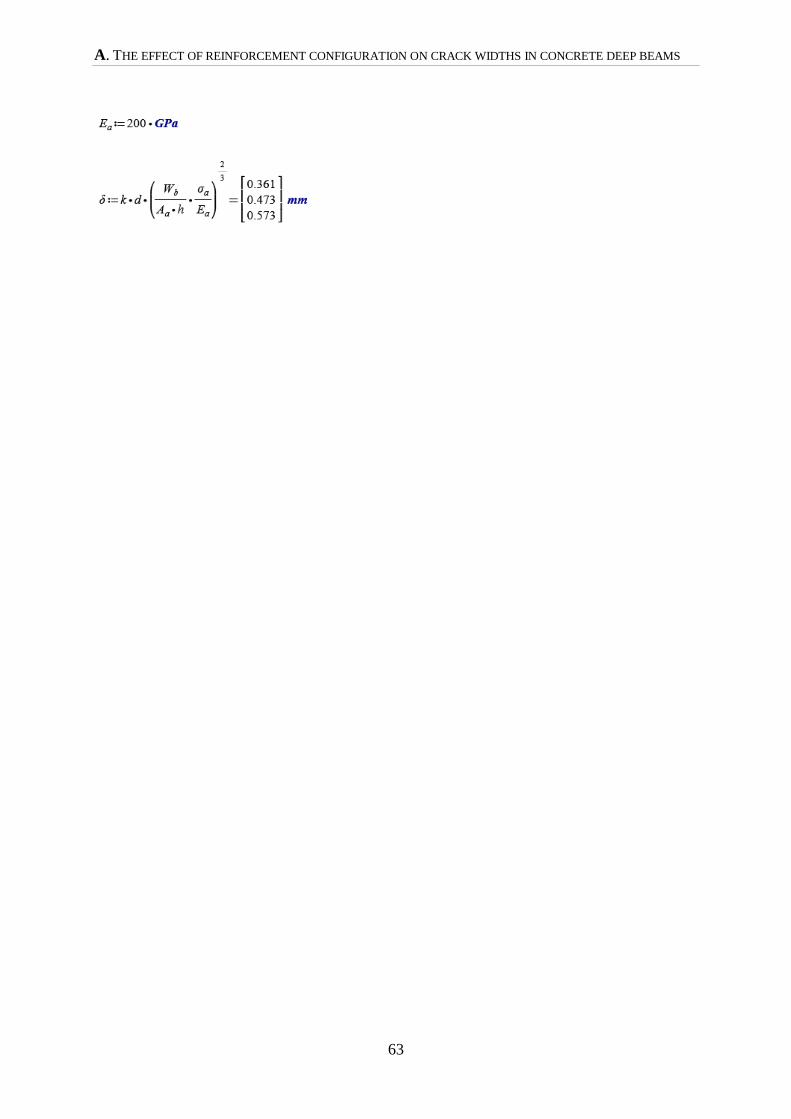
A. THE EFFECT OF REINFORCEMENT CONFIGURATION ON CRACK WIDTHS IN CONCRETE DEEP BEAMS
63

A. THE EFFECT OF REINFORCEMENT CONFIGURATION ON CRACK WIDTHS IN CONCRETE DEEP BEAMS
64
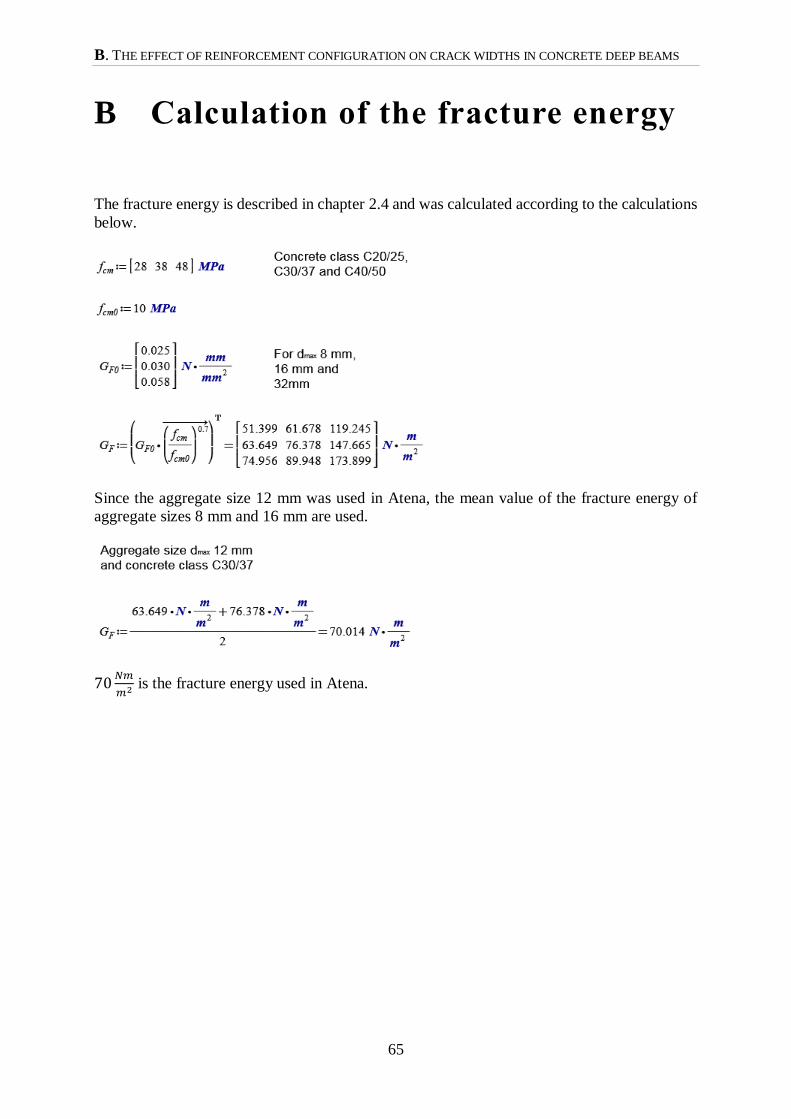
B. THE EFFECT OF REINFORCEMENT CONFIGURATION ON CRACK WIDTHS IN CONCRETE DEEP BEAMS
65
B Calculation of the fracture energy
The fracture energy is described in chapter 2.4 and was calculated according to the calculations
below.
Since the aggregate size 12 mm was used in Atena, the mean value of the fracture energy of
aggregate sizes 8 mm and 16 mm are used.
70𝑁𝑚
𝑚2 is the fracture energy used in Atena.

B. THE EFFECT OF REINFORCEMENT CONFIGURATION ON CRACK WIDTHS IN CONCRETE DEEP BEAMS
66
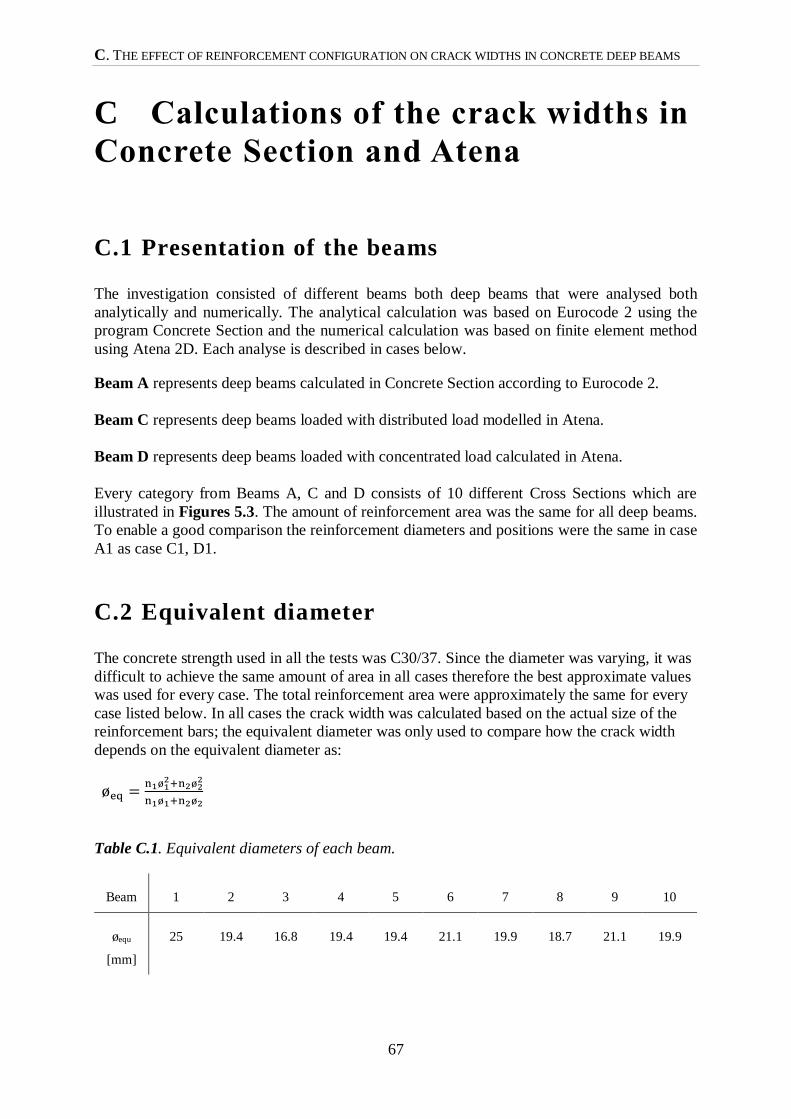
C. THE EFFECT OF REINFORCEMENT CONFIGURATION ON CRACK WIDTHS IN CONCRETE DEEP BEAMS
67
C Calculations of the crack widths in
Concrete Section and Atena
C.1 Presentation of the beams
The investigation consisted of different beams both deep beams that were analysed both
analytically and numerically. The analytical calculation was based on Eurocode 2 using the
program Concrete Section and the numerical calculation was based on finite element method
using Atena 2D. Each analyse is described in cases below.
Beam A represents deep beams calculated in Concrete Section according to Eurocode 2.
Beam C represents deep beams loaded with distributed load modelled in Atena.
Beam D represents deep beams loaded with concentrated load calculated in Atena.
Every category from Beams A, C and D consists of 10 different Cross Sections which are
illustrated in Figures 5.3. The amount of reinforcement area was the same for all deep beams.
To enable a good comparison the reinforcement diameters and positions were the same in case
A1 as case C1, D1.
C.2 Equivalent diameter
The concrete strength used in all the tests was C30/37. Since the diameter was varying, it was
difficult to achieve the same amount of area in all cases therefore the best approximate values
was used for every case. The total reinforcement area were approximately the same for every
case listed below. In all cases the crack width was calculated based on the actual size of the
reinforcement bars; the equivalent diameter was only used to compare how the crack width
depends on the equivalent diameter as:
øeq =n1ø1
2+n2ø22
n1ø1+n2ø2
Table C.1. Equivalent diameters of each beam.
Beam 1 2 3 4 5 6 7 8 9 10
øequ
[mm]
25 19.4 16.8 19.4 19.4 21.1 19.9 18.7 21.1 19.9
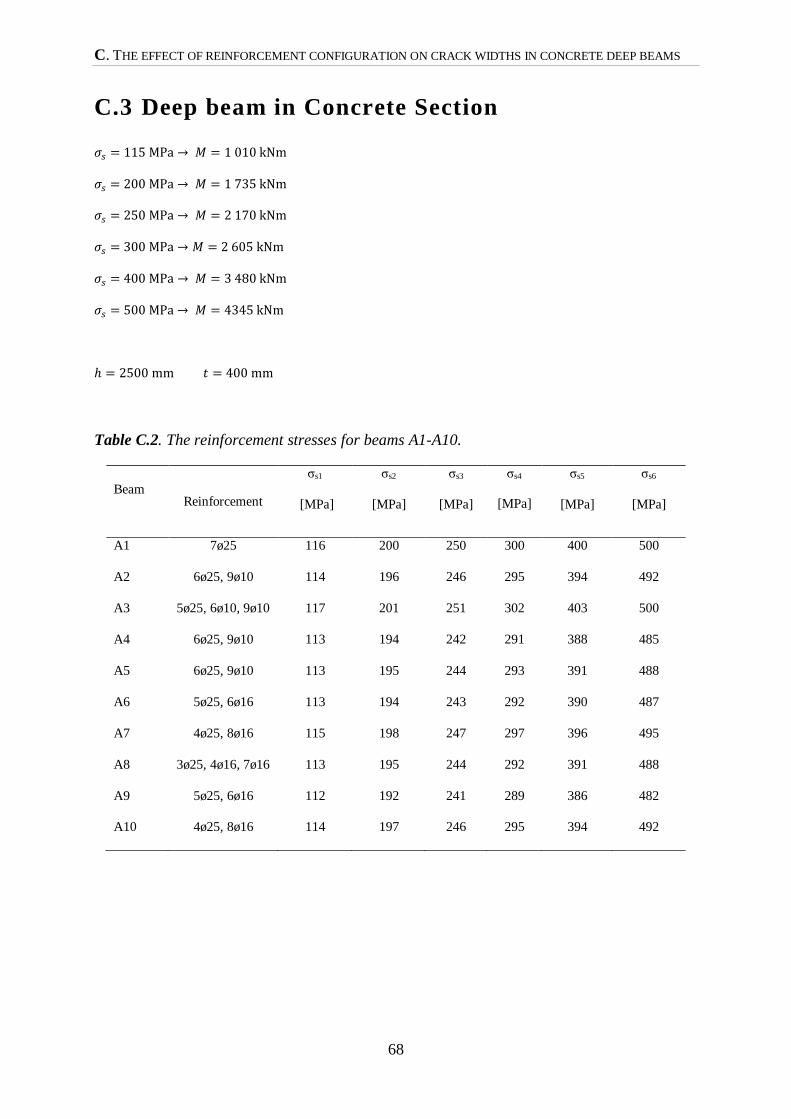
C. THE EFFECT OF REINFORCEMENT CONFIGURATION ON CRACK WIDTHS IN CONCRETE DEEP BEAMS
68
C.3 Deep beam in Concrete Section
𝜎𝑠 = 115 MPa → 𝑀 = 1 010 kNm
𝜎𝑠 = 200 MPa → 𝑀 = 1 735 kNm
𝜎𝑠 = 250 MPa → 𝑀 = 2 170 kNm
𝜎𝑠 = 300 MPa → 𝑀 = 2 605 kNm
𝜎𝑠 = 400 MPa → 𝑀 = 3 480 kNm
𝜎𝑠 = 500 MPa → 𝑀 = 4345 kNm
ℎ = 2500 mm 𝑡 = 400 mm
Table C.2. The reinforcement stresses for beams A1-A10.
Beam Reinforcement
σs1
[MPa]
σs2
[MPa]
σs3
[MPa]
σs4
[MPa]
σs5
[MPa]
σs6
[MPa]
A1 7ø25 116 200 250 300 400 500
A2 6ø25, 9ø10 114 196 246 295 394 492
A3 5ø25, 6ø10, 9ø10 117 201 251 302 403 500
A4 6ø25, 9ø10 113 194 242 291 388 485
A5 6ø25, 9ø10 113 195 244 293 391 488
A6 5ø25, 6ø16 113 194 243 292 390 487
A7 4ø25, 8ø16 115 198 247 297 396 495
A8 3ø25, 4ø16, 7ø16 113 195 244 292 391 488
A9 5ø25, 6ø16 112 192 241 289 386 482
A10 4ø25, 8ø16 114 197 246 295 394 492
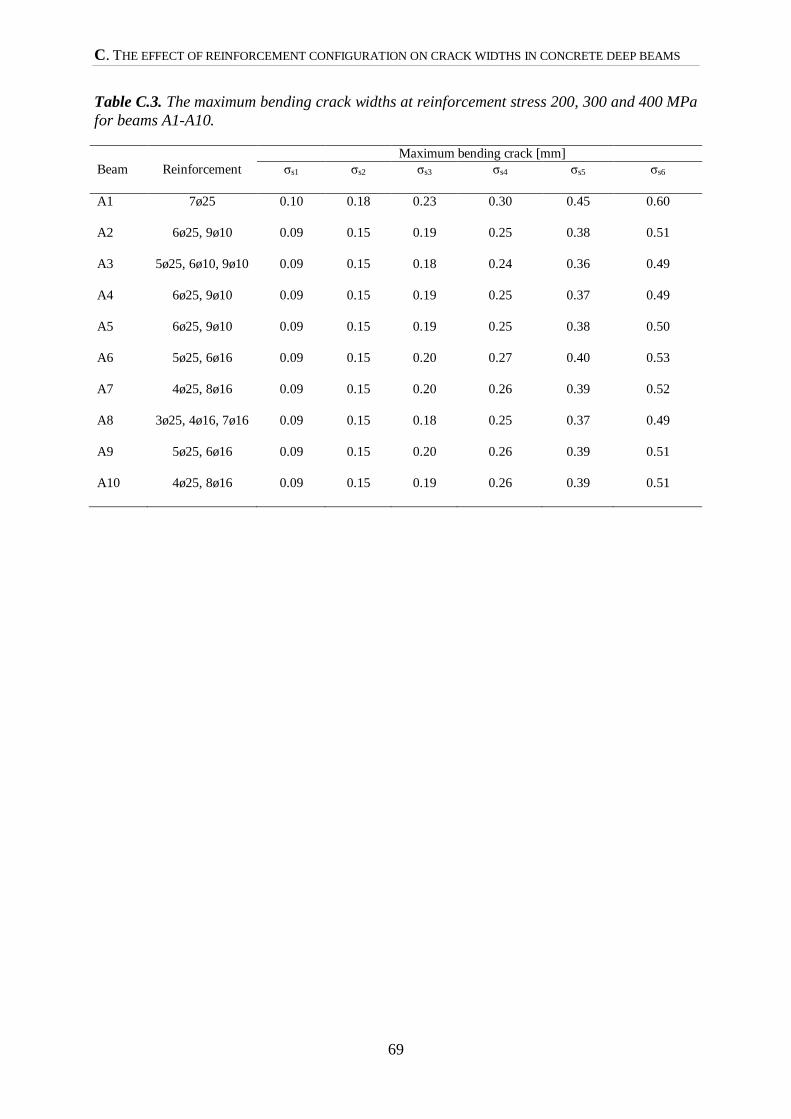
C. THE EFFECT OF REINFORCEMENT CONFIGURATION ON CRACK WIDTHS IN CONCRETE DEEP BEAMS
69
Table C.3. The maximum bending crack widths at reinforcement stress 200, 300 and 400 MPa
for beams A1-A10.
Beam Reinforcement
Maximum bending crack [mm]
σs1 σs2 σs3 σs4 σs5 σs6
A1 7ø25 0.10 0.18 0.23 0.30 0.45 0.60
A2 6ø25, 9ø10 0.09 0.15 0.19 0.25 0.38 0.51
A3 5ø25, 6ø10, 9ø10 0.09 0.15 0.18 0.24 0.36 0.49
A4 6ø25, 9ø10 0.09 0.15 0.19 0.25 0.37 0.49
A5 6ø25, 9ø10 0.09 0.15 0.19 0.25 0.38 0.50
A6 5ø25, 6ø16 0.09 0.15 0.20 0.27 0.40 0.53
A7 4ø25, 8ø16 0.09 0.15 0.20 0.26 0.39 0.52
A8 3ø25, 4ø16, 7ø16 0.09 0.15 0.18 0.25 0.37 0.49
A9 5ø25, 6ø16 0.09 0.15 0.20 0.26 0.39 0.51
A10 4ø25, 8ø16 0.09 0.15 0.19 0.26 0.39 0.51
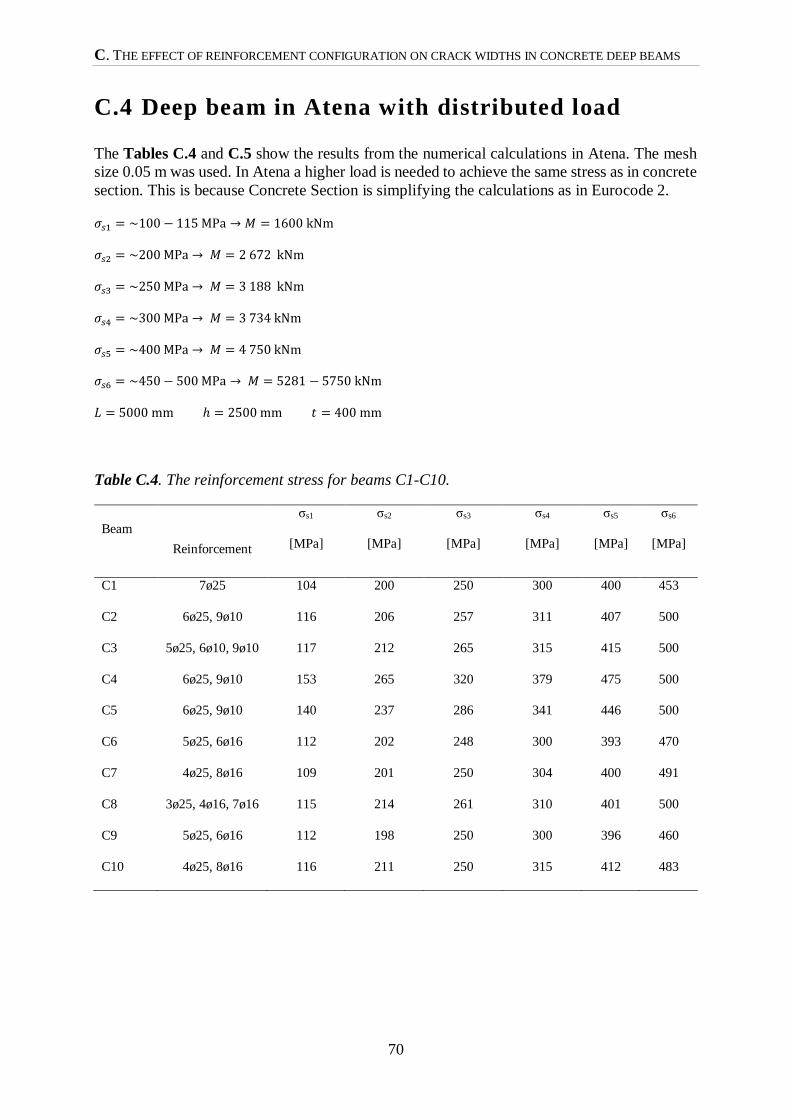
C. THE EFFECT OF REINFORCEMENT CONFIGURATION ON CRACK WIDTHS IN CONCRETE DEEP BEAMS
70
C.4 Deep beam in Atena with distributed load
The Tables C.4 and C.5 show the results from the numerical calculations in Atena. The mesh
size 0.05 m was used. In Atena a higher load is needed to achieve the same stress as in concrete
section. This is because Concrete Section is simplifying the calculations as in Eurocode 2.
𝜎𝑠1 = ~100 − 115 MPa → 𝑀 = 1600 kNm
𝜎𝑠2 = ~200 MPa → 𝑀 = 2 672 kNm
𝜎𝑠3 = ~250 MPa → 𝑀 = 3 188 kNm
𝜎𝑠4 = ~300 MPa → 𝑀 = 3 734 kNm
𝜎𝑠5 = ~400 MPa → 𝑀 = 4 750 kNm
𝜎𝑠6 = ~450 − 500 MPa → 𝑀 = 5281 − 5750 kNm
𝐿 = 5000 mm ℎ = 2500 mm 𝑡 = 400 mm
Table C.4. The reinforcement stress for beams C1-C10.
Beam
Reinforcement
σs1
[MPa]
σs2
[MPa]
σs3
[MPa]
σs4
[MPa]
σs5
[MPa]
σs6
[MPa]
C1 7ø25 104 200 250 300 400 453
C2 6ø25, 9ø10 116 206 257 311 407 500
C3 5ø25, 6ø10, 9ø10 117 212 265 315 415 500
C4 6ø25, 9ø10 153 265 320 379 475 500
C5 6ø25, 9ø10 140 237 286 341 446 500
C6 5ø25, 6ø16 112 202 248 300 393 470
C7 4ø25, 8ø16 109 201 250 304 400 491
C8 3ø25, 4ø16, 7ø16 115 214 261 310 401 500
C9 5ø25, 6ø16 112 198 250 300 396 460
C10 4ø25, 8ø16 116 211 250 315 412 483
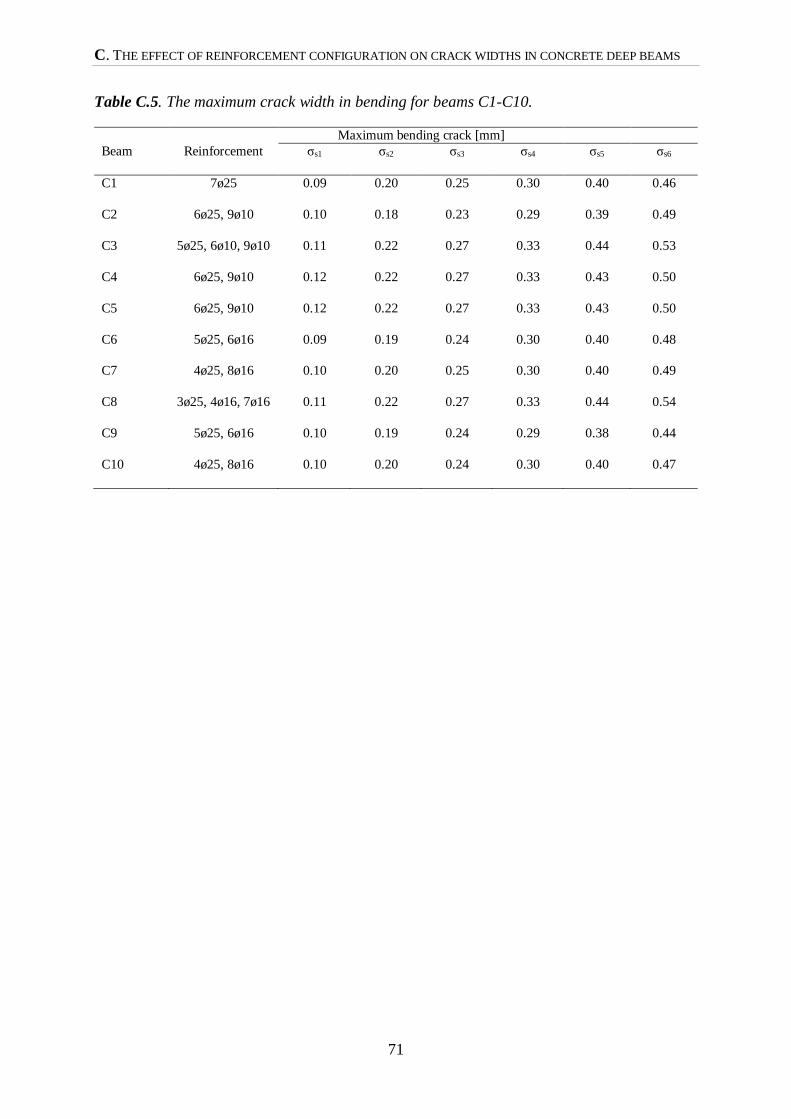
C. THE EFFECT OF REINFORCEMENT CONFIGURATION ON CRACK WIDTHS IN CONCRETE DEEP BEAMS
71
Table C.5. The maximum crack width in bending for beams C1-C10.
Beam Reinforcement
Maximum bending crack [mm]
σs1 σs2 σs3 σs4 σs5 σs6
C1 7ø25 0.09 0.20 0.25 0.30 0.40 0.46
C2 6ø25, 9ø10 0.10 0.18 0.23 0.29 0.39 0.49
C3 5ø25, 6ø10, 9ø10 0.11 0.22 0.27 0.33 0.44 0.53
C4 6ø25, 9ø10 0.12 0.22 0.27 0.33 0.43 0.50
C5 6ø25, 9ø10 0.12 0.22 0.27 0.33 0.43 0.50
C6 5ø25, 6ø16 0.09 0.19 0.24 0.30 0.40 0.48
C7 4ø25, 8ø16 0.10 0.20 0.25 0.30 0.40 0.49
C8 3ø25, 4ø16, 7ø16 0.11 0.22 0.27 0.33 0.44 0.54
C9 5ø25, 6ø16 0.10 0.19 0.24 0.29 0.38 0.44
C10 4ø25, 8ø16 0.10 0.20 0.24 0.30 0.40 0.47
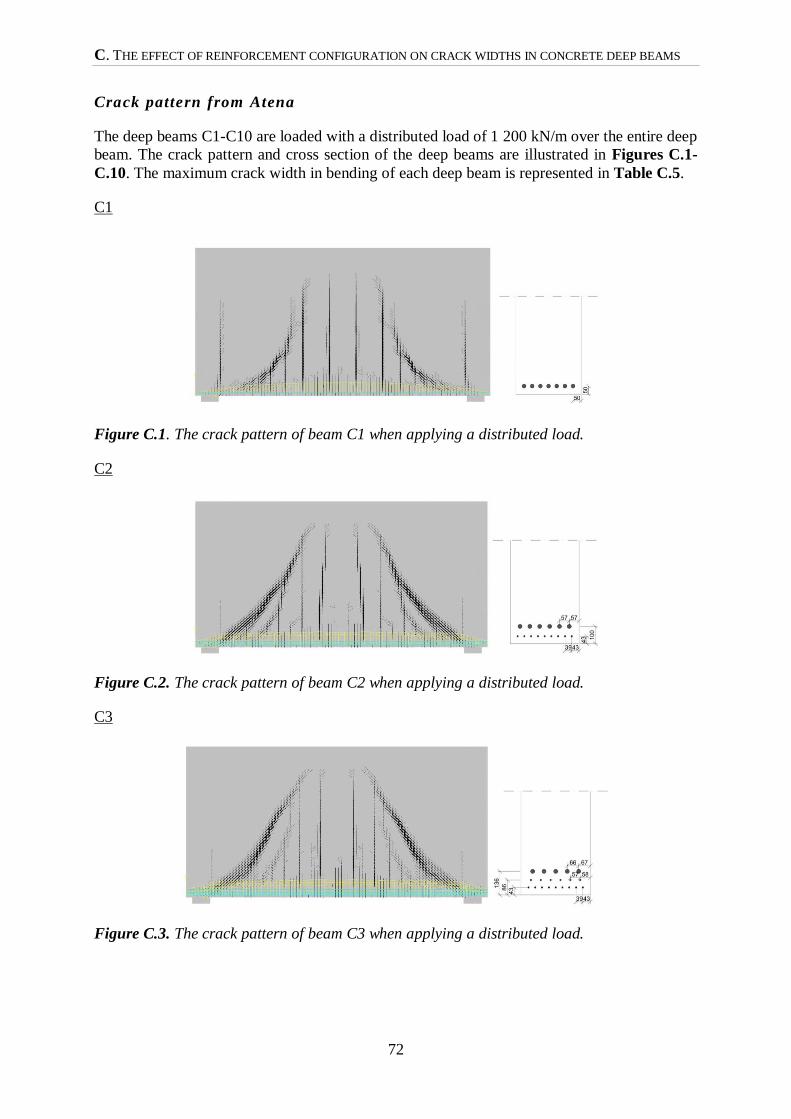
C. THE EFFECT OF REINFORCEMENT CONFIGURATION ON CRACK WIDTHS IN CONCRETE DEEP BEAMS
72
Crack pattern from Atena
The deep beams C1-C10 are loaded with a distributed load of 1 200 kN/m over the entire deep
beam. The crack pattern and cross section of the deep beams are illustrated in Figures C.1-
C.10. The maximum crack width in bending of each deep beam is represented in Table C.5.
C1
Figure C.1. The crack pattern of beam C1 when applying a distributed load.
C2
Figure C.2. The crack pattern of beam C2 when applying a distributed load.
C3
Figure C.3. The crack pattern of beam C3 when applying a distributed load.
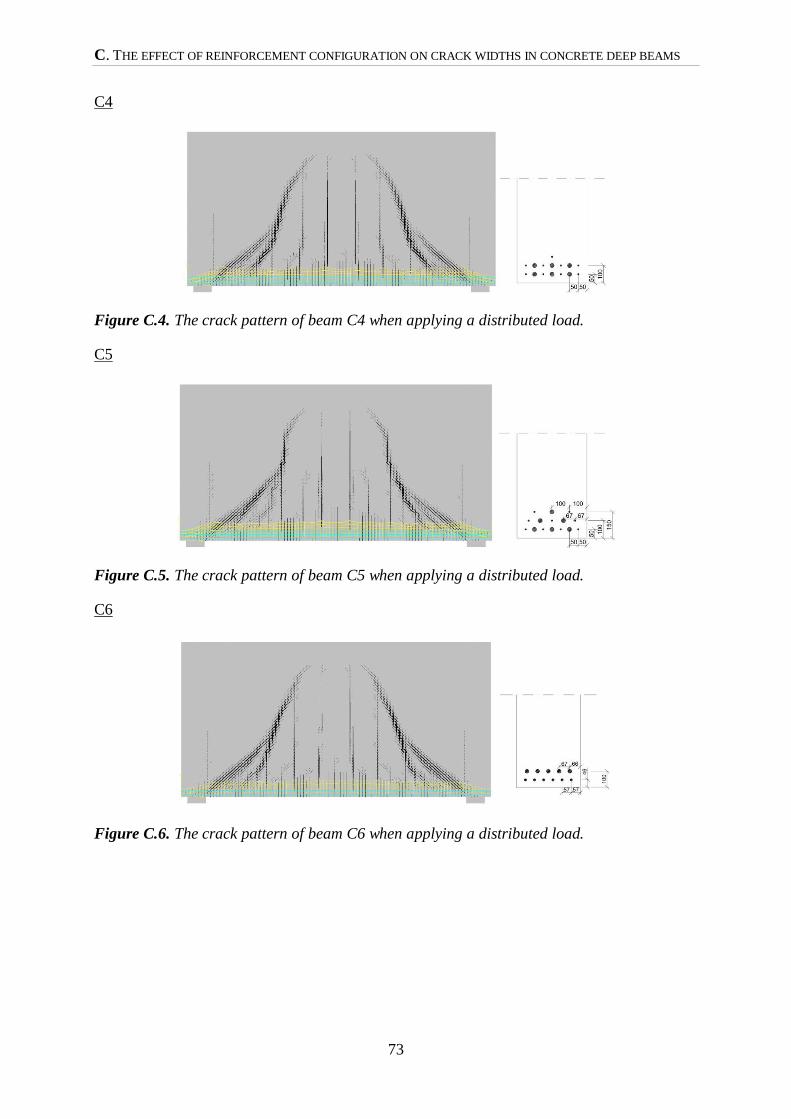
C. THE EFFECT OF REINFORCEMENT CONFIGURATION ON CRACK WIDTHS IN CONCRETE DEEP BEAMS
73
C4
Figure C.4. The crack pattern of beam C4 when applying a distributed load.
C5
Figure C.5. The crack pattern of beam C5 when applying a distributed load.
C6
Figure C.6. The crack pattern of beam C6 when applying a distributed load.
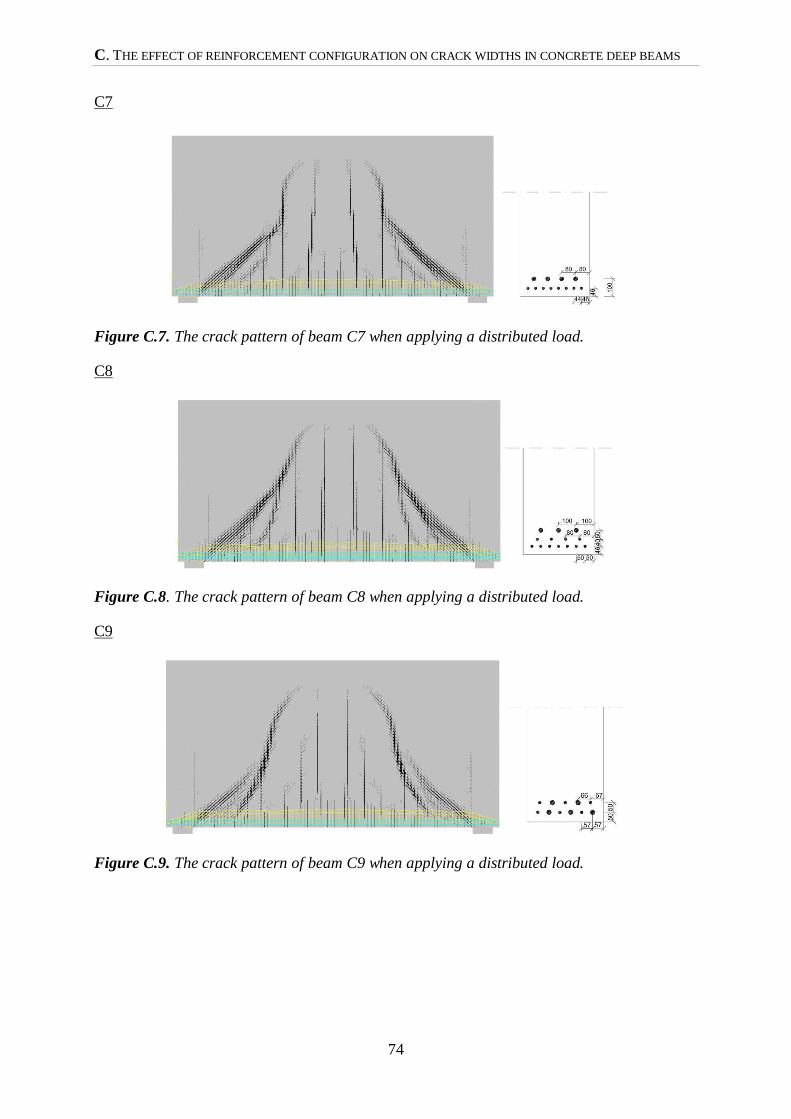
C. THE EFFECT OF REINFORCEMENT CONFIGURATION ON CRACK WIDTHS IN CONCRETE DEEP BEAMS
74
C7
Figure C.7. The crack pattern of beam C7 when applying a distributed load.
C8
Figure C.8. The crack pattern of beam C8 when applying a distributed load.
C9
Figure C.9. The crack pattern of beam C9 when applying a distributed load.
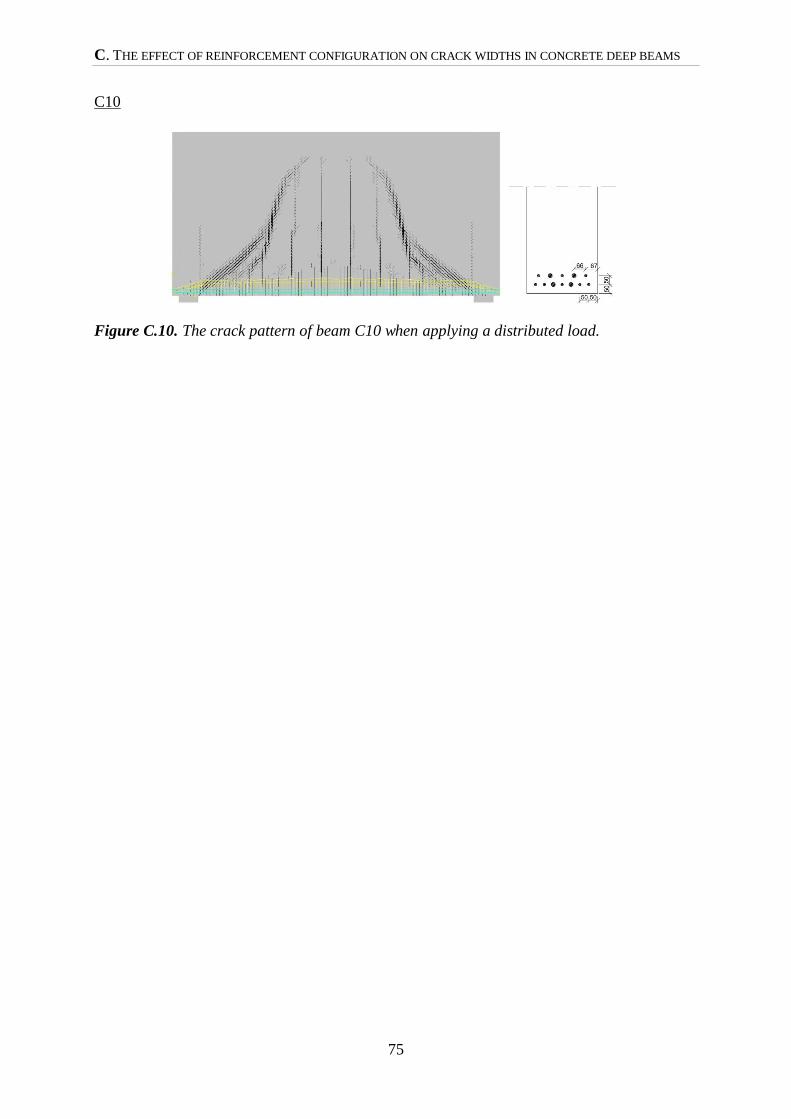
C. THE EFFECT OF REINFORCEMENT CONFIGURATION ON CRACK WIDTHS IN CONCRETE DEEP BEAMS
75
C10
Figure C.10. The crack pattern of beam C10 when applying a distributed load.
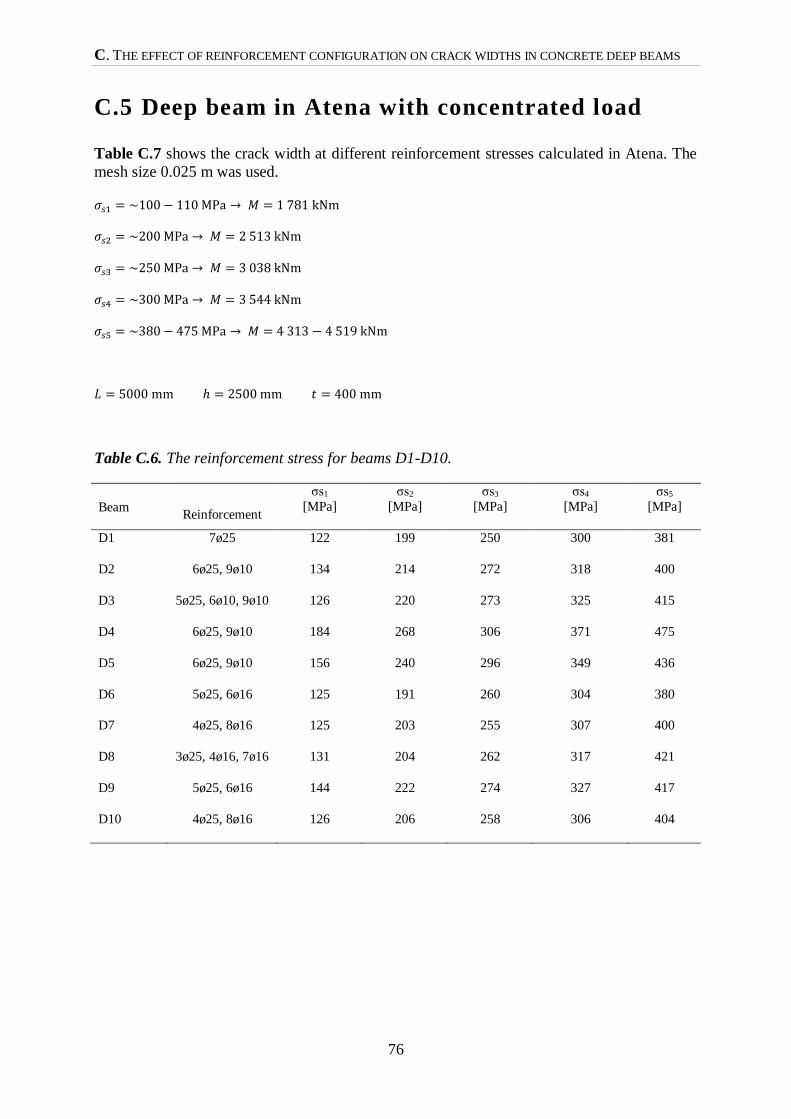
C. THE EFFECT OF REINFORCEMENT CONFIGURATION ON CRACK WIDTHS IN CONCRETE DEEP BEAMS
76
C.5 Deep beam in Atena with concentrated load
Table C.7 shows the crack width at different reinforcement stresses calculated in Atena. The
mesh size 0.025 m was used.
𝜎𝑠1 = ~100 − 110 MPa → 𝑀 = 1 781 kNm
𝜎𝑠2 = ~200 MPa → 𝑀 = 2 513 kNm
𝜎𝑠3 = ~250 MPa → 𝑀 = 3 038 kNm
𝜎𝑠4 = ~300 MPa → 𝑀 = 3 544 kNm
𝜎𝑠5 = ~380 − 475 MPa → 𝑀 = 4 313 − 4 519 kNm
𝐿 = 5000 mm ℎ = 2500 mm 𝑡 = 400 mm
Table C.6. The reinforcement stress for beams D1-D10.
Beam Reinforcement
σs1
[MPa]
σs2
[MPa]
σs3
[MPa]
σs4
[MPa]
σs5
[MPa]
D1 7ø25 122 199 250 300 381
D2 6ø25, 9ø10 134 214 272 318 400
D3 5ø25, 6ø10, 9ø10 126 220 273 325 415
D4 6ø25, 9ø10 184 268 306 371 475
D5 6ø25, 9ø10 156 240 296 349 436
D6 5ø25, 6ø16 125 191 260 304 380
D7 4ø25, 8ø16 125 203 255 307 400
D8 3ø25, 4ø16, 7ø16 131 204 262 317 421
D9 5ø25, 6ø16 144 222 274 327 417
D10 4ø25, 8ø16 126 206 258 306 404
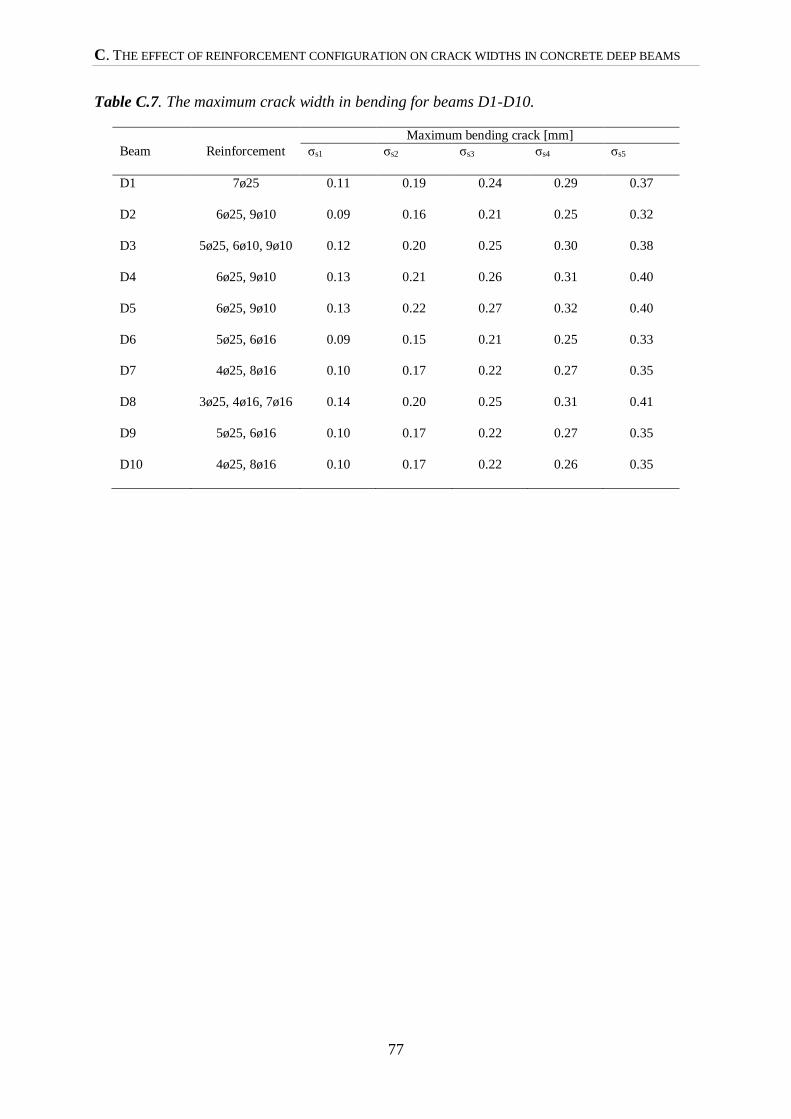
C. THE EFFECT OF REINFORCEMENT CONFIGURATION ON CRACK WIDTHS IN CONCRETE DEEP BEAMS
77
Table C.7. The maximum crack width in bending for beams D1-D10.
Beam Reinforcement
Maximum bending crack [mm]
σs1 σs2 σs3 σs4 σs5
D1 7ø25 0.11 0.19 0.24 0.29 0.37
D2 6ø25, 9ø10 0.09 0.16 0.21 0.25 0.32
D3 5ø25, 6ø10, 9ø10 0.12 0.20 0.25 0.30 0.38
D4 6ø25, 9ø10 0.13 0.21 0.26 0.31 0.40
D5 6ø25, 9ø10 0.13 0.22 0.27 0.32 0.40
D6 5ø25, 6ø16 0.09 0.15 0.21 0.25 0.33
D7 4ø25, 8ø16 0.10 0.17 0.22 0.27 0.35
D8 3ø25, 4ø16, 7ø16 0.14 0.20 0.25 0.31 0.41
D9 5ø25, 6ø16 0.10 0.17 0.22 0.27 0.35
D10 4ø25, 8ø16 0.10 0.17 0.22 0.26 0.35
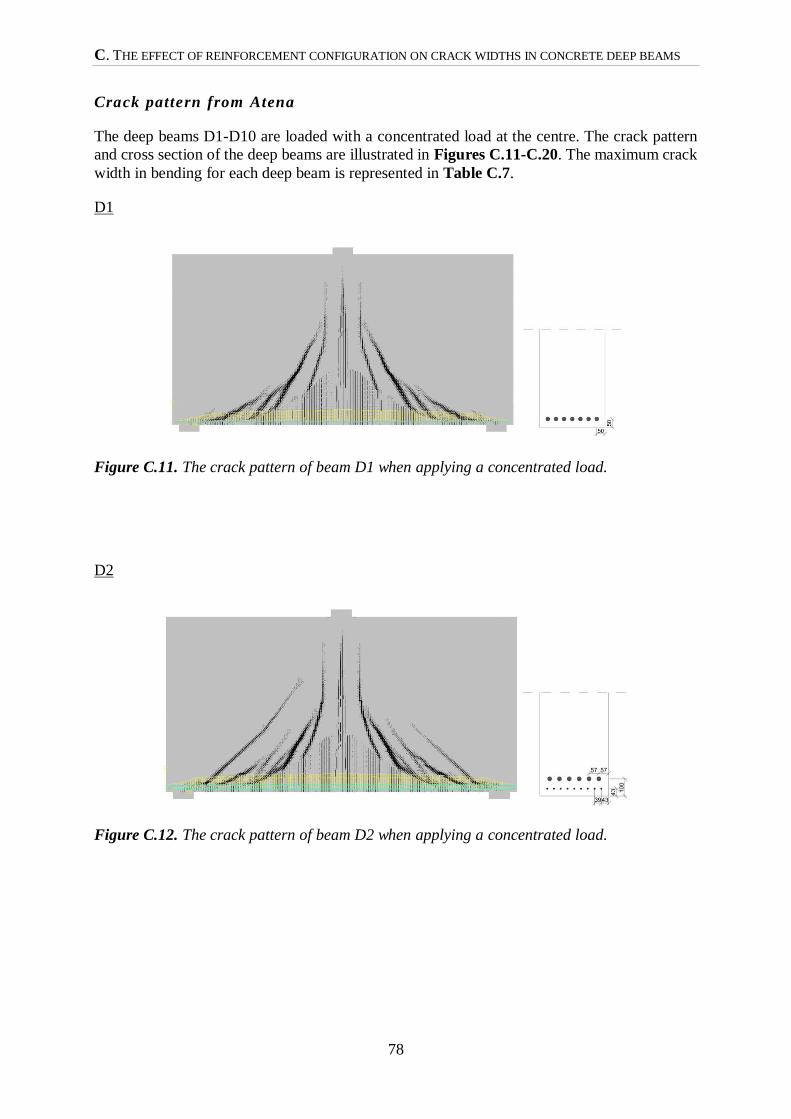
C. THE EFFECT OF REINFORCEMENT CONFIGURATION ON CRACK WIDTHS IN CONCRETE DEEP BEAMS
78
Crack pattern from Atena
The deep beams D1-D10 are loaded with a concentrated load at the centre. The crack pattern
and cross section of the deep beams are illustrated in Figures C.11-C.20. The maximum crack
width in bending for each deep beam is represented in Table C.7.
D1
Figure C.11. The crack pattern of beam D1 when applying a concentrated load.
D2
Figure C.12. The crack pattern of beam D2 when applying a concentrated load.
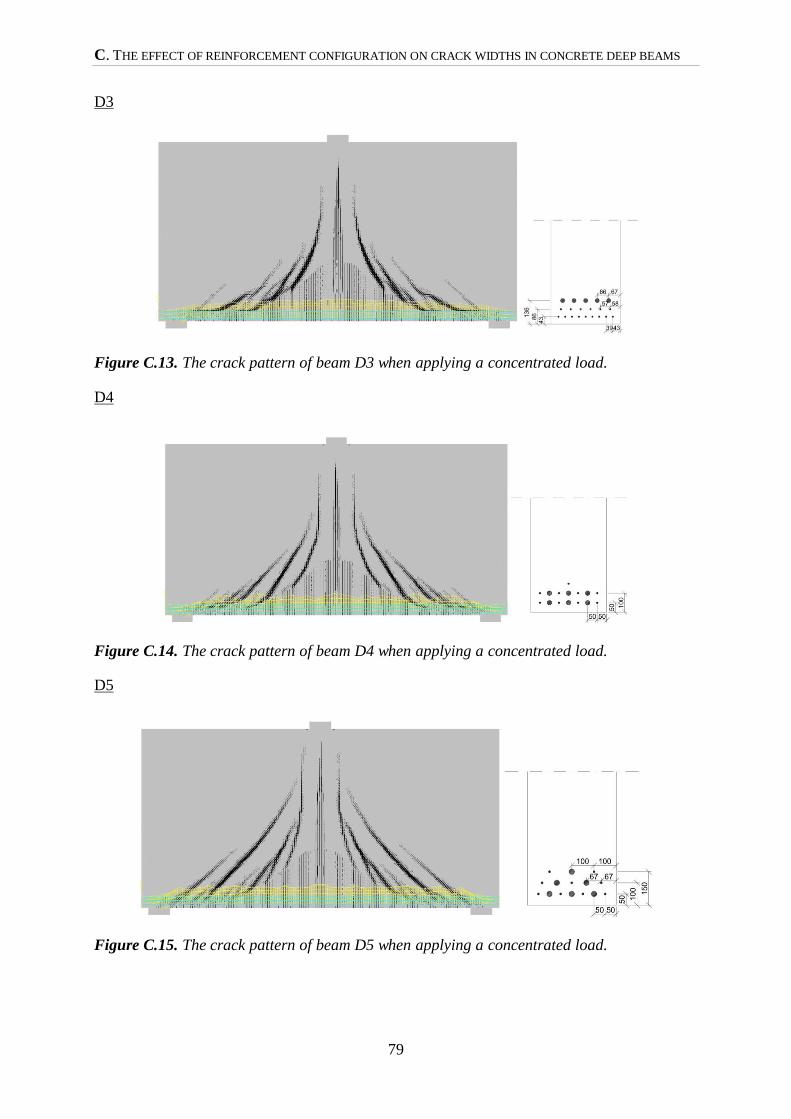
C. THE EFFECT OF REINFORCEMENT CONFIGURATION ON CRACK WIDTHS IN CONCRETE DEEP BEAMS
79
D3
Figure C.13. The crack pattern of beam D3 when applying a concentrated load.
D4
Figure C.14. The crack pattern of beam D4 when applying a concentrated load.
D5
Figure C.15. The crack pattern of beam D5 when applying a concentrated load.
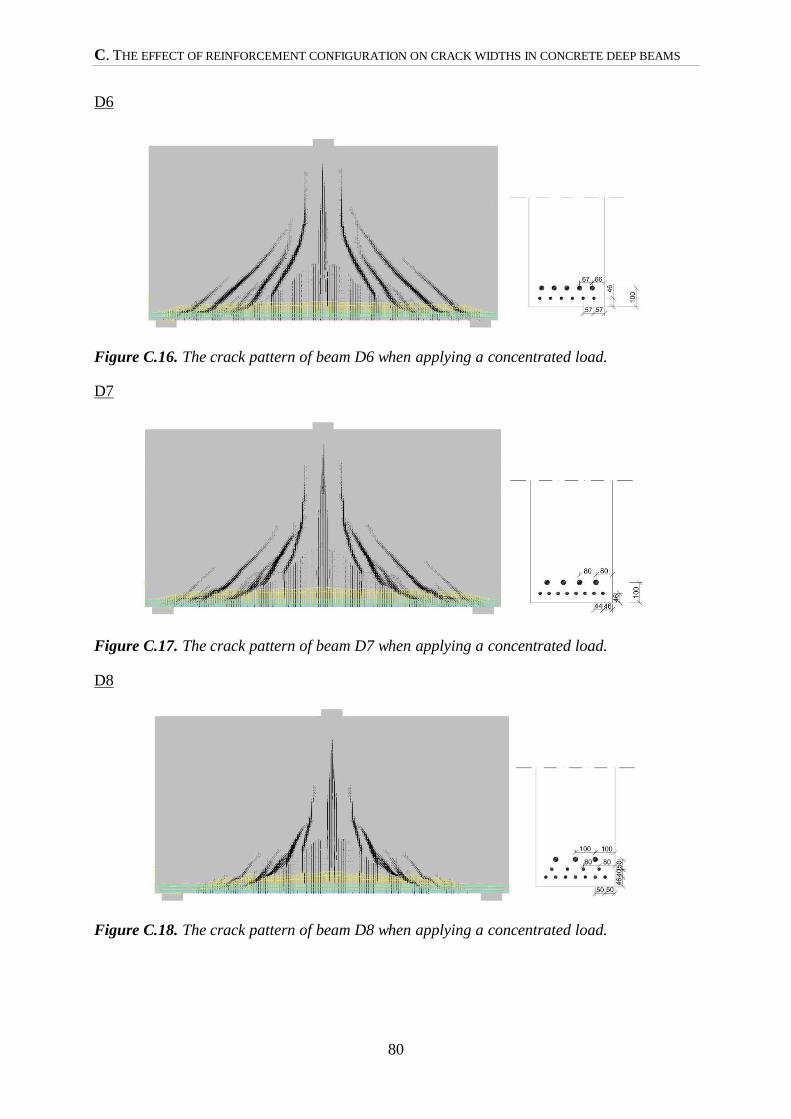
C. THE EFFECT OF REINFORCEMENT CONFIGURATION ON CRACK WIDTHS IN CONCRETE DEEP BEAMS
80
D6
Figure C.16. The crack pattern of beam D6 when applying a concentrated load.
D7
Figure C.17. The crack pattern of beam D7 when applying a concentrated load.
D8
Figure C.18. The crack pattern of beam D8 when applying a concentrated load.
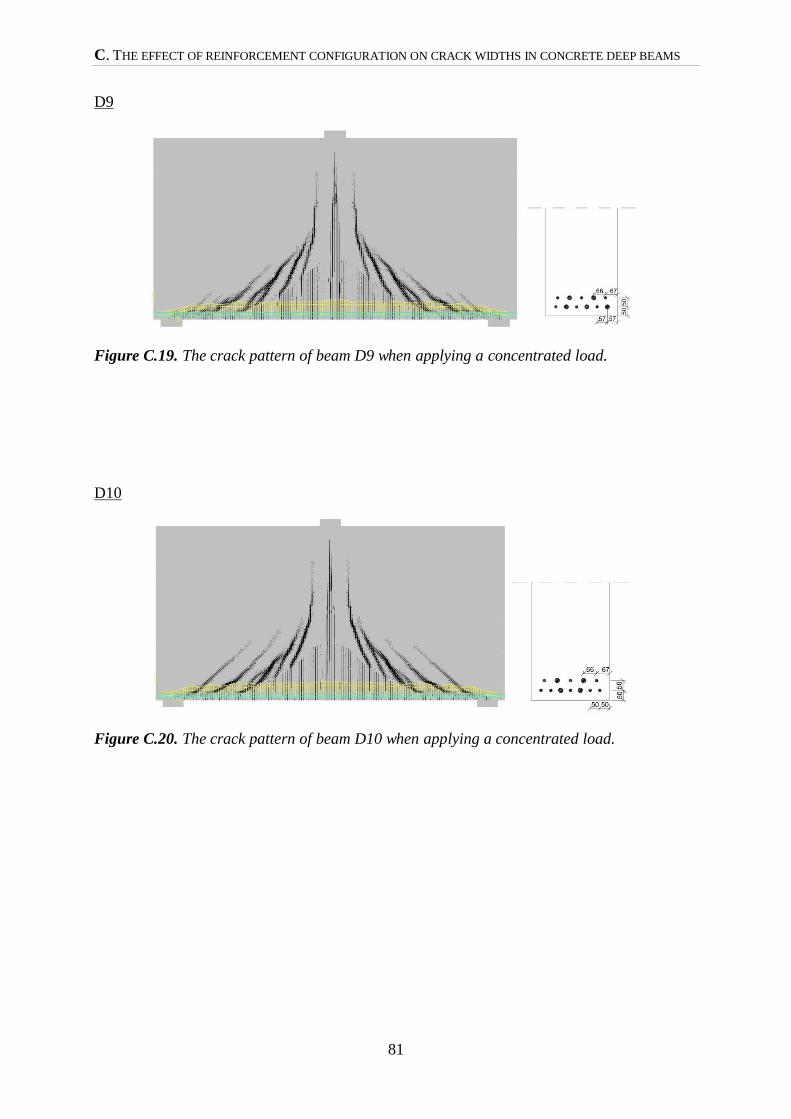
C. THE EFFECT OF REINFORCEMENT CONFIGURATION ON CRACK WIDTHS IN CONCRETE DEEP BEAMS
81
D9
Figure C.19. The crack pattern of beam D9 when applying a concentrated load.
D10
Figure C.20. The crack pattern of beam D10 when applying a concentrated load.
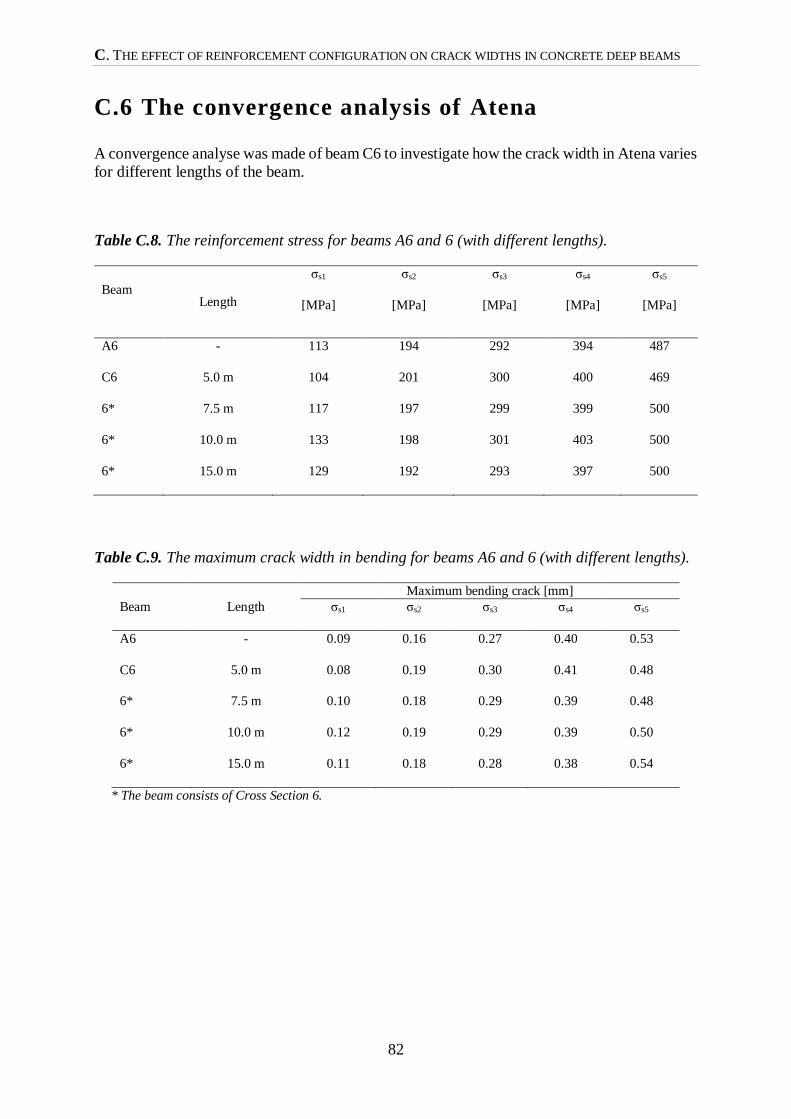
C. THE EFFECT OF REINFORCEMENT CONFIGURATION ON CRACK WIDTHS IN CONCRETE DEEP BEAMS
82
C.6 The convergence analysis of Atena
A convergence analyse was made of beam C6 to investigate how the crack width in Atena varies
for different lengths of the beam.
Table C.8. The reinforcement stress for beams A6 and 6 (with different lengths).
Beam Length
σs1
[MPa]
σs2
[MPa]
σs3
[MPa]
σs4
[MPa]
σs5
[MPa]
A6 - 113 194 292 394 487
C6 5.0 m 104 201 300 400 469
6* 7.5 m 117 197 299 399 500
6* 10.0 m 133 198 301 403 500
6* 15.0 m 129 192 293 397 500
Table C.9. The maximum crack width in bending for beams A6 and 6 (with different lengths).
Beam Length
Maximum bending crack [mm]
σs1 σs2 σs3 σs4 σs5
A6 - 0.09 0.16 0.27 0.40 0.53
C6 5.0 m 0.08 0.19 0.30 0.41 0.48
6* 7.5 m 0.10 0.18 0.29 0.39 0.48
6* 10.0 m 0.12 0.19 0.29 0.39 0.50
6* 15.0 m 0.11 0.18 0.28 0.38 0.54
* The beam consists of Cross Section 6.
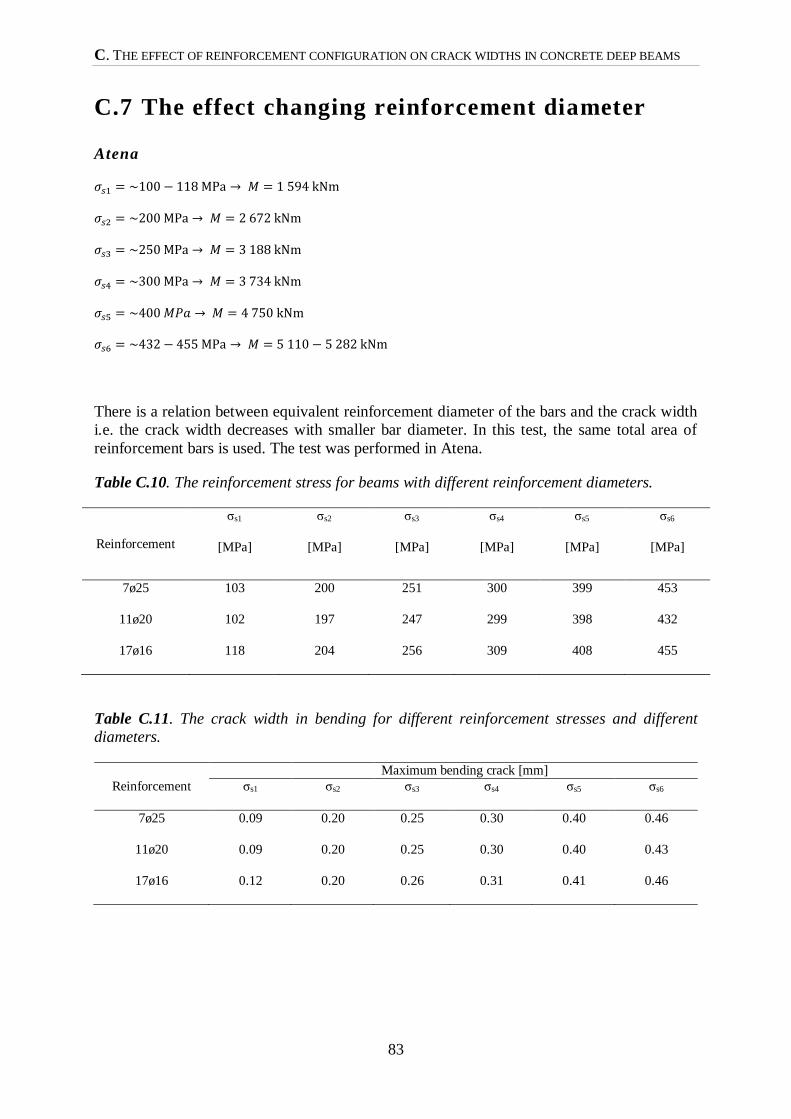
C. THE EFFECT OF REINFORCEMENT CONFIGURATION ON CRACK WIDTHS IN CONCRETE DEEP BEAMS
83
C.7 The effect changing reinforcement diameter
Atena
𝜎𝑠1 = ~100 − 118 MPa → 𝑀 = 1 594 kNm
𝜎𝑠2 = ~200 MPa → 𝑀 = 2 672 kNm
𝜎𝑠3 = ~250 MPa → 𝑀 = 3 188 kNm
𝜎𝑠4 = ~300 MPa → 𝑀 = 3 734 kNm
𝜎𝑠5 = ~400 𝑀𝑃𝑎 → 𝑀 = 4 750 kNm
𝜎𝑠6 = ~432 − 455 MPa → 𝑀 = 5 110 − 5 282 kNm
There is a relation between equivalent reinforcement diameter of the bars and the crack width
i.e. the crack width decreases with smaller bar diameter. In this test, the same total area of
reinforcement bars is used. The test was performed in Atena.
Table C.10. The reinforcement stress for beams with different reinforcement diameters.
Reinforcement
σs1
[MPa]
σs2
[MPa]
σs3
[MPa]
σs4
[MPa]
σs5
[MPa]
σs6
[MPa]
7ø25 103 200 251 300 399 453
11ø20 102 197 247 299 398 432
17ø16 118 204 256 309 408 455
Table C.11. The crack width in bending for different reinforcement stresses and different
diameters.
Reinforcement
Maximum bending crack [mm]
σs1 σs2 σs3 σs4 σs5 σs6
7ø25 0.09 0.20 0.25 0.30 0.40 0.46
11ø20 0.09 0.20 0.25 0.30 0.40 0.43
17ø16 0.12 0.20 0.26 0.31 0.41 0.46
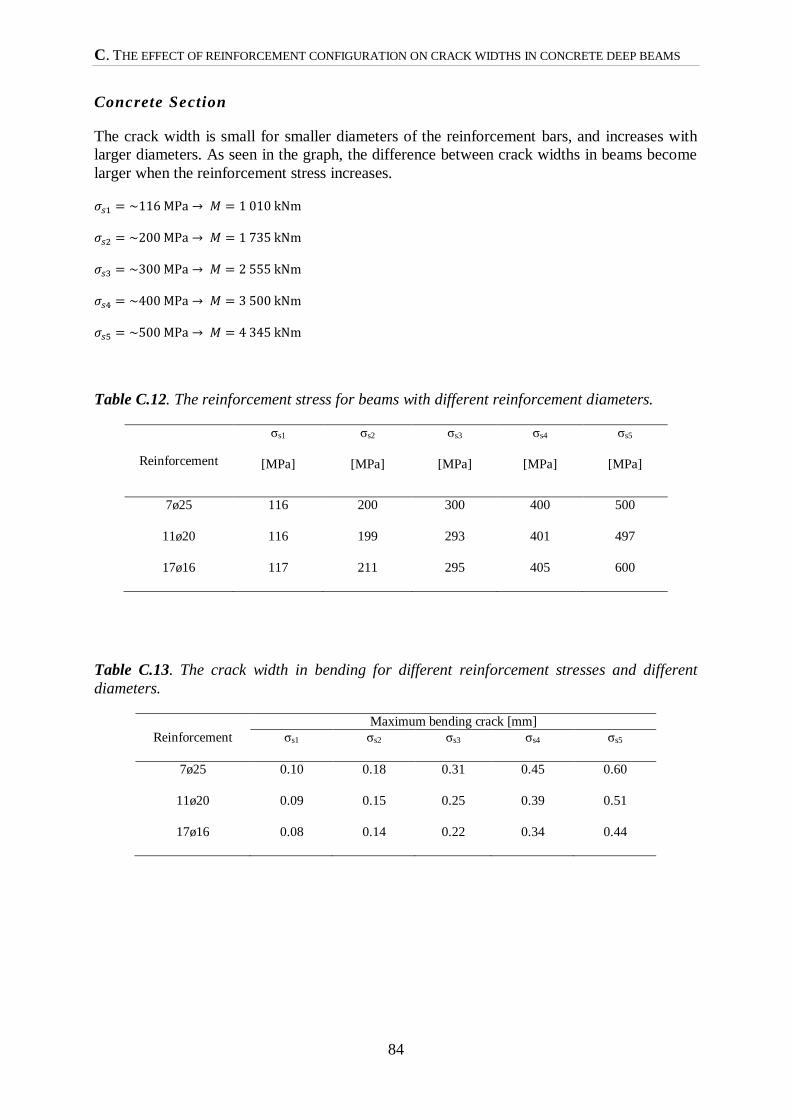
C. THE EFFECT OF REINFORCEMENT CONFIGURATION ON CRACK WIDTHS IN CONCRETE DEEP BEAMS
84
Concrete Section
The crack width is small for smaller diameters of the reinforcement bars, and increases with
larger diameters. As seen in the graph, the difference between crack widths in beams become
larger when the reinforcement stress increases.
𝜎𝑠1 = ~116 MPa → 𝑀 = 1 010 kNm
𝜎𝑠2 = ~200 MPa → 𝑀 = 1 735 kNm
𝜎𝑠3 = ~300 MPa → 𝑀 = 2 555 kNm
𝜎𝑠4 = ~400 MPa → 𝑀 = 3 500 kNm
𝜎𝑠5 = ~500 MPa → 𝑀 = 4 345 kNm
Table C.12. The reinforcement stress for beams with different reinforcement diameters.
Reinforcement
σs1
[MPa]
σs2
[MPa]
σs3
[MPa]
σs4
[MPa]
σs5
[MPa]
7ø25 116 200 300 400 500
11ø20 116 199 293 401 497
17ø16 117 211 295 405 600
Table C.13. The crack width in bending for different reinforcement stresses and different
diameters.
Reinforcement
Maximum bending crack [mm]
σs1 σs2 σs3 σs4 σs5
7ø25 0.10 0.18 0.31 0.45 0.60
11ø20 0.09 0.15 0.25 0.39 0.51
17ø16 0.08 0.14 0.22 0.34 0.44
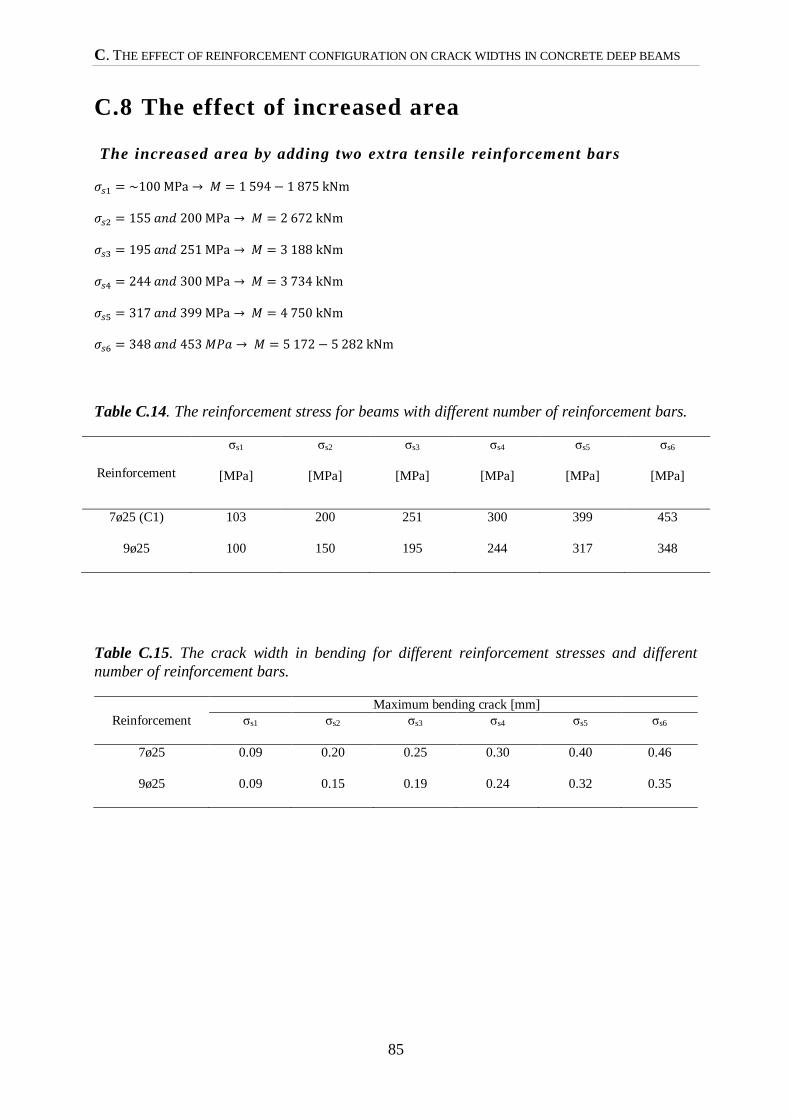
C. THE EFFECT OF REINFORCEMENT CONFIGURATION ON CRACK WIDTHS IN CONCRETE DEEP BEAMS
85
C.8 The effect of increased area
The increased area by adding two extra tensile reinforcement bars
𝜎𝑠1 = ~100 MPa → 𝑀 = 1 594 − 1 875 kNm
𝜎𝑠2 = 155 𝑎𝑛𝑑 200 MPa → 𝑀 = 2 672 kNm
𝜎𝑠3 = 195 𝑎𝑛𝑑 251 MPa → 𝑀 = 3 188 kNm
𝜎𝑠4 = 244 𝑎𝑛𝑑 300 MPa → 𝑀 = 3 734 kNm
𝜎𝑠5 = 317 𝑎𝑛𝑑 399 MPa → 𝑀 = 4 750 kNm
𝜎𝑠6 = 348 𝑎𝑛𝑑 453 𝑀𝑃𝑎 → 𝑀 = 5 172 − 5 282 kNm
Table C.14. The reinforcement stress for beams with different number of reinforcement bars.
Reinforcement
σs1
[MPa]
σs2
[MPa]
σs3
[MPa]
σs4
[MPa]
σs5
[MPa]
σs6
[MPa]
7ø25 (C1) 103 200 251 300 399 453
9ø25 100 150 195 244 317 348
Table C.15. The crack width in bending for different reinforcement stresses and different
number of reinforcement bars.
Reinforcement
Maximum bending crack [mm]
σs1 σs2 σs3 σs4 σs5 σs6
7ø25 0.09 0.20 0.25 0.30 0.40 0.46
9ø25 0.09 0.15 0.19 0.24 0.32 0.35