Embed Size (px)
Citation preview
WELDING RESEARCH
NOVEMBER 2016 / WELDING JOURNAL 419-s
Introduction The type of shielding gas used inpartial penetration keyhole laser weld-ing has been shown to have dramaticeffects on the amount of porosity thatforms in the welds (Refs. 1–4). At at-mospheric pressure, inert gases suchas Ar tend to produce high levels ofporosity in commonly welded metals
such as steels and austenitic stainlesssteels. This type of porosity is the re-sult of voids created in unstable key-holes, and is different from solidifica-tion-induced porosity that forms assolubility limits are exceeded duringcooling of liquid weld pools that aresupersaturated with gases such as oxy-gen and hydrogen. However, whenthese same metals are welded in nitro-
gen, instead of Ar, the welds containlittle or no porosity under identicallaser welding conditions (Refs. 1, 3, 4). Certain metals, such as nickel, pro-duce high levels of porosity when laserwelded in Ar or nitrogen (Ref. 1), andother metals, such as titanium, cannotbe welded in nitrogen due to its highreactivity with nitrogen. Although thereasons for porosity formation in nick-el and titanium aren’t perfectly clear,it is believed the lack of solubilityand/or reactivity of inert shielding gasin the metal being welded play an im-portant role in the retention of porosi-ty in the final weld joint (Ref. 1). Be-cause of this, other solutions are need-ed to minimize porosity in partial pen-etration Ni and Ti keyhole laser welds. One way to minimize the effects ofshielding gas on porosity is to performthe laser weld in vacuum or under re-duced pressure conditions, and thistechnique is being investigated as analternative to conventional atmos-pheric laser welding. One study per-formed by Katayama et al. shows ben-eficial effects on weld penetration andreduced porosity in reduced pressurelaser welds made in aluminum andstainless steel (Ref. 5). It is speculatedthat reduced porosity occurs in thesewelds due to changes in the liquid con-vective path that promote gas pore re-moval from deep laser welds relativeto those made at atmospheric pressurein Ar or He inert gas. More recentstudies have also confirmed the bene-
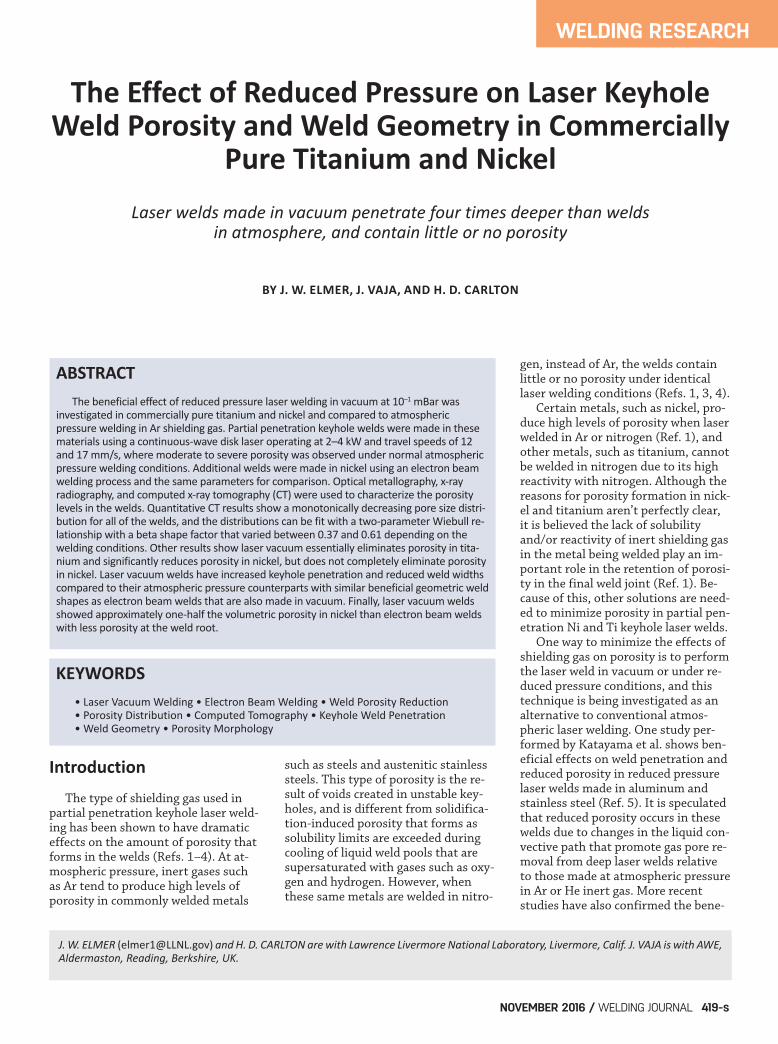
The Effect of Reduced Pressure on Laser KeyholeWeld Porosity and Weld Geometry in Commercially
Pure Titanium and NickelLaser welds made in vacuum penetrate four times deeper than welds
in atmosphere, and contain little or no porosity
BY J. W. ELMER, J. VAJA, AND H. D. CARLTON
ABSTRACT The beneficial effect of reduced pressure laser welding in vacuum at 10–1 mBar wasinvestigated in commercially pure titanium and nickel and compared to atmosphericpressure welding in Ar shielding gas. Partial penetration keyhole welds were made in thesematerials using a continuouswave disk laser operating at 2–4 kW and travel speeds of 12and 17 mm/s, where moderate to severe porosity was observed under normal atmosphericpressure welding conditions. Additional welds were made in nickel using an electron beamwelding process and the same parameters for comparison. Optical metallography, xray radiography, and computed xray tomography (CT) were used to characterize the porositylevels in the welds. Quantitative CT results show a monotonically decreasing pore size distribution for all of the welds, and the distributions can be fit with a twoparameter Wiebull relationship with a beta shape factor that varied between 0.37 and 0.61 depending on thewelding conditions. Other results show laser vacuum essentially eliminates porosity in titanium and significantly reduces porosity in nickel, but does not completely eliminate porosityin nickel. Laser vacuum welds have increased keyhole penetration and reduced weld widthscompared to their atmospheric pressure counterparts with similar beneficial geometric weldshapes as electron beam welds that are also made in vacuum. Finally, laser vacuum weldsshowed approximately onehalf the volumetric porosity in nickel than electron beam weldswith less porosity at the weld root.
KEYWORDS • Laser Vacuum Welding • Electron Beam Welding • Weld Porosity Reduction • Porosity Distribution • Computed Tomography • Keyhole Weld Penetration • Weld Geometry • Porosity Morphology
J. W. ELMER ([email protected]) and H. D. CARLTON are with Lawrence Livermore National Laboratory, Livermore, Calif. J. VAJA is with AWE,Aldermaston, Reading, Berkshire, UK.
Elmer Paper 201628 November 2016_Layout 1 10/17/16 10:56 AM Page 419
WELDING RESEARCH
WELDING JOURNAL / NOVEMBER 2016, VOL. 95420-s
ficial effects of reduced pressure multi-kW laser welding of structural andstainless steels through experiments(Refs. 6, 7) and modeling (Ref. 8).Commercial laser vacuum systems arejust now being developed for industri-al applications to take advantage ofthese benefits. In this study, commercially purenickel and titanium were laser weldedwith a high-power CW disk laser underargon shielding gas and reduced pres-sure conditions. This set of experi-ments was aimed at demonstratingthe beneficial effects of laser keyholewelding under reduced atmosphere forporosity-prone materials.
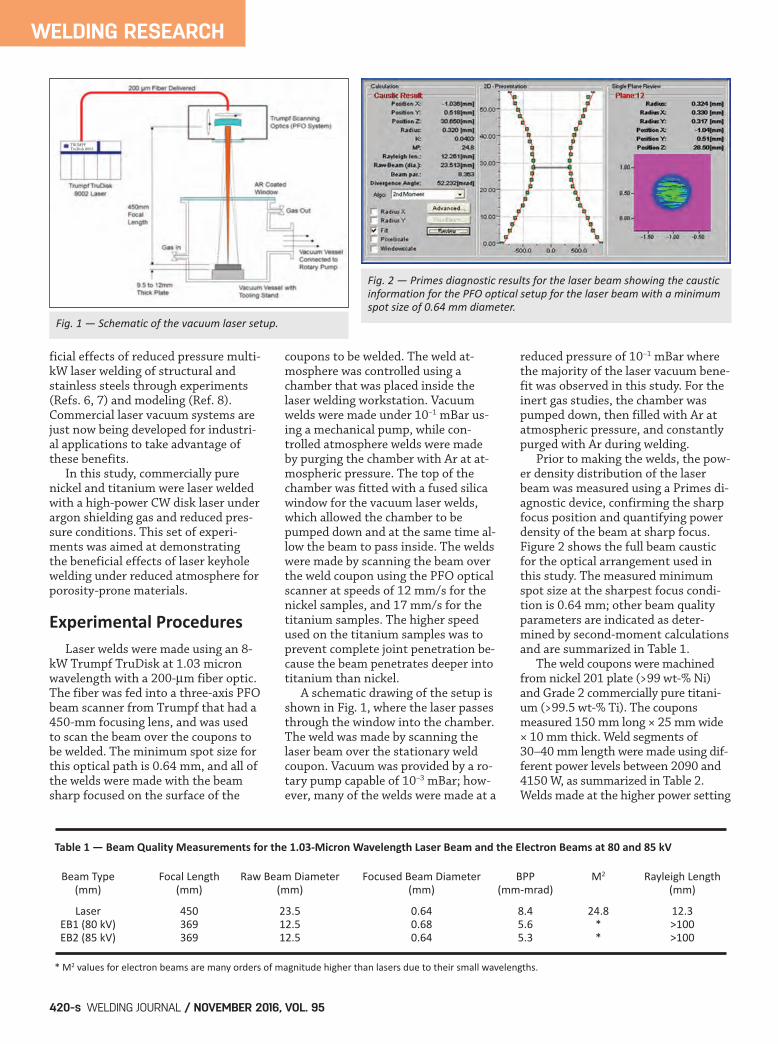
Experimental Procedures Laser welds were made using an 8-kW Trumpf TruDisk at 1.03 micronwavelength with a 200-m fiber optic.The fiber was fed into a three-axis PFObeam scanner from Trumpf that had a450-mm focusing lens, and was usedto scan the beam over the coupons tobe welded. The minimum spot size forthis optical path is 0.64 mm, and all ofthe welds were made with the beamsharp focused on the surface of the
coupons to be welded. The weld at-mosphere was controlled using achamber that was placed inside thelaser welding workstation. Vacuumwelds were made under 10–1 mBar us-ing a mechanical pump, while con-trolled atmosphere welds were madeby purging the chamber with Ar at at-mospheric pressure. The top of thechamber was fitted with a fused silicawindow for the vacuum laser welds,which allowed the chamber to bepumped down and at the same time al-low the beam to pass inside. The weldswere made by scanning the beam overthe weld coupon using the PFO opticalscanner at speeds of 12 mm/s for thenickel samples, and 17 mm/s for thetitanium samples. The higher speedused on the titanium samples was toprevent complete joint penetration be-cause the beam penetrates deeper intotitanium than nickel. A schematic drawing of the setup isshown in Fig. 1, where the laser passesthrough the window into the chamber.The weld was made by scanning thelaser beam over the stationary weldcoupon. Vacuum was provided by a ro-tary pump capable of 10–3 mBar; how-ever, many of the welds were made at a
reduced pressure of 10–1 mBar wherethe majority of the laser vacuum bene-fit was observed in this study. For theinert gas studies, the chamber waspumped down, then filled with Ar atatmospheric pressure, and constantlypurged with Ar during welding. Prior to making the welds, the pow-er density distribution of the laserbeam was measured using a Primes di-agnostic device, confirming the sharpfocus position and quantifying powerdensity of the beam at sharp focus.Figure 2 shows the full beam causticfor the optical arrangement used inthis study. The measured minimumspot size at the sharpest focus condi-tion is 0.64 mm; other beam qualityparameters are indicated as deter-mined by second-moment calculationsand are summarized in Table 1. The weld coupons were machinedfrom nickel 201 plate (>99 wt-% Ni)and Grade 2 commercially pure titani-um (>99.5 wt-% Ti). The couponsmeasured 150 mm long × 25 mm wide× 10 mm thick. Weld segments of30–40 mm length were made using dif-ferent power levels between 2090 and4150 W, as summarized in Table 2.Welds made at the higher power setting
Fig. 1 — Schematic of the vacuum laser setup.
Fig. 2 — Primes diagnostic results for the laser beam showing the causticinformation for the PFO optical setup for the laser beam with a minimumspot size of 0.64 mm diameter.
Table 1 — Beam Quality Measurements for the 1.03Micron Wavelength Laser Beam and the Electron Beams at 80 and 85 kV
Beam Type Focal Length Raw Beam Diameter Focused Beam Diameter BPP M2 Rayleigh Length (mm) (mm) (mm) (mm) (mmmrad) (mm)
Laser 450 23.5 0.64 8.4 24.8 12.3 EB1 (80 kV) 369 12.5 0.68 5.6 * >100 EB2 (85 kV) 369 12.5 0.64 5.3 * >100
* M2 values for electron beams are many orders of magnitude higher than lasers due to their small wavelengths.
TRUMPFTruDisk 8002
Elmer Paper 201628 November 2016_Layout 1 10/17/16 10:56 AM Page 420
WELDING RESEARCH
NOVEMBER 2016 / WELDING JOURNAL 421-s
are referred to as HP, and those at thelower power setting are referred to asLP. These powers and speeds were cho-sen to produce keyhole welds that sim-ulated the results of prior laser weldingexperiments on Ni made with a fiberlaser on commercially pure nickel in Arand N2 shielding gas (Ref. 1). Electron beam welds were also per-formed in vacuum on a nickel sampleto demonstrate the similarity of laservacuum weld geometries to electronbeam weld geometries, and to comparethe amounts of porosity produced byeach method. The electron beam weldswere made using a 150-kV HamiltonStandard machine (No. 605) at 6.9 ×10⁻⁵ mBar vacuum with the parame-ters summarized in Table 2. The elec-tron beam welds were made at 80 kV,40 mA (3200 W), and 85 kV, 37.5 mA(3190 W), with a long work distance of305 mm, which corresponds to an ef-fective focal length of 369 mm (Ref.
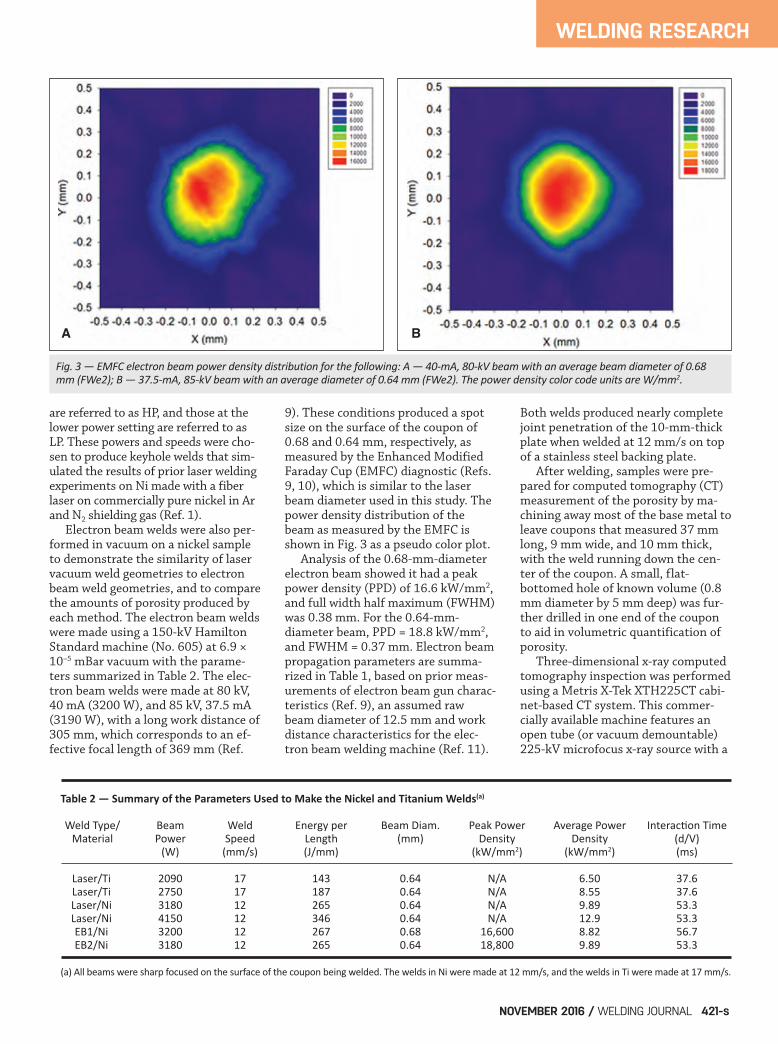
9). These conditions produced a spotsize on the surface of the coupon of0.68 and 0.64 mm, respectively, asmeasured by the Enhanced ModifiedFaraday Cup (EMFC) diagnostic (Refs.9, 10), which is similar to the laserbeam diameter used in this study. Thepower density distribution of thebeam as measured by the EMFC isshown in Fig. 3 as a pseudo color plot. Analysis of the 0.68-mm-diameterelectron beam showed it had a peakpower density (PPD) of 16.6 kW/mm2,and full width half maximum (FWHM)was 0.38 mm. For the 0.64-mm-diameter beam, PPD = 18.8 kW/mm2,and FWHM = 0.37 mm. Electron beampropagation parameters are summa-rized in Table 1, based on prior meas-urements of electron beam gun charac-teristics (Ref. 9), an assumed rawbeam diameter of 12.5 mm and workdistance characteristics for the elec-tron beam welding machine (Ref. 11).
Both welds produced nearly completejoint penetration of the 10-mm-thickplate when welded at 12 mm/s on topof a stainless steel backing plate. After welding, samples were pre-pared for computed tomography (CT)measurement of the porosity by ma-chining away most of the base metal toleave coupons that measured 37 mmlong, 9 mm wide, and 10 mm thick,with the weld running down the cen-ter of the coupon. A small, flat-bottomed hole of known volume (0.8mm diameter by 5 mm deep) was fur-ther drilled in one end of the couponto aid in volumetric quantification ofporosity. Three-dimensional x-ray computedtomography inspection was performedusing a Metris X-Tek XTH225CT cabi-net-based CT system. This commer-cially available machine features anopen tube (or vacuum demountable)225-kV microfocus x-ray source with a
Fig. 3 — EMFC electron beam power density distribution for the following: A — 40mA, 80kV beam with an average beam diameter of 0.68mm (FWe2); B — 37.5mA, 85kV beam with an average diameter of 0.64 mm (FWe2). The power density color code units are W/mm2.
Table 2 — Summary of the Parameters Used to Make the Nickel and Titanium Welds(a)
Weld Type/ Beam Weld Energy per Beam Diam. Peak Power Average Power Interaction Time Material Power Speed Length (mm) Density Density (d/V) (W) (mm/s) (J/mm) (kW/mm2) (kW/mm2) (ms)
Laser/Ti 2090 17 143 0.64 N/A 6.50 37.6 Laser/Ti 2750 17 187 0.64 N/A 8.55 37.6 Laser/Ni 3180 12 265 0.64 N/A 9.89 53.3 Laser/Ni 4150 12 346 0.64 N/A 12.9 53.3 EB1/Ni 3200 12 267 0.68 16,600 8.82 56.7 EB2/Ni 3180 12 265 0.64 18,800 9.89 53.3
(a) All beams were sharp focused on the surface of the coupon being welded. The welds in Ni were made at 12 mm/s, and the welds in Ti were made at 17 mm/s.
A B
Elmer Paper 201628 November 2016_Layout 1 10/17/16 10:56 AM Page 421
WELDING RESEARCH
WELDING JOURNAL / NOVEMBER 2016, VOL. 95422-s
65-W water-cooled reflection targetthat provides a nominal focal spot sizeof 3 m (when measured at 70 kV and0.1 mA) at the x-ray emission point. X-ray images were captured by a PerkinElmer XRD0820 amorphous siliconflat panel detector, which has an inputscreen 200 × 200 mm in size with1000 × 1000 detector elements result-
ing in a native pixel size of 0.2 mm,the detector also has a 16 bit (65536grey levels) dynamic range. The detec-tor is mounted 929 mm from the focalspot of the projected x-ray images,providing a geometrically magnifiedimage for improved defect detection. The weld coupons were placed onthe end and rotated about the center-
line of the weld using a turntable with-in the x-ray cabinet between the x-raysource and detector. The coupon wasrotated through 360 deg with images(projections) being captured at regularintervals (angular increments) duringthe rotation. The ideal number of pro-jections to use equates to × numberof pixels across the sample, which cor-
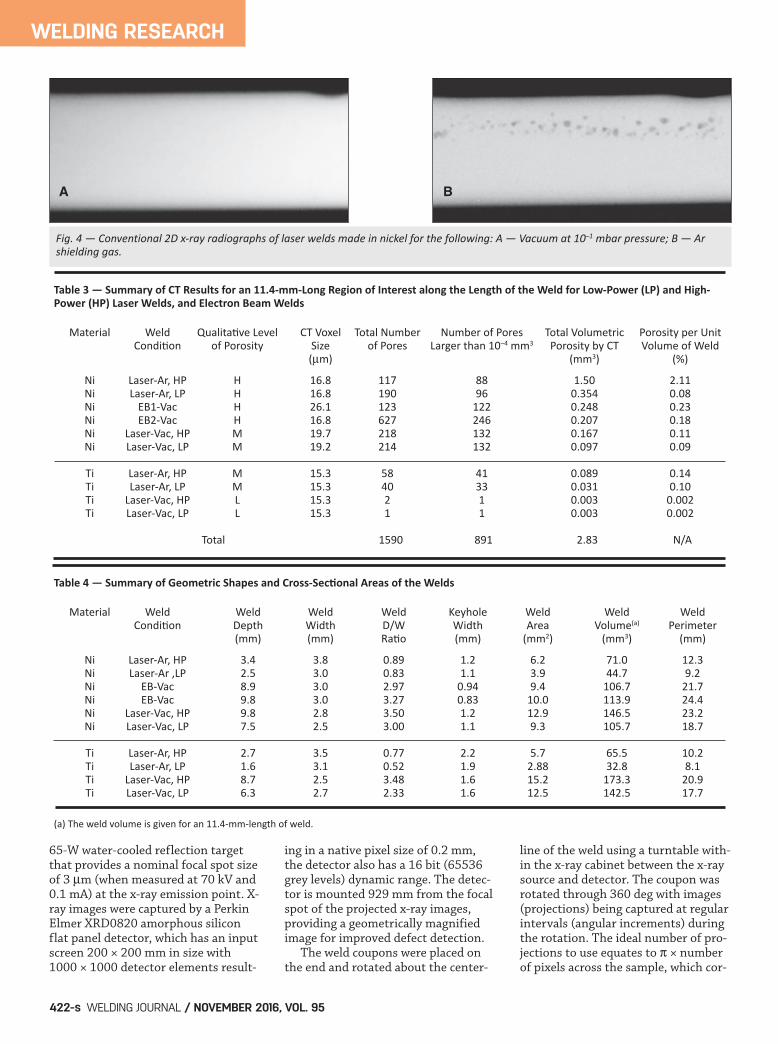
Fig. 4 — Conventional 2D xray radiographs of laser welds made in nickel for the following: A — Vacuum at 10–1 mbar pressure; B — Arshielding gas.
Table 3 — Summary of CT Results for an 11.4mmLong Region of Interest along the Length of the Weld for LowPower (LP) and HighPower (HP) Laser Welds, and Electron Beam Welds
Material Weld Qualitative Level CT Voxel Total Number Number of Pores Total Volumetric Porosity per Unit Condition of Porosity Size of Pores Larger than 10–4 mm3 Porosity by CT Volume of Weld (m) (mm3) (%)
Ni LaserAr, HP H 16.8 117 88 1.50 2.11 Ni LaserAr, LP H 16.8 190 96 0.354 0.08 Ni EB1Vac H 26.1 123 122 0.248 0.23 Ni EB2Vac H 16.8 627 246 0.207 0.18 Ni LaserVac, HP M 19.7 218 132 0.167 0.11 Ni LaserVac, LP M 19.2 214 132 0.097 0.09 Ti LaserAr, HP M 15.3 58 41 0.089 0.14 Ti LaserAr, LP M 15.3 40 33 0.031 0.10 Ti LaserVac, HP L 15.3 2 1 0.003 0.002 Ti LaserVac, LP L 15.3 1 1 0.003 0.002
Total 1590 891 2.83 N/A
Table 4 — Summary of Geometric Shapes and CrossSectional Areas of the Welds
Material Weld Weld Weld Weld Keyhole Weld Weld Weld Condition Depth Width D/W Width Area Volume(a) Perimeter (mm) (mm) Ratio (mm) (mm2) (mm3) (mm)
Ni LaserAr, HP 3.4 3.8 0.89 1.2 6.2 71.0 12.3 Ni LaserAr ,LP 2.5 3.0 0.83 1.1 3.9 44.7 9.2 Ni EBVac 8.9 3.0 2.97 0.94 9.4 106.7 21.7 Ni EBVac 9.8 3.0 3.27 0.83 10.0 113.9 24.4 Ni LaserVac, HP 9.8 2.8 3.50 1.2 12.9 146.5 23.2 Ni LaserVac, LP 7.5 2.5 3.00 1.1 9.3 105.7 18.7 Ti LaserAr, HP 2.7 3.5 0.77 2.2 5.7 65.5 10.2 Ti LaserAr, LP 1.6 3.1 0.52 1.9 2.88 32.8 8.1 Ti LaserVac, HP 8.7 2.5 3.48 1.6 15.2 173.3 20.9 Ti LaserVac, LP 6.3 2.7 2.33 1.6 12.5 142.5 17.7
(a) The weld volume is given for an 11.4mmlength of weld.
A B
Elmer Paper 201628 November 2016_Layout 1 10/17/16 10:56 AM Page 422
WELDING RESEARCH
NOVEMBER 2016 / WELDING JOURNAL 423-s
responds to 721 projections for thesamples used in this study. The com-ponent was positioned at a distancefrom the x-ray source that ensuredthat the projected image fell withinthe confines of the detector sides at allangles of turntable rotation. X-ray set-tings (kV and mA) were selected thatsufficiently penetrated the componentat all angles without saturating the de-tector. A 1-mm-thick copper filter wasplaced in front of the x-ray source toreduce saturation by low-energy x-raysfrom the Bremsstrahlung emission ofthe source. When a scan was completed, thecaptured digital radiographs wereprocessed through a reconstruction al-gorithm into a 3D representation ofthe component, sometimes referred toas a CT volume. During reconstruc-tion, each pixel from the detector atevery angular increment was
processed into athree-dimension-al volume ele-ment with greylevel and position(these are knownas voxels). For thesettings usedhere, the recon-structed voxelsize varied from15.3 to 26.1 m,depending on theCT reconstructionsetup for differ-ent samples, assummarized inTable 3.
Once generat-ed, the CT vol-umes wereloaded into a vi-sualization soft-ware package foranalysis, usingVolume GraphicsVGStudio MaxVersion 2.2. Thispackage displaysa 3D rendering ofthe sample alongwith 2D slice
views in the each of the three axes,plus a rotational slice view about thevertical axis. Typically, features areobserved in the 2D slices followedwith creation of slice planes withinthe 3D volume rendering. A secondCT visualization software package,Avizo (Ref. 12), was also used forquantification of the pore volumes inthe same manner performed in a pre-vious investigation (Ref. 1). To cali-brate the threshold intensity forquantification, different thresholdvalues were used until the analysis re-turned a correct volume for the flat-bottomed hole. The output of theanalysis is a spreadsheet that lists allsegmented porosity and their respec-tive volumes and the amount ofporosity as a function of the distancefrom the front of the weld as per-formed in a previous study (Ref. 1).
After performing the CT scans, thewelds were cross sectioned, coldmounted in epoxy resin, and metallo-graphically prepared using standardlapping and polishing procedures. Af-ter polishing, the nickel welds werechemically etched and photographedusing a digital microscope to observethe weld microstructure and to meas-ure the weld pool dimensions. Theweld fusion zone cross-sectional areawas further measured using the digitalmicroscope software to calculate thearea contained within a closed pathperimeter line drawn around the weldfusion boundary, including the weldcrown. All of the weld measurementsare summarized in Table 4.
Results and Discussion
Comparison of Laser BeamWelds Made in Vacuum and Ar Shielding
To demonstrate the qualitative ef-fect of vacuum on reduction in porosi-ty, preliminary Ni and laser welds weremade and radiographed using conven-tional 2D x-ray methods. The resultsare shown in Fig. 4 where dark areasrepresent porosity in the welds. Figure4A, B compare the Ni welds in vacuumand Ar, respectively. Small amounts ofporosity are present in the vacuumweld, but cannot be distinguished inthis figure, whereas large amounts ofporosity are clearly evident in the Niweld made in Ar. Based on the results of the 2D radi-ographs on the preliminary welds, amore thorough study was performedwhere each metal was welded with twodifferent power levels, referred to aslow power (LP) and high power (HP)hereafter. These welds were made inboth vacuum and atmospheric Arshielding gas conditions, and the re-sults were characterized using opticalmetallography techniques and 3D x-ray CT. Additional welds were madeusing the electron beam process,which is performed in vacuum only
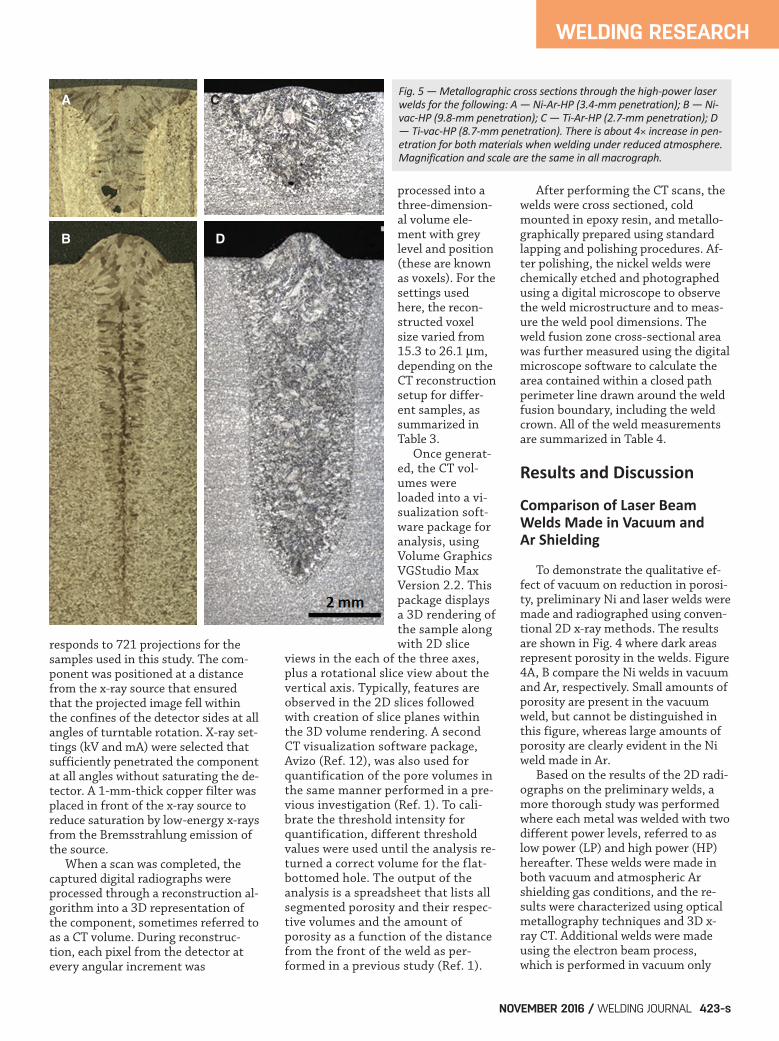
Fig. 5 — Metallographic cross sections through the high-power laserwelds for the following: A — Ni-Ar-HP (3.4-mm penetration); B — Ni-vac-HP (9.8-mm penetration); C — Ti-Ar-HP (2.7-mm penetration); D— Ti-vac-HP (8.7-mm penetration). There is about 4× increase in pen-etration for both materials when welding under reduced atmosphere.Magnification and scale are the same in all macrograph.
A C
B D
Elmer Paper 201628 November 2016_Layout 1 11/3/16 12:05 PM Page 423
WELDING RESEARCH
WELDING JOURNAL / NOVEMBER 2016, VOL. 95424-s
and is also a high-power density weld-ing process to compare with the laservacuum weld results. The welding parameters are sum-marized in Table 2 where the beam/material interaction time (beam diam-eter to travel speed ratio) was kept atabout 53 ms for the welds made in Ni.This is identical to welds made in aprevious study to produce similar key-hole behavior (Ref. 1). The LP welds inNi had heat inputs of 265 J/mm, whilethe HP laser weld in Ni was made at30% increased heat input of 347J/mm. The electron beam weldsmatched the heat input of the LP laserwelds in nickel and nearly completelypenetrated the 10-mm-thick plate.The Ti laser welds were made at a cor-
respondingly low-er heat input byincreasing thetravel speed to 17mm/s, and thusreducing the in-teraction time to37.6 ms. The rea-son for thischange was to re-duce the penetra-tion in the Ti al-loy, which wouldhave completelypenetrated the10-mm-thickplate if the higherheat input usedon the Ni sampleswas used. The re-sulting heat in-puts for the Ti
welds were 143 J/mm for the low-power weld, and 187 J/mm for thehigh-power weld. Figure 5 shows metallographic crosssections through the Ti and Ni HPwelds made in vacuum and argon to in-dicate the effects of reduced pressure onweld pool shape and porosity. The weldsmade in nickel under Ar and reducedpressure are shown in Fig. 5A, B, respec-tively. The first, and most obvious, dif-ference is the dramatic change in weldpool shape and penetration. For identi-cal welding parameters, the weld madein Ar is wide at the top, with shallowpenetration and a very short keyhole,compared to the weld made under re-duced pressure. The aspect ratio, de-
fined here as weld depth to full topwidth, is 0.89 for the weld made underAr and 3.5 for the weld made under re-duced pressure. This nearly 4× increasein aspect ratio is fully attributable to thechange in pressure surrounding thelaser weld. In addition to the difference in weldgeometry, it is clear the weld made inAr has a very large void showing up inthe center of the keyhole, whereasvery little porosity is present in theweld made under reduced pressure.Figure 5C and D shows the correspon-ding welds made in Ti under Ar and re-duced pressure, respectively, havingvery similar weld cross-sectionalshapes as in Ni. Here, the aspect ratioincreases from 0.77 for the Ti weldmade in Ar to 3.48 for the Ti weldmade under reduced pressure condi-tions. In the case of Ti, much lowerporosity is present than in Ni, withonly a few small voids showing up atthe root of the weld made in Ar. Computed tomography (CT) is be-coming an increasingly important toolfor understanding porosity distribu-tions in welds because it can quantifyporosity in a way that conventionalmetallography is not able to do (Refs. 1,13). In this study, 3D CT was performedon each of the welds over an 11.4-mmregion of interest that did not includethe weld start or stop locations. Resultsof the CT analysis characterized everypore in each of the welds so that thenumber of pores, the volume of eachpore, and the total volume of porositywere documented. The overall results of
Table 5 — Pore Size Distribution Parameters for the TwoParameter Weibull Relationship where is the Scale Parameter, and is theShape Parameter
Material Weld Total Number Weibull Weibull Parameters Condition of Pores Parameters Grouped by Weld Type
Ni LaserAr, HP 117 0.00245 0.37464 Ni LaserAr, LP 190 0.00043 0.41923 0.00090 0.37281 Ni EB1Vac 123 0.00217 0.77319 Ni EB2Vac 627 0.00019 0.64001 0.00031 0.5748 Ni LaserVac, HP 218 0.00040 0.61481 Ni LaserVac, LP 214 0.00034 0.72746 0.00047 0.60573 Ni All Ni Pores 1489 0.00045 0.47519 — — Ti LaserAr, HP 58 0.00089 0.54279 0.00075 0.58557 Ti LaserAr, LP 40 0.00055 0.73203 Ti LaserVac, HP 2 N/A N/A N/A N/A Ti LaserVac, LP 1 N/A N/A Ti All Ti Pores 101 0.00075 0.58432 — — Ni + Ti All Pores 1590 0.00051 0.49036
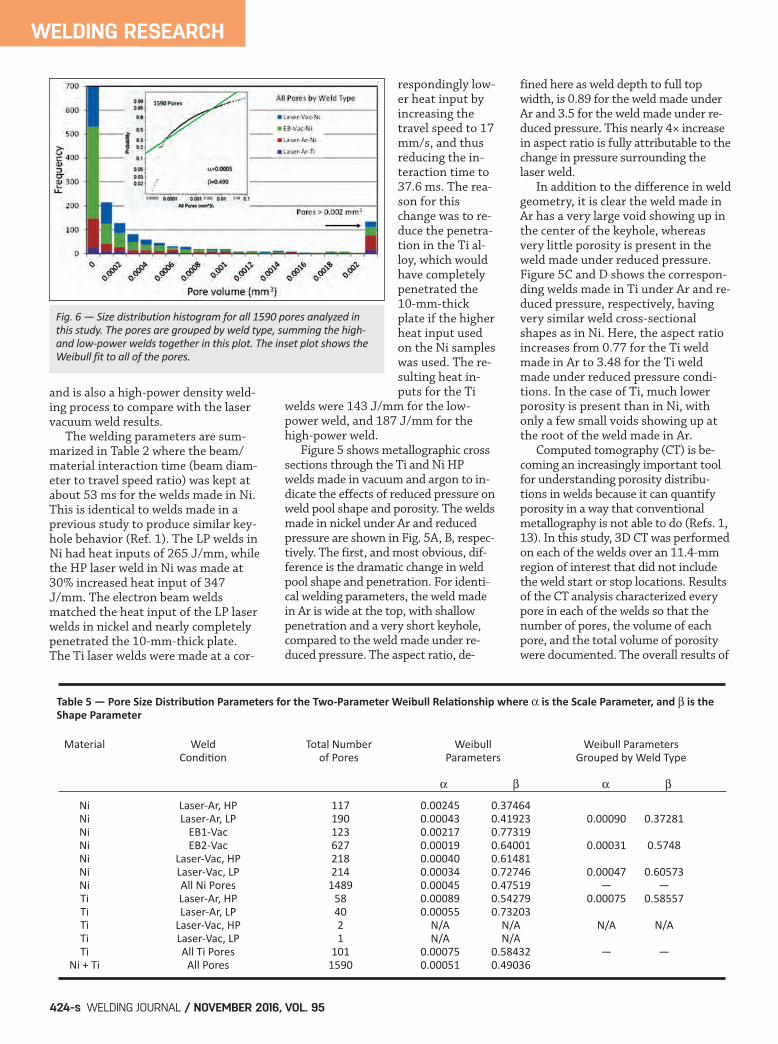
Fig. 6 — Size distribution histogram for all 1590 pores analyzed inthis study. The pores are grouped by weld type, summing the highand lowpower welds together in this plot. The inset plot shows theWeibull fit to all of the pores.
Elmer Paper 201628 November 2016_Layout 1 10/17/16 10:56 AM Page 424
WELDING RESEARCH
NOVEMBER 2016 / WELDING JOURNAL 425-s
the porosity measurements are summa-rized in Table 3. In addition, a qualita-tive level of porosity is given as high(H), medium (M), or low (L) based on anarbitrary level of percent porosity perunit volume of weld. Note that the Hand M levels of porosity would be con-sidered too high for most weld applica-tions. A total of 1590 pores were identi-fied in the ten welds, and it is interest-ing to note that some of the welds withthe highest number of pores did notcontain the highest volumetric porosity.It is clear from these data that Ni hashigher porosity than Ti for a given weld-ing parameter, Ar produces higherporosity than vacuum for a given weld-ing parameter, and higher-power weldscontain higher amounts of porosity. There are many ways to analyze theporosity distributions, but one of themost useful is a histogram showingthe pore frequency vs. pore size. Fig-ure 6 shows this histogram for all1590 pores. The results show the poredistribution monotonically decreasesfor all of the welds, much the same aswhat was observed in a previous studyof the effects of shielding gas on laserweld porosity (Ref. 1). Color coding inthis figure shows the grouping ofporosity frequency by type of weld,where the low- and high-power weldshave been lumped together in this plotwith all weld types showing similarfrequency trends. This behavior showsthere are many more small-diameterpores than large pores, and the distri-bution can be represented by a Wiebullrelationship with a beta shape factorless than unity (Ref. 1). The Weibullrelationship is described in Equation
1, where the pore size, P, is represent-ed as a continuous function of two pa-rameters, , the shape factor, andathe scaling parameter:
The Weibull fit to all of the data isplotted in the inset of Fig. 6 for allof the pores in all of the welds. Eachweld type was further fit by the two-
parameter Weibull relationship using astatistical data analysis package (Ref.14), and the results are summarized inTable 5. This table shows that variesfrom 0.37 to 0.61 each for the differentweld and material types, while the fit tothe all of the data grouped together hasa parameter of 0.49. Note that theoverall Weibull parameter of 0.49 isclose to that measured in a previousstudy of 0.54 for laser welds made indifferent shielding gas conditions at at-
) ) )( ( (= βα
α )( )(β− − α β11f P P / exp P/
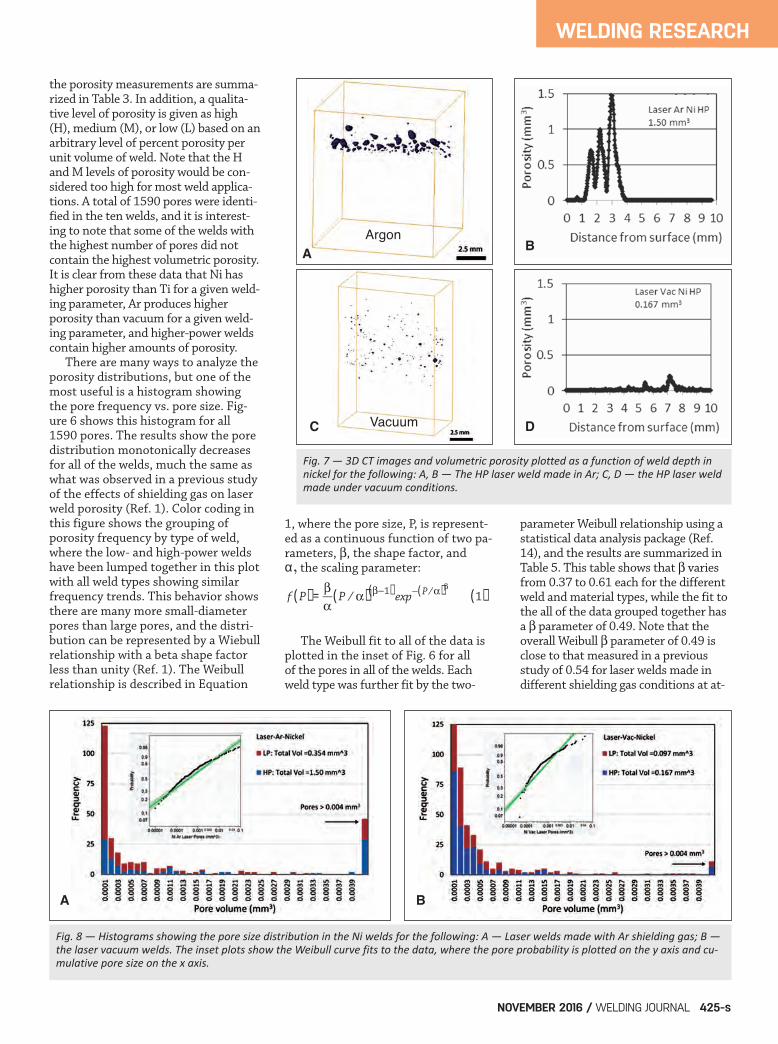
Fig. 7 — 3D CT images and volumetric porosity plotted as a function of weld depth innickel for the following: A, B — The HP laser weld made in Ar; C, D — the HP laser weldmade under vacuum conditions.
Fig. 8 — Histograms showing the pore size distribution in the Ni welds for the following: A — Laser welds made with Ar shielding gas; B —the laser vacuum welds. The inset plots show the Weibull curve fits to the data, where the pore probability is plotted on the y axis and cumulative pore size on the x axis.
A
A
C D
B
B
Argon
Vacuum
Elmer Paper 201628 November 2016_Layout 1 10/17/16 10:56 AM Page 425
WELDING RESEARCH
WELDING JOURNAL / NOVEMBER 2016, VOL. 95426-s
mospheric pressure. Also note that thefit to the Weibull plot (log-normal dis-tribution) has some important implica-tions about the distribution of the data,or pore sizes in our case. Recent work has studied the signifi-cance of the upper tail of the distribu-tion that deviates from a log-normaldistribution, showing how the distribu-tion with a long tail will underpredictthe importance of large pore sizes,while an upper distribution with ashort tail will overpredict the impor-tance of large pore sizes (Ref. 15). Thecombined data for all the welds shownin Fig. 6 indicate the log-normal distri-
bution doesn’t fit the data all that well,where the actual pore size data curvesover the best fit line, and the long up-per tail indicates many larger poresthan would be expected from theWeibull parameters alone. This type offit indicates there are most likely multi-ple porosity mechanisms active in thedifferent types of welds studied here,and that a grouping of all the data to-gether may not be the best representa-tion of porosity in each individual weld.Analysis that follows will take a closerlook at the pore size distributions ofthe different types of welds and materi-als.
Laser Welds in Nickel
The porosity distribution statisticsare useful in quantifying the highernumber density of small pores in thewelds, but additional information canbe acquired through visualization ofthe pore locations within the weldfrom the 3D CT renderings. Figure 7compares CT rendered data in Ni forthe porosity that formed in the HPlaser welds made in Ar and vacuumconditions. The weld made in Ar isshown in Fig. 7A, and has the highestporosity of all the welds made in thisstudy. The porosity is located in thelower part of the weld and has a globu-lar morphology that is very similar inappearance to the porosity observed inlaser welds made in Ar in a previousstudy with a different laser (Ref. 1). Another way to illustrate the poros-ity distribution is to integrate all ofthe porosity on a given CT slicethrough the weld, and then plot theporosity contained in each slice fromone side of the weld to the other. Thisis easily done from the 3D CT data,and can be performed in any orienta-tion relative to the weld. Figure 7Bplots the porosity for the laser weldmade in Ar from the top surface (x = 0mm) to the root of the weld (x = 10mm). This plot shows there is littleporosity in the top 1 mm of the weld,and that the remainder is concentrat-ed between 1 and 3 mm below the sur-face. Comparing this to the metallo-graphic cross section in Fig. 5A con-firms the location of a large pore about2.5 mm from the top surface, locatednear the center of the keyhole portionof the weld.
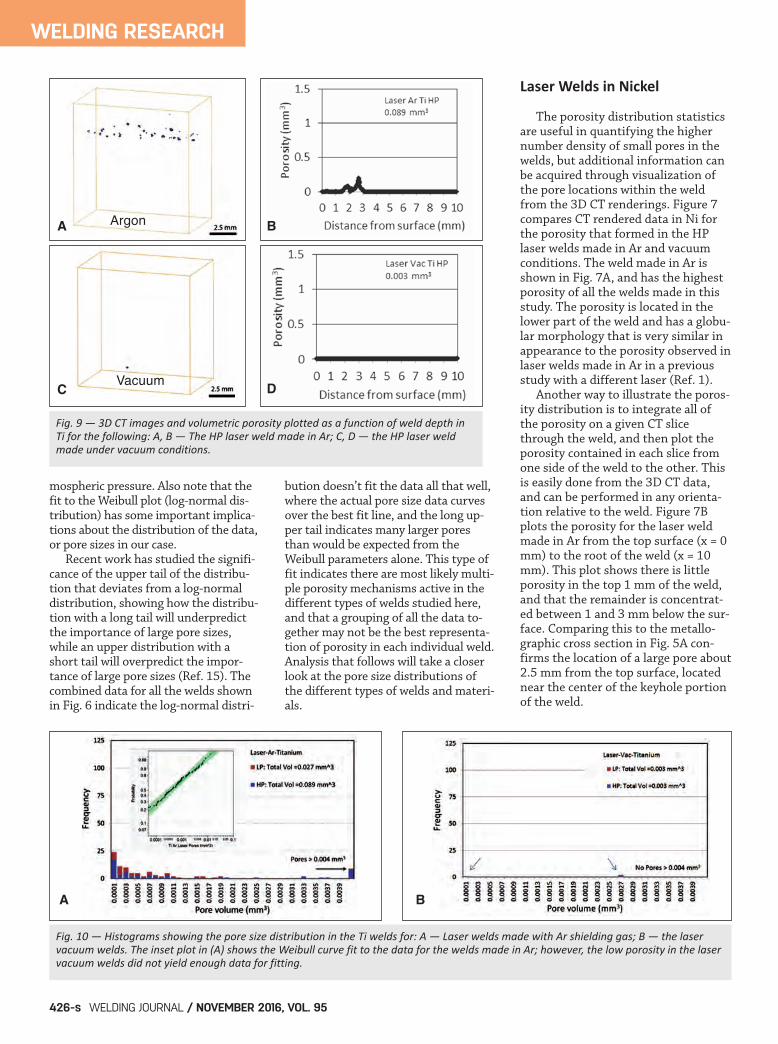
Fig. 10 — Histograms showing the pore size distribution in the Ti welds for: A — Laser welds made with Ar shielding gas; B — the laservacuum welds. The inset plot in (A) shows the Weibull curve fit to the data for the welds made in Ar; however, the low porosity in the laservacuum welds did not yield enough data for fitting.
A B
Fig. 9 — 3D CT images and volumetric porosity plotted as a function of weld depth inTi for the following: A, B — The HP laser weld made in Ar; C, D — the HP laser weldmade under vacuum conditions.
A
C D
BArgon
Vacuum
Elmer Paper 201628 November 2016_Layout 1 10/17/16 10:56 AM Page 426
The 3D CT rendering of the corre-sponding laser weld made in Ni butunder vacuum conditions is shown inFig. 7C. This weld was considerablydeeper than the weld made in Ar, andbecause of this, the sample wasturned on end to prevent completepenetration of the coupon. This weldalso contains porosity, but only about11% (0.167 mm3) as much as the cor-responding HP laser weld made in Ar(1.50 mm3). The vacuum weld porosi-ty is also distributed differently andhas a spherical morphology as op-posed to the globular morphologyseen in the weld made in Ar. Theporosity is distributed more uniform-ly throughout the depth in the vacu-um weld. This can be seen in Fig. 7D,which plots the porosity as a functionof weld depth. This comparisonshows the large increase in penetra-tion, significantly reduced porosity,different porosity distribution, anddifferent pore morphology for laserwelds made in vacuum. These find-ings indicate laser welds made in vac-uum are significantly different thanthose made in an inert gas such as Ar. Histograms, plotting the frequencyof a given pore size, are shown in Fig.8 for the Ni laser welds made in Ar and
vacuum conditions.The histograms are col-or coded so that thehigh- and low-powerwelds can be compared,
and the HP welds correspond to the3D CT images shown in Fig. 7. Eachhistogram includes insets that showthe Weibull fit to the grouped data,and the total porosity for each condi-tion. This comparison shows the Nilaser welds made in Ar contain boththe largest pores and the highest vol-ume of pores, whereas the vacuumwelds have a higher number of smallerpores and about 10% the total volu-metric porosity. The Weibull plotsshow the best fit lines through thedata, where the green band representsthe 95% confidence limit of the fit.The results indicate that the parame-ter for the welds made in Ar of 0.37 issignificantly less than that for theweld made in vacuum of 0.61. Thelower parameter for the welds madein Ar, combined with the longer uppertail on the Weibull plot corresponds tothe higher number of large pores inthe Ar shielded welds than in the laserwelds made in vacuum.
Laser Welds in Titanium
Three-dimensional CT renderings ofthe porosity in the HP laser welds madein Ti are shown in Fig. 9 for Ar and vac-
uum conditions. Figure 9A shows theporosity in the Ar-shielded weld, whichindicates the porosity is again locatedin the lower part of the weld and has aglobular morphology that is very simi-lar to the morphology of the Ni weldsmade in Ar. Figure 9B plots the porosityin this weld from the top surface (x = 0mm) to the root of the weld. The plotshows there is little porosity in the top1 mm of the weld, and the remainder isconcentrated between 1 and 3 mm be-low the surface. The metallographiccross section of this weld, shown in Fig.5C, does indicate one small pore at theroot of the weld, where it would be ex-pected based on the CT results. The 3DCT rendering of the corresponding HPlaser weld made in Ti under vacuumconditions is shown in Fig. 9C, whichindicates the two small pores in thisweld are clustered together near theweld root. The porosity as a function ofweld depth is plotted in Fig. 9D, whichemphasizes the near elimination ofporosity in Ti when welding under vac-uum conditions. Histograms of the porosity in Tilaser welds are shown in Fig. 10 for Arand vacuum conditions, where the HPcolor-coded data correspond to the 3DCT images in Fig. 9. This comparisonhighlights the beneficial results of laserwelding Ti in vacuum where porosity isnearly eliminated. In vacuum, the threesmall voids had a total porosity volume
WELDING RESEARCH
NOVEMBER 2016 / WELDING JOURNAL 427-s
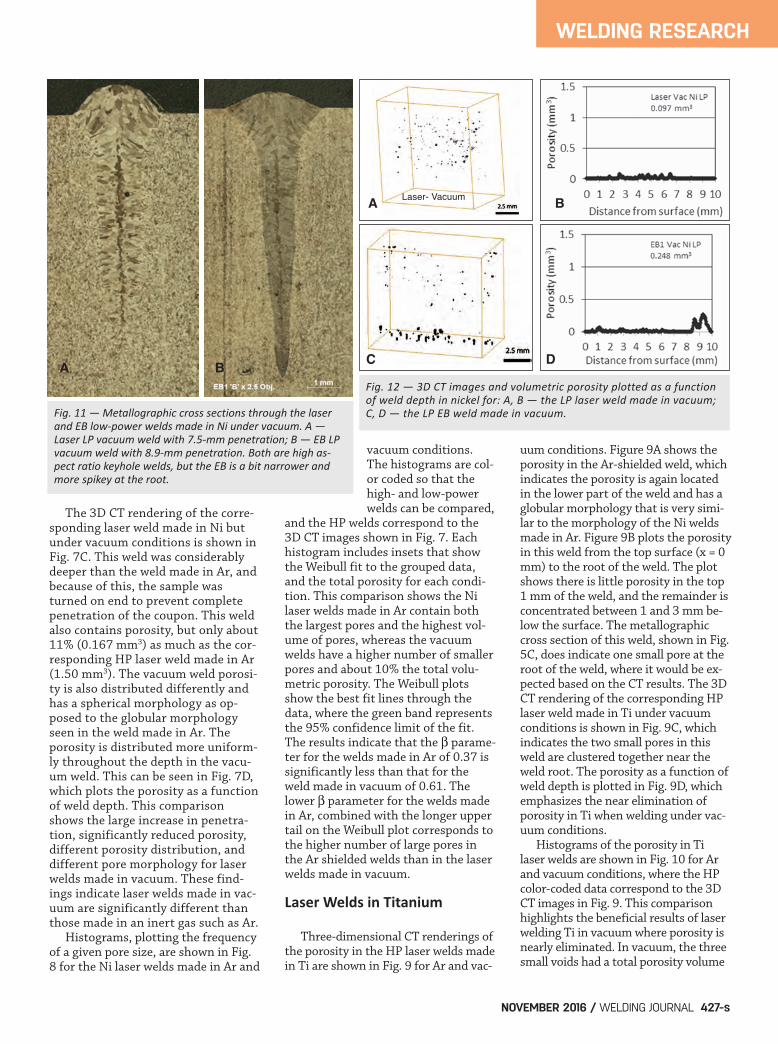
Fig. 11 — Metallographic cross sections through the laserand EB lowpower welds made in Ni under vacuum. A —Laser LP vacuum weld with 7.5mm penetration; B — EB LPvacuum weld with 8.9mm penetration. Both are high aspect ratio keyhole welds, but the EB is a bit narrower andmore spikey at the root.
Fig. 12 — 3D CT images and volumetric porosity plotted as a functionof weld depth in nickel for: A, B — the LP laser weld made in vacuum;C, D — the LP EB weld made in vacuum.
A
C
B
DA B
Laser- Vacuum
Elmer Paper 201628 November 2016_Layout 1 10/17/16 10:56 AM Page 427
of 0.003 mm3 in each weld, whereas theHP laser welds in Ti made in Ar had sig-nificantly higher porosity (0.089 mm3).The Weibull fit to the Ti laser weldsmade in Ar has a parameter of 0.58,whereas the Ti welds made in vacuumdid not have enough porosity datapoints to fit. In both conditions, thehigh-power welds had more porositythan the low-power welds. It’s also in-teresting to note that the HP Ti weldsmade in Ar shielding contain much lessporosity (0.089 mm3) than the HP Niwelds made in Ar (1.50 mm3). This islikely due to the nature of the keyholeand the weld pool that are different inTi than Ni due to different thermophys-ical properties of these two metals(Refs. 1, 16–18). The low vapor pressureof nickel is believed to be related to ahigher keyhole instability, and thushigher initial porosity generation thanTi. The relatively high thermal diffusivi-ty of nickel is further responsible fortrapping much of this porosity before ithas a chance to be transported out ofthe liquid weld pool before the weld so-lidifies (Ref. 1).
Comparison of Laser andElectron Beam Welds Made in Vacuum Electron beam welds were made inNi with nearly identical beam parame-ters as the LP laser weld as summarizedin Tables 1 and 2. Figure 11 comparesthe metallographic cross sectionsthrough the laser and EB welds, whilethe weld measurements are summa-rized in Table 4 for these two welds. Thecomparison shows the EB weld is a bitdeeper (8.9 vs. 7.5 mm), and has a nar-rower keyhole width (0.94 vs. 1.1 mm)than the laser weld. However, the weldcross-sectional areas are nearly identicalat 9.4 and 9.3 mm2 for the EB and laserwelds, respectively. The equivalence of
weld cross-sectional areas indicates thelaser and EB welds have very similarmelting efficiencies, transferring similaramounts of energy into the base metal.This is in stark contrast to the laserwelds where the cross-sectional area ofthe FZ made in Ar is less than half thatof the laser weld made under reducedatmosphere conditions. This differencerepresents a reduction of more than50% of the power loss to mechanismsother than melting. Three-dimensional CT measure-ments of the porosity in the low-powervacuum welds made by the laser and EBprocesses in Ni are shown in Fig. 12.The porosity in the LP laser weld,shown in Fig. 12A, is very similar to theHP laser weld in that the porosity isdistributed throughout, with a lot ofsmaller sized pores that have a spheri-cal morphology. The electron beamweld porosity, shown in Fig. 12C, is dif-ferent in that the upper portion of theweld is similar to the laser weld withwidely distributed spherical porosity,but the lower portion of the EB weldcontains root porosity not seen in thelaser weld. The EB root porosity is com-mon in deep-penetrating keyholewelds, and in this case the CT resultsshow the root porosity has an elongat-ed globular morphology. It is generallybelieved that root porosity is caused byinstability in the keyhole as the weldspikes into the base metal. Plots of the porosity distribution areshown in Fig. 12B, D for the laser andEB welds, respectively. The root porosi-ty clearly shows up in the EB welds be-tween 8.5- and 10-mm depths, andporosity in the EB weld (0.248 mm3) ismore than 2× the overall porosity of thelaser weld (0.097 mm3) for these LPwelds made at 3200 W. Figure 11showed the cross sections of these twowelds, and does indicate the presence ofspherical porosity in the main portions
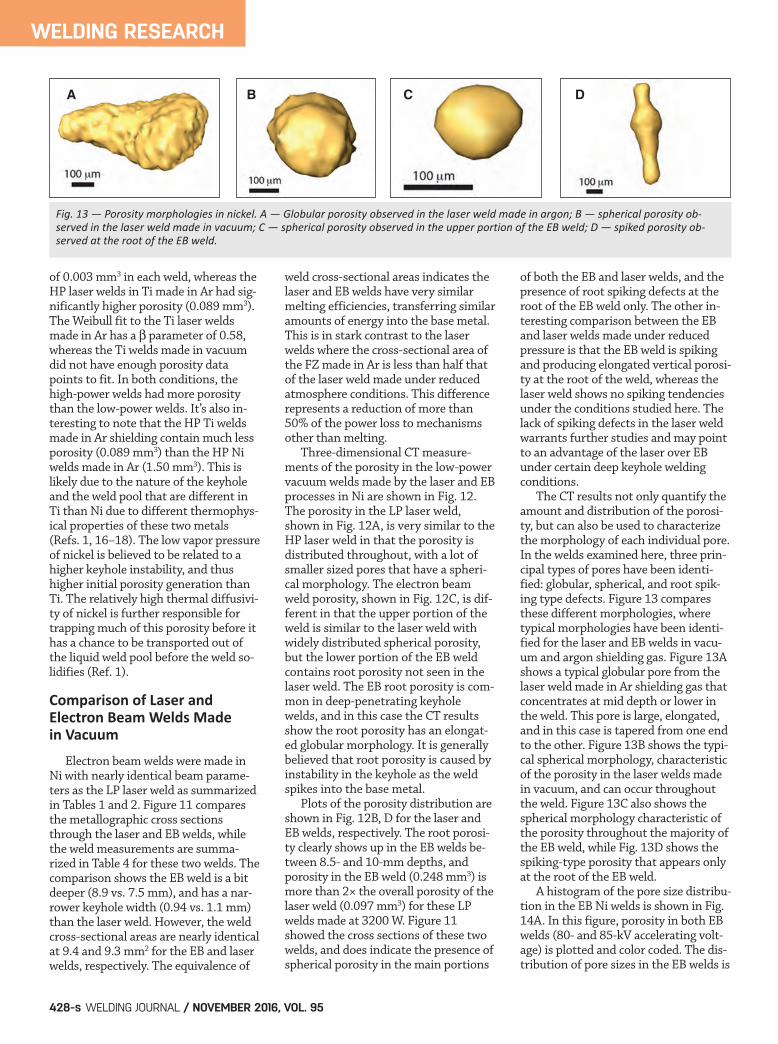
of both the EB and laser welds, and thepresence of root spiking defects at theroot of the EB weld only. The other in-teresting comparison between the EBand laser welds made under reducedpressure is that the EB weld is spikingand producing elongated vertical porosi-ty at the root of the weld, whereas thelaser weld shows no spiking tendenciesunder the conditions studied here. Thelack of spiking defects in the laser weldwarrants further studies and may pointto an advantage of the laser over EB under certain deep keyhole welding conditions. The CT results not only quantify theamount and distribution of the porosi-ty, but can also be used to characterizethe morphology of each individual pore.In the welds examined here, three prin-cipal types of pores have been identi-fied: globular, spherical, and root spik-ing type defects. Figure 13 comparesthese different morphologies, wheretypical morphologies have been identi-fied for the laser and EB welds in vacu-um and argon shielding gas. Figure 13Ashows a typical globular pore from thelaser weld made in Ar shielding gas thatconcentrates at mid depth or lower inthe weld. This pore is large, elongated,and in this case is tapered from one endto the other. Figure 13B shows the typi-cal spherical morphology, characteristicof the porosity in the laser welds madein vacuum, and can occur throughoutthe weld. Figure 13C also shows thespherical morphology characteristic ofthe porosity throughout the majority ofthe EB weld, while Fig. 13D shows thespiking-type porosity that appears onlyat the root of the EB weld. A histogram of the pore size distribu-tion in the EB Ni welds is shown in Fig.14A. In this figure, porosity in both EBwelds (80- and 85-kV accelerating volt-age) is plotted and color coded. The dis-tribution of pore sizes in the EB welds is
WELDING RESEARCH
WELDING JOURNAL / NOVEMBER 2016, VOL. 95428-s
Fig. 13 — Porosity morphologies in nickel. A — Globular porosity observed in the laser weld made in argon; B — spherical porosity observed in the laser weld made in vacuum; C — spherical porosity observed in the upper portion of the EB weld; D — spiked porosity observed at the root of the EB weld.
CB DA
Elmer Paper 201628 November 2016_Layout 1 10/17/16 10:56 AM Page 428
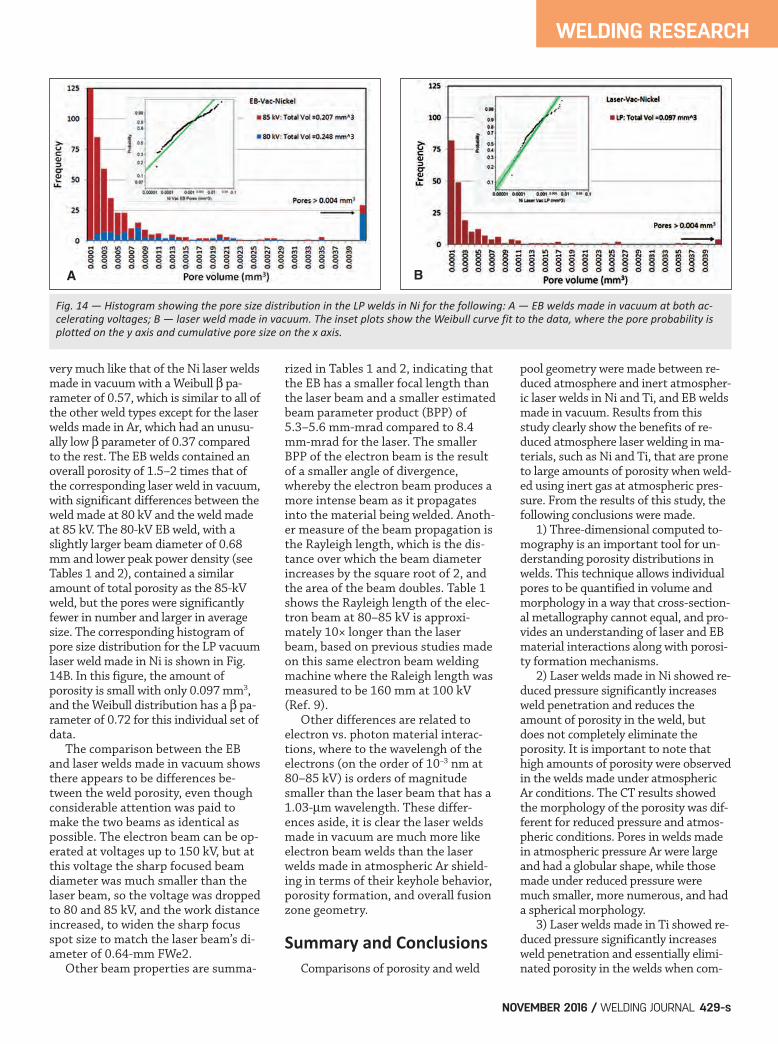
very much like that of the Ni laser weldsmade in vacuum with a Weibull pa-rameter of 0.57, which is similar to all ofthe other weld types except for the laserwelds made in Ar, which had an unusu-ally low parameter of 0.37 comparedto the rest. The EB welds contained anoverall porosity of 1.5–2 times that ofthe corresponding laser weld in vacuum,with significant differences between theweld made at 80 kV and the weld madeat 85 kV. The 80-kV EB weld, with aslightly larger beam diameter of 0.68mm and lower peak power density (seeTables 1 and 2), contained a similaramount of total porosity as the 85-kVweld, but the pores were significantlyfewer in number and larger in averagesize. The corresponding histogram ofpore size distribution for the LP vacuumlaser weld made in Ni is shown in Fig.14B. In this figure, the amount ofporosity is small with only 0.097 mm3,and the Weibull distribution has a pa-rameter of 0.72 for this individual set ofdata. The comparison between the EBand laser welds made in vacuum showsthere appears to be differences be-tween the weld porosity, even thoughconsiderable attention was paid tomake the two beams as identical aspossible. The electron beam can be op-erated at voltages up to 150 kV, but atthis voltage the sharp focused beamdiameter was much smaller than thelaser beam, so the voltage was droppedto 80 and 85 kV, and the work distanceincreased, to widen the sharp focusspot size to match the laser beam’s di-ameter of 0.64-mm FWe2. Other beam properties are summa-
rized in Tables 1 and 2, indicating thatthe EB has a smaller focal length thanthe laser beam and a smaller estimatedbeam parameter product (BPP) of5.3–5.6 mm-mrad compared to 8.4mm-mrad for the laser. The smallerBPP of the electron beam is the resultof a smaller angle of divergence,whereby the electron beam produces amore intense beam as it propagatesinto the material being welded. Anoth-er measure of the beam propagation isthe Rayleigh length, which is the dis-tance over which the beam diameterincreases by the square root of 2, andthe area of the beam doubles. Table 1shows the Rayleigh length of the elec-tron beam at 80–85 kV is approxi-mately 10× longer than the laserbeam, based on previous studies madeon this same electron beam weldingmachine where the Raleigh length wasmeasured to be 160 mm at 100 kV(Ref. 9). Other differences are related toelectron vs. photon material interac-tions, where to the wavelengh of theelectrons (on the order of 10–3 nm at80–85 kV) is orders of magnitudesmaller than the laser beam that has a1.03-m wavelength. These differ-ences aside, it is clear the laser weldsmade in vacuum are much more likeelectron beam welds than the laserwelds made in atmospheric Ar shield-ing in terms of their keyhole behavior,porosity formation, and overall fusionzone geometry.
Summary and Conclusions Comparisons of porosity and weld
pool geometry were made between re-duced atmosphere and inert atmospher-ic laser welds in Ni and Ti, and EB weldsmade in vacuum. Results from thisstudy clearly show the benefits of re-duced atmosphere laser welding in ma-terials, such as Ni and Ti, that are proneto large amounts of porosity when weld-ed using inert gas at atmospheric pres-sure. From the results of this study, thefollowing conclusions were made. 1) Three-dimensional computed to-mography is an important tool for un-derstanding porosity distributions inwelds. This technique allows individualpores to be quantified in volume andmorphology in a way that cross-section-al metallography cannot equal, and pro-vides an understanding of laser and EBmaterial interactions along with porosi-ty formation mechanisms. 2) Laser welds made in Ni showed re-duced pressure significantly increasesweld penetration and reduces theamount of porosity in the weld, butdoes not completely eliminate theporosity. It is important to note thathigh amounts of porosity were observedin the welds made under atmosphericAr conditions. The CT results showedthe morphology of the porosity was dif-ferent for reduced pressure and atmos-pheric conditions. Pores in welds madein atmospheric pressure Ar were largeand had a globular shape, while thosemade under reduced pressure weremuch smaller, more numerous, and hada spherical morphology. 3) Laser welds made in Ti showed re-duced pressure significantly increasesweld penetration and essentially elimi-nated porosity in the welds when com-
WELDING RESEARCH
NOVEMBER 2016 / WELDING JOURNAL 429-s
Fig. 14 — Histogram showing the pore size distribution in the LP welds in Ni for the following: A — EB welds made in vacuum at both accelerating voltages; B — laser weld made in vacuum. The inset plots show the Weibull curve fit to the data, where the pore probability isplotted on the y axis and cumulative pore size on the x axis.
BA
Elmer Paper 201628 November 2016_Layout 1 10/17/16 10:56 AM Page 429
pared to the moderately high amountsof porosity in the welds made under at-mospheric Ar conditions. Overall, therewas much less porosity in the Ti than inthe Ni welds. CT results showed that themorphology of the porosity in atmos-pheric pressure Ar welds was globularand similar to that of the welds made inNi under Ar conditions. 4) There is a dramatic difference inthe weld pool shape and penetration forlaser welds made in Ar vs. those madeunder reduced atmosphere conditions.For identical welding parameters, thelaser weld made in nickel in Ar is wide atthe top, with shallow penetration andhas a very short keyhole compared tothe weld made under reduced pressure.The aspect ratio is 0.89 for the weldmade under Ar and 3.5 for the weldmade under reduced pressure. Thisnearly 4× increase in aspect ratio is fullyattributable to the change in pressuresurrounding the laser weld. Similar weldcross-sectional shape differences wereobserved in Ti, where the aspect ratioschanged from 0.77 for the Ti weld madein Ar to 3.48 for the Ti weld made underreduced pressure conditions. 5) A comparison of the porosity be-tween EB and laser welds made in Niunder vacuum showed differences be-tween the amount and types of weldporosity. The EB welds contained anoverall amount of porosity of 1.5–2times that of the corresponding laserweld in vacuum. Some of the pores inthe EB weld are similar to the laserweld with widely distributed sphericalporosity. However, the EB weld alsocontained spiking-type porosity at theweld root that was not observed in thelaser weld. 6) The geometric shape of the weldfusion zone for laser welds made un-der reduced atmospheric conditions isvery similar to that of the correspon-ding EB weld. Both showed keyholeshapes with high aspect ratios. How-ever, some differences exist. The EBweld penetrated more than the laserweld (8.9 vs. 7.5 mm), and has a nar-rower keyhole width (0.94 vs. 1.1mm) than the laser weld. It is impor-tant to note that the weld cross-sec-tional areas are nearly identical at 9.4and 9.3 mm2 for the EB and laserwelds, respectively, which indicatessimilar melting efficiencies. In addi-tion, the laser vaccuum weld did notshow any root spiking defects like
those observed in the EB welds. 7. The CT results were analyzed us-ing statistical methods to determinethe size distribution of the 1590 poresanalyzed in these welds. The porositydistributions showed a monotonic de-crease in frequency with increasingpore size and were fit by a Weibull re-lationship. The fits to the pore distri-bution were made by weld type, mate-rial type, and an overall grouping of allpores. The results showed that theWeibull shape parameter for the Nilaser welds made in atmospheric Arwere lower than all the other weldswith = 0.37. On average, for all 1590pores, = 0.49, which is similar to theresults from a previous study where = 0.54 for 531 measured pores fromlaser welds in different shielding gasesunder atmospheric conditions (Ref. 1).
This work was performed under theauspices of the U.S. Department of En-ergy by Lawrence Livermore NationalLaboratory under Contract DE-AC52-07NA27344. The authors would like tothank Richard Watson, Tim Whiteside,and Jessica Opie of AWE for perform-ing CT radiography and reconstructionof the data, Neil Bond and Gail Smithfor preparing the metallographic sam-ples, and Andrew Johnson for prepara-tion of the laser welding figures andreview of the manuscript.
1. Elmer, J. W., Vaja, J., Carlton, H. D.,and Pong, R. 2015. The effect of Ar and N2
shielding gas on laser weld porosity insteel, stainless steels, and nickel. WeldingJournal 94(10): 313-s to 325-s. 2. Kuo, T.-Y., and Lin, Y. D. 2007. Ef-fects of different shielding gasses and pow-er waveforms on penetration characteris-tics and porosity formation in laser weld-ing of Inconel 690 alloy. Materials Transac-tions 48(2): 219–226. 3. Shin, M., and Nakata, K. 2010. Weldbead formation by a 10 kW class high pow-er fiber laser on 16 mm thickness carbonsteel plate. Trans. JWRI 39(1): 33–38. 4. Kawahito, Y., Mizutani, M., andKatayama, S. 2009. High quality welding ofstainless steel with 10 kW high power fiberlaser. Science and Technology of Welding andJoining 14(4): 288–294. 5. Katayama, S., Kobayashi, Y., Mizutani,
M., and Matsunawa, A. 2001. Effect of vacu-um on penetration and defects in laser weld-ing. J. Laser Applications V15(5): 187–192. 6. Sokolov, M., Salminen, A., andKatayama, S. 2015. Reduced pressurewelding of thick section structural steel. J.Materials Processing Technology Vol. 219,pp. 278–285. 7. Chen, Q., Tang, X., Lu, F. et al. 2015.Study of the effect of laser-induced plasmaplume on penetration in fiber laser weldingunder sub-atmospheric pressure. Int. J. ofAdvanced Manufacturing Technology Vol. 78,Issue 1-4, pp. 331–339. 8. Pang, S., Koji, H., and Fabbro, R.2015. Explanation of penetration depthvariation during laser welding under vari-able ambient pressure. J. Laser ApplicationsVol. 27, Issue 2, p. 22007. 9. Palmer, T. A., and Elmer, J. W. 2007.Characterization of electron beams at dif-ferent focus settings and work distances inmultiple welders using the enhanced modi-fied faraday cup. Science and Technology ofWelding and Joining 12(2): 161–174. 10. Elmer, J. W., and Teruya, A. T. 2001.An enhanced faraday cup for the rapid de-termination of the power density distribu-tion in electron beams. Welding Journal80(12): 288-s to 295-s. 11. Elmer, J. W., Teruya, A. T., andO’Brien, D. W. 1993. Tomographic imagingof non-circular and irregular electron beampower density distributions. Welding Jour-nal 72(11): 493-s to 505-s. 12. Avizo. 3D Analysis Software for Sci-entific and Industrial data. vsg3d.com/avi-zo/overview 13. Madison, J. D., and Aagesen, L. K.2012. Quantitative characterization ofporosity in laser welds of stainless steel.Scripta Materialia 67: 783–786. 14. JMP, Version 9.0.0. SAS Institute,Inc., Cary, N.C., 2010. 15. Donegan, S. P., Tucker, J. C., Rollett,A. D., Barmak, K., and Groeber, M. 2013.Extreme value analysis of tail departurefrom log-normality in experimental andsimulated grain size distributions. ActaMat. 61(15): 5595–5604. 16. Rai, R., Elmer, J. W., Palmer, T. A.,and DebRoy, T. 2007. Heat transfer andfluid flow during keyhole mode laser weld-ing of tantalum, Ti-6Al-4V, 304L stainlesssteel and vanadium. Journal of Physics D:Applied Physics 40(18): 5753–5766. 17. Zhao, H., Niu, W., Zhang, B., Lei, Y.,Kodama, M., and Ishide, T. 2011. Modelingof keyhole dynamics and porosity forma-tion considering the adaptive keyholeshape and three-phase coupling duringdeep-penetration laser welding. J. AppliedPhysics D: Applied Physics 44: 485302. 18. Matsunawa, A., and Semak, V.1997. The simulation of front keyhole walldynamics during laser welding. J. Phys. D:Appl. Phys. 30: 798–809.
WELDING RESEARCH
WELDING JOURNAL / NOVEMBER 2016, VOL. 95430-s
Acknowledgments
References
Elmer Paper 201628 November 2016_Layout 1 10/17/16 10:56 AM Page 430