Embed Size (px)
Citation preview

The Effect of Rate Regulation on Price and Competition
Sharon TennysonDepartment of Policy Analysis and ManagementCornell [email protected]
Richard A. DerrigOpal Consulting, [email protected]
CANE Meeting, Sturbridge, MA
September 18, 2007

Impact of Rate RegulationAGENDA
Regulation and Competition – The Rationale and the Reality
A Little Theory and Practice
Auto Insurance: Brookings/AEI Case Studies
The Case of Massachusetts
Implications for California

Why (now) Do States Regulate P-C Insurance Rates? Automobile insurance
Homeowners insurance
Workers compensation insurance
Medical malpractice insurance
Mandatory or socially desirable insurance
Uninsured parties shift financial risk to others in society
Some consumers face high prices
Some markets experience price shocks
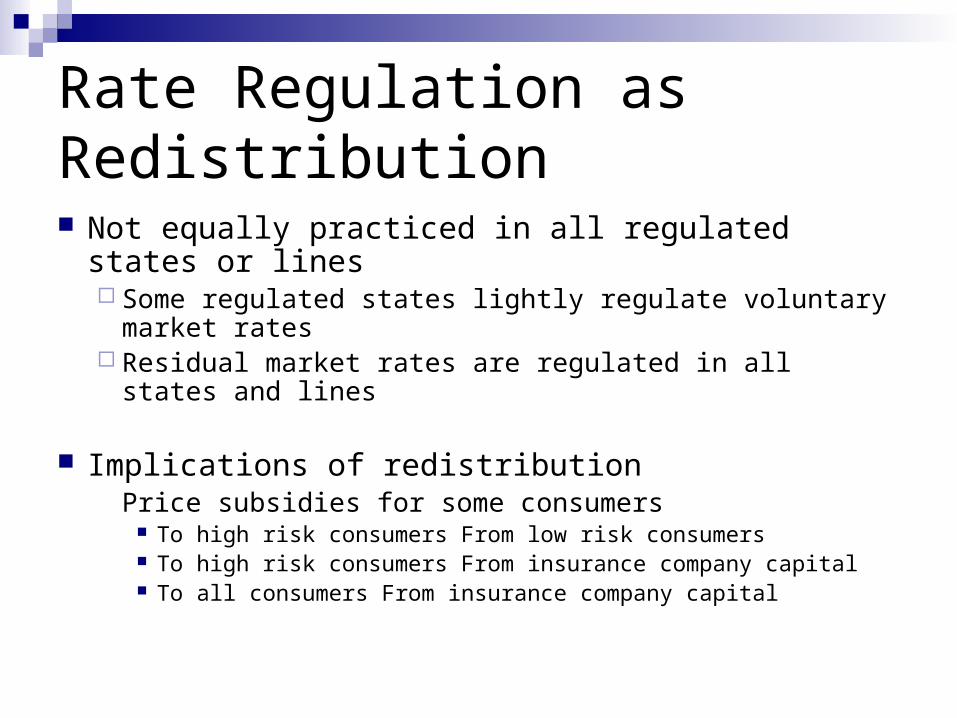
Rate Regulation as Redistribution Not equally practiced in all regulated states or
lines Some regulated states lightly regulate voluntary
market rates Residual market rates are regulated in all states and
lines
Implications of redistributionPrice subsidies for some consumers
To high risk consumers From low risk consumers To high risk consumers From insurance company capital To all consumers From insurance company capital

Efficient Redistribution?
Not Likely: Not Sustainable
The Problem: Competitive Market Forces
Attempts to move prices a significant distance from competitively-determined prices will distort market functioning Company responses to regulation Consumer responses to regulation Regulator responses to the responses

Efficiency Consequences: Supply Rate suppression distorts insurance supply
Decreased writing of voluntary coverage Reduced innovation and quality of service Reduced entry of firms Increased exit of firms
Rate uncertainty distorts insurance supply All of the above effects Price stickiness and market volatility

Efficiency Consequences: Demand Rate subsidies distort consumer behavior: Insurance demand
Increased demand from high risk consumers Decreased demand from low risk consumers May cause low risk consumers to forego insurance
Safety incentives Prices are less responsive to changes in losses/risk
Claiming incentives Prices are less responsive to changes in losses/risk

Implications
Stringent regulation of insurance rates produces unintended effects: Reduced competition Higher cost inflation Lower insurance availability Greater market volatility
Regulated outcomes may even be contrary to the regulatory objectives pursued

What is the Empirical Record? On average and over the long run, rate
regulation has little effect on average loss ratios (Harrington, 2002) Not necessary for market functioning Creates uncertainty and costly compliance
In states and markets where rate regulation is stringently applied, empirical studies find effects supportive of theory
In states and markets where stringent rate regulation is dismantled, empirical studies find effects supportive of theory

Evidence from Massachusetts State regulation of private passenger auto
insurance rates has created widely-recognized market problems Exit of insurance providers, especially national firms Small number of suppliers Larger than normal residual market Cost inefficiencies Politicized ratemaking environment
Less recognized problem: In the aggregate, regulation drives overall claims costs higher

Table 1
Major Regulatory Changes, 1970-2000
Massachusetts Private Passenger Automobile Insurance
Year Regulation
1971 Nofault auto insurance effective
1975 State rate-setting extended to all auto coverages
1977 Competitive rate-setting allowed
1978 State rate-setting reinstituted
1989 Automobile Insurance Reform Law effective
1991 Insurance Fraud Bureau began operation
1996 Competitive Discounts and Deviations begin at -7.4%
2006 Competitive Discounts and Deviations stabilize at -1.7%
2007 Competitive rate-setting allowed 4/1/08

Table 2
Direction of Subsidies by Driver Class and Territory Compulsory Insurance Coverage 2004
Experienced Classes
Inexperienced Classes Business Classes
Non-Boston Territories
Average Premium $527.15 $1,220.54 $500.67
Average Subsidy -$26.00 $138.29 -$46.43
Cells Subsidized (%) 12.50% 42.71% 6.25%
Boston Territories
Average Premium $813.33 $1,434.04 $751.98
Average Subsidy $253.77 $520.09 $32.30
Cells Subsidized (%) 64.65% 72.73% 36.36%
Source: Authors calculations using data from Actuarial Notice 04-1, Automobile Insurers Bureau of Massachusetts, 2004. Compulsory coverages are Bodily Injury Liability (20/40), Personal Injury Protection (8,000), Property Damage Liability (5,000) and Uninsured Motorist (20/40)

Table 3
Massachusetts Private Passenger Automobile
Historical Summary of Industry Discounts/Deviations
Year Average Discount Annual Change in
Discount
1996 -7.4%
1997 -9.2% -1.8%
1998 -9.2% +0.0%
1999 -6.5% +2.7%
2000 -5.5% +1.0%
2001 -3.0% +2.5%
2002 -2.2% +0.8%
2003 -1.9% +0.3%
2004 -1.7% +0.2%
2005 -1.8% -0.1%
2006 -1.7% +0.1%
2007 -1.7% est'd +0.0%
Source: Automobile Insurers Bureau of Massachusetts

Impact of Rate Regulation on Claims: First Cut: State-level data on average
loss costs50 states1972-1998 (before and after
Massachusetts effective subsidies)
Hypothesis: Massachusetts’ loss costs will be higher than otherwise predicted during period of stringent regulation

Impact of Rate Regulation on Claims Second cut: Massachusetts town-level
data on loss cost levels for 5 coverages360 townsBiennial data 1999-2007
Hypothesis: Loss cost growth higher in subsidized towns than in other towns

Figure 1: Average Annual Loss Costs per Insured CarMassachusetts vs National Average
0
100
200
300
400
500
600
72 73 74 75 76 77 78 79 80 81 82 83 84 85 86 87 88 89 90 91 92 93 94 95 96 97 98
Year
(Lo
sses
In
curr
ed/W
ritt
en C
ar
Yea
rs)
National Average
Massachusetts
State Data

Impact of Rate RegulationState by State Estimation
DATA: 1972- 1998 NAIC Coverage Variations Demographics Regulation METHOD: Panel Data Regression Models Ln(Liab. Loss / W Car Years)

State Regression EstimatesLst = ß0 + ß1CSYearst + ß2MAsCSYearst + γ’Xst + ß4StateRegsst + ß5StateRegsstCSYearst + as + Tt
+ εst
CSYears = 1978-1998 or 1978-1995Test ß2 > 0Control variables = traffic density, cost of hospital
stay, per capita income, rate regulation, nofault, PIP limits, compulsory insurance minimums
as and Tt are state and year fixed-effectsAdjust S.E. for arbitrary heteroskedasticity and for
arbitrary correlation within state
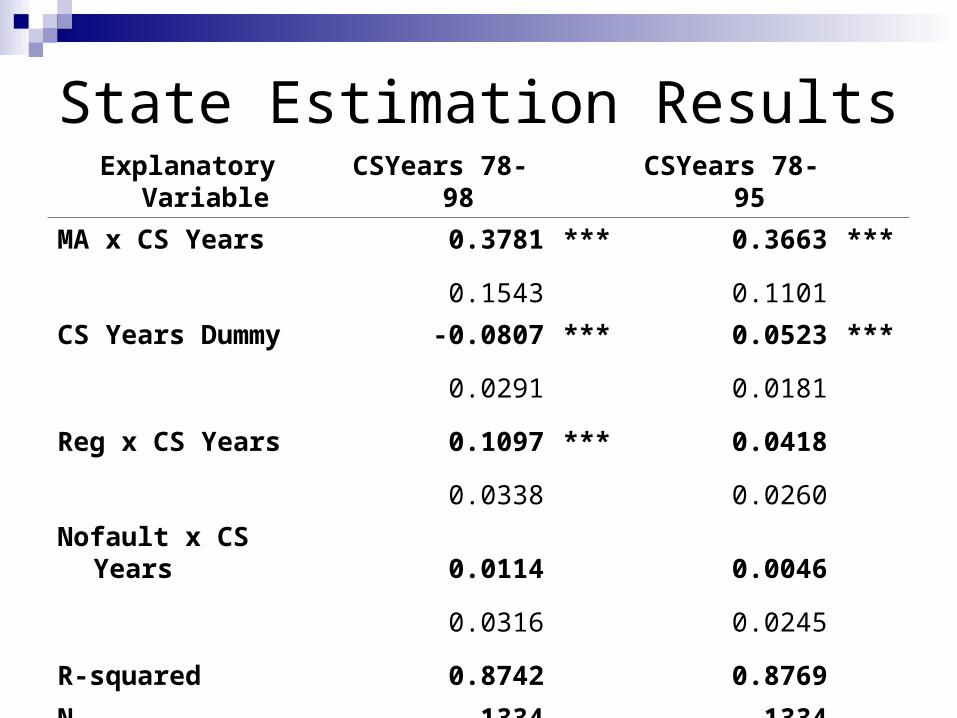
State Estimation ResultsExplanatory Variable CSYears 78-98 CSYears 78-95
MA x CS Years 0.3781 *** 0.3663 ***
0.1543 0.1101
CS Years Dummy -0.0807 *** 0.0523 ***
0.0291 0.0181
Reg x CS Years 0.1097 *** 0.0418
0.0338 0.0260
Nofault x CS Years 0.0114 0.0046
0.0316 0.0245
R-squared 0.8742 0.8769
N 1334 1334
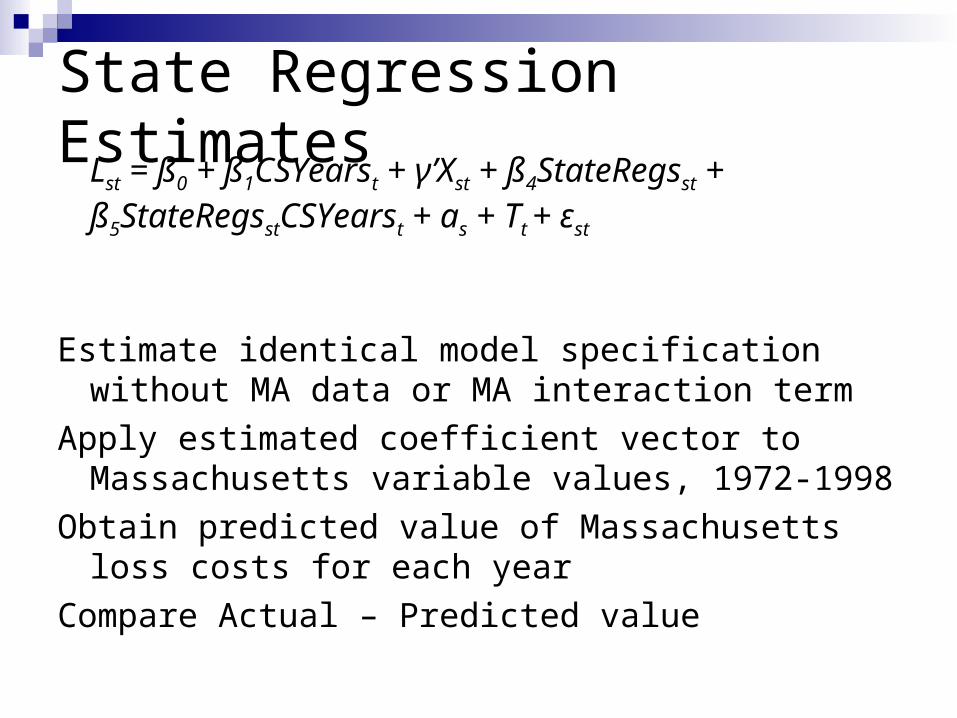
State Regression EstimatesLst = ß0 + ß1CSYearst + γ’Xst + ß4StateRegsst + ß5StateRegsstCSYearst + as + Tt + εst
Estimate identical model specification without MA data or MA interaction term
Apply estimated coefficient vector to Massachusetts variable values, 1972-1998
Obtain predicted value of Massachusetts loss costs for each year
Compare Actual – Predicted value

Actual Losses Incurred vs Predicted Losses from Regression Model: Massachusetts 1972-1998
-150
-100
-50
0
50
100
150
72 73 74 75 76 77 78 79 80 81 82 83 84 85 86 87 88 89 90 91 92 93 94 95 96 97 98
Year
Pre
dict
ion
diff
eren
ce
Actual Loss - Predicted Loss
Actual – Predicted Losses

Impact of Rate Regulation on Claims:Second Cut Panel of Massachusetts town-level data on
loss cost indices for 5 coverages from AIB 360 towns Biennial data 1999-2007 Pure premium index Average class rating factor
Hypothesis: Indices will grow faster in subsidized towns than in other towns

Figure 2: BIL Pure Premium Index GrowthSubsidized vs Unsubsidized Towns
(1999=1)
0.88
0.9
0.92
0.94
0.96
0.98
1
1.02
1.04
1.06
1999 2001 2003 2005 2007
Rating Year
Ind
ex
Unsubsidized Towns
Subsidized Towns
Source: Automobile Insurers Bureau Filings on Territories and Actuarial Notices on Subsidies
Town Data - BIL

Impact of Rate RegulationTown Level Estimation DATA: 5 coverage Town DataAIB Territory FilingsRate Subsidies All YearsTown Index – Bayesian Estimate/Class Normalized (ACRF)
METHOD: Regression Models on Town Relativity Growth
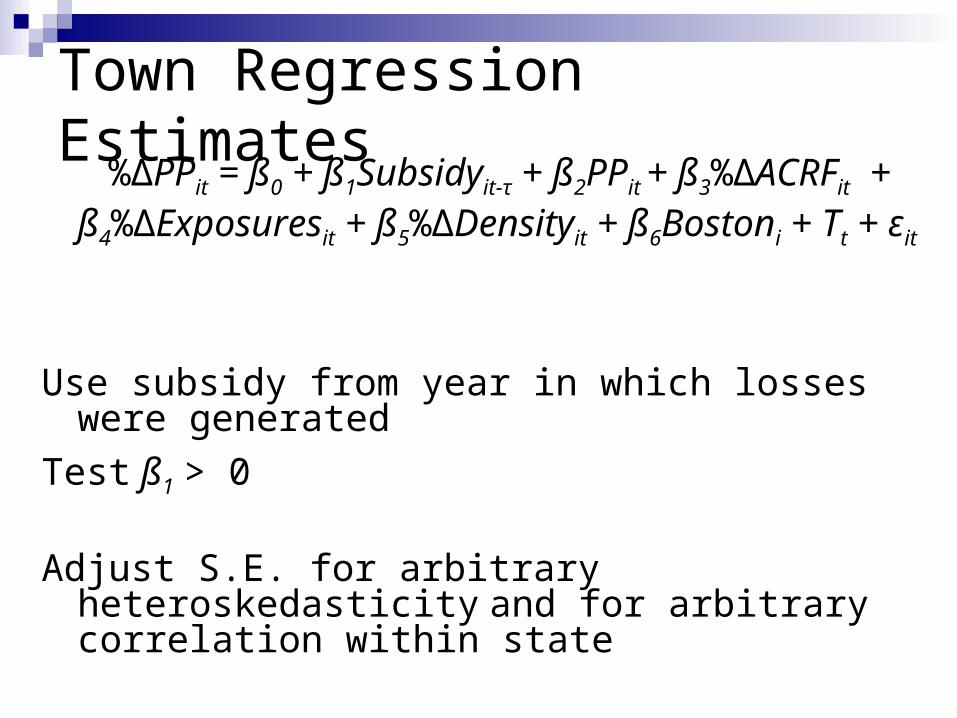
Town Regression Estimates %ΔPPit = ß0 + ß1Subsidyit-τ + ß2PPit +
ß3%ΔACRFit + ß4%ΔExposuresit + ß5%ΔDensityit + ß6Bostoni + Tt + εit
Use subsidy from year in which losses were generated
Test ß1 > 0
Adjust S.E. for arbitrary heteroskedasticity and for arbitrary correlation within state

Pure Premium Growth Estimates BIL PIP PDL COL COM
Lag subsidy indicator
0.0717 ***
0.0566 ***
0.0112 **
0.0277 ***
0.0206 ***
0.0220 0.0184 0.0061 0.0088 0.0134
Lag pure premium
-0.059
8 ***
-0.0105
-0.003
5
-0.028
4 ***
-0.061
6 ***
0.0192 0.0076 0.0083 0.0101 0.0114
R-squared0.039
60.07
940.062
50.070
10.084
1
F-statistic 2.95 ***
19.22 *** 7.54 *** 7.51 *** 8.90 ***
N 1439 1439 1439 1439 1439
Standard errors appear below the coefficient estimates, and are adjusted to allow for arbitrary heteroskedasticity and for arbitrary correlation in errors across years within each town. *** indicates statistically significant at the 1% confidence level *

Impact of Rate RegulationCalifornia Auto Territories
PROP 103 (1989) Driving History Emphasized for Relative Pricing; Mandatory and Optional Classes
April 2006 Change: Territory must be less “important” than Mandatory Prop 103 Factors: Annual Mileage, Driving Safety Record, Years Licensed
Effect yet to be seen but moves away from cost-based must introduce Mass-like subsides varying by insurer
Rural to Urban, High Income to Lower Income,
High Cost to Low Cost

Impact of Rate RegulationCalifornia Auto Territories
April 2006 Change: Optional Territory Frequency and Territory Severity (and 14 others) must each be forced to be less “important” (less relativity weight) than Mandatory Prop 103 Factors: Annual Mileage, Driving Record, Years Licensed
DOI Study Showed 3 Scenarios that implied:
Increases for 53 of 58 Counties (High +37%,Low 1.3%)
Decreases for 5 of 58 Counties (High -0.5%,Low -12%)
LA Zips (High – 6%, Low -11%),
Beverly Hills Zips (High -10%, Low -23%)
Corr Prem to LossPP, (Current 0.75, New 0.725 to 0.62)

Papers R.A. Derrig and S. Tennyson (2007), The
Impact of Rate Regulation on Claims: Evidence from Massachusetts Automobile Insurance, www.aria.org/meetings/ARIA_2007_Program.pdf
Concurrent session VD #3
S. Tennyson (2007), Efficiency Consequences of Rate Regulation in Insurance Markets, Networks Financial Institute Policy Brief, www.networksfinancialinstitute.org

References (Excerpt)Automobile Insurers Bureau of Massachusetts, Actuarial Notice -2: Subsidies in the
Rates, Boston, MA: AIB. Various years.Automobile Insurers Bureau of Massachusetts, 2006, AIB Recommendations for 2007
Private Passenger Automobile Insurance Territory Definiitons, MA DOI Docket R2006-03, May 15.
Blackmon, B.G. Jr. and R. Zeckhauser, 1991, Mispriced Equity: Regulated Rates for Auto Insurance in Massachusetts, American Economic Review, 81: 65-69.
Burnes, N.S., 2007, Opinion, Findings, and Decision on the Operation of Competition in Private Passenger Motor Vehicle Insurance in 2008, Massachusetts Division of Insurance Docket No. R2007-03, July 16.
Conger, R.F., 1988, The Construction of Automobile Rating Territories in Massachusetts, Proceedings of the Casualty Actuarial Society, 71: Part 1, 1-74.
Derrig, R.A.,1993, Price Regulation in US Automobile Insurance: A Case Study of Massachusetts Private Passenger Automobile Insurance 1978-1990, The Geneva Papers on Risk and Insurance, 18: 158-173.
Derrig, R.A., and Hilary N. Rowan, 2006, Written testimony of The California Farm Bureau, California Department of Insurance, Proposed Amendment of Title 10 of California Code of Regulations, Section 2632.8 – Optional Auto Insurance Rating Factors, CDI File #RH 03029820.
DuMouchel, W.H., 1983, The Massachusetts Automobile Insurance Classification Scheme, The Statistician, 32: 69-81.
Rottenberg, S., 1989, The Cost of Regulated Pricing: a Critical Analysis of Auto Insurance Premium Rate-Setting in Massachusetts, Boston: Pioneer Institute for Public Policy Research.
Tennyson, S., 1997, The Impact of Rate Regulation on State Automobile Insurance Markets, Journal of Insurance Regulation 15: 502‑523.