Embed Size (px)
Citation preview

University of Wollongong University of Wollongong
Research Online Research Online
Faculty of Engineering and Information Sciences - Papers: Part B
Faculty of Engineering and Information Sciences
2019
The effect of raster orientation on the static and fatigue properties of The effect of raster orientation on the static and fatigue properties of
filament deposited ABS polymer filament deposited ABS polymer
Natalie Jap University of New South Wales
Garth Pearce University of New South Wales
Alan K. Hellier University of Wollongong, [email protected]
Nicholas Russell University of New South Wales
William C. H Parr University of New South Wales
See next page for additional authors
Follow this and additional works at: https://ro.uow.edu.au/eispapers1
Part of the Engineering Commons, and the Science and Technology Studies Commons
Recommended Citation Recommended Citation Jap, Natalie; Pearce, Garth; Hellier, Alan K.; Russell, Nicholas; Parr, William C. H; and Walsh, William R., "The effect of raster orientation on the static and fatigue properties of filament deposited ABS polymer" (2019). Faculty of Engineering and Information Sciences - Papers: Part B. 2493. https://ro.uow.edu.au/eispapers1/2493
Research Online is the open access institutional repository for the University of Wollongong. For further information contact the UOW Library: [email protected]

The effect of raster orientation on the static and fatigue properties of filament The effect of raster orientation on the static and fatigue properties of filament deposited ABS polymer deposited ABS polymer
Abstract Abstract Fused Filament Fabrication (FFF) is a cheap, accessible and common Additive Manufacturing (AM) technique. FFF is highly flexible, robust and uses stable and easily transportable precursor materials. Although the static mechanical properties of FFF components are well documented, the dynamic mechanical properties are still not fully established. It was identified that raster orientation was a significant factor in determining tensile strength, and thus could also affect fatigue strength. Dogbone specimens of Acrylonitrile Butadiene Styrene (ABS) were tested under sinusoidal tension-tension fatigue loading at a frequency of 5 Hz, and at 40%, 60%, 80% and 90% of the mean ultimate tensile strength (UTS) of the respective −45°/45° and 0°/90° raster orientations determined from static tensile tests. Sample sizes of 5 were used for each stress level. Statistical analysis of the results showed that the two raster orientations fail at a statistically equivalent number of cycles when fatigued at the same percentage of UTS. However, when tested at the same absolute stress, the −45°/45° raster orientation exhibited a greater number of cycles to failure by as much as 63.5%. A linear fatigue model was derived for each raster orientation based on a single static test which has the potential to simplify component design and testing requirements.
Disciplines Disciplines Engineering | Science and Technology Studies
Publication Details Publication Details Jap, N. S. F., Pearce, G. M., Hellier, A. K., Russell, N., Parr, W. C. & Walsh, W. R. (2019). The effect of raster orientation on the static and fatigue properties of filament deposited ABS polymer. International Journal of Fatigue, 124 328-337.
Authors Authors Natalie Jap, Garth Pearce, Alan K. Hellier, Nicholas Russell, William C. H Parr, and William R. Walsh
This journal article is available at Research Online: https://ro.uow.edu.au/eispapers1/2493
N.S.F. Jap et al. / International Journal of Fatigue
1
The effect of raster orientation on the static and fatigue
properties of filament deposited ABS polymer
Natalie S.F. Jap a, Garth M. Pearce a,*, Alan K. Hellier b, Nicholas Russell c, William C. Parr c, William R.
Walsh c
a School of Mechanical and Manufacturing Engineering, UNSW Sydney (The University of New South Wales), Sydney
NSW 2052, Australia b School of Mechanical, Materials, Mechatronic and Biomedical Engineering, University of Wollongong, Northfields
Avenue, Wollongong NSW 2522, Australia
c Surgical and Orthopaedic Research Laboratories, Prince of Wales Clinical School, School of Medicine, UNSW Sydney
(The University of New South Wales), Sydney NSW 2052, Australia
A B S T R A C T
_________________________________________________________________________________
Fused Filament Fabrication (FFF) is a cheap, accessible and common Additive Manufacturing (AM) technique. FFF is highly flexible, robust and uses stable and easily transportable precursor materials. Although the static mechanical properties of FFF components are well documented, the dynamic mechanical properties are still not fully established. It was identified that raster orientation was a significant factor in determining tensile strength, and thus could also affect fatigue strength. Dogbone specimens of Acrylonitrile Butadiene Styrene (ABS) were tested under sinusoidal tension-tension fatigue loading at a frequency of 5 Hz, and at 40%, 60%, 80% and 90% of the mean ultimate
tensile strength (UTS) of the respective -45/45 and 0/90 raster orientations determined from static tensile tests. Sample sizes of 5 were used for each stress level. Statistical analysis of the results showed that the two raster orientations fail at a statistically equivalent number of cycles when fatigued at the same percentage of UTS. However, when tested at the same absolute stress, the -
45/45 raster orientation exhibited a greater number of cycles to failure by as much as 63.5%. A linear fatigue model was derived for each raster orientation based on a single static test which has the potential to simplify component design and testing requirements. _________________________________________________________________________________
Keywords:
ABS polymer
Additive manufacturing
Fatigue
Fused filament fabrication
Raster orientation
* Corresponding author.
E-mail address: [email protected] (G.M. Pearce).
N.S.F. Jap et al. / International Journal of Fatigue
2
1. Introduction
Additive Manufacturing (AM) technologies have already had a definitive impact on modelling and prototyping engineering components. In some sectors, AM has already transitioned into the realm of fabricating actual components and assemblies subjected to service loads and environmental conditions. Fused Filament Fabrication (FFF), also known as Fused Deposition Modelling (FDM), is the most ubiquitous AM technique, yet structural applications of FFF are somewhat limited by the polymer materials which can be processed.
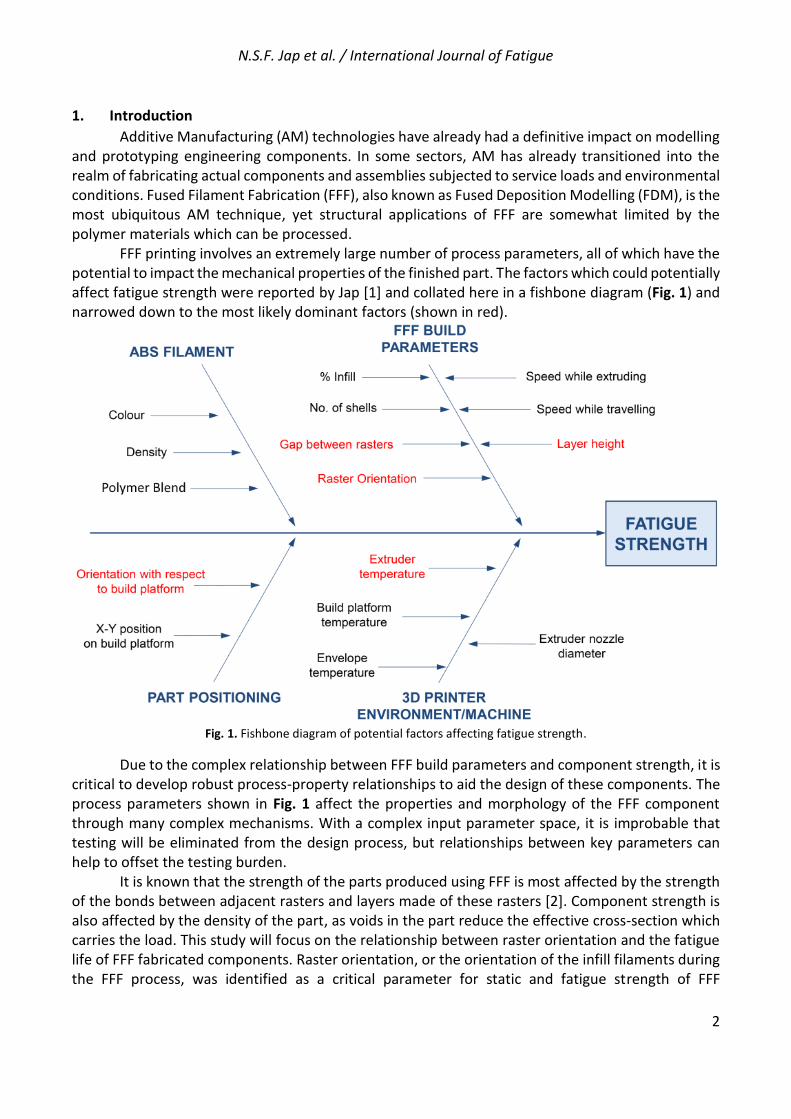
FFF printing involves an extremely large number of process parameters, all of which have the potential to impact the mechanical properties of the finished part. The factors which could potentially affect fatigue strength were reported by Jap [1] and collated here in a fishbone diagram (Fig. 1) and narrowed down to the most likely dominant factors (shown in red).
Fig. 1. Fishbone diagram of potential factors affecting fatigue strength.
Due to the complex relationship between FFF build parameters and component strength, it is critical to develop robust process-property relationships to aid the design of these components. The process parameters shown in Fig. 1 affect the properties and morphology of the FFF component through many complex mechanisms. With a complex input parameter space, it is improbable that testing will be eliminated from the design process, but relationships between key parameters can help to offset the testing burden.
It is known that the strength of the parts produced using FFF is most affected by the strength of the bonds between adjacent rasters and layers made of these rasters [2]. Component strength is also affected by the density of the part, as voids in the part reduce the effective cross-section which carries the load. This study will focus on the relationship between raster orientation and the fatigue life of FFF fabricated components. Raster orientation, or the orientation of the infill filaments during the FFF process, was identified as a critical parameter for static and fatigue strength of FFF

N.S.F. Jap et al. / International Journal of Fatigue
3
components [1]. Limited static and no dynamic data are available investigating the relationship between raster orientation and the mechanical properties of the fabricated components.
Models for fatigue life prediction will be developed in this paper, based on static material test data, simplifying the material characterisation process and adding to the limited body of knowledge in this area [3-6]. A comprehensive account of the work described in this paper including a literature review on AM is contained in the thesis by Jap [1]. The whole thesis may be found in electronic Appendix A in the online version of this article. 2. Experimental design and methodology
This section is reserved for experimental design and methodology. All results and discussion
are presented separately in following sections under the same subheadings.
2.1. Test method and specimen selection A dogbone-type specimen was chosen for the tests due to the simplicity of sample preparation
and its suitability for FFF fabrication. A cylindrical-type specimen was not used, as the dimensional accuracy of the FFF process is reduced for smaller radii. Additionally, a dogbone specimen has been used for a fatigue study previously [2]. Since no material standards currently exist for additive manufactured parts, the specimen dimensions were based on test specimen 1B in the ISO 527-2:2012 standard [7] with a thickness of 4 mm. The full dimensions may be found in Fig. 2. The 1B specimen was chosen over the 1A specimen because it is smaller in size, thus reducing the manufacturing time and material used for each specimen.
Fig. 2. Dogbone specimen dimensions based on ISO 527-2:2012 (in mm).
2.2. Specimen preparation
The test specimens were produced using a Stratasys UPrint SETM 3D printer with ABS P430TM (ivory colour) material. The soluble support material used was SR 30TM and the 3D printer software used was CatalystEXTM version 4.4. The software did not allow for parts to be printed without support material. Thus, all specimens were printed with support material which consisted of a simple raft. Each specimen had a layer resolution of 0.01 in (0.254 mm) with the “solid” model interior setting. The print envelope is temperature-controlled and fully enclosed, with the filament stored in a sealed environment inside the machine. All specimens were printed using the same batch of ABS polymer print material.
Two raster orientations were considered for the study: -45/45 and 0/90. By default, the
UPrint printer fills with alternate raster layers of -45 and 45 relative to the printer axis system. The two raster orientations were achieved by varying the part orientation relative to the print platform

N.S.F. Jap et al. / International Journal of Fatigue
4
as shown in Fig. 3. The square represents the build platform plane (i.e. the X-Y plane). For both raster orientations, the specimens were 3D printed lying flat on the build platform.
Fig. 3. Specimen orientation within the 3D printer.
The specimens were X-rayed to confirm their internal structure, as shown in Fig. 4. A Faxitron
X-ray MX-20 Specimen Radiography System was used at 18 kV for 18 s to take the images.
Fig. 4. X-ray images of dogbone specimen printed at different part orientations – (a) -45/45, (b) 0/90.
The true dimensions of the specimens were measured with Vernier callipers. It was observed that the thickness of each specimen was approximately 4.2 mm rather than the nominal 4.0 mm from the CAD model. This could be due to the fact that the UPrint SETM 3D printer has a layer resolution of 0.01 in, which is approximately 0.254 mm. A specimen thickness of 4.2 mm is used for all subsequent calculations. The effective cross-sectional area of the gauge region was found from the measured specimen thickness and width.
A simple ageing investigation was carried out to ensure that the material did not significantly change mass due to absorption of water or other volatile substances. Four specimens were weighed immediately after fabrication with scales of 0.01 g accuracy. The samples were stored in zip-lock bags in the laboratory and reweighed after 2 days, 1 week, 2 weeks, 3 weeks and 8 weeks. The mass for all specimens increased by approximately 0.25-0.3% over the first two weeks before reaching a stable
(a) (b)
N.S.F. Jap et al. / International Journal of Fatigue
5
value. The impact of this mass increase was considered insignificant for the mechanical properties of the specimens.
It was intended that each specimen be tested within 48 h of fabrication. However, due to laboratory logistics, this was not always able to be achieved. Some specimens were prepared from 4 days to a week in advance of testing. These longer periods occurred for the 40% level tests. To reduce any variability due to this, the specimens were stored in zip-lock bags in the laboratory at room temperature until testing. 2.3. Test machine and fixtures
The tensile tests and all subsequent fatigue tests were carried out using a calibrated MTS Mini
Bionix 858 servo-hydraulic machine with a 25 kN load cell and MTS FlexTestTM 40 Station Manager
software, version 5.5C 4251. All testing was performed at room temperature.
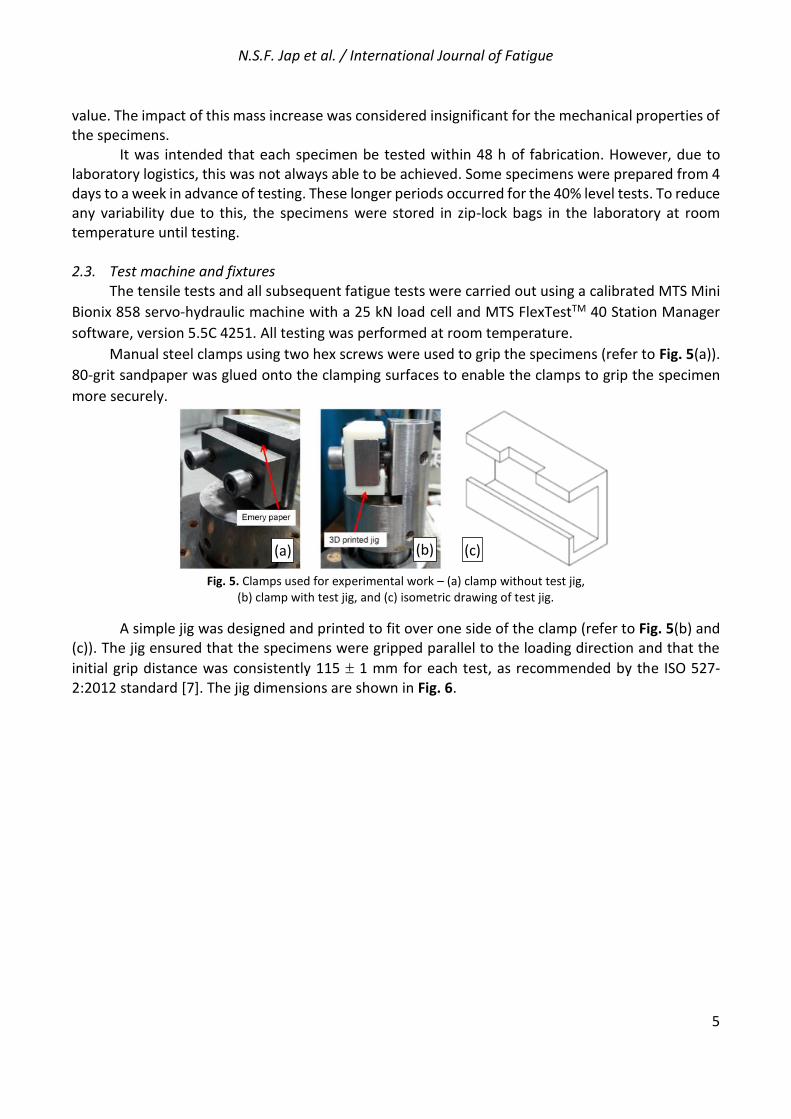
Manual steel clamps using two hex screws were used to grip the specimens (refer to Fig. 5(a)).
80-grit sandpaper was glued onto the clamping surfaces to enable the clamps to grip the specimen
more securely.
Fig. 5. Clamps used for experimental work – (a) clamp without test jig,
(b) clamp with test jig, and (c) isometric drawing of test jig.
A simple jig was designed and printed to fit over one side of the clamp (refer to Fig. 5(b) and (c)). The jig ensured that the specimens were gripped parallel to the loading direction and that the
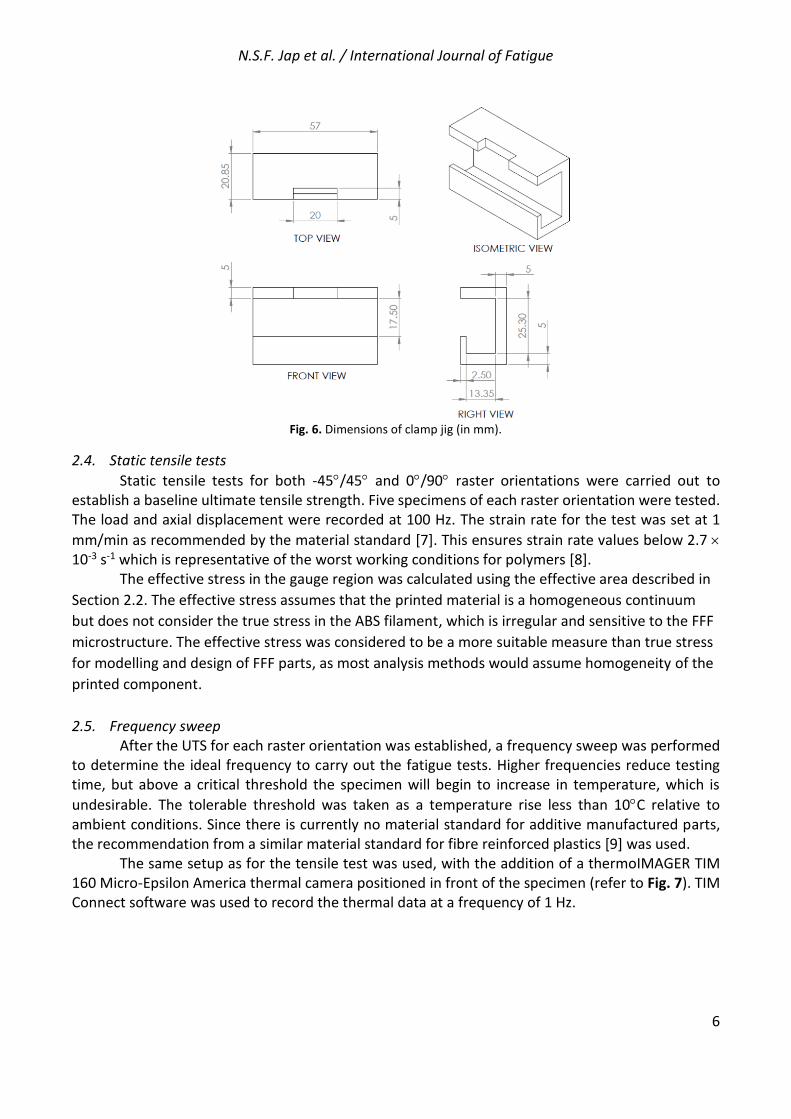
initial grip distance was consistently 115 1 mm for each test, as recommended by the ISO 527-2:2012 standard [7]. The jig dimensions are shown in Fig. 6.
(a) (b) (c)
N.S.F. Jap et al. / International Journal of Fatigue
6
Fig. 6. Dimensions of clamp jig (in mm).
2.4. Static tensile tests
Static tensile tests for both -45/45 and 0/90 raster orientations were carried out to establish a baseline ultimate tensile strength. Five specimens of each raster orientation were tested. The load and axial displacement were recorded at 100 Hz. The strain rate for the test was set at 1
mm/min as recommended by the material standard [7]. This ensures strain rate values below 2.7 10-3 s-1 which is representative of the worst working conditions for polymers [8].
The effective stress in the gauge region was calculated using the effective area described in
Section 2.2. The effective stress assumes that the printed material is a homogeneous continuum
but does not consider the true stress in the ABS filament, which is irregular and sensitive to the FFF
microstructure. The effective stress was considered to be a more suitable measure than true stress
for modelling and design of FFF parts, as most analysis methods would assume homogeneity of the
printed component.
2.5. Frequency sweep After the UTS for each raster orientation was established, a frequency sweep was performed
to determine the ideal frequency to carry out the fatigue tests. Higher frequencies reduce testing time, but above a critical threshold the specimen will begin to increase in temperature, which is
undesirable. The tolerable threshold was taken as a temperature rise less than 10C relative to ambient conditions. Since there is currently no material standard for additive manufactured parts, the recommendation from a similar material standard for fibre reinforced plastics [9] was used.
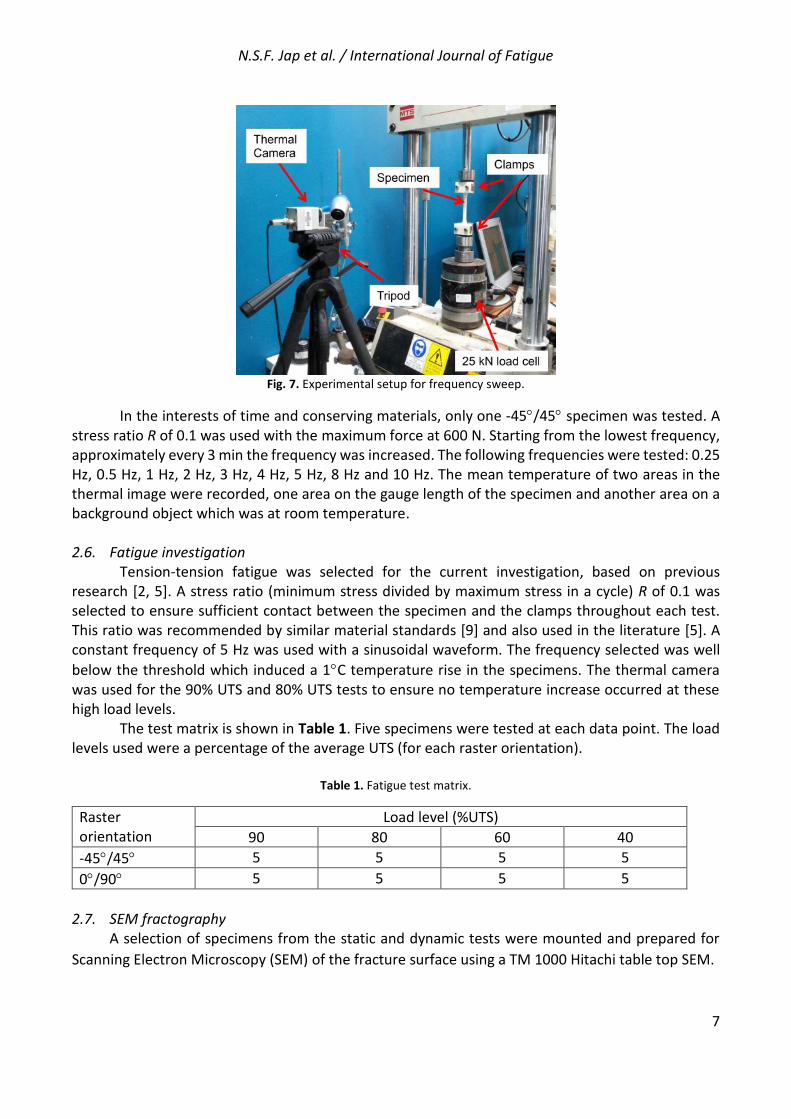
The same setup as for the tensile test was used, with the addition of a thermoIMAGER TIM 160 Micro-Epsilon America thermal camera positioned in front of the specimen (refer to Fig. 7). TIM Connect software was used to record the thermal data at a frequency of 1 Hz.
N.S.F. Jap et al. / International Journal of Fatigue
7
Fig. 7. Experimental setup for frequency sweep.
In the interests of time and conserving materials, only one -45/45 specimen was tested. A stress ratio R of 0.1 was used with the maximum force at 600 N. Starting from the lowest frequency, approximately every 3 min the frequency was increased. The following frequencies were tested: 0.25 Hz, 0.5 Hz, 1 Hz, 2 Hz, 3 Hz, 4 Hz, 5 Hz, 8 Hz and 10 Hz. The mean temperature of two areas in the thermal image were recorded, one area on the gauge length of the specimen and another area on a background object which was at room temperature. 2.6. Fatigue investigation
Tension-tension fatigue was selected for the current investigation, based on previous research [2, 5]. A stress ratio (minimum stress divided by maximum stress in a cycle) R of 0.1 was selected to ensure sufficient contact between the specimen and the clamps throughout each test. This ratio was recommended by similar material standards [9] and also used in the literature [5]. A constant frequency of 5 Hz was used with a sinusoidal waveform. The frequency selected was well
below the threshold which induced a 1C temperature rise in the specimens. The thermal camera was used for the 90% UTS and 80% UTS tests to ensure no temperature increase occurred at these high load levels.
The test matrix is shown in Table 1. Five specimens were tested at each data point. The load levels used were a percentage of the average UTS (for each raster orientation).
Table 1. Fatigue test matrix.
Raster orientation
Load level (%UTS)
90 80 60 40
-45/45 5 5 5 5
0/90 5 5 5 5
2.7. SEM fractography
A selection of specimens from the static and dynamic tests were mounted and prepared for
Scanning Electron Microscopy (SEM) of the fracture surface using a TM 1000 Hitachi table top SEM.
N.S.F. Jap et al. / International Journal of Fatigue
8
3. Results and discussion
3.1. Static tensile tests Orienting the build direction of the specimen in different planes changes the amount of
extruded filament alignment with loading, which can significantly affect UTS [9][10]. The results for
both raster orientations are summarised in Table 2. The average UTS of the -45/45 raster
orientation is approximately 3 MPa or 15% greater than the 0/90 group. A two-sample t-test at 5% significance indicated that the difference was statistically significant (p-value ≪ 0.001). Shapiro-Wilk tests performed at 5% significance on each group showed that normal distributions could be assumed (p-value > 0.2). The UTS of each raster orientation was consistent across all the specimens tested, as indicated by the relatively small standard deviations. This result shows that the 3D printer generates reproducible results across different print runs with the same batch of raw material.
Table 2. Summary of static tensile test results.
Raster orientation Average UTS
(MPa) Standard
deviation (MPa)
-45/45 23.16 0.43
0/90 20.18 0.19
These results contradict those of Ahn et al. [11], which demonstrated that the -45/45 raster
orientation had a smaller tensile strength than the 0/90 raster orientation. Ahn et al. also tested ABS made using an FFF printer; however, it is important to note that a different blend of ABS (P400) and different slicing software (Quickslice) were used. Lee and Huang [2] on the other hand, tested ABS P430 in addition to ABS P400. Their study found that ABS P430 had a UTS of approximately 32
MPa for the -45/45 raster orientation. This is much larger than what was measured in the present study. However, in addition to the use of a different, higher-end 3D printer, a smaller layer resolution was used (0.007 in or 0.178 mm). Tymrak et al. [12] found that ABS specimens printed with a 0.2 mm layer height had a higher average UTS (29.7 MPa) than specimens printed with a 0.4 mm layer height
(28.2 MPa). The average UTS of the -45/45 raster orientation was 29.5 MPa; that of the 0/90
group was 27.7 MPa. The former is 1.8 MPa or 6.5% higher. Also, higher strain rates have been shown to result in higher UTS values compared to lower strain rates for printed parts [13]. Lee and Huang used a strain rate of 25.4 mm/min for their fatigue tests. It is not clear whether they used the same strain rate for their static tensile tests. Also, it was not clarified whether the actual or nominal cross-sectional area was used in the calculation of stress. Therefore, these differences may account for the
discrepancies in UTS values. ABS parts printed in a 0 orientation have previously been found to have tensile strengths approaching 30 MPa [13]. Other studies have shown tensile strengths varying between 10 and 18 MPa [10, 14, 15]. The variation of results presented in the literature reinforces the challenges associated with predicting absolute properties of FFF printed components. As indicated in Fig. 1, the properties are sensitive to many parameters, necessitating testing for each new configuration.
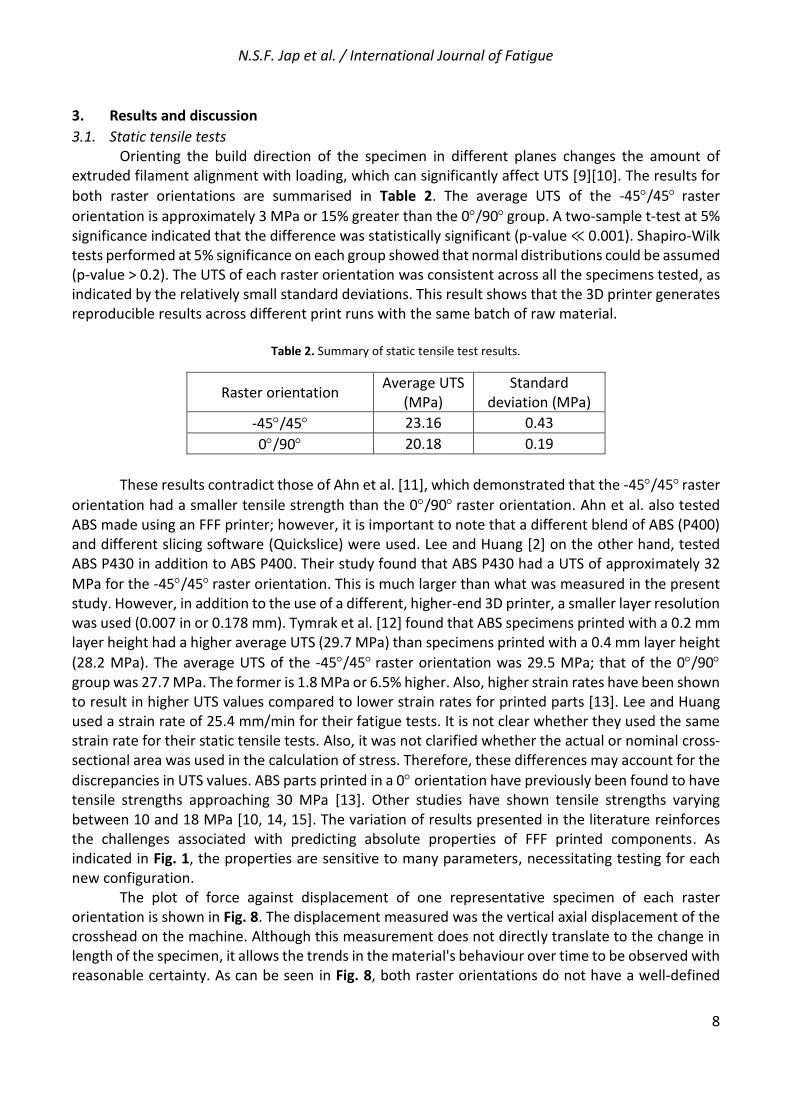
The plot of force against displacement of one representative specimen of each raster orientation is shown in Fig. 8. The displacement measured was the vertical axial displacement of the crosshead on the machine. Although this measurement does not directly translate to the change in length of the specimen, it allows the trends in the material's behaviour over time to be observed with reasonable certainty. As can be seen in Fig. 8, both raster orientations do not have a well-defined
N.S.F. Jap et al. / International Journal of Fatigue
9
yield point. There is also very little difference between the 0.2% proof stress and UTS for both specimen configurations.
Both specimens have a relatively constant plastic region before fracture. The features of this plot are slightly different to the plot presented in the work from Lee and Huang [2] possibly due to, again, a smaller layer resolution and different 3D printer model used or a different strain rate used. The strain rate cannot be verified as the previous publication did not specify the rate used for the static tension test.
Fig. 8. Force vs displacement for each raster orientation – (a) -45/45, (b) 0/90.
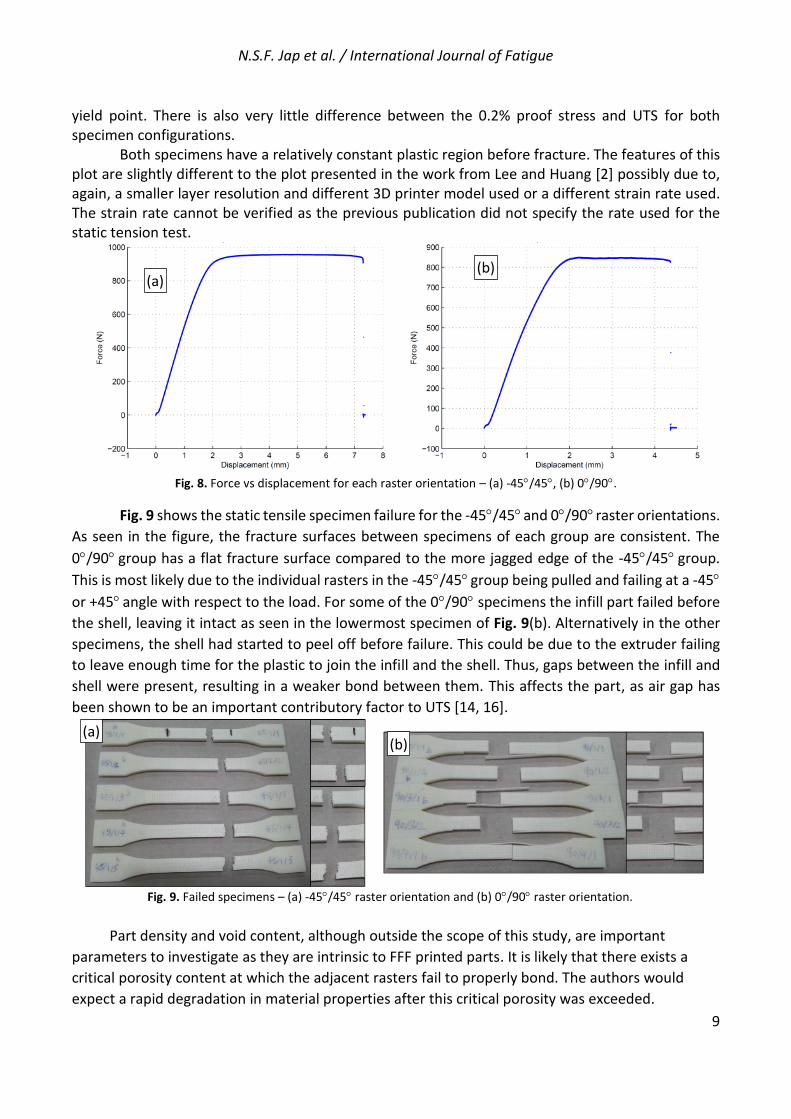
Fig. 9 shows the static tensile specimen failure for the -45/45 and 0/90 raster orientations.
As seen in the figure, the fracture surfaces between specimens of each group are consistent. The
0/90 group has a flat fracture surface compared to the more jagged edge of the -45/45 group.
This is most likely due to the individual rasters in the -45/45 group being pulled and failing at a -45
or +45 angle with respect to the load. For some of the 0/90 specimens the infill part failed before
the shell, leaving it intact as seen in the lowermost specimen of Fig. 9(b). Alternatively in the other
specimens, the shell had started to peel off before failure. This could be due to the extruder failing
to leave enough time for the plastic to join the infill and the shell. Thus, gaps between the infill and
shell were present, resulting in a weaker bond between them. This affects the part, as air gap has
been shown to be an important contributory factor to UTS [14, 16].
Fig. 9. Failed specimens – (a) -45/45 raster orientation and (b) 0/90 raster orientation.
Part density and void content, although outside the scope of this study, are important
parameters to investigate as they are intrinsic to FFF printed parts. It is likely that there exists a
critical porosity content at which the adjacent rasters fail to properly bond. The authors would
expect a rapid degradation in material properties after this critical porosity was exceeded.
(a) (b)
(a) (b)
N.S.F. Jap et al. / International Journal of Fatigue
10
3.2. Frequency sweep As discussed previously, a single specimen was subjected to a cyclic load across a range of
frequencies to determine if specimen heating was occurring during fatigue testing. The specimen was loaded cyclically to a load of 600 N, which corresponded to a load level of around 60% UTS.
Thermal imaging of the specimen and surrounds was conducted. The temperature of the specimen was not significantly affected by the range of frequencies tested; the observed change in
temperature was much smaller than the recommended maximum temperature rise of 10C [9]. Therefore, based on this frequency sweep test and the recommendations of material standards, the chosen test frequency was 5 Hz. The chosen frequency was kept as low as practically possible, within the recommended frequency range of 1-25 Hz [9], to reduce the possible occurrence of excessive heating effects at higher loading ratios (i.e. 80-90% UTS).
3.3. Fatigue investigation
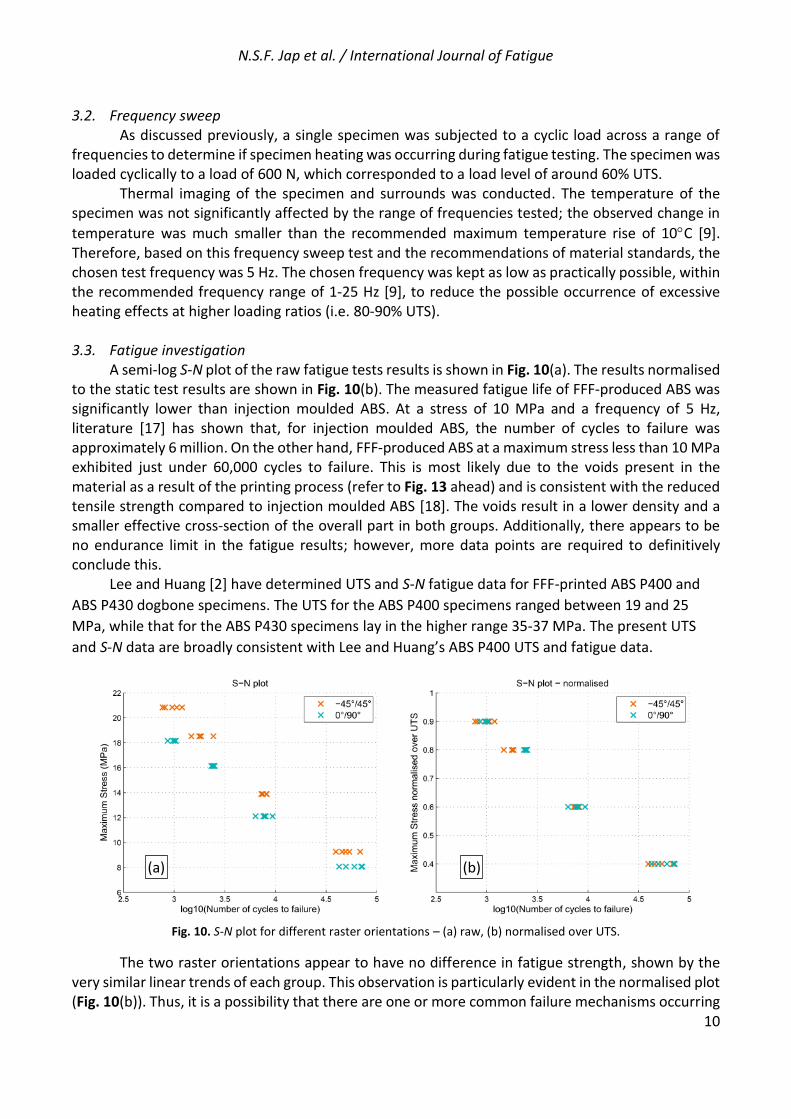
A semi-log S-N plot of the raw fatigue tests results is shown in Fig. 10(a). The results normalised to the static test results are shown in Fig. 10(b). The measured fatigue life of FFF-produced ABS was significantly lower than injection moulded ABS. At a stress of 10 MPa and a frequency of 5 Hz, literature [17] has shown that, for injection moulded ABS, the number of cycles to failure was approximately 6 million. On the other hand, FFF-produced ABS at a maximum stress less than 10 MPa exhibited just under 60,000 cycles to failure. This is most likely due to the voids present in the material as a result of the printing process (refer to Fig. 13 ahead) and is consistent with the reduced tensile strength compared to injection moulded ABS [18]. The voids result in a lower density and a smaller effective cross-section of the overall part in both groups. Additionally, there appears to be no endurance limit in the fatigue results; however, more data points are required to definitively conclude this.
Lee and Huang [2] have determined UTS and S-N fatigue data for FFF-printed ABS P400 and
ABS P430 dogbone specimens. The UTS for the ABS P400 specimens ranged between 19 and 25
MPa, while that for the ABS P430 specimens lay in the higher range 35-37 MPa. The present UTS
and S-N data are broadly consistent with Lee and Huang’s ABS P400 UTS and fatigue data.
Fig. 10. S-N plot for different raster orientations – (a) raw, (b) normalised over UTS.
The two raster orientations appear to have no difference in fatigue strength, shown by the very similar linear trends of each group. This observation is particularly evident in the normalised plot (Fig. 10(b)). Thus, it is a possibility that there are one or more common failure mechanisms occurring
(a) (b)
N.S.F. Jap et al. / International Journal of Fatigue
11
in both groups, causing them to fail at a similar number of cycles. Previous research [5] comparing
other raster orientations including 0, 90 and 45 with -45/45 showed that the 90 and 45 raster
orientations performed more poorly than -45/45 at the same percentage of their respective tensile strengths.
Statistical analysis was carried out to confirm that there is no difference between the two raster orientation groups. The Shapiro-Wilk test at 5% significance was performed to check for normality of each sample for each raster orientation. The tests on all samples reported p-values greater than 0.1; thus the data collected were assumed to be normally distributed.
Two-sample t-tests were then carried out on each pair of samples at each stress level at 5% significance. The null hypothesis was that the two groups had equal means and the alternative hypothesis was that the two groups had unequal means. The variances were not assumed to be equal. The 40%, 60% and 90% stress level groups have p-values greater than 0.1. Thus, there is little evidence against the null hypothesis. The 80% group t-test, however, had a p-value between 0.01 and 0.1, indicating there is some but inconclusive evidence against the null hypothesis. This may have
occurred due to the larger variability of the data collected for the -45/45 group, indicated by a
larger standard deviation of the number of cycles to failure compared to 0/90. Therefore, given that the two-sample t-tests suggest there is not enough evidence to reject the null hypothesis outright, it is highly likely that the two raster orientations fail due to tension-tension fatigue at the same rate.
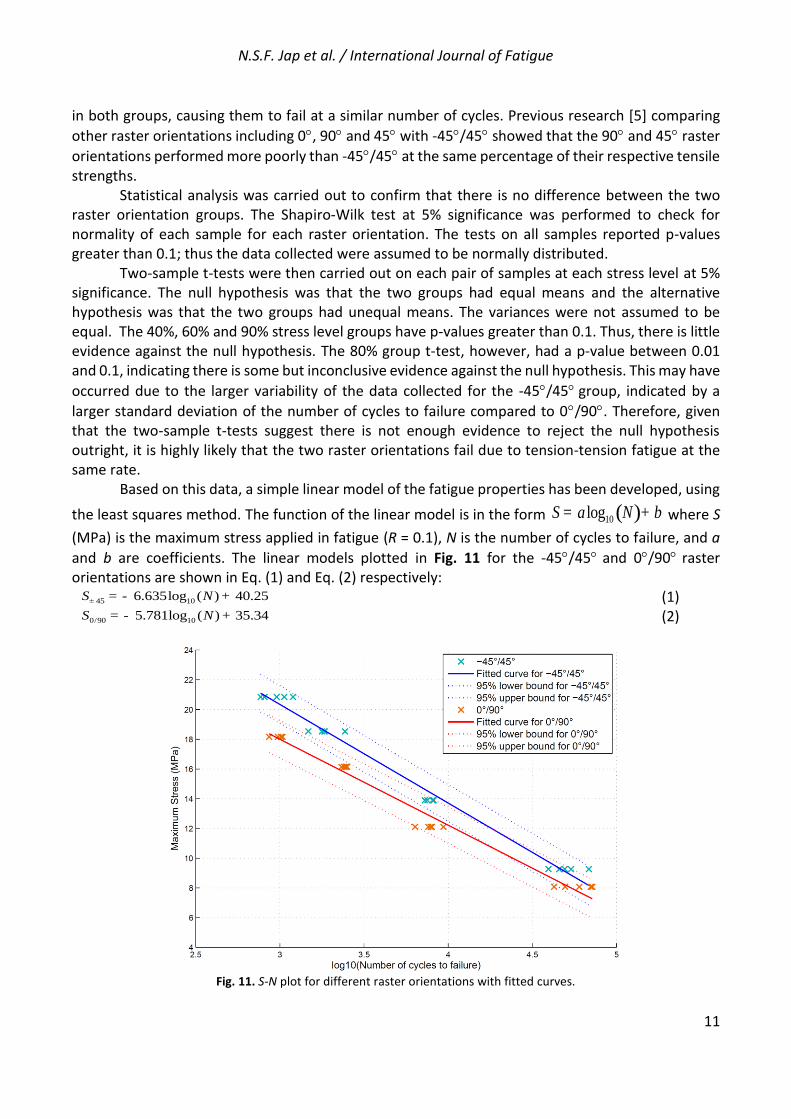
Based on this data, a simple linear model of the fatigue properties has been developed, using
the least squares method. The function of the linear model is in the form ( )10logS a N b= + where S
(MPa) is the maximum stress applied in fatigue (R = 0.1), N is the number of cycles to failure, and a
and b are coefficients. The linear models plotted in Fig. 11 for the -45/45 and 0/90 raster orientations are shown in Eq. (1) and Eq. (2) respectively:
45 106.635log ( ) 40.25S N± = - + (1)
0/90 105.781log ( ) 35.34S N= - + (2)
Fig. 11. S-N plot for different raster orientations with fitted curves.

N.S.F. Jap et al. / International Journal of Fatigue
12
When normalised by the UTS of the appropriate static tests, the linear fatigue models show
excellent agreement, as shown by Eqs. (3) and (4) as well as Fig. 12. An aggregate of the -45/45
and 0/90 data was also fit with a linear model, as shown in Eq. (5).
4510
45
0.2865log ( ) 1.738S
NUTS
±
±
= - + (3)
0/9010
0/90
0.2865log ( ) 1.751S
NUTS
= - + (4)
100.2861log ( ) 1.744aggregate
aggregate
SN
UTS= - + (5)
Fig. 12. S-N plot for different raster orientations with fitted curves normalised over the UTS.
The 95% confidence bounds are also shown in Fig. 11 and Fig. 12. To assess the accuracy of the derived linear models, the goodness-of-fit statistics were computed for both raster orientations (refer to Table 3).
Table 3. Goodness-of-fit statistics.
Curve fit Goodness-of-fit statistics
R-square RSME (MPa)
-45/45 0.9852 0.5708
0/90 0.9808 0.5663
The R-square statistic is the proportion of the observed response variation which can be
explained by the linear model. For both normalised and non-normalised models of each raster orientation, the R-square values were greater than 0.98. This means that 98% of the response variance is accounted for by the linear model.
The root mean squared error (RMSE), also known as the standard error of regression, measures the average error of the predicted value from the model with the observed data. The RMSE
N.S.F. Jap et al. / International Journal of Fatigue
13
values for the non-normalised models of the -45/45 and 0/90 groups are 0.5708 MPa and 0.5663 MPa respectively. Therefore, on average, the linear model for each raster orientation will have an
error of 0.6 MPa, which is equivalent to approximately 2.6% and 3% of the UTS of the -45/45 and
0/90 raster orientations respectively. These two goodness-of-fit statistical measures show that the model should be reasonably
accurate for prediction purposes. However, the 95% prediction bounds are quite large and span over approximately 3/4 of a decade (as seen in Fig. 12). This leads to a larger prediction range at lower
stresses. For example, at approximately 8 MPa for the 0/90 raster orientation the number of cycles to failure, according to the model, could be between 31,600 and 75,000. Further data points at other stress levels may help improve these models and narrow the confidence bounds; however, the variability at low stress levels is influenced strongly by the inherent variability of the printing process.
A spreadsheet containing all the fatigue data may be found in electronic Appendix B in the online version of this article. 3.4. SEM fractography
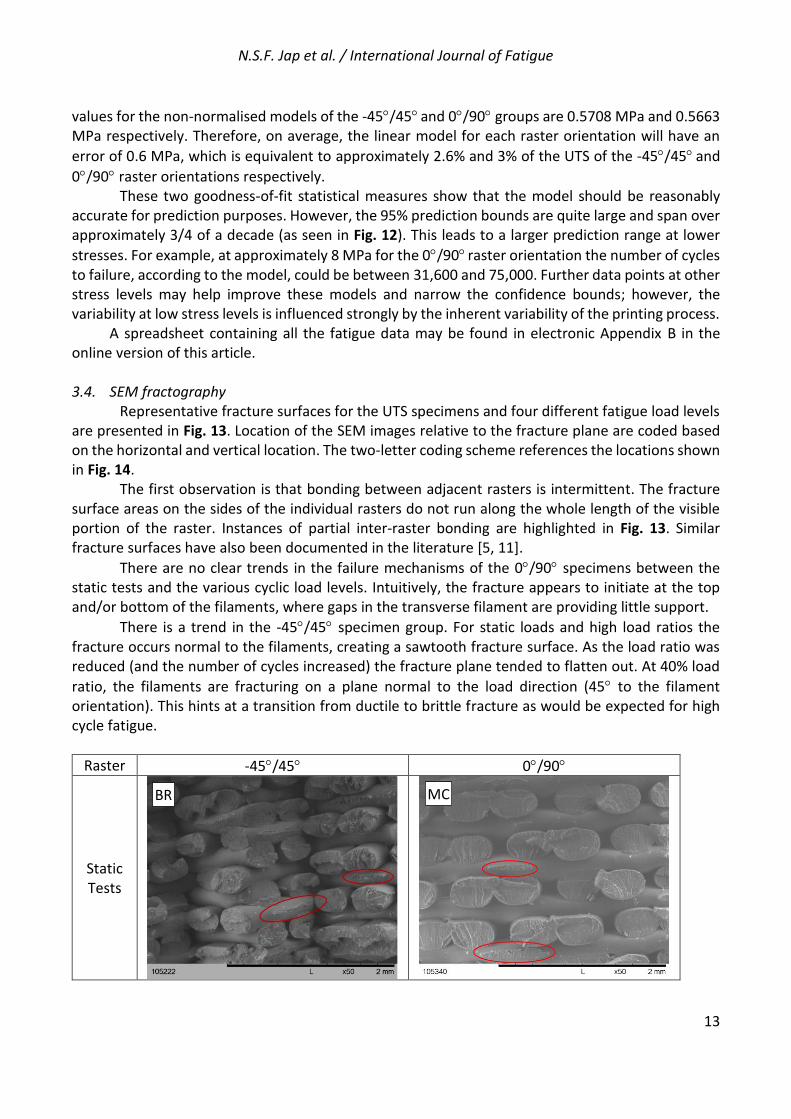
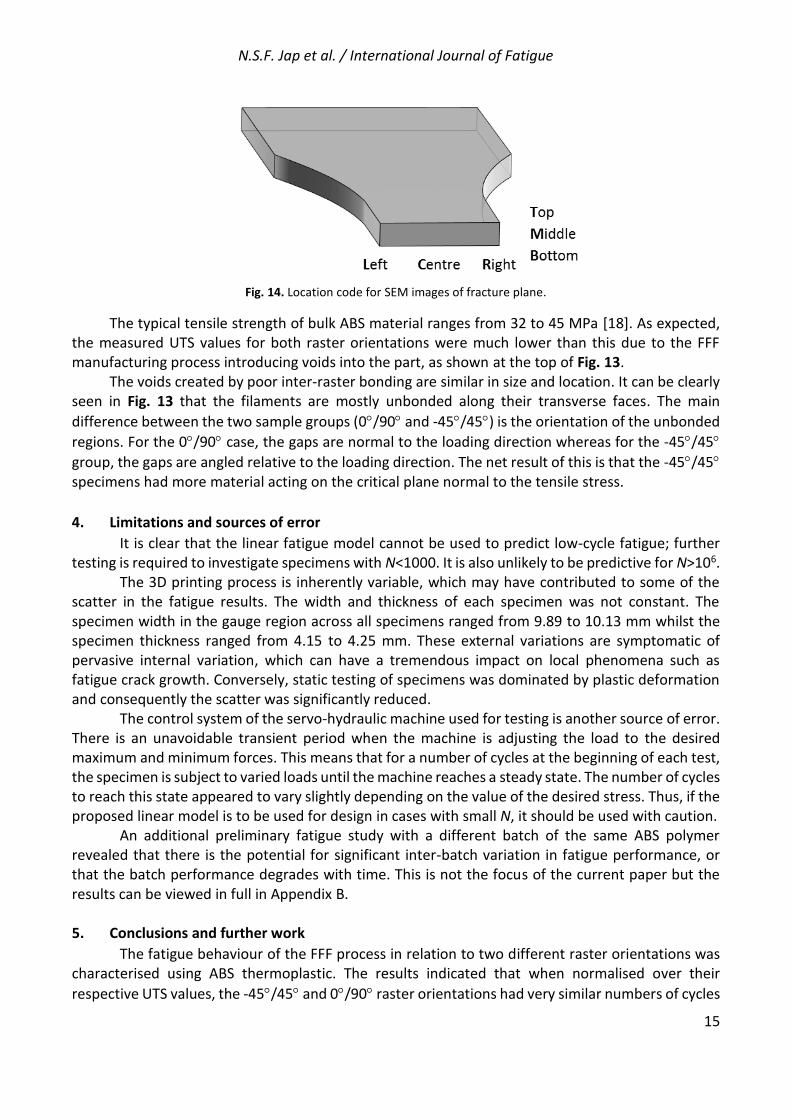
Representative fracture surfaces for the UTS specimens and four different fatigue load levels are presented in Fig. 13. Location of the SEM images relative to the fracture plane are coded based on the horizontal and vertical location. The two-letter coding scheme references the locations shown in Fig. 14.
The first observation is that bonding between adjacent rasters is intermittent. The fracture surface areas on the sides of the individual rasters do not run along the whole length of the visible portion of the raster. Instances of partial inter-raster bonding are highlighted in Fig. 13. Similar fracture surfaces have also been documented in the literature [5, 11].
There are no clear trends in the failure mechanisms of the 0/90 specimens between the static tests and the various cyclic load levels. Intuitively, the fracture appears to initiate at the top and/or bottom of the filaments, where gaps in the transverse filament are providing little support.
There is a trend in the -45/45 specimen group. For static loads and high load ratios the fracture occurs normal to the filaments, creating a sawtooth fracture surface. As the load ratio was reduced (and the number of cycles increased) the fracture plane tended to flatten out. At 40% load
ratio, the filaments are fracturing on a plane normal to the load direction (45 to the filament orientation). This hints at a transition from ductile to brittle fracture as would be expected for high cycle fatigue.
Raster -45/45 0/90
Static Tests
BR MC

N.S.F. Jap et al. / International Journal of Fatigue
14
90% UTS Fatigue
80% UTS Fatigue
60% UTS Fatigue
40% UTS Fatigue
Fig. 13. SEM images of fracture surfaces from static and fatigue tensile tests. Some contrast enhancement was applied
to the raw figures to increase visibility of fracture surface features.
MC
TL
MC
MC
BC
ML
BL
MC
N.S.F. Jap et al. / International Journal of Fatigue
15
Fig. 14. Location code for SEM images of fracture plane.
The typical tensile strength of bulk ABS material ranges from 32 to 45 MPa [18]. As expected, the measured UTS values for both raster orientations were much lower than this due to the FFF manufacturing process introducing voids into the part, as shown at the top of Fig. 13.
The voids created by poor inter-raster bonding are similar in size and location. It can be clearly seen in Fig. 13 that the filaments are mostly unbonded along their transverse faces. The main
difference between the two sample groups (0/90 and -45/45) is the orientation of the unbonded
regions. For the 0/90 case, the gaps are normal to the loading direction whereas for the -45/45
group, the gaps are angled relative to the loading direction. The net result of this is that the -45/45 specimens had more material acting on the critical plane normal to the tensile stress.
4. Limitations and sources of error
It is clear that the linear fatigue model cannot be used to predict low-cycle fatigue; further testing is required to investigate specimens with N<1000. It is also unlikely to be predictive for N>106.
The 3D printing process is inherently variable, which may have contributed to some of the scatter in the fatigue results. The width and thickness of each specimen was not constant. The specimen width in the gauge region across all specimens ranged from 9.89 to 10.13 mm whilst the specimen thickness ranged from 4.15 to 4.25 mm. These external variations are symptomatic of pervasive internal variation, which can have a tremendous impact on local phenomena such as fatigue crack growth. Conversely, static testing of specimens was dominated by plastic deformation and consequently the scatter was significantly reduced.
The control system of the servo-hydraulic machine used for testing is another source of error. There is an unavoidable transient period when the machine is adjusting the load to the desired maximum and minimum forces. This means that for a number of cycles at the beginning of each test, the specimen is subject to varied loads until the machine reaches a steady state. The number of cycles to reach this state appeared to vary slightly depending on the value of the desired stress. Thus, if the proposed linear model is to be used for design in cases with small N, it should be used with caution.
An additional preliminary fatigue study with a different batch of the same ABS polymer revealed that there is the potential for significant inter-batch variation in fatigue performance, or that the batch performance degrades with time. This is not the focus of the current paper but the results can be viewed in full in Appendix B. 5. Conclusions and further work
The fatigue behaviour of the FFF process in relation to two different raster orientations was characterised using ABS thermoplastic. The results indicated that when normalised over their
respective UTS values, the -45/45 and 0/90 raster orientations had very similar numbers of cycles
N.S.F. Jap et al. / International Journal of Fatigue
16
to failure. This led to the conclusion that a failure mechanism inherent to the FFF process may be occurring in both raster orientations.
Both raster orientations presented linear trends in the semi-log S-N plots. Linear models were derived for each raster orientation and goodness-of-fit statistics were computed, showing that the model can reliably predict new response values. However, this accuracy of the models is limited by the number of data points used and the range of stress values considered. The 20 data points used for each model at four different stresses resulted in relatively wide prediction bounds at 95% confidence. Thus, these models should be used with caution.
One clear finding of the work is that, for a given stress level, the raster orientation has a great impact on the fatigue life of the component. Evaluation of the models for a constant stress, say 16
MPa, shows the -45/45 raster specimen to have more than twice the fatigue life of the equivalent
0/90 raster specimen. Batch-to-batch variation of material fatigue properties needs to be thoroughly investigated
in conjunction with more detailed characterisation of the raw print material. It is not clear from the current work what influence a quasi-isotropic specimen raster, with
alternating -45/45 and 0/90 blocks (or other combinations), has on the fatigue performance of the components. It is possible that quasi-isotropic specimens would exhibit intermediate fatigue properties, but it is also possible that the fatigue lives would improve due to crack arrest mechanisms only present with more filament orientations.
Acknowledgements
The authors gratefully acknowledge Dr Ediz Cetin for his input from a space application perspective and for allowing use of the MakerBot 3D printer owned by the Australian Centre for Space Engineering Research (ACSER) for preliminary studies. This work was funded internally by UNSW Sydney and did not rely on support from external grant funding. Supplementary material to be provided for final publishing
Appendix A. Bachelor of Engineering (Mechatronics) Final Year Honours Project Thesis by N.S.F. Jap (.pdf file). Appendix B. Spreadsheet containing all fatigue data (.xls file).
References
1. Jap, N.S.F. 3D printing functional structures for space applications. Bachelor of Engineering (Mechatronics) Final Year Honours Project Thesis. NSW, Australia: UNSW Sydney; 2014.
2. Lee, J. and A. Huang. Fatigue analysis of FDM materials. Rapid Prototyping Journal, 2013; 19(4): 291-299.
3. Ziemian, S., M. Okwara, and C.W. Ziemian. Tensile and fatigue behavior of layered acrylonitrile butadiene styrene. Rapid Prototyping Journal, 2015; 21(3): 270-278.
4. Ziemian, C.W., et al. Monotonic and cyclic tensile properties of ABS components fabricated by additive manufacturing. In: Proceedings of 25th annual international solid freeform fabrication symposium, Austin, TX, USA; 4-6 August 2014. p. 525-541.
N.S.F. Jap et al. / International Journal of Fatigue
17
5. Ziemian, C.W., M.M. Sharma, and S.N. Ziemian. Anisotropic mechanical properties of ABS parts fabricated by fused deposition modelling. In: Gokcek, M., editor, Mechanical engineering. InTech; 2012. p. 159-180. ISBN: 978-953-51-0505-3.
6. Dizon, J.R.C., et al. Mechanical characterization of 3D-printed polymers. Additive Manufacturing, 2018; 20: 44-67.
7. ISO 527-2:2012. Plastics – Determination of tensile properties – Part 2: Test conditions for moulding and extrusion plastics. Geneva, Switzerland: Standardization, I.O.f., 2012.
8. Berti, G., et al. Mechanical characterisation of PA‐Al2O3 composites obtained by selective laser sintering. Rapid Prototyping Journal, 2010; 16(2): 124-129.
9. ISO 13003:2003. Fibre-reinforced plastics – Determination of fatigue properties under cyclic loading conditions. Geneva, Switzerland: Standardization, I.O.f., 2003.
10. Bellini, A. and S. Güçeri. Mechanical characterization of parts fabricated using fused deposition modeling. Rapid Prototyping Journal, 2003; 9(4): 252-264.
11. Ahn, S.H., et al. Anisotropic material properties of fused deposition modeling ABS. 2002; 8(4): 248-257.
12. Tymrak, B.M., M. Kreiger, and J.M. Pearce. Mechanical properties of components fabricated with open-source 3-D printers under realistic environmental conditions. Materials & Design, 2014; 58: 242-246.
13. Rodríguez, J.F., J.P. Thomas, and J.E. Renaud. Mechanical behavior of acrylonitrile butadiene styrene (ABS) fused deposition materials. Experimental investigation. Rapid Prototyping Journal, 2001; 7(3): 148-158.
14. Li, L., et al. Composite modeling and analysis for fabrication of FDM prototypes with locally controlled properties. Journal of Manufacturing Processes, 2002; 4(2): 129-141.
15. Sood, A.K., R.K. Ohdar, and S.S. Mahapatra. Parametric appraisal of mechanical property of fused deposition modelling processed parts. Materials & Design, 2010; 31(1): 287-295.
16. Rodrıguez, J.F., J.P. Thomas, and J.E. Renaud. Design of fused-deposition ABS components for stiffness and strength. Journal of Mechanical Design, 2003; 125(3): 545-551.
17. Lampman, S. Characterization and failure analysis of plastics. Materials Park, OH, USA: ASM International; 2003. ISBN: 0-87170-789-6.
18. Davis, J.R., editor. ASM materials engineering dictionary. Materials Park, OH, USA: ASM International; 2006. ISBN: 087170-447-1.