Embed Size (px)
Citation preview

THE EFFECT OF PRODUCT PACKAGING ON
CONSUMER CHOICE OF COSMETIC BRANDS: A CASE
OF STUDENTS IN USIU-AFRICA
BY
WINNIE C. RUTO
UNITED STATES INTERNATIONAL UNIVERSITY-
AFRICA
SUMMER, 2015

THE ROLE OF PRODUCT PACKAGING ON CONSUMER CHOICE
OF COSMETIC BRANDS: A CASE OF STUDENTS IN USIU-
AFRICA.
BY
WINNIE C. RUTO
A Project Report Submitted to the Chandaria School of Business in
Partial Fulfilment of the Requirement for the Degree of Masters in
Business Administration (MBA)
UNITED STATES INTERNATIONAL UNIVERSITY-AFRICA
SUMMER, 2015
ii
STUDENT’S DECLARATION
I, the undersigned, declare that this is my original work and has not been submitted to any
other college, institution or university other than the United States International
University in Nairobi for academic credit.
Signed: ________________________ Date: _________________________
Winnie Ruto (ID. No: 640846)
This project has been presented for examination with my approval as the appointed
supervisor.
Signed: ________________________ Date: _________________________
Dr. Joseph Ngugi Kamau
Signed: _______________________ __ Date: _________________________
Dean, School of Business

iii
COPY RIGHT
All material in this project report is unless otherwise stated, the property of Winnie
Chepchumba Ruto. Copyright and other intellectual property laws protect this material.
Reproduction of the materials, in part or whole in any manner without the prior written
consent of the copyright holder, is a violation of Copyright law. ©

iv
ABSTRACT
Much has been discussed in the academic field with a greater inclination of packaging
from the point of view of the producer (manufacturers, retailers, product designers etc.).
However, less has been done with respect to packaging from the point of view of the final
consumer. The purpose of this study is to therefore focus on the consumer, and how the
efforts put behind product packaging technology of cosmetic products influence
consumer purchase choice.
This study was governed by three specific objectives; the assessment of graphics (colour
and artwork), package dimension (shape and design) and information (labels), and how
these key areas of packaging influence consumer choice of cosmetic brands. Ultimately,
these aspects ought to reveal a general perspective of the impact of packaging on
consumer choice of cosmetic brands.
The research employed a descriptive design and utilized the United States International
University-Africa students as the population for this study. A sample size of 100 students
was selected through a probability sampling design (stratified and systematic sampling),
and was furnished with questionnaires to facilitate data collection. The information was
then analysed and subjected to interpretation to further understand the association
between product packaging and consumer choice of cosmetic brands.
An analysis of the responses received by the sample population was subjected to various
measures of description and inference to determine the said association, ultimately setting
the direction in which the research inclined to. Statistically, this study has endorsed the
purpose of the research set out by indicating the existence of an association between
product packaging and consumer choice of cosmetic brands.
It was concluded that in support of the of the existing relationship between product
packaging and consumer choice of cosmetic brands, firms in the cosmetic industry are
justified in their efforts of designing attractive packaging in a bid to attract consumer
interest and evoke purchase decision. The packaging variables have shown their
importance both independently and cumulatively in communicating product quality and
features in a manner that is competitive.

v
A major recommendation emanating from this study is an academic inquisition into the
role of package technology on consumer choice. Alternatively, would be the option of
looking into other consumables that highly depend on packaging for their marketing
functions, especially those restricted from certain promotional efforts like alcoholic
products and tobacco related brands. Aside from packaging, other marketing areas that
strongly came out in the course of this study was the role of positioning strategies on
consumer choice.

vi
ACKNOWLEDGEMENT
I would like to acknowledge my family and friends for the emotional support they have
provided while I have undertaken the preparation of this proposal.
I would also wish to thank Dr. Joseph Ngugi, Prof. Francis Wambalaba and Dr. Stephen
Maore (all of whom serve as faculty members in USIU-Africa) for their efforts in
assisting with the guidance and formulation of this academic document.
I would equally want to thank USIU-Africa for availing the facilities necessary for the
unlimited and continual development of this proposal.
Finally, I would wish to thank God, without whom all this would have been impossible.

vii
TABLE OF CONTENTS
STUDENT’S DECLARATION ....................................................................................... ii
COPY RIGHT .................................................................................................................. iii
ABSTRACT ...................................................................................................................... iv
ACKNOWLEDGEMENT .............................................................................................. vii
LIST OF TABLES .............................................................................................................x
LIST OF FIGURES ........................................................................................................ xii
CHAPTER ONE ................................................................................................................1
1.0 INTRODUCTION...................................................................................................1
1.1 Background of the Study ..........................................................................................1
1.2 Statement of the Problem ..........................................................................................4
1.3 General Objective of the Study .................................................................................5
1.4 Specific Research Objectives ....................................................................................5
1.5 Importance of the Study ............................................................................................5
1.6 Scope of the Study ....................................................................................................5
1.7 Definition of Terms...................................................................................................6
1.8 Chapter Summary .....................................................................................................6
CHAPTER TWO ...............................................................................................................7
2.0 LITERATURE REVIEW ......................................................................................7
2.1 Introduction ...............................................................................................................7
2.2 The Influence of the Graphical Aspect on Consumer Choice ..................................7
2.3 The Influence of the Dimensional Aspect on Consumer Choice ............................10
2.4 The Influence of the Product Information on Consumer Choice ............................13
2.5 Chapter Summary ...................................................................................................15

viii
CHAPTER THREE .........................................................................................................16
3.0 RESEARCH METHODOLOGY ........................................................................16
3.1 Introduction .............................................................................................................16
3.2 Research Design......................................................................................................16
3.3 Population and Sampling Design ..............................................................................16
3.4 Data collection Method ...........................................................................................18
3.5 Research Procedures ...............................................................................................18
3.6 Data Analysis Method.............................................................................................19
3.7 Chapter Summary ...................................................................................................19
CHAPTER FOUR ............................................................................................................20
4.0 RESULTS AND FINDINGS ................................................................................20
4.1 Introduction .............................................................................................................20
4.2 Demographic Status ................................................................................................20
4.5 The Influence of Graphics on Consumer Choice ....................................................23
4.5 The Role of Dimensions on Consumer Chioce .......................................................28
4.5 The Influence of Product Information on Consumer Choice ..................................31
4.6 Cumulative Analysis ...............................................................................................35
4.7 Chapter Summary ...................................................................................................40
CHAPTER FIVE .............................................................................................................41
5.0 DISCUSSION, CONCLUSIONS AND RECOMMENDATIONS ...................41
5.1 Introduction .............................................................................................................41
5.2 Summary .................................................................................................................41
5.3 Discussion ...............................................................................................................43
5.4 Conclusions .............................................................................................................46
5.5 Recommendations ...................................................................................................48

ix
REFERENCES .................................................................................................................50
APPENDIX .......................................................................................................................53
APPENDIX I: QUESTIONNAIRE: COSMETIC PACKAGING ..............................53

x
LIST OF TABLES
Table 3.1: USIU-Africa undergraduate student distribution.............................................. 17
Table 4.1: Statistical Analysis of Graphics ........................................................................ 23
Table 4.3: Correlation Analysis (Colour vs. Artwork Perception) .................................... 24
Table 4.3: Correlation Analysis (package graphics vs. product manufacture location) .... 24
Table 4.4: Correlation Analysis (package graphics vs. product manufacture preference
location)..............................................................................................................................25
Table 4.5: Correlation Analysis (package graphics vs. consumer price consideration) .... 25
Table 4.6: Correlation Analysis (package graphics vs. product proximity) ...................... 26
Table 4.7: Correlation Analysis (package graphics vs. brand familiarity) ........................ 26
Table 4.8: Statistical Analysis of Dimension ..................................................................... 28
Table 4.9: Correlation Analysis (Package Dimension) ...................................................... 28
Table 4.10: Correlation Analysis (package dimension vs. product manufacture
location)…. ........................................................................................................................ 29
Table 4.11: Correlation Analysis (package dimension vs. product manufacture preference
location)..............................................................................................................................29
Table 4.12: Correlation Analysis (package dimension vs. consumer price
consideration)… ................................................................................................................. 30
Table 4.13: Correlation Analysis (package dimension vs. product proximity) ................. 30
Table 4.14: Correlation Analysis (package dimension vs. brand familiarity) ................... 30
Table 4.15: Statistical Analysis of Information ................................................................. 32
Table 4.16: Correlation Analysis (package information) .................................................. 32
Table 4.17: Correlation Analysis (product information vs. product manufacture
location)…. ........................................................................................................................ 33
Table 4.18: Correlation Analysis (product information vs. product manufacture
preference
location)..............................................................................................................................33
Table 4.19: Correlation Analysis (product information vs. consumer price
consideration)… ................................................................................................................. 34
Table 4.20: Correlation Analysis (product information vs. product proximity) ................ 34
Table 4.21: Correlation Analysis (product information vs. brand familiarity) .................. 35
Table 4.22: Correlation of Specific Research Objectives (graphics, dimension and
information) ....................................................................................................................... 35
Table 4.23: Model Summary ............................................................................................. 36

xi
Table 4.24: ANOVA .......................................................................................................... 36
Table 4.25: Coefficients ..................................................................................................... 36

xii
LIST OF FIGURES
Figure 4.1: Gender Distribution ......................................................................................... 20
Figure 4.2: Age Distribution .............................................................................................. 21
Figure 4.3: Monthly Income/ Allowance in Ksh. .............................................................. 21
Figure 4.4: Frequency Distribution of Colour Perception ................................................. 22
Figure 4.5: Frequency Distribution of Artwork Perception ............................................... 23
Figure 4.6: Frequency Distribution of the Package Dimension ......................................... 27
Figure 4.7: Frequency Distribution of Product Information .............................................. 31
Figure 4.8: Frequency Distribution of Product Manufacture Location ............................. 38
Figure 4.9: Frequency Distribution of Product Manufacture Preference Location ........... 38
Figure 4.10: Frequency Distribution of Consumer Price Consideration ........................... 39
Figure 4.11: Frequency Distribution of Product Proximity ............................................... 39
Figure 4.12: Frequency Distribution of Brand Familiarity ................................................ 40

1
CHAPTER ONE
1.0 INTRODUCTION
1.1 Background of the Study
According to the Department of the Environment of Northern Ireland, packaging may be
defined as “all products made of any material of nature to be used for the containment,
protection, handling, delivery and preservation of goods from the producer to the user or
consumer”, (Department of the Environment, 2010).This definition holds a level of truth;
that of the package being a product and as such ideally different from the product it
contains. However, contrary to this, the view of a package as a product independent of the
actual substance it bears is of little significance to consumers; theirs is a subconscious
assumption of a synonymous nature between the package and the product contained
within. As such it would therefore imply a linkage where a highly efficient and well-
designed package would ultimately translate into a product of superior quality, yet
researches have rarely isolated the cause of product satisfaction to the product’s package
(Hess, Singh, Metcalf, & Danes, 2014).On the other hand, consumer choice, derived from
human behaviour has been viewed as a volatile concept, difficult to measure and predict.
The burden of the success of a product has fallen into the hands of the marketer, who
observes consumer behaviour to create an ‘appealing’ package, consequently
manipulating packaging elements in order to turn the once ‘volatile concept’ into a
predictable and economically measurable outcome(Levin & Milgrom, 2004). However, as
the consumer changes in need, awareness and choice, and as competition grows to
attempt to level the playing field, so must the marketer adapt their strategies accordingly.
The cosmetic market in Kenya, over the past few years, has experienced an influx in the
number of products available within the industry. From fragrances to skin care ranges, the
consumer is spoilt for choice every time they walk into a retail store seeking for these
items. Though top global brands such as Revlon, L’Oreal, Estée Lauder, Nivea, Avon and
Oriflame (Rooney, 2011), have a presence in the country’s market, there is still cut throat
competition from local players scrambling for a piece of the market (Situma, 2013). Gone
are the days when a package was merely just a container that protected the product
through various stages within the supply chain (Kotler & Armstrong, 2010), it is now also

2
the last marketing communication tool that a company can use to advertise its product on
the shelf of a retail store (Rundh, 2009).
Competition within this industry has forced company stakeholders to invest in more
attractive and innovative packaging to appeal to the consumer. A package is therefore
highly instrumental in aiding a company’s positioning strategy as they target the
consumer market. How the consumer places the value of the product within their mind,
has quite a bit to do with the product packaging strategy in use (Ampuero & Vila, 2006).
Since the consumer is faced with so many products every single time they visit a retail
store, it is paramount that the package stands out from the rest of the array of similar
products, and is attractive enough to evoke a choice. The package should be convincing,
bringing together all its elements to appeal to the consumer’s need (Rundh, 2009, Kotler
& Armstrong, 2010).
Similar studies have been carried out with respect to the food industry especially in Asian
countries. In Iran, consumers give high regard to elements (shape, size, colour and type of
package) of food packages in their market, and this has led to preference of products
packaged in attractive, informative and highly functional packages. There is a sense of
connectivity associated with the product and the package, as the consumer feels the two
are synonymous. Since it is also the bearer of the product information, if well laid out, a
consumer will more likely purchase that product over the rest due to the informative role
it has played in their decision making process (Jafari, Sharif, Salehi & Zahmatkesh,
2013).
Once again, another research undertaken in Karachi, Pakistan, revealed similar results;
when packaging elements such as colour, package material, design and innovation were
tested against consumer preference, it was clear that packaging communicates consumer
perceived value of the product. If these elements are well combined, the package becomes
a marketing tool, having greater reach than advertising due to its continued after-purchase
product marketing. Like the consumer market in Iran, the package here is viewed as part
of the product; hence its quality communicates product value and further acts as a product
differentiator in the market. It is also key to note that their findings uncovered a partial
dependency of their results on a consumer’s level of involvement, the time constraint they
face when making their decisions, and a level of concern on the package’s environmental
friendliness (Ahmed, Parmar & Amin, 2014).

3
Other researches (Deliya & Parmar 2012; Shah, Ahmad & Ahmad 2013;Solanki 2014)
done in India and Pakistan tested, among other packaging elements, design, dimension,
information, innovation, the synonymous nature of the package and the product, the vital
role played by the package with respect to advertising and its crucial nature in
determining a consumer’s decision to purchase one product over another. Even though
the purpose of the package has evolved with time, it must still fulfil the basic
requirements; highly functional and protective of the product, not only through the supply
chain, but even after purchase, up until the product is fully exhausted.
It is evident that a package plays a certain role, both for the company and the consumer. It
is a ‘marketer’, stretching its effectiveness beyond the reach of other promotional tools
such as advertising. Packaging serves as a differentiator, positioning the product in a
manner that is visible to the consumer. As a result, despite the numerous competitive
brands of products, the package is able to ‘call out’ to the consumer, aiding in its location
in a retail store (Rundh, 2009). The consumer on the other hand is at an advantage, not
only of purchasing a product that is intact, but also in enjoying added benefits of
functionality, innovation, imagery and information that guides the decision making
process (Jafari, Sharif, Salehi & Zahmatkesh, 2013).
Cosmetic consumers in Kenya enjoy a wide range of products that are attractively
designed and packaged to appeal to their tastes and preferences. Companies are bringing
to the table various components of interest when it comes to the graphics, dimensions and
information included in the package. Attempts are made at ensuring that the package
meets the changing nature of preference of consumers, how they use the product, when
they use it, and why they use it.
With all that said what then does a consumer look for in a package? Aside from the
product itself, does the package introduce an intensified push to purchase a given
product? If the consumer was genuinely loyal to a particular brand, what then justifies a
company’s expenditure on increased research efforts of packaging and repackaging? The
ultimate test is of course visibility, the ability of the company to ensure that the package
can influence a consumer’s purchase choice now and repeatedly in the future (Rundh
2009; Shah, Ahmad & Ahmad 2013).
4
1.2 Statement of the Problem
In 2010, McKinsey Global Institute, the economic research arm of McKinsey and
Company, put together studies that revealed the potential of Africa as the economic haven
of the 21st century. As of 2008, Africa’s collective Gross Domestic Product (GDP)
amounted to $1.6 trillion, combined consumer spending estimated at $860 million and 52
cities within the region having a minimum population of 1 million. Within a decade from
2008, these figures are forecasted to escalate to a combine continental GDP of $2.6
trillion under the control of four key industries within the region (consumer-based
products, infrastructure, agriculture and resources), consumer spending rising to nearly
$1.4 trillion and half of the African population residing in developed cities. That said, it is
impossible to ignore the potential wielded by the African continent within the global
economic sphere. Even more compelling, is the role played by the consumer retail sector
(under which the cosmetic industry exists) that has registered a growth rate of 6.8%
between 2002 and 2007. African consumers are now more educated and exposed to
global trends and as such their demand for more value from corporates has caused a spur
in the retail circles of consumable products (McKinsey Global Institute, 2010).
Another dynamic angle that comes into play is internationalization and the concept of the
global village which have become widely embraced phenomena, sipping under the
consumer’s aesthetics and consequently causing a product’s package to become
somewhat of a volatile concept for every market player (Rundh, 2009). As cosmetic
manufacturers reach a stalemate on consumer satisfaction where the parity among
products is getting smaller and smaller, the package comes in as the final and most valued
tool in determining consumer purchase decision (Rundh, 2009; Shah, Ahmad & Ahmad,
2013).
Kenya’s cosmetic industry faces immense competition both from local manufacturers and
global giants who have now found the African turf rather lucrative to invest in and as
such are bringing their products and services closer to the Kenyan consumer (Situma,
2013). With the increase in competition, researchers have acknowledged the effect of
product packaging on corporate investment with respect to capital and human labour.
However the issue arising, and that which has informed the undertaking of this study, is
to determine whether the efforts put behind a cosmetic product’s package affects the
Kenyan consumer’s decision to actually purchase cosmetic products.

5
1.3 General Objective of the Study
To analyse the impact of cosmetic packaging on the Kenyan consumer choice with
respect to cosmetic brands.
1.4 Specific Research Objectives
1.4.1 To assess the influence of graphics (colour and artwork) on consumer choice.
1.4.2 To analyse the role of package dimensions (shape and design) on consumer
choice.
1.4.3 To measure the influence information on a package bears on consumer choice.
1.5 Importance of the Study
This study will test the relationship between a product’s package and a consumer’s
decision to purchase based on the package. The information emanating from this research
will be of benefit to the following;
1.5.1 Corporates
Cosmetic manufacturers and dealers with presence in the Kenyan market or future
intention of the said, who are keen on market information with respect to product
packaging and consumer choice, which may inform their strategies.
1.5.2 Researchers
Every study is of benefit to the realm of research in terms of knowledge addition and
expansion. This study would be of benefit to researchers seeking information on
marketing strategy of the cosmetic market in Kenya, with a focus on product packaging
and consumer choice.
1.6 Scope of the Study
This research will look into the aspects of product packaging that may have an effect on
consumer choice of the cosmetic products available in the Kenyan market. The study will
be primarily carried out in Nairobi among students of USIU-Africa, and as such may face
a broad geographic representation of Kenyan youth cosmetic consumers. Another
limitation worth noting would be a demographic factor of the sample population with

6
respect to age and income as students will generally be within the youth bracket and of
moderate income status.
1.7 Definition of Terms
Some of the terminologies used herein and what they refer to will be as follows;
Packaging: The art and science behind the container that carries a product (Department
of the Environment, 2010).
Consumer choice: The buyer’s/user’s decision to actualize purchase intent into purchase
decision (Miller , 2009).
1.8 Chapter Summary
This chapter has briefly introduced a background into the study of product packaging and
consumer choice of cosmetic brands in Kenya. It will be looking into aspects of a product
package (colour, shape and material) and how they influence consumer choice. It may
shed light on the viability of spending when it comes to product packaging in the
cosmetic industry with a focus on the student population of USIU-Africa.
Succeeding chapters will discuss literature that has been gathered under packaging and
consumer behaviour (Chapter Two) and the methodology to be employed for this study
(Chapter Three).
7
CHAPTER TWO
2.0 LITERATURE REVIEW
2.1 Introduction
In the previous chapter, a background into the study of the effect of product packaging on
consumer choice of cosmetic brands was outlined. In this chapter, a literature based
analysis will be undertaken to understand the concepts that define the research problem
earlier stated.
First will be an assessment of the content of each specific research objective; the aspect of
package graphics with respect to colour and artwork, the aspect of package dimensions
with regard to design and shape and the aspect of the informational content on the
package, with great bearing on the label component. Lastly, an illustration of the
conceptual framework in focus of this research.
2.2 Influence of the Graphical Aspect on Consumer Choice
Several articles reviewed give close relation to colour and artwork as the two main
graphical aspects of a product’s package. This relation has made it difficult to analyse
these two spheres independently and so this review will attempt to separate the two,
though not entirely.
2.2.1 Colour
Colour is a basic aspect of human perception and has intrigued many researchers to study
its impact and cognition on behaviour’ (Mehta & Zhu, 2009). The debate on the colour
preference on consumer choice has been a subject of heated debate among psychologists
and marketers alike. The bearing it holds on consumer preference has been drawn from
cognitive studies that have revealed a relationship between the colour red with danger and
mistakes, and the colour blue with a sense of serenity, freedom and openness. As such,
warm hues(generalized from the colour red) bring a connotation of thrill and boldness
while cool hues (blue) carry with them an air of tranqulity (Mehta & Zhu, 2009).
Branding is a story narrated by colour, not just in the creation of visual attractiveness but
in communicating the essence of the product. Cosmetic products are easily denoted by

8
their bold use of colour. A recent study places consumer preference of colour at close to
85%; an indication of the key role colour plays in consumer choice. It carries more than
just a message about the product, it relays the desired attributes that are unique to a brand.
Colour thus becomes the medium by which a brand voices its appeal (Doyle, 2006) (Hill,
2011).
Another school of thought looks at colour in relation to packaging, with representation on
consumer perceived quality. The aesthetic value placed on a product prmarily due to its
colour may affect how an individual views this item against simliar products. The idea
here is that there is a strong relationship between dark colours, especially black, with the
allure of elegance and refinement. A product packaged in this format will tend to
communicate higher value and consequently be thought as more exclusive. On the flip
side, bright colours tend to appear as just any other product and the consumer’s perceived
psychological view of this would be ‘a common man product’. This would translate into
such an item being viewed as relatively affordable and less exclusive (Ampuero & Vila,
2006). An illustration of warm hues such as yellow, orange and green are said to depict a
sense of natural value that consumer’s who tend to lean on less chemicalized products
appear to trust these product package colours as acceptable (Doyle, 2006).
A bit of importance on harmony and coherence between the actual product and the
package colour is of essence, especially in a research on how consumers interpret value of
wine based on the colour of the bottle. The respondents felt an intricate connection
between the package colour and value of the product. Once again, dark colours emerged
as more trusted, a sign of refinement, tradition and experience. Light coloured packages,
especially clear glass was described to make the product appear cheap, with little thought
put into it. However, a certain sense of bias tended to emerge that colours the evoked a
feeling of patriotism (this would be colour combinations that gave the feeling of one’s
national flag) were highly favoured when used in packaging. It is as if a consumer can
trust such a product over another; the subconcious notion that locally manufactured goods
would not be made to harm its own (Ampuero & Vila, 2006; Rocchi & Stefani, 2006).
Though many researchers have placed substantial importance on the use of colour in
packaging, there was a bizzare twist in another study that tested, among other things,
confectioneries, just to discover that consumers, though presented with multiple coloured
packages of the same products with the same weight and description, drew their purchase

9
decision more towards colourless/see-through packaging. It is as if the choice of the
manufacturer to use a transparent package is indeed a sign of trustworthiness. A brand in
this scenario is therefore more reliable if it opts for a clear package as opposed to the
choice of any other colour (Sevilla, 2012).
2.2.2 Artwork
History has given us much appreciation for art (paintings), whether fine or abstract. To a
trained eye, it can communicate vast amounts of thoughts and feelings that give one a
sense of warmth. Art has largely progressed over the years, carrying with it timelessness,
class and royalty. In product packaging, art has been used to convey its own pleasurable
influence onto products in the market. Marketers and manufacturers alike have used art to
draw a consumer’s interest into a realm of elegance and sophistication. Art has been
manipulated to transfer its value onto the product, almost making the two synonymous.
There is a strong belief that art has played into the mind of consumers, creating a high
level of appeal that is favourable. Money has been spent by many organizations into
researching and developing artistic content on a package that calls out to consumer’s
desire for fine things. It is a merger between perception and social attributes that makes
art entirely exclusive and now, important in packaging (Hagtvedt & Patrick, 2008).
Hagtvedt and Patrick (2008), undertook an assessment of what they termed as a spill-over
effect of visual art onto consumable products. The study points out that though the
relationship between art and favourable consumer perception of products has not been
entirely established, marketers have continued to follow cues on purchase behaviour that
have revealed a strong relationship between the visual art and positive consumption of
products packaged in ine with this.
Art was a rather exclusive affair in history, with the few exposed to high society having
not only an understanding of such masterpieces, but an appreciation to match it. However,
the current trend now seems to only appreciate the ‘air’ of art without feeling the need to
dig deeper into comprehending it. As such, marketers have gotten away with using any
form of art since the consumer is not necessarily concerned with the message of the art
piece itself, but more on the fact that it exists on the package. It has become a trend,
acceptable in the market due to its appeal and to a large extent, a sense of luxury. (Dairy
Managemnt Inc., 2001; Hagtvedt & Patrick, 2008)

10
The question of pictorial imagery has also been discussed, and classified as ‘nonart’. As
the study on art infusion tested art against nonart, there was overwhelming response in
support for art, further justifying the authors’ spill-over effect. Art communicated higher
quality and luxury as opposed to nonart, on the same packaged products. The same way
music has found a basis under classical conditioning of consumer behaviour, where the
attributes of the song are carried into the product, art has seemingly behaved the same
way. As such, art infusion has become important in packaging, regardless of the content
of the piece of art itself (Hagtvedt & Patrick, 2008).
Another line of thinking introduces art as a manipulation of lines and shapes, rather than
the previously discussed art in the form of paintings. On this sphere, the use of curves,
waves, shapes and lines of different forms not only indicate visual appreciation, but go
further to create demarcations of how such combinations appeal to different social
classes. It has been explained that structured lines and shape, with symmetry in how they
are paired together, communicate products of higher aesthetic value and draw a
perception of higher price. On the other hand, obscure and almost mismatched shapes,
and asymmetrical order tend to find themselves lower on the value perception spectrum
(Ampuero & Vila, 2006).
The conclusion thus drawn from the use of graphics may appear to match bold colour
combinations, art and symmetrical use of shapes and lines to fall at the top of consumer
value perception. Asymmetrical use of shapes and lines, nonart and bright colours seem
to heavily fall at the bottom of the value chain (Ampuero & Vila, 2006; Hagtvedt &
Patrick, 2008; Mehta & Zhu, 2009; Sevilla, 2012). This will be an important aspect to be
tested in this research.
2.3 The Influence of the Dimensions (Shape and Design) on Consumer Choice
The Gestalt Principles, orchestrated by a group of psychologists from Germany during the
early 1900s, brings into perspective a theory that attempts to explain human perception
with regard to dimensions. Gestalt is a psychological term coined to mean ‘unified whole’
(Spokane Falls Community College, 2013). These principles, commonly referred to as
laws, bring together five elements; that of similarity, continuation, proximity, closure, and
figure and ground, with the aim of explaining human tendency toward order, patterns and
hierarchy. The five laws rarely operate in isolation and as such the human mind will
perceive them simultaneously, sometimes combining two or more laws at a subconscious

11
level while interpreting various levels of meanings of shapes and designs. The law of
similarity dictates that human beings perceive that shapes and patterns that are similar
form a group and can thus create a level of unification. Should, among these shapes and
patterns, exist one that is unlike the rest, the mind perceives it as an ‘anomaly’. As such, a
person would be drawn more to similarity as a result of the ‘order’ it presents and
disregard the ‘anomaly’. The law of continuation explains how the human mind inclines
towards progression, like name ‘gold’ printed in gold as opposed to pink; the gradual
transition from one form to another. This would mean that if two shapes existed and were
to be deemed related, a flow from one to the other was essential. The third is proximity,
defined as the degree of distance among shapes especially of a similar nature. The larger
the distance, the less the mind can perceive then as a whole. If this distance were to be
reduced, say a stack of toothpaste boxes close together, then the unification theory
dictates a strength in numbers; highly visible, greater appreciation. Closure is the ability
to fill in the gaps to create a complete picture. This is however only possible when the
existing pattern is familiar to an individual such that it is not necessary to see the entire
design but one can almost imagine it complete, much like the Apple logo. Lastly, figure
and ground; refers to how an object (figure) is perceived within its environment (ground).
The ability of the mind to conceptualize a shape or form is highly dependent on the
supportive nature of its surrounding e.g. a boldly coloured logo on a seemingly less
aggressive background. These five principles hold a certain assumption; that human
perception affirms these laws and disregarding any shape or design that does not abide by
Gestalt.
When it comes to the performance quality of any product, its shape and design have a
heavy bearing on it. This is fundamentally how the product appears on the shelf in a
supermarket, an afterwards in a consumer’s home. The basic function of a package that
any consumer evaluates almost at a subconscious level is its ability to hold and protect the
product through its life cycle (Deliya & Parmar, 2012; Shah, Ahmad & Ahmad, 2013;
Solanki, 2014). Just like the graphical aspect of colour and artwork, shape and design
under the aspect of dimensions have been used almost interchangeably in past studies and
the same shall be done here.
Among the many visual cues within close range to a consumer is the shape or
symmetrical nature of the package. It is not just important to the consumer, but is equally
crucial as it crosses the supply chain when it comes to issues of staking and packing. The

12
retailer needs to feel like the space used to display the product in the store is as minimal
as possible and at the same time, attractive and eye catching (Kotler & Armstrong, 2010).
In the cosmetic industry however, there seems to be a shift in the trend when it comes to
the use of dimension. It is nolonger about simple columns that are easy to align on a shelf
in the name of ‘space-conservation’, but the extreme end of the spectrum is being
experienced. Marketers have chosen to deconstruct shape into angles and features
previoulsy unimagineable. The geometric structure and panelling has been taken to a
level of deconstruction that is simply a sight to behold once one steps into a store. From
the shapes of smashed industrial metal, diamonds and dolls, to designs that spell out
brand logos and letters, cosmetics have indeed come a long way from panelled packaging
to deconstructed works of wonder (Hill, 2011).
Marketers have found out that the design and shape of cosmetics have to meet a sort of
decorative need when in the possession of the consumer. The more abstract the design, in
this case, the more catchy to the consumer. Since, unlike food consumables, cosmetic
products have grown into more collectable products, even after the product itself has been
exhausted. As such, it contiues to carry the marketing role into a consumer’s home. It has
become the future of brand identity, turning the entire process into a mark of exclusivity
and further into a limited edition pieces (Rundh, 2009; Hill, 2011; Underwood, 2011).
If a consumer feels that the thought put into designing the package of any particular
product is done creatively, then it bears an influence on perceived quality. If the shape
and design is extravagant, then the value placed on the item is worthwhile. Therefore,
together with superior performance quality, package design that is artistically revealed
has a positive impact on consumer purchase (Holmes & Paswan, 2012).
Design and shape are also viewed synonymously to the product such that when the shape
appears larger, then the consumer feels as though the quantity of the product is much
more than what it actually is. Consequently, if two similar products of matching quantity
are availed to a consumer, with one package larger than another, it is possible that a
consumer will select that which seems bigger as he relates that to value with respect to the
price spent. This becomes a very important factor when designing the shape of any
package since such consumer preference occurs almost without any thought (Rocchi &
Stefani, 2006).

13
To marketers, design is part and parcel of the initial communication between the brand
and the consumer within the closest proximity.It is thus essentially crucial in its role as a
communicator of the manufacturer’s strategy and promotional plan. For the consumer to
fully experience the product, the design has to be functional and catchy. In this way, the
consumer is satisfied at two levels; with the product itself and with the experience of
interacting with the package (Miller , 2009).
Another school of thought introduces an interesting twist into the nature of the design and
shape of a product; that of ‘closure’. Illustrated would be a sandwich that is presented
whole. The fact that its dimensions have not been altered means it has closure. If the
sandwich is to be cut, then its level of closure has been compromised. The study behind
this ascertained that consumers view on closure is directly related to their perception of
size such that a ‘closed’ package is of a greater size than one that seems altered. It is
because subconsciously, there lies a thought that there is a missing piece in this ‘puzzle’.
This approach goes against the extreme design as an appeal, saying that if a consumer
perceives closure (which can only exist in a structured package design) as a complete
product (Sevilla, 2012).
When it comes to design and shape therefore, it will be an area of assessment to test the
aspects brought out in the Gestalt principles against more ‘law-defying’ designs and to
understand what the purpose of the purchase really is; if it is to obtain the product for
itself or the package due to its design.
2.4 The Influence of Product Information (Labeling) on Consumer Choice
‘For a message to have an effect it must be believed’ (Sevilla, 2012). On any package,
information will either be displayed on the package directly or included on the label. Such
information ranges from the name of the product to the product composition list,
manufacture and expiration dates, location of manufacture etc. It is crucial in the current
time that information about a product is present on the package, and as such to serve the
dual role of communicating product benefits and detriments in equal measure. America
has viewed this with vigor and package information must disclose even warning signs so
that the consumer is fully aware of the product attributes (Miller , 2009).
It has also been held that the closer the proximity of the message is to the consumer, the
more believable it is since advertisements and other promotional tools have been shown

14
to have sense of distance between the consumer and the product. This not only applies
within the sphere of marketing but acts as a basic psychological principle of proximity
and message acceptability. This theory holds that the level of human acceptability of any
information is increased once the communication medium is brought to a closer range.
This therefore informs marketers on the information content to place on a product’s
package as it draws a consumer closer to the product as compared to other forms of
promotion like advertising (Sevilla, 2012).
Logos have also been incorporated in labels, and corporate manufactures with strong
logos and trademarks in the cosmetic industry use these to elbow past competition as they
capitalize on consumer familiarity with their brands. Information on the label is thus vital
in pushing a product in the market especially when used by renowned brands such as
Calvin Klein, Gucci, Dior and Prada (Hill, 2011).
One approach when it comes to labeling is the basic functionality behind it such that a
label should essentially have two parts; the front label that evokes consumer interest and
bears the marketing function of attractiveness, and the back label that has the technical
informational content of the product. The relationship between these two labels should
essentially be harmonious, as in the Gestalt Law of Figure and Ground, as the consumer
will not assess the two independently, but the back as a continuation of the front. That
said, emphasis is further placed on the shape, size and position of the label as well as the
nature of the inscription on it. Whether the information on the label tells a story of the
product or simply has a catchy ring to it is vital in determining the level of consumer
interest in the product. However, the foundation of it all is to ensure that the information
displayed on the package or label is true and relevant, so that the consumer feels a sense
of trustworthiness in the overall presentation of the product (Rocchi & Stefani, 2006;
Sevilla, 2012).
The matter on communication of value that is vested on a label is worth looking into. A
consumer responds positively to information that is well written and clear, since if the
label looks well organized, then the consumer perceives higher care given to this
particular product hence greater perceived quality. Another aspect mention in this study
that looked into the perception of consumers on the value of wine packaging was the
presence of a watermark on the label. There was an intrinsic feeling of exclusivity or that
the item is rare and almost collectable. It all boils down to the content of the information

15
and how it is presented (Rocchi & Stefani, 2006). The information selected to appear on a
package should be done carefully, to ensure that a positive lingers in a consumer’s mind
repeatedly. This repetitive nature is primarily for the purpose of product recollection,
ensuring that the desired image is retained in the consumer’s mind constantly to evoke
product choice. The underlying principles behind this are the Gestalt Laws of Closure and
Continuation; stating the ability of the mind to complete and incomplete form and
mentally perceive it as a whole, and the ability to gradually progress from one form to the
next, respectively (Spokane Falls Community College, 2013). Closure and continuation
work hand in hand when it comes to information; giving the consumer a basis on which to
build an image and generate expectations, preferably that the product is superior to the
rest on the shelf (Konnikova, 2014).An important factor to note as this study is
undertaken would be to understand the extent to which information (label) attracts
consumer interest and stimulates choice.
2.7 Chapter Summary
This chapter has reviewed literature on the three specific research objectives that shall
govern the scope of this study; the graphical aspect of a product package with regard to
colour and artwork, package dimensions as pertains shape and design, and finally
information, which has been closely connected with labeling. The next chapter will
describe the research design and methodology, outlining how data shall be sourced and
analyzed for interpretation.

16
CHAPTER THREE
3.0 RESEARCH METHODOLOGY
3.1 Introduction
This study seeks to analyse the impact of product packaging on consumer choice of
cosmetic brands. This chapter outlines the overall methodology to be undertaken for the
purposes of this research; research design, population and sampling design, data
collection methodology research procedures and the data analysis methods that governed
this study.
3.2 Research Design
Research design is described as the framework or plan for the study used as a guide in the
collection and analysis of data. The research design used in this study was descriptive in
nature. Cooper and Schindler (2003) describe a descriptive study as a method that tries to
discover answers to the questions who, what, when, where and sometimes how. It assists
in describing a subject often by creating a profile of a group of problems, people or
events. The descriptive design involves evaluating how different factors are perceived by
the consumers and how they affect their behaviour and choice. Since the study is aimed at
analysing the influence of product packaging on consumer choice of cosmetic brands, it
was appropriate to undertake a descriptive design to give more insight on consumer
purchase behaviour and statistically shed light on justifications of whether cosmetic
manufacturers should increase the expenditure on packaging technology, based on the
outcome of this study.
3.3 Population and Sampling Design
A population refers to all the individuals or objects that meet certain requirements for
membership in the overall group. Those who qualify are then referred to as the population
elements (Churchill & Brown, 2007). According to Cooper and Schindler (2003), a
population is the total collection of elements about which we wish to make inferences.
The purpose of the study was to study the influence of product packaging within the
Kenyan cosmetic industry. As such, the target population was obtained from United
States International University -Africa students. This is an institution that boasts of

17
coverage that is largely representative of both local and international students.
Though the balance of nationality may not be evenly scaled, it still offers valuable insight
into the consumption behaviour of cosmetic products with respect to packaging. All
undergraduate students in session at USIU-Africa formed the population for this study.
A sampling frame is an objective list of the population from which the researcher makes
her selection. It should contain a complete, up to date list of all those that comprise the
population for research (Descombe, 1998). According to Cooper and Schindler (2003),
this list should be a complete and correct list of the population members only. The
sampling frame in this study is made of the students of United States International
University. The records in the Student Affairs Office show that there are
5928undergraduate students. This information has been further illustrated in the table
below.
Table 3.1: USIU-Africa Undergraduate Student Distribution
Population Description Population Number Percentage
Male 2,753 46.44%
Female 3,175 53.56%
TOTAL 5,928 100%
Source: Student Affairs Records (USIU-Africa), March 2015.
The sampling techniques used in this study were stratified random sampling and simple
random sampling. This was to be so, in order to divide the undergraduate student
population into their respective year of study and gender (stratified) then further
administer the questionnaires randomly until the required sample size is arrived at. Since
the gender percentages are different, the ratio, 46% male: 54% female, an attempt will
made yield responses with respect to the gender distribution as shown in Table 1 above.
Cooper and Schindler (2003) stated that the sample size is the selected element or subset
of the population that is to be studied. To ensure that the sample accurately represents the
population, they further recommended that the researcher must clearly define the
characteristic of the population, determine the required sample size and choose the best
method for selecting the members of the sample from the larger population. Though
several techniques of selecting a sample size exist, the one that has been selected for this
study draws from a concept developed by Yamane in 1967 that presents a simplified
18
sampling formula, that brings together the population size and the preferred error term;
either 5% or 10% depending on the researcher’s desired level of confidence, to determine
an appropriate sample size as illustrated below (Singh & Masuku, 2014).
n = N/ 1+Ne²
Sample = Population/ (1 + [Population*sampling error²]
Walliman (2011) concurs and states that a population that is greater than 5,000 can apply
this formula to generate an appropriate scientific sample size since the magnitude of the
population may not entail a sample whose traits are extremely heterogeneous. Based on
the formula above, with the population of 5,928, and the sampling error as 10% (one of
the two acceptable error values for social sciences), then n is 98.341, hence a sample size
of 100 students was used to represent the estimated population; that is 1.7% of the general
population under study. It is also important to state that within a certain range of the
population size, the formula above may yield a similar sample size result. This has been
explained as mechanism to have a sample size that is manageable for study and hence
appropriate for large populations where the parity in heterogeneity is minimal.
3.4 Data collection Method
Primary data collection method was applied in this study. Data was collected using
questionnaires designed by the researcher. The questionnaire contained closed ended
questions, governed by the three research questions earlier described; that of graphics,
dimension and information, to ease analysis and minimize error. The use of a
questionnaire ensures that the required information is collected in the shortest time
possible. Secondary data was obtained from the admissions records where necessary.
3.5 Research Procedures
The researcher began by seeking approval of the proposal for continuation and sought
permission from the relevant authority to undertake the study in USIU-Africa. A letter
was then sent to the research office in USIU-Africa to notify them about the undertaking
of the research. The researcher recruited and trained research assistants to aid in data
collection. A list of all continuing undergraduate students was sourced from the
admission records to create strata within the population based on the students’ year of
study. The researcher conducted a pilot test of the questionnaire before the main research
to enhance the efficiency of the findings. A pre-test is conducted to detect weaknesses in

19
the design. It should therefore draw subjects from the target population and simulate the
procedures and protocol that have been designated for data collection (Cooper and
Schindler, 2003). There was a two day pilot test conducted on 10 students. The group
also helped in correcting and modifying the questionnaire after which it was ready for
use. The selected respondents were then briefed on the research and all responses remain
confidential. Consent was sort from them as the study is entirely on voluntary basis. The
questionnaires was then administered and collected for purposes of analysis.
3.6 Data Analysis Method
The data was collected using a combination of self and researcher-administered
questionnaires. The data was then analysed using SPSS. The first step in the analysis
involved cleaning of the collected questionnaires; ensuring that all questions are
answered, knowing the number collected and ensuring all the pages are intact. This was
be followed by coding the questionnaires into SPSS then data entry and cleaning, to
rectify any wrong entries. This is done to ensure accuracy of the data and its conversion
from raw to reduced and classified forms that are more appropriate for analysis (Cooper
and Schindler, 2003).
Desriptive statistics were done to get the mean, mode and median, and inferrential
statistics to reveal the range, standard deviation and variance. Further, the research
analysed the output’s correlation on demographics versus the objectives, and regression
analysis was used to test the hypothesis (Null hypothesis-Hₒ: there is no association
between product packaging and consumer choice of cosmetic brands). Results have been
presented with the use of figures and tables to facilitate interpretation.
3.7 Chapter Summary
This chapter has expounded on descriptive research design and how it was undertaken in
this study. The population was the undergraduate students of USIU-Africa, from whom
100 respondents were extracted through probability sampling, and provided with
questionnaires that collected data necessary for the study. This data was then subjected to
SPSS for purposes of analysis. The succeeding chapter looks into the results and findings
emanating from the methodology stated in this chapter.

20
CHAPTER FOUR
4.0 RESULTS AND FINDINGS
4.1 Introduction
The previous chapter dealt with the discussion of the research methodology that was
applied in this study. This chapter will display the outcome of the study based on the
parameters set out in the previous chapter in an aim to bring into statistical perspective
the results and findings of this study.
4.2 General Analysis of Demographic Status
The study prompted general criteria to bring into perspective the demographic structure of
the respondents involved in the study. As indicated in the previous chapter, 100 USIU-A
undergraduate students took part in this study and the demographic structure is as
follows:
Figure 4.1: Gender Distribution
As illustrated above, the gender distribution of was uneven with male respondents
constituting slightly over one third of the population at 39% and female respondents at
61%. This disparity was expected due to the population imbalance of USIU-A
undergraduate students as depicted in Table 1 (Chapter 3).

21
Figure 4.2: Age Distribution
The figure above is a visual illustration of the age distribution. Respondents were given
four age brackets in which to select their category. The first selection was the age bracket
below 18 years, in which none of the respondents selected. 83% of the sample was
between the ages of 18 and 28, 12% between 29 and 39, and 5% were above the age of
40.
Figure 4.3: Monthly Income/ Allowance in Ksh.
22
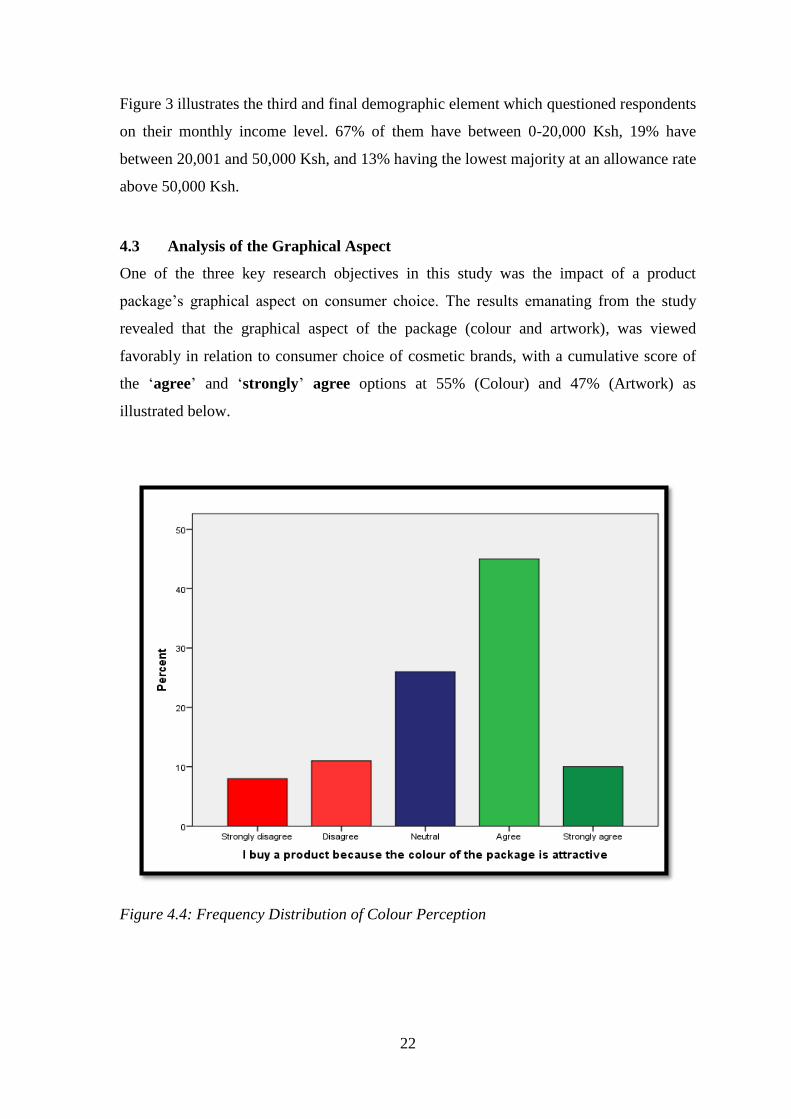
Figure 3 illustrates the third and final demographic element which questioned respondents
on their monthly income level. 67% of them have between 0-20,000 Ksh, 19% have
between 20,001 and 50,000 Ksh, and 13% having the lowest majority at an allowance rate
above 50,000 Ksh.
4.3 Analysis of the Graphical Aspect
One of the three key research objectives in this study was the impact of a product
package’s graphical aspect on consumer choice. The results emanating from the study
revealed that the graphical aspect of the package (colour and artwork), was viewed
favorably in relation to consumer choice of cosmetic brands, with a cumulative score of
the ‘agree’ and ‘strongly’ agree options at 55% (Colour) and 47% (Artwork) as
illustrated below.
Figure 4.4: Frequency Distribution of Colour Perception

23
Figure 4.5: Frequency Distribution of Artwork Perception
The aspect of graphics yielded fairly close statistical results when an analysis was carried
out. The mean value averaged at 3.4, the median value at 3.5 and the modal value at 4.
These three measures of central tendency seemed to depict close similarity. The measures
of dispersion (variance and standard deviation) averaged at 1.202 and 1.096 (respectively)
from the mean value. The skewness of the data was negative, averaging at -.414 but more
skewed in colour than in artwork. The table below further illustrates these results.
Table 4.1: Statistical Analysis of Graphics
Colour Artwork GRAPHICS
N Valid 100 100 100
Missing 0 0 0
Mean 3.38 3.42 3.40
Median 4.00 3.00 3.50
Mode 4 3 4
Std. Deviation 1.071 1.121 1.096
Variance 1.147 1.256 1.202
Skewness -.713 -.235 -.474
Std. Error of Skewness .241 .241 .241
Range 4 4 4
With respect to correlation, the analysis revealed an average positive correlation with a
statistically significant relationship between an individual’s product choice based on the

24
attractive nature of a package colour, and its artwork. The results showed a nearly average
positive correlation value (r = 0.446) with a P value of less than 0.01, an indication of
statistical significance. The results are illustrated in Table 3.
Table 4.2: Correlation Analysis (Colour vs. Artwork Perception)
I buy a product
because the colour
of the package is
attractive
I buy a product
because the
artwork on the
package is
attractive.
I buy a product because the
colour of the package is attractive
Pearson Correlation 1 .446**
Sig. (2-tailed) .000
N 100 100
I buy a product because the
artwork on the package is
attractive.
Pearson Correlation .446** 1
Sig. (2-tailed) .000
N 100 100
**. Correlation is significant at the 0.01 level (2-tailed).
In addition to subjecting the respondents to questions directly related to product
packaging, other aspects of consumer choice were included in the data collection tool. A
correlation analysis was undertaken to assess the relationship between the first research
objective (Graphical Aspect) against each of the five additional consumer choice
determinants and the results were as follows:
Table 4.3: Correlation Analysis (package graphics vs. product manufacture location)
I buy a product
because the colour of
the package is
attractive
I purchase cosmetic
products of locally
established companies.
I buy a product because the
colour of the package is
attractive
Pearson Correlation 1 .007
Sig. (2-tailed) .946
N 100 99
I purchase cosmetic
products of locally
established companies.
Pearson Correlation .007 1
Sig. (2-tailed) .946
N 99 99

25
Based on the first alternative consumer choice preference determinant in Table 4, r was a
very weak positive relationship close to zero indicating little to no correlation between the
two variables. The P value was also above 0.05 (P = 0.946), a clear indication that there
was no statistical significance between the two variables tested against each other in the
table above.
Table 4.4: Correlation Analysis (package graphics vs. product manufacture preference
location)
I buy a product
because the colour
of the package is
attractive
Cosmetic products
manufactured locally have a
higher quality than those
manufactured internationally.
I buy a product because the
colour of the package is
attractive
Pearson Correlation 1 -.008
Sig. (2-tailed) .941
N 100 99
Cosmetic products
manufactured locally have a
higher quality than those
manufactured
internationally.
Pearson Correlation -.008 1
Sig. (2-tailed) .941
N 99 99
In Table 4.4, the second consumer choice preference alternative was measured against the
research objective of product packaging and the results showed a very weak negative
relationship almost close to zero (P = -0.008) which indicates no correlation between the
two variables. The level of significance registered a value higher than the recommended r
= 0.05 (r = 0.941) indicating that there was no statistical significance between the two
variables.
Table 4.5: Correlation Analysis (package graphics vs. consumer price consideration)
I buy a product because
the colour of the package
is attractive
Price determines my
choice of cosmetic
products.
I buy a product because the
colour of the package is
attractive
Pearson Correlation 1 .209*
Sig. (2-tailed) .039
N 100 98
Price determines my choice
of cosmetic products.
Pearson Correlation .209* 1
Sig. (2-tailed) .039
N 98 98
*. Correlation is significant at the 0.05 level (2-tailed).

26
When the third aspect (price) was tested against the graphical aspect of product
packaging, the correlation coefficient depicted a weak positive relationship (r = 0.209)
between the two variables. This relationship was however statistically significant, with a
P value of less than 0.05 (P = 0.039).
Table 4.6: Correlation Analysis (package graphics vs. product proximity)
I buy a product because the
colour of the package is
attractive
I purchase cosmetic
products that are within
close proximity.
I buy a product because the
colour of the package is
attractive
Pearson Correlation 1 .043
Sig. (2-tailed) .679
N 100 96
I purchase cosmetic
products that are within
close proximity.
Pearson Correlation .043 1
Sig. (2-tailed) .679
N 96 96
Table 4.6, an analysis between the graphical aspect of packaging and product proximity
yielded a result with a correlation coefficient that was positive but very weak (r = 0.043).
Since the P value was greater than 0.05 (P = 0.679), then it can be concluded that the
relationship between the two is not statistically significant.
Table 4.7: Correlation Analysis (package graphics vs. brand familiarity)
I buy a product because the
colour of the package is
attractive
I purchase cosmetic
products with well-known
brands.
I buy a product because the
colour of the package is
attractive
Pearson Correlation 1 .085
Sig. (2-tailed) .405
N 100 99
I purchase cosmetic
products with well-known
brands.
Pearson Correlation .085 1
Sig. (2-tailed) .405
N 99 99
Table 4.7, an analysis between the graphical aspect of packaging and brand familiarity
yielded a result with a correlation coefficient that was positive but very weak (r = 0.085).
Since the P value was greater than 0.05 (P = 0.405), then it can be concluded that the
relationship between the two is not statistically significant.

27
4.4 Analysis of the Package Dimension
Another key research objective in this study was the role of a product package’s
dimensions on consumer choice. The results emanating from the study revealed that the
dimension of the package (shape and design), was viewed favorably in relation to
consumer choice of cosmetic brands, with a cumulative score of the ‘agree’ and
‘strongly agree’ options at 63.6% as illustrated in the figure below.
Figure 4.6: Frequency Distribution of the Package Dimension
The aspect of dimension yielded fairly close statistical results when an analysis was
carried out. The mean debuted at 3.72, the median at 4.0 and the modal value at 4. These
three measures of central tendency seemed to depict close similarity. The measures of
dispersion (variance and standard deviation) accumulated to values of .858 and .926
respectively, from the mean value. The skewness of the data was negative, averaging at -
.582. The table below further illustrates these results.

28
Table 4.8: Statistical Analysis of Dimension
N Valid 99
Missing 1
Mean 3.72
Median 4.00
Mode 4
Std. Deviation .926
Variance .858
Skewness -.582
Std. Error of Skewness .243
Range 4
With respect to correlation, the analysis revealed a weak, positive correlation with a
statistically significant relationship between an individual’s product choices based on the
attractive nature of a package dimension. The results showed a nearly average positive
correlation value (r = 0.362) with a P value of less than 0.01, indicating the existence of
statistical significance. The results are illustrated in Table 4.9 below.
Table 4.9: Correlation Analysis (Package Dimension)
I buy a product
because the
design/shape of the
package is attractive.
I will purchase a product
because the package
design/shape is attractive even
if I do not need the product.
I buy a product because
the design/shape of the
package is attractive.
Pearson
Correlation 1 .362**
Sig. (2-tailed) .000
N 99 99
I will purchase a product
because the package
design/shape is attractive
even if I do not need the
product.
Pearson
Correlation .362** 1
Sig. (2-tailed) .000
N 99 99
**. Correlation is significant at the 0.01 level (2-tailed).
Based on the first alternative consumer choice preference determinant in Table 4.10, r
was a very weak positive relationship, close to zero indicating little to no correlation
between the two variables. The P value was also above 0.05 (P = 0.612), a clear

29
indication that there was no statistical significance between the two variables tested
against each other in the table below.
Table 4.10: Correlation Analysis (package dimension vs. product manufacture location)
I buy a product because the
design/shape of the package is
attractive.
I purchase cosmetic
products of locally
established companies.
I buy a product because the
design/shape of the package
is attractive.
Pearson
Correlation 1 .052
Sig. (2-tailed) .612
N 99 99
I purchase cosmetic products
of locally established
companies.
Pearson
Correlation .052 1
Sig. (2-tailed) .612
N 99 99
Table 4.11: Correlation Analysis (package dimension vs. product manufacture preference
location)
I buy a product
because the
design/shape of the
package is attractive.
Cosmetic products
manufactured locally have a
higher quality than those
manufactured internationally.
I buy a product because the
design/shape of the package
is attractive.
Pearson Correlation 1 .112
Sig. (2-tailed) .269
N 99 99
Cosmetic products
manufactured locally have a
higher quality than those
manufactured
internationally.
Pearson Correlation .112 1
Sig. (2-tailed) .269
N
99 99
In Table 4.11, the second consumer choice preference alternative was measured against
the research objective of package dimension and the results showed a very weak positive
relationship, almost close to zero (P = 0.112) which indicates no correlation between the
two variables. The level of significance registered a value higher than the recommended r
= 0.05 (r = 0.269) indicating that there was no statistical significance between the two
variables.

30
Table 4.12: Correlation Analysis (package dimension vs. consumer price consideration)
I buy a product because
the design/shape of the
package is attractive.
Price determines my
choice of cosmetic
products.
I buy a product because the
design/shape of the package
is attractive.
Pearson Correlation 1 .235*
Sig. (2-tailed) .020
N 99 98
Price determines my choice
of cosmetic products.
Pearson Correlation .235* 1
Sig. (2-tailed) .020
N 98 98
*. Correlation is significant at the 0.05 level (2-tailed).
When the third aspect (price) was tested against the aspect of package dimension, the
correlation coefficient depicted a weak positive relationship (r = 0.235) between the two
variables. This relationship was however statistically significant, with a P value of less
than 0.05 (P = 0.020).
Table 4.13: Correlation Analysis (package dimension vs. product proximity)
I buy a product because
the design/shape of the
package is attractive.
I purchase cosmetic
products that are within
close proximity.
I buy a product because the
design/shape of the package
is attractive.
Pearson Correlation 1 .026
Sig. (2-tailed) .805
N 99 96
I purchase cosmetic
products that are within
close proximity.
Pearson Correlation .026 1
Sig. (2-tailed) .805
N 96 96
Table 4.13, an analysis between the aspect of package dimension and product proximity
yielded a result with a correlation coefficient that was positive but very weak(r = 0.026).
Since the P value was greater than 0.05 (P = 0.805), then it can be concluded that the
relationship between the two is not statistically significant.
Table 4.14: Correlation Analysis (package dimension vs. brand familiarity)

31
I buy a product because
the design/shape of the
package is attractive.
I purchase cosmetic
products with well-known
brands.
I buy a product because the
design/shape of the package
is attractive.
Pearson Correlation 1 .100
Sig. (2-tailed) .327
N 99 99
I purchase cosmetic
products with well-known
brands.
Pearson Correlation .100 1
Sig. (2-tailed) .327
N 99 99
Table 4.14, an analysis between the aspect of package dimension and brand familiarity
yielded a result with a correlation coefficient that was positive but very weak (r = 0.100).
Since the P value was greater than 0.05 (P = 0.327), then it can be concluded that the
relationship between the two is not statistically significant.
4.5 Analysis of the Product Information
The final specific research objective in this study was the influence of a product
package’s information on consumer choice. The results emanating from the study
revealed that the product information on a package was viewed favorably in relation to
consumer choice of cosmetic brands, with a cumulative score of the ‘agree’ and
‘strongly agree’ options at 89.8% as illustrated in the figure below.
Figure 4.7: Frequency Distribution of Product Information
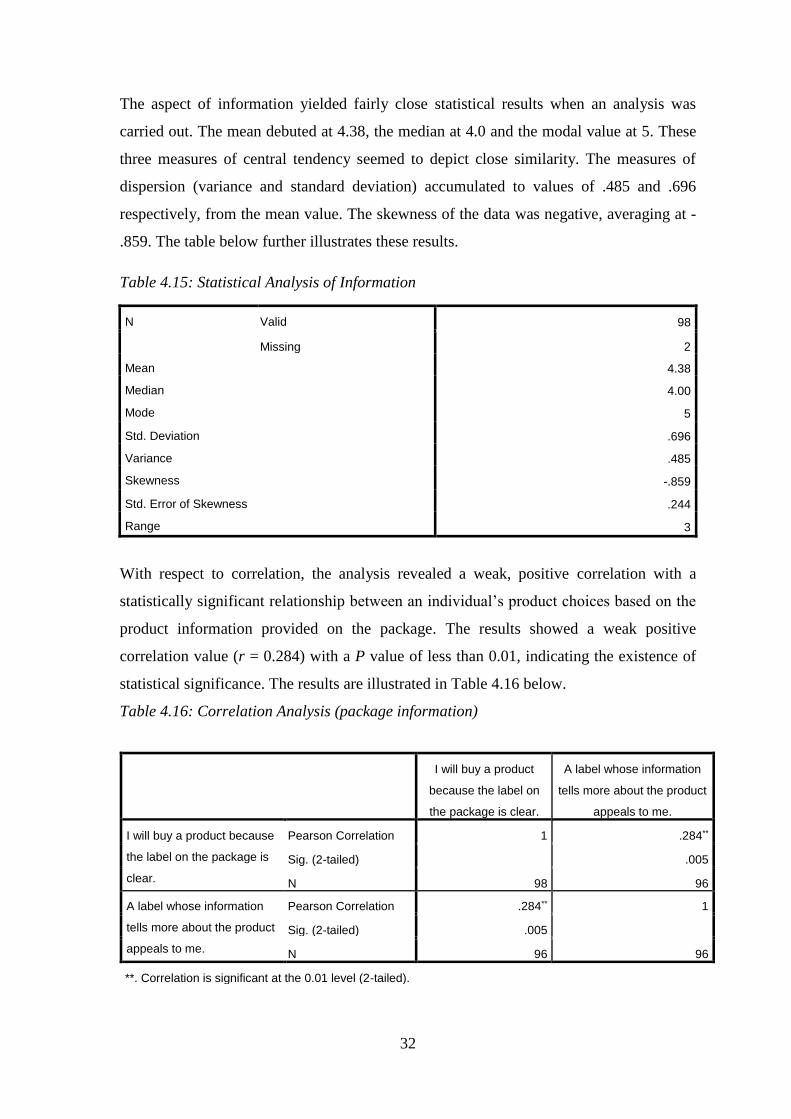
32
The aspect of information yielded fairly close statistical results when an analysis was
carried out. The mean debuted at 4.38, the median at 4.0 and the modal value at 5. These
three measures of central tendency seemed to depict close similarity. The measures of
dispersion (variance and standard deviation) accumulated to values of .485 and .696
respectively, from the mean value. The skewness of the data was negative, averaging at -
.859. The table below further illustrates these results.
Table 4.15: Statistical Analysis of Information
N Valid 98
Missing 2
Mean 4.38
Median 4.00
Mode 5
Std. Deviation .696
Variance .485
Skewness -.859
Std. Error of Skewness .244
Range 3
With respect to correlation, the analysis revealed a weak, positive correlation with a
statistically significant relationship between an individual’s product choices based on the
product information provided on the package. The results showed a weak positive
correlation value (r = 0.284) with a P value of less than 0.01, indicating the existence of
statistical significance. The results are illustrated in Table 4.16 below.
Table 4.16: Correlation Analysis (package information)
I will buy a product
because the label on
the package is clear.
A label whose information
tells more about the product
appeals to me.
I will buy a product because
the label on the package is
clear.
Pearson Correlation 1 .284**
Sig. (2-tailed) .005
N 98 96
A label whose information
tells more about the product
appeals to me.
Pearson Correlation .284** 1
Sig. (2-tailed) .005
N 96 96
**. Correlation is significant at the 0.01 level (2-tailed).

33
Table 4.17: Correlation Analysis (product information vs. product manufacture location)
Product information
on the package is
important to me.
I purchase cosmetic products of
locally established companies.
Product information on the
package is important to me.
Pearson Correlation 1 .042
Sig. (2-tailed) .681
N 98 98
I purchase cosmetic
products of locally
established companies.
Pearson Correlation .042 1
Sig. (2-tailed) .681
N 98 99
Based on the first alternative consumer choice preference determinant in Table 4.17, r
was a very weak positive relationship, close to zero indicating little to no correlation
between the two variables. The P value was also above 0.05 (P = 0.681), a clear
indication that there was no statistical significance between the two variables tested
against each other in the table above.
Table 4.18: Correlation Analysis (product information vs. product manufacture
preference location)
Product
information on
the package is
important to me.
Cosmetic products
manufactured locally have a
higher quality than those
manufactured internationally.
Product information on the
package is important to me.
Pearson Correlation 1 .122
Sig. (2-tailed) .231
N 98 98
Cosmetic products
manufactured locally have a
higher quality than those
manufactured
internationally.
Pearson Correlation .122 1
Sig. (2-tailed) .231
N
98 99
In Table 4.18, the second consumer choice preference alternative was measured against
the research objective of product information and the results showed a very weak positive
relationship, almost close to zero (P = 0.122) which indicates no correlation between the
two variables. The level of significance registered a value higher than the recommended r

34
= 0.05 (r = 0.231) indicating that there was no statistical significance between the two
variables.
Table 4.19: Correlation Analysis (product information vs. consumer price consideration)
Product information
on the package is
important to me.
Price determines my
choice of cosmetic
products.
Product information on the
package is important to me.
Pearson Correlation 1 .154
Sig. (2-tailed) .133
N 98 97
Price determines my choice
of cosmetic products.
Pearson Correlation .154 1
Sig. (2-tailed) .133
N 97 98
When the third aspect (price) was tested against the aspect of product information, the
correlation coefficient depicted a weak positive relationship (r = 0.154) between the two
variables. This relationship was not statistically significant, with a P value of more than
0.05 (P = 0.133).
Table 4.20: Correlation Analysis (product information vs. product proximity)
Product information
on the package is
important to me.
I purchase cosmetic
products that are within
close proximity.
Product information on the
package is important to me.
Pearson Correlation 1 .049
Sig. (2-tailed) .636
N 98 95
I purchase cosmetic
products that are within
close proximity.
Pearson Correlation .049 1
Sig. (2-tailed) .636
N 95 96
Table 4.20, an analysis between the aspect of product information and product proximity
yielded a result with a correlation coefficient that was positive but very weak(r = 0.049).
Since the P value was greater than 0.05 (P = 0.636), then it can be concluded that the
relationship between the two is not statistically significant.

35
Table 4.21: Correlation Analysis (product information vs. brand familiarity)
Product information on
the package is
important to me.
I purchase cosmetic
products with well-known
brands.
Product information on the
package is important to me.
Pearson Correlation 1 .262**
Sig. (2-tailed) .009
N 98 98
I purchase cosmetic
products with well-known
brands.
Pearson Correlation .262** 1
Sig. (2-tailed) .009
N 98 99
**. Correlation is significant at the 0.01 level (2-tailed).
Table 4.21, an analysis between the aspect of product information and brand familiarity
yielded a result with a weak positive correlation coefficient (r = 0.262). Since the P value
was less than 0.01 (P = 0.009), then it can be concluded that the relationship between the
two is statistically significant.
4.6 Cumulative Analysis
Since the three specific research objectives stem from the purpose of the study, that of
determining the role played by product packaging in consumer choice of cosmetic brands,
it was fundamental to assess the relationship among the specific objectives. The table
below shows the analysis drawn from the data collected.
Table 4.22: Correlation of Specific Research Objectives (graphics, dimension and
information)
Graphics Dimension Information
Graphics Pearson Correlation 1 .374** -.091
Sig. (2-tailed) .000 .375
N 100 99 98
Dimension Pearson Correlation .374** 1 -.049
Sig. (2-tailed) .000 .632
N 99 99 98
Information Pearson Correlation -.091 -.049 1
Sig. (2-tailed) .375 .632
N 98 98 98
**. Correlation is significant at the 0.01 level (2-tailed).

36
Based on the table above, the aspect of graphics and dimension reveal a weak positive
correlation coefficient of 0.374. The statistical significance between the two is valid since
the P value is less than the prescribed 0.01 limit. The aspect of information in relation to
graphics revealed a weak negative correlation of 0.091, and since its P value is greater
than 0.01, the relationship between information and graphics is not statistically
significant. Again, information and dimension yielded a weak negative correlation of
0.049, and with a P value greater than 0.01, there was no statistical significance between
those two objectives. It is thus safe to say that information has no relationship with either
graphics or dimension.
Finally, a regression analysis was conducted to determine the ability of product packaging
variables in influencing consumer choice of cosmetic brands. The result is as follows:
Table 4.23: Model Summary
Model R R Square Adjusted R Square Std. Error of the Estimate
1 .320a .102 .073 .917
Table 4.24: ANOVAa
Model Sum of Squares df Mean Square F Sig.
1 Regression 8.895 3 2.965 3.526 .018b
Residual 78.198 93 .841 Total 87.093 96
Table 4.25: Coefficients
Model
Unstandardized
Coefficients
Standardized
Coefficients
t Sig.
95.0% Confidence
Interval for B
B Std. Error Beta
Lower
Bound
Upper
Bound
1 (Constant) 1.465 .749 1.957 .053 -.021 2.952
I buy a product because the
colour/artwork of the
package is attractive
.136 .093 .155 1.461 .147 -.049 .322
I buy a product because the
design/shape of the package
is attractive.
.189 .109 .184 1.736 .086 -.027 .405
Product information on the
package is important to me. .241 .135 .177 1.792 .076 -.026 .508

37
Tables 4.23 through to 4.25 are results obtained from a regression analysis undertaken
with the dependent variable (consumer choice) being tested against the three specific
research objectives (graphics, dimension and information). The purpose here is to
ultimately focus the interpretation of the results to test the hypothesis of this study (Null
hypothesis-Hₒ: there is no association between product packaging and consumer choice of
cosmetic brands).
Table 4.23 indicates an R Square value of 0.102, an indication that the three research
objectives that govern this study can only account for 10.2% of the dependent variable
(consumer choice). Table 4.24 indicates a significance value of 0.018. Since this is less
than the recommended 0.05 limit, then the outcome of the study is statistically significant.
Table 4.25 lays out each independent variable (graphics, dimension and information) with
the following linear equations:
Graphics (y = .136x + 1.108)
Dimension (y = .189x + 1.108)
Information (y = .241x + 1.108)
Thus, for every unit of consumer choice (y) there is a contribution of .136, .189 and .241
of graphics, dimension and information, respectively in the positive direction. The level
of significance (P) for each independent variable against consumer choice is higher than
the generally accepted 0.05 limit, but since the researcher set the P value at 0.1 (where P
≤ 0.1), the cumulative P value of the independent variable indicates a value lower than
0.1, with the analysis setting it in Table 4.24 at 0.018. The analysis therefore concludes
that the researcher rejects the null hypothesis in favour of the alternative hypothesis
(There is an association between product packaging and consumer choice of cosmetic
brands).
With a better understanding of the outcome of the study, below are graphs indicating the
respondents’ sentiments on other factors they consider when purchasing cosmetic
products, other than packaging.

38
Figure 4.8: Frequency Distribution of Product Manufacture Location
Based on the table above, slightly over a third of respondents (37.4%) purchase cosmetic
products manufactured locally, while the distribution should a slight majority on neutral
ground and in disagreement with the option of cosmetic purchase of locally manufactured
goods.
Figure 4.9: Frequency Distribution of Product Manufacture Preference Location
When respondents were asked their view perceived product quality of cosmetic brands,
close to half of them (47.4%) indicated that they did not agree with the view that products

39
manufactured locally have a higher quality than those manufactured international.
Approximately 36% of them were indifferent to this view while 16% concurred with the
statement put across to them.
Figure 4.10: Frequency Distribution of Consumer Price Consideration
On the matter of price sensitivity, 65% of respondents felt it a necessary aspect when
determining their choice of cosmetic brands. 22% were indifferent while 13% disagreed
with the statement.
Figure 4.11: Frequency Distribution of Product Proximity
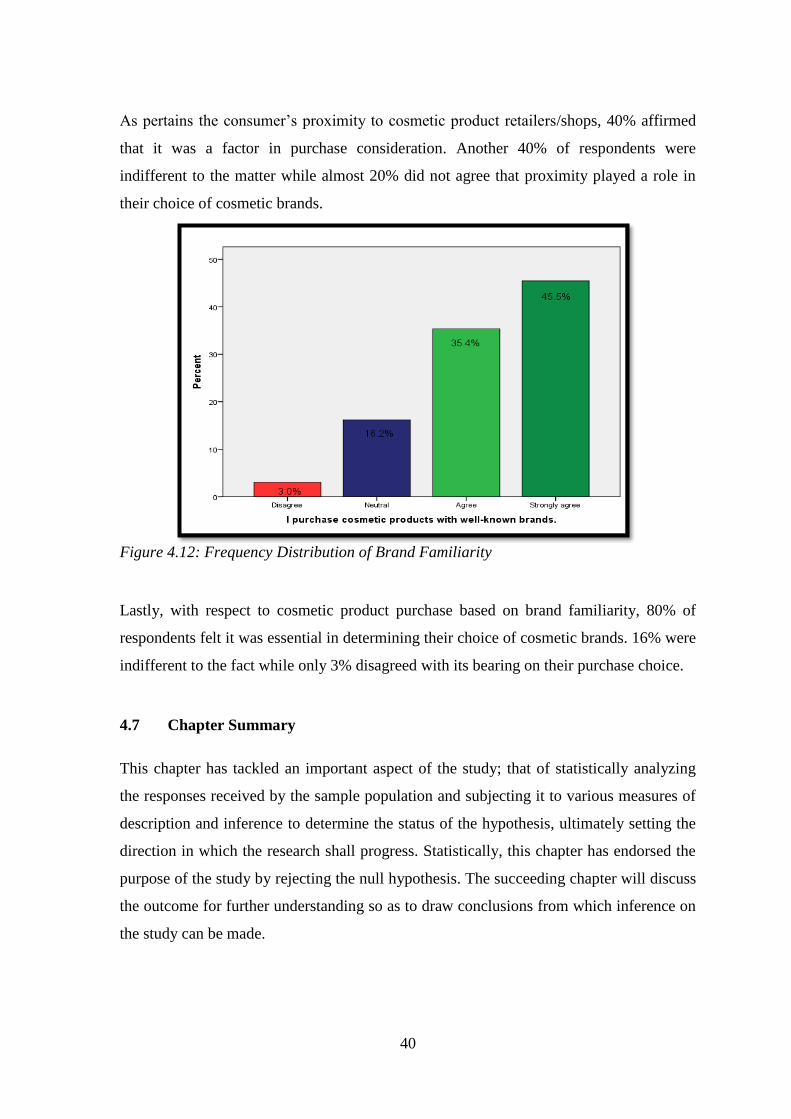
40
As pertains the consumer’s proximity to cosmetic product retailers/shops, 40% affirmed
that it was a factor in purchase consideration. Another 40% of respondents were
indifferent to the matter while almost 20% did not agree that proximity played a role in
their choice of cosmetic brands.
Figure 4.12: Frequency Distribution of Brand Familiarity
Lastly, with respect to cosmetic product purchase based on brand familiarity, 80% of
respondents felt it was essential in determining their choice of cosmetic brands. 16% were
indifferent to the fact while only 3% disagreed with its bearing on their purchase choice.
4.7 Chapter Summary
This chapter has tackled an important aspect of the study; that of statistically analyzing
the responses received by the sample population and subjecting it to various measures of
description and inference to determine the status of the hypothesis, ultimately setting the
direction in which the research shall progress. Statistically, this chapter has endorsed the
purpose of the study by rejecting the null hypothesis. The succeeding chapter will discuss
the outcome for further understanding so as to draw conclusions from which inference on
the study can be made.
41
CHAPTER FIVE
5.0 DISCUSSION, CONCLUSIONS AND RECOMMENDATIONS
5.1 Introduction
In the previous chapter, the results emanating from the study were analysed, presented
and interpreted in aiding the basis on which to structure the outcome of this study. In this
final chapter, deductions and inferences will be made from the analysis carried out in
preceding chapter and related to factors previously held true in other researches, as were
outlined in the second chapter of this study. In conclusion, recommendations will be
made for improvement of future research and study.
5.2 Summary
Numerous industries in the cosmetic realm spend vast amounts of resources in product
packaging due to the fact that it serves a marketing role in the increasingly competitive
consumer market. The researcher was keen in understanding the vital role of packaging
within the spheres of consumer related products, and several questions arose from this
inquisition; with the array cosmetic products lined up in numerous rows and from one
aisle to another in retail stores, what drives consumer choice in selecting one item out of
other seemingly similar options? If, supposedly, all other factors were held constant
(price, quality, quantity etc.), what then informs the consumer, standing in front of a wide
selection of cosmetic products, to decide which particular item to purchase? The
researcher’s assumption was that there might be a significant connection between a
package and consumer choice, in a manner to say that a well-designed product would
attract a consumer’s attention to the point of causing a purchase decision. That said, the
purpose of this study was to determine the influence that product packaging has when it
comes to consumer choice of cosmetic brands.
In order to bring the aspect of product packaging into perspective, it was essential to
create variables (components) that supported the concept of a ‘product package’.
Inquisition into literature from similar studies revealed aspects such as colour, artwork,
typography, design, technology, information and functionality among other elements.
Through an assessment of major package characteristics, three aspects surfaced

42
repeatedly; colour, artwork, design and information. With this aspects selected to
structure the concept of product packaging, three research objectives were designed to
govern the scope of the study in question. The first one combined colour and artwork,
referring to it as ‘graphics’, and as such attempting to determine the role that it played in
consumer choice of cosmetic brands. Secondly, the researcher coined ‘dimension’ as a
component of packaging; bringing together another two apparently similar characteristics,
that of design and shape. The third and final component was information. These three
components (variables) acted as the pillars that would represent the concept of
‘packaging’ in testing its relationship with consumer choice with respect to cosmetic
brands.
The methodology undertaken in this study had several aspects. The research employed a
descriptive research design so as to further understand the phenomenon experienced in
the consumer market, and which informed the inquiry posed by this study. The population
under focus was the undergraduate student population of USIU-A, who totalled
approximately 5,000 individuals as at February 2015. The researcher felt that this
population, being representative of different cultures and characteristics by having
students of varied nationalities, may shed more light in understanding consumer
behaviour patterns, especially since the cosmetic industry was not an exclusively local
affair, but served by both international and local corporations. The sample constituted 100
undergraduate students from the institution. Data was collected at a primary level through
the use of closed ended questionnaires and was analysed using the Software Program for
Social Scientists (SPSS). Descriptive and inferential statistics were utilized in the analysis
and ultimately in determining the status of the hypothesis set out in the study.
Some of the major findings that emanated from the analytical process was that majority of
the respondents indicated that they considered product packaging played a role in their
purchase decisions of cosmetic brands. This was further supported by statistics, which
indicated that a positive relationship existed between the packaging components of
graphics, dimension and information, and consumer purchase choice.

43
5.3 Discussion
5.3.1 The Influence of Graphics on Consumer Choice
With respect to package graphics as the first independent variable in this study, the
outcome of the previous chapter indicated a generally favourable view towards the impact
of graphics in consumer purchase decisions of cosmetic products. This outcome had been
earlier supported by several authors, with an acknowledgement to the crucial part played
by a package within the marketing function.
This study assessed package graphics on two fronts; colour and artwork. When it came to
the aspect of colour, several facts came up in course of this research. Colour has found a
way of fascinating various academicians and behavioural scientists; regardless of the
colour preferences of different people, it is irrefutable that colour ignites a level of
interest in people (Mehta & Zhu, 2009). This study concurred with this a majority of
respondents indicating the important role that colour played in their product selection
process. However, the notion of Ampuero and Vila (2006) that dark coloured packaging
signified elegance and higher product quality was not supported by the respondents in this
study. Though this fact may hold true for selected consumable items, it is clear that there
is higher preference for products with bright colours with warm hues when it comes to
cosmetic packaging. Since cosmetic products are essentially used to improve physical
appearance, it is important that they appear bright, attractive and vibrant. It is in their
ability to look fun and exciting that pulls at a consumers’ attention.
A correlation between a package colour and the product it contains or the brand it belongs
to has also proved vital. The package falls between two spectrums; to communicate the
brand which it represents and to introduce to the consumer the product they will interact
with upon purchase. As such, the ability of the package to merge these two concepts and
create a seamless continuity from one end to the other is important to the consumer
subconscious need for ‘flow without interruption’ (Rocchi & Stefani, 2006). A twist is
also introduced with the prospect of having a see through package that minimizes the use
of vibrant colour to call at a consumer’s attention. See-through packaging allows for one
to see exactly what they are buying and this has had an influence in how trustworthy a
manufacturer is considered when choosing to use a transparent package. It is a bold
statement; that of a firm confident in the product they put before the consumer. There is

44
simply no need to have many theatrics when the product can automatically sell itself
(Sevilla, 2012).
Another subset of the aspect of graphics that was put to test in this study is the use of
artwork in product packaging. It is evident that art carries with it an air of elegance and
refined sophistication. In ancient and medieval times, art was viewed as an affiliation of
the high and mighty. This perspective has trickled down over time where art has become
synonymous with ‘an expensive affair’ and where activities related to collecting valuable
paintings can easily be summed into enormous financial gains. The trick however lies in
tapping into this perceived value and creating a merger between that and product quality.
Consumers have proved this possible by feeling the affluence of product packages that
contain artwork; it feels like a piece of royalty, the ability to own something that might as
well be a collectible piece is satisfying (Dairy Managemnt Inc., 2001; Hagtvedt &
Patrick, 2008). There is simply no said association between various forms of art; abstract
or otherwise, art is art, art is beautiful. It will be seen and appreciated regardless of where
the product package designer chooses to position it. Artwork can therefore be
manipulated by marketers in the quest to communicate sophistication and exemplary
product value. Focus should however be placed in the ability of the artwork used on a
package to relate the package with its brand and with the product within. Respecting the
force played by this human need for coninuity cannot go unattended to.
Graphics are thus integral within the packaging world, stretching their reach of influence
through various spectrums to create an ultimately appealing product. In any case, it all
lies in image; you can only have one chance to make a powerful first encounter with your
consumer.
5.3.2 The Role of Dimensions on Consumer Choice
Package dimension can be discussed either with respect to package shape or design; the
two have been used synonymously and consequently perceived as one and the same. This
study made one aspect very clear when looking at human perception towards package
design and perceived value; the less it appeared symmetrical, the more likely one was to
be drawn towards it. Earlier in the second chapter, the Gestalt Principles of ‘the unified
whole’ was discussed and related to expectations of human perception and consequently
consumer behaviour. In the spirit of respecting the need for symmetrical order, the
principles indicate that human interest is drawn to what appears complete in terms of

45
being whole or complete. In this case, something abstract and different will be viewed as
odd and lacking structural continuity hence the mind will perceive it as an anomaly
(Spokane Falls Community College, 2013). However, this study has shown that the
opposite is actually true; though the mind will actually recognize an anomaly of one item
among seemingly ‘perfect’ alternatives, the anomaly will evoke interest and lead to
purchase of a cosmetic product with the said characteristic. With this mind, the marketer
is thus better off breaking various rules of symmetry and tending towards more whimsical
shapes and designs when setting out to present the market with a unique product. It is the
unique aspect about the package that nags at an individual’s interest; their need to want to
unravel and understand it, has proved to cause consumer choice. Though a symmetrical
product may create order in product shipment and storage, which is important as it moves
through the supply chain (Kotler & Armstrong, 2010), it is important for the consumer to
look at something with a touch of mischief in it that can go to the extent of carrying a
decorative feature. Hill (2011) and Underwood (2011) discuss the role of the package
after the purchase process and possibly after the product has been exhausted; the need to
want to keep the package due to other reasons elongates the marketing process and makes
the product more viable as a functional capacity and as a design feature in the home for a
long time to come.
When it comes to perceived product quantity, this study revealed that shape design of
product packaging had no relation with the amount of the product contained within. This
would mean that a measure of weight would serve as a better determinant of product
quantity rather than a mere assumption of what a particular design is likely to contain.
The design should however not look like there is a defect with it in the form of a missing
piece. The consumer will view at as a puzzle and as such the overall presentation of the
shape and design should appear complete regardless of its structural appearance, as was
discussed by Sevilla (2006).
5.3.3 The Influence of Product Information on Consumer Choice
Information, the final component of the product package matrix, was the most supported
aspect of this research from the responses received. It is not just a requirement, but is
tasked with explaining product features at a more personal and detail level. This detail
should however be limited to only that which is necessary and can fit on a label without
making it crowded. Just as a crowded room can tend to be overwhelming to many

46
individuals, marketers should ensure that when they design product package labels, the
structure and content of the words used depict much without the need to use too many
explanations.
Brand power is important in the consumer purchase process and thus consumer choice is
heavily governed by the presence of brand logos and trademarks. These features tend to
create trust between the consumer and the product because the item appears genuine.
Firms can incorporate the use tactics such as watermarks to create the illusion of
authenticity in their products. Ultimately, the quality of the label, and the information
held therein has a very important standing in assisting a consumer overwhelmed with
variety in a store. Once the information is included in a manner that is simple to identify
and easy to read and comprehend, then a consumer’s ability to select that item is highly
likely.
5.4 Conclusions
5.4.1 The influence of Graphics on Consumer Choice
In the assessment of product packaging with respect to graphics (colour and artwork) and
its impact on consumer choice of cosmetic brands, it can be concluded it is an important
aspect in a consumer’s decision process and holds a significant bearing in their choice of
cosmetic brands. Marketers and manufacturers should therefore regard package graphics
as an important element when designing a product’s package.
5.4.2 The Role of Dimensions on Consumer Choice
Dimensional aspects of a product’s package, with a focus on the item’s shape and design
features play a measurable role in consumption behavioral patterns. It is as such
fundamental that in the formulation of product package dimensions, marketers and
manufacturers should remember to factor in consumer preference of the said aspect so as
to drive increased product consumption.
5.4.3 The Influence of Product Information on Consumer Choice
Information, in the outcome of this study has depicted itself as the most important factor
in packaging. Consequently, key focus should be placed on the quality of information that
is included on a product’s package due to the role it plays in the consumer purchase
process.

47
With all the above discussions relating to product packaging variables, it can be
concluded that in support of the alternative hypothesis (there is a relationship between
product packaging and consumer choice of cosmetic brands) firms in the cosmetic
industry are justified in their efforts of designing attractive packaging in a bid to attract
consumer interest and evoke purchase decision. The packaging variables have shown
their importance both independently and cumulatively in communicating product quality
and features in a manner that is competitive. As such, marketers cannot rule out the
importance of the marketing role played by a package in enhancing product awareness
and creating an edge for the same among its various competitors and its role actualizing
visibility and attractiveness, while communicating quality and dependability in the mind
of the consumer(Ampuero & Vila, 2006; Rundh, 2009; Jafari, Sharif, Salehi, &
Zahmatkesh, 2013). Therefore, as effort is placed in other aspects of product packaging
such as technology, and further across the marketing function with respect to advertising
and promotion, it is clear that packaging has curved out its place as a feature, more
important than merely serving a shipment and protection role for the product in which it
contains (Kotler & Armstrong, 2010), worth research, development and improvement
with the changing dynamics of consumer behaviour and related market driven forces.

48
5.5 Recommendations
5.5.1 Recommendations for Improvement
5.5.1.1 The Influence of Graphics on Consumer Choice
The assessment of the graphical aspect could have been improved in this study through an
exclusive assessment of the impact of colour and artwork, from a psychological
perspective in order to create a clearer understanding of consumer perceptions as
governed by package related graphics.
5.5.1.2 The Role of Dimensions on Consumer Choice
With specific regard to the dimensional aspects of product packaging, further analysis
should be undertaken in the influence of package shape and design, as independent
aspects of the product contained therein. This would go a long way in informing
marketers and manufacturers on the dimensional trends of the consumer market based on
the outcome they anticipate to make.
5.5.1.3 The Influence of Product Information on Consumer Choice
The aspect of information has been previously discussed as the most important package
variable within the confines of this study. A further look into consumption perception of
information and its intrinsic interpretation may go a long way in informing marketers and
manufacturers on how to structure the informational element of a product’s package in a
manner that meets consumer needs within any given market.
5.5.2 Recommendations for Further Studies
While formulating the parameters of this study, other aspects of packaging may be worth
academic inquisition such as the role of package technology on consumer choice.
Alternatively, would be the option of looking into other consumables that highly
depended on packaging for their marketing functions, especially those restricted from
certain promotional efforts like alcoholic products and tobacco related brands. Aside from
packaging, other marketing areas that strongly came out in the course of this study was
the role of positioning strategies on consumer choice. Positioning in this respect would

49
entirely be on the physical front, in terms of how and where products are arranged in a
retail store and how that affects consumer behavioural patterns.

50
REFERENCES
Ahmed, R. R., Parmar, V., & Amin, M. A. (2014). Impact of Product Packaging on
Consumer's Buying Behaviour. European Journal of Scientific Research, 145-
157.
Ampuero, O., & Vila, N. (2006). Consumer Perceptions of Product Packaging. Journal of
Consumer Marketing, 100-112.
Cooper , D. R., & Schindler, P. S. (2003). Business Research Methods. New York: Irwin/
McGraw-Hill.
Dairy Managemnt Inc. (2001, March 14). Packaging Opportunities for Fluid Milk. Dairy
and Foods, pp. a-h.
Deliya, M. M., & Parmar, B. J. (2012). Role of Packaging on Consumer Purchase
Behaviour - Patan District. Global Journal of Management and Business
Research, 46-68.
Department of the Environment. (2010, May 10). Definition of Packaging. Retrieved May
24, 2015, from DOE: http://www.doeni.gov.uk/niea/waste-
home/regulation/regulations_packaging/definition_of_packaging.htm
Descombe, M. (1998). The Good Research Guide: For Samll Scale Social Research
Projects. Mumbai: Viva Books Private Limited.
Doyle, L. (2006, January 6). GCI Magazine. Retrieved February 3, 2015, from
www.GCImagazine.com: http://www.GCImagazine.com
Hagtvedt, H., & Patrick, V. M. (2008). Art Infusion: The Influence of Visual Art on the
Perception and Evaluation of Consumer Products. Journal of Marketing Research,
379-389.
Hess, J. S., Singh, J., Metcalf, L. E., & Danes, J. (2014). The impact of Consumer Product
Package Quality on Consumption Satisfaction, Brand Perceptions, Consumer
Investment and Behavior. Journal of Applied Packaging Research, 23-39.

51
Hill, A. (2011, April 9). Beauty Packaging Identity Trends. Retrieved February 3, 2015,
from GCI Magazine: http//www.GCImagazine.com
Holmes, G. R., & Paswan, A. (2012). Consumer Reaction to New Package Design.
Journal of Product and Brand Management, 109-116.
Jafari, S., Sharif, M., Salehi, M., & Zahmatkesh, R. (2013). Influence of Packaging on
Consumer Behavior. Arabian Journal of Business and Management Review, 65-
71.
Konnikova, M. (2014, December 17). How Headlines Change The Way We Think.
Retrieved May 26, 2015, from The New Yorker:
http://www.newyorker.com/science/maria-konnikova/headlines-change-way-think
Kotler, P., & Armstrong, G. (2010). Principles of Marketing. Pearson.
Levin , J., & Milgrom , P. (2004, October). Consumer Theory. Retrieved May 24, 2015,
from Stanford University: https://web.stanford.edu/.../Consumer%20Theory.pdf
McKinsey Global Institute;. (2010). Lions on the Move: The Progress and Potential of
African Economies. McKinsey and Company, 4-82.
Mehta, R. P., & Zhu, R. (2009). Blue or Red? Exploring the Effect of Colour on
Cognitive Task Performances. Advances in Consumer Research, 1045-1046.
Miller , C. (2009). Brand Psychology Impacts Part Purchasing Decisions. Aftermarket
Business, 10.
Rocchi, B., & Stefani, G. (2006). Consumer Perception of Wine Packaging: A Case
Study. International Journal of Wine Marketing, 33-44.
Rooney, J. (2011, May 10). Brand Power to The People:J&J Takes the Lead inForbes
Ranking. Retrieved March 28, 2015, from Forbes: http://www.forbes.com
Rundh, B. (2009). Packaging Design: creating cometitive advantage with product
packaging. British Food Journal, 111(9), 988-1002.
Sevilla, J. (2012). When It's What's Outside That Matters: Recent Findings on Product
and Packaging Design. Advances in Consumer Research, 308-312.

52
Shah, S., Ahmad, A., & Ahmad, N. (2013). Role of Packaging in Consumer Buying
Behaviour. International Review of Basic and Applied Sciences, 35-41.
Singh, A. S., & Masuku, M. B. (2014). Sampling Techniques and Determination of
Sample Size In Applied Statistics Research. International Journal of Economics,
Commerce and Management, 1-22.
Situma, E. (2013, April 11). Business Daily. Retrieved February 11, 2015, from
businessdailyafrica.com: http://www.businessdailyafrica.com/Cosmetics-brands-
battling-for-Kenyan-market/-/1248928/1745578/-/item/0/-/p9lkcoz/-/index.html
Solanki, A. H. (2014). Role of Packaging on Consumer Buying Behaviour with Special
Reference to Personal Care Products. Indian Journal of Applied Research, 342-
345.
Spokane Falls Community College. (2013, May 3). Spokane Falls Community College.
Retrieved May 25, 2015, from Spokane Falls Community College website:
http://graphicdesign.spokanefalls.edu/tutorials/process/gestaltprinciples/gestaltprin
c.htm
Underwood, R. L. (2011). The Communicative Power of Product Packaging: Creating
Brand identity via Lived and Mediated Experience. Journal of Marketing Theory
and Practice , 62-73.
Walliman, N. (2011). Your Research Project: Designing and Planning Your Work.
London: Sage Publishers.

53
APPENDIX
APPENDIX I: QUESTIONNAIRE: COSMETIC PACKAGING
(To the respondent: Kindly note that this questionnaire will be exclusively used for purposes of
this study and your information will remain confidential and undisclosed to any other source.)
INSTRUCTIONS: Answer the questions below by selecting the appropriate response.
SECTION A: Personal Information
1. Please select your gender. [MALE] [FEMALE]
2. Please select the age bracket you fall in.
[Below 18 years] [18-28 years] [29-39 years] [40 years and above]
3. Please select your monthly income/allowance level a month in Ksh.
[0-20,000] [20,001-50,000] [50,001 and above]
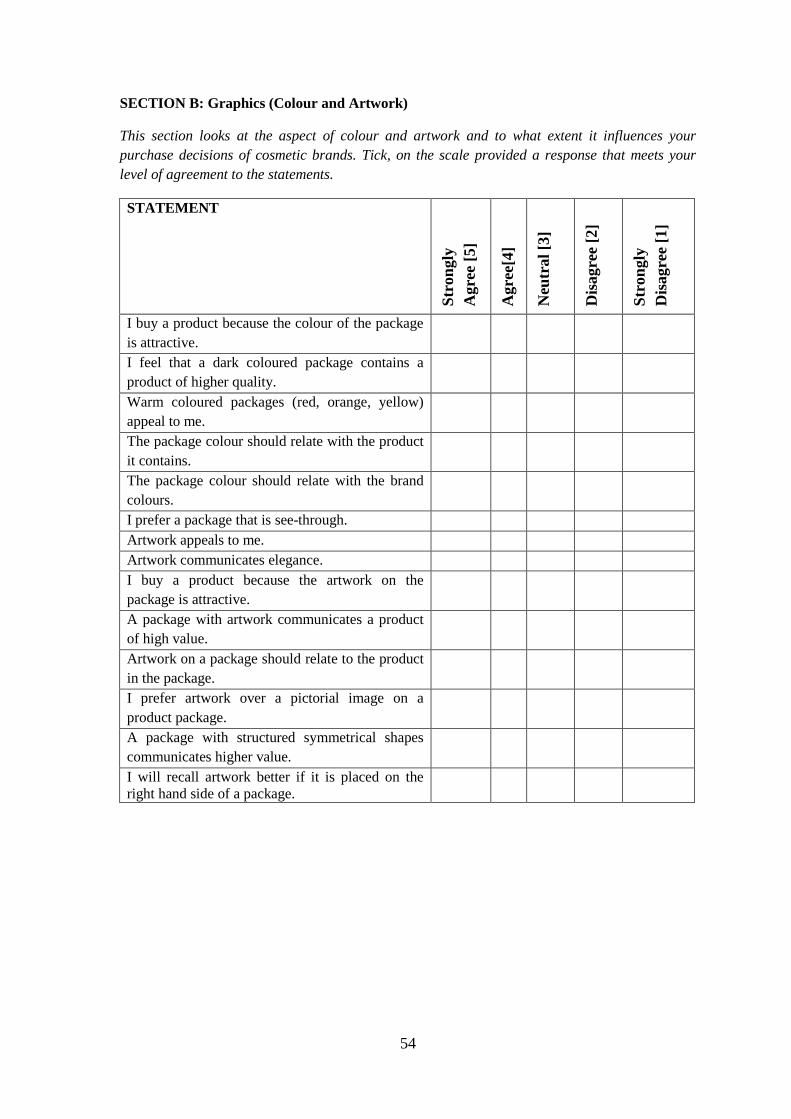
54
SECTION B: Graphics (Colour and Artwork)
This section looks at the aspect of colour and artwork and to what extent it influences your
purchase decisions of cosmetic brands. Tick, on the scale provided a response that meets your
level of agreement to the statements.
STATEMENT
Str
on
gly
Agre
e [5
]
Agre
e[4
]
Neu
tral
[3]
Dis
agre
e [2
]
Str
on
gly
Dis
agre
e [1
]
I buy a product because the colour of the package
is attractive.
I feel that a dark coloured package contains a
product of higher quality.
Warm coloured packages (red, orange, yellow)
appeal to me.
The package colour should relate with the product
it contains.
The package colour should relate with the brand
colours.
I prefer a package that is see-through.
Artwork appeals to me.
Artwork communicates elegance.
I buy a product because the artwork on the
package is attractive.
A package with artwork communicates a product
of high value.
Artwork on a package should relate to the product
in the package.
I prefer artwork over a pictorial image on a
product package.
A package with structured symmetrical shapes
communicates higher value.
I will recall artwork better if it is placed on the
right hand side of a package.

55
SECTION C: Dimensions (shape and design)
This section looks at the aspect of shape and design and to what extent it influences your
purchase decisions of cosmetic brands. Tick, on the scale provided a response that meets your
level of agreement to the statements.
STATEMENT
Str
on
gly
Agre
e [5
]
Agre
e [4
]
Neu
tral
[3]
Dis
agre
e [2
]
Str
on
gly
Dis
agre
e [1
]
I buy a product because the design/shape of
the package is attractive.
A package design/shape that is abstract
appeals to me.
A package design/shape that is decorative
appeals to me.
The package design/shape is an indicator of
the value of the product brand.
An extravagant design/shape of a product’s
package communicates superior quality.
A package with a shape/design that appears
large has a higher quantity of the product
inside it.
The more interesting the design/shape of the
package is, the more likely I am to purchase
it.
I prefer a product whose design/shape appears
complete/whole.
I consider if the design/shape of the package
is functional before I purchase it.
I will purchase a product because the package
design/shape is attractive even if I do not need
the product.

56
SECTION D: Information (labels)
This section looks at the aspect of information/labelling and to what extent it influences your
purchase decisions of cosmetic brands. Tick, on the scale provided a response that meets your
level of agreement to the statements.
STATEMENT
Str
on
gly
Ag
ree
[5]
Ag
ree
[4]
Neu
tral
[3]
Dis
ag
ree
[2]
Str
on
gly
Dis
ag
ree
[1]
I will buy a product because the label on the package
is clear.
Product information on the package is important to
me.
The information on a package is more believable than
when I see/read it on an advertisement.
Brand logos and trademarks play a role in my
purchase decision.
An attractive label on the product package appeals to
me.
A label can assist me to determine the quality of the
product in the package.
I will recall product information better if the label is
on the left hand side.
A label crowded with too much information does not
appeal to me.
A label whose information tells more about the
product appeals to me.
A label with a watermark makes a product appear
more genuine.
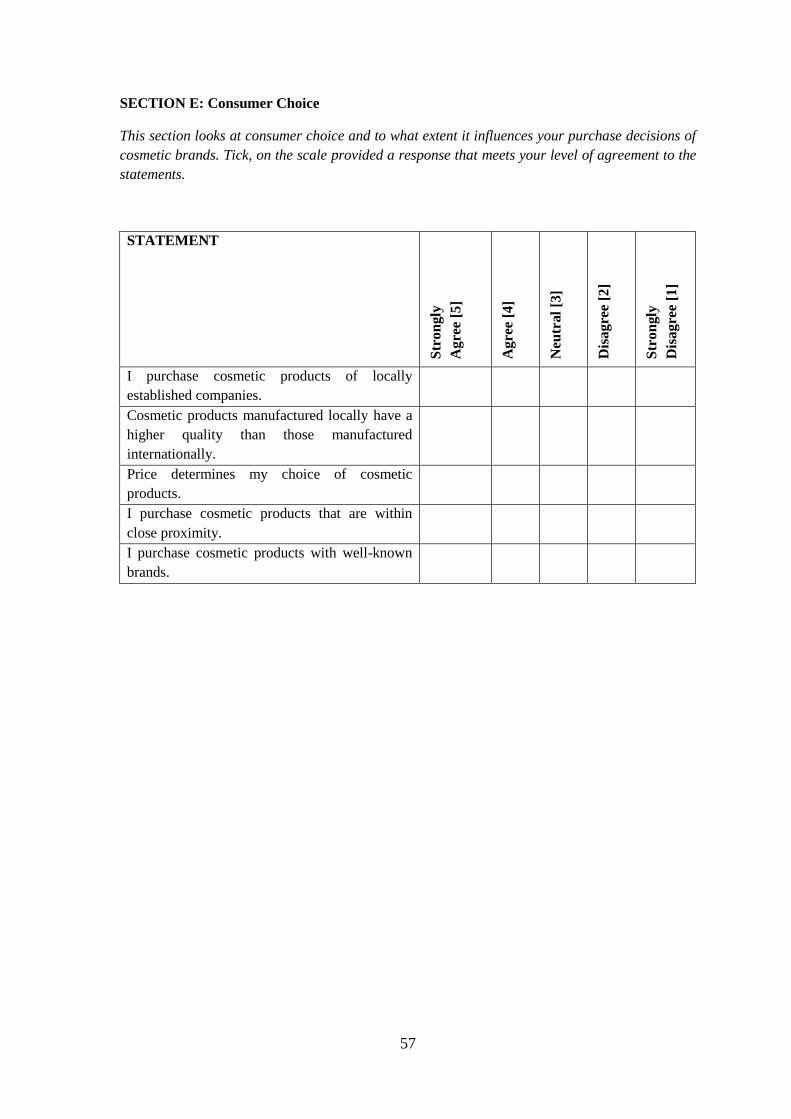
57
SECTION E: Consumer Choice
This section looks at consumer choice and to what extent it influences your purchase decisions of
cosmetic brands. Tick, on the scale provided a response that meets your level of agreement to the
statements.
STATEMENT
Str
on
gly
Ag
ree
[5]
Ag
ree
[4]
Neu
tral
[3]
Dis
ag
ree
[2]
Str
on
gly
Dis
ag
ree
[1]
I purchase cosmetic products of locally
established companies.
Cosmetic products manufactured locally have a
higher quality than those manufactured
internationally.
Price determines my choice of cosmetic
products.
I purchase cosmetic products that are within
close proximity.
I purchase cosmetic products with well-known
brands.