Embed Size (px)
Citation preview

Economics Working Paper Series
2014/008
The Effect of Personality Traits on Subject Choice
and Performance in High School: Evidence from an English Cohort
Silvia Mendolia and Ian Walker
The Department of Economics Lancaster University Management School
Lancaster LA1 4YX UK
© Authors All rights reserved. Short sections of text, not to exceed
two paragraphs, may be quoted without explicit permission, provided that full acknowledgement is given.
LUMS home page: http://www.lums.lancs.ac.uk/

The Effect of Personality Traits on Subject Choice and Performance in High School: Evidence from an English
Cohort
Silvia Mendolia†, and Ian Walker‡
†University of Wollongong, School of Accounting, Economics and Finance [email protected] ‡Lancaster University, Department of Economics [email protected]
Keywords: Personality, Education, Locus of Control, Self-Esteem
JEL codes: I10, I21 Abstract:
This paper investigates the relationship between personality traits in adolescence and performance in high school using a large and recent cohort study. In particular, we investigate the impact of locus of control, self-esteem, and work ethics at age 15, on test scores at age 16, and on subject choices and subsequent performance at age 17-18. In particular, individuals with external locus of control or with low levels of self-esteem seem less likely to have good performance in test scores at age 16 and to pursue further studies at 17-18, especially in mathematics or science. We use matching methods to control for a rich set of adolescent and family characteristics and we find that personality traits do affect study choices and performance in test scores - particularly in mathematics and science. We explore the robustness of our results using the methodology proposed by Altonji et al. (2005) that consists in making hypotheses about the correlation between the unobservables that determine test scores and subjects’ choices and the unobservables that influence personality.
Corresponding author: Dr. Silvia Mendolia, School of Accounting, Economics, and Finance, Faculty of Business, Building 40, Room 215, University of Wollongong, NSW 2522, Australia
0

1. Introduction
The objective of this paper is to analyse the role of non-cognitive traits on
performance in High School. In particular, we study the effect of locus of control, self-esteem
and work ethics recorded when the child is 15-16 on: subsequent test scores in English and
Mathematics at age 16; on the likelihood of choosing different subjects beyond 16; and
subsequent performance at age 18 in those subjects.
We contribute to the existing literature in several ways. First, we provide evidence
from a recent dataset based on a large cohort of English children born in 1990 and followed
for seven years, starting in 2004. Our analysis is focused on personality traits in adolescence.
A variety of studies have shown that the Big Five personality traits are relatively malleable, at
least over the early life cycle and then tend to be stable during adult life (Cobb-Clark and
Schurer, 2012 and 2013). There is some evidence that policy interventions can promote
useful traits and suppress harmful ones early in life and, while cognitive skills (such as IQ,
for example) are believed to be relatively stable by the age of 8, other aspects of personality
might be easier to change at a later age (see Carneiro and Heckman, 2003 for a discussion).
Existing studies mostly rely on relatively dated data (for example NLSY1979 for Heckman et
al., 2006 and Cebi, 2007; NELS1988 for Coleman and Deleire, 2003; UK NCDS1958 for
Carneiro et al., 2007), or do not have a specific focus on adolescents (Chamorro et al., 2003;
Delaney et al., 2013). Secondly, we have a great deal of information on test scores by subject
at different ages, including students’ choices of subjects which are very important for entry
into higher education. We use this information to investigate the role of different personality
traits on choice of study and performance. The existing literature is mostly focused on the
broad effect of personality on education, using indicators such as years of schooling, or
college graduation (Heckman et al. 2006; Coleman and Deleire, 2003; Cebi, 2007) and
focusing on the role of one specific personality trait, such as locus of control or
1

conscientiousness (Baron and Cobb-Clark, 2010). Thirdly we use propensity score matching
(PSM) to investigate the relationship between personality and High School performance as
well as OLS estimation, and we examine the robustness of our results using the methodology
proposed by Altonji et al. (2005) (the AET method). This method does not rely on any
identifying exclusion restrictions but instead, uses observed differences between those with
and without a particular personality trait to provide information regarding the likely
magnitude and direction of selection along unobserved characteristics. OLS is widely
regarded as providing an estimate of an upper bound on the causal effect. PSM, by focussing
on treatments and controls that are observably comparable, is thought to provide closer
estimates to the causal effect than OLS because it seems plausible that observations for which
there is common support will also be more similar in their unobservable determinant of the
outcome. AET may be regarded as a method that could tighten the PSM bound by exploring
how the estimated causal effects varies as the correlation between unobservables and the
outcome relative to the correlation between observables and the outcome. The AET estimate
will be identical to OLS if there is no correlation between the treatment and the
unobservables. An interesting case is the AET estimate provided when it is assumed that the
correlation between the treatment and the unobservable is the same as that between the
treatment and the observables. This special case corresponds to what we might expect to
estimate if the available observable variables were a random selection of all relevant
variables. A well designed survey that is closely matched to the needs of the research
question would presumably do better than this. Thus, this special case might be regarded a
worst case and so provides a lower bound. Intermediate cases correspond to the informal
methodology of estimating models with sequentially more explanatory variables to establish
the stability of the estimated causal effect.
2

Fourthly, we analyse the different impact of personality traits on children across
various markers of deprivation. In particular, we look at disadvantaged families, where
disadvantage is defined in a variety of ways, and we analyse the effect of different non-
cognitive skills for them, compared to their advantaged peers. We examine whether
personality traits can play a different role for children who are less likely to receive support in
their education from their families. The results broadly support the idea that the effect of
personality traits is particularly strong for the cognitive outcomes for children who come
from disadvantaged socio-economic backgrounds while the effect on advantaged children is
limited. These results would support the use of policies that improve academic achievement
for students from disadvantaged socio-economic background through encouraging positive
personality traits.
Finally, we focus on understanding the role of personality traits on performance in
different subjects at age 16 and on subsequent subject choices and performance at age 18. In
particular, we try to understand whether some specific traits are more beneficial (or
detrimental) for performance in some particulars subjects. In particular, some research
suggests that maths skills play an important role in determining earnings, even controlling for
educational attainment in general (see Joensen and Skyt Nielsen, 2009, for example). Here
we distinguish between English and Mathematics at age 16 and between English,
Mathematics, and Science at age 18. While the determinants of performance in a particular
subject (rather than the overall school performance) are very hard to disentangle, it is possible
that personality traits play a role in enhancing performance in one area, rather than another.
The issue seems to be particularly relevant for the British population: the UK ranking of 15-
years old pupils in Mathematics and Science in the OECD’s PISA tests has been falling from
2000 to 2009 and was just below the OECD average in Mathematics and only slightly above
in Science. A key contributing factor to UK’s STEM (Science, Technology, Engineering and
3

Mathematics) deficit is the very low General Certificate of Secondary Education (GCSE)
performance at 16 in Science and Mathematics subjects. High level passes in these subjects at
this level is a pre-requisite for further study in these same subjects. Not surprisingly, the UK
has one of the lowest shares of 15-year olds intending a STEM career among the OECD
countries and still lags behind most OECD countries in women’s aspirations to study a STEM
subject and engage in a STEM career (see OECD, 2012).
The rest of this paper is organized as follows. Section 2 provides a brief overview of
the existing literature; Section 3 presents the data and explains the personality indicators and
outcomes that it contains; Section 4 and 5 discuss the estimation methods and the results; and
Section 6 concludes with a discussion of the policy implications of the work. The headline
finding of the research is that we broadly support the idea that non-cognitive skills are
important in determining performance in high school, particularly in Mathematics and
Science. Individuals with external locus of control, low self-esteem, and low levels of work
ethics1 are all less likely to achieve good results at the end of High School and less likely to
specialize in mathematical or scientific subjects for their final exams before applying to
university.
2. Overview of the existing literature
The evidence on the effect of personality on educational outcomes has suggested a
variety of transmission mechanisms, such as study behaviours, effort, and attention skills.
Almlund et al. (2011) provides an excellent review of the studies conducted in this area.
Research in personality psychology has produced the widely shared taxonomy of
traits, known as the Big Five. The Big Five are five factors (Openness to Experience,
Conscientiousness, Extraversion, Agreeableness, and Neuroticism or Emotional Stability)
1 These concepts are explained and defined in Section 3.
4
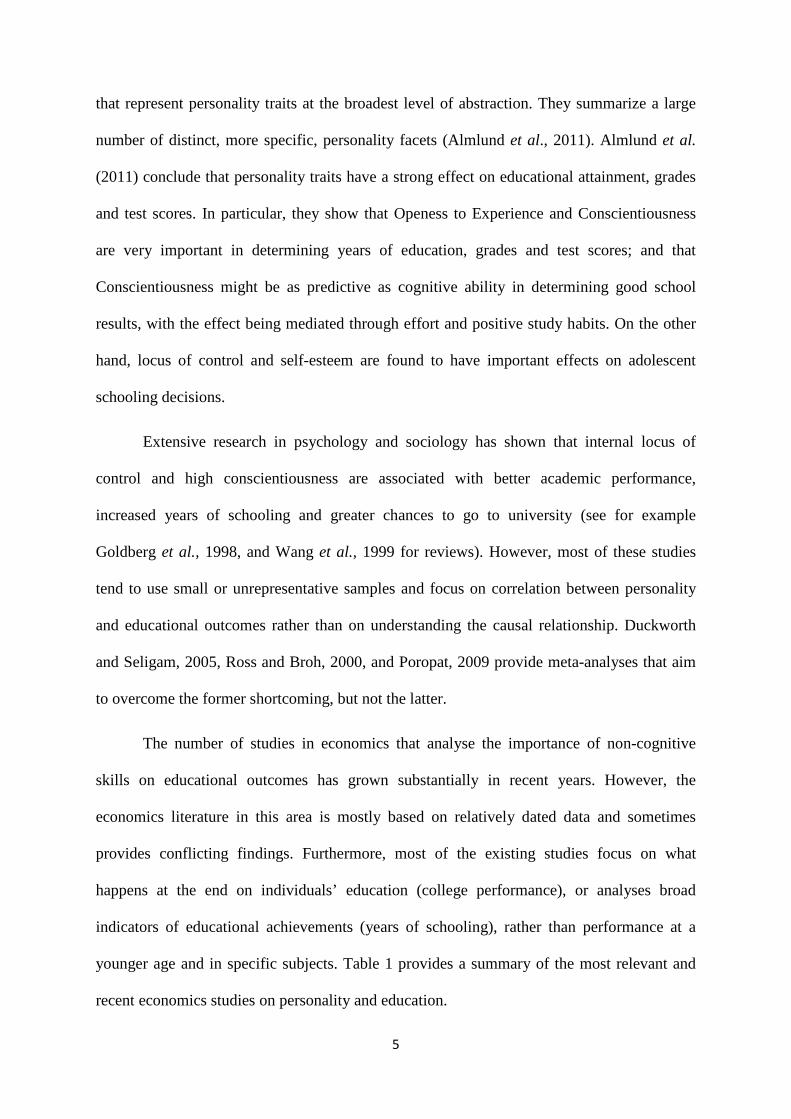
that represent personality traits at the broadest level of abstraction. They summarize a large
number of distinct, more specific, personality facets (Almlund et al., 2011). Almlund et al.
(2011) conclude that personality traits have a strong effect on educational attainment, grades
and test scores. In particular, they show that Openess to Experience and Conscientiousness
are very important in determining years of education, grades and test scores; and that
Conscientiousness might be as predictive as cognitive ability in determining good school
results, with the effect being mediated through effort and positive study habits. On the other
hand, locus of control and self-esteem are found to have important effects on adolescent
schooling decisions.
Extensive research in psychology and sociology has shown that internal locus of
control and high conscientiousness are associated with better academic performance,
increased years of schooling and greater chances to go to university (see for example
Goldberg et al., 1998, and Wang et al., 1999 for reviews). However, most of these studies
tend to use small or unrepresentative samples and focus on correlation between personality
and educational outcomes rather than on understanding the causal relationship. Duckworth
and Seligam, 2005, Ross and Broh, 2000, and Poropat, 2009 provide meta-analyses that aim
to overcome the former shortcoming, but not the latter.
The number of studies in economics that analyse the importance of non-cognitive
skills on educational outcomes has grown substantially in recent years. However, the
economics literature in this area is mostly based on relatively dated data and sometimes
provides conflicting findings. Furthermore, most of the existing studies focus on what
happens at the end on individuals’ education (college performance), or analyses broad
indicators of educational achievements (years of schooling), rather than performance at a
younger age and in specific subjects. Table 1 provides a summary of the most relevant and
recent economics studies on personality and education.
5

Table 1 here
One of the most notable examples of the relevance of non-cognitive skills is provided
by Heckman and Rubinstein (2001) who analyse the performance of Graduate Equivalence
Diplomas (GED) recipients and conclude that their lower achievements in the labour market
and the higher prevalence of criminal or risky behaviours can be attributed to the lack of non-
cognitive skills such as discipline, patience or motivation. Other work by Heckman and
collaborators has emphasized the importance of investing in promoting positive non-
cognitive skills from a very early age (see for example studies on the Perry Preschool
program, such as Heckman and Masterov, 2007 and Heckman et al., 2010). Heckman, et al.
(2006) use data from the US NLSY1979 and show that locus of control and self-esteem affect
years of schooling and college performance.
Coleman and Deleire (2003) use NELS1988 to incorporate locus of control into a
human capital investment model and show that teenagers with internal locus of control are
more likely to make educational investments, such as complete high school and attend a four-
year college. On the other hand, Cebi (2007) replicates the Coleman and Deleire (2003) study
using NLSY and suggest that locus of control is not a significant determinant of educational
outcomes, even if it is rewarded in the labour market.
Lundberg (2013) analyses the impact of cognitive ability and personality traits on
college graduation in a recent cohort of young Americans, and how the returns to these traits
vary by family background. Her work finds relevant differences across family background
groups, particularly for men. Conscientiousness does not seem to have an effect on the
education of disadvantaged men, while openness to experience has a relevant effect on
college graduation only for less-advantaged men and women.
6

In the European context, several studies have suggested positive returns to non-
cognitive traits, and point to the role of social skills (Carneiro et al., 2007, Silles, 2010,
Duckworth and Seligman, 2005, and Duckworth and Schoon, 2010) or the impact of positive
study behaviours (Delaney et al., 2013). Duncan et al. (2007) focuses on school readiness,
comparing data from UK, US and Canada and show that attention skills are good predictors
of educational achievements while other measures of socio-emotional behaviours seem less
important. Borghans et al. (2008) show that, in an experimental setting, people with internal
locus of control respond less to financial incentives when allocating effort to cognitive tasks,
probably because they are more highly motivated. Finally, Baron and Cobb-Clark (2010)
analyse the link between locus of control and high school graduation and university
attendance using a recent cohort of Australian youths. Their work shows that people with
internal locus of control are more likely to invest in their education and they do not find any
significant relationship between family welfare history and young person’s locus of control.
Our own analysis is particularly important because of the recent attention in the
literature to quantify returns to literacy and numeracy skills, and returns to human capital
investments in the STEM subjects. For example, Crawford and Cribb (2013) use the 1970
BCS to study the relationship between reading and mathematics skills measured at age 10 and
weekly earnings and hourly wages at ages 30, 34 and 38. They control for a rich set of
demographic and family background characteristics and they find that a one standard
deviation increase in age 10 mathematics (reading) scores is associated with 10% (5%) higher
earnings during one’s 30s. Dolton and Vignoles (2002) also show a very large effect of
having Mathematics A-Level (typically at age 18) on subsequent earnings, even after
controlling for higher education.
In the US, a few studies have taken advantage of curriculum reforms. For example,
Cortes et al (2013) find that an extra high school Mathematics course had large effects on test
7
scores, high school graduation and participation in higher education. Finally, one of the most
relevant studies in this area is Joensen and Nielsen (2009) who estimate the causal effect of
studying advanced high school mathematics by exploiting an educational reform that changed
the possible combinations of subjects with mathematics in Denmark. They show that taking
an advanced mathematics course in combination with an advanced chemistry course
increases earnings by 20% relative to chemistry without mathematics.
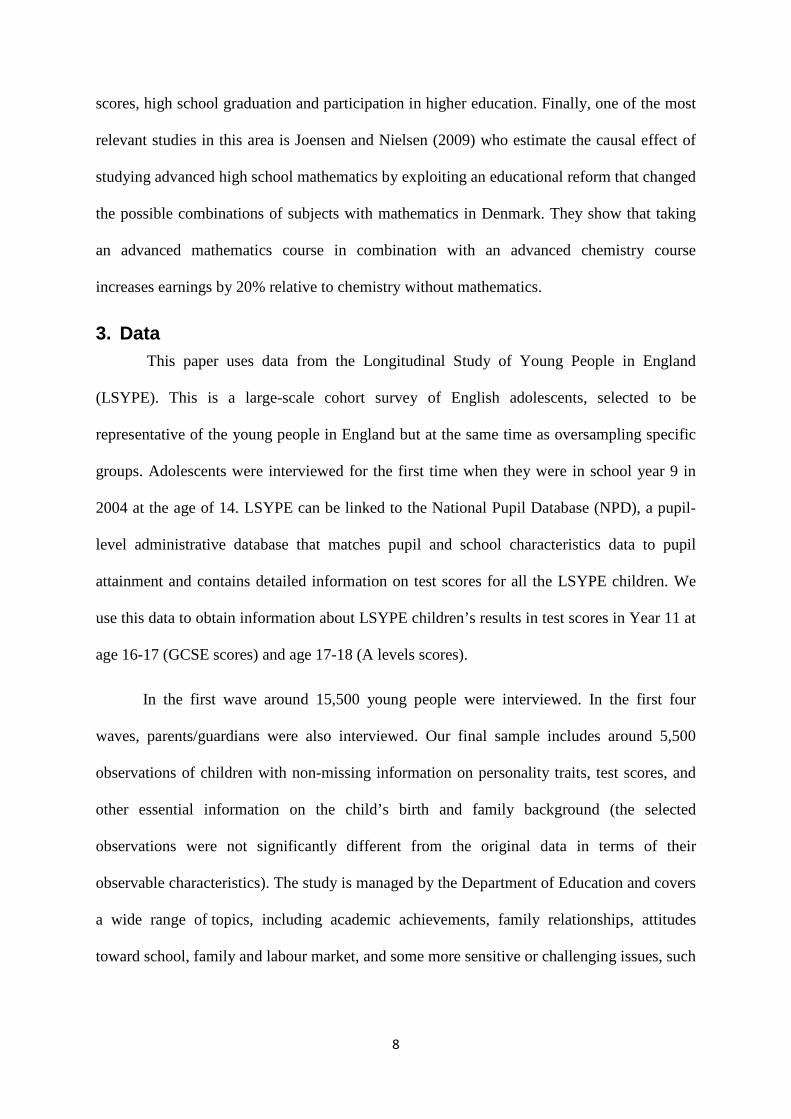
3. Data This paper uses data from the Longitudinal Study of Young People in England
(LSYPE). This is a large-scale cohort survey of English adolescents, selected to be
representative of the young people in England but at the same time as oversampling specific
groups. Adolescents were interviewed for the first time when they were in school year 9 in
2004 at the age of 14. LSYPE can be linked to the National Pupil Database (NPD), a pupil-
level administrative database that matches pupil and school characteristics data to pupil
attainment and contains detailed information on test scores for all the LSYPE children. We
use this data to obtain information about LSYPE children’s results in test scores in Year 11 at
age 16-17 (GCSE scores) and age 17-18 (A levels scores).
In the first wave around 15,500 young people were interviewed. In the first four
waves, parents/guardians were also interviewed. Our final sample includes around 5,500
observations of children with non-missing information on personality traits, test scores, and
other essential information on the child’s birth and family background (the selected
observations were not significantly different from the original data in terms of their
observable characteristics). The study is managed by the Department of Education and covers
a wide range of topics, including academic achievements, family relationships, attitudes
toward school, family and labour market, and some more sensitive or challenging issues, such
8

as risky health behaviours (smoking, alcohol drinking, drug taking), personal relationships,
etc.
3.1 Outcomes
We are interested in testing the effect of personality traits on a variety of cognitive
outcomes (test scores) at various ages and in different subjects, and on the chances that a
child will take further studies after compulsory education. Table 2 lists the outcomes we use
in our analysis and the age of the child for each outcome. We focus on the following
outcomes:
• GCSE at age 16: At the end of Key Stage 4 (from 13 to 16 years old), pupils generally
take the national public GCSEs in most subjects studied – often in as many as 10
subjects. GCSE grades range from A* to G. Our dependent variables include: the
number of subjects with “pass” grades from A* to C in GCSE exams; a binary
variable indicating having 5 GCSE passes including Mathematics and English which
is usually required for students following an academic track for progression beyond
age 16; and two binary variables equal to 1 if the child attained A* to C in English
and Mathematics.
• Decision to take General Certificate of Education Advanced (A levels): A level
subjects are studied over a two-year period. A-levels are administered by an official
assessment body. Most students study three or four subjects simultaneously during
Year 12 and Year 13 (ages 17–18), either in their secondary education school or in
post-16 colleges. A-levels are taken at age 18 and are the main admission criterion for
university admission. Elite institutions or high demand courses usually require high
9

grades, while admission to less prestigious institutions and less popular subjects will
may be possible with lower grades.2
• A level subjects studied: students usually select three to four subjects for their A
levels, depending on their academic preferences and intentions toward further
education. Some universities and/or some degrees will have specific requirements in
terms of A-level subject studied and grades. The most commonly demanded subjects
in university entry requirements, known as ‘facilitating’ subjects, are: Biology,
Chemistry, Physics 3 , English, Geography, History, Mathematics, Modern and
Classical Languages.
• Grades in A levels by subject: The passing grades for A-levels are A*, A, B, C, D and
E. Grades are often translated into points for aggregation purposes as follows: 120
points for A, 100 for B, 80 for C, 60 for D, and 40 for E.
Table 2 here
3.2 Personality traits
Personality is complex and factor analysis has been utilised extensively in personality
psychology to identify a number of common factors derived from a variety of questions
(Cobb-Clark et al., 2014; Piatek and Pinger 2010; and Almlund et al., 2011). While our data
does not include information about the “Big Five” personality traits that have been the focus
of some recent research (see Almlund et al., 2011 for a review of possible alternatives), it
does include a series of questions on locus of control, self-esteem and attitudes to work asked
at age 15.
2 We do not consider the complex array of vocational training courses that less academic students can take from 16 to 18. 3 We group the following subjects under “Science”: Biology, Chemistry, Physics (and any combination of two of these three subjects), Environmental Science, Psychology (as a Science), Science for Public Understanding, Science: technology, Zoology, Meteorology, Engineering Science, Other Science.
10

Locus of control refers to individual beliefs about whether life events are mostly
internally or externally determined (Rotter, 1966). People with an external locus of control
believe that what happens in life is largely determined by events beyond their control, while
individuals with internal locus of control generally believe that life events are mostly caused
by their own decisions and behaviours. We measure locus of control using children’s
responses to six questions (see the Appendix for details). We follow the previous literature in
the field (see for example Cobb-Clark et al., 2014 and Piatek and Pinger 2010) and use factor
analysis to create indices of internal and external locus of control. Children are coded as
external if they have a score in the top quartile of the distribution of the external index,
derived from factor analysis (see Schurer, 2014). We also examine the robustness of this
definition, by classifying children as external if they have a score in the top third or half of
the distribution of the external index (see Caliendo et al., 2014). Self-esteem refers to an
individual perception of her/his own value. LSYPE data includes two questions on self-
esteem (see Appendix for details) asked at waves 2 and 4. We construct an indicator of low
self-esteem equal to 1 if they have placed themselves in the most distressed category for one
of the two questions at least once between the two waves (around 26% of the children in the
sample)4.
Almlund et al. (2011) suggest that competence, dutifulness, self-discipline,
perseverance and work-ethic are all facets of Conscientiousness. LSYPE includes four
questions on working attitudes (see the Appendix for details) and we use factor analysis to
create an index of work ethics. Children are coded as having high work ethics, if they have a
score in the top quartile of the distribution of the index (see Schurer, 2014).
4 Alternative/more restrictive indicators of low self-esteem were constructed to test the robustness of our estimates and results are available on request.
11

3.3 Other explanatory variables
We estimate two versions of our model, one more parsimonious than the other. All of
the variables we control for are, arguably, pre-determined variables – that is, not themselves
influenced by personality traits. Our more parsimonious model only includes at-birth
characteristics such as: birth-weight; whether the child was premature; ethnic background;
sex of the child; and family characteristics such as marital status and age of the mother at
birth. In the second model we include other family’s characteristics (measured at wave 1)
such as: child’s or parent’s disability, maternal education and employment status, whether the
child lives in a single parent family, grandparents’ education, family income and older
siblings. One natural concern is that personality traits might be related with cognitive ability
and mental health (see for example Judge et al. 2002, and Schurer 2014) and therefore our
results could be picking up the effect of those variables, rather than personality traits per se.
Our data does not include any measure of cognitive ability (e.g. IQ test or other psychometric
assessments) and therefore we cannot control for this information in our model. LSYPE
includes the General Health Questionnaire (GHQ) score, as a measure of youths’ mental
health. We run a sensitivity analysis of our second model including the GHQ score and main
results are unchanged (results are available on request). However, we decided to follow the
main literature in this area (see for example Coleman and Deleire, 2000; Heckman et al.,
2006; Delaney et al., 2013; Lundberg, 2013) and not to include this measure in the preferred
version of the model, as mental health is likely to be correlated with personality and therefore
the GHQ score is likely to be endogenous.
Table 3 presents descriptive statistics on the outcome variables, broken down by
personality traits. Individuals with external locus of control and low self-esteem seem less
likely to perform well in their GCSE and A levels exams and to choose “core subjects” in
their studies. On the other hand, children with a high level of work ethics seem to have better
12

results both at GCSE and at A levels and to be more likely to continue with further education
after GCSE.
Table 3 here.
We explore the possibility of heterogeneity in the effect of personality traits on
children by socio-economic background and by various indicators of socio-economic
disadvantage. We follow Ruhm (2008) and construct a multivariate indicator of
socioeconomic status by regressing total family income on mother’s age at birth, education,
and marital status. Youths are classified as “advantaged” (“disadvantaged”) if they live in
households that are above (below) the median prediction. This SES index simultaneously
accounts for a larger number of determinants than simple income and possibly reduces the
endogeneity problem.
4. Estimation
While we begin by using Ordinary Least Squares, to control for observable
confounders, this is well known to lead to biased estimates of the causal effects because of
neglected heterogeneity. The linear model can be written as:
Yi = α + Pi’ β + Xi’ γ + εi (1)
where Yi represents educational outcomes (test scores in various subjects or subject choice at
A levels), Pi’ is a vector of psychological traits (binary indicators of external locus of control,
low self-esteem, and high work ethics) and Xi’ is a vector of child’s and family’s
characteristics. We cannot, in this data, address the selection on unobservables problem
because there is simply no quasi-experimental variation across our sample to exploit.
However, we do try to lower the upper bound provided by OLS estimation, through the
inclusion of a more detailed set of independent variables. Estimation by OLS could be biased
if we are not controlling for variables that actually play an important role in determining test
13

scores (the so-called omitted variable bias), or because of reverse causality (i.e change in
personality because of particular results in test scores). However, previous literature has
shown that personality traits tend to be quite stable after childhood (Cobb-Clark and Schurer,
2012 and 2013) and we are using personality traits collected at least one year before the test
scores.
Secondly, we exploit propensity score matching that does not rely on functional form
assumptions and restricts inference to samples where we can find overlap in the distribution
of covariates across the treatment.
Standard OLS regression controlling linearly for the observable characteristics and
personality traits may suffer from two potential sources of bias. First, if the true model were
non-linear in terms of the characteristics, the OLS estimate of the effect of personality traits
would be biased. Second, this regression constrains the impact to be homogeneous, i.e. the
same for all individuals; if, by contrast, the effect varies according to some of the youths’
characteristics, OLS will not, in general, recover the Average Treatment on Treated (ATT)
effect. Both these biases are exacerbated if some children fall outside the so-called common
support of the observables – that is, if there are children with some particular personality
traits for whom there are no comparable children in the sample of those without that
particular trait. If that is the case, OLS would be comparing non comparable children using
linear extrapolation.
In contrast, propensity score matching does not rely on the same functional form
assumptions of OLS and restricts inference to samples where we can find overlap in the
distribution of covariates across the treatment.
PSM may be thought of as assuming the selection problem way because it relies on
conditional independence that implies no selection on the unobservables conditional on the
14

observables. On the other hand, matching methods have some desirable features: the
observations used to estimate the causal effect are selected without reference to the outcome,
as in a controlled experiment; it dominates other methods based on selection on observables
(like OLS), thanks to its more convincing comparison of treated and control units; it offers
interesting insights for a better understanding of the estimation of causal effects; and there is
some (debated) evidence suggesting that it contributes to a reduction in the selection bias (see
Dehejia and Wahba 2002, Dehejia 2005, and Smith and Todd 2004). At the very least,
matching provides a convincing way to select the observations on which other estimation
methods can be based. Matching attaches appropriate weights to the observations in the
control group, so that the distribution of their observable characteristics is realigned to the
treatment group.
Propensity Score Matching has also been used in various recent papers investigating
the determinants of child well-being (see for example Ruhm, 2008, Berger et al., 2005, and
Goodman and Sianesi, 2005) and the effect of personality traits (Caliendo et al., 2014). The
idea of propensity score matching is to match children with different personality traits (for
example, with and without low self-esteem) who are as comparable as possible in all other
respects so that they have similar propensities to be treated. More specifically, we first
estimate the conditional probability of having a specific personality trait, called the
propensity score: such as having low self-esteem for each child, given our covariates. Then,
estimated propensity scores are used to create a matched control group and for each treated
child we find the comparison member with the closest propensity score. Non-matched
individuals are dropped from the analysis. Our analysis is performed using psmatch2 and
appropriate tests have been run, in order to compare covariate distributions across our
15

matched groups to ensure that adequate balance has been obtained (results available in
Appendix Table A1)5.
Lastly, we test our results using the methodology proposed by Altonji et al. (2005)
(AET) that relies on using the selection on observable traits to provide information about the
potential for selection on unobservable characteristics. This approach states that the part of an
outcome (Yi) that is related to the observables has the same relationship with personality traits
as the part related to the unobservables. It requires some strong assumptions (see Altonji et
al., 2005 for the details and Chatterji et al., 2011 and Johnston et al., 2013 for applications of
the methodology) but has the advantage of not relying on identifying variables. The AET
approach is based on the estimation of a bivariate probit model without any identifying
restrictions but with a constrained correlation coefficient. Identification comes from this
restriction as well as from functional form (Altonji et al., 2005). Following the AET
approach, if the observable determinants of an outcome are a random set of the complete set
of determinants, then selection on observable characteristics will be equal to selection on
unobservable characteristics. Altonji et al. (2005) show that we can consider the following
bivariate probit model:
Y = 1(α + βP + X’ γ + ε >0) (2)
P=1(Z’ θ + u >0) (3)
�𝑢𝜀� ∼ 𝑁 �00� �1 𝜌𝜌 1� (4)
5 Our approach is similar to Goodman and Sianesi (2005) and we use propensity score matching with the nearest neighbour method with replacement (as it has been shown to reduce bias relative to matching without replacement, see Dehejia and Wahba, 2002) and then used the common option, so that off-support observations are automatically dropped. Similar results were obtained with other matching methods.
16

In this model, the parameter ρ is not identified and we use the degree of selection on the
observables as a guide. The idea that “selection on the observables is the same as the
selection on unobservables” is formalised as:
𝐶𝑜𝑣 (𝑃, 𝜀)𝑉𝑎𝑟 (𝜀)
= 𝐶𝑜𝑣 (𝑃,𝑋′𝛾)𝑉𝑎𝑟 (𝑋′𝛾)
This condition holds under the following assumptions: the elements of X are chosen
randomly from the full set of variables that determine Y; and the number of observed and
unobserved factors is large enough so that no element dominates the distribution of the
outcome. These assumptions are very strong but, as argued in Altonji et al. (2005), weaker
than the standard OLS assumption that Cov(X, ε) = 0. Following Altonji et al. (2005), we
present estimates that maximise the likelihood imposing 𝜌 = 𝐶𝑜𝑣 (𝑃′𝛽,𝑃′𝛾)𝑉𝑎𝑟 (𝑃′𝛾)
which is equivalent
to condition (5).
Altonji et al. (2005) argue that if X, the observable determinants of Y, are a random
sample of the complete set of determinants, selection on observable characteristics should be
equal to selection on unobservable characteristics. In practice, as noted in Altonji et al (2005)
there are reasons to believe that the relationship between the unobservables and any
potentially endogenous treatment will be weaker than the relationship between the
observables and the treatment. For instance, the set of independent variables X has been
selected with the idea of reducing bias, rather than at random, and therefore the estimates
obtained under this assumption could be considered a lower bound of the true effect.
5. Results
The results from the estimation of the effect of personality traits on high school results
by subject are presented in Tables 4, 5, 6 and 7. Tables 4 and 5 present results from OLS and
Probit models, where all three personality traits are included in the estimation at the same
(5)
17
time. Personality traits have a strong ad significant effect on school performance, especially
at GCSE level. External locus of control decreases chances of good results in GCSE Results
in all subjects by about 20 percentage points – p.p and results are very similar across OLS
and Probit specifications of Model 2. It also decreases chances of taking A levels by about 15
p.p. and performance in A levels in English, Mathematics and Science (by about 7 points).
High work ethics have a positive effect on school performance and increases chances of
doing well in GCSE exams and taking A levels by about 5-6 p.p. It also increases scores in A
levels in Mathematics (+ 6 points) and Science (+ 14 points). Results from specifications
where we include each personality trait separately are not presented for parsimony but are
very similar. On the basis of the stability of our results we feel justified in examining the
effects of each trait separately in our subsequent PSM and AET analysis (see Table 7 and 8).
In our discussion, we will focus on the results from PSM estimation of Model 2 (see
Table 7), as this is our preferred specification and results do not vary significantly from
Model 1 to Model 2 (as showed by the tests reported in Table 4).
Figures 1 and 2 show the distribution of propensity scores across treatment and
control groups. Both graphs show that there is sufficient overlap between the treatment and
control groups.
Figure 1 here
Figure 2 here
Table 4 here
Table 5 here
Results from Table 7 confirm that personality has a notable effect on high school
performance and on subject choices. In particular, individuals with external locus of control
are less likely to have good results in test scores at age 16, and they are less likely to study for
18

A levels exams (-14 p.p.), and less likely to choose Mathematics (- 7 p.p) , or Science (-11
p.p) as their A levels subjects. At A level, the number of “facilitating subjects” (English,
Mathematics, Sciences, History, Geography, and Languages) chosen by these students is
likely to be lower than the one selected by their peers without external locus of control. Their
grades also tend to be lower, both for English and maths at GCSE level and for mathematics
and science at A level (by about 8 to 11 points, or 15% of a standard deviation). Low self-
esteem has a similar effect on performance and subject choices, but to a smaller extent. On
the other hand, students with high work ethics tend to perform better in GCSE tests, are more
likely to take A levels (by about 5 p.p. or 11% of a standard deviation), choose core subjects
for their exams and perform better in mathematics and science (+ 8 to +14 p.p. or 15% to
19% of a standard deviation). Results from balancing tests for PSM model are reported and
discussed in Appendix Table A1.
The results from Probit, PSM and AET estimation are generally consistent with those
reported from OLS estimation, with slightly lower effects, on average, reported from PSM
estimation. Nonetheless the degree to which PSM tightens the OLS bound is surprisingly
small. OLS seems to do a reasonable job despite our reservations. Interestingly, in all
different specifications of model 2, external locus of control and high work ethics seem to
have a stronger impact on results in mathematics and science, than in English, especially at
A-level. It is possible that these personality traits, which are closely related to motivation and
hard-working attitude impact more on these subjects, while other non-cognitive traits (such
as, for example, creativity or openness to experience) may have a stronger impact on
performance in English.
One possible explanation for the negative effects of external locus of control is that
external individuals tend to think that their choices have less impact on their future, which
they believe are mostly driven by luck and external circumstances. As a consequence, these
19

children are less likely to put a strong effort in their school work, as they do not believe this
will impact their future. This affects their performance and their chances to achieve high
results in their education. Low self-esteem may have a similar but smaller effect. Children
with low self-esteem struggle to see themselves as valuable, and this could affect their
aspirations and effort to achieve their potential, which in turn will affect their school results
and their choices related to further education. On the other hand, it is possible that individuals
with external locus of control or low self-esteem are more likely to come from families where
education is not valued, or they suffer from chronic stressor and are less able to concentrate,
and this affects their performance at school.
Further, a high level of work ethics could have a positive effect on test scores and
subject choices because students who are conscientious with their school work and show a
rigorous attitude could be more likely to perform well at GCSE level and to be willing to
continue with their education. They are also more likely to invest their time and energy in
choosing core subjects and perform well in mathematics, and science. It is also possible that
they come from families where hard-working attitude is valued more and therefore they are
more likely to put more effort in their school work.
Our findings are consistent with previous literature from psychology and economics.
For example, Almlund et al., 2011 discuss findings from various studies showing that
conscientiousness has very strong associations with course grades, which seems almost as
large as those between grades and cognitive ability (see for example Poropat, 2009).
In Table 6 we split the results by socio-economic status, and present a test of the
differences between results in the two groups. Interestingly, personality has a stronger effect
on performance at GCSE level for children who come from low socio-economic
backgrounds. The chances of getting 5 or more GCSE passes improve by around 10 p.p. for
20

disadvantaged children if they have high work ethics, and similar effects are found for
performance in English and mathematics at GCSE level. The negative effect of external locus
of control is found for both socio-economic groups, but it is stronger for students with a
disadvantaged background (around -25 p.p) and the differences are significant. External locus
of control also plays a negative role in the performance of disadvantaged youths who take A-
level English, while high work ethics seems to be more strongly rewarded for youths from
advantaged socio-economic status who undertake A levels in Mathematics and Science.
However, testing differences in results for A-levels is particularly complicated as the number
of individuals who choose to complete this exam is small, especially among children who
come from disadvantaged families.
Table 6 here
Table 7 here
These differences are not entirely unexpected: children from advantaged socio-
economic backgrounds are more likely to receive positive stimulation in the home
environment and to have parents who closely supervise their school work. They are also more
likely to continue their education after GCSE because of the higher expectations of their
families. Therefore, the role of personality traits is less important and is partially outweighed
by family resources. On the other hand, the results for students from disadvantaged families
seem to be more affected by positive or negative personality traits. It is likely that individual
non-cognitive skills will have more impact in families where the children receive less support
and stimulation through their education. One obvious concern in performing this type of
analysis if that growing up in a deprived socio-economic environment may directly affect
personality of young people. Previous research has investigated whether, for example,
welfare receipt can influence non-cognitive traits (Baron and Cobb-Clark, 2010) who
investigate this issue using a model in which locus of control is regressed against a series of
21

measures of socio-economic disadvantage and their results show little evidence that young
disadvantaged have a more external locus of control once family demographics and
background characteristics are taken into account.
Lastly, in Table 8 we present results from the empirical strategy proposed by Altonji
et al. (2005) and applied by Chatterji et al. (2011), which does not rely on problematic
identifying assumptions. The first part of the AET method consists in varying the level of
correlation between unobservables determining personality traits and outcomes and
determining whether the effect of personality is sensitive to these variations. The first column
in table 8 column reports estimates identical to a standard univariate probit (imposing no
correlations between the unobservables determining outcomes and personality traits6), while
the other columns report estimates of the effect of personality traits on various outcomes from
bivariate probit models imposing increasingly stronger levels of correlations between error
terms. The true level of correlation between the errors is unknown. However, we follow
Johnston et al. (2013) and we vary ρ between 0 and the correlations between the outcomes
and each specific personality traits in a linear model without other covariates. For example, it
is reasonable to assume that unobserved factors will affect external locus of control and
school outcomes in opposite directions. The coefficient of external locus in a linear model
where we regress the probability of obtaining at least 5 GCSE with grade between A* and C
against it with no other covariates is equal to -0.29 and therefore we vary ρ between 0 and –
0.30.
In the first part of Table 8, as expected, increasing the negative error correlation
decreases the estimated effect of external locus of control on all outcomes. However, the
effects on performance at GCSE level remain statistically significant and negative even when
moderate levels of negative selection are imposed (the effect on the chances of sitting A
6 The results are slightly different from the ones from a probit model reported in Table 5 because in the AET test we consider one personality trait at a time, in order to construct the bivariate probit model.
22

levels become insignificant only when ρ is set to – 0.30). The effects on the performance in A
level subjects are more sensitive to the imposed level of correlation. Even small amounts of
negative correlation between the unobservables make the effect of external locus of control
statistically insignificant. However, as already noticed, the number of children taking A
levels is significantly smaller than the ones taking GCSE and the small sample size might be
affecting the results. The last column shows results from the second part of the AET method,
i.e. the bivariate probit model, where selection on observables is used to set the level of
selection on unobservables. When selection on observables is set equal to selection on
unobservables, the effect of external locus of control becomes insignificant (and ρ varies
between -0.35 and -0.40 for the estimation on GCSE performance). In the second part of
Table 8, we progressively increase the levels of positive correlation in the estimation of the
effect of high work ethics of school performance. The effects on GCSE performance and on
the probability to take A levels remain positive and statistically significant when moderate
level of selection are introduced, while results on performance at A levels are more sensitive
to selection. However, the effect of work ethics on the probability of taking A-levels in
Science remain unchanged. The positive effects of high work ethics persist when selection on
observables is set equal to selection on unobservables.
Lastly, we vary the level of negative correlation between the error terms in the
estimation of the effect of low self-esteem. Here the results are sensitive to the level of
negative correlation imposed but most of the effect on GCSE performance persist when
selection on observable is equal to selection on unobservables (and ρ assumes slightly
positive values, indicating possible positive, even if very moderate, correlation between the
unobservables affecting the impact of low self- esteem on school performance).
23

In general, we believe that results from the AET test confirm our original hypothesis
of significant effects of personality on school performance, and especially the positive impact
of high work ethics.
Table 8 here
As shown in Appendix Table A2, the effects of personality traits are comparable with
the effect of other important variables, such as family income, presence of older siblings, or
growing up in a single parent household. The results from Appendix Table A2 are highly
consistent with our expectations and with previous literature on education. Generally,
children from high income and high education families perform better than their
disadvantaged peers. Boys have worse results than girls at GCSE level and they are also less
likely to take A-levels. However, they tend to have higher scores in Mathematics and Science
when they do take A levels. Ethnic minorities (and especially children with an Asian
background) perform well at all exams while children from single mother households, those
whose mums were very young at birth, or those who grow up with a disability or a disable
parent tend to have worse results both at age 16 and 18.
6. Conclusion and Discussion
This paper has highlighted the effect of personality on performance and subjects’
choice in high school. We used the Longitudinal Study of Young People in England, which is
a rich source of information on English teen-agers and can be linked to the National Pupil
Database, in order to get detailed information on school outcomes. We find that personality
traits have a significant effect on test scores at age 16-17 and 17-18 and this effect is
particularly relevant for children who come from disadvantaged socio-economic
backgrounds. The size of the effect is notable and is comparable to other important variables,
such as family income, presence of older siblings, or growing up in a single parent household.
24

Our analysis is performed using Ordinary Least Squares, Propensity Score Matching
and the methodology proposed by Altonji et al. (2005) which relies on using the selection on
observable traits to provide information about the selection on unobservable characteristics.
We make extensive use of the information contained in LSYPE and increase our set of
independent variables, in order to control for wider factors affecting both school outcomes
and personality traits. Our results are stable over the two different specifications of our
model. Moreover, Propensity Score Matching and AET allow us to better compare a group of
children who did not have specific personality traits with observationally similar children
who have those characteristics, given our independent variables.
The paper provides further evidence of the positive (negative) effects of high work
ethics (external locus of control and low self-esteem) on cognitive outcomes that are well
known to have important effects on lifecycle living standards. In particular, we show that
external locus of control and high work ethics have strong and opposite effects on
performance in Mathematics and Science.
A variety of interventions have been suggested that exploit the early malleability of
personality to improve long term outcomes. Selective personality-targeted interventions that
focus on specific personality traits as risk factors for negative and harmful behaviours have
recently been shown to be more effective than universal prevention programs (see for
example Conrod et al., 2010, Foxcroft and Tsertsvadze, 2011, Conrod et al., 2013). In the
UK, an example of these policies is SEAL (Social and Emotional Aspects of Learning), a
voluntary program designed to develop the social and emotional skills of all school pupils in
the areas of self-awareness, managing feelings, empathy, motivation and social skills. SEAL
is currently being implemented in around 90% of primary schools and 70% of secondary
schools. Various evaluations of SEAL have been conducted. Hallam, Rhamie and Shaw
(2006) concluded that primary SEAL “had a major impact on children’s well-being,
25

confidence, social and communication skills, relationships, including bullying, playtime
behaviour, pro-social behaviour and attitudes towards schools”. The evaluations of a number
of existing policies have shown that changing personality is possible and interventions are
useful, especially when they target young children and adolescents. We believe that our study
shows some of the ultimate benefits of these programs, which span a wide range of
achievements, which might have important long lasting consequences on individuals’ lives
and society as a whole.
The results here strongly suggest that there is a potential for policies that exploit
possible changes in personality to promote positive educational choices and achievements in
adolescence – outcomes that are important determinants of long run living standards.
26

References
Almlund, M., Lee Duckworth, A., Heckman, J.J., Kautz T. (2011). Personality Psychology and Economics. In Handbook of the Economics of Education. Vol. 4, ed. Hanushek E.A., Machin S. Woessmann L., 1-181. Amsterdam: Elsevier.
Altonji, J.G., Elder, T., Taber, C. (2005). Selection on Observed and Unobserved Variables: Assessing the Effectiveness of Catholic Schools. Journal of Political Economy 113: 151-184.
Baron, J. D., Cobb-Clark, D. (2010). Are Young People’s Educational Outcomes Linked to their Sense of Control? IZA Working Paper no. 4907.
Berger, L.M., Hill, J., Waldfogel, J. (2005). Maternity Leave, Early Maternal Employment and Child Health and Development in the US. Economic Journal, 115, 29-47.
Borghans, L., Lee Duckworth, A., Heckman, J., Ter Weel, B. (2008). The Economics and Psychology of Personality Traits. Journal of Human Resources, 43, 972-1059
Caliendo, M., Cobb-Clark, D., Uhlendorff, A. (2014). Locus of Control and Job Search Strategies. Review of Economics and Statistics, forthcoming.
Carneiro, P., Heckman, J. J. (2003). Human Capital Policy. In J. J. Heckman, A. B. Krueger, & B. M. Friedman (Eds.), Inequality in America: What role for human capital policies? Cambridge, Mass: MIT Press.
Carneiro, P., Crawford, C., Goodman, A. (2007). The Impact of Early Cognitive and Non-Cognitive Skills on Later Outcomes, CEE DP 92.
Cebi, M. (2007). Locus of Control and Human Capital Investment Revisited. Journal of Human Resources, 42, 919–932.
Chamorro-Premuzic, T., Furnham, A. (2003). Personality Predicts Academic Performance: Evidence from Two Longitudinal University Samples. Journal of Research in Personality, 37, 319-38.
Chatterji, P., Alegria, M., Takeuchi, D., 2011. Psychiatric disorders and labor market outcomes: evidence from the National Comorbidity Survey-Replication. Journal of Health Economics, 30, 858–868.
Cobb-Clark, D., Kassenboehmer, S.C., Schurer, S. (2014). Healthy Habits: The Connection between Diet, Exercise, and Locus of Control. Journal of Economic Behavior and Organization, 98, 1-28.
Cobb-Clark, D., Schurer, S. (2012). The stability of the Big-Five personality traits. Economics Letters, 115, 11-15.
Cobb-Clark D., Schurer S. (2013). Two Economists' Musings on the Stability of Locus of Control. The Economic Journal, 123, 358-400.
Coleman, M., DeLeire, T. (2003). An Economic Model of Locus of Control and the Human Capital Investment Decision. The Journal of Human Resources, 38, 701-721.
Conrod, P. J., Castellanos-Ryan, N., Strang, J. (2010). Brief, Personality-Targeted Coping Skills Interventions and Survival as a Non-Drug User over a 2-Year Period During Adolescence. Archives of General Psychiatry, 67, 85-93.
27

Conrod, P.J., O’Leavy Barret, M.A., Newton, N., Topper, L., Castellanos-Ryan, N., Mackie, C., Girard, A. (2013). Effective of a Seective, Personality –Targeted Prevention Program for Adolescent Alcohol Use and Misuse. Journal of American Medical Association – Psychiatry, 70, 334-342.
Cortes, K., Goodman, J., Nomi, T. (2013). Intensive Math Instruction and Educational Attainment: Long-Run Impacts of Double-Dose Algebra, Harvard Kennedy School Faculty Research Working Paper Series RWP13-009.
Crawford, C., Cribb, J. (2013) Reading and Mathematics Skills at Age 10 and Earnings in Later Life: A Brief Analysis Using the British Cohort Study. Centre for Analysis of Youth Transitions (CAYT) Impact Study: REP03.
Dehejia, R.H., Wahba, S. (2002). Propensity Score-Matching Methods for Non-Experimental Causal Studies. The Review of Economics and Statistics, 84, 151–61.
Dehejia, R.H. 2005. Practical Propensity Score Matching: a Reply to Smith and Todd. Journal of Econometrics, 125, 355-364.
Delaney, L., Harmon, C., Ryan, M. (2013). The Role of Noncognitive Traits in Undergraduate Study Behaviours. Economics of Education Review, 32, 181-195.
Dolton, P.J., Vignoles, A. (2002). Is a Broader Curriculum Better? Economics of Education Review, 21, 415–429.
Duckworth, K., Schoon, I. (2010). Progress and Attainment During Primary School: the Roles of Literacy, Numeracy and Self-Regulation. Longitudinal and Life Course Studies, 1, 223-240.
Duckworth, A., Seligman, M. (2005). Self-Discipline Outdoes IQ in Predicting Academic Performance of Adolescents, Psychological Science, 16, 939-944.
Duncan, G.J., Dowsett, C.J., Claessens, A.,Mugnuson, K., Huston, A.C., Klebanov, P.,Pagani, L.S., Feinstein, L., Engel, M., Brooks- Gunn, J., Sexton, H., Duckworth K., Japel, C. (2007), School Readiness and Later Achievement. Developmental Psychology, 43, 1428–1446.
Foxcroft D.R., Tsertsvadze A. (2011). Universal School-based Prevention Programs for Alcohol Misuse in Young People. Cochrane Database of Systematic Reviews 5, doi.
Goldberg, L.R., Sweeney, D. Merenda, P.F., & Hughes, J.E. (1998). Demographic variables and personality: The effects of gender, age, education, and ethnic/racial status on self-descriptions of personality attributes. Personality and Individual Differences, 24, 393-403.
Goodman A., Sianesi B. (2005). Early Education and Children’s Outcomes: How Long Do the Impacts Last? Fiscal Studies, 26, 513-548.
Hallam, S., Rhamie, J., Shaw, J. (2006). Evaluation of the Primary Behaviour and Attendance Pilot. Research Report RR717. Nottingham: DfES Publications
Heckman, J J., Masterov, D. (2007). The Productivity Argument for Investing in Young Children. Review of Agricultural Economics, 29, 446–93.
Heckman, J. J., Moon, S. H., Pinto, R., Savelyev, P. A., Yavitz, A. (2010). The Rate of Return to the HighScope Perry Preschool Program. Journal of Public Economics, 9, 114–128.
28

Heckman J.J., Rubinstein Y.(2001).The Importance of Noncognitive Skills: Lessons from the GED Testing Program. American Economic Review, 91, 145–149
Heckman J.J., Stixrud, J., Urzua, S. 2006. The Effects of Cognitive and Noncognitive Abilities on Labor Market Outcomes and Social Behavior. Journal of Labor Economics 24: 411-482.
Joensen, J.S., Nielsen, H. S. (2009). Is there a Causal Effect of High School Math on Labor Market Outcomes? Journal of Human Resources, 44, 171-198.
Johnston, D., Schurer, S., Shields, M. (2013). Exploring the intergenerational persistence of mental health: Evidence from three generations. Journal of Health Economics, 32, 1077–1089.
Judge, T.A., Erez, A., Bono, J.E., Thoresen, C.J. (2002). Are measures of self-esteem, neuroticism, locus of control, and generalized self-efficacy indicators of a common core construct? Journal of Personality and Social Psychology, 83, 693-710.
Kalil, A., & Khalid, S. (2011, April). “Non-cognitive skills and educational attainment” Paper presented at the Annual Meeting of the Population Association of America, Washington, D.C.
Lundberg, S. (2013). The College Type: Personality and Educational Inequality. Journal of Labor Economics, 31: 421-441.
OECD (2012) Education at A Glance, OECD.
Piatek R., Pinger P. 2010. Maintaining (Locus of) Control? Assessing the Impact of Locus of Control on Education Decisions and Wages. IZA Discussion Paper 5289.
Poropat, A.E., (2009). A Meta-Analysis of the Five-Factor Model of Personality and Academic Performance. Psychological Bullettin, 135, 322–338.
Ross, C. E., Broh, B.A. (2000). The roles of self-esteem and the sense of personal control in the academic achievement process. Sociology of Education, 73, 270- 284.
Rotter, J. (1966). Generalized Expectancies for Internal Versus External Control of Reinforcement, Psychological Monographs, 80, 1-28.
Ruhm C.J. (2008). Maternal Employment and Adolescent Development. Labour Economics, 15, 958-983.
Schurer, S. (2014). Bouncing back from health shocks: Locus of control, labour supply, and mortality. IZA Discussion Paper 8203.
Silles, M. (2010). Personality, Education and Earnings. Education Economics, 18, 131-151.
Smith J., Todd P., 2004. Does Matching Overcome Lalonde’s Critique of Nonexperimental Estimators. Journal of Econometrics 125: 305-353.
Wang, L.-Y., Kick, E., Fraser, J., Burns, T.J. (1999). Status Attainment in America: The Roles of Locus of Control and Self-Esteem in Educational and Occupational Outcomes. Sociological Spectrum, 19, 281- 298.
29

Tables
Table 1 Summary of main findings in the literature on the effects of childcare on children outcomes (in alphabetical order) Paper Data Method Main findings Baron and Cobb-Clark (2010)
Youth in Focus OLS, Probit Ordered probit
A standard deviation increase in locus of control increases the probability of high school graduation by 4.5 p.p.
Coleman and Deleire (2003)
NELS Probit A standard deviation increase in youths' sense of control results in a 2 to 3pp increase in the probability of completing high school.
Cebi (2007) NLSY Probit A standard deviation increase in locus of control increases hourly wages by 2. 1 percent. Borghans et al. (2008) 128 students
from Maastrict University
Experimental analysis Subjects with favorable personality traits such as high performance-motivation and an internal locus of control perform relatively well in the absence of rewards.
Heckman et al., 2006 NLSY79 Structural model Non-cognitive skills affect years of schooling and college performance. Delaney et al., 2013 Irish University
Study OLS with a broad set of covariates
A standard deviation increase in students’ conscientiousness increases lecture attendance by approximately 7.4 percent; and increases study time by almost two hours
Carneiro et al., 2007 NCDS58 OLS A standard deviation increase in social adjustment score at age 11 increases the probability to stay at school after age 16 by 4 p.p. and the probability of having a degree by 2 p.p.
Lundberg, 2013 NLSAH-Add Health
LPM Conscientiousness has no significant impact on the education of disadvantaged men, while openness to experience has an effect on chances of college graduation only for less-advantaged men and women.
Coneus et al., 2009 GSOEP Probit and IV A standard deviation difference in noncognitive skills (locus of control) is related to a dropout probability that is 2.2 to 3.7 percentage points lower.
Silles, 2010 NCDS OLS Social maladjustment is associated with worst educational attainment (test score at age 16) Kalil et al., 2010 NLSY97 OLS and Blinder
Oaxaca decomposition A standard deviation increase in self-efficacy increases educational attainment (measured in years of education and college attendance) by 0.04 standard deviations
30

Table 2 - Outcomes
Test Scores Variable
Has 5 or more GCSE with A*-C Binary (1/0)
Has achieved A*-C in GCSE Mathematics Binary (1/0)
Has achieved A*-C in GCSE English Binary (1/0)
Has A levels Binary (1/0)
A level points In points
Has A level - Mathematics Binary (1/0)
A level points - Mathematics In points
Has A level - Science Binary (1/0)
A level points - Science In points
Has A level - English Binary (1/0)
A level points - English In points
No. facilitating subjects (Maths, Science, English, History, Geography, Languages)
Number of subjects (from 0 to 6)
31

Table 3 – Descriptive statistics of outcome variables by locus of control, self-esteem and work ethics Whole sample External Low Self-Esteem High Work ethics
Has 5 + GCSE with A*-C - % 55.4 32.8 53.0 63.7 Has GCSEA*-C in English - % 67.6 45.1 67.3 74.8 Has GCSEA*-C in Maths - % 62.6 40.6 58.1 69.3 Has A levels - % 39.6 22.4 38.8 47.4 Points in A levels – mean (sd) 260.9 (132.7) 232.72 (127.1) 260.26 (126.3) 264.53 (138.5) Has A levels – Maths - % 8.9 3.2 6.7 11.3 Points in A levels Maths – mean (sd) 113.36 (52.1) 108.5 (53.0) 111.7 (54.6) 122.5 (57.6) Has A levels – Science - % 12 4.8 10 16.1 Points in A levels Science – mean (sd) 135.18 (76.5) 133.33 (70.2) 129.62 (76.7) 141.85 (76.4) Has A levels – English - % 12 7.2 12.7 14.8 Points in A levels English – mean (sd) 92.48 (28.9) 84.55 (24.8) 90.56 (26.6) 97.12 (29.0) No. facilitating subjects (Maths, Science, English, 1.2 (0.9) 0.9 (0.8) 1.1 (0.9) 1.3 (0.9) History, Geography, Languages) mean (sd)
32
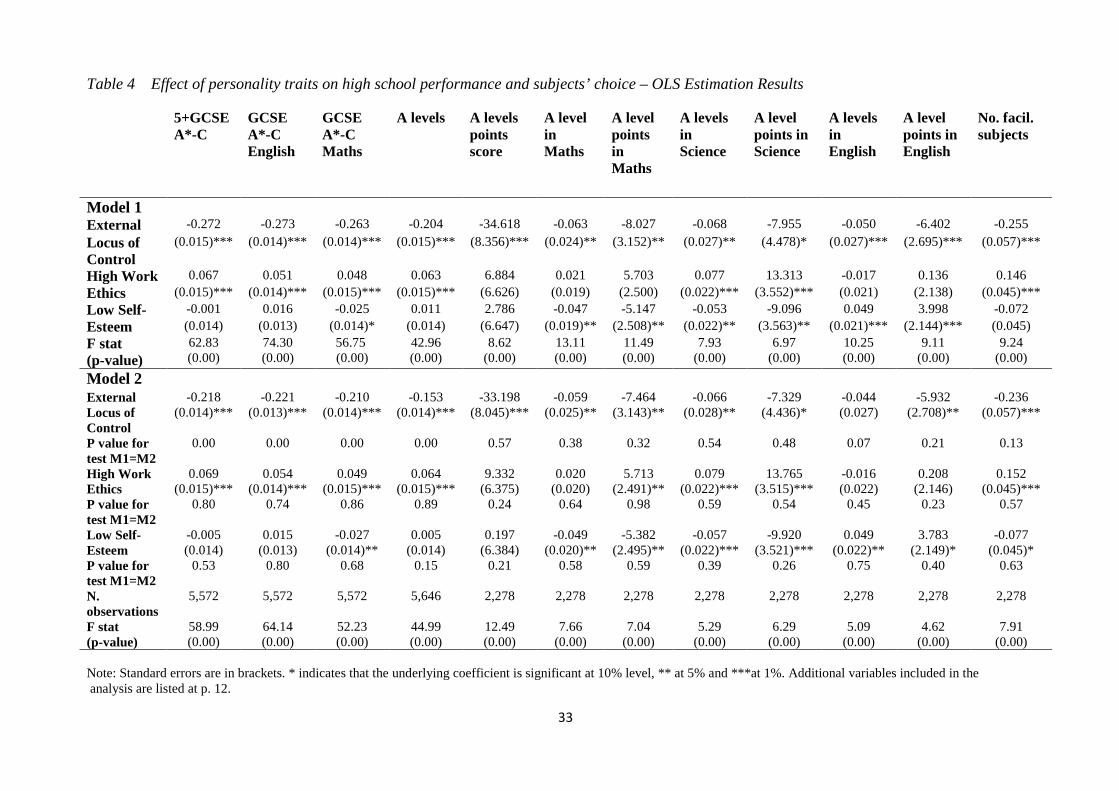
Table 4 Effect of personality traits on high school performance and subjects’ choice – OLS Estimation Results
5+GCSE A*-C
GCSE A*-C English
GCSE A*-C Maths
A levels A levels points score
A level in Maths
A level points in Maths
A levels in Science
A level points in Science
A levels in English
A level points in English
No. facil. subjects
Model 1 External -0.272 -0.273 -0.263 -0.204 -34.618 -0.063 -8.027 -0.068 -7.955 -0.050 -6.402 -0.255 Locus of (0.015)*** (0.014)*** (0.014)*** (0.015)*** (8.356)*** (0.024)** (3.152)** (0.027)** (4.478)* (0.027)*** (2.695)*** (0.057)*** Control High Work 0.067 0.051 0.048 0.063 6.884 0.021 5.703 0.077 13.313 -0.017 0.136 0.146 Ethics (0.015)*** (0.014)*** (0.015)*** (0.015)*** (6.626) (0.019) (2.500) (0.022)*** (3.552)*** (0.021) (2.138) (0.045)*** Low Self- -0.001 0.016 -0.025 0.011 2.786 -0.047 -5.147 -0.053 -9.096 0.049 3.998 -0.072 Esteem (0.014) (0.013) (0.014)* (0.014) (6.647) (0.019)** (2.508)** (0.022)** (3.563)** (0.021)*** (2.144)*** (0.045) F stat (p-value)
62.83 (0.00)
74.30 (0.00)
56.75 (0.00)
42.96 (0.00)
8.62 (0.00)
13.11 (0.00)
11.49 (0.00)
7.93 (0.00)
6.97 (0.00)
10.25 (0.00)
9.11 (0.00)
9.24 (0.00)
Model 2 External -0.218 -0.221 -0.210 -0.153 -33.198 -0.059 -7.464 -0.066 -7.329 -0.044 -5.932 -0.236 Locus of (0.014)*** (0.013)*** (0.014)*** (0.014)*** (8.045)*** (0.025)** (3.143)** (0.028)** (4.436)* (0.027) (2.708)** (0.057)*** Control P value for test M1=M2
0.00 0.00 0.00 0.00 0.57 0.38 0.32 0.54 0.48 0.07 0.21 0.13
High Work 0.069 0.054 0.049 0.064 9.332 0.020 5.713 0.079 13.765 -0.016 0.208 0.152 Ethics (0.015)*** (0.014)*** (0.015)*** (0.015)*** (6.375) (0.020) (2.491)** (0.022)*** (3.515)*** (0.022) (2.146) (0.045)*** P value for test M1=M2
0.80 0.74 0.86 0.89 0.24 0.64 0.98 0.59 0.54 0.45 0.23 0.57
Low Self- -0.005 0.015 -0.027 0.005 0.197 -0.049 -5.382 -0.057 -9.920 0.049 3.783 -0.077 Esteem (0.014) (0.013) (0.014)** (0.014) (6.384) (0.020)** (2.495)** (0.022)*** (3.521)*** (0.022)** (2.149)* (0.045)* P value for test M1=M2
0.53 0.80 0.68 0.15 0.21 0.58 0.59 0.39 0.26 0.75 0.40 0.63
N. observations
5,572 5,572 5,572 5,646 2,278 2,278 2,278 2,278 2,278 2,278 2,278 2,278
F stat (p-value)
58.99 (0.00)
64.14 (0.00)
52.23 (0.00)
44.99 (0.00)
12.49 (0.00)
7.66 (0.00)
7.04 (0.00)
5.29 (0.00)
6.29 (0.00)
5.09 (0.00)
4.62 (0.00)
7.91 (0.00)
Note: Standard errors are in brackets. * indicates that the underlying coefficient is significant at 10% level, ** at 5% and ***at 1%. Additional variables included in the analysis are listed at p. 12.
33

Table 5 Effect of personality traits on high school performance and subjects’ choice – Probit Estimation Results
5+GCSE A*-C GCSE A*-C English
GCSE A*-C Maths
A levels A level in Maths
A levels in Science
A levels in English
Model 2 External -0.650 -0.676 -0.609 -0.506 -0.229 -0.220 -0.139 Locus of (0.043)*** (0.044)*** (0.042)*** (0.045)*** (0.095)** (0.087)** (0.086) Control [-0.255] [-0.246] [-0.234] [-0.180] [-0.059] [-0.071] [-0.045]
High Work 0.212 0.199 0.159 0.193 0.054 0.234 -0.055
Ethics (0.045)*** (0.048)*** (0.046)*** (0.044)*** (0.069) (0.065)*** (0.066) [0.082] [0.065] [0.058] [0.074] [0.015] [0.081] [-0.018]
Low Self- -0.015 0.051 -0.088 0.021 -0.197 -0.183 0.138 Esteem (0.042) (0.045) (0.042)** (0.042) (0.074)*** (0.067)*** (0.065)*
[-0.006] [0.017] -[0.033] [0.074] [-0.053] [-0.060] [0.047] N. observations 5,572 5,572 5,572 5,646 2,278 2,278 2,278 Note: Robust standard errors are in parentheses. Marginal effects are in brackets. * indicates that the underlying coefficient is significant at 10% level, ** at 5% and ***at 1%. Additional variables included in the analysis are listed at p. 12.
34

Table 6 Effect of personality traits on high school performance and subjects’ choice – OLS Estimation Results by socio- economic status – Model 2
5+GCSE A*-C
GCSE A*-C English
GCSE A*-C Maths
A levels A levels points score
A level in Maths
A level points in Maths
A levels in Science
A level points in Science
A levels in English
A level points in English
No. facil. subjects
Advantaged Children External -0.184 -0.168 -0.142 -0.171 -33.861 -0.042 -5.616 -0.061 -6.324 0.010 -2.040 -0.204 Locus of (0.023)*** (0.021)*** (0.023)*** (0.023)*** (10.002)*** (0.031) (3.948)*** (0.032) (5.270) (0.035) (3.288) (0.066)*** Control High 0.033 0.017 0.022 0.045 23.394 0.029 9.440 0.105 20.045 -0.004 3.015 0.175 Work (0.020)* (0.017) (0.019) (0.022)** (8.638)*** (0.027) (4.014)*** (0.030)*** (5.463)*** (0.028) (3.084) (0.059)*** Ethics Low Self- 0.006 0.014 -0.013 -0.003 4.269 -0.049 -4.959 -0.080 -12.241 0.0769 6.324 -0.103 Esteem (0.019) (0.016) (0.018) (0.021) (7.687) (0.024)* (3.332) (0.026)*** (4.491)*** (0.028)*** (2.823)** (0.055)* Disadvantaged children External -0.233 -0.250 -0.249 -0.131 -30.88 -0.079 -9.622 -0.068 -7.925 -0.132 -12.343 -0.294 Locus of (0.018)*** (0.019)*** (0.019)*** (0.015)*** (12.992)** (0.031)** (3.16)*** (0.039)* (5.782) (0.037)*** (3.407)*** (0.081)*** Control P-value for Test adv=disadv
0.10 0.005 0.00 0.16 0.85 0.39 0.42 0.88 0.83 0.006 0.03 0.39
High 0.098 0.085 0.069 0.083 -7.179 -.0008 0.274 0.040 5.282 -0.018 -2.309 0.128 Work (0.020)** (0.019)*** (0.020)*** (0.020)*** (9.796) (0.028) (3.150) (0.033) (4.979) (0.032) (3.010) (0.072)* Ethics P-value for Test adv=disadv
0.02 0.008 0.09 0.22 0.02 0.43 0.07 0.15 0.04 0.73 0.21 0.61
Low -0.013 0.015 -0.040 0.011 -6.963 -0.049 -6.113 -0.0212 -6.767 0.017 0.685 -0.021 Self- (0.019) (0.019) (0.019)** (0.017) (10.185) (0.026)* (2.870)** (0.034) (4.747) (0.035) (3.242) (0.071) Esteem P-value for Test adv=disadv
0.49
0.98
0.31
0.57
0.38
0.99
0.79
0.17
0.40
0.18
0.18
0.36
Note: Standard errors are in brackets. N. observations is reported under the standard errors * indicates that the underlying coefficient is significant at 10% level, ** at 5% and ***at 1%. Additional variables included in the analysis are listed at p. 9.
35

Table 7 Effect of personality traits on high school performance and subjects’ choice – PSM Estimation Results
5+GCSE A*-C
GCSE A*-C English
GCSE A*-C Maths
A levels A levels points score
A level in Maths
A level points in Maths
A levels in Science
A level points in Science
A levels in English
A level points in English
No. facil. subjects
Model 2
External -0.231 -0.164 -0.209 -0.145 -27.596 -0.068 -8.308 -0.115 -12.047 -0.024 -5.163 -0.287
Locus of (0.021)*** (0.021)*** (0.021)*** (0.019)** (11.058)** (0.032)** (3.928)*** (0.037)*** (5.494)*** (0.036) (3.469) (0.074)***
Control 5,857 5,857 5,857 5,936 2,331 2,331 2,331 2,331 2,331 2,331 2,331 2,331
High 0.108 0.073 0.091 0.052 21.714 0.052 7.972 0.092 14.095 0.001 1.931 0.228
Work (0.020)*** (0.018)*** (0.019)*** (0.019)** (8.517)** (0.024)** (3.094)** (0.026)*** (4.303)*** (0.026) (2.613) (0.057)***
Ethics 7,310 7,310 7,310 7,403 2,981 2,981 2,981 2,981 2,981 2,981 2,981 2,981
Low Self- -0.065 0.007 -0.078 -0.016 -2.002 -0.048 -4.296 -0.055 -7.572 0.033 -0.024 -0.099
Esteem (0.017)*** (0.016) (0.017)*** (0.016) (7.704) (0.022)** (2.680) (0.025)** (3.941)* (0.025) (2.473) (0.053)*
8,293 8,293 8,293 8,414 3,215 3,215 3,215 3,215 3,215 3,215 3,215 3,215 Note: Standard errors are in brackets. N. observations is reported under the standard errors. * indicates that the underlying coefficient is significant at 10% level, ** at 5% and ***at 1%. Additional variables included in the analysis are listed at p. 12.
36

Table 8 Sensitivity Analysis: Effect of personality traits on high school performance and subjects’ choice given different assumptions on the correlations of disturbances in Bivariate Probit (AET Test)
External Locus of Control
ρ= 0 ρ= -0.05 ρ= -0.1 ρ= -0.15 ρ= -0.20 ρ= -0.25 ρ= -0.3 ρ set such that select on obs.=
select on unobs.
5+GCSE A*-C
-0.664 (0.042)***
-0.578 (0.042)***
-0.492 (0.042)***
-0.406 (0.041)***
-0.315 (0.041)***
-0.235 (0.041)****
-0.134 (0.040)***
0.016 (0.039)
-0.296 [ -0.260] [-0.227] [-0.194] [-0.161] [-0.125] [-0.093] [-0.053] [0.006] ρ= -0.38 GCSE A*-C English
-0.675 (0.0418)***
-0.589 (0.041)***
-0.504 (0.042)***
-0.419 (0.041)***
-0.329 (0.041)***
-0.250 (0.041)***
-0.151 (0.040)***
-0.052 (0.039)
-0.294 [-0.247] [-0.215] [-0.182] [-0.151] [-0.118] [-0.089] [-0.053] [-0.018] ρ= -0.35 GCSE A*-C Maths
-0.627 (0.041)***
-0.541 (0.041)***
-0.455 (0.041)***
-0.370 (0.041)***
-0.280 (0.040)***
-0.201 (0.040)***
-0.010 (0.039)**
0.105 (0.038)***
-0.282 [-0.241] [-0.208] [-0.175] [-0.142] [ -0.107] [-0.076] [-0.038] [0.039] ρ= -0.41 A levels -0.233
-0.516 (0.044)***
-0.430 (0.043)***
-0.342 (0.043)***
-0.256 (0.043)***
-0.165 (0.043)***
-0.084 (0.042)**
0.016 (0.042)
0.230 (0.0411)***
[-0.181] [ -0.153] [-0.123] [-0.093] [ -0.061] [-0.031] [ 0.006] [0.088] ρ= -0.41 A level in Maths
-0.291 (0.092)***
-0.199 (0.092)**
-0.105 (0.092)
-0.012 (0.092)
0.086 (0.091)*
0.174 (0.091)*
0.285 (0.089)***
-0.123 (0.092)
-0.044 [-0.074] [-0.052] [-0.028] [-0.003] [0.025] [0.051] [0.087] [-0.033] ρ= -0.09 A levels in Science
-0.258 (0.083)***
-0.166 (0.083)**
-0.073 (0.083)
0.019 (0.082)
0.116 (0.082)*
0.203 (0.081)**
0.311 (0.080)**
-0.451 (0.083)***
-0.052 [-0.082] [ -0.054] [-0.024] [0.006] [0.040] [0.072] [0.112] [ -0.137] ρ= 0.10 A levels in English
-0.122 (0.082)
-0.029 (0.082)
0.063 (0.082)
0.155 (0.082)*
0.251 (0.081)***
0.337 (0.081)***
0.444 (0.080)**
0.592 (0.078)***
-0.070 [-0.039] [ -0.009] [0.021] [0.053] [0.088] [0.120] [0.161] [ .218] ρ= -0.37 Note: Standard errors are in parentheses. Marginal effects in brackets * indicates that the underlying coefficient is significant at 10% level, ** at 5% and ***at 1%. Additional variables included in the analysis are listed at p. 9. Results from an OLS regression of various outcomes on external locus of control with no additional covariates are reported in the first column in italic.
37

High work ethics ρ= 0 ρ= 0.05 ρ= 0.1 ρ set such that select on obs.= select on unobs.
5+GCSE A*-C 0.272 (0.039)***
0.185 (0.039)***
0.097 (0.039)**
0.239 (0.039)***
0.079 [0.106] [0.072] [0.038] [0.093] ρ= 0.02 GCSE A*-C English 0.284
(0.042)*** 0.196
(0.042)*** 0.108
(0.042)** 0.231
(0.042)*** 0.069 [0.094] [0.066] [0.037] [0.077] ρ= 0.03 GCSE A*-C Maths 0.232
(0.040)*** 0.145
(0.040)*** 0.057
(0.039) 0.196
(0.040)*** 0.070 [0.085] [0.054] [0.021] [0.072] ρ= 0.02 A levels 0.253
(0.038)*** 0.165
(0.038)*** 0.078
(0.038)** 0.129
(0.038)*** 0.100 [0.097] [0.063] [0.029] [0.049] ρ= 0.07 A level in Maths 0.070
(0.062) -0.014 (0.062)
-0.098 (0.061)
0.086 (0.062)
0.009 [0.019] [-0.004] [-0.027] [0.024] ρ= -0.009 A levels in Science 0.206
(0.057)*** 0.121
(0.057)** 0.036
(0.056) 0.302
(0.057)** 0.041 [0.071] [0.041] [0.012] [0.105] ρ= - 0.05 A levels in English -0.036
(0.058) -0.121 (0.058)
-0.206 (0.058)
0.059 (0.058)
0.012 [-0.012] [-0.039] [-0.066] [0.020] ρ= - 0.05 Note: Standard errors are in parentheses. Marginal effects in brackets * indicates that the underlying coefficient is significant at 10% level, ** at 5% and ***at 1%. Additional variables included in the analysis are listed at p. 9. Results from an OLS regression of various outcomes on external locus of control with no additional covariates are reported in the first column in italic.
38

Low self-esteem ρ= 0 ρ= -0.05 ρ= -0.1 ρ set such that select on obs.= select
on unobs. 5+GCSE A*-C -0.122
(0.034)*** -0.037 (.034)
0.047 (.034)
-0.221 (0.034)***
-0.035 [-0.048] [ -0.015] [0.019] [-0.088] ρ= 0.06 GCSE A*-C English -0.065
(0.035)* 0.019 (0.035)
0.103 (0.035)**
-0.226 (0.035)***
-0.008 [-0.024] [0.007] [0.037] [-0.083] ρ= 0.09 GCSE A*-C Maths -0.170
(0.034)*** -0.086
(0.034)** -0.001 (0.034)
-0.217 (0.034)***
-0.058 [-0.066] [ -0.033] [-0.0005] [-0.084] ρ= 0.03 A levels -0.044
(0.034) 0.040
(0.034) 0.125
(0.034)*** -0.161
(0.034)*** -0.006 [-0.016] [0.014] [0.0467] [-0.058] ρ= 0.07 A level in Maths -0.206
(0.062)*** -0.121 (0.062)*
-0.035 (0.061)
0.011 (0.061)
-0.054 [-0.054] [-0.032] [-0.0095] [0.003] ρ= -0.12 A levels in Science -0.167
(0.056)*** -0.083 (0.056)
0.002 (0.056)
0.008 (0.056)
-0.038 [ -0.054] [-0.027] [0.00087] [0.002] ρ= -0.10 A levels in English 0.107
(0.054)* 0.191
(0.054)*** 0.276
(0.054)*** -0.595
(0.051)** 0.053 [0.036] [0.065] [0.095] [-0.18] ρ= 0.42 Note: Standard errors are in brackets. * indicates that the underlying coefficient is significant at 10% level, ** at 5% and ***at 1%. Additional variables included in the analysis are listed at p. 9. Results from an OLS regression of various outcomes on external locus of control with no additional covariates are reported in the first column in italic.
39

Figure 1 - Histogram of propensity scores of treatment vs. control group
Figure 2 - Kernel graphs of propensity score for treated and control group
Model 2 – Effect of external locus of control on having 5 or more GCSE with A*-C.
0 .2 .4 .6 .8Propensity Score
Untreated Treated: On supportTreated: Off support
02
46
kden
sity
_ps
core
0 .2 .4 .6 .8x
Treatment Group Control Group
40

Appendix
Locus of control – Questions in LSYPE 1. I can pretty much decide what happens in my life
2. If someone is not a success in life, it is usually his fault
3. How well you get in this world is mostly a matter of luck
4. Even if I do well at school, I will have a hard time
5. People like me do not have much of a chance
6. If you work hard at something, you will usually succeed
Possible answers:
• Strongly agree • Agree • Disagree • Strongly disagree
Work ethics – Questions in LSYPE
1. Doing well at school means a lot to me
2. At school, I work as hard as I can
3. Working hard at school now will help me to get on later in life
4. If you work hard at something, you will usually succeed
Possible answers:
• Strongly agree • Agree • Disagree • Strongly disagree
Self-esteem – Questions in LSYPE
1. How useful you have felt recently? 2. How much you have been thinking of yourself as a worthless person recently?
Possible answers:
• Not at all • No more than usual • Rather more than usual • Much more than usual.
41

Table A1 Balance tests for Propensity Score Matching (Estimation of the effect of external locus of control on chances of getting 5+ GCSE A*-C – Model 2) Variable Mean -
Treated Mean Control % Bias % Fall in
Bias t p
HH yearly income >31,200£
0.247 0.268 -4.5 82.9 -1.27 0.203
HH yearly income betw. 11,400£ and 31,200£
0.487 0.464 4.6 66.1 1.23 0.220
Birth weight 3.312 3.310 0.4 92.5 0.10 0.919 Premature birth 0.098 0.093 1.8 -22.2 0.50 0.614 Has older siblings 1.025 1.003 2.0 88.2 0.50 0.620 Grandparents went to university
0.069 0.061 3.0 64.1 0.90 0.368
Child has disabilty 0.169 0.183 -3.9 67.0 -0.97 0.330 Main parent has disability 0.219 0.222 -0.8 85.0 -0.22 0.823 Mother has a 0.091 0.092 -0.2 98.8 -0.06 0.949 university degree Mother has other 0.119 0.135 -4.6 52.1 -1.28 0.200 higher education Mother senior high school graduate
0.153 0.153 0.0 100.0 -0.00 1.000
Mother junior high school graduate
0.282 0.280 0.5 93.1 0.12 0.901
Mother has qualifications level 1 or below
0.112 0.127 -4.9 51.6 -1.20 0.230
Mother has other qualification
0.038 0.033 2.7 56.6 0.70 0.487
Male 0.543 0.545 -0.3 95.5 -0.07 0.941 Single parent at birth 0.252 0.238 3.3 76.7 0.86 0.388 Mother younger than 20 at birth
0.091 0.079 4.5 69.2 1.13 0.260
Black 0.054 0.047 3.0 -487.3 0.84 0.399 Asian 0.088 0.075 4.4 -302.2 1.22 0.223 Mixed 0.077 0.096 -7.3 -3.7 -1.78 0.076 Mother was unemployed at wave 1
0.015 0.015 -0.6 81.9 -0.15 0.881
Mother was out of the labour force at wave 1
0.288 0.274 3.2 80.7 0.83 0.409
Single mother at wave 1 0.274 0.266 2.1 88.1 0.54 0.587
A summary of the distribution of the absolute bias shows that before matching: Mean = 10.83 SD=8.70 and after matching: Mean = 2.81; SD=1.96
Table A1 shows results from balance tests of the estimation performed with Model 2 on the effect of external locus of control on the chances of getting 5 or more GCSE with grade A*-C. The output shows values of each variable for the matched sample. In each row, it shows the mean of the variable for the treatment group and the mean for the control group. It also shows the “%bias,” which is the standardized bias. This “bias” is defined as the difference of the mean values of the treatment group and the (not matched / matched) non treatment group, divided by the square root of the average sample variance in the treatment group and the not matched non treatment group. The
42

table also shows the % reduction in bias, which is how much of this bias was eliminated by matching. In this example, there are few variables exhibiting negative values for this column (meaning that the bias increased as a result of matching) and these are mostly cases in which the bias was already very low before matching. To assess balance, one should look at both the bias and the mean differences between treatment and control in the matched sample. In our example, the bias is significantly reduced after matching (the mean goes from 10.83 to 2.81). The last two columns present results from a t-test on the hypothesis that the mean value of each variable is the same in the treatment group and the non-treatment group after matching. If p>0.1, the null hypothesis cannot be rejected on the 10% significance level. The null hypothesis that the mean values of the two groups do not differ after matching cannot be rejected for most of the variables included in our analysis. By matching, the differences between treatment group and non-treatment group are reduced considerably.
43

Table A2 Effect of other independent variables on high school performance and subjects’ choice - OLS Estimation Results from Model 2
5+GCSE A*-C GCSE A*-C in English
GCSE A*-C in Maths
Has A level A level points
HH income >31,200£ 0.119 (0.018)***
0.129 (0.017)***
0.104 (0.018)***
0.111 (0.019)***
15.706 (8.530)*
Income betw. 11,400£ - 31,200£
0.014 (0.016)
0.022 (0.015)
0.015 (0.016)
0.012 (0.016)
3.589 (8.255)
Birth weight 0.032 (0.012)***
0.026 (0.011)**
0.043 (0.012)***
0.003 (0.012)
-3.922 (5.536)
Premature birth -0.028 (0.022)
-0.023 (0.020)
-0.007 (0.022)
-0.016 (0.022)
-8.485 (10.513)
Has older siblings -0.039 (0.006)***
-0.039 (0.005)***
-0.039 (0.006)***
-0.035 (0.006)***
-8.534 (3.041)***
Grandparents went to university
0.110 (0.021)***
0.073 (0.020)***
0.095 (0.021)***
0.075 (0.021)***
50.659 (8.437)***
Child has disabilty -0.088 (0.017)***
-0.078 (0.016)***
-0.090 (0.017)***
-0.029 (0.017)*
7.860 (8.583)
Main parent has disability
-0.034 (0.015)**
-0.046 (0.014)***
-0.016 (0.015)
-0.030 (0.015)**
-1.970 (7.465)
Mother – University degree
0.333 (0.025)***
0.299 (0.023)***
0.303 (0.024)***
0.318 (0.025)***
89.468 (11.832)***
Mother – other Higher educ.
0.225 (0.024)***
0.257 (0.022)***
0.211 (0.023)***
0.216 (0.024)***
50.680 (11.952)***
Mother senior high school gr.
0.194 (0.023)***
0.216 (0.022)***
0.199 (0.023)***
0.148 (0.023)***
37.695 (12.133)***
Mother junior high school gr.
0.120 (0.020)***
0.146 (0.019)***
0.130 (0.020)***
0.067 (0.020)***
15.518 (11.195)
Mother has low qualification
0.015 (0.026)
0.024 (0.024)
0.036 (0.025)
-0.034 (0.026)
-9.850 (15.581)
Mother has other qualification
0.033 (0.038)
0.094 (0.035)***
0.076 (0.037)**
0.064 (0.038)*
41.881 (20.703)**
Male -0.073 (0.012)***
-0.130 (0.011)***
-0.029 (0.012)**
-0.072 (0.012)***
-16.872 (5.595)***
Single parent at birth -0.049 (0.017)***
-0.055 (0.016)***
-0.025 (0.017)
-0.041 (0.017)**
-27.793 (8.943)***
Mother younger than 20 at birth
-0.186 (0.026)***
-0.194 (0.024)***
-0.194 (0.025)***
-0.154 (0.026)***
-73.538 (17.073)***
Black -0.055 (0.027)**
0.009 (0.025)
-0.035 (0.026)
-0.051 (0.027)*
-35.044 (13.428)***
Asian 0.136 (0.022)***
0.120 (0.021)***
0.141 (0.022)***
0.188 (0.023)***
8.481 (9.586)
Mixed 0.088 (0.025)***
0.083 (0.023)***
0.083 (0.025)***
0.027 (0.025)
22.888 (11.735)*
Mother unemployed at wave 1
-0.082 (0.055)
0.043 (0.052)
-0.070 (0.055)
-0.034 (0.056)
-18.188 (31.112)
Mother out of the labour force at wave 1
-0.033 (0.015)**
-0.022 (0.014)
-0.052 (0.015)***
-0.008 (0.015)
16.021 (7.577)**
Single mother at wave 1
-0.067 (0.017)***
-0.034 (0.016)**
-0.082 (0.017)***
-0.070 (0.017)***
-11.575 (9.043)
Constant 0.407 0.551 0.432 0.338 231.888 (0.046)*** (0.043)*** (0.045)*** (0.046)*** (22.789)*** R2 0.22 0.23 0.20 0.17 0.13 N 5,572 5,572 5,572 5,646 2,278
Note: Standard errors are in brackets. * indicates that the underlying coefficient is significant at 10% level, ** at
5% and ***at 1%
44

. Table A2 Effect of other independent variables on high school performance and subjects’ choice - OLS Estimation Results from Model 2 - Cont.
A levels in Maths
A levels in Maths – Points
A level in Science A level in Science –Points
A level in English A level in English - Points
N. of facilitating subjects
HH income >31,200
0.055 (0.026)**
5.941 (3.333)*
0.048 (0.029)*
6.450 (4.704)
-0.011 (0.029)
0.673 (2.871)
0.179 (0.060)***
Income 11,400£ -31,200£
0.028 (0.025)
2.125 (3.226)
0.028 (0.028)
1.976 (4.552)
-0.034 (0.028)
-0.924 (2.779)
0.030 (0.058)
Birth weight 0.005 (0.017)
-0.725 (2.163)
0.014 (0.019)`
1.347 (3.053)
-0.018 (0.019)
-1.712 (1.864)
-0.002 (0.039)
Prem. birth -0.040 (0.032)
-3.573 (4.108)
-0.011 (0.036)
-2.052 (5.797)
-0.039 (0.036)
-3.511 (3.539)
-0.031 (0.0580
Has older siblings
-0.032 (0.009)***
-3.419 (1.188)***
-0.024 (0.010)**
-4.230 (1.677)**
0.002 (0.010)
0.039 (1.024)
-0.075 (0.021)***
Grandp. went to university
0.053 (0.026)**
5.195 (3.297)
0.072 (0.029)**
15.484 (4.653)***
0.029 (0.029)
4.382 (2.840)
0.156 (0.060)***
Child has disabilty
-0.006 (0.026)
0.761 (3.354)
-0.006 (0.029)
1.973 (4.733)
0.010 (0.029)
0.520 (2.889)
-0.046 (0.060)
Main parent has disability
0.008 (0.023)
2.701 (2.917)
-0.015 (0.026)
-1.783 (4.117)
0.007 (0.025)
0.603 (2.513)
0.020 (0.052)
Mother university degree
0.089 (0.036)**
15.928 (4.623)***
0.076 (0.041)*
25.115 (6.525)***
0.112 (0.040)***
12.049 (3.983)***
0.369 (0.084)***
Mother has other higher educ.
0.019 (0.037)
5.858 (4.670)
0.035 (0.041)
9.424 (6.591)
0.128 (0.041)***
11.755 (4.023)***
0.227 (0.084)***
Mother senior high school gr.
0.041 (0.037)
6.983 (4.741)
0.015 (0.042)
3.900 (6.691)
0.086 (0.041)**
7.554 (4.084)*
0.179 (0.085)**
Mother junior high school gr.
0.029 (0.034)
4.355 (4.375)
-0.002 (0.038)
1.354 (6.174)
0.090 (0.038)**
7.139 (3.769)*
0.116 (0.079)
Mother has low qualif.
-0.070 (0.048)
-5.092 (6.088)
-0.132 (0.053)**
-13.144 (8.592)
0.069 (0.053)
5.655 (5.245)
-0.097 (0.110)
Mother has other qualification
0.079 (0.064)
6.224 (8.090)
0.076 (0.071)
14.474 (11.417)
0.039 (0.071)
3.399 (6.969)
0.205 (0.146)
Male 0.128 14.531 0.076 6.616 -0.177 -16.369 0.015 (0.017)*** (2.186)*** (0.019)*** (3.085)** (0.019)*** (1.883)*** (0.040) Single parent at birth
-0.067 (0.028)***
-7.867 (3.494)**
-0.040 (0.031)
-8.043 (4.932)
0.011 (0.030)
-0.552 (3.010)
-0.239 (0.063)***
45

A levels in Maths
A levels in Maths – Points
A level in Science A level in Science –Points
A level in English A level in English - Points
N. of facilitating subjects
Mother younger than 20 at birth
-0.047 (0.053)
-8.777 (6.671)
-0.067 (0.059)
-8.378 (9.415)
-0.023 (0.058)
-1.944 (5.747)
-0.289 (0.121)**
Black -0.001 -3.246 -0.082 -15.650 -0.012 -0.508 -0.228 (0.041) (5.247) (0.046)* (7.405)** (0.046) (4.520) (0.095)** Asian 0.193 20.877 0.124 20.905 -0.041 -4.466 0.034 (0.029)*** (3.746)*** (0.033)*** (5.286)*** (0.033) (3.227) (0.068) Mixed 0.136 17.084 0.118 19.777 -0.070 -6.151 0.172 (0.036)*** (4.585)*** (0.040)*** (6.471)*** (0.040)* (3.950) (0.083)** Mother was unemployed at wave 1
0.074 (0.096)
5.547 (12.157)
-0.061 (0.107)
-10.961 (17.157)
0.191 (0.106)*
10.265 (10.473)
0.248 (0.220)
Mother was out of the labour force at wave 1
-0.008 (0.023)
0.143 (2.960)
0.036 (0.026)
6.342 (4.178)
0.023 (0.026)
2.203 (2.550)
0.051 (0.054)
Single mother at wave 1
-0.026 (0.028)
-4.283 (3.534)
-0.025 (0.031)
-4.283 (4.987)
-0.023 (0.031)
-1.737 (3.044)
-0.070 (0.064)
Constant 0.092 10.674 0.162 19.039 0.359 31.868 0.992 (0.070) (8.905) (0.078)** (12.567) (0.078)*** (7.671)*** (0.161)*** R2 0.08 0.08 0.06 0.07 0.06 0.05 0.08 N 2,278 2,278 2,278 2,278 2,278 2,278 2,278
Note: Standard errors are in brackets. * indicates that the underlying coefficient is significant at 10% level, ** at 5% and ***at 1%.
46