Embed Size (px)
Citation preview
The Effect of Ownership on Organizational Performance A Case Study of Banking Sector in Pakistan
Author: Muhammad Usman (740807-T095)
Supervisor: Prof. Eva Wittbom
Master’s Thesis in Business Administration, MBA programme
Date of submission: September 13, 2010

Abstract Aims:
The main aims of this research are to provide more empirical evidences for theory of property rights and public choice theory and to test these theories in a new environment i.e. banking sector of Pakistan. This research compares performance of public and private banks in Pakistan on the basis of four performance measures, profitability, liquidity, solvency and efficiency. It also studies the effect of politics on public banks.
Method:
Mainly quantitative approach is utilized in this thesis to compare performance of public and private banks in Pakistan in terms of profitability, liquidity, solvency and efficiency. Ratio analysis is used for this purpose. Qualitative analysis is based on qualitative study of empirical findings of quantitative analysis with respect to elections and observing lending behavior of public and private banks along with study of net interest margin during election years.
Major Findings:
The theory of property rights and public choice literature support private ownership for superior performance as compared to public ownership. From empirical findings, very weak support is found for both theories.
Out of twelve ratios used in ratio analysis, ten ratios support public ownership for superior performance as compared to private ownership and only two ratios quote that private ownership is superior in performance than public ownership. From empirical findings it can be concluded that performance of public banks is superior to private banks in Pakistan in terms of profitability, liquidity, solvency and efficiency.
Similarly, out of twelve ratios, only six ratios provided evidence of effect of elections on performance of public ownership which is a weak support for public choice theory. Moreover, lending behavior of public and private banks along with study of net interest margin has totally ruled out the presence of political influence on public banks. It can be concluded from these empirical findings that either political influence on public banks is minimized or political influence is affecting both sectors of banks in Pakistan.
As banking sector in Pakistan is highly competitive now due to introduction of financial reforms in Pakistan, it can be concluded that theory of property rights and public choice theory do not work well in competitive markets especially Pakistan.
It can also be concluded from empirical findings that privatization is not the only solution to poor performance of public ownership. The introduction of competition can substantially improve performance of public ownership.
Keywords:
public versus private, theory of property rights, public choice theory, public versus private banks.
2

Acknowledgement
First and foremost, I would like to express my sincere gratitude to Allah Almighty for blessing me courage, potential and energy to work on this master thesis. The achievement of this thesis is through the contributions of many people to whom I would like to show my appreciations. I would like to convey my sincere gratefulness to the following
First, I wish to thank to my supervisor Prof. Eva Wittbom for giving me an opportunity to work on this interesting topic and for providing me comments, constructive ideas, suggestions and guidance during the whole course of this thesis process.
I would like to express my special thanks to Prof. Dr. Iqbal S. Hussain (Cambridge University, UK) and Prof. Mirza Muhammad Zubair Baig (FG College Sihala, Islamabad) for helping me in thesis drafting and proof reading.
I am also grateful to Mr. Muneer Islam Quereshi (Lahore Stock Exchange) and Prof. Dr. Asrar Ahmad (Education University, Lahore) for helping me in data collection. I am also thankful to the operational team at Samba Bank Gujranwala branch, Mr. Muhammad Afzal, Mr. Ali Raza, Mr. Muhammad Rehman and Mr. Moazzam Farooq for helping me in methodology section.
Many thanks should go to the Principal of my college, Prof. Dr. Muhammad Afzal Johar (Federal Govt. College Sihala, Islamabad) for his invaluable guidance and for awarding me special relaxation from college duties during the thesis process.
My appreciations should also go to my close friends, Munawar Saleem (Jonkoping, Sweden), Mazhar Tajammal Hashmi (Vaxjo, Sweden), Emma Johansson (Gotenberg, Sweden), Prof. Dr. Munir Ahmad (FG College Sihala, Islamabad) and Prof. Syed Muhammad Khalid Imran (IMCB College F-7/3, Islamabad) in providing me motivation, support and enthusiasm during the whole thesis process.
In the end, I am immensely indebted to my family members for giving me support, co-operation, and encouragement and for showing patience during this thesis.
Muhammad Usman
MBA student
School of Management,
Blekinge Institute of Technology,
Sweden.
August, 2010
3
Table of Contents
CHAPTER 1: Introduction --------------------------------------------------------------------------12
1.1 Background: --------------------------------------------------------------------12
1.2 Research Questions: -----------------------------------------------------------14
1.3 Methodology--------------------------------------------------------------------14
1.4 Significance of Research: -----------------------------------------------------15
1.5 Aims and Objectives: ----------------------------------------------------------15
1.6 Beneficiaries of Research: -----------------------------------------------------15
1.7 Limitations of Research: ------------------------------------------------------16
1.8 Structure of Thesis: Chapters -------------------------------------------------16
1.8.1 Introduction: ------------------------------------------------------------------16
1.8.2 Overview of Financial Reforms in Pakistan: -----------------------------16
1.8.3 Literature Review: -----------------------------------------------------------16
1.8.4. Research Methodology: ----------------------------------------------------16
1.8.5 Analysis and Empirical Findings: -----------------------------------------16
1.8.6 Conclusions and Recommendations: -------------------------------------16
CHAPTER 2: Overview of Financial Reforms in Pakistan -----------------------------------17
2.1 Introduction: --------------------------------------------------------------------17
2.2 Financial Sector Reforms in Pakistan: --------------------------------------17
2.2.1 Financial Sector Liberalization: -------------------------------------------18
2.2.2 Non-Banking Financial Institutions (NBFI): ----------------------------19
2.2.3 Privatization: -----------------------------------------------------------------19
2.2.4 Regulatory Reforms: --------------------------------------------------------19
4

2.2.5 Prudential Regulation Reforms---------------------------------------------19
2.2.6 Payment System Reforms: ------------------------------------------------20
2.2.7 Capital Market Reforms: --------------------------------------------------20
2.3 Effect of Financial Reforms: ------------------------------------------------20
CHAPTER 3: Literature Review -------------------------------------------------------------------21
3.1 Ownership: ---------------------------------------------------------------------21
3.2 Performance: -------------------------------------------------------------------21
3.2.1 Past Periods: -----------------------------------------------------------------21
3.2.2 Similar Businesses: ---------------------------------------------------------21
3.2.3 Planned Performance: ------------------------------------------------------22
3.3 Theory of Property Rights: --------------------------------------------------22
3.3.1 Property Right: Definition: ------------------------------------------------22
3.3.2 Types of Property Rights: -------------------------------------------------22
3.3.3 Characteristics of Property Rights: ---------------------------------------23
3.3.4 Property Right Systems (Forms of Ownership): ------------------------23
3.3.5 Effect of Property Right Systems on Efficiency: -----------------------24
3.4 Factors Responsible for Differential Performance: -----------------------26
3.4.1 The Effect of Incentives: --------------------------------------------------26
3.4.2 The Effect of Politics: ------------------------------------------------------27
3.4.3 The Effects of Job Characteristics and Organizational Climate: ------29
3.4.4 The Effect of Competition and Regulation: -----------------------------30
3.5 Comparing Public versus Private Performance: Evidences --------------32
5
3.6 Preferences for Public and Private Ownership: ----------------------------33
CHAPTER 4: Research Methodology -------------------------------------------------------------35
4.1 Research Philosophy: ---------------------------------------------------------35
4.2 Research Approach: -----------------------------------------------------------35
4.3 Research Strategy: -------------------------------------------------------------35
4.4 Sample Selection: --------------------------------------------------------------36
4.5 Data Collection: ----------------------------------------------------------------36
4.6 Quantitative Analysis: ---------------------------------------------------------37
4.6.1 Profitability Ratios: ----------------------------------------------------------37
4.6.2 Liquidity Ratios: -------------------------------------------------------------38
4.6.3 Solvency and Risk Ratios: -------------------------------------------------39
4.6.4 Efficiency or Activity Ratios: ----------------------------------------------39
4.7 Determination of Political Influence: ---------------------------------------40
CHAPTER 5: Analysis and Empirical Findings -------------------------------------------------41
5.1 Profitability Ratios: ------------------------------------------------------------41
5.1.1 Return on Assets (ROA): --------------------------------------------------41
5.1.2 Return on Equity (ROE): ---------------------------------------------------42
5.1.3 Yield on Earning Assets (YOEA): ----------------------------------------43
5.2 Liquidity Ratios: ---------------------------------------------------------------44
6

5.2.1 Cash to Deposit Ratio (CDR): ---------------------------------------------44
5.2.2 Loan to Deposit Ratio (LDR): ---------------------------------------------45
5.2.3 Loan to Asset Ratio (LAR): ------------------------------------------------46
5.3 Solvency and Risk Ratios: ----------------------------------------------------48
5.3.1 Debt-Equity Ratio (DER): --------------------------------------------------48
5.3.2 Debt to Total Asset Ratio (DTAR): ---------------------------------------49
5.3.3 Equity Multiplier (EM): ----------------------------------------------------50
5.4 Efficiency or Activity Ratios: ------------------------------------------------51
5.4.1 Asset Utilization (AU): -----------------------------------------------------51
5.4.2 Income Expense Ratio (IER): ---------------------------------------------52
5.4.3 Operating Efficiency (OE): ------------------------------------------------53
5.5 Lending Behaviour of Banks: -----------------------------------------------54
5.6 Empirical Findings: ----------------------------------------------------------55
CHAPTER 6: Conclusions and Recommendations --------------------------------------------57
6.1 Conclusions: -------------------------------------------------------------------57
6.2 Recommendations: ------------------------------------------------------------57
References: ----------------------------------------------------------------------------------------------58
7

List of Tables Table-4.1: Sample Pairs----------------------------------------------------------------------36
Table-5.1: Return on Assets-----------------------------------------------------------------42
Table-5.2: Return on Equity-----------------------------------------------------------------43
Table-5.3: Yield on Earning Assets--------------------------------------------------------44
Table-5.4: Cash to Deposit Ratio-----------------------------------------------------------45
Table-5.5: Loan to Deposit Ratio-----------------------------------------------------------46
Table-5.6: Loan to Asset Ratio--------------------------------------------------------------47
Table-5.7: Debt-Equity Ratio----------------------------------------------------------------49
Table-5.8: Debt to Total Asset Ratio-------------------------------------------------------50
Table-5.9: Equity Multiplier-----------------------------------------------------------------51
Table-5.10: Asset Utilization----------------------------------------------------------------52
Table-5.11: Income Expense Ratio---------------------------------------------------------53
Table-5.12: Operating Efficiency-----------------------------------------------------------54
Table-5.13: % increase or decrease in lending-------------------------------------------55
Table-5.14: Overall comparison of public and private banks---------------------------56
8

List of Figures Figure-5.1: Return on Assets---------------------------------------------------------------------42
Figure-5.2: Return on Equity---------------------------------------------------------------------43
Figure-5.3: Yield on Earning Assets------------------------------------------------------------44
Figure-5.4: Cash to Deposit Ratio---------------------------------------------------------------45
Figure-5.5: Loan to Deposit Ratio---------------------------------------------------------------46
Figure-5.6: Loan to Asset Ratio------------------------------------------------------------------47
Figure-5.7: Debt-Equity Ratio-------------------------------------------------------------------48
Figure-5.8: Debt to Total Asset Ratio-----------------------------------------------------------49
Figure-5.9: Equity Multiplier---------------------------------------------------------------------50
Figure-5.10: Asset Utilization--------------------------------------------------------------------52
Figure-5.11: Income Expense Ratio-------------------------------------------------------------53
Figure-5.12: Operating Efficiency---------------------------------------------------------------54
Figure-5.13: % increase or decrease in lending------------------------------------------------55
9

List of Appendices
APPENDIX A: Websites of Banks under study------------------------------------------64
APPENDIX B: Description of Financial Ratios’ Variables-----------------------------65
APPENDIX C: Ratio Analysis of Individual Banks-------------------------------------66
APPENDIX D: Lending Behaviour of Individual Banks--------------------------------69
10

Abbreviations
ABL Allied Bank Limited
AU Asset Utilization
BSAL Banking Sector Adjustment Loan
CDR Cash to Deposit Ratio
CEO Chief Executive Officer
CIA Central Intelligence Agency
CLA Corporate Law Authority
DER Debt Equity Ratio
DFI Development Financial Institution
DTAR Debt to Total Assets Ratio
EM Equity Multiplier
HBL Habib Bank Limited
IER Income Expense Ratio
IMF International Monetary Fund
LAR Loan to Asset Ratio
LDR Loan to Deposit Ratio
MCB Muslim Commercial Bank
NBFI Non-Banking Financial Institutions
NBP National Bank of Pakistan
OE Operating Efficiency
SBP State Bank of Pakistan
SECP Securities and Exchange Commission of Pakistan
YOEA Yield on Earning Assets
11
CHAPTER: 1
Introduction
1.1 Background: The banking sector in Pakistan is growing more competitive due to huge wave of privatization started in the 90s, liberalization of financial market, growth in number of new banks in the market, tightening of prudential regulations and entry of foreign investment in this sector. Now, 80 % of system assets are in hands of private banks as compared to 10 % in 1990. Due to introduction of these financial reforms, efficiency is greatly improved by public banks, private banks and newly privatized banks in Pakistan (di Patti & Hardy 2005). In view of intense competition in the sector, performance of banks and factors affecting it are now of great concerns to researchers and practitioners. One of these factors is form of ownership. Ownership gives control and bargaining power to owners to use strategies that are beneficial to them (Grossman & Hart 1986; Hart & Moore 1990; Hart 1995). Ownership affects the choice of property rights assignments, political influence, organizational climate and job characteristics leading to different business practices and strategies which in turn are responsible for differential performance of ownership forms. Most important theories that study the effect of different ownership forms on organizational performance are theory of property rights and public choice theory.
The theory of property rights evaluates the effect of ownership forms on organizational performance on basis of property rights assignments to decision makers and incentives derived from those property rights. According to this property rights theory, property rights in private ownership are fully assigned to decision makers while in public ownership, the assignment of property rights to decision makers is partial which leads to poor performance as compared to private ownership. Consequently property rights theory suggests that public organizations should be less efficient and less profitable than private organizations (Carroll 2004).
Public choice theory studies the effect of politics on public organizations. This theory presents the view that public organizations are controlled by politicians and bureaucrats who use these organizations for their personnel benefits and as a result efficiency of public organizations is less as compared to private organizations because it is costly for politicians to influence private organizations (Shleifer & Vishny 1994).
Vast evidences are found in literature about political influence on public organizations. It is observed that politicians use strategy of excess spending to increase their political support. Political influence on public organizations is more pronounced near the elections. Micco, Panizza & Yanez (2005) found that public banks have lower profitability than private banks and differential performance of public and private banks widens during election year in developing countries. Dinc (2005) studied bank level data of 36 countries and found that lending behaviour of banks is affected by the elections. He further proved that public banks increase their lending near the elections relative to private banks. Sapienza (2004) observed
12

that lending behaviour of banks is changed with electoral results of political party affiliated with the banks in Italy. It is concluded from these evidences that during the election year, performance of public organizations is poor than private organizations.
In addition to property rights assignments and political influence, there are number of competing factors that are also responsible for differential performance of public and private organizations but all these factors are also linked with ownership forms. These factors are sources of funding and market exposure, complexity within organizations, fuzziness of owner’s identity and job security.
Both public and private organizations differ in their sources of funding and market exposure. Private organizations depend on market sources for their funding which award them incentives and penalties to meet market demands while public organizations mostly receive funding by appropriation process which can be influenced by political forces. In private organizations, environment is competitive and dynamic with profit maximization as the only objective. So they develop efficient strategies to meet market and customer demands. While public managers follow status-quo and have number of competing and ambiguous goals to meet (Rainey, Backoff & Levine 1978). Consequently efficiency of public organizations is less than private organizations.
Agency issues also affect performance of both public and private organizations. Agency issues are dominant in those private organizations that are controlled by managers and absent in owners’ controlled private organizations (Boardman & Vining 1992). Agency issues in public organizations are present between politicians and bureaucrats and arise due to lack of accountability (Whitehead 1988). So, agency issues affect performance of both public and private organizations to same or lesser extent.
Another factor that affects performance of public and private organizations is job security. It is less likely that employees having secured jobs will involve in corruption than employees with temporary jobs (Landes & Posner 1975). This factor supports public organizations more than private organizations because job security is higher in public organizations than private organizations.
In addition to these factors there is another driver of performance. It is competition that also has effect on performance of both types of organizations but extent of its effect on performance of ownership is debatable in literature. One group of scholars is of the view that competition is more important indicator of performance than ownership of organizations. When competitive product markets are normatively appropriate i.e. there is no product markets failure then ownership does not matter. Second group of scholars argue that although competition affects performance of organizations but ownership still matters. Public organizations perform poor than private organizations in competitive markets. Competition just moderates the relationship between ownership and performance (Boardman & Vining 1992).
In connection with these conclusions presented by literature, researchers have presented different alternatives to cope with poor performance of public ownership. One of these alternatives suggested by researchers is privatization. But this alternative works well in competitive environment. It is observed that state-owned enterprises that were privatized in noncompetitive environment did not show any improvement in returns on sales. However,
13

improvements were dramatic where privatization was carried in a competitive environment. So researchers suggested that introduction of competition can substantially improve efficiency of public organizations (Megginson, Nash & van Randenborgh 1994). Further, some researchers suggested that by assigning residual rights of public organization to tax paying public, efficiency of public organizations can be improved (Carroll 2004).
Before reaching to alternatives for poor performance of public ownership, it is advisable to understand the objectives of public and private ownership. Private ownership has only objective of earning profit while public ownership also have developmental mandate or social goals to meet in addition to earn profit. These social goals and developmental mandate are also responsible for poor performance of public ownership as compared to private ownership because these are not included in the financial statements which are commonly used to measure performance of these ownership forms (Stiglitz 1994). It means that public ownership should not be totally ruled out as there are some situations where public ownership should be preferred over private ownership (Shleifer 1998).
Both theories cited above clearly support private organizations for superior performance as compared to public organizations. However, when literature was reviewed, equivocal results were found. Some studies favour public organizations while rest of them favour private organization for superior performance. It means that these theories require more rigorous testing in order to reach generalization. In order to test these theories, the conclusion statement put forward by both these theories i.e. private organizations are superior in performance than public organizations is taken as hypothesis by this research to test this hypothesis in banking sector in Pakistan.
1.2 Research Questions:
The selected hypothesis is tested by answering following research questions.
• Out of public and private banking sectors in Pakistan, which sector show superior performance in terms of profitability, liquidity, solvency and efficiency?
• How much the elections affect the differential performance of public and private banks in Pakistan?
• How much lending behaviour of public banks has undergone a change during election years?
1.3 Methodology: This study is carried out in controlled environment so that reliable results are obtained in the context of effect of ownership. Industry factor is controlled as all the samples belong to banking sector. In order to control factors of bank size and banking experience, banks of similar size (number of branches) and history (number of years in local financial market) are selected. In order to remove the effect of privatization, those banks are selected that are within their respective sector for the last at least five years. Country factor is also controlled as all sample
14

banks are domestic banks in Pakistan. Due to control of country factor, all the sample banks are facing similar competitive forces.
For answering first research question, ratio analysis (12 ratios in total) is used to measure performance of public and private sector banks (of comparable size and history) on the basis of four performance measures i.e. profitability, liquidity, solvency and efficiency. First research question provides empirical evidence for property rights theory and public choice theory.
Second research question is answered by observing the effect of elections on all the twelve ratios obtained from ratio analysis in first research question. For third research question, it is observed if there is any abrupt change in lending behavior of public and private banks along with study of net interest margin just before the elections. Second and third questions study the effect of politics on performance of public banks and provide empirical evidences for public choice theory.
1.4 Significance of Research:
In Pakistan, many studies have carried out to measure comparative performance of banks but most of them are in context of effect of financial reforms, pre- and post-privatization performance or between Islamic and conventional banking. No study has found yet on comparative performance of banks in context of effect of ownership forms. Most of the previous studies in the area of comparative performance of public and private ownership did not show any sign of control variables. As current research is carried out in controlled environment so it will be a useful addition to the bulk of literature.
Most of previous studies were conducted with use of Data Envelopment Analysis or Schocastic Frontier Analysis in area of comparative performance. This study preferred to use ratio analysis which is mostly used by bank regulators (Sabi 1996; Samad 1999; Spindler 1991) and those ratios are selected which are commonly used by bank regulators.
1.5 Aims and Objectives: The main aims and objectives of this research are to provide more empirical evidences for theory of property rights and public choice theory and to test theory of property rights and public choice theory in a new environment i.e. banking sector in Pakistan.
1.6 Beneficiaries of Research: The beneficiaries of this research are the existing and potential shareholders, bank depositors, and investors, experts of public policy, State Bank of Pakistan, Privatization Commission of Pakistan, Ministry of Finance, research students and bank managers.
15

1.7 Limitations of Research: This research is limited to only commercial and domestic scheduled banks in Pakistan. So microfinance institutions, the central bank, specialized banks, Islamic banks, domestic banks with foreign ownership and foreign banks are not included in this research.
1.8 Structure of Thesis: Chapters
1.8.1 Introduction:
In this chapter, detailed background to research topic, research questions, methodology, significance, aims and objectives, beneficiaries of this research along with limitations and at the end complete structure of whole thesis is presented.
1.8.2 Overview of Financial Reforms in Pakistan:
In this chapter, an overview of banking sector of Pakistan is presented along with brief summary of financial reforms introduced by the government and their effects on local financial market.
1.8.3 Literature Review:
In this chapter, relevant theories about comparative performance of public and private ownership are presented. Further, factors responsible for their differential performance are discussed. Finally, results of previous studies in same area are presented and situations are discussed where public or private ownership should be preferred.
1.8.4. Research Methodology:
In this chapter, research philosophy, research strategies and research approach used in this thesis are discussed. Then sample selection strategy, data collection methods and analytical techniques being used are duly presented.
1.8.5 Analysis and Empirical Findings:
In this chapter, analysis of data gathered is carried out and empirical findings are correlated with the literature.
1.8.6 Conclusions and Recommendations:
In this chapter, conclusions of empirical findings are presented. Then area for future researches closer to this research is highlighted.
16

CHAPTER: 2
Overview of Financial Reforms in Pakistan Pakistan is a densely populated country located in South Asia having 6th position in the world ranking of countries by population and 36th position in the world ranking of countries by area (CIA 2010).
2.1 Introduction: The financial sector of a country consists of those entities that are engaged in transactions involving financial instruments in money, capital and foreign exchange markets. This sector is strongly linked with other sectors of economy like external, real and fiscal sectors. Its role as an engine of economic growth has gained almost consensus among modern economists (Hanif 2003).
The financial sector of Pakistan consists of regulators, scheduled commercial banks, microfinance banks/institutions, specialized banks, modarabas (Islamic banking), development finance institutions and stock market. There are four public sector banks, twenty private banks, four specialized banks, five Islamic banks, seven foreign banks, seven microfinance institutions, and eight development finance institutions operating in Pakistan (State Bank of Pakistan 2010).
Earlier, the financial sector was mainly regulated by three organizations such as State Bank of Pakistan (SBP), Pakistan Banking Council and Corporate Law Authority (CLA). The SBP is central bank in Pakistan while Pakistan Banking Council was monitor of performance of nationalized commercial banks and CLA regulated equity market. Now SBP is given sole responsibility to regulate banking sector as Pakistan Banking Council was abolished in 1997. In order to regulate capital market, leasing and investment, a new organization was established in 2001 namely Securities and Exchange Commission of Pakistan (SECP). The SECP replaced CLA and became independent regulator (Hanif 2003).
2.2 Financial Sector Reforms in Pakistan: Financial sector reforms comprise a set of actions and guidelines to reduce distortions and developing a competitive price mechanism in financial markets. It includes structural and institutional changes spread over time. The sequence and intensity of financial reforms depend upon initial conditions of the economy.
The financial sector of Pakistan has gone through number of changes since 1990. These include liberalization of new bank opening policy which resulted into emergence of strong private banking sector in Pakistan, strengthened the role of controlling authorities such as SBP and SECP
17

and brought out financial sector reforms which changed ownership of banking from government-owned to private sector. Now share of government-owned banks is greatly reduced as compared to private banks.
The financial sector reforms took place in two stages, both on advice of International Monetary Fund (IMF) and World Bank. First stage was started in 1990 and second stage was started in 1997. The financial re-structuring process in Pakistan has mainly taken two steps: first step leads to strengthening of financial institutions and second step leads to the development of an efficient and competitive financial market.
In order to improve efficiency of financial sector, government took initiative to start macroeconomic and financial sector restructuring program in 1997. International donors such as International Monetary Fund (IMF), World Bank and government of Japan provided technical support and banking sector adjustment loan (BSAL). Main objectives of this program were to enhance the recovery of non-performing loans, retrenchment of surplus staff, closure of over-extended branches, privatization of banks, introduction of international accounting standards, strengthening of prudential regulations and establishment of banking courts. The main focus was to improve efficiency of government-owned banks by reducing cost, completing privatization of banks, liberalizing bank branching policy, reduction in taxes, integrating of national savings scheme to the financial market, removing mandatory placement of foreign currency deposits by commercial banks, and strengthening role of central bank as an effective regulator of banking sector (Qayyum & Ahmed 2006). To achieve these goals, following measures were taken.
2.2.1 Financial Sector Liberalization:
There are numerous efficiency issues that are associated with government ownership of financial institutions. At time of independence of Pakistan i.e. 14 August 1947, Habib Bank Limited (HBL) was inherited to Pakistan as it was established in 1941 near Mumbai and shifted to Pakistan after the independence. On 1st of July, 1948, central bank of Pakistan (SBP) was established in partnership with government and private sector. After one year, government set up a fully government-owned bank namely National Bank of Pakistan (NBP). The banking sector in Pakistan has been dominated by government-owned banks which had accommodated the financial needs of public, government and private sectors (Khan 1995).
In 1974, Government of Pakistan adopted nationalization policy and nationalized all banks operating in market with elimination of private sector and directing credit resources to high priority sectors of the economy. The branch network of nationalized commercial banks proliferated in all regions and territories in order to provide banking services to all areas without taking into account feasibility and viability of such expansion. The bureaucratic control of nationalized banks along with lack of healthy competition rendered banking services highly inefficient and removed accountability mechanism in the sector. The dominance of government-owned banks in financial sector led to poor efficiency in the banking sector (Ul-Haque 1997). Moreover, regulatory mechanism of banking operations was also weakened due to multiple regulatory authorities like SBP and Pakistan Banking Council. Nationalization policy led to poor performance of government-owned banks and forced the government to revise its nationalization policy.
18

Consequently, the nationalization act of 1974 was amended in 1991. In first step, twenty three banks were allowed to operate. Out of these, ten banks belonged to domestic private sector while rests were of foreign sector (Hanif 2003).
2.2.2 Non-Banking Financial Institutions (NBFI):
To increase competition in credit market, a number of non-banking financial institutions were allowed to operate. Currently, more than 100 NBFIs are operating in Pakistan. On the other hand, to increase efficiency, mergers and amalgamations are also encouraged (Hanif 2003).
2.2.3 Privatization:
Privatization of government-owned banks was started to enhance competition and efficiency in the banking sector. In first stage, two government-owned banks namely Muslim Commercial Bank (MCB) and Allied Bank Limited (ABL) were privatized. The process of privatization took two years. First, 26 % shares of both MCB and ABL were offered to private sector followed by delivery of 49 % shares of MCB to private sector in 1993 along with control rights. In 1993, 25 % shares of ABL were sold to Employee Management Group along with control rights. Habib Credit & Exchange Bank was fully privatized in 1996. 10 % shares of NBP were sold through stock market. United Bank Limited (UBL) was privatized in 2002 and HBL was privatized in 2003.
Now, there are four government-owned banks operating in Pakistan as compared to twenty private banks. It is also observed that newly privatized banks have improved efficiency after privatization. So, financial sector reforms are successful in improving efficiency of domestic commercial banks (Hanif 2003).
2.2.4 Regulatory Reforms:
The State Bank of Pakistan revised its role as bank regulator in 1993 and advised commercial banks to set quarterly recovery targets, submit their progress reports and develop strategies to re enhance future recovery program. In 1997, the SBP took another step by revising its disclosure standards and directed commercial banks to submit their annual accounts on a new format as per with international accounting practices. The SBP adopted new standards to monitor performance of operating banks which was CAMELS (i.e. capital adequacy, asset quality, management, earnings, liquidity and sensitivity to market risk).
Further, by implementing reforms in 1997, the Government of Pakistan amended two important banking laws such as Banking Companies Ordinance (1962) and the SBP Act (1956). Now, Chief Executive Officer (CEO), board members of all nationalized banks and Development Financial Institutions (DFI) have to be appointed and fired with approval of SBP. In order to enhance SBP’s role as bank regulator, SBP was divided into three units i.e. the SBP as a central bank, SBP-Banking Services Corporation and National Institute of Banking and Finance (Hanif 2003).
19
2.2.5 Prudential Regulation Reforms:
Prudential regulations are essential to safeguard interests of ultimate user of services as well as viability of service provider. In order to ensure a sound and viable financial system, the SBP issued new prudential regulations dealing with lending operations of banks and NBFIs. The prudential regulations described risk exposure limits, criteria for management, rules for paying dividends and rules to check money laundering and other unlawful activities. The capital adequacy requirements along with five other aspects of CAMELS were enforced in line with Basel committee recommendations (Hanif 2003).
2.2.6 Payment System Reforms:
The health of a financial system depends on an efficient, reliable and rapid payment system. Payments system consists of rules & regulations, standards, institutions, and technical means of exchanging financial values between two subjects. Previously, in Pakistan there was a manual system for transactions. In 1996, an organization, National Institution Facilitation Technology, was established to replace old payment system by automation of cheque clearing with help of private sector (Hanif 2003).
2.2.7 Capital Market Reforms:
As a part of liberalization process, capital market was opened to foreign investors in 1990s. To develop an efficient and orderly market for corporate business, a credit rating agency, PACRA was established in 1994 as a joint venture between International Finance Council, IBCA limited of United Kingdom and Lahore Stock Exchange. In 1994-95, a Central Depository Company was formed to start paperless trading in stock exchange. It facilitated the transfer of stock ownership and reduced paperwork for brokerage houses, custodian banks and other financial institutions and reduced the risk of duplication of securities, forgeries, damages and loss of securities.
In 1997, Government took another step to strength the capital market and formulated a capital market development program with help of Asian Development Bank. The main purpose of this program was to enhance competition, strengthening governance, modernizing market infrastructure and its linkages, developing corporate debt market, reforming mutual fund industry, developing leasing industry and promoting contractual savings through reforms of insurance sector and pension funds (Hanif 2003).
2.3 Effect of Financial Reforms: As the result of these financial reforms, the banking sector in Pakistan has converted into a highly competitive market with dominance of private sector. The efficiency has greatly improved due to these reforms by public banks, private banks and newly privatized banks (di Patti & Hardy 2005).
20
CHAPTER: 3
Literature Review
3.1 Ownership: Ownership implies to legal right of possession. Owner is a person who has two formal rights: right to control firm and to take residual earning (net income after paying all obligations) of the firm.
The term formal is used due to fact that formal (legal) control does not mean effective (economic) control. In case of sole proprietorship, a person can have full control right and full residual right which leads to full ownership (Hansmann 2000). But in case of corporations, shareholders have formal control while effective control lies in hands of managers. In complex organizations, usually, a person does not have both control and residual rights which leads to principal-agent problems in corporations (Fama & Jensen 1983). Some firms do not have owners as in case of nonprofit organizations in which no one can take the residual earnings (Hansmann 2000).
3.2 Performance: Performance is defined as organization’s ability to achieve its objectives in a resourceful manner with consistency without seeking purpose of analysis. If analysis or measurement is carried out too often then it will consume more resources and become counter productive (Stainer 2006).
Measurement of performance alone does not provide any useful information about organization until it is carried out in relation to some benchmark. Without benchmark it cannot be determined that whether performance of organization is good, bad or indifferent.
Following benchmarks are commonly used in performance measurement (Atrill & McLaney 2006).
3.2.1 Past Periods:
By comparing performance of an organization with previous years, it can be deduced that performance of organization is improving or deteriorating. Problem can occur by selecting past periods as benchmark as some industries have business cycles. So performance can be improved or deteriorated due to these business cycles and it is difficult to exclude effect of business cycles from performance. So in this case results of performance measurement will not be reliable.
21

3.2.2 Similar Businesses:
In a competitive environment, businesses are usually compared with other businesses of similar industry. In this way problem of business cycles is removed. Some problems still can occur as different businesses have different accounting policies and different year’s ends. In current research, similar business benchmark is taken, as this research is going to compare public versus private banks. All banks in Pakistan have similar accounting policies and similar year’s ends. So whole of literature review, empirical findings study performance of one ownership in comparison to other ownership.
3.2.3 Planned Performance:
Performance can be measured with targets that management developed before start of period under review. But in order to get useful results; planned level should be based on realistic assumptions.
Now in order to study the effect of ownership on performance of organizations, theory of property rights is discussed here.
3.3 Theory of Property Rights: The theory of property rights was developed by works of Coase (1937, 1960), Alchian (1987), Demsetz (1964, 1966, 1967) and Furubotn & Pejovich (1972, 1974). The theory of property rights is based on fact that incentives direct economic behavior of individuals and organizations. If decision maker has ability to gain return of most efficient decision, then he considers every decision alternative, compares net gain from each decision alternative and chooses the decision which produces highest net gain. Thus the incentives that direct behavior of decision maker are derived from property rights of the decision maker.
The theory of property rights consists of three parts. In first part, concept of property right and its types are defined. In second part, different alternative property right systems (forms of ownership) are explained. And in third part, assignment of rights in each property rights system (form of ownership) is examined and their effect on efficiency of resource utilization is studies (Carroll 2004).
3.3.1 Property Right: Definition
Property right is defined as ability to obtain return or potential reward from a resource, to use or modify a resource (Furubotn & Pejovich 1972, 1974).
3.3.2 Types of Property Rights:
The property right, holder of which has ability to obtain return or potential reward from a resource is termed as residual right. The property right, holder of which has ability to use or modify a resource is called control right (Carroll 2004).
22

3.3.3 Characteristics of Property Rights:
Property rights are usually defined by social laws and regulations but also sometimes, by social traditions and customs (Furubotn & Pejovich 1972, 1974; Demsetz 1967). Following are most important characteristics of property rights,
• How clearly the rights are defined.
• Exclusivity of the rights.
• Transferability of the rights.
A clearly defined property right sets the limits to which a resource can be used or modified. The value of property right is affected by clarity of its definition. Clarity of its definition can increase or decrease value of property rights depending upon property right in question and form of clarification. For example, zoning regulations in a real estate sector may allow owner of the real estate to rent his property only to single family or tenant but not to multiple tenants. This regulation can decrease potential rental income. But on the other side, it can increase or maintain neighborhood quality and potential resale value. It will improve value of property right.
The second characteristic of property rights is exclusivity which usually increases value of property rights as it allows only to owner of exclusive rights to use them, while prohibiting others. However, restrictions can be imposed on exercise of exclusive property rights. For example, equal opportunity regulations can limit ability of owner of a real estate to sell his property to certain race, religion or gender.
The third characteristic of property rights is transferability. This characteristic allows owner of property right to obtain return from the resource either fully by selling it or partially by leasing the rights. Restrictions can be placed on transferability of property rights by regulations. For example, a restriction can be imposed on inherited property of a heir for a certain period of time for selling and using; thus, limiting his control and residual rights (Carroll 2004).
3.3.4 Property Right Systems (Forms of Ownership):
Property right systems (Forms of Ownership) are developed by different configurations of control rights and residual rights with variations on characteristics of these rights. The configuration of rights is an assignment of property rights. There are three general property right systems:
• Private property right system.
• State property right system.
• Public or communal property right system.
In private property right system, both control rights and residual rights are assigned to individuals or organizations. For example, a land can be sold to individuals, families and to organizations. In private property right system, owner has both control rights and residual rights. He can exercise his control rights by using or modifying the property through development. He
23

can exercise his residual right by selling or leasing the property. However, regulations can reduce exercise of residual and control rights. For example, zoning regulations can prohibit specific uses of the resource, altering the control rights. Tax authorities can increase residual gain (via tax credit for preservation or certain kind of development) or decrease the residual gain obtained from the resource (by imposing tax on return from the resource).
In state property right system, both control rights and residual rights are assigned to government or state. This type of property rights system existed in former Soviet Union and can be observed today in China and North Korea. Other examples of state property right system are US federal lands, toll highways, state and municipal parks, embassies, nationalized industries and other government buildings. State ownership is not same as public ownership. In state property right system, state is granted exclusive rights to a resource and state can limit access of public to the resource. For example, state can limit public access to military bases or federal lands by putting restrictions on commercial activities. In this right system, state is also granted transferability right. So government can sell or lease a government property (Carroll 2004). Chinese state property right system allows central government to distribute input to industrial enterprises and set targets for output and profit for them (He 2002).
In public property right system, control rights and residual rights are assigned to all members of community. It is a pure public ownership. It is an open system with lack of exclusivity. In public property right system, exclusive rights are not assigned to any individual, to any organization or even to state. So this property right system is considered as nonprofit. The examples of public property right system are waterways, public roads and ocean fisheries beyond internationally agreed limits (Carroll 2004).
Technically public property right system is very close state property right system but has a clear demarcation. The best example that can be presented here is of public parks. State or local government develops these parks for welfare of general public. State technically has capability to limit public access from using public parks by imposing fee for entrance. If this right is used by the state frequently then parks can be identified as state-owned property. If the state does not use this right then parks can be identified as public property (Alchian & Demsetz 1973). So the state and public property right systems differ by public access. Another example that can be presented here to differentiate between state and public property right system is the difference between the state and the government. The Queen of England represents the state while the Prime Minister of England represents the public. The main difference between these two designations is that public can elect the Prime Minister but cannot elect the Queen. So these two designations also differ by public access. Prime Minister is a political figure but Queen of England is a nonpolitical figure.
3.3.5 Effect of Property Right Systems on Efficiency:
Third part of property rights theory studies the effect of right assignments on behavior of decision maker, on resource allocation and on efficiency. This analysis is carried in context of neoclassical model of efficient market where there are no information problems; no transaction cost with perfect agent behavior and assumes that profit maximization is only objective of participants in the market (Furubotn & Pejovich 1972). In this model, every party who will be assigned rights will exercise these rights in order to increase its net wealth.
24

Under private property right system, in which individuals or organizations are assigned the rights, owner of the resource will invest the resource with objective of neoclassical profit maximization. So the private property right system promotes resource usage and exchange until the resource achieves its optimal value. Therefore, the private property right system along with individual profit maximization concept in a competitive market, promotes efficient allocation of resources in the economy (Demsetz 1966, 1967; Alchian 1987).
In state property right system, the state decides to invest in state-owned resources. The efficiency results will not be same as in private property right system. In private property right system, individual or organizational wealth maximization is followed, while in state property right system, wealth maximization of whole society is followed. This outcome would require that state’s decision making process should reflect and incorporate interests of all members of the society. This belief was basis for formation of Communist Party. However if state in the state property right system does not follow profit maximization principle for the society, economic efficiency in the state property right system will be far less than private property right system(Carroll 2004). In state property right system, mostly political objectives are pursued rather than profit maximization of whole society (Boycko, Shleifer & Vishny 1996). Due to these reasons, the state property right system is economically less efficient than private property right system. The evidences of this finding can be seen in recent Chinese movement from state-owned enterprises to a shareholding system (Milgrom & Roberts 1992; Jefferson & Rawski 1994).
Under the public property right system, residual rights and control rights to a resource are effectively unassigned. Due to lack of exclusivity and transferability of property rights in the public property right system, there will be minimum investment in common property resources. The reason is that every person or organization investing in public property right system is not sure of getting profit back and profit can go to a different person who cannot be excluded but who has made no investment. Another efficiency implication of public property right system is that it promotes overuse of resources. This overuse attempts will be made by a person who will achieve pioneer access to the resource. In public property right system we see ‘first come, first serve’ self interest behavior. So, lack of exclusivity in the public property right system leads to lower outcome of the resource. The examples of this behavior can be seen in over fishing in oceans, overgrazing in ranges and over harvesting in timber. These types of responses to public property right system reduce value of resource to the community leading to inefficient outcome (Carroll 2004).
The development of different property right systems and resulting efficiency of these property right assignments are highly related. Demstez (1967) has proved that decision to alter these property right systems depends upon cost and benefits of doing so. Altering a property right system is costly as it involves development of new laws and traditions that are acceptable to members of whole society. When value of a resource is changed by consumer preferences and market demands, value of changing a property right system is also changed. In this way, higher value of resource may be achieved which is greater than cost of altering the property right system.
If value of a resource in public property right system is increased then the public property right system can be evolved to the state property right system. This can be observed among national governments through treaties that assign coastal rights to protect ocean fisheries. Alternatively, the public property right system can be evolved to private property right system for protectionism. The example is provided by Demsetz (1967) of Northwest Indians fur trading activities to prevent excessive hunting of animals by outsiders. Resource value can also be
25

changed due to some exogenous effects. When value of resource decreases so much that enforcing a private property right system is more costly than its worth, private property right system can be evolved to public property right system. An example can be presented here of abandoned housing in urban areas where property values have significantly declined (Carroll 2004).
3.4 Factors Responsible for Differential Performance: As it is evident from the theory of property rights that public organizations are less efficient in resource utilization than private organizations, now different factors are discussed here which are linked with different ownership forms and are responsible for differential performance of public and private organizations.
3.4.1 The Effect of Incentives:
Property rights that include the right to control a resource and the right to get returns from a resource, provide basis for efficient decisions of individuals who have wealth maximization as only objective in their mind. Consequently, an individual or an organization that holds property rights will invest the resources in such a way to produce highest returns. There is an incentive to acquire a resource which may be productive and then develop the resource to get maximum production from that resource. Property rights thus establish incentives for efficient or inefficient use of the resource by individuals or organization that hold them. Incentives are derived from property rights while difference between incentives is evolved from different alternative property right systems. Mirrlees (1976) and Milgrom & Roberts (1992) have elaborated importance of level and intensity of the incentives. They have proved that by increasing intensity of the incentives, efficiency of decision maker can be improved.
The private property right system thus generates highest efficiency from decisions concerning investments in resources. The incentive to invest in and allocate resources is derived from ability to use or modify a resource or ability to get returns from a resource. The clear definition of these rights, their exclusivity and transferability are important characteristics of private property right system and generates efficient outcome.
In state property right system, decisions are not so efficient as compared to private property right system due to limited ability of state to fully articulate preferences of all members of society.
In public property right system, efficiency is further reduced due to lack of exclusivity and transferability of property rights. In neoclassical model, managers within an organization make decisions to promote interest of residual claimants of that organization. As residual claimants are either absent or least defined in public organizations so their efficiency is usually less than private organizations.
Whenever there is a violation in assumptions of neoclassical model, managerial decision making can be inefficient even in private organizations. For example, if residual claimant is absent in nonprofit private organizations, their efficiency can be lowered. On the contrary, if residual rights in public property right system are assigned to taxpaying public, then managerial decisions in public organizations would be efficient under condition of neoclassical model (Carroll 2004).
26

Another assumption of neoclassical model is profit maximization of individuals and organizations. As property rights are attenuated in nonprofit firms so decision maker cannot keep residual earning of the firm. Consequently efficiency of nonprofit firms is always less than profit seeking firms. If competitor’s entry is free then competition will lead to demise of nonprofit firms. But nonprofit firms exist for welfare of public due to two reasons. First, government regulations reduce cost advantage of profit seeking firms. Second, output of nonprofit firms is subsidized by charitable donations (by private parties or by government) (Frech III 1976).
3.4.2 The Effect of Politics:
The effect of politics on performance of public organization is the area of great interests to contemporary political economists particularly after the collapse of state ownership in former Soviet Union and concludes that public organizations perform poor than private organization.
There are two plausible explanations for poor performance of public organizations versus private organizations. First school of thought argues that public organizations have a social and developmental role which makes them socially profitable but financially unprofitable (Stiglitz 1994). Those who are critical to this thought are supporters of public choice theory and argue that public organizations are controlled by politicians who use them for their political objectives and as a result efficiency of public organizations is lowered than private organizations (La Porta, Lopez-de-silanes & Shleifer 2002).
Public Choice Theory studies economic behavior of non-market decision makers like politicians, voters and bureaucrats and assumes that man is an egoist, rational and utility maximizer (Mueller 1976) and consequently suggests that government ministers and civil servants have different goals than profit maximization and they exhibit individual utility maximizing behavior. They are involved in increasing their vote bank and achieving budget maximization objectives leading to waste and inefficiencies (Shleifer & Vishny 1994).
Politicians increase their vote bank and political support in number of ways which in turn lower performance of public organizations as compared to private organizations. Most commonly used strategy by politicians for this purpose is excess spending. Excess spending is used by politicians to increase their political support and usually favor friends of government. Lot of evidences about excess spending is found in literature. Studies using bank level data have found that lending behavior of banks is affected by political environment. Sapienza (2004) did a study on Italian banks and found that lending behavior of banks is affected by electoral results of political party affiliated with the bank. Khwaja & Mian (2005) found that public banks in Pakistan favor those firms that have politically connected directors in terms of more lending and higher default rate. Dinc (2005) used bank-level data of 36 countries and found that lending behavior of banks in emerging markets is affected by elections. Credit Lyonnais, a defaulting French bank, made worse loans to friends of ruling socialist party (Boycko, et al 1996).
Micco et al (2005) found that difference in performance of public and private banks widens during election year because public banks increase their lending for political influence. However, it is observed that lending behavior of public and private banks is not affected by elections in industrial countries. In industrial countries, public banks cease their developmental role and develop competing strategies with private counterparts while in developing countries public
27
banks continue to play developmental role and exhibit poor performance as compared to private banks.
Another strategy used by politicians to get political support and enhance vote bank is excess employment. Politicians care about people whose jobs are in danger because they have to take votes from people in future. In Public choice model, there exists an exchange between selfish public and selfish politicians. Public give votes to politicians who gain income, prestige and power which are linked with running government apparatus and in turn expect some social and economic benefits back from politicians especially the employment (Mueller 1976).
The politicians’ interest in excess employment is derived from pressure of potentially unemployed public and labor unions which enable politician to get votes away from other politicians (Boycko, et al 1996). British government for years refused to close highly inefficient coal mine operations to save miners’ jobs and subsidized these inefficient operations. The reason was that the miners’ union had significant power to bring down the government (Shleifer 1998). Donahue (1989) has proved it by providing data that publicly provided municipal services have higher employment per production unit in comparison to their private counterparts. Excess employment increases government popularity and reduces political instability.
Another negative effect of political patronage is depicted by Krueger (1990) who argued that public enterprises are pressurized to hire politically connected persons rather than qualified person which lead to poor performance of public organizations as compared to private organizations. Senior appointments in public sector are based on political patronage rather than merit which lead to low morale in ranks of technocracy in public organizations. Headships of public sector organizations are indiscriminately used as political sinecures. Efficient managers who fail to satisfy the politicians are transferred which leads to poor efficiency in public organizations (Bardhan 1984: 69-70). Mr. B.K. Nehru, a former Indian ambassador to United States has depicted the clear picture of political effects on performance of public organization by noting that public organizations especially in the United States are used to accommodate those powerful politicians, who cannot be made ministers, with salaries, perquisites, patronage and opportunities to make money through corruption (Marathe 1989: 184).
It is evident from the discussion that politics plays a negative role in the performance of public organizations as compared to private organization which leads to poor performance of public organizations as compared to private organizations but social and developmental role of public organization is ignored here as these roles do not appear in the balance sheet of organizations.
An alternative provided to reduce political influence on public organizations is privatization process which increases the cost for politicians to influence the public organizations because they have to give subsidies to private organization to remain inefficient which is politically harder to sustain than wasting profit of public organizations. So privatization enhances the efficiency of private organizations especially when it is mixed with tight monetary policy and new owner is a profit maximizing individual rather than an employee or a manager (Boycko et al 1996).
3.4.3 The Effects of Job Characteristics and Organizational Climate:
It is observed by literature study that there an essential difference exists between practices of public and private organizations in terms of job characteristics and organizational climate which
28

further has effect on relative performance of public and private organizations. The difference between public and private organizations evolves from their pattern of ownership and funding (Walmsley & Zald 1973).
Effectiveness of public and private organizations depends upon matching the internal organizational structure to demands of external task environment. So functioning in public and private organizations depends on different environmental contingencies that they have to adapt. For example, difference in these two sectors in their criteria of control and accountability, legal and political environment, funding and patterns of ownership has direct effect on the structure and practices in these two types of organization (Thompson 1962).
The main environmental factors that differ in these sectors are sources of funding and degree to market exposure (Lindblom 1977; Walmsley & Zald 1973). In private organizations, environment is competitive and dynamic with profit maximization as the only objective, which enforces managers to develop efficient strategies to meet market and customer demands. The dependence of private sector on market for resources provides the incentives and penalties that reinforce policies for cost reduction, effective performance and operating efficiency. Managers in public sector organizations usually follow status-quo, having multiple and ambiguous goals with funding through appropriation process which can be influenced by political forces (Rainey, Backoff & Levine 1978). Consequently efficiency of public organizations is lowered than private organizations.
In private organizations, managers are rewarded on the basis of their efficiency to meet the market demands while in public organizations, managers have multiple and competing goals to meet with additional constraints and lower priority is given to those policies that reward efficiency. Solomon (1986) provided evidence to it. He took interview of 240 top managers of different public and private organizations in Israel and concluded that performance based rewards and policies that promote efficiency are more prominent in private organizations as compared to public organizations. The largest difference found in these two sectors was in area of reward system. Rewards were not distributed on basis of performance in public organizations. The differences between two sectors were more significant in efficiency-related areas including improvement of methodology, task autonomy, and task clarity and reward orientation. Further, he concluded that satisfaction with jobs and organizational characteristics is higher in private organizations than public sector organizations. All these factors also support private ownership for superior performance in comparison to public ownership.
Another factor that affects efficiency of decision maker is degree of complexity within organization. In case of sole proprietorship and small partnership firms, the legal control rights and legal residual rights are usually in hands of same person which leads to efficient decision making. While in complex organizations, legal control rights are assigned to decision makers (managers) while legal residual rights are assigned to other parties (shareholders). Legal residual rights are less effective than legal control rights in decision making process as legal control rights are in hands of manager who makes decisions. This situation leads to agency issues within complex organizations as decision-makers start displaying utility maximizing behaviors (Carroll 2004).
Another organizational factor that affects comparative performance of public and private enterprises is fuzziness of owner’s identity. In private enterprises, there can be many owners-principals, so every owner shares cost of monitoring with others (Ben-Ner, Montias & Neuberger
29

1993). In public enterprises, owner is a government department represented by a single civil servant who can exercise full control. So, theoretically, performance of public enterprises should be better than private because ownership is not diffused among many owners. But government department, itself, is agency of citizens, who are the de-jure owners of public enterprises. In other words, the civil servant who is controlling public enterprise himself is an agent, monitoring other agents and has no incentives to meet their objectives. Citizens in a democracy neither have incentives nor have sufficient knowledge to influence public organizations. As a result, public ownership effectively becomes de-facto proprietorship by politicians and civil servants, while public managers feel themselves free of both market discipline and sanctions from ultimate principals. In this atmosphere, government decision making process is surrounded by special interest and pressure groups which pressurizes bureaucrats to direct government resources to their own special interests (Majumdar 1998). It can be observed that agency issues are also present in public organizations but these are usually between politicians and bureaucrats (Boycko, et al 1996). So agency issues affect performance of both public and private organizations.
One of the factors that affect performance of employees is job security. It is observed that employees having more secure jobs are more efficient than less secure job holders. Example can be presented here of American judiciary. It is observed that secured judges are less likely to involve in bribe taking than less secure job holders. The reason found is that bribe taking can lead to dismissal. If a secure job holder is caught by bribe charge, he loses more years of income than short tenure judge (Landes & Posner 1975). Job security is higher in public than private organization. So this factor favors public organizations for superior performance than private organizations.
3.4.4 The Effect of Competition and Regulation:
Competition has effect on performance of both public and private organizations to same or lesser extent. Competition aligns the behavior of managers in both public and private organizations. In public organizations, usually politicians are controlling the firm. Political competition results in socially efficient outcomes (Wintrobe 1987). Mueller (1989: 214) has more clarified the situation of political competition by stating that if voters reward those politicians who promise them more social and economic benefits then competition for votes between politicians will lead to efficient social outcome just similar by invisible hands. But political competition is not as efficient as market competition. First reason of it is that the interaction between politicians and public is not as efficient as economic competition (Mueller 1989:285). Second, Political competition is non price competition (Carroll 1990). In the similar way, managers in private firms also face competition pressure in the form of takeover bids and competition with others managers in the job market (Wintrobe 1987: 439).
Two different views are found in literature about the effect of competition on performance of ownership. First group of scholars who are supporters of argument ‘primacy of competition versus ownership’ has argued that competition in product markets is more important determinant of efficiency than ownership of organization. When competitive product markets are normatively appropriate i.e. there is no product markets failure then ownership does not matter. There is no difference in efficiency of public and private organizations. It is only the competition that drives performance of public and private organizations. The main argument put by these scholars is that agency issues are present in both public and private organizations. Agency issues arise in public organizations due to lack of accountability (Whitehead 1988). While in private organizations,
30
agency issues arise due to separation in ownership and control (Fama & Jensen 1983). So, there is inherently no reason to consider that private organizations are always superior in performance than public organizations.
Many evidences have been found in support of this argument. Many researchers have argued that even private organizations do not adopt strategies to improve performance in weakly competitive or in highly regulated industries (Kay & Thompson 1986). In weakly competitive markets, private organizations also behave like monopoly and management efficiency is not improved strongly (Grosse & Yanes 1998). So in weakly competitive market, public monopolies and private monopolies are both considered as inefficient (Vickers & Yarrow 1988; Kay & Thompson 1986). Some evidences are found that public and private organizations facing similar competitive environment do not show any efficiency difference (Caves & Christiansen 1980). For example, between public and private organizations facing sufficient competition without any discrimination regulations and subsidies, unit cost differences are insignificant (Borcherding, Pommerehne & Schneider 1982). With the increase in competitive rivalry, strategies to face competition become important for both public and private organizations. The competition in the market exerts pressure on public organizations to reduce cost and to remove discretionary behavior of bureaucracy and consequently public organizations can be more profitable than private organizations (Spann 1977).
It can be concluded here that the introduction of competition in product market can eliminate the need of privatization. This argument was supported by Megginson et al (1994). They witnessed that state-owned enterprises that were privatized in noncompetitive environment did not show any improvement in returns on sales. However, improvements were dramatic where privatization was carried in a competitive environment. So degree of competition and effectiveness of regulatory policy have more effects than ownership (Vickers & Yarrow 1988).
Now the question raises that in similar competitive environment which factors can be responsible for the differential performance of public and private organizations. This question is answered by Majumdar (1998). He explained that with similar competition, public and private enterprises can differ in performance based on their institutional environment. The choice of institutional environment is affected by form of ownership. So ownership cannot be ruled out. This conclusion is in accordance with second group of scholars.
Second group of scholars argues that competition has effect on performance of ownership but ownership still matters. Boardman & Vining (1989) who belong to second group of scholars evaluated fifty-four studies about comparative performance of public and private organizations; six studies revealed that public organizations are more efficient than private organizations. Sixteen studies concluded that there is no performance difference between public and private organizations while thirty-two studies revealed that private organizations are more efficient than public organizations. These mixed results provided weak support to theory of property rights and public choice literature which are mainly supporters of superior private performance in comparison to public organization.
As Boardman & Vining (1989) found mixed results then there should be further elaboration that what are the conditions in which form of ownership affect organizational performance (Ramaswamy 2001). In reply to this question, Boardman & Vining (1989) further argued that mixed results were found due to two reasons: first, these studies were carried out in noncompetitive environment (monopolies or duopolies) and the second; these studies were
31
carried out in highly regulated service sector. So they concluded that the theory of property rights does not work well in noncompetitive environment or in highly regulated service sector. In order to prove the latter statement, Boardman & Vining (1989) evaluated the performance of 500 largest non-US industrial corporations of the world in a competitive environment and concluded that mixed and state-owned organizations perform worse than private organizations. So ownership matters. However, competition moderates the relationship between ownership and performance. In highly competitive situation, their differential performance increases with increase of competitive intensity (Ramaswamy 2001).
Further to reply the arguments of first group of scholars, Boardman & Vining (1992) argued that although agency issues are also present in private organizations which lead to poor performance but private organizations are of two types. Agency issues are dominant in those private organizations that are controlled by managers while agency issues are absent in owner controlled private organizations. So when performance results of both types of private organizations will be mixed, efficiency results will be better in favor of private organizations as compared to public organizations.
3.5 Comparing Public versus Private Performance: Evidences Previous studies on comparative performance of public and private organizations provided equivocal results. Some studies favor public ownership for superior performance; some favor private ownership while some concluded that ownership does not have any effect on performance.
First, empirical findings of those studies are presented that favor private ownership. A study conducted by Majumdar (1998) to evaluate the comparative performance of government owned, mixed and private enterprises with the help of Data Envelopment Analysis in India for the period of 1973-1974 & 1988-1989 and concluded that government owned enterprises are less efficient than mixed and private enterprises. Mixed enterprises on their turn are less efficient than private enterprises. A study conducted by Zeitun & Tian (2007) revealed that with increasing government shares in a firm in Jordan, performance of that firm is lowered along with lowering of risk of default. Backx, Carney & Gedajlovic (2002) studied comparative performance of public, private and mixed corporations in airline industry and concluded that public enterprises under-perform their private counterparts while mixed enterprises perform better than public enterprises but perform worse than private enterprises. Kumbhakar & Hjalmarsson (1998) studied comparative efficiency of public and private electricity retail distribution in Sweden and concluded that relative efficiency of private enterprises is higher than public enterprises. Donahue (1989) carried a survey of multiple studies and proved that public provision of municipal services is of higher cost than private services in the United States. Mueller (1989) carried a survey of many studies relevant to comparative performance of public and private enterprises and found that private enterprises have higher efficiency than public enterprises. Micco et al (2005) concluded that state-owned banks located in developing countries have lower profit than private banks. They could not find any relationship between ownership and performance in industrial countries. Ramaswamy (2001) evaluated the performance of 110 state-owned and private organizations in terms of profitability and operating efficiency for a three year period (1990-1992) in India and found that state-owned organizations perform poor than private organizations.
32
Some studies found little or no relationship between ownership and performance. Figueira, Nellis & Parker (2009) conducted a study to investigate the effect of ownership on bank efficiency in Latin America. They used a range of financial and economic ratios, Data Envelopment Analysis and regression modelling and study revealed that there is little difference in performance of public and private banks. A study was conducted by Liu (1995) on comparative performance of public and private ports in Britain and concluded that no ownership effect was found on performance. A study conducted by Estache & Rossi (2002) concluded that there is no performance difference between public and private water companies in Asia. A study conducted by Altunbas, Evans & Molyneux (2001) on German banking industry concluded that there is little evidence that private banks are more efficient than public sector banks. While both sectors took benefit from economies of scale, inefficiency measure showed that public banks have little cost and profit advantage over private banks. Bhaya (1990) used annual survey of industries data for the years 1981-1982 to 1985-1986 in India and measured performance of public and private organizations and concluded that public management efficiency is not inferior to private management. Similar type of study was conducted in India by Jha & Sahni (1992) and concluded that there is no efficiency difference between public and private sectors. However, public sector organizations were found less profitable as compared to private organizations.
3.6 Preferences for Public and Private Ownership: It is evident from literature review that when we compare performance of public versus private firms then mixed results are found although results favor comparatively more for private ownership as depicted by Boardman & Vining (1989). Now the situations should be discussed to where public ownership should be preferred over private ownership and vice versa.
Shleifer (1998) depicted these situations by exemplifying interesting situations. Private ownership is preferred over public ownership when there is a strong incentive to innovate and to reduce cost. In private ownership there is an incentive to innovate because owner will get all the benefits of that innovation. While this incentive is attenuated in public ownership because public managers do not have any residual rights. Efficiency of private firms is also higher than public firms because they do not have any social goals and they invest only in those areas where they can earn profits. Example can be presented here of delivery of postal service to remote or sparsely populated areas. It would be unprofitable to involve in this kind of operations for private firms (Tierney 1988).
If government knows what to produce exactly then there is no difference in contracting with private firm or doing in-house production. Government can make contract with a private supplier and has ability to enforce the contract. Government can bind private firms to deliver postal service to remote areas or alternatively can regulate these firms when entry is free. With situation of perfect contracting and regulation, there is no difference between public and private provision of services.
The main objective of public ownership is to achieve social goals and exhibit a developmental role in society. While objective of private ownership is to earn more profit. The failure of private ownership to meet social goals can be addressed by government contracting without resorting to public ownership.
33
But this is not always the situation. Government cannot fully anticipate, regulate or enforce the contracts with private firms. The example is provided by development of incomplete contract theory by Grossman & Hart (1986), Hart & Moore (1990), and Hart (1995). These authors specify the idea that ownership gives control and bargaining power to the owner. Consequently owner will invest in such a way to reap more benefits from his assets. If contracts do not specify what to produce then owner has strong incentive to produce that product which reduces cost or innovate the ways to get more profit. In this situation public ownership should be preferred over private ownership.
Still, there are other competing factors that can align behavior of private ownership. Following example will explain this interesting situation. Private schools can hire less experienced and cheaper teachers to reduce cost but their efficiency and quality will be lowered. In this case, strong incentive leads to inefficiency. On the other hand, public schools do not have incentive to reduce cost and quality and becomes efficient. Consequently soft incentive leads to efficient outcome. Still, public ownership does not have incentive to innovate. However, competition between schools can provide more choices to consumers and they can switch schools if they are dissatisfied. This could exert pressure on private schools to not to follow cost reduction strategy. Another factor that pushes them to not to reduce cost is reputation building. If they want to maintain their customers and want to have more customers in future, they have not to sacrifice quality. Also, the case for private ownership becomes stronger when political patronage and corruption are also brought into play.
There is another private alternative to profit maximizing supplier. Nonprofit firms use generated surplus to improve lives of their employees and even to improve quality when they are socially motivated (Weisbrod 1988). In this way nonprofit private firms will be more efficient than government or for-profit private firms (Glaeser & Shleifer 1998).
Public ownership is preferred when cost reduction leads to non-contractible deterioration of quality, innovation is relatively unimportant, competition and reputation mechanisms are weak and consumer choice is ineffective. Example can be presented here of operating Air Force One, the plane that carries the President of the United States. Security of President is important enough to enforce supplier to maintain quality of service and not to reduce cost through fuel saving by using riskier routes. Innovation and reputation of supplier is unimportant in this case. President cannot readily switch supplier if plane is not ready on short notice. Due to these reasons, public ownership of service is preferred in this case over private ownership (Shleifer 1998).
From the discussion it is evident that although efficiency of private ownership is better than public ownership, still there are situations where public ownership should be preferred over private ownership. So public ownership can not be totally ruled out.
34
CHAPTER: 4
Research Methodology
4.1 Research Philosophy: Research philosophy is the way by which knowledge is developed and judged as being acceptable and it affects the route we choose in doing research (Saunders, Lewis & Thornhill 2003). Positivism research philosophy is adopted in this research. Positivism philosophy works with observable social reality and end product is law-like generalization similar to those produced by physical and natural scientist (Saunders et al 2003). This research applies logic of knowledge based on affirmation of theories, through extensive literature review and supported by strict scientific methods. By using positivism approach, this research deals with the belief that science sometimes incorporates new ideas that are discontinuous from the old ones. It is the objective of this study to search for new empirical results considering the common ones.
4.2 Research Approach: A deductive research approach is applied in this study. In deductive approach, a theory and subsequently a hypothesis are developed and research strategy is designed to test the hypothesis. There are important characteristics of deductive approach. First, it searches to explain casual relationships between variables. Second, concept needs to be operationalised in a way that enables facts to be measured quantitatively. Final characteristic is generalization. In order to make generalization, sample of sufficient numerical size should be selected (Saunders et al 2003). This study is based on the reviews of theories like theory of property rights and public choice theory. Further conclusion statement of these theories i.e. private ownership is superior in performance than public ownership, is taken as hypothesis to test these theories in banking sector of Pakistan. On the basis of empirical findings of performance analysis and study of political influence on public banks, hypothesis presented by these theories is confirmed or rejected.
4.3 Research Strategy: Case study research strategy is applied in this research. Robson (2002) defines case study as strategy for doing research which comprises an empirical investigation of a particular contemporary phenomenon within its real life context using multiple sources of evidence. Case study strategy is worthwhile way of exploring the existing theory. A well-structured theory can enable us to challenge an existing theory and provide insight for new hypothesis. This research has chosen banking sector in Pakistan as case study to test the theory of property rights and public choice theory. Further, this study is longitudinal and explanatory as it compares performance of public and private banks for the year 2005 to 2009 and explains the relationship between two variables i.e. ownership and performance.
35

4.4 Sample Selection: This study is carried out in controlled environment so that reliable results are obtained in the context of effect of ownership. Industry factor is controlled as all the samples belong to banking sector. In order to control factors of bank size and bank experience, banks of similar size (number of branches) and history (number of years in local financial market) are selected. There are four public and twenty private banks in Pakistan. One of the public banks is very small and has presence mainly in one province, so it is excluded from the sample. Consequently three pairs of banks are selected. This study chooses same sized or nearly same size pairs of banks (one from public and other from private sector) so that size of bank could not affect its results. In order to remove the effect of privatization, those banks are selected that are within their respective sector for the last at least five years. Country factor is also controlled as all sample banks are domestic banks in Pakistan. Due to control of country factor, all banks are facing similar competitive forces. Following pairs of banks are included in the study.
Pairs Name of Bank Sector Year of Establishment Number of Branches
First Pair Habib Bank Limited Private 1947 1450
National Bank of Pakistan Public 1949 1250
Second Pair Bank Al Habib Limited Private 1991 265
The Bank of Punjab Public 1989 273
Third Pair Atlas Bank Limited Private 1990 32
First Women Bank Limited Public 1989 38
Table-4.1 Sample Pairs
Source: State Bank of Pakistan 2010 & websites of respective banks (Appendix A)
4.5 Data Collection: As 1st question is going to be solved with help of ratio analysis or data derived from balance sheets and income statements, so balance sheets and income statements (for the year 2005 to 2009) of selected sample of banks are collected from websites of respective banks. Balance sheets and income statements are analyzed and edited to remove double entries and to exclude subsidiaries data (if any bank has subsidiary business). 2nd question is answered by analyzing
36
empirical findings generated by ratio analysis. 3rd question requires studying lending behaviour and net interest margins charged by public and private banks, so it uses annual reports of respective banks.
4.6 Quantitative Analysis: This study evaluates comparative performance of public and private sector banks to find the effect of ownership on banking performance. In banking performance study, inter-bank analysis is much common (sabi 1996). Performance of a bank can be better understood by analysis of inter-bank comparison. Various parametric and non-parametric approaches are used to measure banking performance. This study uses ratio analysis for inter-bank performance comparison. Ratio analysis is used mostly by bank regulators (Sabi 1996; Samad 1999; Spindler 1991). The most important benefit of ratio analysis is that it removes bank disparities. All banks are not equal in size. The use of ratio analysis compensates the disparities in sizes (Samad 1999).
Ratio analysis (12 ratios are used) is applied to calculate profitability, liquidity, solvency and efficiency of each bank. Then for each ratio, average ratio of three banks is calculated for each sector. Then every average ratio of both sectors is compared in form of table and graph. From the results, it is evaluated that which banking sector is more solvent, more liquid, more profitable and more efficient. It explains that which of these two ownership forms generates better performance results. As every ratio is calculated for the last five years for each bank, trends in comparative performance of each sector are also visible from the graphs.
These ratios gather different performance measures of banks, on the basis of which these are divided into four categories.
4.6.1 Profitability Ratios:
These ratios are used to assess ability of a business to earn profit in comparison with all its expenses during a specific time period. Generally, accounting profit is the difference between revenue and cost (Ross, Westerfield & Jaffe 2005). If these ratios are higher than competitors, industry averages or previous years’ ratio then it can be considered that firm is performing profitably. Following profitability ratios are used in this research.
Return on Assets (ROA):
ROA gives profitability on assets of the firm after meeting all expenses and taxes. It measures the profit of the firm after tax for each dollar invested in assets (Horne & Wachowicz 2005). It is indicator of managerial performance. So, higher value of this ratio means better managerial performance (Ross, Westerfield & Jaffe 2005). ROA can be increased by increasing profit margin or asset turnover.
ROA = Net Profit / Total Assets
37
Return on Equity (ROE):
Return on equity represents profitability of shareholders of the firm after meeting all expenses and taxes (Horne & Wachowicz 2005). ROE is net earning per dollar equity capital. Higher ROE means better managerial performance. But higher ROE can be due to financial leverage. So higher leverd firms have higher ROE which increases risk too (Ross, Westerfield & Jaffe 2005). Usually ROE is higher for high growth companies.
ROE = Net Profit / Shareholders’ Equity
Yield on Earning Assets (YOEA):
This ratio represents earning percentage of earning assets. Higher the ratio, higher is return of bank to earning assets. This ratio can be used as proxy of net ineterest margin.
YOEA = Net Interest Income / Earning Assets
4.6.2 Liquidity Ratios:
Liquidity ratios measure ability of the firm to meet its short-term (less than a year) obligations and reveal short-term financial strength and weakness (Ross, Westerfield & Jaffe 2005). Higher liquidity ratio means bank has higher margin of safety and ability to meet its short-term obligations. Saving accounts and tranactions deposits can be withdrawn at any time and bank faces liquidity problem when withdrawal exceeds new deposits over a short period of time (Samad & Hassan 2000). Following liquidity ratios are used.
Cash to Deposit Ratio (CDR):
This ratio measures cash holding by commercial banks. Cash is most liquid asset in banks. The purpose of this holding is to meet demands of withdrawal from depositors. It is important in maintaining customer trust. But on the other hand, it reduces opportunity to earn income from cash.
CDR = Total Cash Holdings / Total Deposits
Loan to Deposit Ratio (LDR):
Loan to deposit ratio is an important indicator of liquidity position of the bank. Loans means advances for conventional banks. Bank with lower LDR is considered to have excessive liquidity, potentially lower profit and hence less risk as compared to bank of higher LDR.
LDR = Loans / Total Deposits
Loan to Asset Ratio (LAR):
It is another important measure of liquidity position of the bank. LAR measures liquidity of bank in terms of its assets. Higher the ratio, less liquid is the bank.
LAR = Loans / Total assets
38

4.6.3 Solvency and Risk Ratios:
These ratios are also called financial gearing, debt or financial leverage ratios. These ratios measure risk and solvency of firms by determining how much the firm depends on debt financing rather than equity capital. These ratios determine the probability that the firm default on its debts. Greater the debts, greater is the probability that the firm will become unable to fulfill its contractual obligations leading to bankrupcy and financial distress. Although debt is important source of financing and provide significant tax advantage but it may create conflict of interest between debtors and shareholders (Ross, Westerfield & Jaffe 2005). If amount of assets held by a firm is greater than all types of liabilities then firm is considered solvent. Following ratios are used to measure solvency.
Debt-Equity Ratio (DER):
This ratio measures the extent to which a firm uses debts. It measures ability of a firm to absorb financial shock. If creditor of the bank defaults in paying back loans or assets value decreases, bank capital provide shield against those loan losses. A bank with lower DER is considered better than bank with higher DER.
DER = Total Debt / Shareholders’ Equity
Debt to Total Assets Ratio (DTAR):
It measures amount of debts the firm uses in financing its total assets. It is indicator of financial strength of the bank and gives information about solvency of the bank. Higher DTAR means that bank uses more debt financing than equity capital which leads to risky situation.
DTAR = Total Debt / Total Assets
Equity Multiplier (EM):
It indicates amount of assets per dollar of shareholders’ equity. Higher value of it shows that bank has used more debts to convert into assets with share capital. Higher value of EM leads to risky situation.
EM = Total Assets / Shareholders’ Equity
4.6.4 Efficiency or Activity Ratios:
Efficiency, activity or turnover ratios measure efficiency in assets or resource management. These ratios measure overall effectiveness of the firm in utilizing its assets to generate sales, quality of receivables and success in collection, effectiveness of inventory management practices and efficiency of the firm in controlling its expenses. Following ratios are used to measure efficiency of sample banks.
39

Asset Utilization (AU):
This ratio measures how efficiently the firm is utilizing its assets. Higher value of this ratio means that firm is using its assets efficiently in generating total revenue. Lower value of it means that firm should either increase its revenue or dispose some of its assets (Ross, Westerfield & Jaffe 2005). Total revenue of a bank can be defined as net spread before provision plus all other incomes.
Asset Utilization = Total Revenue / Total Assets
Income Expense Ratio (IER):
It measures amount of income earned per dollar of operating expenses. This is most commonly used ratio in banking sector to measure managerial efficiency in generating total income while controlling its operating expenses. Higher IER is preferred over lower ones. Total income is net spread earned before provision plus all other income.
IER = Total Income / Total Operating Expenses
Operating Efficiency (OE):
This ratio measures amount of operating revenue per dollar of operating expense. It provides information about managerial efficiency in generating operating revenues and controlling its operating expenses. In other words, how efficienct is the bank. High OE is preferred over lower OE.
OE = Total Operating Revenue / Total Operating Expenses
4.7 Determination of Political Influence:
Political influence on public banks is determined by two ways in this research. First, it is observed that if there is any effect of elections on comparative performance of public and private banks. So the effect of elections on performance of these banks for all the twelve ratios is discussed. Second, it is observed that if there is any change occurs in lending behavior of public and private banks during the election years. In Pakistan last general elections were held in first quarter of 2008. So, political influence can be observed in the year of 2007 or 2008.
Effect of elections on comparative performance of public and private banks is observed in literature. Micco et al (2005) found that public banks have lower profitability than private banks and their differential performance widens during election year in developing countries. Similarly, lending behaviour of banks is studied to determine political influence on public banks. In order to isolate political influence from other drivers of performance, lending behavior of private banks is also observed. In this way all other factors become constant. Usually public banks increase lending before the elections in favor of friends of government to increase political support of government.
40

This increase in lending can be due to demand shock of loans. To identify this increase on loan due to political influence, amount of loan and net interest margin are studied. If increase in loan is followed by lower interest margin then this is due to political lending. Otherwise, it is due to increase in demands of loans (Micco et al 2005). Increase in lending with decrease in interest margin has negative effect on profitability and efficiency of banks.
CHAPTER: 5
Analysis and Empirical Findings In this chapter, analysis of data gathered and empirical findings are presented. As it is a comparative study of two banking sectors i.e. public and private so one sector is benchmark for the other sector. First empirical findings of ratio analysis are presented along with the study of effect of elections on differential performance of public and private banks. In the end, lending behaviour of both public and private banks is studied along with the study of net interest margin during election years. Description of financial statement items used in ratio analysis is presented in Appendix B. Ratio analysis of individual sample banks is presented in the Appendix C.
5.1 Profitability Ratios: In this section, analysis and empirical findings of those ratios are presented that provide information about profitability of banks. The ratios included in this section are Return on Assets (ROA), Return on Equity (ROE) and Yield on Earning Assets (YOEA).
5.1.1 Return on Assets (ROA):
This ratio is measure of profitability of banks after meeting all their expenses in comparison to total assets. Higher the ratio, more profitable is the bank. ROA calculated for public and private sector banks provides the basis for comparison of profitability between these two sectors. ROA of public banks increases from 2005 to 2006 moving from 1.86 % to 2.27% and then shows decreasing trend from 2007 to 2008 moving from 2.05% to -0.69%. In 2009, it shows little recovery and start increasing again and gain the value 0.57%. Similar is the situation for private banks except that it does not shown any sign of recovery in the year 2009. It increases from 1.14% to 1.37% in year 2005 to 2006. From the year 2007 it starts its decreasing trend and ends with 0.48% in 2007, -0.74% in 2008 and -2.86% in 2009. From the table 5.1, it is clear that ROA of public banks is greater than private banks in every analysis year from 2005 to 2009. Overall, the mean ROA of public banks i.e. 1.21% is greater than that of private banks i.e. -0.12% which shows that public banks are more profitable than private banks in terms of ROA.
Both banking sectors show deteriorating performance during and before the election year i.e. 2007 & 2008. Both sectors are showing downward trend in election year although drop of ROA of public banks is more pronounced. Public banks have shown little recovery in the year 2009 while private sector banks are still observing difficulties. So little effect of election is found on public banks as performance of both sector is very close only during the election year while in all
41

other years performance of public banks is much better than private banks. Trends in performance of ROA of both sectors are visible from the figure 5.1.
Figure-5.1 Return on Assets
Sector 2005 2006 2007 2008 2009 Mean
Public 1.86% 2.27% 2.05% -0.69% 0.57% 1.21%
Private 1.14% 1.37% 0.48% -0.74% -2.86% -0.12%
Table-5.1 Return on Assets
5.1.2 Return on Equity (ROE):
This ratio is also indicator of profitability. It measures profitability of banks in terms of their equity. Higher the ratio, more profitable is the bank. ROE of public banks starts decreasing from the year 2005 with value 29.63% in 2005, 28.96% in 2006, 24.08% in 2007 and shows abrupt fall in 2008 (-56.87%) and shows little recovery in the year 2009 (5.82%). ROE of private banks increases in the start from 2005 to 2006 (19.82% to 19.98%) and then shows decreasing trend from 2007 with value 12.52%, 2008 with value 5.62% and -8.72% in 2009. ROE of public banks is greater than private banks in all the analysis year except the year of 2008. Overall, mean ROE of public banks i.e. 6.32% is less than that of private banks i.e. 9.84% which shows that public banks are less profitable than private banks in terms of ROE.
Return on Assets (ROA)
-4.00%
-3.00%
-2.00%
-1.00%
0.00%
1.00%
2.00%
3.00%
2005 2006 2007 2008 2009
Years
ROA Public Banks
Private Banks
42
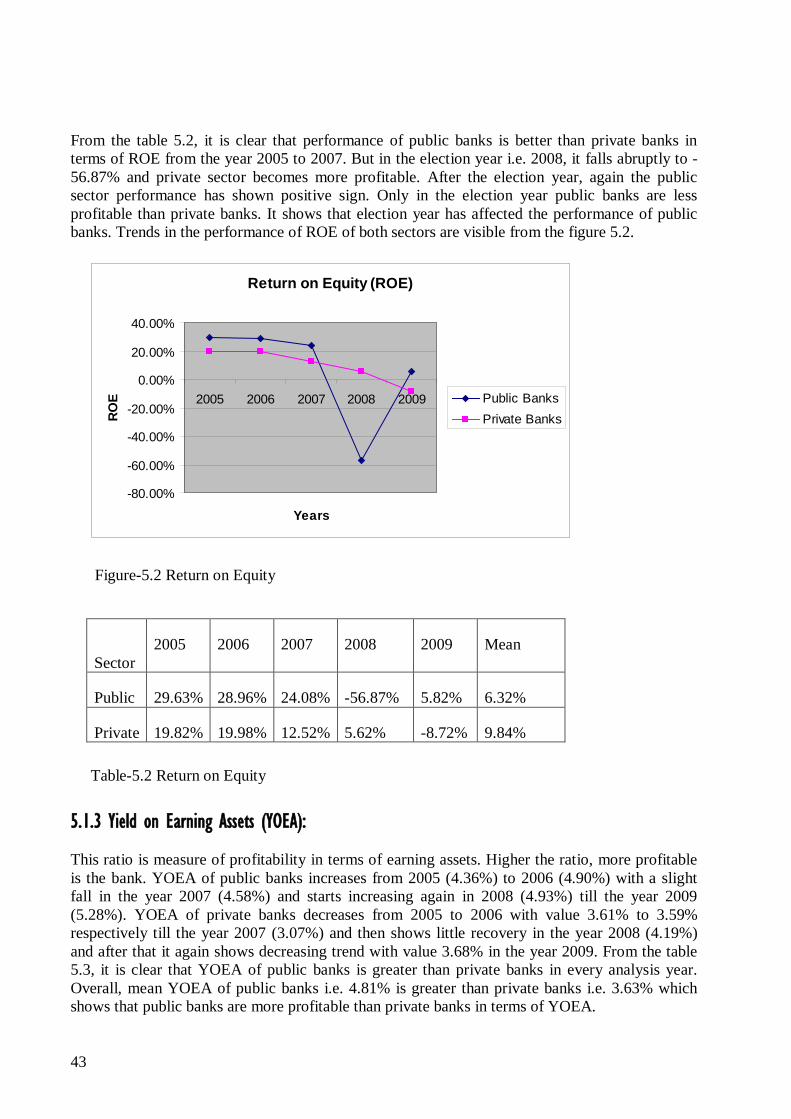
From the table 5.2, it is clear that performance of public banks is better than private banks in terms of ROE from the year 2005 to 2007. But in the election year i.e. 2008, it falls abruptly to -56.87% and private sector becomes more profitable. After the election year, again the public sector performance has shown positive sign. Only in the election year public banks are less profitable than private banks. It shows that election year has affected the performance of public banks. Trends in the performance of ROE of both sectors are visible from the figure 5.2.
Figure-5.2 Return on Equity
Sector
2005 2006 2007 2008 2009 Mean
Public 29.63% 28.96% 24.08% -56.87% 5.82% 6.32%
Private 19.82% 19.98% 12.52% 5.62% -8.72% 9.84%
Table-5.2 Return on Equity
5.1.3 Yield on Earning Assets (YOEA):
This ratio is measure of profitability in terms of earning assets. Higher the ratio, more profitable is the bank. YOEA of public banks increases from 2005 (4.36%) to 2006 (4.90%) with a slight fall in the year 2007 (4.58%) and starts increasing again in 2008 (4.93%) till the year 2009 (5.28%). YOEA of private banks decreases from 2005 to 2006 with value 3.61% to 3.59% respectively till the year 2007 (3.07%) and then shows little recovery in the year 2008 (4.19%) and after that it again shows decreasing trend with value 3.68% in the year 2009. From the table 5.3, it is clear that YOEA of public banks is greater than private banks in every analysis year. Overall, mean YOEA of public banks i.e. 4.81% is greater than private banks i.e. 3.63% which shows that public banks are more profitable than private banks in terms of YOEA.
Return on Equity (ROE)
-80.00%
-60.00%
-40.00%
-20.00%
0.00%
20.00%
40.00%
2005 2006 2007 2008 2009
Years
ROE Public Banks
Private Banks
43

There is little fall in YOEA before the election year in 2007 and YOEA of private banks also fall in similar fashion. During election year both sectors have increased their YOEA. So there seems on specific effect of election year on performance of public banks is found in terms of YOEA. Trends in performance of YOEA of both sectors are visible from the figure 5.3.
Figure-5.3 Yield on Earning Assets
Sector
2005 2006 2007 2008 2009 Mean
Public 4.36% 4.90% 4.58% 4.93% 5.28% 4.81%
Private 3.61% 3.59% 3.07% 4.19% 3.68% 3.63%
Yield on Earning Assets (YOEA)
0.00%
1.00%
2.00%
3.00%
4.00%
5.00%
6.00%
2005 2006 2007 2008 2009
Years
YOEA Public Banks
Private Banks
44

Table-5.3 Yield on Earning Assets
It is clear from the results of all three profitability ratios that ROA and YOEA support public banks more than private banks in better performance. While ROE favors private banks. Election year effect is also found in case of ROA and ROE. Overall, we can say that public banks are more profitable than private banks and little evidence is found for theory of property rights but more pronounced election effect is found to support public choice theory in case of banking sector in Pakistan in terms of profitability.
5.2 Liquidity Ratios:
In this section, analysis and empirical findings of those ratios are presented that provide information about liquidity position of banks. The ratios included in this section are Cash to Deposit Ratio (CDR), Loan to Deposit Ratio (LDR) and Loan to Asset Ratio (LAR).
5.2.1 Cash to Deposit Ratio (CDR):
This ratio shows liquidity position of banks and their ability to meet cash withdrawal demands of depositors. It increases customer trust but reduces chances of earning profit from cash. Higher the ratio, more liquid is the bank. In other words, bank has higher margin of safety and ability to meet their short term obligations. CDR of public banks increases from the year 2005 (11.00%) to 2006 (12.00%) and then shows a little decreasing trend till the year 2008 (11.08%) and shows recovery in the year 2009 by attaining the value of 12.04%. The CDR of private banks increases from 9.07% in 2005 till the year 2007 to 10.89%. After that it shows decreasing trend ending with 8.60% in 2009. From the table 5.4, it is clear that CDR of public banks is greater than private banks in every analysis year which shows that public banks are more liquid than private banks in terms of CDR. Overall, the mean CDR of public banks i.e. 11.50% is greater than that of private banks i.e. 9.33% which leads to the conclusion that public banks have stronger liquidity position than private banks in terms of CDR.
There is little fall in CDR of public banks in the election year (2008). While CDR of private banks shows more significant fall in the election year. So no election effect is found here specifically for public banks. Moreover, trends in performance of CDR of both sectors are visible from the figure 5.4.
Cash to Deposit Ratio (CDR)
0.00%
2.00%4.00%
6.00%8.00%
10.00%12.00%
14.00%
2005 2006 2007 2008 2009
Years
CDR Public Banks
Private Banks
45
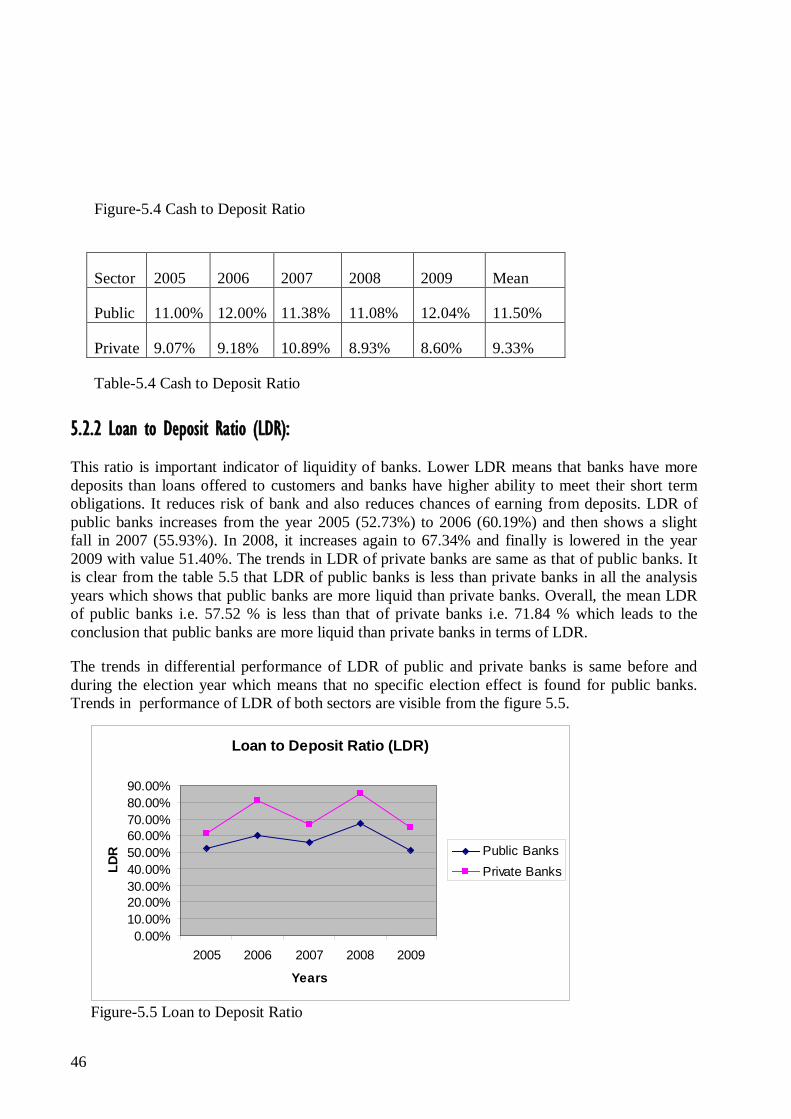
Figure-5.4 Cash to Deposit Ratio
Sector 2005 2006 2007 2008 2009 Mean
Public 11.00% 12.00% 11.38% 11.08% 12.04% 11.50%
Private 9.07% 9.18% 10.89% 8.93% 8.60% 9.33%
Table-5.4 Cash to Deposit Ratio
5.2.2 Loan to Deposit Ratio (LDR):
This ratio is important indicator of liquidity of banks. Lower LDR means that banks have more deposits than loans offered to customers and banks have higher ability to meet their short term obligations. It reduces risk of bank and also reduces chances of earning from deposits. LDR of public banks increases from the year 2005 (52.73%) to 2006 (60.19%) and then shows a slight fall in 2007 (55.93%). In 2008, it increases again to 67.34% and finally is lowered in the year 2009 with value 51.40%. The trends in LDR of private banks are same as that of public banks. It is clear from the table 5.5 that LDR of public banks is less than private banks in all the analysis years which shows that public banks are more liquid than private banks. Overall, the mean LDR of public banks i.e. 57.52 % is less than that of private banks i.e. 71.84 % which leads to the conclusion that public banks are more liquid than private banks in terms of LDR.
The trends in differential performance of LDR of public and private banks is same before and during the election year which means that no specific election effect is found for public banks. Trends in performance of LDR of both sectors are visible from the figure 5.5.
Figure-5.5 Loan to Deposit Ratio
Loan to Deposit Ratio (LDR)
0.00%10.00%20.00%30.00%40.00%50.00%60.00%70.00%80.00%90.00%
2005 2006 2007 2008 2009
Years
LDR Public Banks
Private Banks
46

Sector
2005 2006 2007 2008 2009 Mean
Public 52.73% 60.19% 55.93% 67.34% 51.40% 57.52%
Private 61.12% 80.81% 66.83% 85.24% 65.19% 71.84%
Table-5.5 Loan to Deposit Ratio
5.2.3 Loan to Asset Ratio (LAR):
This ratio measures liquidity of banks in relation to loan-total assets comparison. Higher the ratio, less liquid is the bank. It means that banks have offered more loans than their capacity and may feel difficulty in meeting their short term obligations. LAR of public banks increases from the year 2005 (42.40%) to the year 2006 (48.45%) and then decreases in the year 2007 (45.26%). In the year 2008, it increases again to 55.53% and finally drops to lowest level in the year 2009 to 41.12%. LAR of private banks shows the same pattern. It is clear from the table 5.6 that LAR of public banks is less than private banks in all the analysis years which shows that public banks are more liquid than private banks. Overall, the mean LAR of public banks i.e. 46.55 % is less than that of private banks i.e. 52.84 %. So it can be concluded that public banks are more liquid than private banks in terms of LAR.
The trends in LAR of public and private banks are same before and during the election year which means that no specific election effect is found for public banks. Trends in performance of LAR of both sectors are visible from the figure 5.6.
Figure-5.6 Loan to Asset Ratio
Loan to Asset Ratio (LAR)
0.00%
10.00%20.00%
30.00%40.00%
50.00%60.00%
70.00%
2005 2006 2007 2008 2009
Years
LAR Public Banks
Private Banks
47
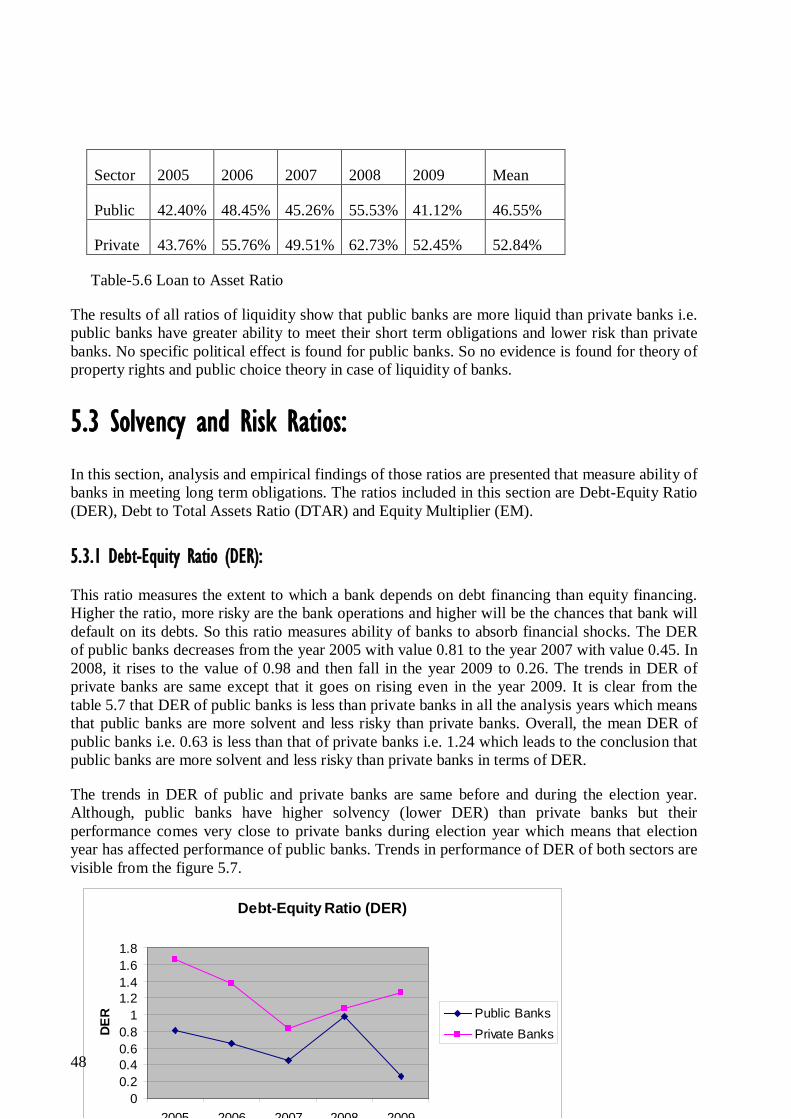
Sector 2005 2006 2007 2008 2009 Mean
Public 42.40% 48.45% 45.26% 55.53% 41.12% 46.55%
Private 43.76% 55.76% 49.51% 62.73% 52.45% 52.84%
Table-5.6 Loan to Asset Ratio
The results of all ratios of liquidity show that public banks are more liquid than private banks i.e. public banks have greater ability to meet their short term obligations and lower risk than private banks. No specific political effect is found for public banks. So no evidence is found for theory of property rights and public choice theory in case of liquidity of banks.
5.3 Solvency and Risk Ratios:
In this section, analysis and empirical findings of those ratios are presented that measure ability of banks in meeting long term obligations. The ratios included in this section are Debt-Equity Ratio (DER), Debt to Total Assets Ratio (DTAR) and Equity Multiplier (EM).
5.3.1 Debt-Equity Ratio (DER):
This ratio measures the extent to which a bank depends on debt financing than equity financing. Higher the ratio, more risky are the bank operations and higher will be the chances that bank will default on its debts. So this ratio measures ability of banks to absorb financial shocks. The DER of public banks decreases from the year 2005 with value 0.81 to the year 2007 with value 0.45. In 2008, it rises to the value of 0.98 and then fall in the year 2009 to 0.26. The trends in DER of private banks are same except that it goes on rising even in the year 2009. It is clear from the table 5.7 that DER of public banks is less than private banks in all the analysis years which means that public banks are more solvent and less risky than private banks. Overall, the mean DER of public banks i.e. 0.63 is less than that of private banks i.e. 1.24 which leads to the conclusion that public banks are more solvent and less risky than private banks in terms of DER.
The trends in DER of public and private banks are same before and during the election year. Although, public banks have higher solvency (lower DER) than private banks but their performance comes very close to private banks during election year which means that election year has affected performance of public banks. Trends in performance of DER of both sectors are visible from the figure 5.7.
Debt-Equity Ratio (DER)
00.20.40.60.8
11.21.41.61.8
2005 2006 2007 2008 2009
DER Public Banks
Private Banks
48

Figure-5.7 Debt-Equity Ratio
Sector 2005 2006 2007 2008 2009 Mean
Public 0.81 0.65 0.45 0.98 0.26 0.63
Private 1.66 1.37 0.84 1.07 1.26 1.24
Table-5.7 Debt-Equity Ratio
5.3.2 Debt to Total Asset Ratio (DTAR):
This ratio measures solvency of banks in terms of their debt-total assets relationship. Higher ratio means that banks depend on debt financing more than their own resources which increases chance of bank default and leads to risky situations. The DTAR of public banks increases from the year 2005 (5.23%) to the year 2008 (3.97%) and finally drop to 2.55% in 2009. The DTAR of private banks decreases from the year 2005 (21.45%) to the year 2007 (6.86%). From 2008 it start increasing and finally ends to 16.45% in 2009. From the table 5.8, it is clear that DTAR of public banks is less than private banks in all the analysis years which shows that public banks depend on debt financing less than private banks. Overall, the mean DTAR of public banks i.e. 4.06 % is less than that of private banks i.e. 13.84 % which means that public banks are more solvent and less risky than private banks.
As DTAR of both public and private banks increases during the election year than previous year, even increase in DTAR of private banks is more significant, so no specific election effect is found for public banks. Trends in the performance of DTAR of both sectors are visible from the figure 5.8.
Debt to Total Asset Ratio (DTAR)
0 00%
5.00%
10.00%
15.00%
20.00%
25.00%
DTAR Public Banks
Private Banks49
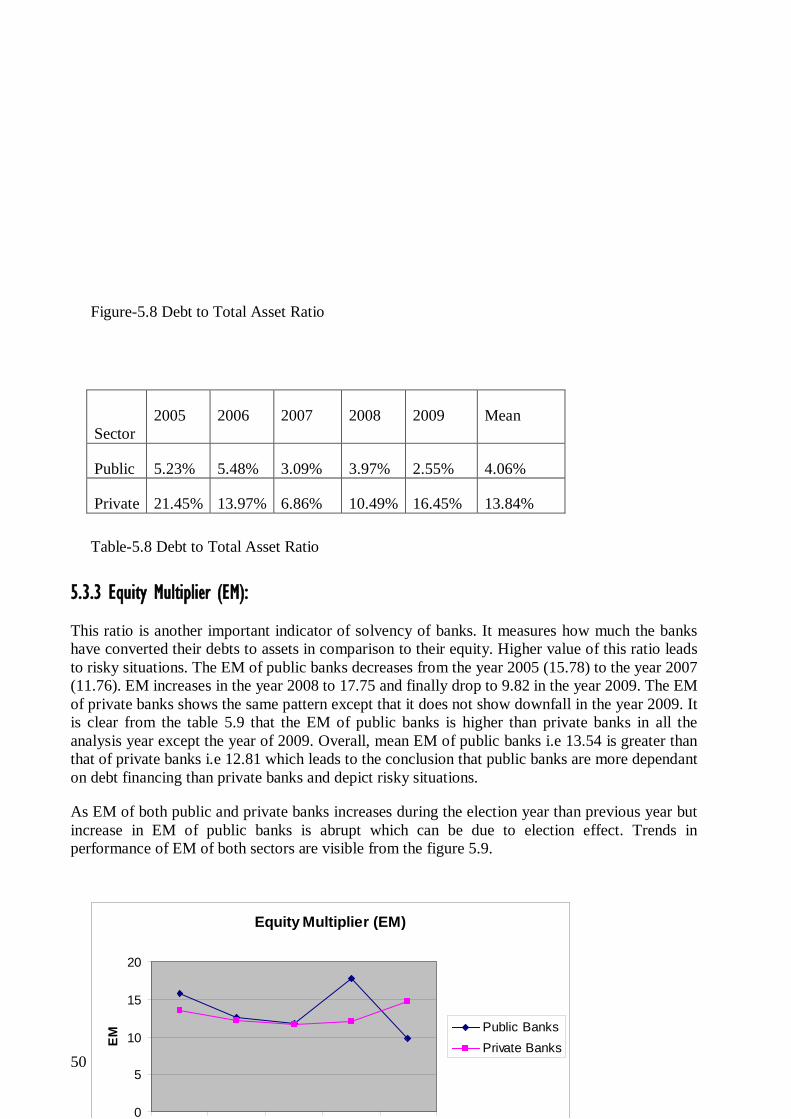
Figure-5.8 Debt to Total Asset Ratio
Sector
2005 2006 2007 2008 2009 Mean
Public 5.23% 5.48% 3.09% 3.97% 2.55% 4.06%
Private 21.45% 13.97% 6.86% 10.49% 16.45% 13.84%
Table-5.8 Debt to Total Asset Ratio
5.3.3 Equity Multiplier (EM):
This ratio is another important indicator of solvency of banks. It measures how much the banks have converted their debts to assets in comparison to their equity. Higher value of this ratio leads to risky situations. The EM of public banks decreases from the year 2005 (15.78) to the year 2007 (11.76). EM increases in the year 2008 to 17.75 and finally drop to 9.82 in the year 2009. The EM of private banks shows the same pattern except that it does not show downfall in the year 2009. It is clear from the table 5.9 that the EM of public banks is higher than private banks in all the analysis year except the year of 2009. Overall, mean EM of public banks i.e 13.54 is greater than that of private banks i.e 12.81 which leads to the conclusion that public banks are more dependant on debt financing than private banks and depict risky situations.
As EM of both public and private banks increases during the election year than previous year but increase in EM of public banks is abrupt which can be due to election effect. Trends in performance of EM of both sectors are visible from the figure 5.9.
Equity Multiplier (EM)
0
5
10
15
20
EM
Public BanksPrivate Banks
50
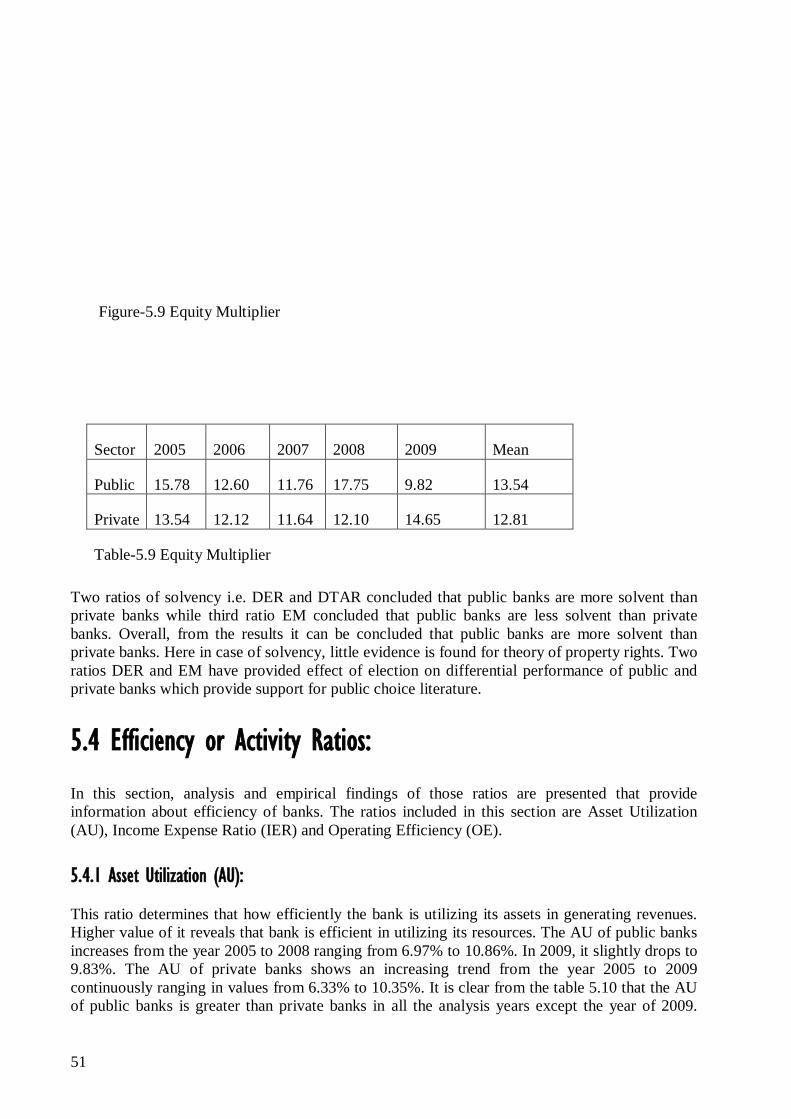
Figure-5.9 Equity Multiplier
Sector 2005 2006 2007 2008 2009 Mean
Public 15.78 12.60 11.76 17.75 9.82 13.54
Private 13.54 12.12 11.64 12.10 14.65 12.81
Table-5.9 Equity Multiplier
Two ratios of solvency i.e. DER and DTAR concluded that public banks are more solvent than private banks while third ratio EM concluded that public banks are less solvent than private banks. Overall, from the results it can be concluded that public banks are more solvent than private banks. Here in case of solvency, little evidence is found for theory of property rights. Two ratios DER and EM have provided effect of election on differential performance of public and private banks which provide support for public choice literature.
5.4 Efficiency or Activity Ratios:
In this section, analysis and empirical findings of those ratios are presented that provide information about efficiency of banks. The ratios included in this section are Asset Utilization (AU), Income Expense Ratio (IER) and Operating Efficiency (OE).
5.4.1 Asset Utilization (AU):
This ratio determines that how efficiently the bank is utilizing its assets in generating revenues. Higher value of it reveals that bank is efficient in utilizing its resources. The AU of public banks increases from the year 2005 to 2008 ranging from 6.97% to 10.86%. In 2009, it slightly drops to 9.83%. The AU of private banks shows an increasing trend from the year 2005 to 2009 continuously ranging in values from 6.33% to 10.35%. It is clear from the table 5.10 that the AU of public banks is greater than private banks in all the analysis years except the year of 2009.
51

Overall, the mean AU of public banks i.e. 9.07% is greater than that of private banks i.e. 8.56% which leads to the conclusion that public banks are more efficient than private banks in terms of AU.
The AU of both sectors shows an increasing trends during the election year and differential performance is also unaffected, so no specific political effect is found for public banks. Trends in performance of AU of both sectors are visible from the figure 5.10.
Figure-5.10 Asset Utilization
Sector 2005 2006 2007 2008 2009 Mean
Public 6.97% 8.78% 8.91% 10.86% 9.83% 9.07%
Private 6.33% 7.71% 8.16% 10.23% 10.35% 8.56%
Table-5.10 Asset Utilization
5.4.2 Income Expense Ratio (IER):
This ratio determines efficiency of banks in generating profit while controlling their expenses. Higher the ratio, higher is the efficiency of banks in generating income and in controlling
Asset Utilization (AU)
0.00%
2.00%
4.00%
6.00%
8.00%
10.00%
12.00%
2005 2006 2007 2008 2009
Years
AU
Public BanksPrivate Banks
52
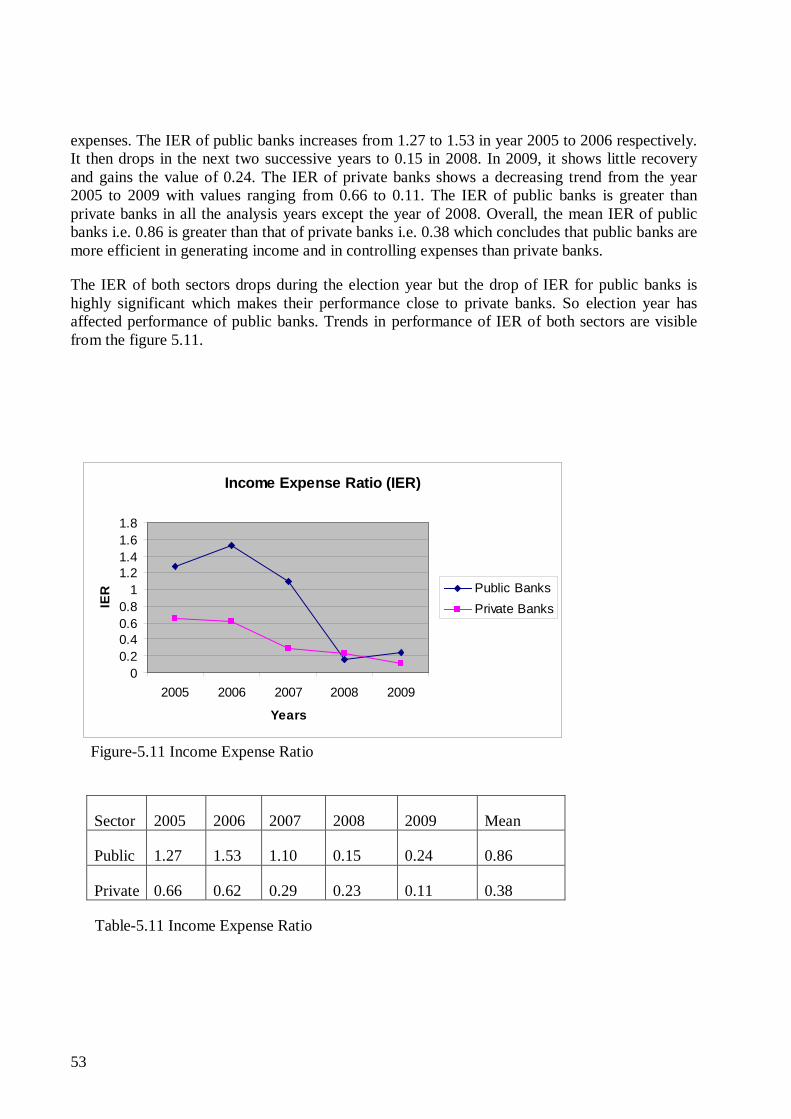
expenses. The IER of public banks increases from 1.27 to 1.53 in year 2005 to 2006 respectively. It then drops in the next two successive years to 0.15 in 2008. In 2009, it shows little recovery and gains the value of 0.24. The IER of private banks shows a decreasing trend from the year 2005 to 2009 with values ranging from 0.66 to 0.11. The IER of public banks is greater than private banks in all the analysis years except the year of 2008. Overall, the mean IER of public banks i.e. 0.86 is greater than that of private banks i.e. 0.38 which concludes that public banks are more efficient in generating income and in controlling expenses than private banks.
The IER of both sectors drops during the election year but the drop of IER for public banks is highly significant which makes their performance close to private banks. So election year has affected performance of public banks. Trends in performance of IER of both sectors are visible from the figure 5.11.
Figure-5.11 Income Expense Ratio
Sector 2005 2006 2007 2008 2009 Mean
Public 1.27 1.53 1.10 0.15 0.24 0.86
Private 0.66 0.62 0.29 0.23 0.11 0.38
Table-5.11 Income Expense Ratio
Income Expense Ratio (IER)
00.20.40.60.8
11.21.41.61.8
2005 2006 2007 2008 2009
Years
IER Public Banks
Private Banks
53

5.4.3 Operating Efficiency (OE):
This ratio measures efficiency of banks in generating operating revenues and in controlling operating expenses. Higher the ratio, more efficient is the banks. The OE of public banks increases from 2005 to 2006 with value 2.87 to 3.45 respectively. In 2007, it drops to 2.13 and in 2008, it further drops to 1.54. In 2009, it shows little recovery and gains the value of 1.92. The OE of private banks increases from 2005 to 2006 having values 2.44 and 2.68. In 2007, it drops to 2.13. In 2008, it shows little recovery to 2.21 and maintain increasing trend in the year 2009 with value 2.49. The OE of public banks is graeter than private banks from 2005 to 2007. While OE of private banks is greater than public banks in the years of 2008 and 2009. Overall, the mean OE of public banks i.e. 2.54 is greater than that of private banks i.e. 2.39 which leads to the conclusion that public banks are more efficient in generating operating revenues and controlling their operating expenses than private banks.
As it is observed from the table 5.12 that OE of public banks drops during the election year while that of private banks improves during the election year resulting into better performance of private banks during election year, so political effect can be observed in performance of public banks. Trends in performance of OE of both sectors are visible from the figure 5.12.
Figure-5.12 Operating Efficiency
Sector 2005 2006 2007 2008 2009 Mean
Public 2.87 3.45 2.93 1.54 1.92 2.54
Private 2.44 2.68 2.13 2.21 2.49 2.39
Table-5.12 Operating Efficiency
Operating Efficiency (OE)
00.5
11.5
22.5
33.5
4
2005 2006 2007 2008 2009
Years
OE Public BanksPrivate Banks
54
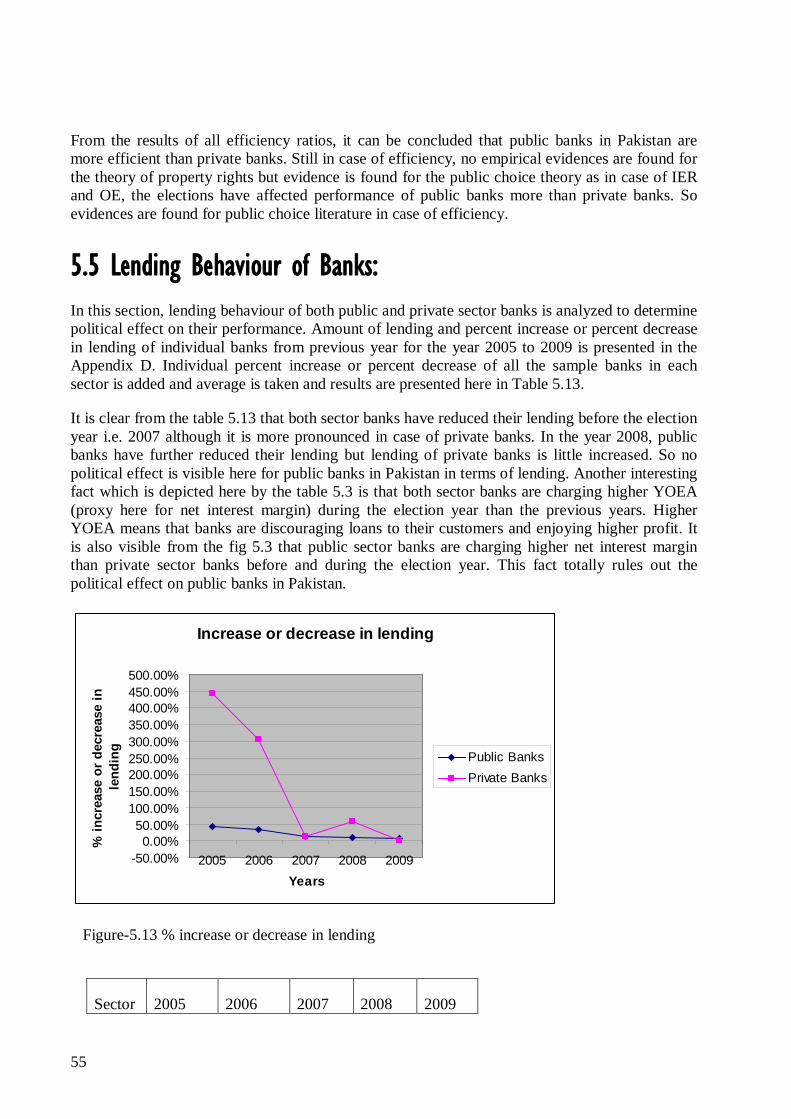
From the results of all efficiency ratios, it can be concluded that public banks in Pakistan are more efficient than private banks. Still in case of efficiency, no empirical evidences are found for the theory of property rights but evidence is found for the public choice theory as in case of IER and OE, the elections have affected performance of public banks more than private banks. So evidences are found for public choice literature in case of efficiency.
5.5 Lending Behaviour of Banks: In this section, lending behaviour of both public and private sector banks is analyzed to determine political effect on their performance. Amount of lending and percent increase or percent decrease in lending of individual banks from previous year for the year 2005 to 2009 is presented in the Appendix D. Individual percent increase or percent decrease of all the sample banks in each sector is added and average is taken and results are presented here in Table 5.13.
It is clear from the table 5.13 that both sector banks have reduced their lending before the election year i.e. 2007 although it is more pronounced in case of private banks. In the year 2008, public banks have further reduced their lending but lending of private banks is little increased. So no political effect is visible here for public banks in Pakistan in terms of lending. Another interesting fact which is depicted here by the table 5.3 is that both sector banks are charging higher YOEA (proxy here for net interest margin) during the election year than the previous years. Higher YOEA means that banks are discouraging loans to their customers and enjoying higher profit. It is also visible from the fig 5.3 that public sector banks are charging higher net interest margin than private sector banks before and during the election year. This fact totally rules out the political effect on public banks in Pakistan.
Increase or decrease in lending
-50.00%0.00%
50.00%100.00%150.00%200.00%250.00%300.00%350.00%400.00%450.00%500.00%
2005 2006 2007 2008 2009Years
% in
crea
se o
r dec
reas
e in
le
ndin
g
Public BanksPrivate Banks
Figure-5.13 % increase or decrease in lending
Sector 2005 2006 2007 2008 2009
55
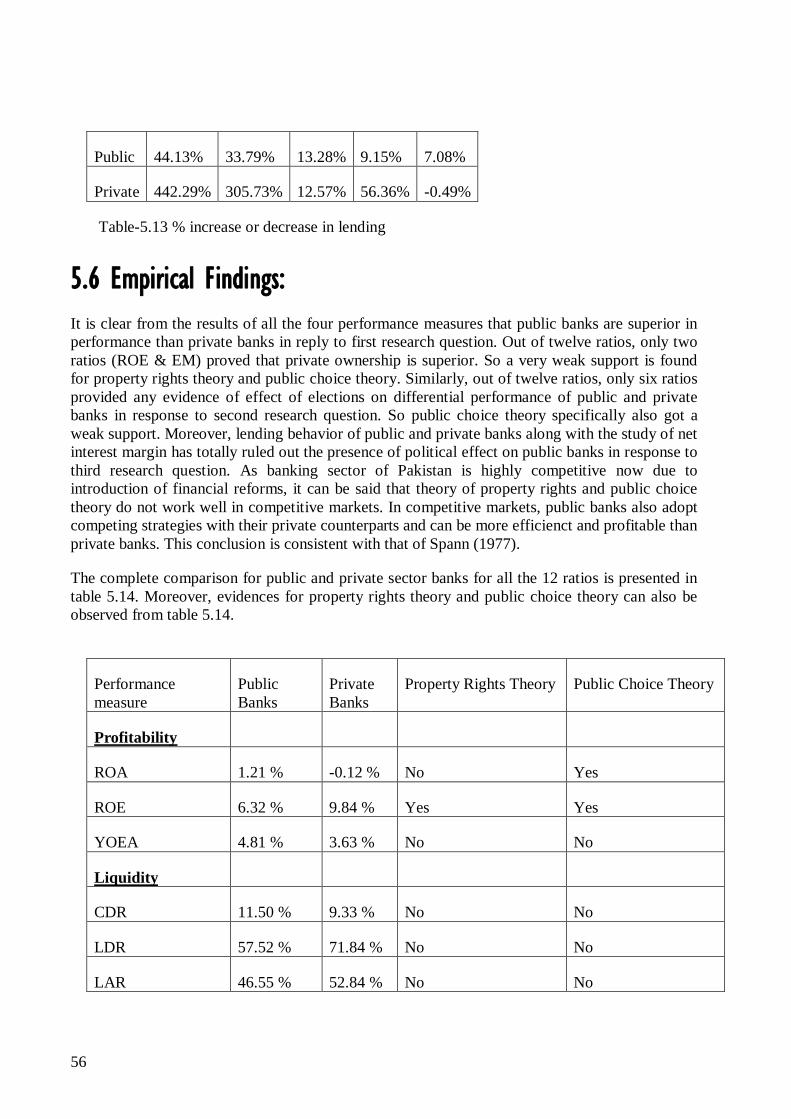
Public 44.13% 33.79% 13.28% 9.15% 7.08%
Private 442.29% 305.73% 12.57% 56.36% -0.49%
Table-5.13 % increase or decrease in lending
5.6 Empirical Findings: It is clear from the results of all the four performance measures that public banks are superior in performance than private banks in reply to first research question. Out of twelve ratios, only two ratios (ROE & EM) proved that private ownership is superior. So a very weak support is found for property rights theory and public choice theory. Similarly, out of twelve ratios, only six ratios provided any evidence of effect of elections on differential performance of public and private banks in response to second research question. So public choice theory specifically also got a weak support. Moreover, lending behavior of public and private banks along with the study of net interest margin has totally ruled out the presence of political effect on public banks in response to third research question. As banking sector of Pakistan is highly competitive now due to introduction of financial reforms, it can be said that theory of property rights and public choice theory do not work well in competitive markets. In competitive markets, public banks also adopt competing strategies with their private counterparts and can be more efficienct and profitable than private banks. This conclusion is consistent with that of Spann (1977).
The complete comparison for public and private sector banks for all the 12 ratios is presented in table 5.14. Moreover, evidences for property rights theory and public choice theory can also be observed from table 5.14.
Performance measure
Public Banks
Private Banks
Property Rights Theory Public Choice Theory
Profitability
ROA 1.21 % -0.12 % No Yes
ROE 6.32 % 9.84 % Yes Yes
YOEA 4.81 % 3.63 % No No
Liquidity
CDR 11.50 % 9.33 % No No
LDR 57.52 % 71.84 % No No
LAR 46.55 % 52.84 % No No
56

Solvency
DER 0.63 1.24 No Yes
DTAR 4.06 % 13.84 % No No
EM 13.54 12.81 Yes Yes
Efficiency
AU 9.07 % 8.56 % No No
IER 0.86 0.38 No Yes
OE 2.54 2.39 No Yes
Table-5.14 Overall comparison of public and private banks
CHAPTER: 6
Conclusions and Recommendations
6.1 Conclusions: The theory of property rights and public choice literature quote for superior performance of private ownership as compared to public ownership. The main objectives of this research are to test the hypothesis presented by these theories in a new environment i.e. banking sector of Pakistan. This is mainly a quantitative study using ratio analysis along with qualitative analysis of empirical findings of ratio analysis. From the empirical findings, a very weak support is found for both theories.
Out of twelve ratios used in ratio analysis, ten ratios support public ownership for superior performance as compared to private ownership and only two ratios quote that private ownership is superior in performance than public ownership. So from empirical findings it can be concluded that performance of public banks is superior to private banks in Pakistan in terms of profitability, liquidity, solvency and efficiency.
Similarly, out of twelve ratios, only six ratios provided evidence of effect of elections on performance of public ownership which is a weak support for public choice theory. Moreover, lending behavior of public and private banks along with the study of net interest margin has
57

totally ruled out the presence of political effect on public banks. It can be concluded from these empirical findings that either political influence on public banks is minimized or political influence is affecting both sector of banks.
As banking sector in Pakistan is highly competitive now due to introduction of financial reforms in Pakistan, it can be concluded that the theory of property rights and public choice theory do not work well in competitive markets. This conclusion is contrast to that provided by Boardman & Vining (1989).
It can also be concluded from the empirical findings that privatization is not the only solution to poor performance of public ownership. The introduction of competition can substantially improve the performance of public ownership. This conclusion is consistent with that of Spann (1977).
6.2 Recommendations: Current research only compares the performance of matched and nearly matched pairs of public and private banks in Pakistan in terms of profitability, liquidity, solvency and efficiency. Further research can be carried out including all the public and private banks in Pakistan. As results obtained are opposite to the theory of property rights and public choice theory, a qualitative research can be carried out to find the reasons of these findings.
References: Aharoni, Y 1986, The Evolution and Management of State Owned Enterprises, Ballinger Publishing, Cambridge, MA.
Alchian, AA 1987, ‘Property Rights’, in J. Eatwell, M. Milgate and P. Newman (eds.), The New Palgrave: A Dictionary of Economics, Vol. 3, Palgrave Macmillan, New York, pp. 1031-1034.
Alchian, AA & Demsetz, H 1972, ‘Production, Information cost and Economic Organization’, American Economic Review, Vol. 62, pp. 777-795.
Alchian, AA & Demsetz, H 1973, ‘The Property Right Paradigm’, The Journal of Economic History, Vol. 33, Issue 1, pp. 16-27.
Altunbas, Y, Evans, L & Molyneux, P 2001, ‘Bank Ownership and Efficiency’, Journal of Money, Credit and Banking, Vol.33, Issue 4, pp. 926-954.
Atrill, P & McLaney, E 2006, Accounting and Finance: for Non-specialist, Pearson Education Limited, England.
Backx, M, Carney, M & Gedajlovic, E 2002, ‘Public, Private and Mixed Ownership and the Performance of International Airlines’, Journal of Air Transport Management, Issue 8, pp. 213-220.
58

Bardhan, PK 1984, The Political Economy of Development in India, Basil Black Well, Oxford.
Ben-Ner, A, Montias, JM & Neuberger, A 1993, ‘Basic Issues in Organizations: A Comparative Perspective’, Journal of Comparative Economics, Issue 17, pp. 207-242.
Bhaya, H 1990, ‘Management Efficiency in the Private and Public Sectors in India’, in J Heath (eds.), Public Enterprise at the Crossroads, Routledge, London, pp. 228-240.
Borcherding, TE, Pommerehne, WW & Schneider, F 1982, ‘Comparing the Efficiency of Private and Public Production: A Survey of the Evidence from five Federal States’, Zeitschrift Fur Nationallokonomie, Issue 2, pp. 127-156.
Boycko, M, Shleifer, A & Vishny, RW 1996, ‘A theory of Privatization’, The Economic Journal, Vol. 106, Issue 435, March, pp. 309-319.
Boardman, AE & Vining, AR 1989, ‘Ownership and Performance in competitive environments: A Comparison of the Performance of Private, Mixed, and State-Owned Enterprises’, Journal of Law and Economics, Issue 32, pp. 1-33.
Boardman, AE & Vining, AR 1992, ‘Ownership Versus Competition: Efficiency in Public Enterprise’, Public Choice, Issue 73, pp. 205-239.
Carroll, KA 1990, ‘Bureau Competition and Inefficiency: A Reevaluation of Theory and Evidence’, Journal of Economic Behavior and Organization, Vol. 13, January, pp. 21-40.
Carroll, KA 2004, Property Rights and Managerial Decisions in For-profit, nonprofit, and Public Organizations, Palgrave Macmillan, New York.
Caves, DW & Christiansen, LR 1980, ‘The Relative Efficiency of Public and Private Firms in a Competitive Environment: The Case of Canadian Railroads’, Journal of Political Economy, Issue 88, pp. 958-976.
CIA 2010, ‘Country Comparison: By Area and Population’, in CIA- The World Factbook, accessed 18 May 2010, from <https://www.cia.gov/library/publications/the-world-factbook/rankorder/2147rank.html>
Coase, RH 1937, ‘The nature of the Firm’, Economica, Vol. 4, Issue 16, November, pp. 386-405.
Coase, RH 1960, ‘The Problem of Social Cost’, Journal of Law and Economics, Issue 3, pp. 1-44.
Demsetz, H 1964, ‘The Exchange and Enforcement of Property Rights’, Journal of Law and Economics, Issue 7, pp. 11-26.
Demsetz, H 1966, ‘Some Aspects of Property Rights’, Journal of Law and Economics, Issue 9, pp. 61-70.
59

Demsetz, H 1967, ‘Towards a Theory of Property Rights’, American Economic Review, Issue 57, pp. 347-359.
di Patti, EB & Hardy, DC 2001, ‘Bank Reform and Bank Efficiency in Pakistan’, IMF Working Paper WP/01/138.
di Patti, EB & Hardy, DC 2005, ‘Financial sector liberalization, Bank privatization, and Efficiency: Evidence from Pakistan’, Journal of Banking and Finance, Vol. 29, pp. 2381-2406
Dinc, S 2005, ‘Politicians and Banks: Political Influences on Government-Owned Banks in Emerging Countries’, Journal of Financial Economics,
Donahue JD 1989, The Privatization Process, Basic Books, New York.
Estache, A, & Rossi, M 2002, ‘How different is the Efficiency of Public and Private Water Companies in Asia?’, The World Bank Economic Review, Vol. 16, Issue 1, pp. 139-148.
Fama, EF & Jensen, MC 1983, ‘Separation of Ownership and Control’, Journal of Law and Economics, Vol. 27, pp. 301-325.
Figueira, C, Nellis, J & Parker, D 2009, ‘The effects of ownership on bank efficiency in Latin America’, Applied Economics, Vol. 41, Issue 18, pp. 2353-2368.
Frech (III), HE 1976, ‘The Property Rights Theory of the Firm: Empirical Results from Natural Experiment’, The Journal of Political Economy, Vol. 84, Issue 1, pp. 134-152.
Furubotn, EG & Pejovich, S 1972, ‘Property Rights and Economic Theory: A Survey of Recent Literature’, Journal of Economic Literature, pp. 1137-1162.
Furubotn, EG & Pejovich, S 1974, ’Introduction: the New Property Rights Literature’, in EG Furubotn and S Pejovic (eds.), The Economics of Property Rights, Ballinger Publishing Company, Cambridge, pp. 1-9.
Glaeser, E & Shleifer, A 1998, ‘Not-for profit Enterpreneurs’, Mimeo.
Grosse, R & Yanes, J 1998, ‘Carrying out a Successful Privatization: The YPF Case’, Academy of Management Executives, Issue 12, pp. 67-73.
Grossman, S & Hart, O 1986, ‘The Costs and Benefits of Ownership: A Theory of Vertical and Lateral Integration’, Journal of Political Economy, Vol. 94, pp. 691-719.
Hanif, MN 2003, ‘Restructuring of Financial Sector in Pakistan’, The Journal of the Institute of Bankers in Pakistan.
Hansmann, H 2000, The Ownership of Enterprise, Harvard University Press, London.
Hart, O 1995, Firms, Contacts, and Financial Structure, Oxford University Press, Oxford.
60
Hart, O & Moore, J 1990, ‘Property Rights and the Nature of the Firm’, Journal of Political Economy, Vol. 98, Issue 6, pp. 1119-1158.
He, X 2002, ‘China State-owned Enterprise Reform: Past, Present and Future’, unpublished manuscript.
Horne, JV & Wachowicz, J 2005, Fundamentals of Financial Management, Pearson Education, 12th Edition, New Delhi.
Jefferson, GH & Rawski, TG 1994, ‘Enterprise Reform in Chinese Industry’, Journal of Economic Perspective, Issue 8, pp. 47-70.
Jha, R & Sahni, BS 1992, ‘Measures of Efficiency in Private and Public Sector Industries: The case of India’, Annals of Public and Cooperative Economics, Vol. 63, pp. 489-495.
Kay, JA & Thompson, DJ 1986, ‘Privatization: A Policy in search of a Rationale’, Economic Journal, Issue 96, pp. 18-32.
Khan, AH 1995, ‘Need and Scope for further Reforms in the Financial Sector in Pakistan’, The Journal of the Institute of Bankers in Pakistan.
Khwaja, A, & Mian, A 2005, ‘Do Lenders Favor Politically Connected Firms? Recent Provision in an Emerging Financial Market’, Quarterly Journal of Economics.
Krueger, AO 1990, ‘Government Failures in Development’, Journal of Economic Perspective, Vol. 4, Issue 3, pp. 9-23.
Kumbhakar, SC & Hjalmarsson, L 1998, ‘Relative Performance of Public and Private Ownership under Yardstick Competition: Electricity Retail Distribution’, European Economic Review, Issue 42, pp. 97-122.
La Porta, R, Lopez-de-silanes, F & Shleifer, A 2002, ‘Government Ownership of Banks’, Journal of Finance, Vol. 57, Issue 2, pp. 265-301.
Landes, WM & Posner, RA 1975, ‘The Independent Judiciary in an Interest Group Perspective’, Journal of Law and Economics, Vol. 18, pp. 875-901.
Lindblom, CE 1977, ‘Politics and Markets’, Basic Books, New York.
Liu, Z 1995, ‘The Comparative Performance of Public and Private Enterprises, The Case of British Ports’, Journal of Transport Economics and Policy, September.
Majumdar, SK 1998, ‘Assessing Comparative Efficiency of the State-owned, Mixed and Private sectors in Indian industry’; Public Choice, Vol.96, pp. 1-24.
Marathe, SS 1989, Regulation and Development, Sage, New Delhi.
Megginson, WL, Nash, RC & van Randenborgh, M 1994, ‘The Financial and Operating Performance of Newly Privatized firms: An International Empirical Analysis’, Journal of Finance, vol. 69, pp. 403-452.
61

Micco, A, Panizza, U & Yanez, M 2005, ‘Bank Ownership and Performance: Does Politics Matter?’, Working Paper N 356, Central Bank of Chile.
Milgrom, P & Roberts, J 1992, Economics, Organization and Management, Prentice Hall, N.J.
Mirrless, JA 1976, ‘The Optimal Structure of Incentives and Authority within an Organization’, Bell Journal of Economics, Issue 7, pp. 105-131.
Mueller, DC 1976, ‘Public Choice: A Survey’, Journal of Economic Literature, Vol. 14, Issue 2, pp. 395-433.
Mueller, DC 1989, Public Choice, Cambridge University Press, Cambridge.
Qayyum, A & Ahmed, M 2006, ‘Efficiency and Sustainability of Micro Finance Institutions in South Asia’, South Asian Network of Economic Research Institute.
Rainey, H, Backoff, RW & Levine, CH 1978, ‘Comparing Public and Private Organizations, Public Administration Review, Issue 36, pp. 223-244.
Ramaswamy, K 2001, ‘Organizational Ownership, Competitive Intensity, and Firm Performance: An Empirical Study of Indian Manufacturing Sector’, Strategic Management Journal, Issue 22, pp. 989-998.
Robson, C 2002, Real World Research, Second Edition, Blackwell, Oxford.
Ross, SA, Westerfield, RW & Jaffe, J 2005, Corporate Finance, 7th Edition, McGraw-Hill Inc.
Sabi, M 1996, ‘Comparative Analysis of Foreign and Domestic Bank Operations in Hungary’, Journal of Comparative Economics, Vol. 22, pp. 179-188.
Samad, A 1999, ‘Comparative Efficiency of the Islamic Bank Malaysia vis-à-vis Conventional Banks’, IIUM Journal of Economics and Management, Vol. 7, Issue 1, pp. 1-25.
Samad, A & Hassan, K 2000, ‘The Performance of Malaysian Islamic Banking during 1984-1997: An Exploratory Study’, Thoughts on Economics, Vol. 10, Issue 1 & 2, pp. 7-26.
Sapianza, P 2004, ‘The Effects of Government Ownership on Bank Lending’, Journal of Financial Economics, Vol. 72, Issue 2, pp. 357-384.
Saunders, M, Lewis, P & Thornhill, A 2003, Research Methods for Business Students, Pearson Education, New Delhi.
Shleifer, A & Vishny, RW 1994, ‘Politicians and Firms’, The Quarterly Journal of Economics, Issue 106, pp. 995-1025.
Shleifer, A 1998, ‘State versus Private Ownership’, The Journal of Economic Perspectives, Vol. 12, Issue 4, Autumn, pp. 133-150.
62

Solomon, EE 1986, ‘Private and Public Sector Managers: An Empirical Investigation of Job Characteristics and Organizational climate’, Journal of Applied Psychology, Vol. 71, Issue 2, pp. 247-259.
Spann, RM 1977, ‘Public vs. Private Provision of Government Services’, in Thomas E. Borcherding (eds.). Budgets and Bureaucrats: The Sources of Government Growth, Duke Univ. Press, Durham, N.C.
Spindler, A 1991, ‘The Performance of Internationally Active Banks and Securities Firms’, Federal Reserve Bank of New York (Staff Study), May.
Stainer, L 2006, ‘Performance Management and Corporate Social Responsibility: The Strategic Connection’, Journal of Strategic Change, Vol. 15, pp. 253-264.
State Bank of Pakistan 2010, ‘Addresses of Banks/Development Finance Institutions Being Regulated by State Bank of Pakistan’, in State Bank of Pakistan-The Central Bank, accessed 29 May 2010, from <http://www.sbp.org.pk/f_links/index.asp>
Stiglitz, J 1994, ‘The Role of the State in Financial Markets’, Proceedings of the World Bank Annual Conference on Economic Development 1993, Washington D.C.
Tierney, J 1998, The U.S. Postal Service, Auburn House, New York.
Thompson, JD 1962, ‘Common and Uncommon Elements in Administration’, Social Welfare Reform, pp. 181-201.
Ul-Haque, N 1997, ‘Financial Market Reform in Pakistan’, The Pakistan Development Review Part-II, Vol. 36, Issue 4, pp. 839-854.
Vickers, J, Yarrow, G 1988, Privatization: An Economic Analysis, MIT Press, Cambridge, MA.
Wamsley, GL & Zald, MN 1973, ‘The Political Economy of Organizations’, Lexington, MA, D.C. Heath.
Weisbrod, B 1988, Non Profit Economy, Harvard University Press, Cambridge, M.A.
Whitehead, C 1988, ‘Introduction, Theory and Practice’, In C. Whitehead (eds.), Reshaping the Nationalized Industries, Transaction Books, New Brunswick, New Jersy, pp. 1-21.
Williamson, OE 2002, ‘The theory of the Firm as Governance Structure: From Choice to Contract’, Journal of economic perspectives, Vol. 16, Issue 3, Summer, pp. 171-195.
Wintrobe, R 1987, ‘The Market for Corporate Control and the Market for Political Control’, Journal of Law, Economics and Organization, Vol. 3, Fall, pp. 435-448.
Zeitun, R & Tian, GG 2007, ‘Does ownership affect a firm’s Performance and default risk in Jordan?’, Corporate Governance, Vol. 7, Issue 1, pp. 66-82.
63
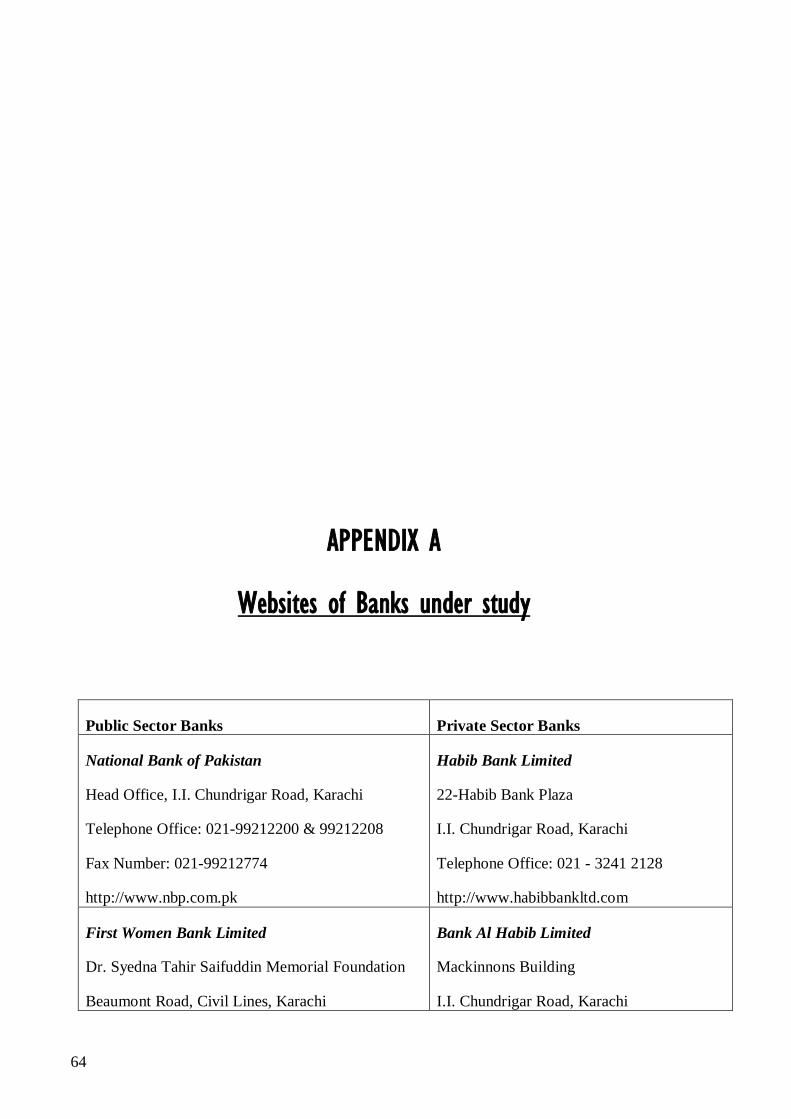
APPENDIX A
Websites of Banks under study
Public Sector Banks Private Sector Banks
National Bank of Pakistan
Head Office, I.I. Chundrigar Road, Karachi
Telephone Office: 021-99212200 & 99212208
Fax Number: 021-99212774
http://www.nbp.com.pk
Habib Bank Limited
22-Habib Bank Plaza
I.I. Chundrigar Road, Karachi
Telephone Office: 021 - 3241 2128
http://www.habibbankltd.com
First Women Bank Limited
Dr. Syedna Tahir Saifuddin Memorial Foundation
Beaumont Road, Civil Lines, Karachi
Bank Al Habib Limited
Mackinnons Building
I.I. Chundrigar Road, Karachi
64

Telephone Office:021-35657681, 35657683
Fax Number:021-35657755
http://www.fwbl.com.pk
Telephone Office: 021- 32419216
Fax Number: 021- 32419752
http://www.bankalhabib.com
The Bank of Punjab
Head Office, BOP TOWER, 10-B, Block E-11,
Main Boulevard Gulberg-III, Lahore
Telephone Office:042-35783711 & 35783712
Fax Number:042-35783713
http://www.bop.com.pk
Atlas Bank Limited
3rd Floor, Federation House
Abdullah Shah Ghazi Road, Clifton, Karachi
Telephone Office: 021-32463570
Fax Number: 021-32463571
www.atlasbank.com.pk
APPENDIX B
Description of Financial Ratios’ Variables
Following balance sheet and income statement items are used in ratio analysis.
Earning Assets = Balances with other banks + Lending to financial institutions + Investments + Advances.
Loans = Advances.
Net Interest Income = Interest earned – Interest expensed.
Net Profit = Profit before tax – Taxation.
Profit before Tax = Total revenue – Total expenses.
Shareholders’ Equity = Share capital + Reserves + Unappropriated profit.
Total Assets = Cash & balances with treasury banks + Balances with other banks + Lending to financial institutions + Investments + Advances + Other assets + Operating fixed assets + Deferred tax assets.
Total Cash Holdings = Cash & balances with treasury banks.
Total Debt = Borrowings from financial institutions.
65
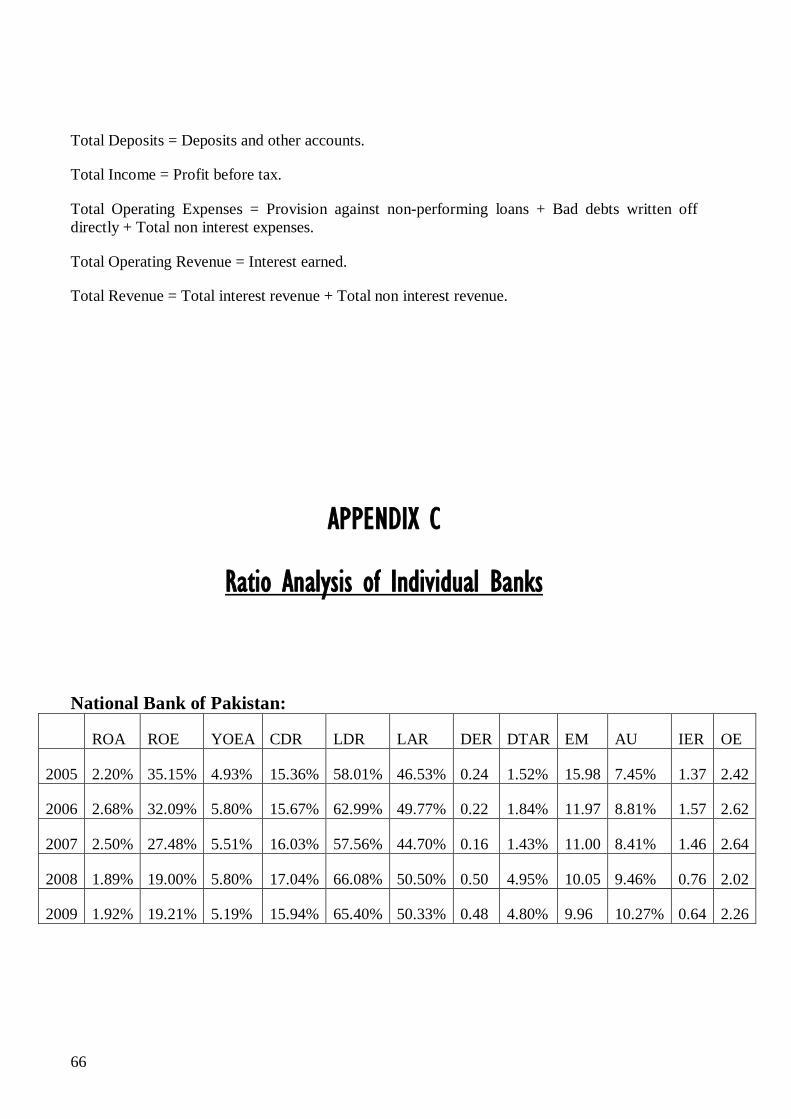
Total Deposits = Deposits and other accounts.
Total Income = Profit before tax.
Total Operating Expenses = Provision against non-performing loans + Bad debts written off directly + Total non interest expenses.
Total Operating Revenue = Interest earned.
Total Revenue = Total interest revenue + Total non interest revenue.
APPENDIX C
Ratio Analysis of Individual Banks
National Bank of Pakistan:
ROA ROE YOEA CDR LDR LAR DER DTAR EM AU IER OE
2005 2.20% 35.15% 4.93% 15.36% 58.01% 46.53% 0.24 1.52% 15.98 7.45% 1.37 2.42
2006 2.68% 32.09% 5.80% 15.67% 62.99% 49.77% 0.22 1.84% 11.97 8.81% 1.57 2.62
2007 2.50% 27.48% 5.51% 16.03% 57.56% 44.70% 0.16 1.43% 11.00 8.41% 1.46 2.64
2008 1.89% 19.00% 5.80% 17.04% 66.08% 50.50% 0.50 4.95% 10.05 9.46% 0.76 2.02
2009 1.92% 19.21% 5.19% 15.94% 65.40% 50.33% 0.48 4.80% 9.96 10.27% 0.64 2.26
66

First Women Bank Limited:
ROA ROE YOEA CDR LDR LAR DER DTAR EM AU IER OE
2005 1.27% 19.02% 4.64% 8.33% 28.25% 23.44% 1.20 8.06% 14.96 6.75% 0.49 2.42
2006 1.84% 19.10% 6.10% 10.13% 44.02% 34.11% 1.07 10.36% 10.35 8.72% 0.88 2.49
2007 1.76% 15.36% 6.54% 10.70% 40.47% 34.09% 0.02 0.24% 8.74 8.54% 0.67 1.92
2008 1.45% 9.33% 8.28% 9.70% 55.64% 45.24% 0.02 0.37% 6.43 11.32% 0.46 1.78
2009 -0.78% -7.57% 5.37% 8.14% 37.39% 31.92% 0.03 0.30% 9.69 9.39% -0.15 1.59
The Bank of Punjab:
ROA ROE YOEA CDR LDR LAR DER DTAR EM AU IER OE
2005 2.11% 34.72% 3.50% 9.93% 71.92% 57.24% 1.00 6.11% 16.40 6.70% 1.95 3.78
2006 2.30% 35.69% 2.80% 10.20% 73.57% 61.46% 0.66 4.24% 15.47 8.80% 2.15 5.24
2007 1.89% 29.42% 1.70% 7.40% 69.75% 56.98% 1.18 7.59% 15.55 9.77% 1.17 4.22
2008 -5.41% -198.94% 0.72% 6.51% 80.29% 70.86% 2.43 6.60% 36.77 11.80% -0.77 0.81
2009 N/A* N/A N/A N/A N/A N/A N/A N/A N/A N/A N/A N/A
*Data Not Available
67

Habib Bank Limited:
ROA ROE YOEA CDR LDR LAR DER DTAR EM AU IER OE
2005 1.76% 28.37% 5.45% 7.92% 73.84% 60.78% 0.96 5.96% 16.10 7.55% 0.79 1.86
2006 2.54% 31.19% 6.12% 10.52% 76.41% 59.69% 1.09 8.88% 12.30 9.29% 1.16 2.39
2007 1.23% 15.85% 5.46% 10.88% 71.17% 52.24% 1.03 7.96% 12.92 8.59% 0.52 1.91
2008 1.39% 16.32% 5.92% 9.85% 76.12% 60.74% 0.72 6.12% 11.70 9.97% 0.58 2.22
2009 1.50% 17.26% 6.16% 12.17% 66.15% 52.65% 0.68 5.86% 11.52 10.32% 0.63 2.43
Bank Al Habib Limited:
ROA ROE YOEA CDR LDR LAR DER DTAR EM AU IER OE
2005 1.60% 30.85% 3.51% 10.00% 72.96% 60.44% 1.32 6.86% 19.28 6.53% 1.12 2.73
2006 1.53% 28.46% 3.79% 10.22% 77.44% 61.56% 1.74 9.38% 18.59 8.02% 1.10 3.20
2007 1.56% 27.59% 3.51% 11.99% 69.00% 56.09% 1.23 6.95% 17.62 8.55% 0.94 3.05
2008 1.37% 24.33% 4.32% 8.27% 69.40% 56.50% 1.24 6.98% 17.79 9.61% 0.78 3.18
2009 1.14% 23.25% 4.09% 7.60% 56.00% 42.43% 2.73 13.42% 20.33 9.59% 0.76 3.72
68

Atlas Bank Limited:
ROA ROE YOEA CDR LDR LAR DER DTAR EM AU IER OE
2005 0.05% 0.25% 1.86% 9.28% 36.57% 10.05% 2.70 51.52% 5.24 4.92% 0.07 2.73
2006 0.05% 0.28% 0.85% 6.80% 88.59% 46.02% 1.29 23.65% 5.46 5.81% -0.39 2.45
2007 -1.34% -5.88% 0.23% 9.80% 60.32% 40.21% 0.25 5.68% 4.37 7.33% -0.58 1.42
2008 -3.5% -23.78% 2.34% 8.68% 110.21% 70.94% 1.25 18.38% 6.82 11.12% -0.66 1.24
2009 -5.5% -66.68% 0.80% 6.03% 73.43% 62.26% 0.37 30.06% 12.09 11.13% -1.05 1.31
APPENDIX D
Lending Behaviour of Individual Banks
Sector Name of Bank
2004 2005 2006 2007 2008 2009
Public National Bank of Pakistan
220,794.08 268,838.78 316,110.41 340,677.10 412,986.86 475,243.43
First Women Bank Limited
1,649.12 2,462.10 3,066.25 3,063.51 3,304.33 3,274.22
The Bank of Punjab
39,438.92 63,623.70 101,319.95 133,893.58 131,731.16 N/A*
69

Private Habib Bank Limited
250,612.46 307,602.75 335,985.46 362,260.53 435,708.66 432,283.59
Bank Al Habib Limited
47,366.95 55,303.78 70,795.96 79,224.38 100,197.00 105,985.32
Atlas Bank Limited
57.62 799.41 7,833.79 9,242.51 20,549.87 19,219.93
Table-1. Lending of individual banks in million rupees
Source: Financial statements of respective banks
* Data Not Available
Sector Name of Bank 2005 2006 2007 2008 2009
Public National Bank of Pakistan
21.76% 17.58% 7.77% 21.22% 15.07%
First Women Bank Limited
49.30% 24.54% -0.09% 7.86% -0.91%
The Bank of Punjab 61.32% 59.25% 32.15% -1.62% N/A*
Private Habib Bank Limited 22.74% 9.23% 7.82% 20.27% -0.79%
Bank Al Habib Limited
16.76% 28.01% 11.90% 26.47% 5.78%
Atlas Bank Limited 1287.38% 879.95% 17.98% 122.34% -6.47%
Table-2. Percent increase or decrease in loans from previous year by individual banks
* Data Not Available
70

71