Embed Size (px)
Citation preview

The Effect of Option-based Compensation on Payout Policy
Evidence from FAS123R
Fabrizio Ferri
Columbia University
ff2270gsbcolumbiaedu
Nan Li
Columbia University
Nli18gsbcolumbiaedu
Corresponding Author Columbia Business School Columbia University Uris Hall 618 3022 Broadway New York
NY 10027 phone (212) 854-0425 We thank Vivian Fang Wei Jiang Christian Leuz Shiva Rajgopal and workshop participants at Columbia University
and Temple University for their comments We thank Jack Ciesielski of The Analystrsquos Accounting Observer for
sharing his data on accelerated vesting with us The study has been accepted for presentation at the 2016 Accounting
Conference at Temple University and the 2017 American Finance Association Annual Meeting
The Effect of Option-based Compensation on Payout Policy
Evidence from FAS123R
Abstract
Does option-based compensation have a causal influence on payout policy To address this
question we examine the adoption of mandatory expensing of stock options (via accounting
standard FAS123R) a plausible exogenous shock to the use of option-based compensation As
FAS123R applies to all firms our identification strategy exploits the fact that the reduction in
option-based compensation in response to the accounting standard varies with the firm-specific
expected accounting impact as measured by the option expense disclosed in the footnotes prior to
FAS123R Using a difference-in-difference research design we do not find that (accounting-
driven) reductions in option-based pay cause dividends to increase repurchases to decrease or the
payout composition to change Our results contrast with the widely held belief that option-based
pay has a causal influence on payout policy and cast doubts on its role in the shift from dividends
to repurchases in recent decades
JEL Classification G35 M41 M48 M52
Keywords dividends repurchases executive stock options FAS123R payout policy
1
1 Introduction
In this study we examine whether option-based executive compensation has a causal
influence on payout policy Payout policy plays a key role in corporate finance (Miller and
Modigliani 1961 Jensen 1986 Fama and French 2001) How much cash to return to shareholders
and how to do it (ie dividends or repurchases) has implications for the firmrsquos investment and
capital structure policy signals the quality of future prospects affects investorsrsquo taxes and
ultimately impacts firm value As noted in a recent paper (Farre-Mensa Michaely and Schmalz
2014) traditional theories of payout policy (eg agency signaling clientele and tax-based
theories) explain some of the cross-sectional variation in corporate payouts However they have
limited power in explaining secular changes over the last 30 years during which repurchases have
replaced dividends as the primary payout vehicle (Skinner 2008) In contrast a number of studies
suggest that this trend may reflect the simultaneous increase in the use of stock options for
executive compensation
Previous research has identified two ways option-based compensation may affect payout
policy The first is the dividend-protection channel Because the value of a call option decreases
with dividends and executive stock options are generally not dividend-protected (due to an
unfavorable accounting treatment)1 option grants give managers the incentive to avoidreduce
dividends and (if there is a target payout amount) to replace them with repurchases (Lambert
Lanen and Larcker 1989)
1 Zhang (2013) finds that between 2000 and 2009 less than 1 of SampP 500 firms provide dividend protection
confirming evidence for earlier periods (Murphy 1999 Weisbenner 2000 Cuny Martin and Puthenpurackal 2009)
Researchers have attributed this low frequency to the unfavorable accounting treatment (Fenn and Liang 2001)
Dividend protection is effected through adjustments to an optionrsquos exercise price Under Accounting Principles Board
Opinion No25 (APB 25) dividend-protected options were considered variable plan options because the exercise price
was not ldquofixedrdquo but contingent upon future events (eg a dividend payment) As such their cost had to be reported in
the income statement at each measurement date (each quarter) based on their intrinsic value (difference between stock
price and exercise price) In contrast options with ldquofixedrdquo terms required a compensation expense based on intrinsic
value at the grant date (typically zero since fixed options were granted with an exercise price equal to the stock price)
2
The second way is the dilution channel which refers to the incentive to use repurchases to
offset the dilutive effect from the exercise of employee stock options (ESO) In a survey of
financial executives over two-thirds of the respondents claim that offseting the dilutionary effect
of stock option plans or other stock programs is an important factor to their repurchase decisions
(Brav Graham Harvey and Michaely 2005) A variation of the dilution argument further notes
that even before the exercise of ESO managers have an incentive to use repurchases to manage the
dilutive effect of in-the-money unexercised options on diluted earnings-per-share (EPS) (Bens
Nagar Skinner and Wong 2003)2 Under these dilution-related arguments firms with more ESO
would engage in larger repurchases Besides if these firms have a target payout amount they
would have an incentive to replace dividends (or future dividend increases) with repurchases
In sum both the dividend-protection and the dilution channels predict that managers of
firms with a large amount of option-based compensation will favor repurchases over dividends A
number of studies have provided empirical evidence consistent with this prediction3
However there are three reasons to re-examine this question First if boards anticipate the
lack of dividend protectionrsquos effect they can increase management compensation to offset the loss
caused by the dividend payments Second changes to payout policy are visible and highly
2 Generally Accepted Accounting Principles (GAAP) require firms to report basic EPS and diluted EPS The
denominator of basic EPS is generally the number of common shares outstanding and thus it is affected by ESO only
when they are exercised In contrast the denominator of diluted EPS takes into account lsquolsquopotentially dilutiversquorsquo
securities such as ESO using the so-called treasury stock method Under this method the denominator of diluted EPS
increases as outstanding unexercised ESOs move into the money Note that firms have incentives to use repurchases to
manage EPS regardless of whether they use ESO (Hribar Jenkins and Johnson 2006) 3 Lambert et al (1989) finds that dividends decrease in the five-year period following the adoption of executive stock
option plans Jolls (1998) documents that firms relying more on option compensation are more likely to buy back
shares Weisbenner (2000) documents a positive association between exercises of ESO and repurchases Fenn and
Liang (2001) show that option compensation is negatively associated with dividends and positively associated with
repurchases Kahle (2002) finds that the number of exercisable employee stock options predicts the occurrence and
amount of repurchases (consistent with the dilution channel) and that the number of executive stock options predicts
the repurchase decision (consistent with the dividend-protection channel) Chetty and Saez (2005) finds that firms
whose executives held more options were less likely to increase dividends in response to the dividend tax reduction in
2003 Zhang (2013) Burns McTier and Minnick (2015) and Minnick and Rosenthal (2015) document that firms with
a greater proportion of dividend-protected equity pay have higher dividend payouts Bens et al (2003) and Cuny et al
(2009) show that repurchases are positively correlated with the dilutive effect of ESO on diluted EPS
3
scrutizined Given the relevance of payout choices to boards analysts and institutional investors
it is not likely that managers could easily modify payout policy to maximize personal wealth
without facing serious scrutiny Third the associations documented in earlier studies may reflect
the endogenous nature of executive pay A compensation contract is designed to mitigate agency
problems that manifest in various corporate policies This feature makes treatment assignment
(eg stock option grants) prone to factors that could affect both executive pay and payout policy
some of which may be unobservable and cannot be easily controlled for (the omitted variable bias
problem) For example a firm with a positive innovation opportunity shock may both choose a
low dividend level to preserve internal capital and grant executive stock options to induce risk
taking Furthermore executive pay may be the result of anticipated payout policy (the reverse
causality problem) For example if a board wants to raise dividends it may give the CEO a pay
package with fewer options and more (dividend-paying) restricted stocks (Aboody and Kasznik
2008) Different causal channels linking executive pay and firm payout possibly coexist and are
difficult to disentangle empirically As emphasized by Edmans and Gabaix (2015) the effects of
executive compensation in general have not been satisfactorily identified largely due to the
scarcity of valid instrumental variables
To address these problems we utilize the 2005 adoption of Financial Accounting Standard
123R (hereinafter FAS123R) as an exogenous shock to the use of option compensation 4
Previously firms were required to expense ESOrsquos intrinsic value at the grant date while disclosing
the fair value amount in footnotes (this amount is referred to as lsquoimplied option expensersquo) As most
ESO were granted at the money and thus with zero intrinsic value (Hall and Murphy 2002) firms
4 FAS123R was introduced in response to the Enron-type accounting scandals of 2001-2002 At that time many
observers argued that overly favorable reporting treatment had led to an excessive use of option-based compensation
(Hall and Murphy 2003) that lsquolsquoperversely created incentives to artificially inflate reported earnings in order to keep
stock prices high and risingrsquorsquo (Greenspan 2002) Thus it is reasonable to assume that FAS123R was exogenous with
respect to trends in payout policy
4
reported no expense in their income statements FAS123R required firms to expense ESO in the
income statement at fair value Consistent with FAS123R increasing the perceived cost of stock
options (Murphy 2013) various studies have documented a large decrease in the use of stock
options subsequent to its introduction (Carter Lynch and Tuna 2007) Hayes Lemmon and Qiu
(2012) report a decline in the median ratio of the value of option grants to total pay from 397 to
139 following FAS123Rrsquos implementation Such a sudden change in executive pay
composition is rare (Frydman and Jenter 2010) and thus provides a unique opportunity to
investigate its effect on payout policy
This setting has additional benefits as well One such benefit is that the decrease in ESO
predicts an increase in dividends Settings that predict a decrease in dividends are arguably less
powerful as firms are notoriously reluctant to cut dividends given the evidence of a negative
investorsrsquo reaction (Brav et al 2005)5 Also the period subsequent to FAS123R witnessed a
general increase in corporate payouts (Floyd Li and Skinner 2015) These factors all combine to
produce a powerful setting to detect a compensation-induced increase in dividends
While FAS123R created an exogenous shock to the use of option-based compensation a
major challenge to the research design remains The accounting standard is applied to all public
firms making it difficult to construct control groups To tackle this challenge our empirical
strategy exploits the idea that FAS123Rrsquos impact likely varies across different types of firms We
conjecture that firms facing a larger hit on their reported earnings (as measured by a higher implied
option expense in 2002 prior to FAS123R) will reduce option grants significantly more than other
firms Indeed in our sample option compensation as percentage of total executive pay drops from
507 to 325 for firms in the top quartile of implied option expense versus 201 to 167 for
5 Indeed association studies reporting a negative association between option-based pay and dividends frame the issue
in terms of lower dividend increases (ie repurchases substituting for future dividend increases in option-heavy firms)
rather than in terms of dividend decreases
5
firms in the bottom quartile Using this cross sectional variation our strategy is a difference-in-
difference design where the first difference is the adoption of FAS123R and the second is the pre-
event implied option expense effectively our proxy for the expected accounting-induced reduction
in option-based compensation The key identification assumption is that the level of implied
option expense (prior to the announcement of FAS123R) is not correlated with the potential future
change in payout variables in the absence of treatment (ie FAS123R) We discuss this
assumption further in Section 2
We perform our empirical tests using a sample of SampP 1500 firms between 2003 and 2007
a five-year event window surrounding the 2005 adoption of FAS123R In particular we estimate
the association between implied option expense measured in 2002 and thus prior to the event
window and the change in the average payout variables from the ldquoprerdquo (2003-2004) to the ldquopostrdquo
(2005-2007) period after controlling for known determinants of payout policy Across various
measures of dividend changes we do not find that firms with higher implied option expense
increased their dividends relative to firms with lower implied option expense both in the full
sample and in a sub-sample of firms that paid dividends prior to FAS123R Also among firms
that did not pay dividends prior to FAS123R those with higher implied option expense did not
experience a relative increase in the rate of dividend initiation This lack of an effect on dividend
payouts is remarkable given that the accounting-induced decline in option-based pay was
accompanied by a corresponding increase in restricted stock awards which generally pay
dividends Further we find no association between implied option expense and changes in the
level of repurchases or changes in the relative weights of dividends and repurchases
Our results are robust to using alternative measures of dividends and repurchases
employing a panel regression (rather than a first-difference regression) and excluding the year of
6
adoption 2005 They are also robust to excluding firms that may have taken actions in anticipation
of the expected adoption of FAS123R (eg voluntarily expensing options) Finally to further
address the lack of a control group we follow Bakke Mahmudi Fernando and Salas (2015) and
define control firms as those voluntarily expensing options and those issuing no options to the
CEO prior to FAS123R on the ground that these firms were likely unaffected by the new standard
Our inferences remain unchanged
Overall the evidence is not consistent with the prediction that option-based compensation
has a first-order causal impact on payout policy and suggests that the previously documented
associations perhaps reflect endogeneity rather than a causal influence Our findings should not be
viewed as denying that stock options provide an incentive to favor repurchases over dividends
Rather they suggest this incentive does not imply an unconstrained ability to change payout policy
in a self-serving way likely because of the visibility of payout policy and its relevance to boards
and institutional investors 6 In addition boards may compensate executives for the lack of
dividend-protection in other ways effectively neutralizing those incentives Notably our findings
are consistent with managersrsquo statements that lack of dividend-protection does not affect payout
decisions (Brav et al (2005) who highlight this stark contrast between their survey evidence and
the empirical associations in the literature)7 Our results also provide another explanation for the
persistent lack of dividend protection in executivesrsquo options boards are not concerned with its
6 Note that our results are not inconsistent with evidence that managers take actions to increase personal wealth in
settings where the level of scrutiny is lower (eg timing of option grants backdating Heron and Lie 2007) or where it
is harder for outsiders to detect personal motives (eg risk-taking activities that increase the value of options Bakke et
al 2015) 7 Only 106 of surveyed executives agree that lack of dividend protection may cause managers to favor repurchases
over dividends ndash the lowest level of support among all the questions in the survey Of course it is possible that
managers would not admit to the effect on their behavior but similar surveys have elicited candid responses For
example a large percentage of managers surveyed by Graham Harvey and Rajgopal (2005) admit that they would
sacrifice economic value to smooth earnings or to hit an earnings target
7
effect because they can mitigate it by directly monitoring payout choices andor adjusting
compensation packages
Our study contributes to a vast literature on the determinants of payout policy First while
many studies document an association between option-based pay and payout policy limited
attempts have been made to examine its causal nature8 Addressing this question will enhance our
understanding of temporal changes in payout policy such as the emergence of repurchases as
primary payout vehicle (Farre-Mensa et al 2014) and the recently observed lsquoresiliencersquo of
dividends (Floyd et al 2015) Using the plausible exogenous variation in ESO induced by
FAS123R our evidence calls into question the notion that option-based compensation is a first-
order driver of payout policy and challenges future research to consider alternative explanations
for the trends in corporate payouts Second we extend the research that examines how
institutional changes affect payout policy Most of these studies examine changes in dividend tax
rates (eg Chetty and Saez 2005 Brown Liang and Wesibenner 2007 Aboody and Kasznik 2008
Blouin Raedy and Shackelford 2011 Hanlon and Hoopes 2014) or in the information environment
(Hail Tahoun and Wang 2014) while we examine a new accounting standard that affected the
composition of executive pay
We also contribute to a recent stream of research that uses exogenous shocks to understand
the economic impact of option-based pay (Low 2009 Gormley Matsa and Milbourn 2013) Some
of these studies use FAS123R to examine the causal effect of option-based pay on risk-taking with
mixed findings (Chava and Purnanandam 2010 Hayes Lemmon and Qiu 2012 Bakke et al 2015
Chu and Ma 2015) We extend this research in two ways First we use FAS123R to examine the
8 A notable exception is Shue and Townsend (2014) who instrument change in option grants with predicted new
option grant cycle and find that dividend growth is slower in the first year of a new option grant cycle than other years
An important premise underlying this approach is that the outcomes respond almost instantaneously to the treatment
In this paper we are more concerned with the longer-term effects of ESO as payout tends to be sticky and may
respond to the treatment only gradually (Lambert et al 1989)
8
effect of option-based pay on a different yet important economic outcome payout policy Second
our metholodogy differs from prior studies in that it explicitly incorporates cross-sectional
variation in how firms were affected by FAS123R Future work may use this approach to examine
the effect of option-based pay on other corporate policies
Finally we extend the literature on how accounting rules impact a firmrsquos economic
behavior (eg Carter and Lynch 2003 Carter et al 2007 Bens and Mohanan 2008 Choudhary
Rajgopal and Venkatachalam 2009 Graham Hanlon and Shevlin 2011) as well as the literature on
the accounting treatment for stock options (Aboody 1996 Dechow Hutton and Sloan 1996
Aboody Barth and Kasznik 2004 Ferri and Sandino 2009)
2 Research Design
21 Empirical Strategy
It is commonly recognized that identifying the causal effects of executive compensation in
empirical studies is challenging (Edmans and Gabaix 2015) FAS123R provides a unique
opportunity to address this problem Aside from significantly reducing the use of option
compensation the accounting change should not in itself correlate with the outcomes of interest
(ie change in payout policy)9 However utilizing FAS123R is not easy because it affected all
US firms at the same time making it difficult to measure a counterfactual change around the
event based on a control group A simple before-after comparison of the outcome variable around
the adoption of FAS123R would assume that any change is driven entirely by the event of interest
(ie it would assume away any conterfactual trend in the outcome variable) a questionable
assumption An alternative strategy is to use the change in option-based compensation around
9 Hayes et al (2012) describes FAS123R as an exogenous change in the accounting benefits of stock options without a
change to the economic costs and benefits of stock options while Bakke et al (2015) describes it as causing a change
in executivesrsquo but not shareholdersrsquo incentives
9
FAS123R effectively assuming that such change is ldquoexogenousrdquo (eg Chava and Purnanandam
2010 Anantharaman and Lee 2014) The problem with this approach is that FAS123R per se did
not generate exogenous cross-sectional variation in option compensation Even if the introduction
of FAS123R is exogenous a firmrsquos response cannot be assumed to be entirely exogenous10
To identify the exogenous portion of firmsrsquo response to the new standard we make use of
evidence that FAS123Rrsquos impact on the use of option compensation varies with the firm-specific
expected accounting impact of the new rule as measured by the implied option expense disclosed
in the footnotes prior to FAS123R (Hayes et al 2012) The reduction in option usage is highest in
firms with the largest implied option expense Thus we can use the differential accounting impact
of FAS123R to overcome the problem of lacking control group
To validate our approach we estimate the following first-differencing regression with
ordinary lease square (OLS)
ΔOptioni = β0 + β1 Accounting Impacti + ΛControli +εi (1)
where ΔOptioni is the change in the average value of executive stock options as percentage of total
pay from the pre- to the post-FAS123R period Accounting Impacti is the implied option expense
measured prior to FAS123R (more details in Section 22) We expect β1 to be negative that is a
more pronounced reduction in option-based pay for firms with higher expected accounting impact
Next after validating the differential impact of FAS123R we examine the central question
of this study by estimating the following OLS regression
ΔPayouti = γ0 + γ1 Accounting Impacti + ΓControli +ui (2)
10 A universally assigned encouragement to receive treatment does not make the realization of treatment assignment
free from endogeneity concerns Consider the following example after the adoption of FAS123R firm A reduces the
weight of option-based pay by 20 and firm B by 40 A finding that firm B increases dividends compared to firm A
cannot be interpreted as evidence of a causal influence of option compensation on dividend policy This is because the
additional reduction in option compensation by firm B relative to firm A may not be driven by FAS123R It may
instead reflect an attempt to align executivesrsquo incentives with anticipated changes in dividend policy (reverse
causality) Without a way to incorporate the heterogeneous impact of FAS123R in the research design the cross
sectional variation in changes in option-based compensation is still subject to the usual endogeneity concerns
10
where ΔPayouti represents the change in the average value of one of the payout variables
of interest (described in Section 23) from the the pre- to the post-FAS123R period
Eq (2) is essentially a difference-in-difference approach to estimate the effect of option-
based pay on payout policy using the differential accounting impact of FAS123R to capture the
exogenous (accounting-induced) portion of the change in option-based pay If option-based pay
has a detectable causal effect on dividends (repurchases) in the direction predicted by the
literature γ1 should be positive (negative)
As noted by Bertrand Duflo and Mullainathan (2004) in difference-in-difference studies
with panel data OLS may yield inconsistent standard error estimates because the dependent
variable and the main independent variable tend to be serially correlated within firm To alleviate
this concern following Bertrand et al (2004) in both Eqs (1) and (2) we collapse the panel to a
single ldquoPrerdquo (2003-2004) and a single ldquoPostrdquo (2005-2007) period by averaging across years and
then measuring the changes from Pre to Post11 We choose 2003 as the starting period in order to
capture a period subsequent to the 2003 tax cut on individual dividend income While the
evidence on the effect of the tax cut on payout policy is mixed (Chetty and Saez 2005 Edgerton
2013 Floyd et al 2015) starting with 2003 allows the pre-FAS123R levels of the key variables to
reflect any effect of the tax cut 12 We end our analysis in 2007 to avoid the potentially
confounding effect of the 2008 financial crisis which had a significant impact on payouts (Floyd et
al 2015)13 Following Hayes et al (2012) and Bakke et al (2015) we include 2005 in the Post
11 In the collapsed two-period panel a regression of changes is equivalent to a regression of levels with firm-fixed
effects and an indicator for the Post period Both approaches obviate unobserved time-invariant firm heterogeneity
We choose first differencing equation for a more intuitive interpretation 12 The Jobs and Growth Tax Relief Reconciliation Act of 2003 was signed into law on May 28 2003 but had been
proposed on January 7 2003 and was made retroactive to the beginning of 2003 Chetty and Saez (2005) show that
the tax change affected dividend policy in 2003 13 In November 2006 the Securities and Exchange Commission required more details about the terms of performance-
based incentive plans We are not aware of any evidence that these rules affected the weight of option-based pay
11
period because FAS123R while effective in June 2005 was released in December 2004 14
Alternatively in untabulated tests we exclude 2005 from the analysis and obtain similar results
Another benefit of using a single Pre and Post period is that it is better suited than panel
data to the analysis of repurchases As noted by Skinner (2008) firms engaging in repurchases
tend to do so every other year thus the relation between repurchases and economic determinants is
stronger over two- or three-year periods than one-year periods Factors explaining the timing of
repurchases differ from those explaining their level and the year-to-year variation in repurchases is
not necessarily informative of changes in payout policy As we are not interested in the timing of
repurchases our approach seems to better capture ldquolong-runrdquo changes in payout policy However
for the analysis of dividends (which are generally paid every year and thus not subject to the
above problem) we also present the results using a panel regression with firm- and year-fixed
effects To alleviate the problem of serial correlation discussed earlier we cluster the standard
errors by firm
22 Accounting Impact
As noted earlier all firms were affected by FAS123R making it difficult to identify a
control sample To capture variation in the cross-sectional impact of FAS123R in Eqs (1) and (2)
we use Accounting Impacti defined as the implied option expense disclosed in the footnote of the
income statement for the 2002 fiscal year scaled by total assets (we obtain similar findings when
scaling it by revenues) We measure this variable in 2002 (ie before the Pre period) rather than in
2003 or 2004 to avoid any confounding effect from the expected adopion of FAS123R (see
discussion in Section 33) As this variable is highly skewed (see Table 1) we define it based on
(Gipper 2015) or had any effect on payout policy However we exclude 2007 from the Post period in robustness tests
Our inferences are unchanged 14 FAS123R was released in December 2004 effective as of the beginning of the first interim or annual reporting
period beginning after June 15 2005 Subsequently the SEC allowed a six-month deferral making the standard
effective for fiscal years beginning after December 15 2005
12
its quartile rank We also presents results with separate indicators for the top three quartiles in
order to better isolate the difference between top quartile (the most lsquotreatedrsquo group) and bottom
quartile (the least lsquotreatedrsquo group and thus closer to the notion of a control group)
An alternative way to address the issue of a lack of control group is suggested by Bakke et
al (2015) They argue that two sets of firms were likely lsquounaffectedrsquo by FAS123R (i) firms that
did not grant options to the CEO in 2003 and 2004 as in these firms FAS123R could not affect
CEO option pay and thus her incentives to make policy changes (ii) firms that were already
voluntarily expensing stock options as of 2002 (ie before FASB began discussions of the new
standard) as these firms would not face any additional accounting charge under FAS123R
Our approach offers a number of advantages First instead of collapsing all lsquonon-controlrsquo
firms in a single lsquotreatedrsquo group we exploit cross-sectional variation among treatment firms in
terms of the likely impact of FAS123R effectively using the most and least affected firms
(respectively top and bottom quartile of implied option expense) as treatment and control group
As shown in Table 1 the implied option expense is highly skewed (ie only a relatively small
number of firms was heavily affected by FAS123R) Capturing this variation is likely to increase
the power of the test Second in Bakke et al (2015) what matters is that the treatment definition
captures an accounting-driven change in CEO option grants as their focus is on CEO risk-taking
incentives In our setting we want to capture an accounting-driven change both in CEO option
grants (predicted to affect incentives to use dividends) and in the overall use of stock options
(predicted to affect the use of repurchases) As noted in Section 31 (see footnote 20) many firms
without CEO option grants in 2003 and 2004 were issuing options to non-CEO executives and
other employees and thus facing a potential accounting charge under FAS123R Third about half
of the firms without CEO option grants in 2003 and 2004 issued options to the CEO in the Post-
13
period Hence it is not clear that the control firms were truly unaffected by FAS123R Finally
the implied option expense in 2002 (our measure of the expected accounting impact) is a function
of option grants made in prior years when firms could not anticipate the adoption of FAS123R In
contrast option grant decisions in 2003 and 2004 may be affected by its anticipated adoption as
FASB added accounting for stock-based compensation to its agenda in March 2003
Notwithstanding the above arguments throughout our study we also present the results
using the definition of treatment and control in Bakke et al (2015) In particular we modify Eqs
(1) and (2) by replacing Accounting Impact with Treated an indicator equal to zero for the two
groups of firms identified as lsquocontrolrsquo in Bakke et al (2015) and one for all other firms
23 Payout Variables and Control Variables
Following Brown et al (2007) our baseline measure for changes in dividends is the change
in the DividendAssets ratiomdashcomputed as the regular cash dividends paid during the year scaled
by total assets at the beginning of the yearmdashfrom the Pre to the Post period15 However the
dividend-to-asset ratio is not what managers focus on when making dividend policy decisions
The stability of dividend per share (DPS) among dividend-paying firms (hereinafter payers)
suggests that managers do not target a specific dividend-to-assets ratio but rather a DPS level
(Baker and Wurgler 2016) Survey evidence confirms that executives make dividend policy
decision in terms of changes to the current level of DPS (Brav et al 2005) Therefore we also
examine the percentage change in the average DPS from the Pre to the Post period However this
measure can only be computed for the subset of payers (defined as firms with non-zero DPS in at
15 An alternative choice would be to scale dividends by the market value of equity essentially computing a dividend
yield However a drawback of using the dividend yield in our setting is that after controlling for time-invariant firm
characteristics through fixed effects or first differencing the variation of the ratio comes mainly from the denominator
the stock price (Baker and Wurgler 2004) Thus we choose the more stable book value of total assets as denominator
Also similar to other studies (eg Fenn and Liang 2001) we focus on regular dividends and exclude special dividends
as they are very rare and may introduce large noise to the dividend measures for few observations (DeAngelo
DeAngelo and Skinner 2000)
14
least one of the years of the Pre period) To provide insights into FAS123Rrsquos effect on dividend
policy for non-payers we examine the relation between our Accounting Impact variable and the
rate of dividend initations in the Pre and Post periods
Our main measure for repurchases is the change in RepurchaseAssetsmdashthat is the
aggregate amount of common stock repurchases made during the year scaled by total assets at the
beginning of the yearmdashfrom the Pre to the Post period In the empirical tests we examine
variations suggested in the literature
Finally as an alternative to examining dividends and repurchases separately we also look at a
measure of the payout composition the change in the DividendsTotal Payout ratio from the Pre to
the Post period (Total Payout is the sum of dividends and repurchases) effectively capturing any
substitution effect between dividends and repurchases 16 Examining the causal effect of the
change in option-based pay on payout composition is especially relevant if managers first target a
total payout and then choose the relative weight of dividends and repurchases In practice it is
unclear to what extent managers act this way (Brav et al 2005) Nonetheless for completeness we
also examine this variable We focus on the subsample of firms with both dividends and
repurchases in both Pre and Post period so as to capture changes in payout mix by firms routinely
using both vehicles to return cash to shareholders
As for the control variables in both Eqs (1) and (2) Controli is a vector of firm characteristics
identified in existent literature as determinants of payout policy (eg Fenn and Liang 2001 Brown
et al 2007 Skinner 2008 Cuny et al 2009) firm size book-to-market leverage asset tangibility
free cash flows cash holdings volatility in operating income institutional ownership sales
16 Fama and French (2001) suggest that repurchases are often complement to dividends while Grullon and Michaely
(2002) document that the increase in share repurchases over the past decades has come at the expense of a lower
increase in dividends consistent with a substitution hypothesis Brown et al (2007) also provide evidence of a
substitution effect in response to the 2003 dividend tax cut Survey evidence in Brav et al (2005) suggests an
asymmetric substitution effect with managers more willing to replace dividends with repurchases than the opposite
15
growth past stock returns and an indicator for loss firms For all of these variables we include
both changes from Pre to Post period and levels in the Pre period to allow for the possibility that
levels of these variables affect subsequent changes in payout policy 17 Finally we include
industry-fixed effects (Fama-French 48 industry indicators) to control for industry-level trends in
payout policies and option-based pay In unreported tests we replace free cash flows with two
separate variables operating profit and capital expenditures We also replace volatility in
operating income with volatility in stock returns Our results are unaffected More detailed
definitions of each variable are in the Appendix
24 Identification Assumption
The key identifying assumption underlying the difference-in-difference estimation
technique is that the parallel trends assumption is satisfied In the absence of treatment both
treated and control firms should experience parallel trends in the outcome variable Our approach
assumes that in the absence of FAS123R the change in dividends or repurchases would be the
same for high and low accounting impact firms Note that the well-documented contemporaneous
correlation between levels of option compensation (a key driver of the implied option expense and
thus the accounting impact) and levels of payout variables does not violate our identification
assumption This is because our assumption pertains to the relation between the level of option
compensation and future changes in payout variables
A specific concern is that options may be granted in anticipation of expected future
changes in payout policy (reverse causality problem) Relative to simple association tests this
concern is significantly reduced in our setting because the accounting impact is measured three
years prior to the arrival of treatment and is the result of option grants made over the prior four or
17 In untabulated analyses we run our tests after excluding changes in the control variables (ie including only their
pre-treatment levels) since in difference-in-difference studies controlling variables measured after the shock may
reintroduce selection bias Our inferences remain unchanged
16
five years depending on the vesting schedule18 For the reverse causality to be plausible the
implied option expense in 2002 (the result of option grants made approximately between 1998 and
2002) needs to reflect the anticipated change in payout policy in 2005-2007 This seems unlikely
While the parallel trend assumption is not directly testable similar to other studies (Bakke
et al 2015) we examine the trends in dividends and repurchases during the Pre period Figure 1
suggests that high and low accounting impact firms (respectively top and bottom quartile of
implied option expense) exhibit similar trends in payout variables in the Pre period ie from 2003
to 2004 More formally to examine the correlation between Accounting Impact and trends in the
payout variables during the Pre period we estimate the following regression only with
observations in 2003 and 2004
Payouti = γ0 + γ1 Accounting Impacti FY2004+ γ2 FY2004+ ΓControli +Firm FE +ui (3)
where Payouti is either DividendAssets or RepurchaseAssets FY2004 is an indicator of
fiscal year 2004 Firm FE indicates firm-fixed effects If firms with varying degrees of accounting
impact have different payout trends before the adoption of FAS123R γ1 should be different from
zero However for both payout variables we find that the estimated γ1 is close to zero and not
statistically significant at 10 level (untabulated tests) Overall the parallel trends assumption
seems reasonable in our setting
3 Empirical analyses
31 Sample Selection and Summary Statistics
Our sample is the SampP 1500 firms with available data on implied option expense (from
Compustat) and on executive compensation (from Execucomp) for at least one year in the Pre
18 The accounting treatment for stock options requires their fair value at the grant date to be recognized over the
service period (usually the vesting period) Hence the implied option expense in a given year includes a fraction of
the expense associated with past option grants
17
period and one year in the Post period to ensure consistency in the sample across periods Similar
to prior studies on payout policy (Fama and French 2001 Skinner 2008) we exclude financial
firms (SIC code between 6000 and 6999) and utilities (SIC between code 4900 and 4999) as well as
firms not incorporated in the US Our final sample includes 1176 firms19 We obtain dividend
and stock returns data from CRSP stock repurchases and dividend per share data from
COMPUSTAT and institutional ownership data from Thomson Reuters 13F database Other
control variables are from CRSP and COMPUSTAT To deal with outliers we winsorize all
continuous variables at 1 and 99 by fiscal year A detailed definition of all variables and their
sources is in Appendix
Table 1 Panel A presents summary statistics of the relevant variables for the pooled sample of
5653 firm-year observations Implied option expense in 2002 (our proxy for Accounting Impact)
is on average 173 of total assets with the median at 052 This suggests that the accounting
impact is very large for a small number of firms Over the entire sample period on average
dividends represent 093 of total assets while repurchases represent 394 Untabulated
analyses indicate that in 16 of the firm-year observations only dividends are paid out in 25
only repurchases in 32 both and in 27 neither Within the subset of firm-years with a payout
dividends represent 3874 of total payout This data confirms prior evidence that repurchases
have assumed the primary role as a vehicle to return cash to shareholders (eg Floyd et al 2015)
The mean (median) total executive pay (average across the top 5 executives) is $25 million ($16
million) On average option grants and restricted stock grants represent respectively 283 and
141 of total pay while salary and bonus comprise 296 and 197 respectively The
19 The results presented in the study are similar when (i) we restrict the sample to firms with available data for the
entire (2003-2007) sample period (1009 firms) and (ii) we exclude firms with CEO turnover in the Post period
(reducing the sample size to 780 firms) as a new CEO may have a different compensation package andor adopt a
different payout policy
18
composition of CEO pay (untabulated) is similar As for the control variables the figures are
generally consistent with other studies examining SampP 1500 firms over the same period
Panel B reports the pairwise Pearson correlations among the relevant variables The
correlations are in line with the associations documented in prior studies For example larger
firms and firms with higher profitability (free cash flows) have higher payouts loss firms have
lower payouts greater volatility in operating income is associated with lower dividends
More relevant to our analysis Panel C presents the mean of each variable in the Pre and Post
period for the full sample For each variable we first compute the firm-level mean over the Pre
and the Post Period and then compute the mean of the resulting figure across all firms There is a
striking increase in repurchases which double from 245 to 490 of total assets causing a
similar increase in total payout The increase in dividends is much smaller from 083 to 099
of total assets As a result for firms with positive payout dividends become a smaller fraction of
total payout in the Post period (2790 versus 3914 in the Pre period) This trend is consistent
with Floyd et al (2015) who document a dramatic increase in repurchases in the years leading to
the 2008 financial crisis Consistent with previous studies around FAS123R there is a significant
reduction in option grants as a fraction of total executive pay (from 343 to 240) and a
corresponding increase in the use of restricted stock (from 87 to 176) with little variation in
the weight of salary and bonus (note that restricted stock salary and bonus were expensed both
before and after FAS123R) Similar patterns hold for the composition of CEO pay (untabulated)
Compared to changes in the mix of executive pay changes in the levels of control variables are
generally less pronounced
Panel D reports the change in the key compensation and payout variables from the Pre to the
Post period by quartiles of implied option expense and yields a number of insights First
19
confirming the skewness suggested by Panel A the mean implied option expense is 551 for
firms in the top quartile versus only 093 035 and 012 for firms in the second third and
bottom quartile respectively Second as expected firms with higher implied option expense have
greater use of option-based pay For example in the Pre-period option pay represents 507 of
total executive pay at firms in the top quartile versus 201 in the bottom quartile Third and
more importantly for our research design the use of option pay changes significantly from the Pre
to the Post period as a function of the accounting impact For firms in the top quartile the
percentage of total pay represented by stock options drops by 182 (from 507 to 325)
versus 113 80 and 34 for firms in the second third and bottom quartile respectively The
decline in option usage across quartiles is accompanied by an increase in restricted stock grants
while the weight of salary and bonus shows little change It is important to emphasize the
substitution of stock options with restricted stocks because restricted stocks typically pay
dividends (Zhang 2013) thus providing further reason to expect a dividend increase in response to
the FAS123R-induced decline in option pay
As for the payout variables Panel D suggests that heavy option users (firms with higher
implied option expense) generally use repurchases more than dividends consistent with the
associations documented in earlier studies In the Pre period repurchases (dividends) represent
351 (030) of total assets for the top quartile versus 113 (112) for the bottom quartile
Panel D also indicates that the increase in repurchases documented in Panel C takes place across
all quartiles As for the (much smaller) change in dividends the absolute increase is similar across
the four quartiles though the relative increase (the percentage change) appears to be slightly
higher in the top quartile Overall these figures do not suggest a shift toward dividends and away
from repurchases by firms with a large (accounting-induced) decline in the use of option pay
20
Panel E presents the same data as Panel D but based on the definition of lsquotreatmentrsquo and
lsquocontrolrsquo in Bakke et al (2015) Under this definition 997 firms are classified as treatment group
and 177 as control (171 firms are classified as lsquocontrolrsquo because they did not grant options to the
CEO in the Pre period and 6 because they were voluntarily expensing options before 2003)
Interestingly lsquotreatedrsquo firms are equally distributed across the quartiles suggesting significant
variation in the degree of treatment As discussed earlier one benefit of our approach is that it
exploits cross-sectional variation among treatment firms in terms of the likely impact of FAS123R
Also 40 of the control firms (71 out of 177) are in the lowest quartile while 35 ((37+25)177)
are in the top two quartiles reflecting the different focus of the two approaches in terms of
identifying firms less affected by FAS123R20
As for payout and compensation variables Panel E shows that the treated group experiences a
larger increase in repurchases than the control group while the (less pronounced) increase in
dividends is similar across treated and control firms Treated firms experience a 126 decrease in
option pay (from 387 to 261) with a corresponding 94 increase in the weight of restricted
stock grants (from 80 to 174) The figures are similar at the CEO level (because the
classification is based on options grants to the CEO it is useful to report pay figures at both the top
5 executives and the CEO level) Interestingly the control group experiences a pronounced
increase in the weight of option grants in total CEO pay from 10 to 127 as almost half of the
control firms issued options to their CEOs in the Post period (for these firms options as percentage
of total CEO pay increased from 0 to 254 untabulated analysis) While this increased use of
stock options suggests (ex post) that these firms were not concerned with the impact of FAS123R
another possibility is that the lack of use of option compensation for CEOs in 2003 and 2004 was
20 In untabulated analysis we find that 55 of the 171 firms issuing no options to the CEO in the Pre period granted
options to the other top executives (and perhaps to other non-executive employees) thus explaining the relatively high
implied option expense for the control group (10 versus 19 for the treatment group ndash see Panel E)
21
temporary rather than the effect of a permanent policy If these firms were planning to issue
options to the CEO in the Post period the assumption that they were unaffected by FAS123R (and
thus their use as control sample) is questionable21
32 Differential Impact of FAS123R on the Use of Option-Based Compensation
An important building block of our approach is the presumed differential impact of FAS123R
on option-based pay as a function of pre-existing implied option expense22 While Table 1 Panel
D preliminarily supports the validity of this assumption we formally examine it by estimating Eq
(1)
As reported in Table 2 Panel A we find a significant negative association between Accounting
Impact and the change in option-based pay around the adoption of FAS123R In column (1)
where we use the quartile rank of implied option expense the -0044 coefficient implies that
around FAS123R option grants over total pay decline by 44 as we move from the highest
quartile to the next Thus the reduction in top quartile firms is 132 larger than in bottom
quartile firms In column 2 we replace the quartile rank with three indicators for the highest
quartiles (with the bottom quartile collapsed in the intercept) so as to be able to compare directly
top and bottom quartile without imposing the same effect across quartiles The negative and
significant coefficient on the top quartile indicator at -0140 suggests that the reduction in option
grants over total pay is 140 larger for top quartile firms relative to bottom quartile firms
Finally in column 3 we use the indicator for treated firms following Bakke et al (2015) The
21 Panel E also shows an increase in the use of restricted stock in CEO pay packages (from 128 to 182 almost
comparable to the increase among treated firms) The concurrent increase in options and restricted stock suggests
these firms would have increased option pay significantly more had it not been for FAS123R indicating further
caution in classifying them as control group of unaffected firms 22 This is akin to the relevance assumption of instrumental variable if we interpret the implied option expense as an
instrument to the change in option-based pay
22
negative and significant coefficient at -0132 suggests that treated firms experience a 132
larger drop in the weight of option pay relative to control firms
In Panel B we re-estimate Eq (1) using a panel regression with firm- and year-fixed effects
(5653 firm-year observations) where the dependent variable is the the ratio of option grants to
total executive pay The results are virtually identical in terms of significance and magnitude of
the coefficients of interest (the interaction terms between respectively Accounting impact and
Treated and an indicator for the Post period)
Overall Table 2 suggests that high implied option expense and the introduction of FAS123R
together strongly encouraged firms to cut back option-based compensation for executives It also
supports the general validity of the approach in Bakke et al (2015) in identifying firms most
affected by FAS123R notwithstanding the concerns outlined earlier
Our test of Eq (1) focuses on executive stock options For our dividend-protection hypothesis
it is important to establish that the level of implied option expense predicts a change in executive
stock options (rather than only a change in the use of non-executive employee stock options) as we
want to capture the effect of a change in executivesrsquo incentives on payout policy At the same
time our dilution channel hypothesis assumes a change in the use of all (executive and non-
executive employee) stock options Thus in untabulated analyses we repeat the test in Eq (1) by
replacing the dependent variable with the change in the number of options granted to all
employees (scaled by the total number of outstanding shares note for this analysis we can only
use data from 2004 to 2007 because Compustat began reporting data on ESO in 2004) The
coefficient on Accounting Impact and Treated continues to be negative and significant suggesting
that the differential reduction in the use of option compensation as a function of accounting impact
23
occurred for both executive and non-executive employee stock options Indeed Brown and Lee
(2011) report a similar decrease in executive and employee stock options around FAS123R
33 Option-Based Pay and Dividend Payouts
In this section we examine the effect of an exogenous (accounting-induced) change in option
compensation on dividend policy by estimating Equation (2)
Table 3 Panel A presents the results using the change in dividends from Pre to Post as
dependent variable We find no significant association between Accounting Impact (column 1 and
2) or Treated (column 3) and the change in dividends around the adoption of FAS123R This is in
stark contrast with the negative effect of option-based pay on dividends predicted in the literature
and documented in various association studies
One concern with this lack of effect is that perhaps our setting is not powerful enough to detect
it One way to examine this possibility is the following The coefficient on Accounting Impact
rank=4 in column 2 is 0001 and the standard error (SE) is 00009 Assuming the estimated
standard error is correct then for a two-tailed t test the coefficient needs to be greater than 00015
(=SE1645) or 015 to reach the 10 percent significant level In other words if moving from
the bottom to the top quartile (which predicts a 14 differential decline in option based pay as per
Table 2 Panel A) resulted in a 015 increase of the dividendasset ratio our test would be able to
detect a causal effect of option-based pay on dividends Given the unconditional mean of the
dividendasset ratio at 093 an increase of 015 from the Pre to the Post period seems
plausible In fact the average increase from the Pre to the Post period is 016 (Table 1 Panel C)
Thus if an effect was there our test should detect it
24
Panel B presents the results using a panel regression (5653 firm-year observations) with firm-
and year-fixed effects and interaction terms between Accounting Impact (or Treated) and an
indicator for the Post period Our inferences are unchanged
These analyses are based on our full sample which includes both dividend-paying and non-
dividend-paying firms Hence they implicity treat as equal two potentially different decisions to
initiate dividends and to increase dividends For example an increase in the dividend-to-asset
ratio from 05 to 06 will be treated the same as an increase from 00 to 01 even though
the latter represents a critical dividend initiation decision23 To address this following Chetty and
Saez (2005) we separately examine how FAS123R impacts the intensity of dividend changes (for
the subset of payers) and the likelihood of dividend initiations (for the subset of non-payers)
331 Option-Based Pay and Dividend Payouts Intensity of Dividend Changes
In the first row of Panel C we repeat the analysis in Panel A for the sub-sample of 572 payers
defined as firms with positive DPS in 2003 andor 2004 Note that we report only the coefficients
of interest for parsimony In the second row we replace the dependent variable with the
percentage change in DPS DPS is the choice variable for managers (Brav et al 2005 Baker and
Wurgler 2016) and thus our preferred measure to capture changes in dividend policy To account
for skewness in this variable (Khale 2002) in the third fourth and fifth rows we use indicator
variables to denote whether the change in DPS surpasses a threshold respectively 20 40 and
60 The proportion of firms that surpass these thresholds are 59 44 and 33 respectively24
23 Initiating dividends is a critical decision for boards given the pre-commitment value that investors attach to this
decision and the strong negative market reaction when firms eliminate or reduce dividends (Brav et al 2005) For
executives trying to maximize the value of their own stock options (dividend-protection argument) the ability to
influence a dividend initiation decision is likely lower than the ability to influence a dividend increase decision 24 Although in the third fourth and fifth rows our dependent variable is a binary variable we use a linear model (OLS)
instead of a probit or logit nonlinear model The reason is that estimating fixed effects in binary response models with
panel data can cause the incidental parameters problem The coefficient estimates can be biased when the panel data
25
Across all of these specifications we find no association between Accounting Impact or Treated
and the intensity of dividend changes Thus it does not appear that an exogenous reduction in
option-based pay caused dividend-paying firms to increase dividends
In Panel D we perform four robustness tests For parsimony we show only the coefficients of
interest and only the cases where the dependent variable is an indicator denoting a greater than
40 increase in DPS The results are similar for the other four ldquointensityrdquo dependent variables
reported in Panel C
In the first row we exclude firms that began to voluntarily expense options in 2003 or 2004
(84 firms of which 68 are dividend payers) FASB added accounting for stock-based
compensation to its agenda in March 2003 and issued an Exposure Draft proposing the expensing
of stock options at fair value in March 2004 In anticipation a number of firms began to
voluntarily expense stock options in 2003 and 2004 (Aboody et al 2004) If these firms reduced
option grants and as a result increased dividends during the Pre period then their inclusion may
reduce the power of our tests and thus our ability to detect the hypothesized relation25
In a similar spirit in the second row we exclude firms in the top decile in terms of reduction in
the ratio of option grants to total pay for the top 5 executives between 2002 (the year prior to the
Pre-period) and 2004 (the end of the Pre-period) This encompasses 113 firms of which 55 are
dividend payers If these firms reduced option grants in anticipation of FAS123R and as a result
increased dividends during the Pre period their inclusion may reduce our ability to detect the
hypothesized relation
has a large number of observations but a short time series Examples of studies making a similar choice are Puri
Rocholl and Steffen (2011) and Chu and Ma (2015) 25 This is unlikely to be a serious concern as previous studies suggest that voluntary expensers made limited use of
stock options (Aboody et al 2004) In fact in our sample 79 of these firms are in the bottom two quartiles of
implied option expense (untabulated) Nonetheless we present this test for robustness
26
In the third row we exclude firms that accelerated the vesting of options before FAS123R
became effective in order to avoid recognizing an expense for the unvested portion of these
options (Choudhary et al 2009 Balsam Reitenga and Yin 2008) This encompasses 196 firms of
which 54 are dividend payers If accelerating vesting was used to reduce the impact of FAS123R
the inclusion of these firms may reduce the power of our tests26
In the fourth row we deal with the concern that if firms target a fixed dividend to net income
ratio (Lintner 1956) and do so without adjusting for changes in accounting standards then by
decreasing net income (via option expense) the accounting change would mechanically cause a
reduction in dividends This would potentially offset and confound the increase predicted under
the dividend-protection and dilution hypotheses This seems unlikely for two reasons First firms
are notoriously reluctant to cut dividends (Brav et al 2005) Hence it seems unlikely that they
would reduce dividends in response to a decline in net income with no economic or cash flow
implications (ie re-classification of an expense from the footnotes to the income statement)
Second firms today set dividends in terms of dividend per share rather than by targeting a net
income-based payout ratio (Brav et al (2005)) As noted by Skinner (2008) over the last few
decades as earnings have become more variable the relation between earnings and dividends has
become weaker with dividend payments increasing smoothly and largely independent of the
variation in earnings Nevertheless in the fourth row we exclude the 66 dividend-paying firms that
26 These firms explicitly stated that they accelerated the vesting of stock options to avoid the accounting charge
(Choudhary et al 2009) In fact 72 are classified in the top two quartiles of implied option expense (untabulated)
Thus we would have predicted these firms to experience a significant decline in option pay To the extent that this
decline did not materialize because they minimized the impact of FAS123R by accelerating vesting the ability of
Accounting Impact to predict the reduction in option pay and thus its usefulness in examining changes in dividends
around FAS123R may be reduced The list of firms accelerating vesting was kindly provided by Jack Ciesielsky of
The Analystsrsquo Accounting Observer
27
had a similar payout ratio in 2003 and 2004 as a proxy for firms with a target net income-based
payout ratio in the Pre period27
As shown in Panel D even after excluding these subsets of firms we continue to find no
association between Accounting Impact or Treated and changes in dividends for dividend-paying
firms This is inconsistent with a causal influence of option compensation on dividend policy
Another concern is that by reducing net income and thus retained earnings FAS123R
may have pushed some firms closer to violating dividend covenants in debt contracts and
thus prevented them from increasing dividends This would bias our study against finding a
causal effect of option-based pay on dividends However this does not appear to be a
significant concern for three reasons First the recognition of an option expense does not
imply a decline in net income In fact more than 70 (75) of the full sample firms
(dividend payers) experienced an increase in net income before extraordinary items from
2004 to 2005 (the percentages are similar across the four quartiles of implied option
expense) Second dividend covenants are less common among dividend-paying firms
(Nikolaev 2010) Third most loan contracts in recent years give parties the option to
ldquofreezerdquo GAAP when facing a mandatory change in accounting principles (Christensen and
Nikolaev 2009) Firms expecting an adverse impact of FAS123R on their dividend covenants
would likely exercise this option (particularly given the non-cash nature of option-based
expense) Nonetheless to alleviate this concern we perform three additional analyses
(untabulated) (i) we repeat the tests in Panel C after excluding firms with a drop in net
income between 2004 and 2005 (ie firms that perhaps faced some covenant-related
27 We define a ldquosimilarrdquo payout to be an absolute change in payout ratio of less than 1 from 2003 to 2004 Among
these 66 firms only 39 continued to have a similar payout ratio in 2005 We also try an alternative definition where
a firm is classified as likely to be using a net income-based target payout ratio if the absolute percentage change in the
ratio from 2003 to 2004 is less than 10 (100 firms) Our inferences are unchanged
28
constrains to their payout policy as a result of FAS123R) (ii) we explicitly control for net
income and retained earnings in the regression (as in Skinner 2008) (iii) we repeat the tests
in Panel C for dividend payers with dividendsasset ratio above the sample median on the
basis that dividend covenants are less frequent among firms paying large dividends (Jung
Lee and Yang 2016) Our inferences are unchanged
332 Option-Based Pay and Dividend Payouts Dividend Initiations
In this section we examine whether the accounting-driven change in option pay affected
dividend initiations among non-payers We cannot employ the difference-in-difference approach
adopted so far by definition the same firm cannot initiate dividends in both periods However we
can provide suggestive evidence as follows First we take all firms that did not pay dividends in
2002 and group them into quartiles based on 2002 implied option expense For each quartile we
find the number of firms initiating dividends in 2003 and 2004 (the Pre period) Next we take all
firms that did not pay dividends in 2004 group them into quartiles based on 2002 implied option
expense and for each quartile find the number of firms initiating dividends in 2005 and 2006 (the
Post period) We do not include 2007 so as to have the same number of years in both periods and
make the cumulative initiation rates comparable
The left portion of Panel E reports the results of this exercise There is a general decrease in
the dividend initiation rate from the Pre to the Post period This holds both in the full sample of
non-payers (from 129 to 79) and across all quartiles This decrease may reflect a temporary
spike in 2003 and 2004 in response to the 2003 dividend tax cut documented in Chetty and Saez
(2005) It is noteworthy that initiation rates in both periods are lower among firms with higher
implied option expense This is consistent with option-heavy firms being mostly high-growth
firms less inclined to pay dividends More relevant to our research question if the lower use of
29
option compensation increased the propensity to pay dividends we would expect to see a relative
increase (ie a lower decrease) in dividend initiations among firms with the highest accounting
impact Instead the rate does not differ depending on the accounting impact There is
approximatley a 5 decline in initiation rate in each quartile In the right portion of Panel E we
examine similar data for dividend terminations While the results should be interpreted with
caution due to their rarity firms with higher accounting impact do not experience a greater decline
in termination rates Our inferences in Panel E are similar when we compared treated and control
firms following Bakke et al (2015) (untabulated)
Even after taking into account the different nature of decisions for dividend paying and non-
dividend-paying firms we fail to find evidence of a causal influence of option-based compensation
on dividend policy This finding is in contrast to the associations documented in earlier studies It
is even more remarkable as most firms replaced stock options with restricted stock which are
generally dividend-protected and should provide further incentive to increase dividends28
34 Option-Based Pay and Repurchases
In this section we examine the effect of an exogenous (accounting-induced) change in option
compensation on repurchases by estimating Equation (2)
Table 4 Panel A presents the results using the change in repurchases (scaled by total assets)
from Pre to Post as a dependent variable If the use of option-based pay had a positive effect on
firmsrsquo propensity to engage in repurchases as posited by the dividend-protection and dilution
hypotheses we should find a negative association between Accounting Impact or Treated and
repurchases Firms with a higher (accounting-driven) reduction in option-based pay should reduce
28 In a sample of SampP 500 firms between 2000 and 2009 Zhang (2013) reports that 80 of the firms granting
restricted stocks offer dividend protection In that sense the FAS123R-induced shift from stock options to restricted
stock may be characterized as a ldquoshockrdquo to dividend protection in unearned equity pay Accordingly our results cast
doubt on the causal interpretation of the positive association between dividend protection and dividend payouts
documented in prior studies (Zhang 2013 Burns et al 2015 Minnick and Rosenthal 2015)
30
the use of repurchases either because they are shifting toward a greater use of dividends andor
because they have a lower need to offset the dilutive effects of stock options However we find no
significant association between Accounting Impact (columns 1 and 2) and the change in
repurchases around the adoption of FAS123R When we use the Treated indicator (column 3) we
find a significant positive association rather than a negative one In Panel B we repeat the analysis
using net repurchases (ie repurchases after removing the effect of share issuances) following
Fama and French (2001) and Skinner (2008) Our inferences are unchanged29
This test is subject to two important caveats The first is we may not detect a decline in
repurchases because in the Post period firms need to offset the exercise of options that were
granted during the Pre period That is a post-FAS123R reduction in grants may not (yet) translate
into a reduction in exercises during the Post period which reduces our ability to test the dilution
hypothesis (ie that firms repurchase shares to offset exercises)30 However we can examine a
variation of this hypothesis where firms use repurchases to manage the effect of unexercised
options on diluted EPS (Bens et al 2003) To do so in Panel C we use a measure of adjusted
repurchases where we subtract our estimate of repurchases undertaken to offset the exercise of
ESO31 We effectively test whether firms experiencing an accounting-induced decrease in option
grants engage in less repurchases (net of exercise-driven repurchases) because their need to
manage the effect of unexercised options on diluted EPS is lower However the coefficient on
the variables of interest is either insignificant or positive inconsistent with the hypothesis
29 In the case of repurchases we do not examine separately ldquoinitiationsrdquo and ldquointensityrdquo as we do for dividends
because initiation is not clearly defined for repurchases Unlike dividends the occurrence of a repurchase in a given
year (or the lack thereof) cannot be used to infer a general policy due to the more discretionary nature of the timing of
repurchases 30 To capture the effect of lower option-based compensation on option exercises and thus on repurchases we would
ideally extend the Post period beyond 2007 However as noted by Floyd et al (2015) repurchases declined
dramatically after 2007 because of the financial crisis making it difficult to detect the effect of any other factor 31 As upper bound estimate of exercise-driven repurchases we multiply the number of ESO exercised during the year
times the average stock price during the year Since the number of ESO exercised is available in Compustat starting in
2004 Panel C is based on observations from 2004 to 2007
31
A second important caveat is that most firms replaced stock options with restricted stock
(Table 2 Panel C) Unvested restricted stock is excluded from the denominator in the computation
of basic EPS (once vested it is included) However it is included in the denominator of diluted
EPS using the treasury stock method similar to stock options Given the complexity of this
method without access to all details of restricted stock grants and option grants it is difficult to
determine whether the switch from stock options to restricted stock decreased the need for
dilution-driven repurchases as our test implicitly assumes Hence it is possible that we do not find
a decrease in repurchases because a reduced need to offset the dilutive effect of stock options was
neutralized by an increased need to offset the dilutive effect of restricted stock
Subject to the above caveats the evidence in Table 4 is not consistent with a positive causal
relation between the use of option-based pay and repurchases More precisely it suggests that
option-driven dilution concerns do not have a first-order effect on the magnitude of repurchases
even though they may play a role in the repurchase decision Hence our result is not necessarily
in conflict with the evidence in Brav et al (2005) where two-thirds of the surveyed financial
executives state that offsetting the dilutionary effect of stock option plans or other stock
programs is an important factor to their repurchase decisions
35 Option-Based Pay and Payout Composition
As an alternative to examining dividends and repurchases separately we also look at the
payout composition the change in the DividendsTotal Payout ratio from the Pre to the Post period
where Total Payout is the sum of dividends and repurchases As noted earlier we focus on the
subsample of firms with both dividends and repurchases in both Pre and Post periods so as to
capture the change in payout mix by firms routinely using both vehicles to return cash to
shareholders If the use of option-based pay causes firms to substitute repurchases for dividends
32
we should find a positive association between Accounting Impact or Treated and the payout mix
defined as DividendsTotal Payout ratio Firms with a higher accounting-driven reduction in
option-based pay should have an increase (decrease) in the relative weight of dividends
(repurchases) to the total payout However as reported in Table 5 Panel A we fail to find a
significant association between Accounting Impact (column 1 and 2) or Treated (column 3) and
the change in payout mix The results are similar when we use Net Payout (dividends plus net
repurchases) instead of Total Payout in computing the payout mix (Panel B)
Overall the combined evidence in Tables 3-5 does not support the hypothesis that option-
based compensation has negative (positive) effect on dividends (repurchases) or that it causes
firms to replace dividends with repurchases
4 Conclusion
Prior literature has documented robust associations between option-based compensation and
payout policy yet it remains unclear whether this association reflcts a causal influence We
investigate the causal effect of option-based compensation on payout policy using the adoption of
FAS123R which resulted in a significant decrease in option grants making it a plausible
exogenous shock to the use of option-based pay To overcome the challenge of no control group
we exploit the fact that firms responded differently depending on the firm-specific accounting
impact as measured by the implied option expense disclosed in the footnotes prior to FAS123R
Firms with larger expected accounting impact curtailed option-based compensation much more
aggressively than firms with lower impact Using a sample of SampP 1500 firms we find no
evidence that firms with a larger accounting-induced decline in option compensation increased
dividends reduced repurchases or changed their payout composition contrary to the widely held
belief that option-based pay has a causal influence on payout policy
33
Appendix Variable Definitions and Data Sources
Accounting Impact Variables
Accounting impact Implied option expense (Compustat XINTOPT) divided by total assets
(Compustat AT) This variable is measured at fiscal year 2002 and is time-invariant
Accounting impact rank The quartile rank of Accounting impact (1=lowest 4=highest)
Payout Variables
Regular dividendTotal assets The numerator is total regular cash dividends in the fiscal year
from the distribution dataset in CRSP Regular cash dividends are identified by the distribution
codes 1212 1222 1232 or 1242 The denominator is one-year lagged total assets (Compustat
AT)
DPS Dividend per share (Compustat DVPSX_F)
DPS pct change The percentage change of average DPS from Pre- to Post-FAS123R period
DPS pct change gtX indicator A dummy variable that equals one if DPC pct change is greater
than X and zero otherwise
RepurchaseTotal assets The numerator is the repurchase of common equity which equals total
repurchase (Compustat PRSTK) minus the change in preferred stock redemption value
(Compustat PSTKRV) The denominator is one-year lagged total assets (Compustat AT)
Net repurchaseTotal assets Net repurchase removes the effect of share issuances The
construction follows Fama and French (2001) and Skinner (2008) if the firm uses the treasury
stock method for repurchase net repurchase equals the increase in common treasury stock
(Compustat TSTKC) if the firm uses the retirement method (when common treasury stock is zero
in the current and prior year) net repurchase equals total repurchases minus stock issuance
(Compustat SSTK) and change in preferred stock redemption value (Compustat PSTKRV)
When the above measures give negative value net repurchase is set to zero
Adjusted repurchaseTotal assets Adjusted repurchase removes from total repurchase the potential
effect of repurchasing exercised options This variable equals total repurchase of common stocks
minus the product between the number of options exercised (Compustat OPTEXD) and average
stock price during the year When the above measure gives negative value adjusted repurchase is
set to zero Since the number of options exercised is not available before 2003 we drop
observations in 2003 when we use this variable
34
Total payoutTotal assets the sum of Regular dividendTotal assets and RepurchaseTotal assets
Regular dividendTotal payout regular cash dividend divided by the sum of regular cash dividend
and repurchase from common equity In the two-period analysis (Pre- vs Post-FAS123R) we
separately sum the numerator and the denominator for each firm-period and then calculate the ratio
Regular dividendNet payout regular dividend divided by the sum of regular dividend and net
repurchase In the two-period analysis (Pre- vs Post-FAS123R) we separately sum the numerator
and the denominator for each firm-period and then calculate the ratio
Compensation Variables
Salary_$ Average salary (Execucomp SALARY) of the top 5 highest paid executives in $1000
Salary_ Average salary (Execucomp SALARY) divided by average total pay (Execucomp
TDC1) of the top 5 highest paid executives
Bonus_$ Average bonus (Execucomp BONUS) of the top 5 highest paid executives in $1000
Due to a data format change we add non-equity plan-based awards (Execucomp
NON_EQ_TARG) to this measure after 2006
Bonus_ Bonus_$ divided by average total pay (Execucomp TDC1) of the top 5 highest paid
executives
Option grant_$ Average option grant value (Execucomp OPTION_AWARDS_BLK_VALUE or
OPTION_AWARDS_FV) of the top 5 highest paid executives in $1000 Due to a data format
change we use OPTION_AWARDS_FV for this measure after 2006
Option grant_ Option grant_$ divided by average total pay (Execucomp TDC1) of the top 5
highest paid executives
Restricted stock grant_$ Average restricted stock grant value (Execucomp RSTKGRNT or
STOCK_AWARDS_FV) of the top 5 highest paid executives in $1000 Due to data format
change we use STOCK_AWARDS_FV for this measure after 2006
Restricted stock grant_ Restricted stock grant_$ divided by average total pay (Execucomp
TDC1) of the top 5 highest paid executives
Total pay_$ Average total pay (Execucomp TDC1) of the top 5 highest paid executives in $1000
35
Other Characteristics
Size The book value of total assets (Compustat AT) minus the book value of common equity
(Compustat CEQ) plus the market value of common equity from CRSP in $M
Log(size) the natural logarithm of size
Book-to-market the book value of common equity dividend by its market value
Leverage long term debt plus short term debt (Compustat DLTT + DLC) divided by total assets
Asset tangibility tangible assets (Compustat AT - INTAN) divided by total assets
Free cash flow Operating cash flow (Compustat OANCF) minus capital expenditure (Compustat
CAPX) then divided by lagged total assets
Cash holding Cash and short-term investments (Compustat CHE) divided by total assets
ROA volatility the standard deviation of returns on assets (operating income before tax divided by
lagged total assets) in the past five fiscal years
Institutional ownership the number of shares held by institutional investors divided by the number
of shares outstanding from Thomson Reuters Institutional Holdings database
Sales growth the growth rate of sales (Compustat SALE) from the prior year
Past stock return annual stock return from the prior year
Loss indicator a dummy variable taking value of one if the current net income is negative and
zero otherwise
36
References
Aboody David 1996 Market Valuation of Employee Stock Options Journal of Accounting and
Economics 22 357-391
Aboody David Barth Mary E and Ron Kasznik 2004 Firms Voluntary Recognition of Stock-
Based Compensation Expense Journal of Accounting Research 42 123ndash150
Aboody David and Ron Kasznik 2008 Executive stock-based compensation and firmsrsquo cash
payout the role of shareholdersrsquo tax-related payout preferences Review of Accounting Studies
13 216ndash251
Anantharaman Divya and Yong Gyu Lee 2014 Managerial risk taking incentives and corporate
pension policy Journal of Financial Economics 111 328ndash351
Baker Malcolm and Jeffrey Wurgler 2004 A catering theory of dividends Journal of Finance
59 1125-1165
Baker Malcolm and Jeffrey Wurgler 2016 Dividends as reference points a behavioral signaling
approach Review of Financial Studies 29 697-738
Bakke Tor-Erik Hamed Mahmudi Chitru Fernando and Jesus Salas 2015 The causal effect of
option pay on corporate risk management Journal of Financial Economics forthcoming
Balsam Steven Austin Reitenga and Jennifer Yin 2008 Option acceleration in response to SFAS
No 123 (R) Accounting Horizons 22 23-45
Bens Daniel and Steven Monahan 2008 Altering Investment Decisions to Manage Financial
Reporting Outcomes Asset-Backed Commercial Paper Conduits and FIN 46 Journal of
Accounting Research 46 1017-1055
Bens Daniel A Venky Nagar Douglas J Skinner and MH Franco Wong 2003 Employee stock
options eps dilution and stock repurchases Journal of Accounting and Economics 36 51ndash90
Bertrand Marianne Esther Duflo and Sendhil Mullainathan 2004 How much should we trust
differences-in-differences estimates The Quarterly Journal of Economics 119 249ndash275
Blouin Jennifer L Jana S Raedy and Douglas A Shackelford 2011 Dividends Share
Repurchases and Tax Clienteles Evidence from the 2003 Reductions in Shareholder Taxes
The Accounting Review 86 887-914
Brav Alon John R Graham Campbell R Harvey and Roni Michaely 2005 Payout policy in the
21st century Journal of Financial Economics 77 483ndash527
Brown Lawrence D and Yen-Jung Lee 2011 Changes in Option-Based Compensation Around
the Issuance of SFAS123R Journal of Business Finance amp Accounting 38 1053ndash109
37
Brown Jeffrey R Nellie Liang and Scott Weisbenner 2007 Executive financial incentives and
payout policy Firm responses to the 2003 dividend tax cut Journal of Finance 62 1935ndash
1965
Burns Natasha Brian McTier and Kristina Minnick 2015 Equity-incentive compensation and
payout policy in Europe Journal of Corporate Finance 30 85-97
Carter Mary Ellen and Luann J Lynch 2003 The Consequences of the FASBrsquos 1998 Proposal on
Accounting for Stock Option Repricing Journal of Accounting and Economics 35 51-72
Carter Mary Ellen Luann J Lynch and Irem Tuna 2007 The role of accounting in the design of
CEO equity compensation The Accounting Review 82 327ndash357
Chava Sudheer and Amiyatosh Purnanandam 2010 CEOs versus CFOs Incentives and
corporate policies Journal of Financial Economics 97 263ndash278
Chetty Raj and Emmanuel Saez 2005 Dividend taxes and corporate behavior Evidence from the
2003 dividend tax cut The Quarterly Journal of Economics 120 791ndash833
Choudhary Preeti Shivaram Rajgopal and Mohan Venkatachalam 2009 Accelerated vesting of
employee stock options in anticipation of FAS123R Journal of Accounting Research 47 105ndash
146
Christensen Hans B and Valeri Nikolaev 2009 Contracting on Mandatory Changes to GAAP
New Practice and Its Determinants Working Paper University of Chicago
Chu Yongqiang and Tao Ma 2015 How does management compensation affect bank risk taking
evidence from FAS 123R University of South Carolina Working Paper
Cuny Charles J Gerald S Martin and John J Puthenpurackal 2009 Stock options and total
payout Journal of Financial and Quantitative Analysis 44 391ndash410
DeAngelo Harry Linda DeAngelo and Douglas J Skinner 2000 Special Dividends and the
Evolution of Dividend Signaling Journal of Financial Economics 57 309-354
Dechow Patricia M Amy P Hutton and Richard G Sloan 1996 Economic consequences of
accounting for stock-based compensation Journal of Accounting Research 34 1ndash20
Edgerton J 2013 Four facts about dividend payouts and the 2003 tax cut International Tax and
Public Finance 20 769-784
Edmans Alex and Xavier Gabaix 2015 Executive compensation a modern primer Journal of
Economic Literature forthcoming
38
Fama Eugene F and Kenneth R French 2001 Disappearing dividends changing firm
characteristics or lower propensity to pay Journal of Financial Economics 60 3ndash43
Farre-Mensa Joan Roni Michaely and Martin C Schmalz 2014 Payout policy Annual Review
of Financial Economics 6 75ndash134
Fenn George W and Nellie Liang 2001 Corporate payout policy and managerial stock
incentives Journal of Financial Economics 60 45ndash72
Ferri Fabrizio and Tatiana Sandino 2009 The impact of shareholder activism on financial
reporting and compensation the case of employee stock options expensing The Accounting
Review 84 433ndash466
Floyd Eric Nan Li and Douglas J Skinner 2015 Payout policy through the financial crisis the
growth of repurchases and the resilience of dividends Journal of Financial Economics 118
299-316
Frydman Carola and Dirk Jenter 2010 CEO compensation Annual Review of Financial
Economics 2 75-102
Gipper Brandon 2015 Assessing the Effects of Disclosing Management Compensation Working
Paper University of Chicago
Gormley Todd David Matsa and Todd Milbourn 2013 CEO compensation and corporate risk
evidence from a natural experiment Journal of Accounting and Economics 56 79-101
Graham John Michelle Hanlon and Terry Shevlin 2011 Real effects of accounting rules
evidence from multinational firmsrsquo investment locations and profit repatriation decisions
Journal of Accounting Research 49 137-185
Graham John Campbell Harvey and Shiva Rajgopal 2005 The Economic implications of
corporate financial reporting Journal of Accounting and Economics 40 3-73
Greenspan Alan 2002 Testimony of Alan Greenspan before the Committee on Banking
Housing and Urban Affairs US Senate July 16 Washington DC Government Printing
Office
Grullon Gustavo and Roni Michaely 2002 Dividends Share Repurchases and the Substitution
Hypothesis Journal of Finance 57 1649-1684
Hail Luzi Ahmed Tahoun and Clare Wang 2014 Dividend Payouts and Information Shocks
Journal of Accounting Research 52 403-456
Hall Brian J and Kevin J Murphy 2002 Stock options for undiversified executives Journal of
Accounting amp Economics 33 3-42
39
Hall Brian J and Kevin J Murphy 2003 The trouble with stock options Journal of Economic
Perspectives 17 49ndash70
Hanlon Michelle and Jeffrey L Hoopes 2014 What do firms do when dividend tax rates change
An examination of alternative payout responses Journal of Financial Economics 114 105-
124
Hayes Rachel M Michael Lemmon and Mingming Qiu 2012 Stock options and managerial
incentives for risk taking Evidence from FAS123R Journal of Financial Economics 105
174ndash190
Heron Randall A Erik Lie 2007 Does backdating explain the stock price pattern around
executive stock option grants Journal of Financial Economics 83 271-295
Hribar Paul Nicole Thorne Jenkins and W Bruce Johnson 2006 Stock repurchases as an
earnings management device Journal of Accounting and Economics 41 3ndash27
Jensen Michael C 1986 Agency cost of free cash flow corporate finance and takeovers
American Economic Review 76 323-329
Jolls Christine 1998 Stock repurchases and incentive compensation NBER Working Paper No
w6467
Jung Boochun Woo-Jong Lee and Yanhua Sunny Yang 2016 The Impact of Dividend
Covenants on Investment and Operating Performance Journal of Business Finance amp
Accounting 43 414ndash447
Kahle Kathleen M 2002 When a buyback isnrsquot a buyback open market repurchases and
employee options Journal of Financial Economics 63 235ndash261
Lambert Richard A William N Lanen and David F Larcker 1989 Executive stock option plans
and corporate dividend policy Journal of Financial and Quantitative Analysis 24 409ndash425
Lintner John 1956 Distribution of incomes of corporations among dividends retained earnings
and taxes The American Economic Review 46 97-113
Low Angie 2009 Managerial risk-taking behavior and equity-based compensation Journal of
Financial Economics 92 470-490
Miller Merton H and Franco Modigliani 1961 Dividend policy growth and the valuation of
shares The Journal of Business 34 411ndash433
Minnick Kristina and Leonard Rosenthal 2015 Stealth compensation Do CEOs increase their
pay by influencing dividend policy Journal of Corporate Finance 25 435-454
40
Murphy Kevin J 1999 Executive compensation In O Ashenfelter and D Card (eds) North
Holland Handbook of Labor Economics Amsterdam Elsevier Science BV
Murphy Kevin J 2013 Executive compensation Where we are and how we got there Handbook
of the Economics of Finance Elsevier Science North Holland 211-356
Nikolaev Valeri 2010 Debt Covenants and Accounting Conservatism Journal of Accounting
Research 48 143-176
Puri Manju Joumlrg Rocholl and Sascha Steffen 2011 Global retail lending in the aftermath of the
US financial crisis Distinguishing between supply and demand effects Journal of Financial
Economics 100 556-578
Shue Kelly and Richard R Townsend 2014 Swinging for the fences Executive reactions to
quasi-random option grants Working Paper University of Chicago
Skinner Douglas J 2008 The evolving relation between earnings dividends and stock
repurchases Journal of Financial Economics 87 582-609
Weisbenner Scott J 2000 Corporate share repurchases in the 1990s What role do stock options
play FEDS Working Paper No 2000-29
Zhang Dan 2013 CEO dividend protection Working Paper BI Norwegian Business School
41
Figure 1 Trends of dividends and repurchases from 2003 to 2007 Panel A plots the average
Regular DividendTotal Assets of firms in the highest and lowest quartiles of Accounting Impact
measured in 2002 Panel B shows the average Total RepurchaseTotal Assets of firms in the
highest and lowest quartiles of Accounting Impact measured in 2002
Panel A Trends of regular dividends
Panel B Trends of total repurchases
00
05
10
15
20
2003 2004 2005 2006 2007
Regular DividendTotal Assets
Lowest Acc Impact
Highest Acc Impact
Pre Post
00
20
40
60
80
100
2003 2004 2005 2006 2007
Total Repurchase Total Assets
Lowest Acc Impact
Highest Acc Impact
Pre Post
42
Table 1
Summary Statistics
Panel A Firm characteristics - full sample
N Mean Std dev 25 pctl Median 75 pctl
Accounting impact (2002) 1176 173 366 022 052 163
Payout variablesRegular dividendTotal assets 5653 093 148 000 000 142
RepurchaseTotal assets 5653 394 710 000 035 500
Total payoutTotal assets 5653 488 748 000 175 666
Regular dividendTotal payout 4091 3874 4057 000 2237 8833
Level of executive compensation (in $1000)
Salary_$ 5653 450 190 314 409 544
Bonus_$ 5653 476 616 122 295 586
Option grant_$ 5653 791 1137 62 384 1002
Restricted stock grant_$ 5653 458 866 0 58 518
Total pay_$ 5653 2481 2475 890 1647 3074
Percentage of executive compensation
Salary_ 5653 296 183 165 251 382
Bonus_ 5653 197 148 97 177 268
Option grant_ 5653 283 235 67 256 445
Restricted stock grant_ 5653 141 180 00 41 249
Control variables
Size ($M) 5653 11086 27294 1017 2459 8117
Log(size) 5653 7985 1565 6925 7808 9002
Book-to-market 5653 0445 0287 0251 0388 0578
Leverage 5653 0202 0172 0038 0187 0309
Asset tangibility 5653 0806 0184 0691 0853 0965
Free cash flow 5653 0059 0091 0013 0059 0108
Cash holding 5653 0166 0172 0034 0100 0247
ROA volatility 5653 0056 0056 0021 0038 0070
Institutional ownership 5653 0753 0202 0639 0795 0910
Sales growth 5653 0121 0189 0028 0096 0183
Past stock return 5653 0094 0183 -0012 0094 0199
Loss indicator 5653 0164 0370 0000 0000 0000
This table presents summary statistics Panel A shows the descriptive statistics of payout variables compensation
variables and other firm characteristics for the full sample Accounting impact is the implied option expense
measured at fiscal year 2002 All other variables are measured at firm-year level from fiscal year 2003 to 2007
resulting in 5653 firm-year observations (except for Regular dividendTotal Payout which can be measured only
for the 4901 firm-year observations with Total payout greater than zero) Panel B shows the pairwise correlations
between main variables at firm-year level Panel C compares payout variables compensation variables and other
firm characteristics before and after FAS123R The Pre-FAS123R period consists of fiscal year 2003 and 2004
the Post-FAS123R period covers fiscal year 2005-2007 Panel D compares the trends of payout and compensation
variables around FAS123R across four quartile groups ranked by 2002 accounting impact Panel E compares the
trends of payout and compensation variables around FAS123R between the treated and control group under the
alternative treatment definition in Bakke et al (2015) (see Section 22) All variables are defined in Appendix The
notation and in Panel C indicates statistically significant at 10 5 and 1 level in T-tests for equal
means respectively
43
Pa
nel
B
Pea
rso
n c
orr
ela
tio
ns
Reg div
Repurchase
Total payout
Salary_
Bonus_
Option_
RS_
Log(size)
BM
Leverage
Tangibility
FCF
Cash holdingROA vol
Inst own
Sales growth
Past ret
urn
Loss
Reg
div
10
0
Repurc
hase
01
610
0
Tota
l payout
03
509
810
0
Sala
ry_
-0
10
-01
8-0
19
10
0
Bonus_
00
700
100
3-0
01
10
0
Option_
-0
10
00
900
6-0
41
-03
510
0
RS
_
01
000
901
0-0
32
-01
1-0
40
10
0
Log(s
ize)
03
101
802
3-0
56
01
101
202
210
0
BM
-02
1-0
28
-03
103
0-0
03
-02
000
0-0
33
10
0
Levera
ge
-00
1-0
08
-00
8-0
05
00
6-0
11
00
801
9-0
03
10
0
Tangib
ility
00
200
100
101
200
1-0
05
-00
6-0
12
-00
4-0
18
10
0
FC
F02
203
703
9-0
20
00
901
1-0
01
02
4-0
32
-02
1-0
16
10
0
Cash
hold
ing
-01
301
000
700
2-0
14
02
2-0
10
-02
3-0
16
-03
502
901
210
0
RO
A v
ol
-01
5-0
04
-00
700
4-0
11
01
9-0
11
-02
3-0
08
-01
101
2-0
02
03
910
0
Inst
ow
n
-00
901
401
1-0
17
00
200
701
200
7-0
01
00
3-0
08
01
4-0
06
-01
110
0
Sale
s gro
wth
-00
8-0
04
-00
6-0
15
00
501
0-0
02
00
7-0
16
-00
3-0
08
01
300
201
400
410
0
Past
retu
rn00
901
301
4-0
18
01
5-0
01
00
301
6-0
29
-01
000
102
7-0
14
-01
001
602
710
0
Loss
-02
0-0
19
-02
201
8-0
18
00
4-0
05
-02
601
901
300
6-0
41
01
702
3-0
16
-01
8-0
40
10
0
44
Panel C Firm characteristics - before and after FAS123R
Pre FAS 123R Post FAS 123R Difference
Payout variables
Regular dividendTotal assets 083 099 016
RepurchaseTotal assets 245 490 245
Total payoutTotal assets 328 589 261
Regular dividendTotal payout 3914 2790 -1124
Level of executive compensation (in $1000)
Salary_$ 426 463 37
Bonus_$ 418 505 87
Option grant_$ 896 707 -191
Restricted stock grant_$ 269 574 305
Total pay_$ 2263 2584 321
Percentage of executive compensation
Salary_ 305 293 -12
Bonus_ 186 204 18
Option grant_ 343 240 -103
Restricted stock grant_ 87 176 89
Control variables
Size ($M) 9671 11631 1960
Log(size) 7860 8035 0175
Book-to-market 0437 0453 0016
Leverage 0201 0203 0002
Asset tangibility 0822 0793 -0029
Free cash flow 0061 0057 -0004
Cash holding 0175 0159 -0016
ROA volatility 0067 0048 -0019
Institutional ownership 0712 0781 0069
Sales growth 0137 0108 -0029
Past stock return 0080 0101 0021
Loss indicator 0173 0159 -0014
45
Pa
nel
D
Fir
m c
ha
racte
rist
ics
by q
ua
rtil
e o
f a
cco
un
tin
g i
mp
act
- b
efo
re a
nd
aft
er
FA
S1
23
R
Accounting im
pact
(2002)
Num
ber
of
Fir
ms
Pre
Post
Pre
Post
Pre
Post
Pre
Post
Payout
vari
able
s
Regula
r div
idendT
ota
l ass
ets
11
2
12
4
09
4
11
1
09
5
11
3
03
0
04
9
Repurc
hase
Tota
l ass
ets
11
3
26
8
19
2
37
3
32
7
63
1
35
1
68
7
Tota
l payout
Tota
l ass
ets
22
4
39
1
28
5
48
4
42
2
74
4
38
1
73
6
Regula
r div
idendT
ota
l payout
643
7
469
8
474
0
341
1
284
5
195
4
82
5
74
5
Perc
enta
ge o
f executive c
om
pensa
tion
Sala
ry_
337
295
313
287
296
289
276
300
Bonus_
223
226
214
228
172
192
134
169
Option g
rant_
201
167
290
210
373
260
507
325
Rest
ricte
d s
tock g
rant_
116
194
98
180
89
176
43
155
294
294
294
294
1st Q
uart
ile2
nd Q
uart
ile3
rd Q
uart
ile4
th Q
uart
ile
01
2
03
5
09
3
55
1
46
Accounting impact
Number of Firms
By accounting impact quartile
1
2
3
4
Pre Post Pre Post
Payout variables
Regular dividendTotal assets 09 11 08 10
RepurchaseTotal assets 18 31 26 52
Total payoutTotal assets 28 43 34 62
Regular dividendTotal payout 428 357 386 265
Percentage of executive compensation
Salary_ 435 364 282 280
Bonus_ 226 214 179 202
Option grant_ 92 125 387 261
Restricted stock grant_ 125 188 80 174
Percentage of CEO compensation
Salary_(CEO) 485 364 260 259
Bonus_(CEO) 249 228 185 219
Option grant_(CEO) 10 127 406 275
Restricted stock grant_(CEO) 128 182 82 183
Panel E Firm characteristics by alternative treatment definition - before and
after FAS123R
Treated
25
19
997
223
250
256
268
10
177
71
Control
44
37
47
Table 2
Differential effect of FAS123R on the use of option-based compensation
Panel A Two-period first-difference regression
Prediction Coeff t-stat Coeff t-stat Coeff t-stat
Accounting impact rank - -0044 -628
Accounting impact rank=2 - -0044 -327
Accounting impact rank=3 - -0075 -468
Accounting impact rank=4 - -0140 -613
Treated - -0132 -875
ΔLog(size) 0061 202 0061 200 0063 214
ΔBook-to-market 0032 091 0032 092 0051 143
ΔLeverage -0157 -213 -0160 -218 -0111 -153
ΔAsset tangibility -0012 -014 -0020 -023 -0023 -026
ΔFree cash flow -0106 -095 -0108 -097 -0128 -117
ΔCash holding -0197 -211 -0193 -206 -0180 -194
ΔFive-year ROA volatility -0065 -031 -0056 -026 -0098 -047
ΔInstitutional ownership -0044 -091 -0043 -088 -0044 -092
ΔSales growth -0064 -102 -0065 -104 -0090 -153
ΔPast one-year stock return 0051 078 0052 080 0091 138
ΔLoss frequency 0056 207 0057 207 0047 179
Log(size) -0009 -210 -0009 -207 -0002 -035
Book-to-market -0015 -056 -0013 -049 0018 072
Leverage 0022 046 0023 048 0068 150
Asset tangibility 0033 077 0033 078 0053 128
Free cash flow 0227 202 0220 195 0127 117
Cash holding -0002 -004 0012 019 -0078 -141
Five-year ROA volatility -0451 -240 -0430 -228 -0509 -283
Institutional ownership -0123 -360 -0122 -359 -0100 -292
Sales growth -0041 -056 -0040 -055 -0089 -125
Past one-year stock return -0009 -015 -0006 -010 0078 125
Loss frequency 0055 174 0056 178 0054 173
Fixed effect
Standard error
Adj R-squared
Observations
Model (3)
Dependent variable ΔAvg Option grantTotal pay
Huber-White
0156
This table investigates whether the effect of FAS123R on the use of option-based pay varies with its potential accounting impact Panel A
reports the results of estimating three two-period first-differencing models where for each firm we average its characteristics in Pre- and
Post-FAS123R period The Pre-FAS123R period consists of fiscal year 2003 and 2004 the Post-FAS123R period covers fiscal year 2005-
2007 In all three specifications the dependent variable is the change of average Option grantTotal pay from Pre- to Post-FAS123R period
The main independent variable varies by model in Model (1) the Accounting impact rank is the quartile rank of implied option expensetotal
assets measured in 2002 (1=lowest 4=highest) In Model (2) Accounting impact rank=2 (3 4) is an indicator that takes value of one if the
firmrsquos Accounting impact rank equals 2 (3 4) In Model (3) we use an alternative treatment construction following Bakke et al (2015)
where Treated is an indicator that takes value of zero if the firm granted zero option to its CEO in both 2003 and 2004 or the firm began to
voluntarily expense option-based pay at fair value in 2002 or earlier and one otherwise For each control variable we include both its level in
the Pre-FAS123R period and its change across the two periods Panel B shows the results of estimating fixed effect models with firm-year
observations The dependent variable is the firm-year level Option grantTotal pay The main independent variables are the interactions of
Post-FAS123R indicator (Post) with Accounting Impact rank Accounting impact rank indicators and Treated respectively All models in
Penal A have industry fixed effects and the standard errors are Huber-White heteroscedasticity-consistent standard errors All models in
Penal B have firm fixed effects and year fixed effects and the standard errors are clustered at firm level All variables are defined in
Appendix The notation and indicates statistically significant at 10 5 and 1 level respectively
Model (1) Model (2)
11711171 1171
Industry Industry
Huber-White
0124
Huber-White
0123
Industry
48
Panel B Panel fixed effects regression
Prediction Coeff t-stat Coeff t-stat Coeff t-stat
Acc impact rank x Post - -0044 -807
Acc impact rank 2 x Post - -0046 -333
Acc impact rank 3 x Post - -0077 -526
Acc impact rank 4 x Post - -0137 -776
Treated x Post - -0145 -970
Log(size) 0034 221 0034 217 0036 229
Book-to-market 0018 084 0017 083 0015 070
Leverage -0004 -009 -0006 -013 -0007 -015
Asset tangibility 0007 012 0004 006 0011 018
Free cash flow -0074 -151 -0072 -146 -0078 -158
Cash holding -0048 -086 -0050 -090 -0006 -011
Five-year ROA volatility 0250 231 0239 219 0437 414
Institutional ownership 0043 159 0044 161 0041 150
Sales growth -0033 -168 -0034 -171 -0031 -158
Past one-year stock return 0067 221 0068 224 0063 204
Loss indicator 0023 209 0022 207 0024 222
Fixed effects
Standard error
Adj R-squared
Observations
Dependent variable Option grantTotal pay
5653 5653 5653
Clustered by firm
Firm Year
Clustered by firm
Firm Year
Clustered by firm
0523 0523 0526
Model (1) Model (2) Model (3)
Firm Year
49
Table 3
Effect of option-based compensation on dividend policy
Panel A Two-period first-difference regression
Prediction Coeff t-stat Coeff t-stat Coeff t-stat
Accounting impact rank + 0000 077
Accounting impact rank=2 + 0001 091
Accounting impact rank=3 + 0000 044
Accounting impact rank=4 + 0001 092
Treated + 0000 -026
ΔLog(size) 0000 -030 0000 -030 0000 -026
ΔBook-to-market -0002 -190 -0002 -193 -0002 -195
ΔLeverage -0002 -059 -0002 -057 -0002 -059
ΔAsset tangibility 0016 431 0016 429 0016 430
ΔFree cash flow 0017 373 0017 373 0017 375
ΔCash holding -0011 -288 -0011 -285 -0010 -282
ΔFive-year ROA volatility 0003 034 0002 032 0003 035
ΔInstitutional ownership -0002 -073 -0002 -073 -0002 -070
ΔSales growth -0001 -040 -0001 -037 -0001 -038
ΔPast one-year stock return 0002 077 0002 076 0002 070
ΔLoss frequency 0000 -048 0000 -045 0000 -046
Log(size) 0000 183 0000 182 0000 182
Book-to-market -0002 -227 -0002 -225 -0002 -284
Leverage -0001 -037 -0001 -039 -0001 -048
Asset tangibility 0003 179 0003 180 0003 176
Free cash flow 0017 291 0017 291 0017 300
Cash holding 0002 080 0002 077 0002 098
Five-year ROA volatility 0003 035 0002 033 0003 044
Institutional ownership -0001 -068 -0001 -068 -0001 -058
Sales growth -0004 -177 -0004 -175 -0004 -172
Past one-year stock return 0004 169 0004 167 0004 165
Loss frequency -0001 -111 -0001 -109 -0001 -102
Fixed effect
Standard error
Adj R-squared
Observations
Dependent variable ΔAvg Regular dividendTotal assets
This table investigates the causal effect of option-based pay on dividend policy by examining whether changes in dividend policy around
FAS123R vary with its potential accounting impact Panel A reports the results of estimating three two-period first-differencing models
where for each firm we average its characteristics in Pre- and Post-FAS123R period In all three specifications the dependent variable is
the change of average Regular dividendTotal assets from Pre- to Post-FAS123R period The main independent variable varies by model in
Model (1) the Accounting impact rank is the quartile rank of implied option expensetotal assets measured in 2002 (1=lowest 4=highest) In
Model (2) Accounting impact rank=2 (3 4) is an indicator that takes value of one if the firmrsquos Accounting impact rank equals 2 (3 4) In
Model (3) we use an alternative treatment construction following Bakke et al (2015) where Treated is an indicator that takes value of zero
if the firm granted zero option to its CEO in both 2003 and 2004 or the firm began to voluntarily expense option-based pay at fair value in
2002 or earlier and one otherwise For each control variable we include both its level in the Pre-FAS123R period and its change across the
two periods Panel B shows the results of estimating fixed effect models with firm-year observations The dependent variable is the firm-
year level Regular dividendTotal assets The main independent variables are the interactions of Post-FAS123R indicator (Post) with
Accounting Impact rank Accounting impact rank indicators and Treated respectively Panel C examines the intensity of dividend changes
among firms with nonzero dividend per share in 2003 or 2004 In particular we estimates the same three models as in Panel A(with the
same independent variables) but for five dependent variables the change of average Regular dividendTotal assets from Pre- to Post-
FAS123R period (as in Panel A) the percentage change of DPS (dividend per share) from Pre- to Post-FAS123R period and three
indicators denoting respectively whether the percentage change of DPS was greater than 20 40 and 60 Panel D reports four
robustness tests of the dividend intensity regression In each of them a set of possible confounding observations is removed (see Section 33
for details) Panel E compares the trends of dividend initiation and termination around FAS123R across four quartile groups ranked by
accounting impact All models in Panel A C and D have industry fixed effects and the standard errors are Huber-White heteroscedasticity-
consistent standard errors All models in Penal B have firm fixed effects and year fixed effects and the standard errors are clustered at
firm level All variables are defined in Appendix The notation and indicates statistically significant at 10 5 and 1 level
Industry Industry Industry
Model (1) Model (2) Model (3)
1171 1171 1171
Huber-White Huber-White Huber-White
0105 0104 0105
50
Panel B Panel fixed effects regression
Prediction Coeff t-stat Coeff t-stat Coeff t-stat
Acc impact rank x Post + 0000 122
Acc impact rank 2 x Post + 0001 110
Acc impact rank 3 x Post + 0001 094
Acc impact rank 4 x Post + 0001 129
Treated x Post + 0000 -012
Log(size) 0001 179 0001 179 0001 181
Book-to-market 0000 025 0000 024 0000 031
Leverage 0001 062 0001 064 0001 069
Asset tangibility 0009 360 0009 358 0009 363
Free cash flow 0002 090 0002 093 0002 092
Cash holding -0007 -295 -0007 -298 -0007 -298
Five-year ROA volatility 0001 041 0001 038 0000 -006
Institutional ownership 0000 -027 0000 -026 0000 -027
Sales growth 0000 053 0000 051 0000 044
Past one-year stock return 0001 089 0001 088 0001 078
Loss indicator 0000 -060 0000 -057 0000 -076
Fixed effects
Standard error
Adj R-squared
Observations
Dependent variable Regular dividendTotal assets
Model (1) Model (2) Model (3)
Firm Year Firm Year Firm Year
5653 5653 5653
Clustered by firm Clustered by firm Clustered by firm
0877 0877 0877
51
Panel C Intensity of dividend changes around FAS123R
Prediction Coeff t-stat Coeff t-stat Coeff t-stat
Accounting impact rank + 0000 065
Accounting impact rank=2 + 0000 048
Accounting impact rank=3 + 0000 026
Accounting impact rank=4 + 0002 080
Treated + 0001 063
Dependent var DPS pct change
Accounting impact rank + -0145 -072
Accounting impact rank=2 + 0018 006
Accounting impact rank=3 + -0177 -045
Accounting impact rank=4 + -0746 -100
Treated + -0407 -119
Accounting impact rank + 0029 095
Accounting impact rank=2 + 0040 074
Accounting impact rank=3 + 0092 139
Accounting impact rank=4 + 0008 007
Treated + -0007 -012
Accounting impact rank + 0024 076
Accounting impact rank=2 + 0047 088
Accounting impact rank=3 + 0079 114
Accounting impact rank=4 + -0003 -002
Treated + 0030 052
Accounting impact rank + 0030 098
Accounting impact rank=2 + 0078 155
Accounting impact rank=3 + 0085 130
Accounting impact rank=4 + 0014 012
Treated + -0006 -011
Control variables
Fixed effect
Standard error
Observations 572 572 572
Yes Yes Yes
Huber-White Huber-White Huber-White
Industry Industry Industry
Dependent var DPS pct
change gt60 indicator
Model (1) Model (2) Model (3)
Dependent var ΔAvg Regular
dividendAssets
Dependent var DPS pct
change gt20 indicator
Dependent var DPS pct
change gt40 indicator
52
Panel D Robustness tests for intensity of dividend changes around FAS123R
Prediction Coeff t-stat Coeff t-stat Coeff t-stat
Accounting impact rank + 0006 017
Accounting impact rank=2 + 0067 118
Accounting impact rank=3 + 0041 057
Accounting impact rank=4 + -0061 -049
Treated + 0022 035Observations
Accounting impact rank + 0009 027
Accounting impact rank=2 + 0058 106
Accounting impact rank=3 + 0032 043
Accounting impact rank=4 + -0032 -024
Treated + 0018 028
Observations
Accounting impact rank + 0030 089
Accounting impact rank=2 + 0039 071
Accounting impact rank=3 + 0122 168
Accounting impact rank=4 + -0063 -052
Treated + 0075 132
Observations
Accounting impact rank + 0008 023
Accounting impact rank=2 + 0023 042
Accounting impact rank=3 + 0048 064
Accounting impact rank=4 + -0042 -033
Treated + -0010 -016
Observations
Control variables
Fixed effect
Standard error
Exclude firms with stable
payout ratio from 2003 to 2004
506 506 506
Dependent variable DPS pct change gt40 indicator
Model (1) Model (2) Model (3)
Exclude voluntary expensers
519 519
Exclude firms in the top decile
of option reduction (02-04)
Exclude firms that accelerated
option vesting
504 504 504
517 517 517
519
Huber-White Huber-White Huber-White
Yes Yes Yes
Industry Industry Industry
53
Panel E Dividend initiation and termination rates around FAS123R
Pre FAS 123R
1 280 75 7 6 13 173
2 284 135 18 9 27 200
3 286 181 11 14 25 138
4 282 260 9 10 19 73
Total 1132 651 45 39 84 129
Post FAS 123R
1 275 63 4 4 8 127
2 280 116 9 9 18 155
3 276 152 9 3 12 79
4 263 223 5 1 6 27
Total 1094 554 27 17 44 79
Pre FAS 123R
1 280 205 2 0 2 10
2 284 149 7 1 8 54
3 286 105 0 0 0 00
4 282 22 0 0 0 00
Total 1132 481 9 1 10 21
Post FAS 123R
1 275 212 3 6 9 42
2 280 164 1 2 3 18
3 276 124 1 1 2 16
4 263 40 0 3 3 75
Total 1094 540 5 12 17 31
termination
in 2004
03-04
cumulative
03-04
cumulative
Quartile firms
with
dividend in
2004
termination
in 2005
termination
in 2006
05-06
cumulative
05-06
cumulative
Termination
Quartile firms
with
dividend in
2002
termination
in 2003
without
dividend in
2004
initiation in
2003
initiation in
2004
03-04
cumulative
03-04
cumulative firmsQuartile
firmsQuartile initiation in
2005
initiation in
2006
05-06
cumulative
05-06
cumulative
Initiation
without
dividend in
2002
54
Table 4
Effect of option-based compensation on repurchases
Panel A Two-period first-difference regression with total repurchase
Prediction Coeff t-stat Coeff t-stat Coeff t-stat
Accounting impact rank - 0002 122
Accounting impact rank=2 - 0002 071
Accounting impact rank=3 - 0005 123
Accounting impact rank=4 - 0007 102
Treated - 0014 365
Control variables
Fixed effect
Standard error
Adj R-squared
Observations
Panel B Two-period first-difference regression with net repurchase
Prediction Coeff t-stat Coeff t-stat Coeff t-stat
Accounting impact rank - 0003 166
Accounting impact rank=2 - 0002 051
Accounting impact rank=3 - 0006 165
Accounting impact rank=4 - 0009 137
Treated - 0010 300
Control variables
Fixed effect
Standard error
Adj R-squared
Observations
Panel C Two-period first-difference regression with repurchase adjusted for exercised options
Prediction Coeff t-stat Coeff t-stat Coeff t-stat
Accounting impact rank - 0001 056
Accounting impact rank=2 - 0002 062
Accounting impact rank=3 - 0007 172
Accounting impact rank=4 - -0001 -008
Treated - 0006 197
Control variables
Fixed effect
Standard error
Adj R-squared
Observations
Dependent variable ΔAvg RepurchaseTotal assets
This table investigates the causal effect of option-based pay on payout policy by examining whether the changes of repurchase around
FAS123R vary with its potential accounting impact Panel A reports the results of estimating three two-period first-differencing models
where for each firm we average its characteristics in Pre- and Post-FAS123R period In all three specifications the dependent variable is
the change of average RepurchaseTotal assets from Pre- to Post-FAS123R period The main independent variable varies by model in
Model (1) the Accounting impact rank is the quartile rank of implied option expensetotal assets measured in 2002 (1=lowest 4=highest)
In Model (2) Accounting impact rank=2 (3 4) is an indicator that takes value of one if the firmrsquos Accounting impact rank equals 2 (3 4)
In Model (3) we use an alternative treatment construction following Bakke et al (2015) where Treated is an indicator that takes value of
zero if the firm granted zero option to its CEO in both 2003 and 2004 or the firm began to voluntarily expense option-based pay at fair
value in 2002 or earlier and one otherwise Panel B reports the regressions with the change of Net repurchaseTotal assets as the
dependent variable and the same independent variable as in Panel A Panel C reports the regressions with the change of Adjusted
repurchaseTotal assets as the dependent variable and the same independent variable as in Panel A All models in Panel A B and C have
industry fixed effects and the standard errors are Huber-White heteroscedasticity-consistent standard errors All variables are defined in
Appendix The notation and indicates statistically significant at 10 5 and 1 level respectively
Model (1) Model (2) Model (3)
Yes Yes Yes
Industry Industry Industry
Huber-White Huber-White Huber-White
Dependent variable ΔAvg Net repurchaseTotal assets
1171 1171 1171
0238 0237 0245
Model (1) Model (2) Model (3)
Yes Yes Yes
Industry Industry Industry
Huber-White Huber-White Huber-White
Dependent variable ΔAvg Adjusted repurchaseTotal assets
0229 0229 0233
1171 1171 1171
Model (1) Model (2) Model (3)
Yes Yes Yes
Industry Industry Industry
Huber-White Huber-White Huber-White
0111 0112 0114
1168 1168 1168
55
Table 5
Effect of option-based compensation on payout mix
Panel A Two-period first-difference regression with total payout mix
Prediction Coeff t-stat Coeff t-stat Coeff t-stat
Accounting impact rank + 0006 028
Accounting impact rank=2 + 0018 045
Accounting impact rank=3 + -0001 -001
Accounting impact rank=4 + 0043 052
Treated + -0035 -094
Control variables
Fixed effect
Standard error
Adj R-squared
Observations
Panel B Two-period first-difference regression with net payout mix
Prediction Coeff t-stat Coeff t-stat Coeff t-stat
Accounting impact rank + -0002 -008
Accounting impact rank=2 + 0008 016
Accounting impact rank=3 + 0018 034
Accounting impact rank=4 + -0059 -055
Treated + -0050 -101
Control variables
Fixed effect
Standard error
Adj R-squared
Observations
0049 0043 0054
257 257 257
Industry Industry Industry
Huber-White Huber-White Huber-White
Dependent variable ΔAvg Regular dividendNet payout
Model (1) Model (2) Model (3)
Yes Yes Yes
0154 0151 0156
362 362 362
Industry Industry Industry
Huber-White Huber-White Huber-White
This table investigates the causal effect of option-based pay on payout mix for firms using both dividend and repurchase by examining
whether the changes of payout mix around FAS123R vary with its potential accounting impact Panel A reports the results of estimating
three two-period first-differencing models where for each firm we average its characteristics in Pre- and Post-FAS123R period In all three
specifications the dependent variable is the change of average Regular dividendTotal payout from Pre- to Post-FAS123R period The main
independent variable varies by model in Model (1) the Accounting impact rank is the quartile rank of implied option expensetotal assets
measured in 2002 (1=lowest 4=highest) In Model (2) Accounting impact rank=2 (3 4) is an indicator that takes value of one if the firmrsquos
Accounting impact rank equals 2 (3 4) In Model (3) we use an alternative treatment construction following Bakke et al (2015) where
Treated is an indicator that takes value of zero if the firm granted zero option to its CEO in both 2003 and 2004 or the firm began to
voluntarily expense option-based pay at fair value in 2002 or earlier and one otherwise Panel B reports the regressions with the change of
Regular dividendNet payout as the dependent variable and the same independent variables as in Panel A Panel A (Panel B) is based on
observations with nonzero regular dividend and repurchase (net repurchase) in both Pre- and Post-FAS123R period All models in Panel A
and B have industry fixed effects and the standard errors are Huber-White heteroscedasticity-consistent standard errors All variables are
defined in Appendix The notation and indicates statistically significant at 10 5 and 1 level respectively
Yes Yes Yes
Dependent variable ΔAvg Regular dividendTotal payout
Model (1) Model (2) Model (3)

1
1 Introduction
In this study we examine whether option-based executive compensation has a causal
influence on payout policy Payout policy plays a key role in corporate finance (Miller and
Modigliani 1961 Jensen 1986 Fama and French 2001) How much cash to return to shareholders
and how to do it (ie dividends or repurchases) has implications for the firmrsquos investment and
capital structure policy signals the quality of future prospects affects investorsrsquo taxes and
ultimately impacts firm value As noted in a recent paper (Farre-Mensa Michaely and Schmalz
2014) traditional theories of payout policy (eg agency signaling clientele and tax-based
theories) explain some of the cross-sectional variation in corporate payouts However they have
limited power in explaining secular changes over the last 30 years during which repurchases have
replaced dividends as the primary payout vehicle (Skinner 2008) In contrast a number of studies
suggest that this trend may reflect the simultaneous increase in the use of stock options for
executive compensation
Previous research has identified two ways option-based compensation may affect payout
policy The first is the dividend-protection channel Because the value of a call option decreases
with dividends and executive stock options are generally not dividend-protected (due to an
unfavorable accounting treatment)1 option grants give managers the incentive to avoidreduce
dividends and (if there is a target payout amount) to replace them with repurchases (Lambert
Lanen and Larcker 1989)
1 Zhang (2013) finds that between 2000 and 2009 less than 1 of SampP 500 firms provide dividend protection
confirming evidence for earlier periods (Murphy 1999 Weisbenner 2000 Cuny Martin and Puthenpurackal 2009)
Researchers have attributed this low frequency to the unfavorable accounting treatment (Fenn and Liang 2001)
Dividend protection is effected through adjustments to an optionrsquos exercise price Under Accounting Principles Board
Opinion No25 (APB 25) dividend-protected options were considered variable plan options because the exercise price
was not ldquofixedrdquo but contingent upon future events (eg a dividend payment) As such their cost had to be reported in
the income statement at each measurement date (each quarter) based on their intrinsic value (difference between stock
price and exercise price) In contrast options with ldquofixedrdquo terms required a compensation expense based on intrinsic
value at the grant date (typically zero since fixed options were granted with an exercise price equal to the stock price)
2
The second way is the dilution channel which refers to the incentive to use repurchases to
offset the dilutive effect from the exercise of employee stock options (ESO) In a survey of
financial executives over two-thirds of the respondents claim that offseting the dilutionary effect
of stock option plans or other stock programs is an important factor to their repurchase decisions
(Brav Graham Harvey and Michaely 2005) A variation of the dilution argument further notes
that even before the exercise of ESO managers have an incentive to use repurchases to manage the
dilutive effect of in-the-money unexercised options on diluted earnings-per-share (EPS) (Bens
Nagar Skinner and Wong 2003)2 Under these dilution-related arguments firms with more ESO
would engage in larger repurchases Besides if these firms have a target payout amount they
would have an incentive to replace dividends (or future dividend increases) with repurchases
In sum both the dividend-protection and the dilution channels predict that managers of
firms with a large amount of option-based compensation will favor repurchases over dividends A
number of studies have provided empirical evidence consistent with this prediction3
However there are three reasons to re-examine this question First if boards anticipate the
lack of dividend protectionrsquos effect they can increase management compensation to offset the loss
caused by the dividend payments Second changes to payout policy are visible and highly
2 Generally Accepted Accounting Principles (GAAP) require firms to report basic EPS and diluted EPS The
denominator of basic EPS is generally the number of common shares outstanding and thus it is affected by ESO only
when they are exercised In contrast the denominator of diluted EPS takes into account lsquolsquopotentially dilutiversquorsquo
securities such as ESO using the so-called treasury stock method Under this method the denominator of diluted EPS
increases as outstanding unexercised ESOs move into the money Note that firms have incentives to use repurchases to
manage EPS regardless of whether they use ESO (Hribar Jenkins and Johnson 2006) 3 Lambert et al (1989) finds that dividends decrease in the five-year period following the adoption of executive stock
option plans Jolls (1998) documents that firms relying more on option compensation are more likely to buy back
shares Weisbenner (2000) documents a positive association between exercises of ESO and repurchases Fenn and
Liang (2001) show that option compensation is negatively associated with dividends and positively associated with
repurchases Kahle (2002) finds that the number of exercisable employee stock options predicts the occurrence and
amount of repurchases (consistent with the dilution channel) and that the number of executive stock options predicts
the repurchase decision (consistent with the dividend-protection channel) Chetty and Saez (2005) finds that firms
whose executives held more options were less likely to increase dividends in response to the dividend tax reduction in
2003 Zhang (2013) Burns McTier and Minnick (2015) and Minnick and Rosenthal (2015) document that firms with
a greater proportion of dividend-protected equity pay have higher dividend payouts Bens et al (2003) and Cuny et al
(2009) show that repurchases are positively correlated with the dilutive effect of ESO on diluted EPS
3
scrutizined Given the relevance of payout choices to boards analysts and institutional investors
it is not likely that managers could easily modify payout policy to maximize personal wealth
without facing serious scrutiny Third the associations documented in earlier studies may reflect
the endogenous nature of executive pay A compensation contract is designed to mitigate agency
problems that manifest in various corporate policies This feature makes treatment assignment
(eg stock option grants) prone to factors that could affect both executive pay and payout policy
some of which may be unobservable and cannot be easily controlled for (the omitted variable bias
problem) For example a firm with a positive innovation opportunity shock may both choose a
low dividend level to preserve internal capital and grant executive stock options to induce risk
taking Furthermore executive pay may be the result of anticipated payout policy (the reverse
causality problem) For example if a board wants to raise dividends it may give the CEO a pay
package with fewer options and more (dividend-paying) restricted stocks (Aboody and Kasznik
2008) Different causal channels linking executive pay and firm payout possibly coexist and are
difficult to disentangle empirically As emphasized by Edmans and Gabaix (2015) the effects of
executive compensation in general have not been satisfactorily identified largely due to the
scarcity of valid instrumental variables
To address these problems we utilize the 2005 adoption of Financial Accounting Standard
123R (hereinafter FAS123R) as an exogenous shock to the use of option compensation 4
Previously firms were required to expense ESOrsquos intrinsic value at the grant date while disclosing
the fair value amount in footnotes (this amount is referred to as lsquoimplied option expensersquo) As most
ESO were granted at the money and thus with zero intrinsic value (Hall and Murphy 2002) firms
4 FAS123R was introduced in response to the Enron-type accounting scandals of 2001-2002 At that time many
observers argued that overly favorable reporting treatment had led to an excessive use of option-based compensation
(Hall and Murphy 2003) that lsquolsquoperversely created incentives to artificially inflate reported earnings in order to keep
stock prices high and risingrsquorsquo (Greenspan 2002) Thus it is reasonable to assume that FAS123R was exogenous with
respect to trends in payout policy
4
reported no expense in their income statements FAS123R required firms to expense ESO in the
income statement at fair value Consistent with FAS123R increasing the perceived cost of stock
options (Murphy 2013) various studies have documented a large decrease in the use of stock
options subsequent to its introduction (Carter Lynch and Tuna 2007) Hayes Lemmon and Qiu
(2012) report a decline in the median ratio of the value of option grants to total pay from 397 to
139 following FAS123Rrsquos implementation Such a sudden change in executive pay
composition is rare (Frydman and Jenter 2010) and thus provides a unique opportunity to
investigate its effect on payout policy
This setting has additional benefits as well One such benefit is that the decrease in ESO
predicts an increase in dividends Settings that predict a decrease in dividends are arguably less
powerful as firms are notoriously reluctant to cut dividends given the evidence of a negative
investorsrsquo reaction (Brav et al 2005)5 Also the period subsequent to FAS123R witnessed a
general increase in corporate payouts (Floyd Li and Skinner 2015) These factors all combine to
produce a powerful setting to detect a compensation-induced increase in dividends
While FAS123R created an exogenous shock to the use of option-based compensation a
major challenge to the research design remains The accounting standard is applied to all public
firms making it difficult to construct control groups To tackle this challenge our empirical
strategy exploits the idea that FAS123Rrsquos impact likely varies across different types of firms We
conjecture that firms facing a larger hit on their reported earnings (as measured by a higher implied
option expense in 2002 prior to FAS123R) will reduce option grants significantly more than other
firms Indeed in our sample option compensation as percentage of total executive pay drops from
507 to 325 for firms in the top quartile of implied option expense versus 201 to 167 for
5 Indeed association studies reporting a negative association between option-based pay and dividends frame the issue
in terms of lower dividend increases (ie repurchases substituting for future dividend increases in option-heavy firms)
rather than in terms of dividend decreases
5
firms in the bottom quartile Using this cross sectional variation our strategy is a difference-in-
difference design where the first difference is the adoption of FAS123R and the second is the pre-
event implied option expense effectively our proxy for the expected accounting-induced reduction
in option-based compensation The key identification assumption is that the level of implied
option expense (prior to the announcement of FAS123R) is not correlated with the potential future
change in payout variables in the absence of treatment (ie FAS123R) We discuss this
assumption further in Section 2
We perform our empirical tests using a sample of SampP 1500 firms between 2003 and 2007
a five-year event window surrounding the 2005 adoption of FAS123R In particular we estimate
the association between implied option expense measured in 2002 and thus prior to the event
window and the change in the average payout variables from the ldquoprerdquo (2003-2004) to the ldquopostrdquo
(2005-2007) period after controlling for known determinants of payout policy Across various
measures of dividend changes we do not find that firms with higher implied option expense
increased their dividends relative to firms with lower implied option expense both in the full
sample and in a sub-sample of firms that paid dividends prior to FAS123R Also among firms
that did not pay dividends prior to FAS123R those with higher implied option expense did not
experience a relative increase in the rate of dividend initiation This lack of an effect on dividend
payouts is remarkable given that the accounting-induced decline in option-based pay was
accompanied by a corresponding increase in restricted stock awards which generally pay
dividends Further we find no association between implied option expense and changes in the
level of repurchases or changes in the relative weights of dividends and repurchases
Our results are robust to using alternative measures of dividends and repurchases
employing a panel regression (rather than a first-difference regression) and excluding the year of
6
adoption 2005 They are also robust to excluding firms that may have taken actions in anticipation
of the expected adoption of FAS123R (eg voluntarily expensing options) Finally to further
address the lack of a control group we follow Bakke Mahmudi Fernando and Salas (2015) and
define control firms as those voluntarily expensing options and those issuing no options to the
CEO prior to FAS123R on the ground that these firms were likely unaffected by the new standard
Our inferences remain unchanged
Overall the evidence is not consistent with the prediction that option-based compensation
has a first-order causal impact on payout policy and suggests that the previously documented
associations perhaps reflect endogeneity rather than a causal influence Our findings should not be
viewed as denying that stock options provide an incentive to favor repurchases over dividends
Rather they suggest this incentive does not imply an unconstrained ability to change payout policy
in a self-serving way likely because of the visibility of payout policy and its relevance to boards
and institutional investors 6 In addition boards may compensate executives for the lack of
dividend-protection in other ways effectively neutralizing those incentives Notably our findings
are consistent with managersrsquo statements that lack of dividend-protection does not affect payout
decisions (Brav et al (2005) who highlight this stark contrast between their survey evidence and
the empirical associations in the literature)7 Our results also provide another explanation for the
persistent lack of dividend protection in executivesrsquo options boards are not concerned with its
6 Note that our results are not inconsistent with evidence that managers take actions to increase personal wealth in
settings where the level of scrutiny is lower (eg timing of option grants backdating Heron and Lie 2007) or where it
is harder for outsiders to detect personal motives (eg risk-taking activities that increase the value of options Bakke et
al 2015) 7 Only 106 of surveyed executives agree that lack of dividend protection may cause managers to favor repurchases
over dividends ndash the lowest level of support among all the questions in the survey Of course it is possible that
managers would not admit to the effect on their behavior but similar surveys have elicited candid responses For
example a large percentage of managers surveyed by Graham Harvey and Rajgopal (2005) admit that they would
sacrifice economic value to smooth earnings or to hit an earnings target
7
effect because they can mitigate it by directly monitoring payout choices andor adjusting
compensation packages
Our study contributes to a vast literature on the determinants of payout policy First while
many studies document an association between option-based pay and payout policy limited
attempts have been made to examine its causal nature8 Addressing this question will enhance our
understanding of temporal changes in payout policy such as the emergence of repurchases as
primary payout vehicle (Farre-Mensa et al 2014) and the recently observed lsquoresiliencersquo of
dividends (Floyd et al 2015) Using the plausible exogenous variation in ESO induced by
FAS123R our evidence calls into question the notion that option-based compensation is a first-
order driver of payout policy and challenges future research to consider alternative explanations
for the trends in corporate payouts Second we extend the research that examines how
institutional changes affect payout policy Most of these studies examine changes in dividend tax
rates (eg Chetty and Saez 2005 Brown Liang and Wesibenner 2007 Aboody and Kasznik 2008
Blouin Raedy and Shackelford 2011 Hanlon and Hoopes 2014) or in the information environment
(Hail Tahoun and Wang 2014) while we examine a new accounting standard that affected the
composition of executive pay
We also contribute to a recent stream of research that uses exogenous shocks to understand
the economic impact of option-based pay (Low 2009 Gormley Matsa and Milbourn 2013) Some
of these studies use FAS123R to examine the causal effect of option-based pay on risk-taking with
mixed findings (Chava and Purnanandam 2010 Hayes Lemmon and Qiu 2012 Bakke et al 2015
Chu and Ma 2015) We extend this research in two ways First we use FAS123R to examine the
8 A notable exception is Shue and Townsend (2014) who instrument change in option grants with predicted new
option grant cycle and find that dividend growth is slower in the first year of a new option grant cycle than other years
An important premise underlying this approach is that the outcomes respond almost instantaneously to the treatment
In this paper we are more concerned with the longer-term effects of ESO as payout tends to be sticky and may
respond to the treatment only gradually (Lambert et al 1989)
8
effect of option-based pay on a different yet important economic outcome payout policy Second
our metholodogy differs from prior studies in that it explicitly incorporates cross-sectional
variation in how firms were affected by FAS123R Future work may use this approach to examine
the effect of option-based pay on other corporate policies
Finally we extend the literature on how accounting rules impact a firmrsquos economic
behavior (eg Carter and Lynch 2003 Carter et al 2007 Bens and Mohanan 2008 Choudhary
Rajgopal and Venkatachalam 2009 Graham Hanlon and Shevlin 2011) as well as the literature on
the accounting treatment for stock options (Aboody 1996 Dechow Hutton and Sloan 1996
Aboody Barth and Kasznik 2004 Ferri and Sandino 2009)
2 Research Design
21 Empirical Strategy
It is commonly recognized that identifying the causal effects of executive compensation in
empirical studies is challenging (Edmans and Gabaix 2015) FAS123R provides a unique
opportunity to address this problem Aside from significantly reducing the use of option
compensation the accounting change should not in itself correlate with the outcomes of interest
(ie change in payout policy)9 However utilizing FAS123R is not easy because it affected all
US firms at the same time making it difficult to measure a counterfactual change around the
event based on a control group A simple before-after comparison of the outcome variable around
the adoption of FAS123R would assume that any change is driven entirely by the event of interest
(ie it would assume away any conterfactual trend in the outcome variable) a questionable
assumption An alternative strategy is to use the change in option-based compensation around
9 Hayes et al (2012) describes FAS123R as an exogenous change in the accounting benefits of stock options without a
change to the economic costs and benefits of stock options while Bakke et al (2015) describes it as causing a change
in executivesrsquo but not shareholdersrsquo incentives
9
FAS123R effectively assuming that such change is ldquoexogenousrdquo (eg Chava and Purnanandam
2010 Anantharaman and Lee 2014) The problem with this approach is that FAS123R per se did
not generate exogenous cross-sectional variation in option compensation Even if the introduction
of FAS123R is exogenous a firmrsquos response cannot be assumed to be entirely exogenous10
To identify the exogenous portion of firmsrsquo response to the new standard we make use of
evidence that FAS123Rrsquos impact on the use of option compensation varies with the firm-specific
expected accounting impact of the new rule as measured by the implied option expense disclosed
in the footnotes prior to FAS123R (Hayes et al 2012) The reduction in option usage is highest in
firms with the largest implied option expense Thus we can use the differential accounting impact
of FAS123R to overcome the problem of lacking control group
To validate our approach we estimate the following first-differencing regression with
ordinary lease square (OLS)
ΔOptioni = β0 + β1 Accounting Impacti + ΛControli +εi (1)
where ΔOptioni is the change in the average value of executive stock options as percentage of total
pay from the pre- to the post-FAS123R period Accounting Impacti is the implied option expense
measured prior to FAS123R (more details in Section 22) We expect β1 to be negative that is a
more pronounced reduction in option-based pay for firms with higher expected accounting impact
Next after validating the differential impact of FAS123R we examine the central question
of this study by estimating the following OLS regression
ΔPayouti = γ0 + γ1 Accounting Impacti + ΓControli +ui (2)
10 A universally assigned encouragement to receive treatment does not make the realization of treatment assignment
free from endogeneity concerns Consider the following example after the adoption of FAS123R firm A reduces the
weight of option-based pay by 20 and firm B by 40 A finding that firm B increases dividends compared to firm A
cannot be interpreted as evidence of a causal influence of option compensation on dividend policy This is because the
additional reduction in option compensation by firm B relative to firm A may not be driven by FAS123R It may
instead reflect an attempt to align executivesrsquo incentives with anticipated changes in dividend policy (reverse
causality) Without a way to incorporate the heterogeneous impact of FAS123R in the research design the cross
sectional variation in changes in option-based compensation is still subject to the usual endogeneity concerns
10
where ΔPayouti represents the change in the average value of one of the payout variables
of interest (described in Section 23) from the the pre- to the post-FAS123R period
Eq (2) is essentially a difference-in-difference approach to estimate the effect of option-
based pay on payout policy using the differential accounting impact of FAS123R to capture the
exogenous (accounting-induced) portion of the change in option-based pay If option-based pay
has a detectable causal effect on dividends (repurchases) in the direction predicted by the
literature γ1 should be positive (negative)
As noted by Bertrand Duflo and Mullainathan (2004) in difference-in-difference studies
with panel data OLS may yield inconsistent standard error estimates because the dependent
variable and the main independent variable tend to be serially correlated within firm To alleviate
this concern following Bertrand et al (2004) in both Eqs (1) and (2) we collapse the panel to a
single ldquoPrerdquo (2003-2004) and a single ldquoPostrdquo (2005-2007) period by averaging across years and
then measuring the changes from Pre to Post11 We choose 2003 as the starting period in order to
capture a period subsequent to the 2003 tax cut on individual dividend income While the
evidence on the effect of the tax cut on payout policy is mixed (Chetty and Saez 2005 Edgerton
2013 Floyd et al 2015) starting with 2003 allows the pre-FAS123R levels of the key variables to
reflect any effect of the tax cut 12 We end our analysis in 2007 to avoid the potentially
confounding effect of the 2008 financial crisis which had a significant impact on payouts (Floyd et
al 2015)13 Following Hayes et al (2012) and Bakke et al (2015) we include 2005 in the Post
11 In the collapsed two-period panel a regression of changes is equivalent to a regression of levels with firm-fixed
effects and an indicator for the Post period Both approaches obviate unobserved time-invariant firm heterogeneity
We choose first differencing equation for a more intuitive interpretation 12 The Jobs and Growth Tax Relief Reconciliation Act of 2003 was signed into law on May 28 2003 but had been
proposed on January 7 2003 and was made retroactive to the beginning of 2003 Chetty and Saez (2005) show that
the tax change affected dividend policy in 2003 13 In November 2006 the Securities and Exchange Commission required more details about the terms of performance-
based incentive plans We are not aware of any evidence that these rules affected the weight of option-based pay
11
period because FAS123R while effective in June 2005 was released in December 2004 14
Alternatively in untabulated tests we exclude 2005 from the analysis and obtain similar results
Another benefit of using a single Pre and Post period is that it is better suited than panel
data to the analysis of repurchases As noted by Skinner (2008) firms engaging in repurchases
tend to do so every other year thus the relation between repurchases and economic determinants is
stronger over two- or three-year periods than one-year periods Factors explaining the timing of
repurchases differ from those explaining their level and the year-to-year variation in repurchases is
not necessarily informative of changes in payout policy As we are not interested in the timing of
repurchases our approach seems to better capture ldquolong-runrdquo changes in payout policy However
for the analysis of dividends (which are generally paid every year and thus not subject to the
above problem) we also present the results using a panel regression with firm- and year-fixed
effects To alleviate the problem of serial correlation discussed earlier we cluster the standard
errors by firm
22 Accounting Impact
As noted earlier all firms were affected by FAS123R making it difficult to identify a
control sample To capture variation in the cross-sectional impact of FAS123R in Eqs (1) and (2)
we use Accounting Impacti defined as the implied option expense disclosed in the footnote of the
income statement for the 2002 fiscal year scaled by total assets (we obtain similar findings when
scaling it by revenues) We measure this variable in 2002 (ie before the Pre period) rather than in
2003 or 2004 to avoid any confounding effect from the expected adopion of FAS123R (see
discussion in Section 33) As this variable is highly skewed (see Table 1) we define it based on
(Gipper 2015) or had any effect on payout policy However we exclude 2007 from the Post period in robustness tests
Our inferences are unchanged 14 FAS123R was released in December 2004 effective as of the beginning of the first interim or annual reporting
period beginning after June 15 2005 Subsequently the SEC allowed a six-month deferral making the standard
effective for fiscal years beginning after December 15 2005
12
its quartile rank We also presents results with separate indicators for the top three quartiles in
order to better isolate the difference between top quartile (the most lsquotreatedrsquo group) and bottom
quartile (the least lsquotreatedrsquo group and thus closer to the notion of a control group)
An alternative way to address the issue of a lack of control group is suggested by Bakke et
al (2015) They argue that two sets of firms were likely lsquounaffectedrsquo by FAS123R (i) firms that
did not grant options to the CEO in 2003 and 2004 as in these firms FAS123R could not affect
CEO option pay and thus her incentives to make policy changes (ii) firms that were already
voluntarily expensing stock options as of 2002 (ie before FASB began discussions of the new
standard) as these firms would not face any additional accounting charge under FAS123R
Our approach offers a number of advantages First instead of collapsing all lsquonon-controlrsquo
firms in a single lsquotreatedrsquo group we exploit cross-sectional variation among treatment firms in
terms of the likely impact of FAS123R effectively using the most and least affected firms
(respectively top and bottom quartile of implied option expense) as treatment and control group
As shown in Table 1 the implied option expense is highly skewed (ie only a relatively small
number of firms was heavily affected by FAS123R) Capturing this variation is likely to increase
the power of the test Second in Bakke et al (2015) what matters is that the treatment definition
captures an accounting-driven change in CEO option grants as their focus is on CEO risk-taking
incentives In our setting we want to capture an accounting-driven change both in CEO option
grants (predicted to affect incentives to use dividends) and in the overall use of stock options
(predicted to affect the use of repurchases) As noted in Section 31 (see footnote 20) many firms
without CEO option grants in 2003 and 2004 were issuing options to non-CEO executives and
other employees and thus facing a potential accounting charge under FAS123R Third about half
of the firms without CEO option grants in 2003 and 2004 issued options to the CEO in the Post-
13
period Hence it is not clear that the control firms were truly unaffected by FAS123R Finally
the implied option expense in 2002 (our measure of the expected accounting impact) is a function
of option grants made in prior years when firms could not anticipate the adoption of FAS123R In
contrast option grant decisions in 2003 and 2004 may be affected by its anticipated adoption as
FASB added accounting for stock-based compensation to its agenda in March 2003
Notwithstanding the above arguments throughout our study we also present the results
using the definition of treatment and control in Bakke et al (2015) In particular we modify Eqs
(1) and (2) by replacing Accounting Impact with Treated an indicator equal to zero for the two
groups of firms identified as lsquocontrolrsquo in Bakke et al (2015) and one for all other firms
23 Payout Variables and Control Variables
Following Brown et al (2007) our baseline measure for changes in dividends is the change
in the DividendAssets ratiomdashcomputed as the regular cash dividends paid during the year scaled
by total assets at the beginning of the yearmdashfrom the Pre to the Post period15 However the
dividend-to-asset ratio is not what managers focus on when making dividend policy decisions
The stability of dividend per share (DPS) among dividend-paying firms (hereinafter payers)
suggests that managers do not target a specific dividend-to-assets ratio but rather a DPS level
(Baker and Wurgler 2016) Survey evidence confirms that executives make dividend policy
decision in terms of changes to the current level of DPS (Brav et al 2005) Therefore we also
examine the percentage change in the average DPS from the Pre to the Post period However this
measure can only be computed for the subset of payers (defined as firms with non-zero DPS in at
15 An alternative choice would be to scale dividends by the market value of equity essentially computing a dividend
yield However a drawback of using the dividend yield in our setting is that after controlling for time-invariant firm
characteristics through fixed effects or first differencing the variation of the ratio comes mainly from the denominator
the stock price (Baker and Wurgler 2004) Thus we choose the more stable book value of total assets as denominator
Also similar to other studies (eg Fenn and Liang 2001) we focus on regular dividends and exclude special dividends
as they are very rare and may introduce large noise to the dividend measures for few observations (DeAngelo
DeAngelo and Skinner 2000)
14
least one of the years of the Pre period) To provide insights into FAS123Rrsquos effect on dividend
policy for non-payers we examine the relation between our Accounting Impact variable and the
rate of dividend initations in the Pre and Post periods
Our main measure for repurchases is the change in RepurchaseAssetsmdashthat is the
aggregate amount of common stock repurchases made during the year scaled by total assets at the
beginning of the yearmdashfrom the Pre to the Post period In the empirical tests we examine
variations suggested in the literature
Finally as an alternative to examining dividends and repurchases separately we also look at a
measure of the payout composition the change in the DividendsTotal Payout ratio from the Pre to
the Post period (Total Payout is the sum of dividends and repurchases) effectively capturing any
substitution effect between dividends and repurchases 16 Examining the causal effect of the
change in option-based pay on payout composition is especially relevant if managers first target a
total payout and then choose the relative weight of dividends and repurchases In practice it is
unclear to what extent managers act this way (Brav et al 2005) Nonetheless for completeness we
also examine this variable We focus on the subsample of firms with both dividends and
repurchases in both Pre and Post period so as to capture changes in payout mix by firms routinely
using both vehicles to return cash to shareholders
As for the control variables in both Eqs (1) and (2) Controli is a vector of firm characteristics
identified in existent literature as determinants of payout policy (eg Fenn and Liang 2001 Brown
et al 2007 Skinner 2008 Cuny et al 2009) firm size book-to-market leverage asset tangibility
free cash flows cash holdings volatility in operating income institutional ownership sales
16 Fama and French (2001) suggest that repurchases are often complement to dividends while Grullon and Michaely
(2002) document that the increase in share repurchases over the past decades has come at the expense of a lower
increase in dividends consistent with a substitution hypothesis Brown et al (2007) also provide evidence of a
substitution effect in response to the 2003 dividend tax cut Survey evidence in Brav et al (2005) suggests an
asymmetric substitution effect with managers more willing to replace dividends with repurchases than the opposite
15
growth past stock returns and an indicator for loss firms For all of these variables we include
both changes from Pre to Post period and levels in the Pre period to allow for the possibility that
levels of these variables affect subsequent changes in payout policy 17 Finally we include
industry-fixed effects (Fama-French 48 industry indicators) to control for industry-level trends in
payout policies and option-based pay In unreported tests we replace free cash flows with two
separate variables operating profit and capital expenditures We also replace volatility in
operating income with volatility in stock returns Our results are unaffected More detailed
definitions of each variable are in the Appendix
24 Identification Assumption
The key identifying assumption underlying the difference-in-difference estimation
technique is that the parallel trends assumption is satisfied In the absence of treatment both
treated and control firms should experience parallel trends in the outcome variable Our approach
assumes that in the absence of FAS123R the change in dividends or repurchases would be the
same for high and low accounting impact firms Note that the well-documented contemporaneous
correlation between levels of option compensation (a key driver of the implied option expense and
thus the accounting impact) and levels of payout variables does not violate our identification
assumption This is because our assumption pertains to the relation between the level of option
compensation and future changes in payout variables
A specific concern is that options may be granted in anticipation of expected future
changes in payout policy (reverse causality problem) Relative to simple association tests this
concern is significantly reduced in our setting because the accounting impact is measured three
years prior to the arrival of treatment and is the result of option grants made over the prior four or
17 In untabulated analyses we run our tests after excluding changes in the control variables (ie including only their
pre-treatment levels) since in difference-in-difference studies controlling variables measured after the shock may
reintroduce selection bias Our inferences remain unchanged
16
five years depending on the vesting schedule18 For the reverse causality to be plausible the
implied option expense in 2002 (the result of option grants made approximately between 1998 and
2002) needs to reflect the anticipated change in payout policy in 2005-2007 This seems unlikely
While the parallel trend assumption is not directly testable similar to other studies (Bakke
et al 2015) we examine the trends in dividends and repurchases during the Pre period Figure 1
suggests that high and low accounting impact firms (respectively top and bottom quartile of
implied option expense) exhibit similar trends in payout variables in the Pre period ie from 2003
to 2004 More formally to examine the correlation between Accounting Impact and trends in the
payout variables during the Pre period we estimate the following regression only with
observations in 2003 and 2004
Payouti = γ0 + γ1 Accounting Impacti FY2004+ γ2 FY2004+ ΓControli +Firm FE +ui (3)
where Payouti is either DividendAssets or RepurchaseAssets FY2004 is an indicator of
fiscal year 2004 Firm FE indicates firm-fixed effects If firms with varying degrees of accounting
impact have different payout trends before the adoption of FAS123R γ1 should be different from
zero However for both payout variables we find that the estimated γ1 is close to zero and not
statistically significant at 10 level (untabulated tests) Overall the parallel trends assumption
seems reasonable in our setting
3 Empirical analyses
31 Sample Selection and Summary Statistics
Our sample is the SampP 1500 firms with available data on implied option expense (from
Compustat) and on executive compensation (from Execucomp) for at least one year in the Pre
18 The accounting treatment for stock options requires their fair value at the grant date to be recognized over the
service period (usually the vesting period) Hence the implied option expense in a given year includes a fraction of
the expense associated with past option grants
17
period and one year in the Post period to ensure consistency in the sample across periods Similar
to prior studies on payout policy (Fama and French 2001 Skinner 2008) we exclude financial
firms (SIC code between 6000 and 6999) and utilities (SIC between code 4900 and 4999) as well as
firms not incorporated in the US Our final sample includes 1176 firms19 We obtain dividend
and stock returns data from CRSP stock repurchases and dividend per share data from
COMPUSTAT and institutional ownership data from Thomson Reuters 13F database Other
control variables are from CRSP and COMPUSTAT To deal with outliers we winsorize all
continuous variables at 1 and 99 by fiscal year A detailed definition of all variables and their
sources is in Appendix
Table 1 Panel A presents summary statistics of the relevant variables for the pooled sample of
5653 firm-year observations Implied option expense in 2002 (our proxy for Accounting Impact)
is on average 173 of total assets with the median at 052 This suggests that the accounting
impact is very large for a small number of firms Over the entire sample period on average
dividends represent 093 of total assets while repurchases represent 394 Untabulated
analyses indicate that in 16 of the firm-year observations only dividends are paid out in 25
only repurchases in 32 both and in 27 neither Within the subset of firm-years with a payout
dividends represent 3874 of total payout This data confirms prior evidence that repurchases
have assumed the primary role as a vehicle to return cash to shareholders (eg Floyd et al 2015)
The mean (median) total executive pay (average across the top 5 executives) is $25 million ($16
million) On average option grants and restricted stock grants represent respectively 283 and
141 of total pay while salary and bonus comprise 296 and 197 respectively The
19 The results presented in the study are similar when (i) we restrict the sample to firms with available data for the
entire (2003-2007) sample period (1009 firms) and (ii) we exclude firms with CEO turnover in the Post period
(reducing the sample size to 780 firms) as a new CEO may have a different compensation package andor adopt a
different payout policy
18
composition of CEO pay (untabulated) is similar As for the control variables the figures are
generally consistent with other studies examining SampP 1500 firms over the same period
Panel B reports the pairwise Pearson correlations among the relevant variables The
correlations are in line with the associations documented in prior studies For example larger
firms and firms with higher profitability (free cash flows) have higher payouts loss firms have
lower payouts greater volatility in operating income is associated with lower dividends
More relevant to our analysis Panel C presents the mean of each variable in the Pre and Post
period for the full sample For each variable we first compute the firm-level mean over the Pre
and the Post Period and then compute the mean of the resulting figure across all firms There is a
striking increase in repurchases which double from 245 to 490 of total assets causing a
similar increase in total payout The increase in dividends is much smaller from 083 to 099
of total assets As a result for firms with positive payout dividends become a smaller fraction of
total payout in the Post period (2790 versus 3914 in the Pre period) This trend is consistent
with Floyd et al (2015) who document a dramatic increase in repurchases in the years leading to
the 2008 financial crisis Consistent with previous studies around FAS123R there is a significant
reduction in option grants as a fraction of total executive pay (from 343 to 240) and a
corresponding increase in the use of restricted stock (from 87 to 176) with little variation in
the weight of salary and bonus (note that restricted stock salary and bonus were expensed both
before and after FAS123R) Similar patterns hold for the composition of CEO pay (untabulated)
Compared to changes in the mix of executive pay changes in the levels of control variables are
generally less pronounced
Panel D reports the change in the key compensation and payout variables from the Pre to the
Post period by quartiles of implied option expense and yields a number of insights First
19
confirming the skewness suggested by Panel A the mean implied option expense is 551 for
firms in the top quartile versus only 093 035 and 012 for firms in the second third and
bottom quartile respectively Second as expected firms with higher implied option expense have
greater use of option-based pay For example in the Pre-period option pay represents 507 of
total executive pay at firms in the top quartile versus 201 in the bottom quartile Third and
more importantly for our research design the use of option pay changes significantly from the Pre
to the Post period as a function of the accounting impact For firms in the top quartile the
percentage of total pay represented by stock options drops by 182 (from 507 to 325)
versus 113 80 and 34 for firms in the second third and bottom quartile respectively The
decline in option usage across quartiles is accompanied by an increase in restricted stock grants
while the weight of salary and bonus shows little change It is important to emphasize the
substitution of stock options with restricted stocks because restricted stocks typically pay
dividends (Zhang 2013) thus providing further reason to expect a dividend increase in response to
the FAS123R-induced decline in option pay
As for the payout variables Panel D suggests that heavy option users (firms with higher
implied option expense) generally use repurchases more than dividends consistent with the
associations documented in earlier studies In the Pre period repurchases (dividends) represent
351 (030) of total assets for the top quartile versus 113 (112) for the bottom quartile
Panel D also indicates that the increase in repurchases documented in Panel C takes place across
all quartiles As for the (much smaller) change in dividends the absolute increase is similar across
the four quartiles though the relative increase (the percentage change) appears to be slightly
higher in the top quartile Overall these figures do not suggest a shift toward dividends and away
from repurchases by firms with a large (accounting-induced) decline in the use of option pay
20
Panel E presents the same data as Panel D but based on the definition of lsquotreatmentrsquo and
lsquocontrolrsquo in Bakke et al (2015) Under this definition 997 firms are classified as treatment group
and 177 as control (171 firms are classified as lsquocontrolrsquo because they did not grant options to the
CEO in the Pre period and 6 because they were voluntarily expensing options before 2003)
Interestingly lsquotreatedrsquo firms are equally distributed across the quartiles suggesting significant
variation in the degree of treatment As discussed earlier one benefit of our approach is that it
exploits cross-sectional variation among treatment firms in terms of the likely impact of FAS123R
Also 40 of the control firms (71 out of 177) are in the lowest quartile while 35 ((37+25)177)
are in the top two quartiles reflecting the different focus of the two approaches in terms of
identifying firms less affected by FAS123R20
As for payout and compensation variables Panel E shows that the treated group experiences a
larger increase in repurchases than the control group while the (less pronounced) increase in
dividends is similar across treated and control firms Treated firms experience a 126 decrease in
option pay (from 387 to 261) with a corresponding 94 increase in the weight of restricted
stock grants (from 80 to 174) The figures are similar at the CEO level (because the
classification is based on options grants to the CEO it is useful to report pay figures at both the top
5 executives and the CEO level) Interestingly the control group experiences a pronounced
increase in the weight of option grants in total CEO pay from 10 to 127 as almost half of the
control firms issued options to their CEOs in the Post period (for these firms options as percentage
of total CEO pay increased from 0 to 254 untabulated analysis) While this increased use of
stock options suggests (ex post) that these firms were not concerned with the impact of FAS123R
another possibility is that the lack of use of option compensation for CEOs in 2003 and 2004 was
20 In untabulated analysis we find that 55 of the 171 firms issuing no options to the CEO in the Pre period granted
options to the other top executives (and perhaps to other non-executive employees) thus explaining the relatively high
implied option expense for the control group (10 versus 19 for the treatment group ndash see Panel E)
21
temporary rather than the effect of a permanent policy If these firms were planning to issue
options to the CEO in the Post period the assumption that they were unaffected by FAS123R (and
thus their use as control sample) is questionable21
32 Differential Impact of FAS123R on the Use of Option-Based Compensation
An important building block of our approach is the presumed differential impact of FAS123R
on option-based pay as a function of pre-existing implied option expense22 While Table 1 Panel
D preliminarily supports the validity of this assumption we formally examine it by estimating Eq
(1)
As reported in Table 2 Panel A we find a significant negative association between Accounting
Impact and the change in option-based pay around the adoption of FAS123R In column (1)
where we use the quartile rank of implied option expense the -0044 coefficient implies that
around FAS123R option grants over total pay decline by 44 as we move from the highest
quartile to the next Thus the reduction in top quartile firms is 132 larger than in bottom
quartile firms In column 2 we replace the quartile rank with three indicators for the highest
quartiles (with the bottom quartile collapsed in the intercept) so as to be able to compare directly
top and bottom quartile without imposing the same effect across quartiles The negative and
significant coefficient on the top quartile indicator at -0140 suggests that the reduction in option
grants over total pay is 140 larger for top quartile firms relative to bottom quartile firms
Finally in column 3 we use the indicator for treated firms following Bakke et al (2015) The
21 Panel E also shows an increase in the use of restricted stock in CEO pay packages (from 128 to 182 almost
comparable to the increase among treated firms) The concurrent increase in options and restricted stock suggests
these firms would have increased option pay significantly more had it not been for FAS123R indicating further
caution in classifying them as control group of unaffected firms 22 This is akin to the relevance assumption of instrumental variable if we interpret the implied option expense as an
instrument to the change in option-based pay
22
negative and significant coefficient at -0132 suggests that treated firms experience a 132
larger drop in the weight of option pay relative to control firms
In Panel B we re-estimate Eq (1) using a panel regression with firm- and year-fixed effects
(5653 firm-year observations) where the dependent variable is the the ratio of option grants to
total executive pay The results are virtually identical in terms of significance and magnitude of
the coefficients of interest (the interaction terms between respectively Accounting impact and
Treated and an indicator for the Post period)
Overall Table 2 suggests that high implied option expense and the introduction of FAS123R
together strongly encouraged firms to cut back option-based compensation for executives It also
supports the general validity of the approach in Bakke et al (2015) in identifying firms most
affected by FAS123R notwithstanding the concerns outlined earlier
Our test of Eq (1) focuses on executive stock options For our dividend-protection hypothesis
it is important to establish that the level of implied option expense predicts a change in executive
stock options (rather than only a change in the use of non-executive employee stock options) as we
want to capture the effect of a change in executivesrsquo incentives on payout policy At the same
time our dilution channel hypothesis assumes a change in the use of all (executive and non-
executive employee) stock options Thus in untabulated analyses we repeat the test in Eq (1) by
replacing the dependent variable with the change in the number of options granted to all
employees (scaled by the total number of outstanding shares note for this analysis we can only
use data from 2004 to 2007 because Compustat began reporting data on ESO in 2004) The
coefficient on Accounting Impact and Treated continues to be negative and significant suggesting
that the differential reduction in the use of option compensation as a function of accounting impact
23
occurred for both executive and non-executive employee stock options Indeed Brown and Lee
(2011) report a similar decrease in executive and employee stock options around FAS123R
33 Option-Based Pay and Dividend Payouts
In this section we examine the effect of an exogenous (accounting-induced) change in option
compensation on dividend policy by estimating Equation (2)
Table 3 Panel A presents the results using the change in dividends from Pre to Post as
dependent variable We find no significant association between Accounting Impact (column 1 and
2) or Treated (column 3) and the change in dividends around the adoption of FAS123R This is in
stark contrast with the negative effect of option-based pay on dividends predicted in the literature
and documented in various association studies
One concern with this lack of effect is that perhaps our setting is not powerful enough to detect
it One way to examine this possibility is the following The coefficient on Accounting Impact
rank=4 in column 2 is 0001 and the standard error (SE) is 00009 Assuming the estimated
standard error is correct then for a two-tailed t test the coefficient needs to be greater than 00015
(=SE1645) or 015 to reach the 10 percent significant level In other words if moving from
the bottom to the top quartile (which predicts a 14 differential decline in option based pay as per
Table 2 Panel A) resulted in a 015 increase of the dividendasset ratio our test would be able to
detect a causal effect of option-based pay on dividends Given the unconditional mean of the
dividendasset ratio at 093 an increase of 015 from the Pre to the Post period seems
plausible In fact the average increase from the Pre to the Post period is 016 (Table 1 Panel C)
Thus if an effect was there our test should detect it
24
Panel B presents the results using a panel regression (5653 firm-year observations) with firm-
and year-fixed effects and interaction terms between Accounting Impact (or Treated) and an
indicator for the Post period Our inferences are unchanged
These analyses are based on our full sample which includes both dividend-paying and non-
dividend-paying firms Hence they implicity treat as equal two potentially different decisions to
initiate dividends and to increase dividends For example an increase in the dividend-to-asset
ratio from 05 to 06 will be treated the same as an increase from 00 to 01 even though
the latter represents a critical dividend initiation decision23 To address this following Chetty and
Saez (2005) we separately examine how FAS123R impacts the intensity of dividend changes (for
the subset of payers) and the likelihood of dividend initiations (for the subset of non-payers)
331 Option-Based Pay and Dividend Payouts Intensity of Dividend Changes
In the first row of Panel C we repeat the analysis in Panel A for the sub-sample of 572 payers
defined as firms with positive DPS in 2003 andor 2004 Note that we report only the coefficients
of interest for parsimony In the second row we replace the dependent variable with the
percentage change in DPS DPS is the choice variable for managers (Brav et al 2005 Baker and
Wurgler 2016) and thus our preferred measure to capture changes in dividend policy To account
for skewness in this variable (Khale 2002) in the third fourth and fifth rows we use indicator
variables to denote whether the change in DPS surpasses a threshold respectively 20 40 and
60 The proportion of firms that surpass these thresholds are 59 44 and 33 respectively24
23 Initiating dividends is a critical decision for boards given the pre-commitment value that investors attach to this
decision and the strong negative market reaction when firms eliminate or reduce dividends (Brav et al 2005) For
executives trying to maximize the value of their own stock options (dividend-protection argument) the ability to
influence a dividend initiation decision is likely lower than the ability to influence a dividend increase decision 24 Although in the third fourth and fifth rows our dependent variable is a binary variable we use a linear model (OLS)
instead of a probit or logit nonlinear model The reason is that estimating fixed effects in binary response models with
panel data can cause the incidental parameters problem The coefficient estimates can be biased when the panel data
25
Across all of these specifications we find no association between Accounting Impact or Treated
and the intensity of dividend changes Thus it does not appear that an exogenous reduction in
option-based pay caused dividend-paying firms to increase dividends
In Panel D we perform four robustness tests For parsimony we show only the coefficients of
interest and only the cases where the dependent variable is an indicator denoting a greater than
40 increase in DPS The results are similar for the other four ldquointensityrdquo dependent variables
reported in Panel C
In the first row we exclude firms that began to voluntarily expense options in 2003 or 2004
(84 firms of which 68 are dividend payers) FASB added accounting for stock-based
compensation to its agenda in March 2003 and issued an Exposure Draft proposing the expensing
of stock options at fair value in March 2004 In anticipation a number of firms began to
voluntarily expense stock options in 2003 and 2004 (Aboody et al 2004) If these firms reduced
option grants and as a result increased dividends during the Pre period then their inclusion may
reduce the power of our tests and thus our ability to detect the hypothesized relation25
In a similar spirit in the second row we exclude firms in the top decile in terms of reduction in
the ratio of option grants to total pay for the top 5 executives between 2002 (the year prior to the
Pre-period) and 2004 (the end of the Pre-period) This encompasses 113 firms of which 55 are
dividend payers If these firms reduced option grants in anticipation of FAS123R and as a result
increased dividends during the Pre period their inclusion may reduce our ability to detect the
hypothesized relation
has a large number of observations but a short time series Examples of studies making a similar choice are Puri
Rocholl and Steffen (2011) and Chu and Ma (2015) 25 This is unlikely to be a serious concern as previous studies suggest that voluntary expensers made limited use of
stock options (Aboody et al 2004) In fact in our sample 79 of these firms are in the bottom two quartiles of
implied option expense (untabulated) Nonetheless we present this test for robustness
26
In the third row we exclude firms that accelerated the vesting of options before FAS123R
became effective in order to avoid recognizing an expense for the unvested portion of these
options (Choudhary et al 2009 Balsam Reitenga and Yin 2008) This encompasses 196 firms of
which 54 are dividend payers If accelerating vesting was used to reduce the impact of FAS123R
the inclusion of these firms may reduce the power of our tests26
In the fourth row we deal with the concern that if firms target a fixed dividend to net income
ratio (Lintner 1956) and do so without adjusting for changes in accounting standards then by
decreasing net income (via option expense) the accounting change would mechanically cause a
reduction in dividends This would potentially offset and confound the increase predicted under
the dividend-protection and dilution hypotheses This seems unlikely for two reasons First firms
are notoriously reluctant to cut dividends (Brav et al 2005) Hence it seems unlikely that they
would reduce dividends in response to a decline in net income with no economic or cash flow
implications (ie re-classification of an expense from the footnotes to the income statement)
Second firms today set dividends in terms of dividend per share rather than by targeting a net
income-based payout ratio (Brav et al (2005)) As noted by Skinner (2008) over the last few
decades as earnings have become more variable the relation between earnings and dividends has
become weaker with dividend payments increasing smoothly and largely independent of the
variation in earnings Nevertheless in the fourth row we exclude the 66 dividend-paying firms that
26 These firms explicitly stated that they accelerated the vesting of stock options to avoid the accounting charge
(Choudhary et al 2009) In fact 72 are classified in the top two quartiles of implied option expense (untabulated)
Thus we would have predicted these firms to experience a significant decline in option pay To the extent that this
decline did not materialize because they minimized the impact of FAS123R by accelerating vesting the ability of
Accounting Impact to predict the reduction in option pay and thus its usefulness in examining changes in dividends
around FAS123R may be reduced The list of firms accelerating vesting was kindly provided by Jack Ciesielsky of
The Analystsrsquo Accounting Observer
27
had a similar payout ratio in 2003 and 2004 as a proxy for firms with a target net income-based
payout ratio in the Pre period27
As shown in Panel D even after excluding these subsets of firms we continue to find no
association between Accounting Impact or Treated and changes in dividends for dividend-paying
firms This is inconsistent with a causal influence of option compensation on dividend policy
Another concern is that by reducing net income and thus retained earnings FAS123R
may have pushed some firms closer to violating dividend covenants in debt contracts and
thus prevented them from increasing dividends This would bias our study against finding a
causal effect of option-based pay on dividends However this does not appear to be a
significant concern for three reasons First the recognition of an option expense does not
imply a decline in net income In fact more than 70 (75) of the full sample firms
(dividend payers) experienced an increase in net income before extraordinary items from
2004 to 2005 (the percentages are similar across the four quartiles of implied option
expense) Second dividend covenants are less common among dividend-paying firms
(Nikolaev 2010) Third most loan contracts in recent years give parties the option to
ldquofreezerdquo GAAP when facing a mandatory change in accounting principles (Christensen and
Nikolaev 2009) Firms expecting an adverse impact of FAS123R on their dividend covenants
would likely exercise this option (particularly given the non-cash nature of option-based
expense) Nonetheless to alleviate this concern we perform three additional analyses
(untabulated) (i) we repeat the tests in Panel C after excluding firms with a drop in net
income between 2004 and 2005 (ie firms that perhaps faced some covenant-related
27 We define a ldquosimilarrdquo payout to be an absolute change in payout ratio of less than 1 from 2003 to 2004 Among
these 66 firms only 39 continued to have a similar payout ratio in 2005 We also try an alternative definition where
a firm is classified as likely to be using a net income-based target payout ratio if the absolute percentage change in the
ratio from 2003 to 2004 is less than 10 (100 firms) Our inferences are unchanged
28
constrains to their payout policy as a result of FAS123R) (ii) we explicitly control for net
income and retained earnings in the regression (as in Skinner 2008) (iii) we repeat the tests
in Panel C for dividend payers with dividendsasset ratio above the sample median on the
basis that dividend covenants are less frequent among firms paying large dividends (Jung
Lee and Yang 2016) Our inferences are unchanged
332 Option-Based Pay and Dividend Payouts Dividend Initiations
In this section we examine whether the accounting-driven change in option pay affected
dividend initiations among non-payers We cannot employ the difference-in-difference approach
adopted so far by definition the same firm cannot initiate dividends in both periods However we
can provide suggestive evidence as follows First we take all firms that did not pay dividends in
2002 and group them into quartiles based on 2002 implied option expense For each quartile we
find the number of firms initiating dividends in 2003 and 2004 (the Pre period) Next we take all
firms that did not pay dividends in 2004 group them into quartiles based on 2002 implied option
expense and for each quartile find the number of firms initiating dividends in 2005 and 2006 (the
Post period) We do not include 2007 so as to have the same number of years in both periods and
make the cumulative initiation rates comparable
The left portion of Panel E reports the results of this exercise There is a general decrease in
the dividend initiation rate from the Pre to the Post period This holds both in the full sample of
non-payers (from 129 to 79) and across all quartiles This decrease may reflect a temporary
spike in 2003 and 2004 in response to the 2003 dividend tax cut documented in Chetty and Saez
(2005) It is noteworthy that initiation rates in both periods are lower among firms with higher
implied option expense This is consistent with option-heavy firms being mostly high-growth
firms less inclined to pay dividends More relevant to our research question if the lower use of
29
option compensation increased the propensity to pay dividends we would expect to see a relative
increase (ie a lower decrease) in dividend initiations among firms with the highest accounting
impact Instead the rate does not differ depending on the accounting impact There is
approximatley a 5 decline in initiation rate in each quartile In the right portion of Panel E we
examine similar data for dividend terminations While the results should be interpreted with
caution due to their rarity firms with higher accounting impact do not experience a greater decline
in termination rates Our inferences in Panel E are similar when we compared treated and control
firms following Bakke et al (2015) (untabulated)
Even after taking into account the different nature of decisions for dividend paying and non-
dividend-paying firms we fail to find evidence of a causal influence of option-based compensation
on dividend policy This finding is in contrast to the associations documented in earlier studies It
is even more remarkable as most firms replaced stock options with restricted stock which are
generally dividend-protected and should provide further incentive to increase dividends28
34 Option-Based Pay and Repurchases
In this section we examine the effect of an exogenous (accounting-induced) change in option
compensation on repurchases by estimating Equation (2)
Table 4 Panel A presents the results using the change in repurchases (scaled by total assets)
from Pre to Post as a dependent variable If the use of option-based pay had a positive effect on
firmsrsquo propensity to engage in repurchases as posited by the dividend-protection and dilution
hypotheses we should find a negative association between Accounting Impact or Treated and
repurchases Firms with a higher (accounting-driven) reduction in option-based pay should reduce
28 In a sample of SampP 500 firms between 2000 and 2009 Zhang (2013) reports that 80 of the firms granting
restricted stocks offer dividend protection In that sense the FAS123R-induced shift from stock options to restricted
stock may be characterized as a ldquoshockrdquo to dividend protection in unearned equity pay Accordingly our results cast
doubt on the causal interpretation of the positive association between dividend protection and dividend payouts
documented in prior studies (Zhang 2013 Burns et al 2015 Minnick and Rosenthal 2015)
30
the use of repurchases either because they are shifting toward a greater use of dividends andor
because they have a lower need to offset the dilutive effects of stock options However we find no
significant association between Accounting Impact (columns 1 and 2) and the change in
repurchases around the adoption of FAS123R When we use the Treated indicator (column 3) we
find a significant positive association rather than a negative one In Panel B we repeat the analysis
using net repurchases (ie repurchases after removing the effect of share issuances) following
Fama and French (2001) and Skinner (2008) Our inferences are unchanged29
This test is subject to two important caveats The first is we may not detect a decline in
repurchases because in the Post period firms need to offset the exercise of options that were
granted during the Pre period That is a post-FAS123R reduction in grants may not (yet) translate
into a reduction in exercises during the Post period which reduces our ability to test the dilution
hypothesis (ie that firms repurchase shares to offset exercises)30 However we can examine a
variation of this hypothesis where firms use repurchases to manage the effect of unexercised
options on diluted EPS (Bens et al 2003) To do so in Panel C we use a measure of adjusted
repurchases where we subtract our estimate of repurchases undertaken to offset the exercise of
ESO31 We effectively test whether firms experiencing an accounting-induced decrease in option
grants engage in less repurchases (net of exercise-driven repurchases) because their need to
manage the effect of unexercised options on diluted EPS is lower However the coefficient on
the variables of interest is either insignificant or positive inconsistent with the hypothesis
29 In the case of repurchases we do not examine separately ldquoinitiationsrdquo and ldquointensityrdquo as we do for dividends
because initiation is not clearly defined for repurchases Unlike dividends the occurrence of a repurchase in a given
year (or the lack thereof) cannot be used to infer a general policy due to the more discretionary nature of the timing of
repurchases 30 To capture the effect of lower option-based compensation on option exercises and thus on repurchases we would
ideally extend the Post period beyond 2007 However as noted by Floyd et al (2015) repurchases declined
dramatically after 2007 because of the financial crisis making it difficult to detect the effect of any other factor 31 As upper bound estimate of exercise-driven repurchases we multiply the number of ESO exercised during the year
times the average stock price during the year Since the number of ESO exercised is available in Compustat starting in
2004 Panel C is based on observations from 2004 to 2007
31
A second important caveat is that most firms replaced stock options with restricted stock
(Table 2 Panel C) Unvested restricted stock is excluded from the denominator in the computation
of basic EPS (once vested it is included) However it is included in the denominator of diluted
EPS using the treasury stock method similar to stock options Given the complexity of this
method without access to all details of restricted stock grants and option grants it is difficult to
determine whether the switch from stock options to restricted stock decreased the need for
dilution-driven repurchases as our test implicitly assumes Hence it is possible that we do not find
a decrease in repurchases because a reduced need to offset the dilutive effect of stock options was
neutralized by an increased need to offset the dilutive effect of restricted stock
Subject to the above caveats the evidence in Table 4 is not consistent with a positive causal
relation between the use of option-based pay and repurchases More precisely it suggests that
option-driven dilution concerns do not have a first-order effect on the magnitude of repurchases
even though they may play a role in the repurchase decision Hence our result is not necessarily
in conflict with the evidence in Brav et al (2005) where two-thirds of the surveyed financial
executives state that offsetting the dilutionary effect of stock option plans or other stock
programs is an important factor to their repurchase decisions
35 Option-Based Pay and Payout Composition
As an alternative to examining dividends and repurchases separately we also look at the
payout composition the change in the DividendsTotal Payout ratio from the Pre to the Post period
where Total Payout is the sum of dividends and repurchases As noted earlier we focus on the
subsample of firms with both dividends and repurchases in both Pre and Post periods so as to
capture the change in payout mix by firms routinely using both vehicles to return cash to
shareholders If the use of option-based pay causes firms to substitute repurchases for dividends
32
we should find a positive association between Accounting Impact or Treated and the payout mix
defined as DividendsTotal Payout ratio Firms with a higher accounting-driven reduction in
option-based pay should have an increase (decrease) in the relative weight of dividends
(repurchases) to the total payout However as reported in Table 5 Panel A we fail to find a
significant association between Accounting Impact (column 1 and 2) or Treated (column 3) and
the change in payout mix The results are similar when we use Net Payout (dividends plus net
repurchases) instead of Total Payout in computing the payout mix (Panel B)
Overall the combined evidence in Tables 3-5 does not support the hypothesis that option-
based compensation has negative (positive) effect on dividends (repurchases) or that it causes
firms to replace dividends with repurchases
4 Conclusion
Prior literature has documented robust associations between option-based compensation and
payout policy yet it remains unclear whether this association reflcts a causal influence We
investigate the causal effect of option-based compensation on payout policy using the adoption of
FAS123R which resulted in a significant decrease in option grants making it a plausible
exogenous shock to the use of option-based pay To overcome the challenge of no control group
we exploit the fact that firms responded differently depending on the firm-specific accounting
impact as measured by the implied option expense disclosed in the footnotes prior to FAS123R
Firms with larger expected accounting impact curtailed option-based compensation much more
aggressively than firms with lower impact Using a sample of SampP 1500 firms we find no
evidence that firms with a larger accounting-induced decline in option compensation increased
dividends reduced repurchases or changed their payout composition contrary to the widely held
belief that option-based pay has a causal influence on payout policy
33
Appendix Variable Definitions and Data Sources
Accounting Impact Variables
Accounting impact Implied option expense (Compustat XINTOPT) divided by total assets
(Compustat AT) This variable is measured at fiscal year 2002 and is time-invariant
Accounting impact rank The quartile rank of Accounting impact (1=lowest 4=highest)
Payout Variables
Regular dividendTotal assets The numerator is total regular cash dividends in the fiscal year
from the distribution dataset in CRSP Regular cash dividends are identified by the distribution
codes 1212 1222 1232 or 1242 The denominator is one-year lagged total assets (Compustat
AT)
DPS Dividend per share (Compustat DVPSX_F)
DPS pct change The percentage change of average DPS from Pre- to Post-FAS123R period
DPS pct change gtX indicator A dummy variable that equals one if DPC pct change is greater
than X and zero otherwise
RepurchaseTotal assets The numerator is the repurchase of common equity which equals total
repurchase (Compustat PRSTK) minus the change in preferred stock redemption value
(Compustat PSTKRV) The denominator is one-year lagged total assets (Compustat AT)
Net repurchaseTotal assets Net repurchase removes the effect of share issuances The
construction follows Fama and French (2001) and Skinner (2008) if the firm uses the treasury
stock method for repurchase net repurchase equals the increase in common treasury stock
(Compustat TSTKC) if the firm uses the retirement method (when common treasury stock is zero
in the current and prior year) net repurchase equals total repurchases minus stock issuance
(Compustat SSTK) and change in preferred stock redemption value (Compustat PSTKRV)
When the above measures give negative value net repurchase is set to zero
Adjusted repurchaseTotal assets Adjusted repurchase removes from total repurchase the potential
effect of repurchasing exercised options This variable equals total repurchase of common stocks
minus the product between the number of options exercised (Compustat OPTEXD) and average
stock price during the year When the above measure gives negative value adjusted repurchase is
set to zero Since the number of options exercised is not available before 2003 we drop
observations in 2003 when we use this variable
34
Total payoutTotal assets the sum of Regular dividendTotal assets and RepurchaseTotal assets
Regular dividendTotal payout regular cash dividend divided by the sum of regular cash dividend
and repurchase from common equity In the two-period analysis (Pre- vs Post-FAS123R) we
separately sum the numerator and the denominator for each firm-period and then calculate the ratio
Regular dividendNet payout regular dividend divided by the sum of regular dividend and net
repurchase In the two-period analysis (Pre- vs Post-FAS123R) we separately sum the numerator
and the denominator for each firm-period and then calculate the ratio
Compensation Variables
Salary_$ Average salary (Execucomp SALARY) of the top 5 highest paid executives in $1000
Salary_ Average salary (Execucomp SALARY) divided by average total pay (Execucomp
TDC1) of the top 5 highest paid executives
Bonus_$ Average bonus (Execucomp BONUS) of the top 5 highest paid executives in $1000
Due to a data format change we add non-equity plan-based awards (Execucomp
NON_EQ_TARG) to this measure after 2006
Bonus_ Bonus_$ divided by average total pay (Execucomp TDC1) of the top 5 highest paid
executives
Option grant_$ Average option grant value (Execucomp OPTION_AWARDS_BLK_VALUE or
OPTION_AWARDS_FV) of the top 5 highest paid executives in $1000 Due to a data format
change we use OPTION_AWARDS_FV for this measure after 2006
Option grant_ Option grant_$ divided by average total pay (Execucomp TDC1) of the top 5
highest paid executives
Restricted stock grant_$ Average restricted stock grant value (Execucomp RSTKGRNT or
STOCK_AWARDS_FV) of the top 5 highest paid executives in $1000 Due to data format
change we use STOCK_AWARDS_FV for this measure after 2006
Restricted stock grant_ Restricted stock grant_$ divided by average total pay (Execucomp
TDC1) of the top 5 highest paid executives
Total pay_$ Average total pay (Execucomp TDC1) of the top 5 highest paid executives in $1000
35
Other Characteristics
Size The book value of total assets (Compustat AT) minus the book value of common equity
(Compustat CEQ) plus the market value of common equity from CRSP in $M
Log(size) the natural logarithm of size
Book-to-market the book value of common equity dividend by its market value
Leverage long term debt plus short term debt (Compustat DLTT + DLC) divided by total assets
Asset tangibility tangible assets (Compustat AT - INTAN) divided by total assets
Free cash flow Operating cash flow (Compustat OANCF) minus capital expenditure (Compustat
CAPX) then divided by lagged total assets
Cash holding Cash and short-term investments (Compustat CHE) divided by total assets
ROA volatility the standard deviation of returns on assets (operating income before tax divided by
lagged total assets) in the past five fiscal years
Institutional ownership the number of shares held by institutional investors divided by the number
of shares outstanding from Thomson Reuters Institutional Holdings database
Sales growth the growth rate of sales (Compustat SALE) from the prior year
Past stock return annual stock return from the prior year
Loss indicator a dummy variable taking value of one if the current net income is negative and
zero otherwise
36
References
Aboody David 1996 Market Valuation of Employee Stock Options Journal of Accounting and
Economics 22 357-391
Aboody David Barth Mary E and Ron Kasznik 2004 Firms Voluntary Recognition of Stock-
Based Compensation Expense Journal of Accounting Research 42 123ndash150
Aboody David and Ron Kasznik 2008 Executive stock-based compensation and firmsrsquo cash
payout the role of shareholdersrsquo tax-related payout preferences Review of Accounting Studies
13 216ndash251
Anantharaman Divya and Yong Gyu Lee 2014 Managerial risk taking incentives and corporate
pension policy Journal of Financial Economics 111 328ndash351
Baker Malcolm and Jeffrey Wurgler 2004 A catering theory of dividends Journal of Finance
59 1125-1165
Baker Malcolm and Jeffrey Wurgler 2016 Dividends as reference points a behavioral signaling
approach Review of Financial Studies 29 697-738
Bakke Tor-Erik Hamed Mahmudi Chitru Fernando and Jesus Salas 2015 The causal effect of
option pay on corporate risk management Journal of Financial Economics forthcoming
Balsam Steven Austin Reitenga and Jennifer Yin 2008 Option acceleration in response to SFAS
No 123 (R) Accounting Horizons 22 23-45
Bens Daniel and Steven Monahan 2008 Altering Investment Decisions to Manage Financial
Reporting Outcomes Asset-Backed Commercial Paper Conduits and FIN 46 Journal of
Accounting Research 46 1017-1055
Bens Daniel A Venky Nagar Douglas J Skinner and MH Franco Wong 2003 Employee stock
options eps dilution and stock repurchases Journal of Accounting and Economics 36 51ndash90
Bertrand Marianne Esther Duflo and Sendhil Mullainathan 2004 How much should we trust
differences-in-differences estimates The Quarterly Journal of Economics 119 249ndash275
Blouin Jennifer L Jana S Raedy and Douglas A Shackelford 2011 Dividends Share
Repurchases and Tax Clienteles Evidence from the 2003 Reductions in Shareholder Taxes
The Accounting Review 86 887-914
Brav Alon John R Graham Campbell R Harvey and Roni Michaely 2005 Payout policy in the
21st century Journal of Financial Economics 77 483ndash527
Brown Lawrence D and Yen-Jung Lee 2011 Changes in Option-Based Compensation Around
the Issuance of SFAS123R Journal of Business Finance amp Accounting 38 1053ndash109
37
Brown Jeffrey R Nellie Liang and Scott Weisbenner 2007 Executive financial incentives and
payout policy Firm responses to the 2003 dividend tax cut Journal of Finance 62 1935ndash
1965
Burns Natasha Brian McTier and Kristina Minnick 2015 Equity-incentive compensation and
payout policy in Europe Journal of Corporate Finance 30 85-97
Carter Mary Ellen and Luann J Lynch 2003 The Consequences of the FASBrsquos 1998 Proposal on
Accounting for Stock Option Repricing Journal of Accounting and Economics 35 51-72
Carter Mary Ellen Luann J Lynch and Irem Tuna 2007 The role of accounting in the design of
CEO equity compensation The Accounting Review 82 327ndash357
Chava Sudheer and Amiyatosh Purnanandam 2010 CEOs versus CFOs Incentives and
corporate policies Journal of Financial Economics 97 263ndash278
Chetty Raj and Emmanuel Saez 2005 Dividend taxes and corporate behavior Evidence from the
2003 dividend tax cut The Quarterly Journal of Economics 120 791ndash833
Choudhary Preeti Shivaram Rajgopal and Mohan Venkatachalam 2009 Accelerated vesting of
employee stock options in anticipation of FAS123R Journal of Accounting Research 47 105ndash
146
Christensen Hans B and Valeri Nikolaev 2009 Contracting on Mandatory Changes to GAAP
New Practice and Its Determinants Working Paper University of Chicago
Chu Yongqiang and Tao Ma 2015 How does management compensation affect bank risk taking
evidence from FAS 123R University of South Carolina Working Paper
Cuny Charles J Gerald S Martin and John J Puthenpurackal 2009 Stock options and total
payout Journal of Financial and Quantitative Analysis 44 391ndash410
DeAngelo Harry Linda DeAngelo and Douglas J Skinner 2000 Special Dividends and the
Evolution of Dividend Signaling Journal of Financial Economics 57 309-354
Dechow Patricia M Amy P Hutton and Richard G Sloan 1996 Economic consequences of
accounting for stock-based compensation Journal of Accounting Research 34 1ndash20
Edgerton J 2013 Four facts about dividend payouts and the 2003 tax cut International Tax and
Public Finance 20 769-784
Edmans Alex and Xavier Gabaix 2015 Executive compensation a modern primer Journal of
Economic Literature forthcoming
38
Fama Eugene F and Kenneth R French 2001 Disappearing dividends changing firm
characteristics or lower propensity to pay Journal of Financial Economics 60 3ndash43
Farre-Mensa Joan Roni Michaely and Martin C Schmalz 2014 Payout policy Annual Review
of Financial Economics 6 75ndash134
Fenn George W and Nellie Liang 2001 Corporate payout policy and managerial stock
incentives Journal of Financial Economics 60 45ndash72
Ferri Fabrizio and Tatiana Sandino 2009 The impact of shareholder activism on financial
reporting and compensation the case of employee stock options expensing The Accounting
Review 84 433ndash466
Floyd Eric Nan Li and Douglas J Skinner 2015 Payout policy through the financial crisis the
growth of repurchases and the resilience of dividends Journal of Financial Economics 118
299-316
Frydman Carola and Dirk Jenter 2010 CEO compensation Annual Review of Financial
Economics 2 75-102
Gipper Brandon 2015 Assessing the Effects of Disclosing Management Compensation Working
Paper University of Chicago
Gormley Todd David Matsa and Todd Milbourn 2013 CEO compensation and corporate risk
evidence from a natural experiment Journal of Accounting and Economics 56 79-101
Graham John Michelle Hanlon and Terry Shevlin 2011 Real effects of accounting rules
evidence from multinational firmsrsquo investment locations and profit repatriation decisions
Journal of Accounting Research 49 137-185
Graham John Campbell Harvey and Shiva Rajgopal 2005 The Economic implications of
corporate financial reporting Journal of Accounting and Economics 40 3-73
Greenspan Alan 2002 Testimony of Alan Greenspan before the Committee on Banking
Housing and Urban Affairs US Senate July 16 Washington DC Government Printing
Office
Grullon Gustavo and Roni Michaely 2002 Dividends Share Repurchases and the Substitution
Hypothesis Journal of Finance 57 1649-1684
Hail Luzi Ahmed Tahoun and Clare Wang 2014 Dividend Payouts and Information Shocks
Journal of Accounting Research 52 403-456
Hall Brian J and Kevin J Murphy 2002 Stock options for undiversified executives Journal of
Accounting amp Economics 33 3-42
39
Hall Brian J and Kevin J Murphy 2003 The trouble with stock options Journal of Economic
Perspectives 17 49ndash70
Hanlon Michelle and Jeffrey L Hoopes 2014 What do firms do when dividend tax rates change
An examination of alternative payout responses Journal of Financial Economics 114 105-
124
Hayes Rachel M Michael Lemmon and Mingming Qiu 2012 Stock options and managerial
incentives for risk taking Evidence from FAS123R Journal of Financial Economics 105
174ndash190
Heron Randall A Erik Lie 2007 Does backdating explain the stock price pattern around
executive stock option grants Journal of Financial Economics 83 271-295
Hribar Paul Nicole Thorne Jenkins and W Bruce Johnson 2006 Stock repurchases as an
earnings management device Journal of Accounting and Economics 41 3ndash27
Jensen Michael C 1986 Agency cost of free cash flow corporate finance and takeovers
American Economic Review 76 323-329
Jolls Christine 1998 Stock repurchases and incentive compensation NBER Working Paper No
w6467
Jung Boochun Woo-Jong Lee and Yanhua Sunny Yang 2016 The Impact of Dividend
Covenants on Investment and Operating Performance Journal of Business Finance amp
Accounting 43 414ndash447
Kahle Kathleen M 2002 When a buyback isnrsquot a buyback open market repurchases and
employee options Journal of Financial Economics 63 235ndash261
Lambert Richard A William N Lanen and David F Larcker 1989 Executive stock option plans
and corporate dividend policy Journal of Financial and Quantitative Analysis 24 409ndash425
Lintner John 1956 Distribution of incomes of corporations among dividends retained earnings
and taxes The American Economic Review 46 97-113
Low Angie 2009 Managerial risk-taking behavior and equity-based compensation Journal of
Financial Economics 92 470-490
Miller Merton H and Franco Modigliani 1961 Dividend policy growth and the valuation of
shares The Journal of Business 34 411ndash433
Minnick Kristina and Leonard Rosenthal 2015 Stealth compensation Do CEOs increase their
pay by influencing dividend policy Journal of Corporate Finance 25 435-454
40
Murphy Kevin J 1999 Executive compensation In O Ashenfelter and D Card (eds) North
Holland Handbook of Labor Economics Amsterdam Elsevier Science BV
Murphy Kevin J 2013 Executive compensation Where we are and how we got there Handbook
of the Economics of Finance Elsevier Science North Holland 211-356
Nikolaev Valeri 2010 Debt Covenants and Accounting Conservatism Journal of Accounting
Research 48 143-176
Puri Manju Joumlrg Rocholl and Sascha Steffen 2011 Global retail lending in the aftermath of the
US financial crisis Distinguishing between supply and demand effects Journal of Financial
Economics 100 556-578
Shue Kelly and Richard R Townsend 2014 Swinging for the fences Executive reactions to
quasi-random option grants Working Paper University of Chicago
Skinner Douglas J 2008 The evolving relation between earnings dividends and stock
repurchases Journal of Financial Economics 87 582-609
Weisbenner Scott J 2000 Corporate share repurchases in the 1990s What role do stock options
play FEDS Working Paper No 2000-29
Zhang Dan 2013 CEO dividend protection Working Paper BI Norwegian Business School
41
Figure 1 Trends of dividends and repurchases from 2003 to 2007 Panel A plots the average
Regular DividendTotal Assets of firms in the highest and lowest quartiles of Accounting Impact
measured in 2002 Panel B shows the average Total RepurchaseTotal Assets of firms in the
highest and lowest quartiles of Accounting Impact measured in 2002
Panel A Trends of regular dividends
Panel B Trends of total repurchases
00
05
10
15
20
2003 2004 2005 2006 2007
Regular DividendTotal Assets
Lowest Acc Impact
Highest Acc Impact
Pre Post
00
20
40
60
80
100
2003 2004 2005 2006 2007
Total Repurchase Total Assets
Lowest Acc Impact
Highest Acc Impact
Pre Post
42
Table 1
Summary Statistics
Panel A Firm characteristics - full sample
N Mean Std dev 25 pctl Median 75 pctl
Accounting impact (2002) 1176 173 366 022 052 163
Payout variablesRegular dividendTotal assets 5653 093 148 000 000 142
RepurchaseTotal assets 5653 394 710 000 035 500
Total payoutTotal assets 5653 488 748 000 175 666
Regular dividendTotal payout 4091 3874 4057 000 2237 8833
Level of executive compensation (in $1000)
Salary_$ 5653 450 190 314 409 544
Bonus_$ 5653 476 616 122 295 586
Option grant_$ 5653 791 1137 62 384 1002
Restricted stock grant_$ 5653 458 866 0 58 518
Total pay_$ 5653 2481 2475 890 1647 3074
Percentage of executive compensation
Salary_ 5653 296 183 165 251 382
Bonus_ 5653 197 148 97 177 268
Option grant_ 5653 283 235 67 256 445
Restricted stock grant_ 5653 141 180 00 41 249
Control variables
Size ($M) 5653 11086 27294 1017 2459 8117
Log(size) 5653 7985 1565 6925 7808 9002
Book-to-market 5653 0445 0287 0251 0388 0578
Leverage 5653 0202 0172 0038 0187 0309
Asset tangibility 5653 0806 0184 0691 0853 0965
Free cash flow 5653 0059 0091 0013 0059 0108
Cash holding 5653 0166 0172 0034 0100 0247
ROA volatility 5653 0056 0056 0021 0038 0070
Institutional ownership 5653 0753 0202 0639 0795 0910
Sales growth 5653 0121 0189 0028 0096 0183
Past stock return 5653 0094 0183 -0012 0094 0199
Loss indicator 5653 0164 0370 0000 0000 0000
This table presents summary statistics Panel A shows the descriptive statistics of payout variables compensation
variables and other firm characteristics for the full sample Accounting impact is the implied option expense
measured at fiscal year 2002 All other variables are measured at firm-year level from fiscal year 2003 to 2007
resulting in 5653 firm-year observations (except for Regular dividendTotal Payout which can be measured only
for the 4901 firm-year observations with Total payout greater than zero) Panel B shows the pairwise correlations
between main variables at firm-year level Panel C compares payout variables compensation variables and other
firm characteristics before and after FAS123R The Pre-FAS123R period consists of fiscal year 2003 and 2004
the Post-FAS123R period covers fiscal year 2005-2007 Panel D compares the trends of payout and compensation
variables around FAS123R across four quartile groups ranked by 2002 accounting impact Panel E compares the
trends of payout and compensation variables around FAS123R between the treated and control group under the
alternative treatment definition in Bakke et al (2015) (see Section 22) All variables are defined in Appendix The
notation and in Panel C indicates statistically significant at 10 5 and 1 level in T-tests for equal
means respectively
43
Pa
nel
B
Pea
rso
n c
orr
ela
tio
ns
Reg div
Repurchase
Total payout
Salary_
Bonus_
Option_
RS_
Log(size)
BM
Leverage
Tangibility
FCF
Cash holdingROA vol
Inst own
Sales growth
Past ret
urn
Loss
Reg
div
10
0
Repurc
hase
01
610
0
Tota
l payout
03
509
810
0
Sala
ry_
-0
10
-01
8-0
19
10
0
Bonus_
00
700
100
3-0
01
10
0
Option_
-0
10
00
900
6-0
41
-03
510
0
RS
_
01
000
901
0-0
32
-01
1-0
40
10
0
Log(s
ize)
03
101
802
3-0
56
01
101
202
210
0
BM
-02
1-0
28
-03
103
0-0
03
-02
000
0-0
33
10
0
Levera
ge
-00
1-0
08
-00
8-0
05
00
6-0
11
00
801
9-0
03
10
0
Tangib
ility
00
200
100
101
200
1-0
05
-00
6-0
12
-00
4-0
18
10
0
FC
F02
203
703
9-0
20
00
901
1-0
01
02
4-0
32
-02
1-0
16
10
0
Cash
hold
ing
-01
301
000
700
2-0
14
02
2-0
10
-02
3-0
16
-03
502
901
210
0
RO
A v
ol
-01
5-0
04
-00
700
4-0
11
01
9-0
11
-02
3-0
08
-01
101
2-0
02
03
910
0
Inst
ow
n
-00
901
401
1-0
17
00
200
701
200
7-0
01
00
3-0
08
01
4-0
06
-01
110
0
Sale
s gro
wth
-00
8-0
04
-00
6-0
15
00
501
0-0
02
00
7-0
16
-00
3-0
08
01
300
201
400
410
0
Past
retu
rn00
901
301
4-0
18
01
5-0
01
00
301
6-0
29
-01
000
102
7-0
14
-01
001
602
710
0
Loss
-02
0-0
19
-02
201
8-0
18
00
4-0
05
-02
601
901
300
6-0
41
01
702
3-0
16
-01
8-0
40
10
0
44
Panel C Firm characteristics - before and after FAS123R
Pre FAS 123R Post FAS 123R Difference
Payout variables
Regular dividendTotal assets 083 099 016
RepurchaseTotal assets 245 490 245
Total payoutTotal assets 328 589 261
Regular dividendTotal payout 3914 2790 -1124
Level of executive compensation (in $1000)
Salary_$ 426 463 37
Bonus_$ 418 505 87
Option grant_$ 896 707 -191
Restricted stock grant_$ 269 574 305
Total pay_$ 2263 2584 321
Percentage of executive compensation
Salary_ 305 293 -12
Bonus_ 186 204 18
Option grant_ 343 240 -103
Restricted stock grant_ 87 176 89
Control variables
Size ($M) 9671 11631 1960
Log(size) 7860 8035 0175
Book-to-market 0437 0453 0016
Leverage 0201 0203 0002
Asset tangibility 0822 0793 -0029
Free cash flow 0061 0057 -0004
Cash holding 0175 0159 -0016
ROA volatility 0067 0048 -0019
Institutional ownership 0712 0781 0069
Sales growth 0137 0108 -0029
Past stock return 0080 0101 0021
Loss indicator 0173 0159 -0014
45
Pa
nel
D
Fir
m c
ha
racte
rist
ics
by q
ua
rtil
e o
f a
cco
un
tin
g i
mp
act
- b
efo
re a
nd
aft
er
FA
S1
23
R
Accounting im
pact
(2002)
Num
ber
of
Fir
ms
Pre
Post
Pre
Post
Pre
Post
Pre
Post
Payout
vari
able
s
Regula
r div
idendT
ota
l ass
ets
11
2
12
4
09
4
11
1
09
5
11
3
03
0
04
9
Repurc
hase
Tota
l ass
ets
11
3
26
8
19
2
37
3
32
7
63
1
35
1
68
7
Tota
l payout
Tota
l ass
ets
22
4
39
1
28
5
48
4
42
2
74
4
38
1
73
6
Regula
r div
idendT
ota
l payout
643
7
469
8
474
0
341
1
284
5
195
4
82
5
74
5
Perc
enta
ge o
f executive c
om
pensa
tion
Sala
ry_
337
295
313
287
296
289
276
300
Bonus_
223
226
214
228
172
192
134
169
Option g
rant_
201
167
290
210
373
260
507
325
Rest
ricte
d s
tock g
rant_
116
194
98
180
89
176
43
155
294
294
294
294
1st Q
uart
ile2
nd Q
uart
ile3
rd Q
uart
ile4
th Q
uart
ile
01
2
03
5
09
3
55
1
46
Accounting impact
Number of Firms
By accounting impact quartile
1
2
3
4
Pre Post Pre Post
Payout variables
Regular dividendTotal assets 09 11 08 10
RepurchaseTotal assets 18 31 26 52
Total payoutTotal assets 28 43 34 62
Regular dividendTotal payout 428 357 386 265
Percentage of executive compensation
Salary_ 435 364 282 280
Bonus_ 226 214 179 202
Option grant_ 92 125 387 261
Restricted stock grant_ 125 188 80 174
Percentage of CEO compensation
Salary_(CEO) 485 364 260 259
Bonus_(CEO) 249 228 185 219
Option grant_(CEO) 10 127 406 275
Restricted stock grant_(CEO) 128 182 82 183
Panel E Firm characteristics by alternative treatment definition - before and
after FAS123R
Treated
25
19
997
223
250
256
268
10
177
71
Control
44
37
47
Table 2
Differential effect of FAS123R on the use of option-based compensation
Panel A Two-period first-difference regression
Prediction Coeff t-stat Coeff t-stat Coeff t-stat
Accounting impact rank - -0044 -628
Accounting impact rank=2 - -0044 -327
Accounting impact rank=3 - -0075 -468
Accounting impact rank=4 - -0140 -613
Treated - -0132 -875
ΔLog(size) 0061 202 0061 200 0063 214
ΔBook-to-market 0032 091 0032 092 0051 143
ΔLeverage -0157 -213 -0160 -218 -0111 -153
ΔAsset tangibility -0012 -014 -0020 -023 -0023 -026
ΔFree cash flow -0106 -095 -0108 -097 -0128 -117
ΔCash holding -0197 -211 -0193 -206 -0180 -194
ΔFive-year ROA volatility -0065 -031 -0056 -026 -0098 -047
ΔInstitutional ownership -0044 -091 -0043 -088 -0044 -092
ΔSales growth -0064 -102 -0065 -104 -0090 -153
ΔPast one-year stock return 0051 078 0052 080 0091 138
ΔLoss frequency 0056 207 0057 207 0047 179
Log(size) -0009 -210 -0009 -207 -0002 -035
Book-to-market -0015 -056 -0013 -049 0018 072
Leverage 0022 046 0023 048 0068 150
Asset tangibility 0033 077 0033 078 0053 128
Free cash flow 0227 202 0220 195 0127 117
Cash holding -0002 -004 0012 019 -0078 -141
Five-year ROA volatility -0451 -240 -0430 -228 -0509 -283
Institutional ownership -0123 -360 -0122 -359 -0100 -292
Sales growth -0041 -056 -0040 -055 -0089 -125
Past one-year stock return -0009 -015 -0006 -010 0078 125
Loss frequency 0055 174 0056 178 0054 173
Fixed effect
Standard error
Adj R-squared
Observations
Model (3)
Dependent variable ΔAvg Option grantTotal pay
Huber-White
0156
This table investigates whether the effect of FAS123R on the use of option-based pay varies with its potential accounting impact Panel A
reports the results of estimating three two-period first-differencing models where for each firm we average its characteristics in Pre- and
Post-FAS123R period The Pre-FAS123R period consists of fiscal year 2003 and 2004 the Post-FAS123R period covers fiscal year 2005-
2007 In all three specifications the dependent variable is the change of average Option grantTotal pay from Pre- to Post-FAS123R period
The main independent variable varies by model in Model (1) the Accounting impact rank is the quartile rank of implied option expensetotal
assets measured in 2002 (1=lowest 4=highest) In Model (2) Accounting impact rank=2 (3 4) is an indicator that takes value of one if the
firmrsquos Accounting impact rank equals 2 (3 4) In Model (3) we use an alternative treatment construction following Bakke et al (2015)
where Treated is an indicator that takes value of zero if the firm granted zero option to its CEO in both 2003 and 2004 or the firm began to
voluntarily expense option-based pay at fair value in 2002 or earlier and one otherwise For each control variable we include both its level in
the Pre-FAS123R period and its change across the two periods Panel B shows the results of estimating fixed effect models with firm-year
observations The dependent variable is the firm-year level Option grantTotal pay The main independent variables are the interactions of
Post-FAS123R indicator (Post) with Accounting Impact rank Accounting impact rank indicators and Treated respectively All models in
Penal A have industry fixed effects and the standard errors are Huber-White heteroscedasticity-consistent standard errors All models in
Penal B have firm fixed effects and year fixed effects and the standard errors are clustered at firm level All variables are defined in
Appendix The notation and indicates statistically significant at 10 5 and 1 level respectively
Model (1) Model (2)
11711171 1171
Industry Industry
Huber-White
0124
Huber-White
0123
Industry
48
Panel B Panel fixed effects regression
Prediction Coeff t-stat Coeff t-stat Coeff t-stat
Acc impact rank x Post - -0044 -807
Acc impact rank 2 x Post - -0046 -333
Acc impact rank 3 x Post - -0077 -526
Acc impact rank 4 x Post - -0137 -776
Treated x Post - -0145 -970
Log(size) 0034 221 0034 217 0036 229
Book-to-market 0018 084 0017 083 0015 070
Leverage -0004 -009 -0006 -013 -0007 -015
Asset tangibility 0007 012 0004 006 0011 018
Free cash flow -0074 -151 -0072 -146 -0078 -158
Cash holding -0048 -086 -0050 -090 -0006 -011
Five-year ROA volatility 0250 231 0239 219 0437 414
Institutional ownership 0043 159 0044 161 0041 150
Sales growth -0033 -168 -0034 -171 -0031 -158
Past one-year stock return 0067 221 0068 224 0063 204
Loss indicator 0023 209 0022 207 0024 222
Fixed effects
Standard error
Adj R-squared
Observations
Dependent variable Option grantTotal pay
5653 5653 5653
Clustered by firm
Firm Year
Clustered by firm
Firm Year
Clustered by firm
0523 0523 0526
Model (1) Model (2) Model (3)
Firm Year
49
Table 3
Effect of option-based compensation on dividend policy
Panel A Two-period first-difference regression
Prediction Coeff t-stat Coeff t-stat Coeff t-stat
Accounting impact rank + 0000 077
Accounting impact rank=2 + 0001 091
Accounting impact rank=3 + 0000 044
Accounting impact rank=4 + 0001 092
Treated + 0000 -026
ΔLog(size) 0000 -030 0000 -030 0000 -026
ΔBook-to-market -0002 -190 -0002 -193 -0002 -195
ΔLeverage -0002 -059 -0002 -057 -0002 -059
ΔAsset tangibility 0016 431 0016 429 0016 430
ΔFree cash flow 0017 373 0017 373 0017 375
ΔCash holding -0011 -288 -0011 -285 -0010 -282
ΔFive-year ROA volatility 0003 034 0002 032 0003 035
ΔInstitutional ownership -0002 -073 -0002 -073 -0002 -070
ΔSales growth -0001 -040 -0001 -037 -0001 -038
ΔPast one-year stock return 0002 077 0002 076 0002 070
ΔLoss frequency 0000 -048 0000 -045 0000 -046
Log(size) 0000 183 0000 182 0000 182
Book-to-market -0002 -227 -0002 -225 -0002 -284
Leverage -0001 -037 -0001 -039 -0001 -048
Asset tangibility 0003 179 0003 180 0003 176
Free cash flow 0017 291 0017 291 0017 300
Cash holding 0002 080 0002 077 0002 098
Five-year ROA volatility 0003 035 0002 033 0003 044
Institutional ownership -0001 -068 -0001 -068 -0001 -058
Sales growth -0004 -177 -0004 -175 -0004 -172
Past one-year stock return 0004 169 0004 167 0004 165
Loss frequency -0001 -111 -0001 -109 -0001 -102
Fixed effect
Standard error
Adj R-squared
Observations
Dependent variable ΔAvg Regular dividendTotal assets
This table investigates the causal effect of option-based pay on dividend policy by examining whether changes in dividend policy around
FAS123R vary with its potential accounting impact Panel A reports the results of estimating three two-period first-differencing models
where for each firm we average its characteristics in Pre- and Post-FAS123R period In all three specifications the dependent variable is
the change of average Regular dividendTotal assets from Pre- to Post-FAS123R period The main independent variable varies by model in
Model (1) the Accounting impact rank is the quartile rank of implied option expensetotal assets measured in 2002 (1=lowest 4=highest) In
Model (2) Accounting impact rank=2 (3 4) is an indicator that takes value of one if the firmrsquos Accounting impact rank equals 2 (3 4) In
Model (3) we use an alternative treatment construction following Bakke et al (2015) where Treated is an indicator that takes value of zero
if the firm granted zero option to its CEO in both 2003 and 2004 or the firm began to voluntarily expense option-based pay at fair value in
2002 or earlier and one otherwise For each control variable we include both its level in the Pre-FAS123R period and its change across the
two periods Panel B shows the results of estimating fixed effect models with firm-year observations The dependent variable is the firm-
year level Regular dividendTotal assets The main independent variables are the interactions of Post-FAS123R indicator (Post) with
Accounting Impact rank Accounting impact rank indicators and Treated respectively Panel C examines the intensity of dividend changes
among firms with nonzero dividend per share in 2003 or 2004 In particular we estimates the same three models as in Panel A(with the
same independent variables) but for five dependent variables the change of average Regular dividendTotal assets from Pre- to Post-
FAS123R period (as in Panel A) the percentage change of DPS (dividend per share) from Pre- to Post-FAS123R period and three
indicators denoting respectively whether the percentage change of DPS was greater than 20 40 and 60 Panel D reports four
robustness tests of the dividend intensity regression In each of them a set of possible confounding observations is removed (see Section 33
for details) Panel E compares the trends of dividend initiation and termination around FAS123R across four quartile groups ranked by
accounting impact All models in Panel A C and D have industry fixed effects and the standard errors are Huber-White heteroscedasticity-
consistent standard errors All models in Penal B have firm fixed effects and year fixed effects and the standard errors are clustered at
firm level All variables are defined in Appendix The notation and indicates statistically significant at 10 5 and 1 level
Industry Industry Industry
Model (1) Model (2) Model (3)
1171 1171 1171
Huber-White Huber-White Huber-White
0105 0104 0105
50
Panel B Panel fixed effects regression
Prediction Coeff t-stat Coeff t-stat Coeff t-stat
Acc impact rank x Post + 0000 122
Acc impact rank 2 x Post + 0001 110
Acc impact rank 3 x Post + 0001 094
Acc impact rank 4 x Post + 0001 129
Treated x Post + 0000 -012
Log(size) 0001 179 0001 179 0001 181
Book-to-market 0000 025 0000 024 0000 031
Leverage 0001 062 0001 064 0001 069
Asset tangibility 0009 360 0009 358 0009 363
Free cash flow 0002 090 0002 093 0002 092
Cash holding -0007 -295 -0007 -298 -0007 -298
Five-year ROA volatility 0001 041 0001 038 0000 -006
Institutional ownership 0000 -027 0000 -026 0000 -027
Sales growth 0000 053 0000 051 0000 044
Past one-year stock return 0001 089 0001 088 0001 078
Loss indicator 0000 -060 0000 -057 0000 -076
Fixed effects
Standard error
Adj R-squared
Observations
Dependent variable Regular dividendTotal assets
Model (1) Model (2) Model (3)
Firm Year Firm Year Firm Year
5653 5653 5653
Clustered by firm Clustered by firm Clustered by firm
0877 0877 0877
51
Panel C Intensity of dividend changes around FAS123R
Prediction Coeff t-stat Coeff t-stat Coeff t-stat
Accounting impact rank + 0000 065
Accounting impact rank=2 + 0000 048
Accounting impact rank=3 + 0000 026
Accounting impact rank=4 + 0002 080
Treated + 0001 063
Dependent var DPS pct change
Accounting impact rank + -0145 -072
Accounting impact rank=2 + 0018 006
Accounting impact rank=3 + -0177 -045
Accounting impact rank=4 + -0746 -100
Treated + -0407 -119
Accounting impact rank + 0029 095
Accounting impact rank=2 + 0040 074
Accounting impact rank=3 + 0092 139
Accounting impact rank=4 + 0008 007
Treated + -0007 -012
Accounting impact rank + 0024 076
Accounting impact rank=2 + 0047 088
Accounting impact rank=3 + 0079 114
Accounting impact rank=4 + -0003 -002
Treated + 0030 052
Accounting impact rank + 0030 098
Accounting impact rank=2 + 0078 155
Accounting impact rank=3 + 0085 130
Accounting impact rank=4 + 0014 012
Treated + -0006 -011
Control variables
Fixed effect
Standard error
Observations 572 572 572
Yes Yes Yes
Huber-White Huber-White Huber-White
Industry Industry Industry
Dependent var DPS pct
change gt60 indicator
Model (1) Model (2) Model (3)
Dependent var ΔAvg Regular
dividendAssets
Dependent var DPS pct
change gt20 indicator
Dependent var DPS pct
change gt40 indicator
52
Panel D Robustness tests for intensity of dividend changes around FAS123R
Prediction Coeff t-stat Coeff t-stat Coeff t-stat
Accounting impact rank + 0006 017
Accounting impact rank=2 + 0067 118
Accounting impact rank=3 + 0041 057
Accounting impact rank=4 + -0061 -049
Treated + 0022 035Observations
Accounting impact rank + 0009 027
Accounting impact rank=2 + 0058 106
Accounting impact rank=3 + 0032 043
Accounting impact rank=4 + -0032 -024
Treated + 0018 028
Observations
Accounting impact rank + 0030 089
Accounting impact rank=2 + 0039 071
Accounting impact rank=3 + 0122 168
Accounting impact rank=4 + -0063 -052
Treated + 0075 132
Observations
Accounting impact rank + 0008 023
Accounting impact rank=2 + 0023 042
Accounting impact rank=3 + 0048 064
Accounting impact rank=4 + -0042 -033
Treated + -0010 -016
Observations
Control variables
Fixed effect
Standard error
Exclude firms with stable
payout ratio from 2003 to 2004
506 506 506
Dependent variable DPS pct change gt40 indicator
Model (1) Model (2) Model (3)
Exclude voluntary expensers
519 519
Exclude firms in the top decile
of option reduction (02-04)
Exclude firms that accelerated
option vesting
504 504 504
517 517 517
519
Huber-White Huber-White Huber-White
Yes Yes Yes
Industry Industry Industry
53
Panel E Dividend initiation and termination rates around FAS123R
Pre FAS 123R
1 280 75 7 6 13 173
2 284 135 18 9 27 200
3 286 181 11 14 25 138
4 282 260 9 10 19 73
Total 1132 651 45 39 84 129
Post FAS 123R
1 275 63 4 4 8 127
2 280 116 9 9 18 155
3 276 152 9 3 12 79
4 263 223 5 1 6 27
Total 1094 554 27 17 44 79
Pre FAS 123R
1 280 205 2 0 2 10
2 284 149 7 1 8 54
3 286 105 0 0 0 00
4 282 22 0 0 0 00
Total 1132 481 9 1 10 21
Post FAS 123R
1 275 212 3 6 9 42
2 280 164 1 2 3 18
3 276 124 1 1 2 16
4 263 40 0 3 3 75
Total 1094 540 5 12 17 31
termination
in 2004
03-04
cumulative
03-04
cumulative
Quartile firms
with
dividend in
2004
termination
in 2005
termination
in 2006
05-06
cumulative
05-06
cumulative
Termination
Quartile firms
with
dividend in
2002
termination
in 2003
without
dividend in
2004
initiation in
2003
initiation in
2004
03-04
cumulative
03-04
cumulative firmsQuartile
firmsQuartile initiation in
2005
initiation in
2006
05-06
cumulative
05-06
cumulative
Initiation
without
dividend in
2002
54
Table 4
Effect of option-based compensation on repurchases
Panel A Two-period first-difference regression with total repurchase
Prediction Coeff t-stat Coeff t-stat Coeff t-stat
Accounting impact rank - 0002 122
Accounting impact rank=2 - 0002 071
Accounting impact rank=3 - 0005 123
Accounting impact rank=4 - 0007 102
Treated - 0014 365
Control variables
Fixed effect
Standard error
Adj R-squared
Observations
Panel B Two-period first-difference regression with net repurchase
Prediction Coeff t-stat Coeff t-stat Coeff t-stat
Accounting impact rank - 0003 166
Accounting impact rank=2 - 0002 051
Accounting impact rank=3 - 0006 165
Accounting impact rank=4 - 0009 137
Treated - 0010 300
Control variables
Fixed effect
Standard error
Adj R-squared
Observations
Panel C Two-period first-difference regression with repurchase adjusted for exercised options
Prediction Coeff t-stat Coeff t-stat Coeff t-stat
Accounting impact rank - 0001 056
Accounting impact rank=2 - 0002 062
Accounting impact rank=3 - 0007 172
Accounting impact rank=4 - -0001 -008
Treated - 0006 197
Control variables
Fixed effect
Standard error
Adj R-squared
Observations
Dependent variable ΔAvg RepurchaseTotal assets
This table investigates the causal effect of option-based pay on payout policy by examining whether the changes of repurchase around
FAS123R vary with its potential accounting impact Panel A reports the results of estimating three two-period first-differencing models
where for each firm we average its characteristics in Pre- and Post-FAS123R period In all three specifications the dependent variable is
the change of average RepurchaseTotal assets from Pre- to Post-FAS123R period The main independent variable varies by model in
Model (1) the Accounting impact rank is the quartile rank of implied option expensetotal assets measured in 2002 (1=lowest 4=highest)
In Model (2) Accounting impact rank=2 (3 4) is an indicator that takes value of one if the firmrsquos Accounting impact rank equals 2 (3 4)
In Model (3) we use an alternative treatment construction following Bakke et al (2015) where Treated is an indicator that takes value of
zero if the firm granted zero option to its CEO in both 2003 and 2004 or the firm began to voluntarily expense option-based pay at fair
value in 2002 or earlier and one otherwise Panel B reports the regressions with the change of Net repurchaseTotal assets as the
dependent variable and the same independent variable as in Panel A Panel C reports the regressions with the change of Adjusted
repurchaseTotal assets as the dependent variable and the same independent variable as in Panel A All models in Panel A B and C have
industry fixed effects and the standard errors are Huber-White heteroscedasticity-consistent standard errors All variables are defined in
Appendix The notation and indicates statistically significant at 10 5 and 1 level respectively
Model (1) Model (2) Model (3)
Yes Yes Yes
Industry Industry Industry
Huber-White Huber-White Huber-White
Dependent variable ΔAvg Net repurchaseTotal assets
1171 1171 1171
0238 0237 0245
Model (1) Model (2) Model (3)
Yes Yes Yes
Industry Industry Industry
Huber-White Huber-White Huber-White
Dependent variable ΔAvg Adjusted repurchaseTotal assets
0229 0229 0233
1171 1171 1171
Model (1) Model (2) Model (3)
Yes Yes Yes
Industry Industry Industry
Huber-White Huber-White Huber-White
0111 0112 0114
1168 1168 1168
55
Table 5
Effect of option-based compensation on payout mix
Panel A Two-period first-difference regression with total payout mix
Prediction Coeff t-stat Coeff t-stat Coeff t-stat
Accounting impact rank + 0006 028
Accounting impact rank=2 + 0018 045
Accounting impact rank=3 + -0001 -001
Accounting impact rank=4 + 0043 052
Treated + -0035 -094
Control variables
Fixed effect
Standard error
Adj R-squared
Observations
Panel B Two-period first-difference regression with net payout mix
Prediction Coeff t-stat Coeff t-stat Coeff t-stat
Accounting impact rank + -0002 -008
Accounting impact rank=2 + 0008 016
Accounting impact rank=3 + 0018 034
Accounting impact rank=4 + -0059 -055
Treated + -0050 -101
Control variables
Fixed effect
Standard error
Adj R-squared
Observations
0049 0043 0054
257 257 257
Industry Industry Industry
Huber-White Huber-White Huber-White
Dependent variable ΔAvg Regular dividendNet payout
Model (1) Model (2) Model (3)
Yes Yes Yes
0154 0151 0156
362 362 362
Industry Industry Industry
Huber-White Huber-White Huber-White
This table investigates the causal effect of option-based pay on payout mix for firms using both dividend and repurchase by examining
whether the changes of payout mix around FAS123R vary with its potential accounting impact Panel A reports the results of estimating
three two-period first-differencing models where for each firm we average its characteristics in Pre- and Post-FAS123R period In all three
specifications the dependent variable is the change of average Regular dividendTotal payout from Pre- to Post-FAS123R period The main
independent variable varies by model in Model (1) the Accounting impact rank is the quartile rank of implied option expensetotal assets
measured in 2002 (1=lowest 4=highest) In Model (2) Accounting impact rank=2 (3 4) is an indicator that takes value of one if the firmrsquos
Accounting impact rank equals 2 (3 4) In Model (3) we use an alternative treatment construction following Bakke et al (2015) where
Treated is an indicator that takes value of zero if the firm granted zero option to its CEO in both 2003 and 2004 or the firm began to
voluntarily expense option-based pay at fair value in 2002 or earlier and one otherwise Panel B reports the regressions with the change of
Regular dividendNet payout as the dependent variable and the same independent variables as in Panel A Panel A (Panel B) is based on
observations with nonzero regular dividend and repurchase (net repurchase) in both Pre- and Post-FAS123R period All models in Panel A
and B have industry fixed effects and the standard errors are Huber-White heteroscedasticity-consistent standard errors All variables are
defined in Appendix The notation and indicates statistically significant at 10 5 and 1 level respectively
Yes Yes Yes
Dependent variable ΔAvg Regular dividendTotal payout
Model (1) Model (2) Model (3)

2
The second way is the dilution channel which refers to the incentive to use repurchases to
offset the dilutive effect from the exercise of employee stock options (ESO) In a survey of
financial executives over two-thirds of the respondents claim that offseting the dilutionary effect
of stock option plans or other stock programs is an important factor to their repurchase decisions
(Brav Graham Harvey and Michaely 2005) A variation of the dilution argument further notes
that even before the exercise of ESO managers have an incentive to use repurchases to manage the
dilutive effect of in-the-money unexercised options on diluted earnings-per-share (EPS) (Bens
Nagar Skinner and Wong 2003)2 Under these dilution-related arguments firms with more ESO
would engage in larger repurchases Besides if these firms have a target payout amount they
would have an incentive to replace dividends (or future dividend increases) with repurchases
In sum both the dividend-protection and the dilution channels predict that managers of
firms with a large amount of option-based compensation will favor repurchases over dividends A
number of studies have provided empirical evidence consistent with this prediction3
However there are three reasons to re-examine this question First if boards anticipate the
lack of dividend protectionrsquos effect they can increase management compensation to offset the loss
caused by the dividend payments Second changes to payout policy are visible and highly
2 Generally Accepted Accounting Principles (GAAP) require firms to report basic EPS and diluted EPS The
denominator of basic EPS is generally the number of common shares outstanding and thus it is affected by ESO only
when they are exercised In contrast the denominator of diluted EPS takes into account lsquolsquopotentially dilutiversquorsquo
securities such as ESO using the so-called treasury stock method Under this method the denominator of diluted EPS
increases as outstanding unexercised ESOs move into the money Note that firms have incentives to use repurchases to
manage EPS regardless of whether they use ESO (Hribar Jenkins and Johnson 2006) 3 Lambert et al (1989) finds that dividends decrease in the five-year period following the adoption of executive stock
option plans Jolls (1998) documents that firms relying more on option compensation are more likely to buy back
shares Weisbenner (2000) documents a positive association between exercises of ESO and repurchases Fenn and
Liang (2001) show that option compensation is negatively associated with dividends and positively associated with
repurchases Kahle (2002) finds that the number of exercisable employee stock options predicts the occurrence and
amount of repurchases (consistent with the dilution channel) and that the number of executive stock options predicts
the repurchase decision (consistent with the dividend-protection channel) Chetty and Saez (2005) finds that firms
whose executives held more options were less likely to increase dividends in response to the dividend tax reduction in
2003 Zhang (2013) Burns McTier and Minnick (2015) and Minnick and Rosenthal (2015) document that firms with
a greater proportion of dividend-protected equity pay have higher dividend payouts Bens et al (2003) and Cuny et al
(2009) show that repurchases are positively correlated with the dilutive effect of ESO on diluted EPS
3
scrutizined Given the relevance of payout choices to boards analysts and institutional investors
it is not likely that managers could easily modify payout policy to maximize personal wealth
without facing serious scrutiny Third the associations documented in earlier studies may reflect
the endogenous nature of executive pay A compensation contract is designed to mitigate agency
problems that manifest in various corporate policies This feature makes treatment assignment
(eg stock option grants) prone to factors that could affect both executive pay and payout policy
some of which may be unobservable and cannot be easily controlled for (the omitted variable bias
problem) For example a firm with a positive innovation opportunity shock may both choose a
low dividend level to preserve internal capital and grant executive stock options to induce risk
taking Furthermore executive pay may be the result of anticipated payout policy (the reverse
causality problem) For example if a board wants to raise dividends it may give the CEO a pay
package with fewer options and more (dividend-paying) restricted stocks (Aboody and Kasznik
2008) Different causal channels linking executive pay and firm payout possibly coexist and are
difficult to disentangle empirically As emphasized by Edmans and Gabaix (2015) the effects of
executive compensation in general have not been satisfactorily identified largely due to the
scarcity of valid instrumental variables
To address these problems we utilize the 2005 adoption of Financial Accounting Standard
123R (hereinafter FAS123R) as an exogenous shock to the use of option compensation 4
Previously firms were required to expense ESOrsquos intrinsic value at the grant date while disclosing
the fair value amount in footnotes (this amount is referred to as lsquoimplied option expensersquo) As most
ESO were granted at the money and thus with zero intrinsic value (Hall and Murphy 2002) firms
4 FAS123R was introduced in response to the Enron-type accounting scandals of 2001-2002 At that time many
observers argued that overly favorable reporting treatment had led to an excessive use of option-based compensation
(Hall and Murphy 2003) that lsquolsquoperversely created incentives to artificially inflate reported earnings in order to keep
stock prices high and risingrsquorsquo (Greenspan 2002) Thus it is reasonable to assume that FAS123R was exogenous with
respect to trends in payout policy
4
reported no expense in their income statements FAS123R required firms to expense ESO in the
income statement at fair value Consistent with FAS123R increasing the perceived cost of stock
options (Murphy 2013) various studies have documented a large decrease in the use of stock
options subsequent to its introduction (Carter Lynch and Tuna 2007) Hayes Lemmon and Qiu
(2012) report a decline in the median ratio of the value of option grants to total pay from 397 to
139 following FAS123Rrsquos implementation Such a sudden change in executive pay
composition is rare (Frydman and Jenter 2010) and thus provides a unique opportunity to
investigate its effect on payout policy
This setting has additional benefits as well One such benefit is that the decrease in ESO
predicts an increase in dividends Settings that predict a decrease in dividends are arguably less
powerful as firms are notoriously reluctant to cut dividends given the evidence of a negative
investorsrsquo reaction (Brav et al 2005)5 Also the period subsequent to FAS123R witnessed a
general increase in corporate payouts (Floyd Li and Skinner 2015) These factors all combine to
produce a powerful setting to detect a compensation-induced increase in dividends
While FAS123R created an exogenous shock to the use of option-based compensation a
major challenge to the research design remains The accounting standard is applied to all public
firms making it difficult to construct control groups To tackle this challenge our empirical
strategy exploits the idea that FAS123Rrsquos impact likely varies across different types of firms We
conjecture that firms facing a larger hit on their reported earnings (as measured by a higher implied
option expense in 2002 prior to FAS123R) will reduce option grants significantly more than other
firms Indeed in our sample option compensation as percentage of total executive pay drops from
507 to 325 for firms in the top quartile of implied option expense versus 201 to 167 for
5 Indeed association studies reporting a negative association between option-based pay and dividends frame the issue
in terms of lower dividend increases (ie repurchases substituting for future dividend increases in option-heavy firms)
rather than in terms of dividend decreases
5
firms in the bottom quartile Using this cross sectional variation our strategy is a difference-in-
difference design where the first difference is the adoption of FAS123R and the second is the pre-
event implied option expense effectively our proxy for the expected accounting-induced reduction
in option-based compensation The key identification assumption is that the level of implied
option expense (prior to the announcement of FAS123R) is not correlated with the potential future
change in payout variables in the absence of treatment (ie FAS123R) We discuss this
assumption further in Section 2
We perform our empirical tests using a sample of SampP 1500 firms between 2003 and 2007
a five-year event window surrounding the 2005 adoption of FAS123R In particular we estimate
the association between implied option expense measured in 2002 and thus prior to the event
window and the change in the average payout variables from the ldquoprerdquo (2003-2004) to the ldquopostrdquo
(2005-2007) period after controlling for known determinants of payout policy Across various
measures of dividend changes we do not find that firms with higher implied option expense
increased their dividends relative to firms with lower implied option expense both in the full
sample and in a sub-sample of firms that paid dividends prior to FAS123R Also among firms
that did not pay dividends prior to FAS123R those with higher implied option expense did not
experience a relative increase in the rate of dividend initiation This lack of an effect on dividend
payouts is remarkable given that the accounting-induced decline in option-based pay was
accompanied by a corresponding increase in restricted stock awards which generally pay
dividends Further we find no association between implied option expense and changes in the
level of repurchases or changes in the relative weights of dividends and repurchases
Our results are robust to using alternative measures of dividends and repurchases
employing a panel regression (rather than a first-difference regression) and excluding the year of
6
adoption 2005 They are also robust to excluding firms that may have taken actions in anticipation
of the expected adoption of FAS123R (eg voluntarily expensing options) Finally to further
address the lack of a control group we follow Bakke Mahmudi Fernando and Salas (2015) and
define control firms as those voluntarily expensing options and those issuing no options to the
CEO prior to FAS123R on the ground that these firms were likely unaffected by the new standard
Our inferences remain unchanged
Overall the evidence is not consistent with the prediction that option-based compensation
has a first-order causal impact on payout policy and suggests that the previously documented
associations perhaps reflect endogeneity rather than a causal influence Our findings should not be
viewed as denying that stock options provide an incentive to favor repurchases over dividends
Rather they suggest this incentive does not imply an unconstrained ability to change payout policy
in a self-serving way likely because of the visibility of payout policy and its relevance to boards
and institutional investors 6 In addition boards may compensate executives for the lack of
dividend-protection in other ways effectively neutralizing those incentives Notably our findings
are consistent with managersrsquo statements that lack of dividend-protection does not affect payout
decisions (Brav et al (2005) who highlight this stark contrast between their survey evidence and
the empirical associations in the literature)7 Our results also provide another explanation for the
persistent lack of dividend protection in executivesrsquo options boards are not concerned with its
6 Note that our results are not inconsistent with evidence that managers take actions to increase personal wealth in
settings where the level of scrutiny is lower (eg timing of option grants backdating Heron and Lie 2007) or where it
is harder for outsiders to detect personal motives (eg risk-taking activities that increase the value of options Bakke et
al 2015) 7 Only 106 of surveyed executives agree that lack of dividend protection may cause managers to favor repurchases
over dividends ndash the lowest level of support among all the questions in the survey Of course it is possible that
managers would not admit to the effect on their behavior but similar surveys have elicited candid responses For
example a large percentage of managers surveyed by Graham Harvey and Rajgopal (2005) admit that they would
sacrifice economic value to smooth earnings or to hit an earnings target
7
effect because they can mitigate it by directly monitoring payout choices andor adjusting
compensation packages
Our study contributes to a vast literature on the determinants of payout policy First while
many studies document an association between option-based pay and payout policy limited
attempts have been made to examine its causal nature8 Addressing this question will enhance our
understanding of temporal changes in payout policy such as the emergence of repurchases as
primary payout vehicle (Farre-Mensa et al 2014) and the recently observed lsquoresiliencersquo of
dividends (Floyd et al 2015) Using the plausible exogenous variation in ESO induced by
FAS123R our evidence calls into question the notion that option-based compensation is a first-
order driver of payout policy and challenges future research to consider alternative explanations
for the trends in corporate payouts Second we extend the research that examines how
institutional changes affect payout policy Most of these studies examine changes in dividend tax
rates (eg Chetty and Saez 2005 Brown Liang and Wesibenner 2007 Aboody and Kasznik 2008
Blouin Raedy and Shackelford 2011 Hanlon and Hoopes 2014) or in the information environment
(Hail Tahoun and Wang 2014) while we examine a new accounting standard that affected the
composition of executive pay
We also contribute to a recent stream of research that uses exogenous shocks to understand
the economic impact of option-based pay (Low 2009 Gormley Matsa and Milbourn 2013) Some
of these studies use FAS123R to examine the causal effect of option-based pay on risk-taking with
mixed findings (Chava and Purnanandam 2010 Hayes Lemmon and Qiu 2012 Bakke et al 2015
Chu and Ma 2015) We extend this research in two ways First we use FAS123R to examine the
8 A notable exception is Shue and Townsend (2014) who instrument change in option grants with predicted new
option grant cycle and find that dividend growth is slower in the first year of a new option grant cycle than other years
An important premise underlying this approach is that the outcomes respond almost instantaneously to the treatment
In this paper we are more concerned with the longer-term effects of ESO as payout tends to be sticky and may
respond to the treatment only gradually (Lambert et al 1989)
8
effect of option-based pay on a different yet important economic outcome payout policy Second
our metholodogy differs from prior studies in that it explicitly incorporates cross-sectional
variation in how firms were affected by FAS123R Future work may use this approach to examine
the effect of option-based pay on other corporate policies
Finally we extend the literature on how accounting rules impact a firmrsquos economic
behavior (eg Carter and Lynch 2003 Carter et al 2007 Bens and Mohanan 2008 Choudhary
Rajgopal and Venkatachalam 2009 Graham Hanlon and Shevlin 2011) as well as the literature on
the accounting treatment for stock options (Aboody 1996 Dechow Hutton and Sloan 1996
Aboody Barth and Kasznik 2004 Ferri and Sandino 2009)
2 Research Design
21 Empirical Strategy
It is commonly recognized that identifying the causal effects of executive compensation in
empirical studies is challenging (Edmans and Gabaix 2015) FAS123R provides a unique
opportunity to address this problem Aside from significantly reducing the use of option
compensation the accounting change should not in itself correlate with the outcomes of interest
(ie change in payout policy)9 However utilizing FAS123R is not easy because it affected all
US firms at the same time making it difficult to measure a counterfactual change around the
event based on a control group A simple before-after comparison of the outcome variable around
the adoption of FAS123R would assume that any change is driven entirely by the event of interest
(ie it would assume away any conterfactual trend in the outcome variable) a questionable
assumption An alternative strategy is to use the change in option-based compensation around
9 Hayes et al (2012) describes FAS123R as an exogenous change in the accounting benefits of stock options without a
change to the economic costs and benefits of stock options while Bakke et al (2015) describes it as causing a change
in executivesrsquo but not shareholdersrsquo incentives
9
FAS123R effectively assuming that such change is ldquoexogenousrdquo (eg Chava and Purnanandam
2010 Anantharaman and Lee 2014) The problem with this approach is that FAS123R per se did
not generate exogenous cross-sectional variation in option compensation Even if the introduction
of FAS123R is exogenous a firmrsquos response cannot be assumed to be entirely exogenous10
To identify the exogenous portion of firmsrsquo response to the new standard we make use of
evidence that FAS123Rrsquos impact on the use of option compensation varies with the firm-specific
expected accounting impact of the new rule as measured by the implied option expense disclosed
in the footnotes prior to FAS123R (Hayes et al 2012) The reduction in option usage is highest in
firms with the largest implied option expense Thus we can use the differential accounting impact
of FAS123R to overcome the problem of lacking control group
To validate our approach we estimate the following first-differencing regression with
ordinary lease square (OLS)
ΔOptioni = β0 + β1 Accounting Impacti + ΛControli +εi (1)
where ΔOptioni is the change in the average value of executive stock options as percentage of total
pay from the pre- to the post-FAS123R period Accounting Impacti is the implied option expense
measured prior to FAS123R (more details in Section 22) We expect β1 to be negative that is a
more pronounced reduction in option-based pay for firms with higher expected accounting impact
Next after validating the differential impact of FAS123R we examine the central question
of this study by estimating the following OLS regression
ΔPayouti = γ0 + γ1 Accounting Impacti + ΓControli +ui (2)
10 A universally assigned encouragement to receive treatment does not make the realization of treatment assignment
free from endogeneity concerns Consider the following example after the adoption of FAS123R firm A reduces the
weight of option-based pay by 20 and firm B by 40 A finding that firm B increases dividends compared to firm A
cannot be interpreted as evidence of a causal influence of option compensation on dividend policy This is because the
additional reduction in option compensation by firm B relative to firm A may not be driven by FAS123R It may
instead reflect an attempt to align executivesrsquo incentives with anticipated changes in dividend policy (reverse
causality) Without a way to incorporate the heterogeneous impact of FAS123R in the research design the cross
sectional variation in changes in option-based compensation is still subject to the usual endogeneity concerns
10
where ΔPayouti represents the change in the average value of one of the payout variables
of interest (described in Section 23) from the the pre- to the post-FAS123R period
Eq (2) is essentially a difference-in-difference approach to estimate the effect of option-
based pay on payout policy using the differential accounting impact of FAS123R to capture the
exogenous (accounting-induced) portion of the change in option-based pay If option-based pay
has a detectable causal effect on dividends (repurchases) in the direction predicted by the
literature γ1 should be positive (negative)
As noted by Bertrand Duflo and Mullainathan (2004) in difference-in-difference studies
with panel data OLS may yield inconsistent standard error estimates because the dependent
variable and the main independent variable tend to be serially correlated within firm To alleviate
this concern following Bertrand et al (2004) in both Eqs (1) and (2) we collapse the panel to a
single ldquoPrerdquo (2003-2004) and a single ldquoPostrdquo (2005-2007) period by averaging across years and
then measuring the changes from Pre to Post11 We choose 2003 as the starting period in order to
capture a period subsequent to the 2003 tax cut on individual dividend income While the
evidence on the effect of the tax cut on payout policy is mixed (Chetty and Saez 2005 Edgerton
2013 Floyd et al 2015) starting with 2003 allows the pre-FAS123R levels of the key variables to
reflect any effect of the tax cut 12 We end our analysis in 2007 to avoid the potentially
confounding effect of the 2008 financial crisis which had a significant impact on payouts (Floyd et
al 2015)13 Following Hayes et al (2012) and Bakke et al (2015) we include 2005 in the Post
11 In the collapsed two-period panel a regression of changes is equivalent to a regression of levels with firm-fixed
effects and an indicator for the Post period Both approaches obviate unobserved time-invariant firm heterogeneity
We choose first differencing equation for a more intuitive interpretation 12 The Jobs and Growth Tax Relief Reconciliation Act of 2003 was signed into law on May 28 2003 but had been
proposed on January 7 2003 and was made retroactive to the beginning of 2003 Chetty and Saez (2005) show that
the tax change affected dividend policy in 2003 13 In November 2006 the Securities and Exchange Commission required more details about the terms of performance-
based incentive plans We are not aware of any evidence that these rules affected the weight of option-based pay
11
period because FAS123R while effective in June 2005 was released in December 2004 14
Alternatively in untabulated tests we exclude 2005 from the analysis and obtain similar results
Another benefit of using a single Pre and Post period is that it is better suited than panel
data to the analysis of repurchases As noted by Skinner (2008) firms engaging in repurchases
tend to do so every other year thus the relation between repurchases and economic determinants is
stronger over two- or three-year periods than one-year periods Factors explaining the timing of
repurchases differ from those explaining their level and the year-to-year variation in repurchases is
not necessarily informative of changes in payout policy As we are not interested in the timing of
repurchases our approach seems to better capture ldquolong-runrdquo changes in payout policy However
for the analysis of dividends (which are generally paid every year and thus not subject to the
above problem) we also present the results using a panel regression with firm- and year-fixed
effects To alleviate the problem of serial correlation discussed earlier we cluster the standard
errors by firm
22 Accounting Impact
As noted earlier all firms were affected by FAS123R making it difficult to identify a
control sample To capture variation in the cross-sectional impact of FAS123R in Eqs (1) and (2)
we use Accounting Impacti defined as the implied option expense disclosed in the footnote of the
income statement for the 2002 fiscal year scaled by total assets (we obtain similar findings when
scaling it by revenues) We measure this variable in 2002 (ie before the Pre period) rather than in
2003 or 2004 to avoid any confounding effect from the expected adopion of FAS123R (see
discussion in Section 33) As this variable is highly skewed (see Table 1) we define it based on
(Gipper 2015) or had any effect on payout policy However we exclude 2007 from the Post period in robustness tests
Our inferences are unchanged 14 FAS123R was released in December 2004 effective as of the beginning of the first interim or annual reporting
period beginning after June 15 2005 Subsequently the SEC allowed a six-month deferral making the standard
effective for fiscal years beginning after December 15 2005
12
its quartile rank We also presents results with separate indicators for the top three quartiles in
order to better isolate the difference between top quartile (the most lsquotreatedrsquo group) and bottom
quartile (the least lsquotreatedrsquo group and thus closer to the notion of a control group)
An alternative way to address the issue of a lack of control group is suggested by Bakke et
al (2015) They argue that two sets of firms were likely lsquounaffectedrsquo by FAS123R (i) firms that
did not grant options to the CEO in 2003 and 2004 as in these firms FAS123R could not affect
CEO option pay and thus her incentives to make policy changes (ii) firms that were already
voluntarily expensing stock options as of 2002 (ie before FASB began discussions of the new
standard) as these firms would not face any additional accounting charge under FAS123R
Our approach offers a number of advantages First instead of collapsing all lsquonon-controlrsquo
firms in a single lsquotreatedrsquo group we exploit cross-sectional variation among treatment firms in
terms of the likely impact of FAS123R effectively using the most and least affected firms
(respectively top and bottom quartile of implied option expense) as treatment and control group
As shown in Table 1 the implied option expense is highly skewed (ie only a relatively small
number of firms was heavily affected by FAS123R) Capturing this variation is likely to increase
the power of the test Second in Bakke et al (2015) what matters is that the treatment definition
captures an accounting-driven change in CEO option grants as their focus is on CEO risk-taking
incentives In our setting we want to capture an accounting-driven change both in CEO option
grants (predicted to affect incentives to use dividends) and in the overall use of stock options
(predicted to affect the use of repurchases) As noted in Section 31 (see footnote 20) many firms
without CEO option grants in 2003 and 2004 were issuing options to non-CEO executives and
other employees and thus facing a potential accounting charge under FAS123R Third about half
of the firms without CEO option grants in 2003 and 2004 issued options to the CEO in the Post-
13
period Hence it is not clear that the control firms were truly unaffected by FAS123R Finally
the implied option expense in 2002 (our measure of the expected accounting impact) is a function
of option grants made in prior years when firms could not anticipate the adoption of FAS123R In
contrast option grant decisions in 2003 and 2004 may be affected by its anticipated adoption as
FASB added accounting for stock-based compensation to its agenda in March 2003
Notwithstanding the above arguments throughout our study we also present the results
using the definition of treatment and control in Bakke et al (2015) In particular we modify Eqs
(1) and (2) by replacing Accounting Impact with Treated an indicator equal to zero for the two
groups of firms identified as lsquocontrolrsquo in Bakke et al (2015) and one for all other firms
23 Payout Variables and Control Variables
Following Brown et al (2007) our baseline measure for changes in dividends is the change
in the DividendAssets ratiomdashcomputed as the regular cash dividends paid during the year scaled
by total assets at the beginning of the yearmdashfrom the Pre to the Post period15 However the
dividend-to-asset ratio is not what managers focus on when making dividend policy decisions
The stability of dividend per share (DPS) among dividend-paying firms (hereinafter payers)
suggests that managers do not target a specific dividend-to-assets ratio but rather a DPS level
(Baker and Wurgler 2016) Survey evidence confirms that executives make dividend policy
decision in terms of changes to the current level of DPS (Brav et al 2005) Therefore we also
examine the percentage change in the average DPS from the Pre to the Post period However this
measure can only be computed for the subset of payers (defined as firms with non-zero DPS in at
15 An alternative choice would be to scale dividends by the market value of equity essentially computing a dividend
yield However a drawback of using the dividend yield in our setting is that after controlling for time-invariant firm
characteristics through fixed effects or first differencing the variation of the ratio comes mainly from the denominator
the stock price (Baker and Wurgler 2004) Thus we choose the more stable book value of total assets as denominator
Also similar to other studies (eg Fenn and Liang 2001) we focus on regular dividends and exclude special dividends
as they are very rare and may introduce large noise to the dividend measures for few observations (DeAngelo
DeAngelo and Skinner 2000)
14
least one of the years of the Pre period) To provide insights into FAS123Rrsquos effect on dividend
policy for non-payers we examine the relation between our Accounting Impact variable and the
rate of dividend initations in the Pre and Post periods
Our main measure for repurchases is the change in RepurchaseAssetsmdashthat is the
aggregate amount of common stock repurchases made during the year scaled by total assets at the
beginning of the yearmdashfrom the Pre to the Post period In the empirical tests we examine
variations suggested in the literature
Finally as an alternative to examining dividends and repurchases separately we also look at a
measure of the payout composition the change in the DividendsTotal Payout ratio from the Pre to
the Post period (Total Payout is the sum of dividends and repurchases) effectively capturing any
substitution effect between dividends and repurchases 16 Examining the causal effect of the
change in option-based pay on payout composition is especially relevant if managers first target a
total payout and then choose the relative weight of dividends and repurchases In practice it is
unclear to what extent managers act this way (Brav et al 2005) Nonetheless for completeness we
also examine this variable We focus on the subsample of firms with both dividends and
repurchases in both Pre and Post period so as to capture changes in payout mix by firms routinely
using both vehicles to return cash to shareholders
As for the control variables in both Eqs (1) and (2) Controli is a vector of firm characteristics
identified in existent literature as determinants of payout policy (eg Fenn and Liang 2001 Brown
et al 2007 Skinner 2008 Cuny et al 2009) firm size book-to-market leverage asset tangibility
free cash flows cash holdings volatility in operating income institutional ownership sales
16 Fama and French (2001) suggest that repurchases are often complement to dividends while Grullon and Michaely
(2002) document that the increase in share repurchases over the past decades has come at the expense of a lower
increase in dividends consistent with a substitution hypothesis Brown et al (2007) also provide evidence of a
substitution effect in response to the 2003 dividend tax cut Survey evidence in Brav et al (2005) suggests an
asymmetric substitution effect with managers more willing to replace dividends with repurchases than the opposite
15
growth past stock returns and an indicator for loss firms For all of these variables we include
both changes from Pre to Post period and levels in the Pre period to allow for the possibility that
levels of these variables affect subsequent changes in payout policy 17 Finally we include
industry-fixed effects (Fama-French 48 industry indicators) to control for industry-level trends in
payout policies and option-based pay In unreported tests we replace free cash flows with two
separate variables operating profit and capital expenditures We also replace volatility in
operating income with volatility in stock returns Our results are unaffected More detailed
definitions of each variable are in the Appendix
24 Identification Assumption
The key identifying assumption underlying the difference-in-difference estimation
technique is that the parallel trends assumption is satisfied In the absence of treatment both
treated and control firms should experience parallel trends in the outcome variable Our approach
assumes that in the absence of FAS123R the change in dividends or repurchases would be the
same for high and low accounting impact firms Note that the well-documented contemporaneous
correlation between levels of option compensation (a key driver of the implied option expense and
thus the accounting impact) and levels of payout variables does not violate our identification
assumption This is because our assumption pertains to the relation between the level of option
compensation and future changes in payout variables
A specific concern is that options may be granted in anticipation of expected future
changes in payout policy (reverse causality problem) Relative to simple association tests this
concern is significantly reduced in our setting because the accounting impact is measured three
years prior to the arrival of treatment and is the result of option grants made over the prior four or
17 In untabulated analyses we run our tests after excluding changes in the control variables (ie including only their
pre-treatment levels) since in difference-in-difference studies controlling variables measured after the shock may
reintroduce selection bias Our inferences remain unchanged
16
five years depending on the vesting schedule18 For the reverse causality to be plausible the
implied option expense in 2002 (the result of option grants made approximately between 1998 and
2002) needs to reflect the anticipated change in payout policy in 2005-2007 This seems unlikely
While the parallel trend assumption is not directly testable similar to other studies (Bakke
et al 2015) we examine the trends in dividends and repurchases during the Pre period Figure 1
suggests that high and low accounting impact firms (respectively top and bottom quartile of
implied option expense) exhibit similar trends in payout variables in the Pre period ie from 2003
to 2004 More formally to examine the correlation between Accounting Impact and trends in the
payout variables during the Pre period we estimate the following regression only with
observations in 2003 and 2004
Payouti = γ0 + γ1 Accounting Impacti FY2004+ γ2 FY2004+ ΓControli +Firm FE +ui (3)
where Payouti is either DividendAssets or RepurchaseAssets FY2004 is an indicator of
fiscal year 2004 Firm FE indicates firm-fixed effects If firms with varying degrees of accounting
impact have different payout trends before the adoption of FAS123R γ1 should be different from
zero However for both payout variables we find that the estimated γ1 is close to zero and not
statistically significant at 10 level (untabulated tests) Overall the parallel trends assumption
seems reasonable in our setting
3 Empirical analyses
31 Sample Selection and Summary Statistics
Our sample is the SampP 1500 firms with available data on implied option expense (from
Compustat) and on executive compensation (from Execucomp) for at least one year in the Pre
18 The accounting treatment for stock options requires their fair value at the grant date to be recognized over the
service period (usually the vesting period) Hence the implied option expense in a given year includes a fraction of
the expense associated with past option grants
17
period and one year in the Post period to ensure consistency in the sample across periods Similar
to prior studies on payout policy (Fama and French 2001 Skinner 2008) we exclude financial
firms (SIC code between 6000 and 6999) and utilities (SIC between code 4900 and 4999) as well as
firms not incorporated in the US Our final sample includes 1176 firms19 We obtain dividend
and stock returns data from CRSP stock repurchases and dividend per share data from
COMPUSTAT and institutional ownership data from Thomson Reuters 13F database Other
control variables are from CRSP and COMPUSTAT To deal with outliers we winsorize all
continuous variables at 1 and 99 by fiscal year A detailed definition of all variables and their
sources is in Appendix
Table 1 Panel A presents summary statistics of the relevant variables for the pooled sample of
5653 firm-year observations Implied option expense in 2002 (our proxy for Accounting Impact)
is on average 173 of total assets with the median at 052 This suggests that the accounting
impact is very large for a small number of firms Over the entire sample period on average
dividends represent 093 of total assets while repurchases represent 394 Untabulated
analyses indicate that in 16 of the firm-year observations only dividends are paid out in 25
only repurchases in 32 both and in 27 neither Within the subset of firm-years with a payout
dividends represent 3874 of total payout This data confirms prior evidence that repurchases
have assumed the primary role as a vehicle to return cash to shareholders (eg Floyd et al 2015)
The mean (median) total executive pay (average across the top 5 executives) is $25 million ($16
million) On average option grants and restricted stock grants represent respectively 283 and
141 of total pay while salary and bonus comprise 296 and 197 respectively The
19 The results presented in the study are similar when (i) we restrict the sample to firms with available data for the
entire (2003-2007) sample period (1009 firms) and (ii) we exclude firms with CEO turnover in the Post period
(reducing the sample size to 780 firms) as a new CEO may have a different compensation package andor adopt a
different payout policy
18
composition of CEO pay (untabulated) is similar As for the control variables the figures are
generally consistent with other studies examining SampP 1500 firms over the same period
Panel B reports the pairwise Pearson correlations among the relevant variables The
correlations are in line with the associations documented in prior studies For example larger
firms and firms with higher profitability (free cash flows) have higher payouts loss firms have
lower payouts greater volatility in operating income is associated with lower dividends
More relevant to our analysis Panel C presents the mean of each variable in the Pre and Post
period for the full sample For each variable we first compute the firm-level mean over the Pre
and the Post Period and then compute the mean of the resulting figure across all firms There is a
striking increase in repurchases which double from 245 to 490 of total assets causing a
similar increase in total payout The increase in dividends is much smaller from 083 to 099
of total assets As a result for firms with positive payout dividends become a smaller fraction of
total payout in the Post period (2790 versus 3914 in the Pre period) This trend is consistent
with Floyd et al (2015) who document a dramatic increase in repurchases in the years leading to
the 2008 financial crisis Consistent with previous studies around FAS123R there is a significant
reduction in option grants as a fraction of total executive pay (from 343 to 240) and a
corresponding increase in the use of restricted stock (from 87 to 176) with little variation in
the weight of salary and bonus (note that restricted stock salary and bonus were expensed both
before and after FAS123R) Similar patterns hold for the composition of CEO pay (untabulated)
Compared to changes in the mix of executive pay changes in the levels of control variables are
generally less pronounced
Panel D reports the change in the key compensation and payout variables from the Pre to the
Post period by quartiles of implied option expense and yields a number of insights First
19
confirming the skewness suggested by Panel A the mean implied option expense is 551 for
firms in the top quartile versus only 093 035 and 012 for firms in the second third and
bottom quartile respectively Second as expected firms with higher implied option expense have
greater use of option-based pay For example in the Pre-period option pay represents 507 of
total executive pay at firms in the top quartile versus 201 in the bottom quartile Third and
more importantly for our research design the use of option pay changes significantly from the Pre
to the Post period as a function of the accounting impact For firms in the top quartile the
percentage of total pay represented by stock options drops by 182 (from 507 to 325)
versus 113 80 and 34 for firms in the second third and bottom quartile respectively The
decline in option usage across quartiles is accompanied by an increase in restricted stock grants
while the weight of salary and bonus shows little change It is important to emphasize the
substitution of stock options with restricted stocks because restricted stocks typically pay
dividends (Zhang 2013) thus providing further reason to expect a dividend increase in response to
the FAS123R-induced decline in option pay
As for the payout variables Panel D suggests that heavy option users (firms with higher
implied option expense) generally use repurchases more than dividends consistent with the
associations documented in earlier studies In the Pre period repurchases (dividends) represent
351 (030) of total assets for the top quartile versus 113 (112) for the bottom quartile
Panel D also indicates that the increase in repurchases documented in Panel C takes place across
all quartiles As for the (much smaller) change in dividends the absolute increase is similar across
the four quartiles though the relative increase (the percentage change) appears to be slightly
higher in the top quartile Overall these figures do not suggest a shift toward dividends and away
from repurchases by firms with a large (accounting-induced) decline in the use of option pay
20
Panel E presents the same data as Panel D but based on the definition of lsquotreatmentrsquo and
lsquocontrolrsquo in Bakke et al (2015) Under this definition 997 firms are classified as treatment group
and 177 as control (171 firms are classified as lsquocontrolrsquo because they did not grant options to the
CEO in the Pre period and 6 because they were voluntarily expensing options before 2003)
Interestingly lsquotreatedrsquo firms are equally distributed across the quartiles suggesting significant
variation in the degree of treatment As discussed earlier one benefit of our approach is that it
exploits cross-sectional variation among treatment firms in terms of the likely impact of FAS123R
Also 40 of the control firms (71 out of 177) are in the lowest quartile while 35 ((37+25)177)
are in the top two quartiles reflecting the different focus of the two approaches in terms of
identifying firms less affected by FAS123R20
As for payout and compensation variables Panel E shows that the treated group experiences a
larger increase in repurchases than the control group while the (less pronounced) increase in
dividends is similar across treated and control firms Treated firms experience a 126 decrease in
option pay (from 387 to 261) with a corresponding 94 increase in the weight of restricted
stock grants (from 80 to 174) The figures are similar at the CEO level (because the
classification is based on options grants to the CEO it is useful to report pay figures at both the top
5 executives and the CEO level) Interestingly the control group experiences a pronounced
increase in the weight of option grants in total CEO pay from 10 to 127 as almost half of the
control firms issued options to their CEOs in the Post period (for these firms options as percentage
of total CEO pay increased from 0 to 254 untabulated analysis) While this increased use of
stock options suggests (ex post) that these firms were not concerned with the impact of FAS123R
another possibility is that the lack of use of option compensation for CEOs in 2003 and 2004 was
20 In untabulated analysis we find that 55 of the 171 firms issuing no options to the CEO in the Pre period granted
options to the other top executives (and perhaps to other non-executive employees) thus explaining the relatively high
implied option expense for the control group (10 versus 19 for the treatment group ndash see Panel E)
21
temporary rather than the effect of a permanent policy If these firms were planning to issue
options to the CEO in the Post period the assumption that they were unaffected by FAS123R (and
thus their use as control sample) is questionable21
32 Differential Impact of FAS123R on the Use of Option-Based Compensation
An important building block of our approach is the presumed differential impact of FAS123R
on option-based pay as a function of pre-existing implied option expense22 While Table 1 Panel
D preliminarily supports the validity of this assumption we formally examine it by estimating Eq
(1)
As reported in Table 2 Panel A we find a significant negative association between Accounting
Impact and the change in option-based pay around the adoption of FAS123R In column (1)
where we use the quartile rank of implied option expense the -0044 coefficient implies that
around FAS123R option grants over total pay decline by 44 as we move from the highest
quartile to the next Thus the reduction in top quartile firms is 132 larger than in bottom
quartile firms In column 2 we replace the quartile rank with three indicators for the highest
quartiles (with the bottom quartile collapsed in the intercept) so as to be able to compare directly
top and bottom quartile without imposing the same effect across quartiles The negative and
significant coefficient on the top quartile indicator at -0140 suggests that the reduction in option
grants over total pay is 140 larger for top quartile firms relative to bottom quartile firms
Finally in column 3 we use the indicator for treated firms following Bakke et al (2015) The
21 Panel E also shows an increase in the use of restricted stock in CEO pay packages (from 128 to 182 almost
comparable to the increase among treated firms) The concurrent increase in options and restricted stock suggests
these firms would have increased option pay significantly more had it not been for FAS123R indicating further
caution in classifying them as control group of unaffected firms 22 This is akin to the relevance assumption of instrumental variable if we interpret the implied option expense as an
instrument to the change in option-based pay
22
negative and significant coefficient at -0132 suggests that treated firms experience a 132
larger drop in the weight of option pay relative to control firms
In Panel B we re-estimate Eq (1) using a panel regression with firm- and year-fixed effects
(5653 firm-year observations) where the dependent variable is the the ratio of option grants to
total executive pay The results are virtually identical in terms of significance and magnitude of
the coefficients of interest (the interaction terms between respectively Accounting impact and
Treated and an indicator for the Post period)
Overall Table 2 suggests that high implied option expense and the introduction of FAS123R
together strongly encouraged firms to cut back option-based compensation for executives It also
supports the general validity of the approach in Bakke et al (2015) in identifying firms most
affected by FAS123R notwithstanding the concerns outlined earlier
Our test of Eq (1) focuses on executive stock options For our dividend-protection hypothesis
it is important to establish that the level of implied option expense predicts a change in executive
stock options (rather than only a change in the use of non-executive employee stock options) as we
want to capture the effect of a change in executivesrsquo incentives on payout policy At the same
time our dilution channel hypothesis assumes a change in the use of all (executive and non-
executive employee) stock options Thus in untabulated analyses we repeat the test in Eq (1) by
replacing the dependent variable with the change in the number of options granted to all
employees (scaled by the total number of outstanding shares note for this analysis we can only
use data from 2004 to 2007 because Compustat began reporting data on ESO in 2004) The
coefficient on Accounting Impact and Treated continues to be negative and significant suggesting
that the differential reduction in the use of option compensation as a function of accounting impact
23
occurred for both executive and non-executive employee stock options Indeed Brown and Lee
(2011) report a similar decrease in executive and employee stock options around FAS123R
33 Option-Based Pay and Dividend Payouts
In this section we examine the effect of an exogenous (accounting-induced) change in option
compensation on dividend policy by estimating Equation (2)
Table 3 Panel A presents the results using the change in dividends from Pre to Post as
dependent variable We find no significant association between Accounting Impact (column 1 and
2) or Treated (column 3) and the change in dividends around the adoption of FAS123R This is in
stark contrast with the negative effect of option-based pay on dividends predicted in the literature
and documented in various association studies
One concern with this lack of effect is that perhaps our setting is not powerful enough to detect
it One way to examine this possibility is the following The coefficient on Accounting Impact
rank=4 in column 2 is 0001 and the standard error (SE) is 00009 Assuming the estimated
standard error is correct then for a two-tailed t test the coefficient needs to be greater than 00015
(=SE1645) or 015 to reach the 10 percent significant level In other words if moving from
the bottom to the top quartile (which predicts a 14 differential decline in option based pay as per
Table 2 Panel A) resulted in a 015 increase of the dividendasset ratio our test would be able to
detect a causal effect of option-based pay on dividends Given the unconditional mean of the
dividendasset ratio at 093 an increase of 015 from the Pre to the Post period seems
plausible In fact the average increase from the Pre to the Post period is 016 (Table 1 Panel C)
Thus if an effect was there our test should detect it
24
Panel B presents the results using a panel regression (5653 firm-year observations) with firm-
and year-fixed effects and interaction terms between Accounting Impact (or Treated) and an
indicator for the Post period Our inferences are unchanged
These analyses are based on our full sample which includes both dividend-paying and non-
dividend-paying firms Hence they implicity treat as equal two potentially different decisions to
initiate dividends and to increase dividends For example an increase in the dividend-to-asset
ratio from 05 to 06 will be treated the same as an increase from 00 to 01 even though
the latter represents a critical dividend initiation decision23 To address this following Chetty and
Saez (2005) we separately examine how FAS123R impacts the intensity of dividend changes (for
the subset of payers) and the likelihood of dividend initiations (for the subset of non-payers)
331 Option-Based Pay and Dividend Payouts Intensity of Dividend Changes
In the first row of Panel C we repeat the analysis in Panel A for the sub-sample of 572 payers
defined as firms with positive DPS in 2003 andor 2004 Note that we report only the coefficients
of interest for parsimony In the second row we replace the dependent variable with the
percentage change in DPS DPS is the choice variable for managers (Brav et al 2005 Baker and
Wurgler 2016) and thus our preferred measure to capture changes in dividend policy To account
for skewness in this variable (Khale 2002) in the third fourth and fifth rows we use indicator
variables to denote whether the change in DPS surpasses a threshold respectively 20 40 and
60 The proportion of firms that surpass these thresholds are 59 44 and 33 respectively24
23 Initiating dividends is a critical decision for boards given the pre-commitment value that investors attach to this
decision and the strong negative market reaction when firms eliminate or reduce dividends (Brav et al 2005) For
executives trying to maximize the value of their own stock options (dividend-protection argument) the ability to
influence a dividend initiation decision is likely lower than the ability to influence a dividend increase decision 24 Although in the third fourth and fifth rows our dependent variable is a binary variable we use a linear model (OLS)
instead of a probit or logit nonlinear model The reason is that estimating fixed effects in binary response models with
panel data can cause the incidental parameters problem The coefficient estimates can be biased when the panel data
25
Across all of these specifications we find no association between Accounting Impact or Treated
and the intensity of dividend changes Thus it does not appear that an exogenous reduction in
option-based pay caused dividend-paying firms to increase dividends
In Panel D we perform four robustness tests For parsimony we show only the coefficients of
interest and only the cases where the dependent variable is an indicator denoting a greater than
40 increase in DPS The results are similar for the other four ldquointensityrdquo dependent variables
reported in Panel C
In the first row we exclude firms that began to voluntarily expense options in 2003 or 2004
(84 firms of which 68 are dividend payers) FASB added accounting for stock-based
compensation to its agenda in March 2003 and issued an Exposure Draft proposing the expensing
of stock options at fair value in March 2004 In anticipation a number of firms began to
voluntarily expense stock options in 2003 and 2004 (Aboody et al 2004) If these firms reduced
option grants and as a result increased dividends during the Pre period then their inclusion may
reduce the power of our tests and thus our ability to detect the hypothesized relation25
In a similar spirit in the second row we exclude firms in the top decile in terms of reduction in
the ratio of option grants to total pay for the top 5 executives between 2002 (the year prior to the
Pre-period) and 2004 (the end of the Pre-period) This encompasses 113 firms of which 55 are
dividend payers If these firms reduced option grants in anticipation of FAS123R and as a result
increased dividends during the Pre period their inclusion may reduce our ability to detect the
hypothesized relation
has a large number of observations but a short time series Examples of studies making a similar choice are Puri
Rocholl and Steffen (2011) and Chu and Ma (2015) 25 This is unlikely to be a serious concern as previous studies suggest that voluntary expensers made limited use of
stock options (Aboody et al 2004) In fact in our sample 79 of these firms are in the bottom two quartiles of
implied option expense (untabulated) Nonetheless we present this test for robustness
26
In the third row we exclude firms that accelerated the vesting of options before FAS123R
became effective in order to avoid recognizing an expense for the unvested portion of these
options (Choudhary et al 2009 Balsam Reitenga and Yin 2008) This encompasses 196 firms of
which 54 are dividend payers If accelerating vesting was used to reduce the impact of FAS123R
the inclusion of these firms may reduce the power of our tests26
In the fourth row we deal with the concern that if firms target a fixed dividend to net income
ratio (Lintner 1956) and do so without adjusting for changes in accounting standards then by
decreasing net income (via option expense) the accounting change would mechanically cause a
reduction in dividends This would potentially offset and confound the increase predicted under
the dividend-protection and dilution hypotheses This seems unlikely for two reasons First firms
are notoriously reluctant to cut dividends (Brav et al 2005) Hence it seems unlikely that they
would reduce dividends in response to a decline in net income with no economic or cash flow
implications (ie re-classification of an expense from the footnotes to the income statement)
Second firms today set dividends in terms of dividend per share rather than by targeting a net
income-based payout ratio (Brav et al (2005)) As noted by Skinner (2008) over the last few
decades as earnings have become more variable the relation between earnings and dividends has
become weaker with dividend payments increasing smoothly and largely independent of the
variation in earnings Nevertheless in the fourth row we exclude the 66 dividend-paying firms that
26 These firms explicitly stated that they accelerated the vesting of stock options to avoid the accounting charge
(Choudhary et al 2009) In fact 72 are classified in the top two quartiles of implied option expense (untabulated)
Thus we would have predicted these firms to experience a significant decline in option pay To the extent that this
decline did not materialize because they minimized the impact of FAS123R by accelerating vesting the ability of
Accounting Impact to predict the reduction in option pay and thus its usefulness in examining changes in dividends
around FAS123R may be reduced The list of firms accelerating vesting was kindly provided by Jack Ciesielsky of
The Analystsrsquo Accounting Observer
27
had a similar payout ratio in 2003 and 2004 as a proxy for firms with a target net income-based
payout ratio in the Pre period27
As shown in Panel D even after excluding these subsets of firms we continue to find no
association between Accounting Impact or Treated and changes in dividends for dividend-paying
firms This is inconsistent with a causal influence of option compensation on dividend policy
Another concern is that by reducing net income and thus retained earnings FAS123R
may have pushed some firms closer to violating dividend covenants in debt contracts and
thus prevented them from increasing dividends This would bias our study against finding a
causal effect of option-based pay on dividends However this does not appear to be a
significant concern for three reasons First the recognition of an option expense does not
imply a decline in net income In fact more than 70 (75) of the full sample firms
(dividend payers) experienced an increase in net income before extraordinary items from
2004 to 2005 (the percentages are similar across the four quartiles of implied option
expense) Second dividend covenants are less common among dividend-paying firms
(Nikolaev 2010) Third most loan contracts in recent years give parties the option to
ldquofreezerdquo GAAP when facing a mandatory change in accounting principles (Christensen and
Nikolaev 2009) Firms expecting an adverse impact of FAS123R on their dividend covenants
would likely exercise this option (particularly given the non-cash nature of option-based
expense) Nonetheless to alleviate this concern we perform three additional analyses
(untabulated) (i) we repeat the tests in Panel C after excluding firms with a drop in net
income between 2004 and 2005 (ie firms that perhaps faced some covenant-related
27 We define a ldquosimilarrdquo payout to be an absolute change in payout ratio of less than 1 from 2003 to 2004 Among
these 66 firms only 39 continued to have a similar payout ratio in 2005 We also try an alternative definition where
a firm is classified as likely to be using a net income-based target payout ratio if the absolute percentage change in the
ratio from 2003 to 2004 is less than 10 (100 firms) Our inferences are unchanged
28
constrains to their payout policy as a result of FAS123R) (ii) we explicitly control for net
income and retained earnings in the regression (as in Skinner 2008) (iii) we repeat the tests
in Panel C for dividend payers with dividendsasset ratio above the sample median on the
basis that dividend covenants are less frequent among firms paying large dividends (Jung
Lee and Yang 2016) Our inferences are unchanged
332 Option-Based Pay and Dividend Payouts Dividend Initiations
In this section we examine whether the accounting-driven change in option pay affected
dividend initiations among non-payers We cannot employ the difference-in-difference approach
adopted so far by definition the same firm cannot initiate dividends in both periods However we
can provide suggestive evidence as follows First we take all firms that did not pay dividends in
2002 and group them into quartiles based on 2002 implied option expense For each quartile we
find the number of firms initiating dividends in 2003 and 2004 (the Pre period) Next we take all
firms that did not pay dividends in 2004 group them into quartiles based on 2002 implied option
expense and for each quartile find the number of firms initiating dividends in 2005 and 2006 (the
Post period) We do not include 2007 so as to have the same number of years in both periods and
make the cumulative initiation rates comparable
The left portion of Panel E reports the results of this exercise There is a general decrease in
the dividend initiation rate from the Pre to the Post period This holds both in the full sample of
non-payers (from 129 to 79) and across all quartiles This decrease may reflect a temporary
spike in 2003 and 2004 in response to the 2003 dividend tax cut documented in Chetty and Saez
(2005) It is noteworthy that initiation rates in both periods are lower among firms with higher
implied option expense This is consistent with option-heavy firms being mostly high-growth
firms less inclined to pay dividends More relevant to our research question if the lower use of
29
option compensation increased the propensity to pay dividends we would expect to see a relative
increase (ie a lower decrease) in dividend initiations among firms with the highest accounting
impact Instead the rate does not differ depending on the accounting impact There is
approximatley a 5 decline in initiation rate in each quartile In the right portion of Panel E we
examine similar data for dividend terminations While the results should be interpreted with
caution due to their rarity firms with higher accounting impact do not experience a greater decline
in termination rates Our inferences in Panel E are similar when we compared treated and control
firms following Bakke et al (2015) (untabulated)
Even after taking into account the different nature of decisions for dividend paying and non-
dividend-paying firms we fail to find evidence of a causal influence of option-based compensation
on dividend policy This finding is in contrast to the associations documented in earlier studies It
is even more remarkable as most firms replaced stock options with restricted stock which are
generally dividend-protected and should provide further incentive to increase dividends28
34 Option-Based Pay and Repurchases
In this section we examine the effect of an exogenous (accounting-induced) change in option
compensation on repurchases by estimating Equation (2)
Table 4 Panel A presents the results using the change in repurchases (scaled by total assets)
from Pre to Post as a dependent variable If the use of option-based pay had a positive effect on
firmsrsquo propensity to engage in repurchases as posited by the dividend-protection and dilution
hypotheses we should find a negative association between Accounting Impact or Treated and
repurchases Firms with a higher (accounting-driven) reduction in option-based pay should reduce
28 In a sample of SampP 500 firms between 2000 and 2009 Zhang (2013) reports that 80 of the firms granting
restricted stocks offer dividend protection In that sense the FAS123R-induced shift from stock options to restricted
stock may be characterized as a ldquoshockrdquo to dividend protection in unearned equity pay Accordingly our results cast
doubt on the causal interpretation of the positive association between dividend protection and dividend payouts
documented in prior studies (Zhang 2013 Burns et al 2015 Minnick and Rosenthal 2015)
30
the use of repurchases either because they are shifting toward a greater use of dividends andor
because they have a lower need to offset the dilutive effects of stock options However we find no
significant association between Accounting Impact (columns 1 and 2) and the change in
repurchases around the adoption of FAS123R When we use the Treated indicator (column 3) we
find a significant positive association rather than a negative one In Panel B we repeat the analysis
using net repurchases (ie repurchases after removing the effect of share issuances) following
Fama and French (2001) and Skinner (2008) Our inferences are unchanged29
This test is subject to two important caveats The first is we may not detect a decline in
repurchases because in the Post period firms need to offset the exercise of options that were
granted during the Pre period That is a post-FAS123R reduction in grants may not (yet) translate
into a reduction in exercises during the Post period which reduces our ability to test the dilution
hypothesis (ie that firms repurchase shares to offset exercises)30 However we can examine a
variation of this hypothesis where firms use repurchases to manage the effect of unexercised
options on diluted EPS (Bens et al 2003) To do so in Panel C we use a measure of adjusted
repurchases where we subtract our estimate of repurchases undertaken to offset the exercise of
ESO31 We effectively test whether firms experiencing an accounting-induced decrease in option
grants engage in less repurchases (net of exercise-driven repurchases) because their need to
manage the effect of unexercised options on diluted EPS is lower However the coefficient on
the variables of interest is either insignificant or positive inconsistent with the hypothesis
29 In the case of repurchases we do not examine separately ldquoinitiationsrdquo and ldquointensityrdquo as we do for dividends
because initiation is not clearly defined for repurchases Unlike dividends the occurrence of a repurchase in a given
year (or the lack thereof) cannot be used to infer a general policy due to the more discretionary nature of the timing of
repurchases 30 To capture the effect of lower option-based compensation on option exercises and thus on repurchases we would
ideally extend the Post period beyond 2007 However as noted by Floyd et al (2015) repurchases declined
dramatically after 2007 because of the financial crisis making it difficult to detect the effect of any other factor 31 As upper bound estimate of exercise-driven repurchases we multiply the number of ESO exercised during the year
times the average stock price during the year Since the number of ESO exercised is available in Compustat starting in
2004 Panel C is based on observations from 2004 to 2007
31
A second important caveat is that most firms replaced stock options with restricted stock
(Table 2 Panel C) Unvested restricted stock is excluded from the denominator in the computation
of basic EPS (once vested it is included) However it is included in the denominator of diluted
EPS using the treasury stock method similar to stock options Given the complexity of this
method without access to all details of restricted stock grants and option grants it is difficult to
determine whether the switch from stock options to restricted stock decreased the need for
dilution-driven repurchases as our test implicitly assumes Hence it is possible that we do not find
a decrease in repurchases because a reduced need to offset the dilutive effect of stock options was
neutralized by an increased need to offset the dilutive effect of restricted stock
Subject to the above caveats the evidence in Table 4 is not consistent with a positive causal
relation between the use of option-based pay and repurchases More precisely it suggests that
option-driven dilution concerns do not have a first-order effect on the magnitude of repurchases
even though they may play a role in the repurchase decision Hence our result is not necessarily
in conflict with the evidence in Brav et al (2005) where two-thirds of the surveyed financial
executives state that offsetting the dilutionary effect of stock option plans or other stock
programs is an important factor to their repurchase decisions
35 Option-Based Pay and Payout Composition
As an alternative to examining dividends and repurchases separately we also look at the
payout composition the change in the DividendsTotal Payout ratio from the Pre to the Post period
where Total Payout is the sum of dividends and repurchases As noted earlier we focus on the
subsample of firms with both dividends and repurchases in both Pre and Post periods so as to
capture the change in payout mix by firms routinely using both vehicles to return cash to
shareholders If the use of option-based pay causes firms to substitute repurchases for dividends
32
we should find a positive association between Accounting Impact or Treated and the payout mix
defined as DividendsTotal Payout ratio Firms with a higher accounting-driven reduction in
option-based pay should have an increase (decrease) in the relative weight of dividends
(repurchases) to the total payout However as reported in Table 5 Panel A we fail to find a
significant association between Accounting Impact (column 1 and 2) or Treated (column 3) and
the change in payout mix The results are similar when we use Net Payout (dividends plus net
repurchases) instead of Total Payout in computing the payout mix (Panel B)
Overall the combined evidence in Tables 3-5 does not support the hypothesis that option-
based compensation has negative (positive) effect on dividends (repurchases) or that it causes
firms to replace dividends with repurchases
4 Conclusion
Prior literature has documented robust associations between option-based compensation and
payout policy yet it remains unclear whether this association reflcts a causal influence We
investigate the causal effect of option-based compensation on payout policy using the adoption of
FAS123R which resulted in a significant decrease in option grants making it a plausible
exogenous shock to the use of option-based pay To overcome the challenge of no control group
we exploit the fact that firms responded differently depending on the firm-specific accounting
impact as measured by the implied option expense disclosed in the footnotes prior to FAS123R
Firms with larger expected accounting impact curtailed option-based compensation much more
aggressively than firms with lower impact Using a sample of SampP 1500 firms we find no
evidence that firms with a larger accounting-induced decline in option compensation increased
dividends reduced repurchases or changed their payout composition contrary to the widely held
belief that option-based pay has a causal influence on payout policy
33
Appendix Variable Definitions and Data Sources
Accounting Impact Variables
Accounting impact Implied option expense (Compustat XINTOPT) divided by total assets
(Compustat AT) This variable is measured at fiscal year 2002 and is time-invariant
Accounting impact rank The quartile rank of Accounting impact (1=lowest 4=highest)
Payout Variables
Regular dividendTotal assets The numerator is total regular cash dividends in the fiscal year
from the distribution dataset in CRSP Regular cash dividends are identified by the distribution
codes 1212 1222 1232 or 1242 The denominator is one-year lagged total assets (Compustat
AT)
DPS Dividend per share (Compustat DVPSX_F)
DPS pct change The percentage change of average DPS from Pre- to Post-FAS123R period
DPS pct change gtX indicator A dummy variable that equals one if DPC pct change is greater
than X and zero otherwise
RepurchaseTotal assets The numerator is the repurchase of common equity which equals total
repurchase (Compustat PRSTK) minus the change in preferred stock redemption value
(Compustat PSTKRV) The denominator is one-year lagged total assets (Compustat AT)
Net repurchaseTotal assets Net repurchase removes the effect of share issuances The
construction follows Fama and French (2001) and Skinner (2008) if the firm uses the treasury
stock method for repurchase net repurchase equals the increase in common treasury stock
(Compustat TSTKC) if the firm uses the retirement method (when common treasury stock is zero
in the current and prior year) net repurchase equals total repurchases minus stock issuance
(Compustat SSTK) and change in preferred stock redemption value (Compustat PSTKRV)
When the above measures give negative value net repurchase is set to zero
Adjusted repurchaseTotal assets Adjusted repurchase removes from total repurchase the potential
effect of repurchasing exercised options This variable equals total repurchase of common stocks
minus the product between the number of options exercised (Compustat OPTEXD) and average
stock price during the year When the above measure gives negative value adjusted repurchase is
set to zero Since the number of options exercised is not available before 2003 we drop
observations in 2003 when we use this variable
34
Total payoutTotal assets the sum of Regular dividendTotal assets and RepurchaseTotal assets
Regular dividendTotal payout regular cash dividend divided by the sum of regular cash dividend
and repurchase from common equity In the two-period analysis (Pre- vs Post-FAS123R) we
separately sum the numerator and the denominator for each firm-period and then calculate the ratio
Regular dividendNet payout regular dividend divided by the sum of regular dividend and net
repurchase In the two-period analysis (Pre- vs Post-FAS123R) we separately sum the numerator
and the denominator for each firm-period and then calculate the ratio
Compensation Variables
Salary_$ Average salary (Execucomp SALARY) of the top 5 highest paid executives in $1000
Salary_ Average salary (Execucomp SALARY) divided by average total pay (Execucomp
TDC1) of the top 5 highest paid executives
Bonus_$ Average bonus (Execucomp BONUS) of the top 5 highest paid executives in $1000
Due to a data format change we add non-equity plan-based awards (Execucomp
NON_EQ_TARG) to this measure after 2006
Bonus_ Bonus_$ divided by average total pay (Execucomp TDC1) of the top 5 highest paid
executives
Option grant_$ Average option grant value (Execucomp OPTION_AWARDS_BLK_VALUE or
OPTION_AWARDS_FV) of the top 5 highest paid executives in $1000 Due to a data format
change we use OPTION_AWARDS_FV for this measure after 2006
Option grant_ Option grant_$ divided by average total pay (Execucomp TDC1) of the top 5
highest paid executives
Restricted stock grant_$ Average restricted stock grant value (Execucomp RSTKGRNT or
STOCK_AWARDS_FV) of the top 5 highest paid executives in $1000 Due to data format
change we use STOCK_AWARDS_FV for this measure after 2006
Restricted stock grant_ Restricted stock grant_$ divided by average total pay (Execucomp
TDC1) of the top 5 highest paid executives
Total pay_$ Average total pay (Execucomp TDC1) of the top 5 highest paid executives in $1000
35
Other Characteristics
Size The book value of total assets (Compustat AT) minus the book value of common equity
(Compustat CEQ) plus the market value of common equity from CRSP in $M
Log(size) the natural logarithm of size
Book-to-market the book value of common equity dividend by its market value
Leverage long term debt plus short term debt (Compustat DLTT + DLC) divided by total assets
Asset tangibility tangible assets (Compustat AT - INTAN) divided by total assets
Free cash flow Operating cash flow (Compustat OANCF) minus capital expenditure (Compustat
CAPX) then divided by lagged total assets
Cash holding Cash and short-term investments (Compustat CHE) divided by total assets
ROA volatility the standard deviation of returns on assets (operating income before tax divided by
lagged total assets) in the past five fiscal years
Institutional ownership the number of shares held by institutional investors divided by the number
of shares outstanding from Thomson Reuters Institutional Holdings database
Sales growth the growth rate of sales (Compustat SALE) from the prior year
Past stock return annual stock return from the prior year
Loss indicator a dummy variable taking value of one if the current net income is negative and
zero otherwise
36
References
Aboody David 1996 Market Valuation of Employee Stock Options Journal of Accounting and
Economics 22 357-391
Aboody David Barth Mary E and Ron Kasznik 2004 Firms Voluntary Recognition of Stock-
Based Compensation Expense Journal of Accounting Research 42 123ndash150
Aboody David and Ron Kasznik 2008 Executive stock-based compensation and firmsrsquo cash
payout the role of shareholdersrsquo tax-related payout preferences Review of Accounting Studies
13 216ndash251
Anantharaman Divya and Yong Gyu Lee 2014 Managerial risk taking incentives and corporate
pension policy Journal of Financial Economics 111 328ndash351
Baker Malcolm and Jeffrey Wurgler 2004 A catering theory of dividends Journal of Finance
59 1125-1165
Baker Malcolm and Jeffrey Wurgler 2016 Dividends as reference points a behavioral signaling
approach Review of Financial Studies 29 697-738
Bakke Tor-Erik Hamed Mahmudi Chitru Fernando and Jesus Salas 2015 The causal effect of
option pay on corporate risk management Journal of Financial Economics forthcoming
Balsam Steven Austin Reitenga and Jennifer Yin 2008 Option acceleration in response to SFAS
No 123 (R) Accounting Horizons 22 23-45
Bens Daniel and Steven Monahan 2008 Altering Investment Decisions to Manage Financial
Reporting Outcomes Asset-Backed Commercial Paper Conduits and FIN 46 Journal of
Accounting Research 46 1017-1055
Bens Daniel A Venky Nagar Douglas J Skinner and MH Franco Wong 2003 Employee stock
options eps dilution and stock repurchases Journal of Accounting and Economics 36 51ndash90
Bertrand Marianne Esther Duflo and Sendhil Mullainathan 2004 How much should we trust
differences-in-differences estimates The Quarterly Journal of Economics 119 249ndash275
Blouin Jennifer L Jana S Raedy and Douglas A Shackelford 2011 Dividends Share
Repurchases and Tax Clienteles Evidence from the 2003 Reductions in Shareholder Taxes
The Accounting Review 86 887-914
Brav Alon John R Graham Campbell R Harvey and Roni Michaely 2005 Payout policy in the
21st century Journal of Financial Economics 77 483ndash527
Brown Lawrence D and Yen-Jung Lee 2011 Changes in Option-Based Compensation Around
the Issuance of SFAS123R Journal of Business Finance amp Accounting 38 1053ndash109
37
Brown Jeffrey R Nellie Liang and Scott Weisbenner 2007 Executive financial incentives and
payout policy Firm responses to the 2003 dividend tax cut Journal of Finance 62 1935ndash
1965
Burns Natasha Brian McTier and Kristina Minnick 2015 Equity-incentive compensation and
payout policy in Europe Journal of Corporate Finance 30 85-97
Carter Mary Ellen and Luann J Lynch 2003 The Consequences of the FASBrsquos 1998 Proposal on
Accounting for Stock Option Repricing Journal of Accounting and Economics 35 51-72
Carter Mary Ellen Luann J Lynch and Irem Tuna 2007 The role of accounting in the design of
CEO equity compensation The Accounting Review 82 327ndash357
Chava Sudheer and Amiyatosh Purnanandam 2010 CEOs versus CFOs Incentives and
corporate policies Journal of Financial Economics 97 263ndash278
Chetty Raj and Emmanuel Saez 2005 Dividend taxes and corporate behavior Evidence from the
2003 dividend tax cut The Quarterly Journal of Economics 120 791ndash833
Choudhary Preeti Shivaram Rajgopal and Mohan Venkatachalam 2009 Accelerated vesting of
employee stock options in anticipation of FAS123R Journal of Accounting Research 47 105ndash
146
Christensen Hans B and Valeri Nikolaev 2009 Contracting on Mandatory Changes to GAAP
New Practice and Its Determinants Working Paper University of Chicago
Chu Yongqiang and Tao Ma 2015 How does management compensation affect bank risk taking
evidence from FAS 123R University of South Carolina Working Paper
Cuny Charles J Gerald S Martin and John J Puthenpurackal 2009 Stock options and total
payout Journal of Financial and Quantitative Analysis 44 391ndash410
DeAngelo Harry Linda DeAngelo and Douglas J Skinner 2000 Special Dividends and the
Evolution of Dividend Signaling Journal of Financial Economics 57 309-354
Dechow Patricia M Amy P Hutton and Richard G Sloan 1996 Economic consequences of
accounting for stock-based compensation Journal of Accounting Research 34 1ndash20
Edgerton J 2013 Four facts about dividend payouts and the 2003 tax cut International Tax and
Public Finance 20 769-784
Edmans Alex and Xavier Gabaix 2015 Executive compensation a modern primer Journal of
Economic Literature forthcoming
38
Fama Eugene F and Kenneth R French 2001 Disappearing dividends changing firm
characteristics or lower propensity to pay Journal of Financial Economics 60 3ndash43
Farre-Mensa Joan Roni Michaely and Martin C Schmalz 2014 Payout policy Annual Review
of Financial Economics 6 75ndash134
Fenn George W and Nellie Liang 2001 Corporate payout policy and managerial stock
incentives Journal of Financial Economics 60 45ndash72
Ferri Fabrizio and Tatiana Sandino 2009 The impact of shareholder activism on financial
reporting and compensation the case of employee stock options expensing The Accounting
Review 84 433ndash466
Floyd Eric Nan Li and Douglas J Skinner 2015 Payout policy through the financial crisis the
growth of repurchases and the resilience of dividends Journal of Financial Economics 118
299-316
Frydman Carola and Dirk Jenter 2010 CEO compensation Annual Review of Financial
Economics 2 75-102
Gipper Brandon 2015 Assessing the Effects of Disclosing Management Compensation Working
Paper University of Chicago
Gormley Todd David Matsa and Todd Milbourn 2013 CEO compensation and corporate risk
evidence from a natural experiment Journal of Accounting and Economics 56 79-101
Graham John Michelle Hanlon and Terry Shevlin 2011 Real effects of accounting rules
evidence from multinational firmsrsquo investment locations and profit repatriation decisions
Journal of Accounting Research 49 137-185
Graham John Campbell Harvey and Shiva Rajgopal 2005 The Economic implications of
corporate financial reporting Journal of Accounting and Economics 40 3-73
Greenspan Alan 2002 Testimony of Alan Greenspan before the Committee on Banking
Housing and Urban Affairs US Senate July 16 Washington DC Government Printing
Office
Grullon Gustavo and Roni Michaely 2002 Dividends Share Repurchases and the Substitution
Hypothesis Journal of Finance 57 1649-1684
Hail Luzi Ahmed Tahoun and Clare Wang 2014 Dividend Payouts and Information Shocks
Journal of Accounting Research 52 403-456
Hall Brian J and Kevin J Murphy 2002 Stock options for undiversified executives Journal of
Accounting amp Economics 33 3-42
39
Hall Brian J and Kevin J Murphy 2003 The trouble with stock options Journal of Economic
Perspectives 17 49ndash70
Hanlon Michelle and Jeffrey L Hoopes 2014 What do firms do when dividend tax rates change
An examination of alternative payout responses Journal of Financial Economics 114 105-
124
Hayes Rachel M Michael Lemmon and Mingming Qiu 2012 Stock options and managerial
incentives for risk taking Evidence from FAS123R Journal of Financial Economics 105
174ndash190
Heron Randall A Erik Lie 2007 Does backdating explain the stock price pattern around
executive stock option grants Journal of Financial Economics 83 271-295
Hribar Paul Nicole Thorne Jenkins and W Bruce Johnson 2006 Stock repurchases as an
earnings management device Journal of Accounting and Economics 41 3ndash27
Jensen Michael C 1986 Agency cost of free cash flow corporate finance and takeovers
American Economic Review 76 323-329
Jolls Christine 1998 Stock repurchases and incentive compensation NBER Working Paper No
w6467
Jung Boochun Woo-Jong Lee and Yanhua Sunny Yang 2016 The Impact of Dividend
Covenants on Investment and Operating Performance Journal of Business Finance amp
Accounting 43 414ndash447
Kahle Kathleen M 2002 When a buyback isnrsquot a buyback open market repurchases and
employee options Journal of Financial Economics 63 235ndash261
Lambert Richard A William N Lanen and David F Larcker 1989 Executive stock option plans
and corporate dividend policy Journal of Financial and Quantitative Analysis 24 409ndash425
Lintner John 1956 Distribution of incomes of corporations among dividends retained earnings
and taxes The American Economic Review 46 97-113
Low Angie 2009 Managerial risk-taking behavior and equity-based compensation Journal of
Financial Economics 92 470-490
Miller Merton H and Franco Modigliani 1961 Dividend policy growth and the valuation of
shares The Journal of Business 34 411ndash433
Minnick Kristina and Leonard Rosenthal 2015 Stealth compensation Do CEOs increase their
pay by influencing dividend policy Journal of Corporate Finance 25 435-454
40
Murphy Kevin J 1999 Executive compensation In O Ashenfelter and D Card (eds) North
Holland Handbook of Labor Economics Amsterdam Elsevier Science BV
Murphy Kevin J 2013 Executive compensation Where we are and how we got there Handbook
of the Economics of Finance Elsevier Science North Holland 211-356
Nikolaev Valeri 2010 Debt Covenants and Accounting Conservatism Journal of Accounting
Research 48 143-176
Puri Manju Joumlrg Rocholl and Sascha Steffen 2011 Global retail lending in the aftermath of the
US financial crisis Distinguishing between supply and demand effects Journal of Financial
Economics 100 556-578
Shue Kelly and Richard R Townsend 2014 Swinging for the fences Executive reactions to
quasi-random option grants Working Paper University of Chicago
Skinner Douglas J 2008 The evolving relation between earnings dividends and stock
repurchases Journal of Financial Economics 87 582-609
Weisbenner Scott J 2000 Corporate share repurchases in the 1990s What role do stock options
play FEDS Working Paper No 2000-29
Zhang Dan 2013 CEO dividend protection Working Paper BI Norwegian Business School
41
Figure 1 Trends of dividends and repurchases from 2003 to 2007 Panel A plots the average
Regular DividendTotal Assets of firms in the highest and lowest quartiles of Accounting Impact
measured in 2002 Panel B shows the average Total RepurchaseTotal Assets of firms in the
highest and lowest quartiles of Accounting Impact measured in 2002
Panel A Trends of regular dividends
Panel B Trends of total repurchases
00
05
10
15
20
2003 2004 2005 2006 2007
Regular DividendTotal Assets
Lowest Acc Impact
Highest Acc Impact
Pre Post
00
20
40
60
80
100
2003 2004 2005 2006 2007
Total Repurchase Total Assets
Lowest Acc Impact
Highest Acc Impact
Pre Post
42
Table 1
Summary Statistics
Panel A Firm characteristics - full sample
N Mean Std dev 25 pctl Median 75 pctl
Accounting impact (2002) 1176 173 366 022 052 163
Payout variablesRegular dividendTotal assets 5653 093 148 000 000 142
RepurchaseTotal assets 5653 394 710 000 035 500
Total payoutTotal assets 5653 488 748 000 175 666
Regular dividendTotal payout 4091 3874 4057 000 2237 8833
Level of executive compensation (in $1000)
Salary_$ 5653 450 190 314 409 544
Bonus_$ 5653 476 616 122 295 586
Option grant_$ 5653 791 1137 62 384 1002
Restricted stock grant_$ 5653 458 866 0 58 518
Total pay_$ 5653 2481 2475 890 1647 3074
Percentage of executive compensation
Salary_ 5653 296 183 165 251 382
Bonus_ 5653 197 148 97 177 268
Option grant_ 5653 283 235 67 256 445
Restricted stock grant_ 5653 141 180 00 41 249
Control variables
Size ($M) 5653 11086 27294 1017 2459 8117
Log(size) 5653 7985 1565 6925 7808 9002
Book-to-market 5653 0445 0287 0251 0388 0578
Leverage 5653 0202 0172 0038 0187 0309
Asset tangibility 5653 0806 0184 0691 0853 0965
Free cash flow 5653 0059 0091 0013 0059 0108
Cash holding 5653 0166 0172 0034 0100 0247
ROA volatility 5653 0056 0056 0021 0038 0070
Institutional ownership 5653 0753 0202 0639 0795 0910
Sales growth 5653 0121 0189 0028 0096 0183
Past stock return 5653 0094 0183 -0012 0094 0199
Loss indicator 5653 0164 0370 0000 0000 0000
This table presents summary statistics Panel A shows the descriptive statistics of payout variables compensation
variables and other firm characteristics for the full sample Accounting impact is the implied option expense
measured at fiscal year 2002 All other variables are measured at firm-year level from fiscal year 2003 to 2007
resulting in 5653 firm-year observations (except for Regular dividendTotal Payout which can be measured only
for the 4901 firm-year observations with Total payout greater than zero) Panel B shows the pairwise correlations
between main variables at firm-year level Panel C compares payout variables compensation variables and other
firm characteristics before and after FAS123R The Pre-FAS123R period consists of fiscal year 2003 and 2004
the Post-FAS123R period covers fiscal year 2005-2007 Panel D compares the trends of payout and compensation
variables around FAS123R across four quartile groups ranked by 2002 accounting impact Panel E compares the
trends of payout and compensation variables around FAS123R between the treated and control group under the
alternative treatment definition in Bakke et al (2015) (see Section 22) All variables are defined in Appendix The
notation and in Panel C indicates statistically significant at 10 5 and 1 level in T-tests for equal
means respectively
43
Pa
nel
B
Pea
rso
n c
orr
ela
tio
ns
Reg div
Repurchase
Total payout
Salary_
Bonus_
Option_
RS_
Log(size)
BM
Leverage
Tangibility
FCF
Cash holdingROA vol
Inst own
Sales growth
Past ret
urn
Loss
Reg
div
10
0
Repurc
hase
01
610
0
Tota
l payout
03
509
810
0
Sala
ry_
-0
10
-01
8-0
19
10
0
Bonus_
00
700
100
3-0
01
10
0
Option_
-0
10
00
900
6-0
41
-03
510
0
RS
_
01
000
901
0-0
32
-01
1-0
40
10
0
Log(s
ize)
03
101
802
3-0
56
01
101
202
210
0
BM
-02
1-0
28
-03
103
0-0
03
-02
000
0-0
33
10
0
Levera
ge
-00
1-0
08
-00
8-0
05
00
6-0
11
00
801
9-0
03
10
0
Tangib
ility
00
200
100
101
200
1-0
05
-00
6-0
12
-00
4-0
18
10
0
FC
F02
203
703
9-0
20
00
901
1-0
01
02
4-0
32
-02
1-0
16
10
0
Cash
hold
ing
-01
301
000
700
2-0
14
02
2-0
10
-02
3-0
16
-03
502
901
210
0
RO
A v
ol
-01
5-0
04
-00
700
4-0
11
01
9-0
11
-02
3-0
08
-01
101
2-0
02
03
910
0
Inst
ow
n
-00
901
401
1-0
17
00
200
701
200
7-0
01
00
3-0
08
01
4-0
06
-01
110
0
Sale
s gro
wth
-00
8-0
04
-00
6-0
15
00
501
0-0
02
00
7-0
16
-00
3-0
08
01
300
201
400
410
0
Past
retu
rn00
901
301
4-0
18
01
5-0
01
00
301
6-0
29
-01
000
102
7-0
14
-01
001
602
710
0
Loss
-02
0-0
19
-02
201
8-0
18
00
4-0
05
-02
601
901
300
6-0
41
01
702
3-0
16
-01
8-0
40
10
0
44
Panel C Firm characteristics - before and after FAS123R
Pre FAS 123R Post FAS 123R Difference
Payout variables
Regular dividendTotal assets 083 099 016
RepurchaseTotal assets 245 490 245
Total payoutTotal assets 328 589 261
Regular dividendTotal payout 3914 2790 -1124
Level of executive compensation (in $1000)
Salary_$ 426 463 37
Bonus_$ 418 505 87
Option grant_$ 896 707 -191
Restricted stock grant_$ 269 574 305
Total pay_$ 2263 2584 321
Percentage of executive compensation
Salary_ 305 293 -12
Bonus_ 186 204 18
Option grant_ 343 240 -103
Restricted stock grant_ 87 176 89
Control variables
Size ($M) 9671 11631 1960
Log(size) 7860 8035 0175
Book-to-market 0437 0453 0016
Leverage 0201 0203 0002
Asset tangibility 0822 0793 -0029
Free cash flow 0061 0057 -0004
Cash holding 0175 0159 -0016
ROA volatility 0067 0048 -0019
Institutional ownership 0712 0781 0069
Sales growth 0137 0108 -0029
Past stock return 0080 0101 0021
Loss indicator 0173 0159 -0014
45
Pa
nel
D
Fir
m c
ha
racte
rist
ics
by q
ua
rtil
e o
f a
cco
un
tin
g i
mp
act
- b
efo
re a
nd
aft
er
FA
S1
23
R
Accounting im
pact
(2002)
Num
ber
of
Fir
ms
Pre
Post
Pre
Post
Pre
Post
Pre
Post
Payout
vari
able
s
Regula
r div
idendT
ota
l ass
ets
11
2
12
4
09
4
11
1
09
5
11
3
03
0
04
9
Repurc
hase
Tota
l ass
ets
11
3
26
8
19
2
37
3
32
7
63
1
35
1
68
7
Tota
l payout
Tota
l ass
ets
22
4
39
1
28
5
48
4
42
2
74
4
38
1
73
6
Regula
r div
idendT
ota
l payout
643
7
469
8
474
0
341
1
284
5
195
4
82
5
74
5
Perc
enta
ge o
f executive c
om
pensa
tion
Sala
ry_
337
295
313
287
296
289
276
300
Bonus_
223
226
214
228
172
192
134
169
Option g
rant_
201
167
290
210
373
260
507
325
Rest
ricte
d s
tock g
rant_
116
194
98
180
89
176
43
155
294
294
294
294
1st Q
uart
ile2
nd Q
uart
ile3
rd Q
uart
ile4
th Q
uart
ile
01
2
03
5
09
3
55
1
46
Accounting impact
Number of Firms
By accounting impact quartile
1
2
3
4
Pre Post Pre Post
Payout variables
Regular dividendTotal assets 09 11 08 10
RepurchaseTotal assets 18 31 26 52
Total payoutTotal assets 28 43 34 62
Regular dividendTotal payout 428 357 386 265
Percentage of executive compensation
Salary_ 435 364 282 280
Bonus_ 226 214 179 202
Option grant_ 92 125 387 261
Restricted stock grant_ 125 188 80 174
Percentage of CEO compensation
Salary_(CEO) 485 364 260 259
Bonus_(CEO) 249 228 185 219
Option grant_(CEO) 10 127 406 275
Restricted stock grant_(CEO) 128 182 82 183
Panel E Firm characteristics by alternative treatment definition - before and
after FAS123R
Treated
25
19
997
223
250
256
268
10
177
71
Control
44
37
47
Table 2
Differential effect of FAS123R on the use of option-based compensation
Panel A Two-period first-difference regression
Prediction Coeff t-stat Coeff t-stat Coeff t-stat
Accounting impact rank - -0044 -628
Accounting impact rank=2 - -0044 -327
Accounting impact rank=3 - -0075 -468
Accounting impact rank=4 - -0140 -613
Treated - -0132 -875
ΔLog(size) 0061 202 0061 200 0063 214
ΔBook-to-market 0032 091 0032 092 0051 143
ΔLeverage -0157 -213 -0160 -218 -0111 -153
ΔAsset tangibility -0012 -014 -0020 -023 -0023 -026
ΔFree cash flow -0106 -095 -0108 -097 -0128 -117
ΔCash holding -0197 -211 -0193 -206 -0180 -194
ΔFive-year ROA volatility -0065 -031 -0056 -026 -0098 -047
ΔInstitutional ownership -0044 -091 -0043 -088 -0044 -092
ΔSales growth -0064 -102 -0065 -104 -0090 -153
ΔPast one-year stock return 0051 078 0052 080 0091 138
ΔLoss frequency 0056 207 0057 207 0047 179
Log(size) -0009 -210 -0009 -207 -0002 -035
Book-to-market -0015 -056 -0013 -049 0018 072
Leverage 0022 046 0023 048 0068 150
Asset tangibility 0033 077 0033 078 0053 128
Free cash flow 0227 202 0220 195 0127 117
Cash holding -0002 -004 0012 019 -0078 -141
Five-year ROA volatility -0451 -240 -0430 -228 -0509 -283
Institutional ownership -0123 -360 -0122 -359 -0100 -292
Sales growth -0041 -056 -0040 -055 -0089 -125
Past one-year stock return -0009 -015 -0006 -010 0078 125
Loss frequency 0055 174 0056 178 0054 173
Fixed effect
Standard error
Adj R-squared
Observations
Model (3)
Dependent variable ΔAvg Option grantTotal pay
Huber-White
0156
This table investigates whether the effect of FAS123R on the use of option-based pay varies with its potential accounting impact Panel A
reports the results of estimating three two-period first-differencing models where for each firm we average its characteristics in Pre- and
Post-FAS123R period The Pre-FAS123R period consists of fiscal year 2003 and 2004 the Post-FAS123R period covers fiscal year 2005-
2007 In all three specifications the dependent variable is the change of average Option grantTotal pay from Pre- to Post-FAS123R period
The main independent variable varies by model in Model (1) the Accounting impact rank is the quartile rank of implied option expensetotal
assets measured in 2002 (1=lowest 4=highest) In Model (2) Accounting impact rank=2 (3 4) is an indicator that takes value of one if the
firmrsquos Accounting impact rank equals 2 (3 4) In Model (3) we use an alternative treatment construction following Bakke et al (2015)
where Treated is an indicator that takes value of zero if the firm granted zero option to its CEO in both 2003 and 2004 or the firm began to
voluntarily expense option-based pay at fair value in 2002 or earlier and one otherwise For each control variable we include both its level in
the Pre-FAS123R period and its change across the two periods Panel B shows the results of estimating fixed effect models with firm-year
observations The dependent variable is the firm-year level Option grantTotal pay The main independent variables are the interactions of
Post-FAS123R indicator (Post) with Accounting Impact rank Accounting impact rank indicators and Treated respectively All models in
Penal A have industry fixed effects and the standard errors are Huber-White heteroscedasticity-consistent standard errors All models in
Penal B have firm fixed effects and year fixed effects and the standard errors are clustered at firm level All variables are defined in
Appendix The notation and indicates statistically significant at 10 5 and 1 level respectively
Model (1) Model (2)
11711171 1171
Industry Industry
Huber-White
0124
Huber-White
0123
Industry
48
Panel B Panel fixed effects regression
Prediction Coeff t-stat Coeff t-stat Coeff t-stat
Acc impact rank x Post - -0044 -807
Acc impact rank 2 x Post - -0046 -333
Acc impact rank 3 x Post - -0077 -526
Acc impact rank 4 x Post - -0137 -776
Treated x Post - -0145 -970
Log(size) 0034 221 0034 217 0036 229
Book-to-market 0018 084 0017 083 0015 070
Leverage -0004 -009 -0006 -013 -0007 -015
Asset tangibility 0007 012 0004 006 0011 018
Free cash flow -0074 -151 -0072 -146 -0078 -158
Cash holding -0048 -086 -0050 -090 -0006 -011
Five-year ROA volatility 0250 231 0239 219 0437 414
Institutional ownership 0043 159 0044 161 0041 150
Sales growth -0033 -168 -0034 -171 -0031 -158
Past one-year stock return 0067 221 0068 224 0063 204
Loss indicator 0023 209 0022 207 0024 222
Fixed effects
Standard error
Adj R-squared
Observations
Dependent variable Option grantTotal pay
5653 5653 5653
Clustered by firm
Firm Year
Clustered by firm
Firm Year
Clustered by firm
0523 0523 0526
Model (1) Model (2) Model (3)
Firm Year
49
Table 3
Effect of option-based compensation on dividend policy
Panel A Two-period first-difference regression
Prediction Coeff t-stat Coeff t-stat Coeff t-stat
Accounting impact rank + 0000 077
Accounting impact rank=2 + 0001 091
Accounting impact rank=3 + 0000 044
Accounting impact rank=4 + 0001 092
Treated + 0000 -026
ΔLog(size) 0000 -030 0000 -030 0000 -026
ΔBook-to-market -0002 -190 -0002 -193 -0002 -195
ΔLeverage -0002 -059 -0002 -057 -0002 -059
ΔAsset tangibility 0016 431 0016 429 0016 430
ΔFree cash flow 0017 373 0017 373 0017 375
ΔCash holding -0011 -288 -0011 -285 -0010 -282
ΔFive-year ROA volatility 0003 034 0002 032 0003 035
ΔInstitutional ownership -0002 -073 -0002 -073 -0002 -070
ΔSales growth -0001 -040 -0001 -037 -0001 -038
ΔPast one-year stock return 0002 077 0002 076 0002 070
ΔLoss frequency 0000 -048 0000 -045 0000 -046
Log(size) 0000 183 0000 182 0000 182
Book-to-market -0002 -227 -0002 -225 -0002 -284
Leverage -0001 -037 -0001 -039 -0001 -048
Asset tangibility 0003 179 0003 180 0003 176
Free cash flow 0017 291 0017 291 0017 300
Cash holding 0002 080 0002 077 0002 098
Five-year ROA volatility 0003 035 0002 033 0003 044
Institutional ownership -0001 -068 -0001 -068 -0001 -058
Sales growth -0004 -177 -0004 -175 -0004 -172
Past one-year stock return 0004 169 0004 167 0004 165
Loss frequency -0001 -111 -0001 -109 -0001 -102
Fixed effect
Standard error
Adj R-squared
Observations
Dependent variable ΔAvg Regular dividendTotal assets
This table investigates the causal effect of option-based pay on dividend policy by examining whether changes in dividend policy around
FAS123R vary with its potential accounting impact Panel A reports the results of estimating three two-period first-differencing models
where for each firm we average its characteristics in Pre- and Post-FAS123R period In all three specifications the dependent variable is
the change of average Regular dividendTotal assets from Pre- to Post-FAS123R period The main independent variable varies by model in
Model (1) the Accounting impact rank is the quartile rank of implied option expensetotal assets measured in 2002 (1=lowest 4=highest) In
Model (2) Accounting impact rank=2 (3 4) is an indicator that takes value of one if the firmrsquos Accounting impact rank equals 2 (3 4) In
Model (3) we use an alternative treatment construction following Bakke et al (2015) where Treated is an indicator that takes value of zero
if the firm granted zero option to its CEO in both 2003 and 2004 or the firm began to voluntarily expense option-based pay at fair value in
2002 or earlier and one otherwise For each control variable we include both its level in the Pre-FAS123R period and its change across the
two periods Panel B shows the results of estimating fixed effect models with firm-year observations The dependent variable is the firm-
year level Regular dividendTotal assets The main independent variables are the interactions of Post-FAS123R indicator (Post) with
Accounting Impact rank Accounting impact rank indicators and Treated respectively Panel C examines the intensity of dividend changes
among firms with nonzero dividend per share in 2003 or 2004 In particular we estimates the same three models as in Panel A(with the
same independent variables) but for five dependent variables the change of average Regular dividendTotal assets from Pre- to Post-
FAS123R period (as in Panel A) the percentage change of DPS (dividend per share) from Pre- to Post-FAS123R period and three
indicators denoting respectively whether the percentage change of DPS was greater than 20 40 and 60 Panel D reports four
robustness tests of the dividend intensity regression In each of them a set of possible confounding observations is removed (see Section 33
for details) Panel E compares the trends of dividend initiation and termination around FAS123R across four quartile groups ranked by
accounting impact All models in Panel A C and D have industry fixed effects and the standard errors are Huber-White heteroscedasticity-
consistent standard errors All models in Penal B have firm fixed effects and year fixed effects and the standard errors are clustered at
firm level All variables are defined in Appendix The notation and indicates statistically significant at 10 5 and 1 level
Industry Industry Industry
Model (1) Model (2) Model (3)
1171 1171 1171
Huber-White Huber-White Huber-White
0105 0104 0105
50
Panel B Panel fixed effects regression
Prediction Coeff t-stat Coeff t-stat Coeff t-stat
Acc impact rank x Post + 0000 122
Acc impact rank 2 x Post + 0001 110
Acc impact rank 3 x Post + 0001 094
Acc impact rank 4 x Post + 0001 129
Treated x Post + 0000 -012
Log(size) 0001 179 0001 179 0001 181
Book-to-market 0000 025 0000 024 0000 031
Leverage 0001 062 0001 064 0001 069
Asset tangibility 0009 360 0009 358 0009 363
Free cash flow 0002 090 0002 093 0002 092
Cash holding -0007 -295 -0007 -298 -0007 -298
Five-year ROA volatility 0001 041 0001 038 0000 -006
Institutional ownership 0000 -027 0000 -026 0000 -027
Sales growth 0000 053 0000 051 0000 044
Past one-year stock return 0001 089 0001 088 0001 078
Loss indicator 0000 -060 0000 -057 0000 -076
Fixed effects
Standard error
Adj R-squared
Observations
Dependent variable Regular dividendTotal assets
Model (1) Model (2) Model (3)
Firm Year Firm Year Firm Year
5653 5653 5653
Clustered by firm Clustered by firm Clustered by firm
0877 0877 0877
51
Panel C Intensity of dividend changes around FAS123R
Prediction Coeff t-stat Coeff t-stat Coeff t-stat
Accounting impact rank + 0000 065
Accounting impact rank=2 + 0000 048
Accounting impact rank=3 + 0000 026
Accounting impact rank=4 + 0002 080
Treated + 0001 063
Dependent var DPS pct change
Accounting impact rank + -0145 -072
Accounting impact rank=2 + 0018 006
Accounting impact rank=3 + -0177 -045
Accounting impact rank=4 + -0746 -100
Treated + -0407 -119
Accounting impact rank + 0029 095
Accounting impact rank=2 + 0040 074
Accounting impact rank=3 + 0092 139
Accounting impact rank=4 + 0008 007
Treated + -0007 -012
Accounting impact rank + 0024 076
Accounting impact rank=2 + 0047 088
Accounting impact rank=3 + 0079 114
Accounting impact rank=4 + -0003 -002
Treated + 0030 052
Accounting impact rank + 0030 098
Accounting impact rank=2 + 0078 155
Accounting impact rank=3 + 0085 130
Accounting impact rank=4 + 0014 012
Treated + -0006 -011
Control variables
Fixed effect
Standard error
Observations 572 572 572
Yes Yes Yes
Huber-White Huber-White Huber-White
Industry Industry Industry
Dependent var DPS pct
change gt60 indicator
Model (1) Model (2) Model (3)
Dependent var ΔAvg Regular
dividendAssets
Dependent var DPS pct
change gt20 indicator
Dependent var DPS pct
change gt40 indicator
52
Panel D Robustness tests for intensity of dividend changes around FAS123R
Prediction Coeff t-stat Coeff t-stat Coeff t-stat
Accounting impact rank + 0006 017
Accounting impact rank=2 + 0067 118
Accounting impact rank=3 + 0041 057
Accounting impact rank=4 + -0061 -049
Treated + 0022 035Observations
Accounting impact rank + 0009 027
Accounting impact rank=2 + 0058 106
Accounting impact rank=3 + 0032 043
Accounting impact rank=4 + -0032 -024
Treated + 0018 028
Observations
Accounting impact rank + 0030 089
Accounting impact rank=2 + 0039 071
Accounting impact rank=3 + 0122 168
Accounting impact rank=4 + -0063 -052
Treated + 0075 132
Observations
Accounting impact rank + 0008 023
Accounting impact rank=2 + 0023 042
Accounting impact rank=3 + 0048 064
Accounting impact rank=4 + -0042 -033
Treated + -0010 -016
Observations
Control variables
Fixed effect
Standard error
Exclude firms with stable
payout ratio from 2003 to 2004
506 506 506
Dependent variable DPS pct change gt40 indicator
Model (1) Model (2) Model (3)
Exclude voluntary expensers
519 519
Exclude firms in the top decile
of option reduction (02-04)
Exclude firms that accelerated
option vesting
504 504 504
517 517 517
519
Huber-White Huber-White Huber-White
Yes Yes Yes
Industry Industry Industry
53
Panel E Dividend initiation and termination rates around FAS123R
Pre FAS 123R
1 280 75 7 6 13 173
2 284 135 18 9 27 200
3 286 181 11 14 25 138
4 282 260 9 10 19 73
Total 1132 651 45 39 84 129
Post FAS 123R
1 275 63 4 4 8 127
2 280 116 9 9 18 155
3 276 152 9 3 12 79
4 263 223 5 1 6 27
Total 1094 554 27 17 44 79
Pre FAS 123R
1 280 205 2 0 2 10
2 284 149 7 1 8 54
3 286 105 0 0 0 00
4 282 22 0 0 0 00
Total 1132 481 9 1 10 21
Post FAS 123R
1 275 212 3 6 9 42
2 280 164 1 2 3 18
3 276 124 1 1 2 16
4 263 40 0 3 3 75
Total 1094 540 5 12 17 31
termination
in 2004
03-04
cumulative
03-04
cumulative
Quartile firms
with
dividend in
2004
termination
in 2005
termination
in 2006
05-06
cumulative
05-06
cumulative
Termination
Quartile firms
with
dividend in
2002
termination
in 2003
without
dividend in
2004
initiation in
2003
initiation in
2004
03-04
cumulative
03-04
cumulative firmsQuartile
firmsQuartile initiation in
2005
initiation in
2006
05-06
cumulative
05-06
cumulative
Initiation
without
dividend in
2002
54
Table 4
Effect of option-based compensation on repurchases
Panel A Two-period first-difference regression with total repurchase
Prediction Coeff t-stat Coeff t-stat Coeff t-stat
Accounting impact rank - 0002 122
Accounting impact rank=2 - 0002 071
Accounting impact rank=3 - 0005 123
Accounting impact rank=4 - 0007 102
Treated - 0014 365
Control variables
Fixed effect
Standard error
Adj R-squared
Observations
Panel B Two-period first-difference regression with net repurchase
Prediction Coeff t-stat Coeff t-stat Coeff t-stat
Accounting impact rank - 0003 166
Accounting impact rank=2 - 0002 051
Accounting impact rank=3 - 0006 165
Accounting impact rank=4 - 0009 137
Treated - 0010 300
Control variables
Fixed effect
Standard error
Adj R-squared
Observations
Panel C Two-period first-difference regression with repurchase adjusted for exercised options
Prediction Coeff t-stat Coeff t-stat Coeff t-stat
Accounting impact rank - 0001 056
Accounting impact rank=2 - 0002 062
Accounting impact rank=3 - 0007 172
Accounting impact rank=4 - -0001 -008
Treated - 0006 197
Control variables
Fixed effect
Standard error
Adj R-squared
Observations
Dependent variable ΔAvg RepurchaseTotal assets
This table investigates the causal effect of option-based pay on payout policy by examining whether the changes of repurchase around
FAS123R vary with its potential accounting impact Panel A reports the results of estimating three two-period first-differencing models
where for each firm we average its characteristics in Pre- and Post-FAS123R period In all three specifications the dependent variable is
the change of average RepurchaseTotal assets from Pre- to Post-FAS123R period The main independent variable varies by model in
Model (1) the Accounting impact rank is the quartile rank of implied option expensetotal assets measured in 2002 (1=lowest 4=highest)
In Model (2) Accounting impact rank=2 (3 4) is an indicator that takes value of one if the firmrsquos Accounting impact rank equals 2 (3 4)
In Model (3) we use an alternative treatment construction following Bakke et al (2015) where Treated is an indicator that takes value of
zero if the firm granted zero option to its CEO in both 2003 and 2004 or the firm began to voluntarily expense option-based pay at fair
value in 2002 or earlier and one otherwise Panel B reports the regressions with the change of Net repurchaseTotal assets as the
dependent variable and the same independent variable as in Panel A Panel C reports the regressions with the change of Adjusted
repurchaseTotal assets as the dependent variable and the same independent variable as in Panel A All models in Panel A B and C have
industry fixed effects and the standard errors are Huber-White heteroscedasticity-consistent standard errors All variables are defined in
Appendix The notation and indicates statistically significant at 10 5 and 1 level respectively
Model (1) Model (2) Model (3)
Yes Yes Yes
Industry Industry Industry
Huber-White Huber-White Huber-White
Dependent variable ΔAvg Net repurchaseTotal assets
1171 1171 1171
0238 0237 0245
Model (1) Model (2) Model (3)
Yes Yes Yes
Industry Industry Industry
Huber-White Huber-White Huber-White
Dependent variable ΔAvg Adjusted repurchaseTotal assets
0229 0229 0233
1171 1171 1171
Model (1) Model (2) Model (3)
Yes Yes Yes
Industry Industry Industry
Huber-White Huber-White Huber-White
0111 0112 0114
1168 1168 1168
55
Table 5
Effect of option-based compensation on payout mix
Panel A Two-period first-difference regression with total payout mix
Prediction Coeff t-stat Coeff t-stat Coeff t-stat
Accounting impact rank + 0006 028
Accounting impact rank=2 + 0018 045
Accounting impact rank=3 + -0001 -001
Accounting impact rank=4 + 0043 052
Treated + -0035 -094
Control variables
Fixed effect
Standard error
Adj R-squared
Observations
Panel B Two-period first-difference regression with net payout mix
Prediction Coeff t-stat Coeff t-stat Coeff t-stat
Accounting impact rank + -0002 -008
Accounting impact rank=2 + 0008 016
Accounting impact rank=3 + 0018 034
Accounting impact rank=4 + -0059 -055
Treated + -0050 -101
Control variables
Fixed effect
Standard error
Adj R-squared
Observations
0049 0043 0054
257 257 257
Industry Industry Industry
Huber-White Huber-White Huber-White
Dependent variable ΔAvg Regular dividendNet payout
Model (1) Model (2) Model (3)
Yes Yes Yes
0154 0151 0156
362 362 362
Industry Industry Industry
Huber-White Huber-White Huber-White
This table investigates the causal effect of option-based pay on payout mix for firms using both dividend and repurchase by examining
whether the changes of payout mix around FAS123R vary with its potential accounting impact Panel A reports the results of estimating
three two-period first-differencing models where for each firm we average its characteristics in Pre- and Post-FAS123R period In all three
specifications the dependent variable is the change of average Regular dividendTotal payout from Pre- to Post-FAS123R period The main
independent variable varies by model in Model (1) the Accounting impact rank is the quartile rank of implied option expensetotal assets
measured in 2002 (1=lowest 4=highest) In Model (2) Accounting impact rank=2 (3 4) is an indicator that takes value of one if the firmrsquos
Accounting impact rank equals 2 (3 4) In Model (3) we use an alternative treatment construction following Bakke et al (2015) where
Treated is an indicator that takes value of zero if the firm granted zero option to its CEO in both 2003 and 2004 or the firm began to
voluntarily expense option-based pay at fair value in 2002 or earlier and one otherwise Panel B reports the regressions with the change of
Regular dividendNet payout as the dependent variable and the same independent variables as in Panel A Panel A (Panel B) is based on
observations with nonzero regular dividend and repurchase (net repurchase) in both Pre- and Post-FAS123R period All models in Panel A
and B have industry fixed effects and the standard errors are Huber-White heteroscedasticity-consistent standard errors All variables are
defined in Appendix The notation and indicates statistically significant at 10 5 and 1 level respectively
Yes Yes Yes
Dependent variable ΔAvg Regular dividendTotal payout
Model (1) Model (2) Model (3)

3
scrutizined Given the relevance of payout choices to boards analysts and institutional investors
it is not likely that managers could easily modify payout policy to maximize personal wealth
without facing serious scrutiny Third the associations documented in earlier studies may reflect
the endogenous nature of executive pay A compensation contract is designed to mitigate agency
problems that manifest in various corporate policies This feature makes treatment assignment
(eg stock option grants) prone to factors that could affect both executive pay and payout policy
some of which may be unobservable and cannot be easily controlled for (the omitted variable bias
problem) For example a firm with a positive innovation opportunity shock may both choose a
low dividend level to preserve internal capital and grant executive stock options to induce risk
taking Furthermore executive pay may be the result of anticipated payout policy (the reverse
causality problem) For example if a board wants to raise dividends it may give the CEO a pay
package with fewer options and more (dividend-paying) restricted stocks (Aboody and Kasznik
2008) Different causal channels linking executive pay and firm payout possibly coexist and are
difficult to disentangle empirically As emphasized by Edmans and Gabaix (2015) the effects of
executive compensation in general have not been satisfactorily identified largely due to the
scarcity of valid instrumental variables
To address these problems we utilize the 2005 adoption of Financial Accounting Standard
123R (hereinafter FAS123R) as an exogenous shock to the use of option compensation 4
Previously firms were required to expense ESOrsquos intrinsic value at the grant date while disclosing
the fair value amount in footnotes (this amount is referred to as lsquoimplied option expensersquo) As most
ESO were granted at the money and thus with zero intrinsic value (Hall and Murphy 2002) firms
4 FAS123R was introduced in response to the Enron-type accounting scandals of 2001-2002 At that time many
observers argued that overly favorable reporting treatment had led to an excessive use of option-based compensation
(Hall and Murphy 2003) that lsquolsquoperversely created incentives to artificially inflate reported earnings in order to keep
stock prices high and risingrsquorsquo (Greenspan 2002) Thus it is reasonable to assume that FAS123R was exogenous with
respect to trends in payout policy
4
reported no expense in their income statements FAS123R required firms to expense ESO in the
income statement at fair value Consistent with FAS123R increasing the perceived cost of stock
options (Murphy 2013) various studies have documented a large decrease in the use of stock
options subsequent to its introduction (Carter Lynch and Tuna 2007) Hayes Lemmon and Qiu
(2012) report a decline in the median ratio of the value of option grants to total pay from 397 to
139 following FAS123Rrsquos implementation Such a sudden change in executive pay
composition is rare (Frydman and Jenter 2010) and thus provides a unique opportunity to
investigate its effect on payout policy
This setting has additional benefits as well One such benefit is that the decrease in ESO
predicts an increase in dividends Settings that predict a decrease in dividends are arguably less
powerful as firms are notoriously reluctant to cut dividends given the evidence of a negative
investorsrsquo reaction (Brav et al 2005)5 Also the period subsequent to FAS123R witnessed a
general increase in corporate payouts (Floyd Li and Skinner 2015) These factors all combine to
produce a powerful setting to detect a compensation-induced increase in dividends
While FAS123R created an exogenous shock to the use of option-based compensation a
major challenge to the research design remains The accounting standard is applied to all public
firms making it difficult to construct control groups To tackle this challenge our empirical
strategy exploits the idea that FAS123Rrsquos impact likely varies across different types of firms We
conjecture that firms facing a larger hit on their reported earnings (as measured by a higher implied
option expense in 2002 prior to FAS123R) will reduce option grants significantly more than other
firms Indeed in our sample option compensation as percentage of total executive pay drops from
507 to 325 for firms in the top quartile of implied option expense versus 201 to 167 for
5 Indeed association studies reporting a negative association between option-based pay and dividends frame the issue
in terms of lower dividend increases (ie repurchases substituting for future dividend increases in option-heavy firms)
rather than in terms of dividend decreases
5
firms in the bottom quartile Using this cross sectional variation our strategy is a difference-in-
difference design where the first difference is the adoption of FAS123R and the second is the pre-
event implied option expense effectively our proxy for the expected accounting-induced reduction
in option-based compensation The key identification assumption is that the level of implied
option expense (prior to the announcement of FAS123R) is not correlated with the potential future
change in payout variables in the absence of treatment (ie FAS123R) We discuss this
assumption further in Section 2
We perform our empirical tests using a sample of SampP 1500 firms between 2003 and 2007
a five-year event window surrounding the 2005 adoption of FAS123R In particular we estimate
the association between implied option expense measured in 2002 and thus prior to the event
window and the change in the average payout variables from the ldquoprerdquo (2003-2004) to the ldquopostrdquo
(2005-2007) period after controlling for known determinants of payout policy Across various
measures of dividend changes we do not find that firms with higher implied option expense
increased their dividends relative to firms with lower implied option expense both in the full
sample and in a sub-sample of firms that paid dividends prior to FAS123R Also among firms
that did not pay dividends prior to FAS123R those with higher implied option expense did not
experience a relative increase in the rate of dividend initiation This lack of an effect on dividend
payouts is remarkable given that the accounting-induced decline in option-based pay was
accompanied by a corresponding increase in restricted stock awards which generally pay
dividends Further we find no association between implied option expense and changes in the
level of repurchases or changes in the relative weights of dividends and repurchases
Our results are robust to using alternative measures of dividends and repurchases
employing a panel regression (rather than a first-difference regression) and excluding the year of
6
adoption 2005 They are also robust to excluding firms that may have taken actions in anticipation
of the expected adoption of FAS123R (eg voluntarily expensing options) Finally to further
address the lack of a control group we follow Bakke Mahmudi Fernando and Salas (2015) and
define control firms as those voluntarily expensing options and those issuing no options to the
CEO prior to FAS123R on the ground that these firms were likely unaffected by the new standard
Our inferences remain unchanged
Overall the evidence is not consistent with the prediction that option-based compensation
has a first-order causal impact on payout policy and suggests that the previously documented
associations perhaps reflect endogeneity rather than a causal influence Our findings should not be
viewed as denying that stock options provide an incentive to favor repurchases over dividends
Rather they suggest this incentive does not imply an unconstrained ability to change payout policy
in a self-serving way likely because of the visibility of payout policy and its relevance to boards
and institutional investors 6 In addition boards may compensate executives for the lack of
dividend-protection in other ways effectively neutralizing those incentives Notably our findings
are consistent with managersrsquo statements that lack of dividend-protection does not affect payout
decisions (Brav et al (2005) who highlight this stark contrast between their survey evidence and
the empirical associations in the literature)7 Our results also provide another explanation for the
persistent lack of dividend protection in executivesrsquo options boards are not concerned with its
6 Note that our results are not inconsistent with evidence that managers take actions to increase personal wealth in
settings where the level of scrutiny is lower (eg timing of option grants backdating Heron and Lie 2007) or where it
is harder for outsiders to detect personal motives (eg risk-taking activities that increase the value of options Bakke et
al 2015) 7 Only 106 of surveyed executives agree that lack of dividend protection may cause managers to favor repurchases
over dividends ndash the lowest level of support among all the questions in the survey Of course it is possible that
managers would not admit to the effect on their behavior but similar surveys have elicited candid responses For
example a large percentage of managers surveyed by Graham Harvey and Rajgopal (2005) admit that they would
sacrifice economic value to smooth earnings or to hit an earnings target
7
effect because they can mitigate it by directly monitoring payout choices andor adjusting
compensation packages
Our study contributes to a vast literature on the determinants of payout policy First while
many studies document an association between option-based pay and payout policy limited
attempts have been made to examine its causal nature8 Addressing this question will enhance our
understanding of temporal changes in payout policy such as the emergence of repurchases as
primary payout vehicle (Farre-Mensa et al 2014) and the recently observed lsquoresiliencersquo of
dividends (Floyd et al 2015) Using the plausible exogenous variation in ESO induced by
FAS123R our evidence calls into question the notion that option-based compensation is a first-
order driver of payout policy and challenges future research to consider alternative explanations
for the trends in corporate payouts Second we extend the research that examines how
institutional changes affect payout policy Most of these studies examine changes in dividend tax
rates (eg Chetty and Saez 2005 Brown Liang and Wesibenner 2007 Aboody and Kasznik 2008
Blouin Raedy and Shackelford 2011 Hanlon and Hoopes 2014) or in the information environment
(Hail Tahoun and Wang 2014) while we examine a new accounting standard that affected the
composition of executive pay
We also contribute to a recent stream of research that uses exogenous shocks to understand
the economic impact of option-based pay (Low 2009 Gormley Matsa and Milbourn 2013) Some
of these studies use FAS123R to examine the causal effect of option-based pay on risk-taking with
mixed findings (Chava and Purnanandam 2010 Hayes Lemmon and Qiu 2012 Bakke et al 2015
Chu and Ma 2015) We extend this research in two ways First we use FAS123R to examine the
8 A notable exception is Shue and Townsend (2014) who instrument change in option grants with predicted new
option grant cycle and find that dividend growth is slower in the first year of a new option grant cycle than other years
An important premise underlying this approach is that the outcomes respond almost instantaneously to the treatment
In this paper we are more concerned with the longer-term effects of ESO as payout tends to be sticky and may
respond to the treatment only gradually (Lambert et al 1989)
8
effect of option-based pay on a different yet important economic outcome payout policy Second
our metholodogy differs from prior studies in that it explicitly incorporates cross-sectional
variation in how firms were affected by FAS123R Future work may use this approach to examine
the effect of option-based pay on other corporate policies
Finally we extend the literature on how accounting rules impact a firmrsquos economic
behavior (eg Carter and Lynch 2003 Carter et al 2007 Bens and Mohanan 2008 Choudhary
Rajgopal and Venkatachalam 2009 Graham Hanlon and Shevlin 2011) as well as the literature on
the accounting treatment for stock options (Aboody 1996 Dechow Hutton and Sloan 1996
Aboody Barth and Kasznik 2004 Ferri and Sandino 2009)
2 Research Design
21 Empirical Strategy
It is commonly recognized that identifying the causal effects of executive compensation in
empirical studies is challenging (Edmans and Gabaix 2015) FAS123R provides a unique
opportunity to address this problem Aside from significantly reducing the use of option
compensation the accounting change should not in itself correlate with the outcomes of interest
(ie change in payout policy)9 However utilizing FAS123R is not easy because it affected all
US firms at the same time making it difficult to measure a counterfactual change around the
event based on a control group A simple before-after comparison of the outcome variable around
the adoption of FAS123R would assume that any change is driven entirely by the event of interest
(ie it would assume away any conterfactual trend in the outcome variable) a questionable
assumption An alternative strategy is to use the change in option-based compensation around
9 Hayes et al (2012) describes FAS123R as an exogenous change in the accounting benefits of stock options without a
change to the economic costs and benefits of stock options while Bakke et al (2015) describes it as causing a change
in executivesrsquo but not shareholdersrsquo incentives
9
FAS123R effectively assuming that such change is ldquoexogenousrdquo (eg Chava and Purnanandam
2010 Anantharaman and Lee 2014) The problem with this approach is that FAS123R per se did
not generate exogenous cross-sectional variation in option compensation Even if the introduction
of FAS123R is exogenous a firmrsquos response cannot be assumed to be entirely exogenous10
To identify the exogenous portion of firmsrsquo response to the new standard we make use of
evidence that FAS123Rrsquos impact on the use of option compensation varies with the firm-specific
expected accounting impact of the new rule as measured by the implied option expense disclosed
in the footnotes prior to FAS123R (Hayes et al 2012) The reduction in option usage is highest in
firms with the largest implied option expense Thus we can use the differential accounting impact
of FAS123R to overcome the problem of lacking control group
To validate our approach we estimate the following first-differencing regression with
ordinary lease square (OLS)
ΔOptioni = β0 + β1 Accounting Impacti + ΛControli +εi (1)
where ΔOptioni is the change in the average value of executive stock options as percentage of total
pay from the pre- to the post-FAS123R period Accounting Impacti is the implied option expense
measured prior to FAS123R (more details in Section 22) We expect β1 to be negative that is a
more pronounced reduction in option-based pay for firms with higher expected accounting impact
Next after validating the differential impact of FAS123R we examine the central question
of this study by estimating the following OLS regression
ΔPayouti = γ0 + γ1 Accounting Impacti + ΓControli +ui (2)
10 A universally assigned encouragement to receive treatment does not make the realization of treatment assignment
free from endogeneity concerns Consider the following example after the adoption of FAS123R firm A reduces the
weight of option-based pay by 20 and firm B by 40 A finding that firm B increases dividends compared to firm A
cannot be interpreted as evidence of a causal influence of option compensation on dividend policy This is because the
additional reduction in option compensation by firm B relative to firm A may not be driven by FAS123R It may
instead reflect an attempt to align executivesrsquo incentives with anticipated changes in dividend policy (reverse
causality) Without a way to incorporate the heterogeneous impact of FAS123R in the research design the cross
sectional variation in changes in option-based compensation is still subject to the usual endogeneity concerns
10
where ΔPayouti represents the change in the average value of one of the payout variables
of interest (described in Section 23) from the the pre- to the post-FAS123R period
Eq (2) is essentially a difference-in-difference approach to estimate the effect of option-
based pay on payout policy using the differential accounting impact of FAS123R to capture the
exogenous (accounting-induced) portion of the change in option-based pay If option-based pay
has a detectable causal effect on dividends (repurchases) in the direction predicted by the
literature γ1 should be positive (negative)
As noted by Bertrand Duflo and Mullainathan (2004) in difference-in-difference studies
with panel data OLS may yield inconsistent standard error estimates because the dependent
variable and the main independent variable tend to be serially correlated within firm To alleviate
this concern following Bertrand et al (2004) in both Eqs (1) and (2) we collapse the panel to a
single ldquoPrerdquo (2003-2004) and a single ldquoPostrdquo (2005-2007) period by averaging across years and
then measuring the changes from Pre to Post11 We choose 2003 as the starting period in order to
capture a period subsequent to the 2003 tax cut on individual dividend income While the
evidence on the effect of the tax cut on payout policy is mixed (Chetty and Saez 2005 Edgerton
2013 Floyd et al 2015) starting with 2003 allows the pre-FAS123R levels of the key variables to
reflect any effect of the tax cut 12 We end our analysis in 2007 to avoid the potentially
confounding effect of the 2008 financial crisis which had a significant impact on payouts (Floyd et
al 2015)13 Following Hayes et al (2012) and Bakke et al (2015) we include 2005 in the Post
11 In the collapsed two-period panel a regression of changes is equivalent to a regression of levels with firm-fixed
effects and an indicator for the Post period Both approaches obviate unobserved time-invariant firm heterogeneity
We choose first differencing equation for a more intuitive interpretation 12 The Jobs and Growth Tax Relief Reconciliation Act of 2003 was signed into law on May 28 2003 but had been
proposed on January 7 2003 and was made retroactive to the beginning of 2003 Chetty and Saez (2005) show that
the tax change affected dividend policy in 2003 13 In November 2006 the Securities and Exchange Commission required more details about the terms of performance-
based incentive plans We are not aware of any evidence that these rules affected the weight of option-based pay
11
period because FAS123R while effective in June 2005 was released in December 2004 14
Alternatively in untabulated tests we exclude 2005 from the analysis and obtain similar results
Another benefit of using a single Pre and Post period is that it is better suited than panel
data to the analysis of repurchases As noted by Skinner (2008) firms engaging in repurchases
tend to do so every other year thus the relation between repurchases and economic determinants is
stronger over two- or three-year periods than one-year periods Factors explaining the timing of
repurchases differ from those explaining their level and the year-to-year variation in repurchases is
not necessarily informative of changes in payout policy As we are not interested in the timing of
repurchases our approach seems to better capture ldquolong-runrdquo changes in payout policy However
for the analysis of dividends (which are generally paid every year and thus not subject to the
above problem) we also present the results using a panel regression with firm- and year-fixed
effects To alleviate the problem of serial correlation discussed earlier we cluster the standard
errors by firm
22 Accounting Impact
As noted earlier all firms were affected by FAS123R making it difficult to identify a
control sample To capture variation in the cross-sectional impact of FAS123R in Eqs (1) and (2)
we use Accounting Impacti defined as the implied option expense disclosed in the footnote of the
income statement for the 2002 fiscal year scaled by total assets (we obtain similar findings when
scaling it by revenues) We measure this variable in 2002 (ie before the Pre period) rather than in
2003 or 2004 to avoid any confounding effect from the expected adopion of FAS123R (see
discussion in Section 33) As this variable is highly skewed (see Table 1) we define it based on
(Gipper 2015) or had any effect on payout policy However we exclude 2007 from the Post period in robustness tests
Our inferences are unchanged 14 FAS123R was released in December 2004 effective as of the beginning of the first interim or annual reporting
period beginning after June 15 2005 Subsequently the SEC allowed a six-month deferral making the standard
effective for fiscal years beginning after December 15 2005
12
its quartile rank We also presents results with separate indicators for the top three quartiles in
order to better isolate the difference between top quartile (the most lsquotreatedrsquo group) and bottom
quartile (the least lsquotreatedrsquo group and thus closer to the notion of a control group)
An alternative way to address the issue of a lack of control group is suggested by Bakke et
al (2015) They argue that two sets of firms were likely lsquounaffectedrsquo by FAS123R (i) firms that
did not grant options to the CEO in 2003 and 2004 as in these firms FAS123R could not affect
CEO option pay and thus her incentives to make policy changes (ii) firms that were already
voluntarily expensing stock options as of 2002 (ie before FASB began discussions of the new
standard) as these firms would not face any additional accounting charge under FAS123R
Our approach offers a number of advantages First instead of collapsing all lsquonon-controlrsquo
firms in a single lsquotreatedrsquo group we exploit cross-sectional variation among treatment firms in
terms of the likely impact of FAS123R effectively using the most and least affected firms
(respectively top and bottom quartile of implied option expense) as treatment and control group
As shown in Table 1 the implied option expense is highly skewed (ie only a relatively small
number of firms was heavily affected by FAS123R) Capturing this variation is likely to increase
the power of the test Second in Bakke et al (2015) what matters is that the treatment definition
captures an accounting-driven change in CEO option grants as their focus is on CEO risk-taking
incentives In our setting we want to capture an accounting-driven change both in CEO option
grants (predicted to affect incentives to use dividends) and in the overall use of stock options
(predicted to affect the use of repurchases) As noted in Section 31 (see footnote 20) many firms
without CEO option grants in 2003 and 2004 were issuing options to non-CEO executives and
other employees and thus facing a potential accounting charge under FAS123R Third about half
of the firms without CEO option grants in 2003 and 2004 issued options to the CEO in the Post-
13
period Hence it is not clear that the control firms were truly unaffected by FAS123R Finally
the implied option expense in 2002 (our measure of the expected accounting impact) is a function
of option grants made in prior years when firms could not anticipate the adoption of FAS123R In
contrast option grant decisions in 2003 and 2004 may be affected by its anticipated adoption as
FASB added accounting for stock-based compensation to its agenda in March 2003
Notwithstanding the above arguments throughout our study we also present the results
using the definition of treatment and control in Bakke et al (2015) In particular we modify Eqs
(1) and (2) by replacing Accounting Impact with Treated an indicator equal to zero for the two
groups of firms identified as lsquocontrolrsquo in Bakke et al (2015) and one for all other firms
23 Payout Variables and Control Variables
Following Brown et al (2007) our baseline measure for changes in dividends is the change
in the DividendAssets ratiomdashcomputed as the regular cash dividends paid during the year scaled
by total assets at the beginning of the yearmdashfrom the Pre to the Post period15 However the
dividend-to-asset ratio is not what managers focus on when making dividend policy decisions
The stability of dividend per share (DPS) among dividend-paying firms (hereinafter payers)
suggests that managers do not target a specific dividend-to-assets ratio but rather a DPS level
(Baker and Wurgler 2016) Survey evidence confirms that executives make dividend policy
decision in terms of changes to the current level of DPS (Brav et al 2005) Therefore we also
examine the percentage change in the average DPS from the Pre to the Post period However this
measure can only be computed for the subset of payers (defined as firms with non-zero DPS in at
15 An alternative choice would be to scale dividends by the market value of equity essentially computing a dividend
yield However a drawback of using the dividend yield in our setting is that after controlling for time-invariant firm
characteristics through fixed effects or first differencing the variation of the ratio comes mainly from the denominator
the stock price (Baker and Wurgler 2004) Thus we choose the more stable book value of total assets as denominator
Also similar to other studies (eg Fenn and Liang 2001) we focus on regular dividends and exclude special dividends
as they are very rare and may introduce large noise to the dividend measures for few observations (DeAngelo
DeAngelo and Skinner 2000)
14
least one of the years of the Pre period) To provide insights into FAS123Rrsquos effect on dividend
policy for non-payers we examine the relation between our Accounting Impact variable and the
rate of dividend initations in the Pre and Post periods
Our main measure for repurchases is the change in RepurchaseAssetsmdashthat is the
aggregate amount of common stock repurchases made during the year scaled by total assets at the
beginning of the yearmdashfrom the Pre to the Post period In the empirical tests we examine
variations suggested in the literature
Finally as an alternative to examining dividends and repurchases separately we also look at a
measure of the payout composition the change in the DividendsTotal Payout ratio from the Pre to
the Post period (Total Payout is the sum of dividends and repurchases) effectively capturing any
substitution effect between dividends and repurchases 16 Examining the causal effect of the
change in option-based pay on payout composition is especially relevant if managers first target a
total payout and then choose the relative weight of dividends and repurchases In practice it is
unclear to what extent managers act this way (Brav et al 2005) Nonetheless for completeness we
also examine this variable We focus on the subsample of firms with both dividends and
repurchases in both Pre and Post period so as to capture changes in payout mix by firms routinely
using both vehicles to return cash to shareholders
As for the control variables in both Eqs (1) and (2) Controli is a vector of firm characteristics
identified in existent literature as determinants of payout policy (eg Fenn and Liang 2001 Brown
et al 2007 Skinner 2008 Cuny et al 2009) firm size book-to-market leverage asset tangibility
free cash flows cash holdings volatility in operating income institutional ownership sales
16 Fama and French (2001) suggest that repurchases are often complement to dividends while Grullon and Michaely
(2002) document that the increase in share repurchases over the past decades has come at the expense of a lower
increase in dividends consistent with a substitution hypothesis Brown et al (2007) also provide evidence of a
substitution effect in response to the 2003 dividend tax cut Survey evidence in Brav et al (2005) suggests an
asymmetric substitution effect with managers more willing to replace dividends with repurchases than the opposite
15
growth past stock returns and an indicator for loss firms For all of these variables we include
both changes from Pre to Post period and levels in the Pre period to allow for the possibility that
levels of these variables affect subsequent changes in payout policy 17 Finally we include
industry-fixed effects (Fama-French 48 industry indicators) to control for industry-level trends in
payout policies and option-based pay In unreported tests we replace free cash flows with two
separate variables operating profit and capital expenditures We also replace volatility in
operating income with volatility in stock returns Our results are unaffected More detailed
definitions of each variable are in the Appendix
24 Identification Assumption
The key identifying assumption underlying the difference-in-difference estimation
technique is that the parallel trends assumption is satisfied In the absence of treatment both
treated and control firms should experience parallel trends in the outcome variable Our approach
assumes that in the absence of FAS123R the change in dividends or repurchases would be the
same for high and low accounting impact firms Note that the well-documented contemporaneous
correlation between levels of option compensation (a key driver of the implied option expense and
thus the accounting impact) and levels of payout variables does not violate our identification
assumption This is because our assumption pertains to the relation between the level of option
compensation and future changes in payout variables
A specific concern is that options may be granted in anticipation of expected future
changes in payout policy (reverse causality problem) Relative to simple association tests this
concern is significantly reduced in our setting because the accounting impact is measured three
years prior to the arrival of treatment and is the result of option grants made over the prior four or
17 In untabulated analyses we run our tests after excluding changes in the control variables (ie including only their
pre-treatment levels) since in difference-in-difference studies controlling variables measured after the shock may
reintroduce selection bias Our inferences remain unchanged
16
five years depending on the vesting schedule18 For the reverse causality to be plausible the
implied option expense in 2002 (the result of option grants made approximately between 1998 and
2002) needs to reflect the anticipated change in payout policy in 2005-2007 This seems unlikely
While the parallel trend assumption is not directly testable similar to other studies (Bakke
et al 2015) we examine the trends in dividends and repurchases during the Pre period Figure 1
suggests that high and low accounting impact firms (respectively top and bottom quartile of
implied option expense) exhibit similar trends in payout variables in the Pre period ie from 2003
to 2004 More formally to examine the correlation between Accounting Impact and trends in the
payout variables during the Pre period we estimate the following regression only with
observations in 2003 and 2004
Payouti = γ0 + γ1 Accounting Impacti FY2004+ γ2 FY2004+ ΓControli +Firm FE +ui (3)
where Payouti is either DividendAssets or RepurchaseAssets FY2004 is an indicator of
fiscal year 2004 Firm FE indicates firm-fixed effects If firms with varying degrees of accounting
impact have different payout trends before the adoption of FAS123R γ1 should be different from
zero However for both payout variables we find that the estimated γ1 is close to zero and not
statistically significant at 10 level (untabulated tests) Overall the parallel trends assumption
seems reasonable in our setting
3 Empirical analyses
31 Sample Selection and Summary Statistics
Our sample is the SampP 1500 firms with available data on implied option expense (from
Compustat) and on executive compensation (from Execucomp) for at least one year in the Pre
18 The accounting treatment for stock options requires their fair value at the grant date to be recognized over the
service period (usually the vesting period) Hence the implied option expense in a given year includes a fraction of
the expense associated with past option grants
17
period and one year in the Post period to ensure consistency in the sample across periods Similar
to prior studies on payout policy (Fama and French 2001 Skinner 2008) we exclude financial
firms (SIC code between 6000 and 6999) and utilities (SIC between code 4900 and 4999) as well as
firms not incorporated in the US Our final sample includes 1176 firms19 We obtain dividend
and stock returns data from CRSP stock repurchases and dividend per share data from
COMPUSTAT and institutional ownership data from Thomson Reuters 13F database Other
control variables are from CRSP and COMPUSTAT To deal with outliers we winsorize all
continuous variables at 1 and 99 by fiscal year A detailed definition of all variables and their
sources is in Appendix
Table 1 Panel A presents summary statistics of the relevant variables for the pooled sample of
5653 firm-year observations Implied option expense in 2002 (our proxy for Accounting Impact)
is on average 173 of total assets with the median at 052 This suggests that the accounting
impact is very large for a small number of firms Over the entire sample period on average
dividends represent 093 of total assets while repurchases represent 394 Untabulated
analyses indicate that in 16 of the firm-year observations only dividends are paid out in 25
only repurchases in 32 both and in 27 neither Within the subset of firm-years with a payout
dividends represent 3874 of total payout This data confirms prior evidence that repurchases
have assumed the primary role as a vehicle to return cash to shareholders (eg Floyd et al 2015)
The mean (median) total executive pay (average across the top 5 executives) is $25 million ($16
million) On average option grants and restricted stock grants represent respectively 283 and
141 of total pay while salary and bonus comprise 296 and 197 respectively The
19 The results presented in the study are similar when (i) we restrict the sample to firms with available data for the
entire (2003-2007) sample period (1009 firms) and (ii) we exclude firms with CEO turnover in the Post period
(reducing the sample size to 780 firms) as a new CEO may have a different compensation package andor adopt a
different payout policy
18
composition of CEO pay (untabulated) is similar As for the control variables the figures are
generally consistent with other studies examining SampP 1500 firms over the same period
Panel B reports the pairwise Pearson correlations among the relevant variables The
correlations are in line with the associations documented in prior studies For example larger
firms and firms with higher profitability (free cash flows) have higher payouts loss firms have
lower payouts greater volatility in operating income is associated with lower dividends
More relevant to our analysis Panel C presents the mean of each variable in the Pre and Post
period for the full sample For each variable we first compute the firm-level mean over the Pre
and the Post Period and then compute the mean of the resulting figure across all firms There is a
striking increase in repurchases which double from 245 to 490 of total assets causing a
similar increase in total payout The increase in dividends is much smaller from 083 to 099
of total assets As a result for firms with positive payout dividends become a smaller fraction of
total payout in the Post period (2790 versus 3914 in the Pre period) This trend is consistent
with Floyd et al (2015) who document a dramatic increase in repurchases in the years leading to
the 2008 financial crisis Consistent with previous studies around FAS123R there is a significant
reduction in option grants as a fraction of total executive pay (from 343 to 240) and a
corresponding increase in the use of restricted stock (from 87 to 176) with little variation in
the weight of salary and bonus (note that restricted stock salary and bonus were expensed both
before and after FAS123R) Similar patterns hold for the composition of CEO pay (untabulated)
Compared to changes in the mix of executive pay changes in the levels of control variables are
generally less pronounced
Panel D reports the change in the key compensation and payout variables from the Pre to the
Post period by quartiles of implied option expense and yields a number of insights First
19
confirming the skewness suggested by Panel A the mean implied option expense is 551 for
firms in the top quartile versus only 093 035 and 012 for firms in the second third and
bottom quartile respectively Second as expected firms with higher implied option expense have
greater use of option-based pay For example in the Pre-period option pay represents 507 of
total executive pay at firms in the top quartile versus 201 in the bottom quartile Third and
more importantly for our research design the use of option pay changes significantly from the Pre
to the Post period as a function of the accounting impact For firms in the top quartile the
percentage of total pay represented by stock options drops by 182 (from 507 to 325)
versus 113 80 and 34 for firms in the second third and bottom quartile respectively The
decline in option usage across quartiles is accompanied by an increase in restricted stock grants
while the weight of salary and bonus shows little change It is important to emphasize the
substitution of stock options with restricted stocks because restricted stocks typically pay
dividends (Zhang 2013) thus providing further reason to expect a dividend increase in response to
the FAS123R-induced decline in option pay
As for the payout variables Panel D suggests that heavy option users (firms with higher
implied option expense) generally use repurchases more than dividends consistent with the
associations documented in earlier studies In the Pre period repurchases (dividends) represent
351 (030) of total assets for the top quartile versus 113 (112) for the bottom quartile
Panel D also indicates that the increase in repurchases documented in Panel C takes place across
all quartiles As for the (much smaller) change in dividends the absolute increase is similar across
the four quartiles though the relative increase (the percentage change) appears to be slightly
higher in the top quartile Overall these figures do not suggest a shift toward dividends and away
from repurchases by firms with a large (accounting-induced) decline in the use of option pay
20
Panel E presents the same data as Panel D but based on the definition of lsquotreatmentrsquo and
lsquocontrolrsquo in Bakke et al (2015) Under this definition 997 firms are classified as treatment group
and 177 as control (171 firms are classified as lsquocontrolrsquo because they did not grant options to the
CEO in the Pre period and 6 because they were voluntarily expensing options before 2003)
Interestingly lsquotreatedrsquo firms are equally distributed across the quartiles suggesting significant
variation in the degree of treatment As discussed earlier one benefit of our approach is that it
exploits cross-sectional variation among treatment firms in terms of the likely impact of FAS123R
Also 40 of the control firms (71 out of 177) are in the lowest quartile while 35 ((37+25)177)
are in the top two quartiles reflecting the different focus of the two approaches in terms of
identifying firms less affected by FAS123R20
As for payout and compensation variables Panel E shows that the treated group experiences a
larger increase in repurchases than the control group while the (less pronounced) increase in
dividends is similar across treated and control firms Treated firms experience a 126 decrease in
option pay (from 387 to 261) with a corresponding 94 increase in the weight of restricted
stock grants (from 80 to 174) The figures are similar at the CEO level (because the
classification is based on options grants to the CEO it is useful to report pay figures at both the top
5 executives and the CEO level) Interestingly the control group experiences a pronounced
increase in the weight of option grants in total CEO pay from 10 to 127 as almost half of the
control firms issued options to their CEOs in the Post period (for these firms options as percentage
of total CEO pay increased from 0 to 254 untabulated analysis) While this increased use of
stock options suggests (ex post) that these firms were not concerned with the impact of FAS123R
another possibility is that the lack of use of option compensation for CEOs in 2003 and 2004 was
20 In untabulated analysis we find that 55 of the 171 firms issuing no options to the CEO in the Pre period granted
options to the other top executives (and perhaps to other non-executive employees) thus explaining the relatively high
implied option expense for the control group (10 versus 19 for the treatment group ndash see Panel E)
21
temporary rather than the effect of a permanent policy If these firms were planning to issue
options to the CEO in the Post period the assumption that they were unaffected by FAS123R (and
thus their use as control sample) is questionable21
32 Differential Impact of FAS123R on the Use of Option-Based Compensation
An important building block of our approach is the presumed differential impact of FAS123R
on option-based pay as a function of pre-existing implied option expense22 While Table 1 Panel
D preliminarily supports the validity of this assumption we formally examine it by estimating Eq
(1)
As reported in Table 2 Panel A we find a significant negative association between Accounting
Impact and the change in option-based pay around the adoption of FAS123R In column (1)
where we use the quartile rank of implied option expense the -0044 coefficient implies that
around FAS123R option grants over total pay decline by 44 as we move from the highest
quartile to the next Thus the reduction in top quartile firms is 132 larger than in bottom
quartile firms In column 2 we replace the quartile rank with three indicators for the highest
quartiles (with the bottom quartile collapsed in the intercept) so as to be able to compare directly
top and bottom quartile without imposing the same effect across quartiles The negative and
significant coefficient on the top quartile indicator at -0140 suggests that the reduction in option
grants over total pay is 140 larger for top quartile firms relative to bottom quartile firms
Finally in column 3 we use the indicator for treated firms following Bakke et al (2015) The
21 Panel E also shows an increase in the use of restricted stock in CEO pay packages (from 128 to 182 almost
comparable to the increase among treated firms) The concurrent increase in options and restricted stock suggests
these firms would have increased option pay significantly more had it not been for FAS123R indicating further
caution in classifying them as control group of unaffected firms 22 This is akin to the relevance assumption of instrumental variable if we interpret the implied option expense as an
instrument to the change in option-based pay
22
negative and significant coefficient at -0132 suggests that treated firms experience a 132
larger drop in the weight of option pay relative to control firms
In Panel B we re-estimate Eq (1) using a panel regression with firm- and year-fixed effects
(5653 firm-year observations) where the dependent variable is the the ratio of option grants to
total executive pay The results are virtually identical in terms of significance and magnitude of
the coefficients of interest (the interaction terms between respectively Accounting impact and
Treated and an indicator for the Post period)
Overall Table 2 suggests that high implied option expense and the introduction of FAS123R
together strongly encouraged firms to cut back option-based compensation for executives It also
supports the general validity of the approach in Bakke et al (2015) in identifying firms most
affected by FAS123R notwithstanding the concerns outlined earlier
Our test of Eq (1) focuses on executive stock options For our dividend-protection hypothesis
it is important to establish that the level of implied option expense predicts a change in executive
stock options (rather than only a change in the use of non-executive employee stock options) as we
want to capture the effect of a change in executivesrsquo incentives on payout policy At the same
time our dilution channel hypothesis assumes a change in the use of all (executive and non-
executive employee) stock options Thus in untabulated analyses we repeat the test in Eq (1) by
replacing the dependent variable with the change in the number of options granted to all
employees (scaled by the total number of outstanding shares note for this analysis we can only
use data from 2004 to 2007 because Compustat began reporting data on ESO in 2004) The
coefficient on Accounting Impact and Treated continues to be negative and significant suggesting
that the differential reduction in the use of option compensation as a function of accounting impact
23
occurred for both executive and non-executive employee stock options Indeed Brown and Lee
(2011) report a similar decrease in executive and employee stock options around FAS123R
33 Option-Based Pay and Dividend Payouts
In this section we examine the effect of an exogenous (accounting-induced) change in option
compensation on dividend policy by estimating Equation (2)
Table 3 Panel A presents the results using the change in dividends from Pre to Post as
dependent variable We find no significant association between Accounting Impact (column 1 and
2) or Treated (column 3) and the change in dividends around the adoption of FAS123R This is in
stark contrast with the negative effect of option-based pay on dividends predicted in the literature
and documented in various association studies
One concern with this lack of effect is that perhaps our setting is not powerful enough to detect
it One way to examine this possibility is the following The coefficient on Accounting Impact
rank=4 in column 2 is 0001 and the standard error (SE) is 00009 Assuming the estimated
standard error is correct then for a two-tailed t test the coefficient needs to be greater than 00015
(=SE1645) or 015 to reach the 10 percent significant level In other words if moving from
the bottom to the top quartile (which predicts a 14 differential decline in option based pay as per
Table 2 Panel A) resulted in a 015 increase of the dividendasset ratio our test would be able to
detect a causal effect of option-based pay on dividends Given the unconditional mean of the
dividendasset ratio at 093 an increase of 015 from the Pre to the Post period seems
plausible In fact the average increase from the Pre to the Post period is 016 (Table 1 Panel C)
Thus if an effect was there our test should detect it
24
Panel B presents the results using a panel regression (5653 firm-year observations) with firm-
and year-fixed effects and interaction terms between Accounting Impact (or Treated) and an
indicator for the Post period Our inferences are unchanged
These analyses are based on our full sample which includes both dividend-paying and non-
dividend-paying firms Hence they implicity treat as equal two potentially different decisions to
initiate dividends and to increase dividends For example an increase in the dividend-to-asset
ratio from 05 to 06 will be treated the same as an increase from 00 to 01 even though
the latter represents a critical dividend initiation decision23 To address this following Chetty and
Saez (2005) we separately examine how FAS123R impacts the intensity of dividend changes (for
the subset of payers) and the likelihood of dividend initiations (for the subset of non-payers)
331 Option-Based Pay and Dividend Payouts Intensity of Dividend Changes
In the first row of Panel C we repeat the analysis in Panel A for the sub-sample of 572 payers
defined as firms with positive DPS in 2003 andor 2004 Note that we report only the coefficients
of interest for parsimony In the second row we replace the dependent variable with the
percentage change in DPS DPS is the choice variable for managers (Brav et al 2005 Baker and
Wurgler 2016) and thus our preferred measure to capture changes in dividend policy To account
for skewness in this variable (Khale 2002) in the third fourth and fifth rows we use indicator
variables to denote whether the change in DPS surpasses a threshold respectively 20 40 and
60 The proportion of firms that surpass these thresholds are 59 44 and 33 respectively24
23 Initiating dividends is a critical decision for boards given the pre-commitment value that investors attach to this
decision and the strong negative market reaction when firms eliminate or reduce dividends (Brav et al 2005) For
executives trying to maximize the value of their own stock options (dividend-protection argument) the ability to
influence a dividend initiation decision is likely lower than the ability to influence a dividend increase decision 24 Although in the third fourth and fifth rows our dependent variable is a binary variable we use a linear model (OLS)
instead of a probit or logit nonlinear model The reason is that estimating fixed effects in binary response models with
panel data can cause the incidental parameters problem The coefficient estimates can be biased when the panel data
25
Across all of these specifications we find no association between Accounting Impact or Treated
and the intensity of dividend changes Thus it does not appear that an exogenous reduction in
option-based pay caused dividend-paying firms to increase dividends
In Panel D we perform four robustness tests For parsimony we show only the coefficients of
interest and only the cases where the dependent variable is an indicator denoting a greater than
40 increase in DPS The results are similar for the other four ldquointensityrdquo dependent variables
reported in Panel C
In the first row we exclude firms that began to voluntarily expense options in 2003 or 2004
(84 firms of which 68 are dividend payers) FASB added accounting for stock-based
compensation to its agenda in March 2003 and issued an Exposure Draft proposing the expensing
of stock options at fair value in March 2004 In anticipation a number of firms began to
voluntarily expense stock options in 2003 and 2004 (Aboody et al 2004) If these firms reduced
option grants and as a result increased dividends during the Pre period then their inclusion may
reduce the power of our tests and thus our ability to detect the hypothesized relation25
In a similar spirit in the second row we exclude firms in the top decile in terms of reduction in
the ratio of option grants to total pay for the top 5 executives between 2002 (the year prior to the
Pre-period) and 2004 (the end of the Pre-period) This encompasses 113 firms of which 55 are
dividend payers If these firms reduced option grants in anticipation of FAS123R and as a result
increased dividends during the Pre period their inclusion may reduce our ability to detect the
hypothesized relation
has a large number of observations but a short time series Examples of studies making a similar choice are Puri
Rocholl and Steffen (2011) and Chu and Ma (2015) 25 This is unlikely to be a serious concern as previous studies suggest that voluntary expensers made limited use of
stock options (Aboody et al 2004) In fact in our sample 79 of these firms are in the bottom two quartiles of
implied option expense (untabulated) Nonetheless we present this test for robustness
26
In the third row we exclude firms that accelerated the vesting of options before FAS123R
became effective in order to avoid recognizing an expense for the unvested portion of these
options (Choudhary et al 2009 Balsam Reitenga and Yin 2008) This encompasses 196 firms of
which 54 are dividend payers If accelerating vesting was used to reduce the impact of FAS123R
the inclusion of these firms may reduce the power of our tests26
In the fourth row we deal with the concern that if firms target a fixed dividend to net income
ratio (Lintner 1956) and do so without adjusting for changes in accounting standards then by
decreasing net income (via option expense) the accounting change would mechanically cause a
reduction in dividends This would potentially offset and confound the increase predicted under
the dividend-protection and dilution hypotheses This seems unlikely for two reasons First firms
are notoriously reluctant to cut dividends (Brav et al 2005) Hence it seems unlikely that they
would reduce dividends in response to a decline in net income with no economic or cash flow
implications (ie re-classification of an expense from the footnotes to the income statement)
Second firms today set dividends in terms of dividend per share rather than by targeting a net
income-based payout ratio (Brav et al (2005)) As noted by Skinner (2008) over the last few
decades as earnings have become more variable the relation between earnings and dividends has
become weaker with dividend payments increasing smoothly and largely independent of the
variation in earnings Nevertheless in the fourth row we exclude the 66 dividend-paying firms that
26 These firms explicitly stated that they accelerated the vesting of stock options to avoid the accounting charge
(Choudhary et al 2009) In fact 72 are classified in the top two quartiles of implied option expense (untabulated)
Thus we would have predicted these firms to experience a significant decline in option pay To the extent that this
decline did not materialize because they minimized the impact of FAS123R by accelerating vesting the ability of
Accounting Impact to predict the reduction in option pay and thus its usefulness in examining changes in dividends
around FAS123R may be reduced The list of firms accelerating vesting was kindly provided by Jack Ciesielsky of
The Analystsrsquo Accounting Observer
27
had a similar payout ratio in 2003 and 2004 as a proxy for firms with a target net income-based
payout ratio in the Pre period27
As shown in Panel D even after excluding these subsets of firms we continue to find no
association between Accounting Impact or Treated and changes in dividends for dividend-paying
firms This is inconsistent with a causal influence of option compensation on dividend policy
Another concern is that by reducing net income and thus retained earnings FAS123R
may have pushed some firms closer to violating dividend covenants in debt contracts and
thus prevented them from increasing dividends This would bias our study against finding a
causal effect of option-based pay on dividends However this does not appear to be a
significant concern for three reasons First the recognition of an option expense does not
imply a decline in net income In fact more than 70 (75) of the full sample firms
(dividend payers) experienced an increase in net income before extraordinary items from
2004 to 2005 (the percentages are similar across the four quartiles of implied option
expense) Second dividend covenants are less common among dividend-paying firms
(Nikolaev 2010) Third most loan contracts in recent years give parties the option to
ldquofreezerdquo GAAP when facing a mandatory change in accounting principles (Christensen and
Nikolaev 2009) Firms expecting an adverse impact of FAS123R on their dividend covenants
would likely exercise this option (particularly given the non-cash nature of option-based
expense) Nonetheless to alleviate this concern we perform three additional analyses
(untabulated) (i) we repeat the tests in Panel C after excluding firms with a drop in net
income between 2004 and 2005 (ie firms that perhaps faced some covenant-related
27 We define a ldquosimilarrdquo payout to be an absolute change in payout ratio of less than 1 from 2003 to 2004 Among
these 66 firms only 39 continued to have a similar payout ratio in 2005 We also try an alternative definition where
a firm is classified as likely to be using a net income-based target payout ratio if the absolute percentage change in the
ratio from 2003 to 2004 is less than 10 (100 firms) Our inferences are unchanged
28
constrains to their payout policy as a result of FAS123R) (ii) we explicitly control for net
income and retained earnings in the regression (as in Skinner 2008) (iii) we repeat the tests
in Panel C for dividend payers with dividendsasset ratio above the sample median on the
basis that dividend covenants are less frequent among firms paying large dividends (Jung
Lee and Yang 2016) Our inferences are unchanged
332 Option-Based Pay and Dividend Payouts Dividend Initiations
In this section we examine whether the accounting-driven change in option pay affected
dividend initiations among non-payers We cannot employ the difference-in-difference approach
adopted so far by definition the same firm cannot initiate dividends in both periods However we
can provide suggestive evidence as follows First we take all firms that did not pay dividends in
2002 and group them into quartiles based on 2002 implied option expense For each quartile we
find the number of firms initiating dividends in 2003 and 2004 (the Pre period) Next we take all
firms that did not pay dividends in 2004 group them into quartiles based on 2002 implied option
expense and for each quartile find the number of firms initiating dividends in 2005 and 2006 (the
Post period) We do not include 2007 so as to have the same number of years in both periods and
make the cumulative initiation rates comparable
The left portion of Panel E reports the results of this exercise There is a general decrease in
the dividend initiation rate from the Pre to the Post period This holds both in the full sample of
non-payers (from 129 to 79) and across all quartiles This decrease may reflect a temporary
spike in 2003 and 2004 in response to the 2003 dividend tax cut documented in Chetty and Saez
(2005) It is noteworthy that initiation rates in both periods are lower among firms with higher
implied option expense This is consistent with option-heavy firms being mostly high-growth
firms less inclined to pay dividends More relevant to our research question if the lower use of
29
option compensation increased the propensity to pay dividends we would expect to see a relative
increase (ie a lower decrease) in dividend initiations among firms with the highest accounting
impact Instead the rate does not differ depending on the accounting impact There is
approximatley a 5 decline in initiation rate in each quartile In the right portion of Panel E we
examine similar data for dividend terminations While the results should be interpreted with
caution due to their rarity firms with higher accounting impact do not experience a greater decline
in termination rates Our inferences in Panel E are similar when we compared treated and control
firms following Bakke et al (2015) (untabulated)
Even after taking into account the different nature of decisions for dividend paying and non-
dividend-paying firms we fail to find evidence of a causal influence of option-based compensation
on dividend policy This finding is in contrast to the associations documented in earlier studies It
is even more remarkable as most firms replaced stock options with restricted stock which are
generally dividend-protected and should provide further incentive to increase dividends28
34 Option-Based Pay and Repurchases
In this section we examine the effect of an exogenous (accounting-induced) change in option
compensation on repurchases by estimating Equation (2)
Table 4 Panel A presents the results using the change in repurchases (scaled by total assets)
from Pre to Post as a dependent variable If the use of option-based pay had a positive effect on
firmsrsquo propensity to engage in repurchases as posited by the dividend-protection and dilution
hypotheses we should find a negative association between Accounting Impact or Treated and
repurchases Firms with a higher (accounting-driven) reduction in option-based pay should reduce
28 In a sample of SampP 500 firms between 2000 and 2009 Zhang (2013) reports that 80 of the firms granting
restricted stocks offer dividend protection In that sense the FAS123R-induced shift from stock options to restricted
stock may be characterized as a ldquoshockrdquo to dividend protection in unearned equity pay Accordingly our results cast
doubt on the causal interpretation of the positive association between dividend protection and dividend payouts
documented in prior studies (Zhang 2013 Burns et al 2015 Minnick and Rosenthal 2015)
30
the use of repurchases either because they are shifting toward a greater use of dividends andor
because they have a lower need to offset the dilutive effects of stock options However we find no
significant association between Accounting Impact (columns 1 and 2) and the change in
repurchases around the adoption of FAS123R When we use the Treated indicator (column 3) we
find a significant positive association rather than a negative one In Panel B we repeat the analysis
using net repurchases (ie repurchases after removing the effect of share issuances) following
Fama and French (2001) and Skinner (2008) Our inferences are unchanged29
This test is subject to two important caveats The first is we may not detect a decline in
repurchases because in the Post period firms need to offset the exercise of options that were
granted during the Pre period That is a post-FAS123R reduction in grants may not (yet) translate
into a reduction in exercises during the Post period which reduces our ability to test the dilution
hypothesis (ie that firms repurchase shares to offset exercises)30 However we can examine a
variation of this hypothesis where firms use repurchases to manage the effect of unexercised
options on diluted EPS (Bens et al 2003) To do so in Panel C we use a measure of adjusted
repurchases where we subtract our estimate of repurchases undertaken to offset the exercise of
ESO31 We effectively test whether firms experiencing an accounting-induced decrease in option
grants engage in less repurchases (net of exercise-driven repurchases) because their need to
manage the effect of unexercised options on diluted EPS is lower However the coefficient on
the variables of interest is either insignificant or positive inconsistent with the hypothesis
29 In the case of repurchases we do not examine separately ldquoinitiationsrdquo and ldquointensityrdquo as we do for dividends
because initiation is not clearly defined for repurchases Unlike dividends the occurrence of a repurchase in a given
year (or the lack thereof) cannot be used to infer a general policy due to the more discretionary nature of the timing of
repurchases 30 To capture the effect of lower option-based compensation on option exercises and thus on repurchases we would
ideally extend the Post period beyond 2007 However as noted by Floyd et al (2015) repurchases declined
dramatically after 2007 because of the financial crisis making it difficult to detect the effect of any other factor 31 As upper bound estimate of exercise-driven repurchases we multiply the number of ESO exercised during the year
times the average stock price during the year Since the number of ESO exercised is available in Compustat starting in
2004 Panel C is based on observations from 2004 to 2007
31
A second important caveat is that most firms replaced stock options with restricted stock
(Table 2 Panel C) Unvested restricted stock is excluded from the denominator in the computation
of basic EPS (once vested it is included) However it is included in the denominator of diluted
EPS using the treasury stock method similar to stock options Given the complexity of this
method without access to all details of restricted stock grants and option grants it is difficult to
determine whether the switch from stock options to restricted stock decreased the need for
dilution-driven repurchases as our test implicitly assumes Hence it is possible that we do not find
a decrease in repurchases because a reduced need to offset the dilutive effect of stock options was
neutralized by an increased need to offset the dilutive effect of restricted stock
Subject to the above caveats the evidence in Table 4 is not consistent with a positive causal
relation between the use of option-based pay and repurchases More precisely it suggests that
option-driven dilution concerns do not have a first-order effect on the magnitude of repurchases
even though they may play a role in the repurchase decision Hence our result is not necessarily
in conflict with the evidence in Brav et al (2005) where two-thirds of the surveyed financial
executives state that offsetting the dilutionary effect of stock option plans or other stock
programs is an important factor to their repurchase decisions
35 Option-Based Pay and Payout Composition
As an alternative to examining dividends and repurchases separately we also look at the
payout composition the change in the DividendsTotal Payout ratio from the Pre to the Post period
where Total Payout is the sum of dividends and repurchases As noted earlier we focus on the
subsample of firms with both dividends and repurchases in both Pre and Post periods so as to
capture the change in payout mix by firms routinely using both vehicles to return cash to
shareholders If the use of option-based pay causes firms to substitute repurchases for dividends
32
we should find a positive association between Accounting Impact or Treated and the payout mix
defined as DividendsTotal Payout ratio Firms with a higher accounting-driven reduction in
option-based pay should have an increase (decrease) in the relative weight of dividends
(repurchases) to the total payout However as reported in Table 5 Panel A we fail to find a
significant association between Accounting Impact (column 1 and 2) or Treated (column 3) and
the change in payout mix The results are similar when we use Net Payout (dividends plus net
repurchases) instead of Total Payout in computing the payout mix (Panel B)
Overall the combined evidence in Tables 3-5 does not support the hypothesis that option-
based compensation has negative (positive) effect on dividends (repurchases) or that it causes
firms to replace dividends with repurchases
4 Conclusion
Prior literature has documented robust associations between option-based compensation and
payout policy yet it remains unclear whether this association reflcts a causal influence We
investigate the causal effect of option-based compensation on payout policy using the adoption of
FAS123R which resulted in a significant decrease in option grants making it a plausible
exogenous shock to the use of option-based pay To overcome the challenge of no control group
we exploit the fact that firms responded differently depending on the firm-specific accounting
impact as measured by the implied option expense disclosed in the footnotes prior to FAS123R
Firms with larger expected accounting impact curtailed option-based compensation much more
aggressively than firms with lower impact Using a sample of SampP 1500 firms we find no
evidence that firms with a larger accounting-induced decline in option compensation increased
dividends reduced repurchases or changed their payout composition contrary to the widely held
belief that option-based pay has a causal influence on payout policy
33
Appendix Variable Definitions and Data Sources
Accounting Impact Variables
Accounting impact Implied option expense (Compustat XINTOPT) divided by total assets
(Compustat AT) This variable is measured at fiscal year 2002 and is time-invariant
Accounting impact rank The quartile rank of Accounting impact (1=lowest 4=highest)
Payout Variables
Regular dividendTotal assets The numerator is total regular cash dividends in the fiscal year
from the distribution dataset in CRSP Regular cash dividends are identified by the distribution
codes 1212 1222 1232 or 1242 The denominator is one-year lagged total assets (Compustat
AT)
DPS Dividend per share (Compustat DVPSX_F)
DPS pct change The percentage change of average DPS from Pre- to Post-FAS123R period
DPS pct change gtX indicator A dummy variable that equals one if DPC pct change is greater
than X and zero otherwise
RepurchaseTotal assets The numerator is the repurchase of common equity which equals total
repurchase (Compustat PRSTK) minus the change in preferred stock redemption value
(Compustat PSTKRV) The denominator is one-year lagged total assets (Compustat AT)
Net repurchaseTotal assets Net repurchase removes the effect of share issuances The
construction follows Fama and French (2001) and Skinner (2008) if the firm uses the treasury
stock method for repurchase net repurchase equals the increase in common treasury stock
(Compustat TSTKC) if the firm uses the retirement method (when common treasury stock is zero
in the current and prior year) net repurchase equals total repurchases minus stock issuance
(Compustat SSTK) and change in preferred stock redemption value (Compustat PSTKRV)
When the above measures give negative value net repurchase is set to zero
Adjusted repurchaseTotal assets Adjusted repurchase removes from total repurchase the potential
effect of repurchasing exercised options This variable equals total repurchase of common stocks
minus the product between the number of options exercised (Compustat OPTEXD) and average
stock price during the year When the above measure gives negative value adjusted repurchase is
set to zero Since the number of options exercised is not available before 2003 we drop
observations in 2003 when we use this variable
34
Total payoutTotal assets the sum of Regular dividendTotal assets and RepurchaseTotal assets
Regular dividendTotal payout regular cash dividend divided by the sum of regular cash dividend
and repurchase from common equity In the two-period analysis (Pre- vs Post-FAS123R) we
separately sum the numerator and the denominator for each firm-period and then calculate the ratio
Regular dividendNet payout regular dividend divided by the sum of regular dividend and net
repurchase In the two-period analysis (Pre- vs Post-FAS123R) we separately sum the numerator
and the denominator for each firm-period and then calculate the ratio
Compensation Variables
Salary_$ Average salary (Execucomp SALARY) of the top 5 highest paid executives in $1000
Salary_ Average salary (Execucomp SALARY) divided by average total pay (Execucomp
TDC1) of the top 5 highest paid executives
Bonus_$ Average bonus (Execucomp BONUS) of the top 5 highest paid executives in $1000
Due to a data format change we add non-equity plan-based awards (Execucomp
NON_EQ_TARG) to this measure after 2006
Bonus_ Bonus_$ divided by average total pay (Execucomp TDC1) of the top 5 highest paid
executives
Option grant_$ Average option grant value (Execucomp OPTION_AWARDS_BLK_VALUE or
OPTION_AWARDS_FV) of the top 5 highest paid executives in $1000 Due to a data format
change we use OPTION_AWARDS_FV for this measure after 2006
Option grant_ Option grant_$ divided by average total pay (Execucomp TDC1) of the top 5
highest paid executives
Restricted stock grant_$ Average restricted stock grant value (Execucomp RSTKGRNT or
STOCK_AWARDS_FV) of the top 5 highest paid executives in $1000 Due to data format
change we use STOCK_AWARDS_FV for this measure after 2006
Restricted stock grant_ Restricted stock grant_$ divided by average total pay (Execucomp
TDC1) of the top 5 highest paid executives
Total pay_$ Average total pay (Execucomp TDC1) of the top 5 highest paid executives in $1000
35
Other Characteristics
Size The book value of total assets (Compustat AT) minus the book value of common equity
(Compustat CEQ) plus the market value of common equity from CRSP in $M
Log(size) the natural logarithm of size
Book-to-market the book value of common equity dividend by its market value
Leverage long term debt plus short term debt (Compustat DLTT + DLC) divided by total assets
Asset tangibility tangible assets (Compustat AT - INTAN) divided by total assets
Free cash flow Operating cash flow (Compustat OANCF) minus capital expenditure (Compustat
CAPX) then divided by lagged total assets
Cash holding Cash and short-term investments (Compustat CHE) divided by total assets
ROA volatility the standard deviation of returns on assets (operating income before tax divided by
lagged total assets) in the past five fiscal years
Institutional ownership the number of shares held by institutional investors divided by the number
of shares outstanding from Thomson Reuters Institutional Holdings database
Sales growth the growth rate of sales (Compustat SALE) from the prior year
Past stock return annual stock return from the prior year
Loss indicator a dummy variable taking value of one if the current net income is negative and
zero otherwise
36
References
Aboody David 1996 Market Valuation of Employee Stock Options Journal of Accounting and
Economics 22 357-391
Aboody David Barth Mary E and Ron Kasznik 2004 Firms Voluntary Recognition of Stock-
Based Compensation Expense Journal of Accounting Research 42 123ndash150
Aboody David and Ron Kasznik 2008 Executive stock-based compensation and firmsrsquo cash
payout the role of shareholdersrsquo tax-related payout preferences Review of Accounting Studies
13 216ndash251
Anantharaman Divya and Yong Gyu Lee 2014 Managerial risk taking incentives and corporate
pension policy Journal of Financial Economics 111 328ndash351
Baker Malcolm and Jeffrey Wurgler 2004 A catering theory of dividends Journal of Finance
59 1125-1165
Baker Malcolm and Jeffrey Wurgler 2016 Dividends as reference points a behavioral signaling
approach Review of Financial Studies 29 697-738
Bakke Tor-Erik Hamed Mahmudi Chitru Fernando and Jesus Salas 2015 The causal effect of
option pay on corporate risk management Journal of Financial Economics forthcoming
Balsam Steven Austin Reitenga and Jennifer Yin 2008 Option acceleration in response to SFAS
No 123 (R) Accounting Horizons 22 23-45
Bens Daniel and Steven Monahan 2008 Altering Investment Decisions to Manage Financial
Reporting Outcomes Asset-Backed Commercial Paper Conduits and FIN 46 Journal of
Accounting Research 46 1017-1055
Bens Daniel A Venky Nagar Douglas J Skinner and MH Franco Wong 2003 Employee stock
options eps dilution and stock repurchases Journal of Accounting and Economics 36 51ndash90
Bertrand Marianne Esther Duflo and Sendhil Mullainathan 2004 How much should we trust
differences-in-differences estimates The Quarterly Journal of Economics 119 249ndash275
Blouin Jennifer L Jana S Raedy and Douglas A Shackelford 2011 Dividends Share
Repurchases and Tax Clienteles Evidence from the 2003 Reductions in Shareholder Taxes
The Accounting Review 86 887-914
Brav Alon John R Graham Campbell R Harvey and Roni Michaely 2005 Payout policy in the
21st century Journal of Financial Economics 77 483ndash527
Brown Lawrence D and Yen-Jung Lee 2011 Changes in Option-Based Compensation Around
the Issuance of SFAS123R Journal of Business Finance amp Accounting 38 1053ndash109
37
Brown Jeffrey R Nellie Liang and Scott Weisbenner 2007 Executive financial incentives and
payout policy Firm responses to the 2003 dividend tax cut Journal of Finance 62 1935ndash
1965
Burns Natasha Brian McTier and Kristina Minnick 2015 Equity-incentive compensation and
payout policy in Europe Journal of Corporate Finance 30 85-97
Carter Mary Ellen and Luann J Lynch 2003 The Consequences of the FASBrsquos 1998 Proposal on
Accounting for Stock Option Repricing Journal of Accounting and Economics 35 51-72
Carter Mary Ellen Luann J Lynch and Irem Tuna 2007 The role of accounting in the design of
CEO equity compensation The Accounting Review 82 327ndash357
Chava Sudheer and Amiyatosh Purnanandam 2010 CEOs versus CFOs Incentives and
corporate policies Journal of Financial Economics 97 263ndash278
Chetty Raj and Emmanuel Saez 2005 Dividend taxes and corporate behavior Evidence from the
2003 dividend tax cut The Quarterly Journal of Economics 120 791ndash833
Choudhary Preeti Shivaram Rajgopal and Mohan Venkatachalam 2009 Accelerated vesting of
employee stock options in anticipation of FAS123R Journal of Accounting Research 47 105ndash
146
Christensen Hans B and Valeri Nikolaev 2009 Contracting on Mandatory Changes to GAAP
New Practice and Its Determinants Working Paper University of Chicago
Chu Yongqiang and Tao Ma 2015 How does management compensation affect bank risk taking
evidence from FAS 123R University of South Carolina Working Paper
Cuny Charles J Gerald S Martin and John J Puthenpurackal 2009 Stock options and total
payout Journal of Financial and Quantitative Analysis 44 391ndash410
DeAngelo Harry Linda DeAngelo and Douglas J Skinner 2000 Special Dividends and the
Evolution of Dividend Signaling Journal of Financial Economics 57 309-354
Dechow Patricia M Amy P Hutton and Richard G Sloan 1996 Economic consequences of
accounting for stock-based compensation Journal of Accounting Research 34 1ndash20
Edgerton J 2013 Four facts about dividend payouts and the 2003 tax cut International Tax and
Public Finance 20 769-784
Edmans Alex and Xavier Gabaix 2015 Executive compensation a modern primer Journal of
Economic Literature forthcoming
38
Fama Eugene F and Kenneth R French 2001 Disappearing dividends changing firm
characteristics or lower propensity to pay Journal of Financial Economics 60 3ndash43
Farre-Mensa Joan Roni Michaely and Martin C Schmalz 2014 Payout policy Annual Review
of Financial Economics 6 75ndash134
Fenn George W and Nellie Liang 2001 Corporate payout policy and managerial stock
incentives Journal of Financial Economics 60 45ndash72
Ferri Fabrizio and Tatiana Sandino 2009 The impact of shareholder activism on financial
reporting and compensation the case of employee stock options expensing The Accounting
Review 84 433ndash466
Floyd Eric Nan Li and Douglas J Skinner 2015 Payout policy through the financial crisis the
growth of repurchases and the resilience of dividends Journal of Financial Economics 118
299-316
Frydman Carola and Dirk Jenter 2010 CEO compensation Annual Review of Financial
Economics 2 75-102
Gipper Brandon 2015 Assessing the Effects of Disclosing Management Compensation Working
Paper University of Chicago
Gormley Todd David Matsa and Todd Milbourn 2013 CEO compensation and corporate risk
evidence from a natural experiment Journal of Accounting and Economics 56 79-101
Graham John Michelle Hanlon and Terry Shevlin 2011 Real effects of accounting rules
evidence from multinational firmsrsquo investment locations and profit repatriation decisions
Journal of Accounting Research 49 137-185
Graham John Campbell Harvey and Shiva Rajgopal 2005 The Economic implications of
corporate financial reporting Journal of Accounting and Economics 40 3-73
Greenspan Alan 2002 Testimony of Alan Greenspan before the Committee on Banking
Housing and Urban Affairs US Senate July 16 Washington DC Government Printing
Office
Grullon Gustavo and Roni Michaely 2002 Dividends Share Repurchases and the Substitution
Hypothesis Journal of Finance 57 1649-1684
Hail Luzi Ahmed Tahoun and Clare Wang 2014 Dividend Payouts and Information Shocks
Journal of Accounting Research 52 403-456
Hall Brian J and Kevin J Murphy 2002 Stock options for undiversified executives Journal of
Accounting amp Economics 33 3-42
39
Hall Brian J and Kevin J Murphy 2003 The trouble with stock options Journal of Economic
Perspectives 17 49ndash70
Hanlon Michelle and Jeffrey L Hoopes 2014 What do firms do when dividend tax rates change
An examination of alternative payout responses Journal of Financial Economics 114 105-
124
Hayes Rachel M Michael Lemmon and Mingming Qiu 2012 Stock options and managerial
incentives for risk taking Evidence from FAS123R Journal of Financial Economics 105
174ndash190
Heron Randall A Erik Lie 2007 Does backdating explain the stock price pattern around
executive stock option grants Journal of Financial Economics 83 271-295
Hribar Paul Nicole Thorne Jenkins and W Bruce Johnson 2006 Stock repurchases as an
earnings management device Journal of Accounting and Economics 41 3ndash27
Jensen Michael C 1986 Agency cost of free cash flow corporate finance and takeovers
American Economic Review 76 323-329
Jolls Christine 1998 Stock repurchases and incentive compensation NBER Working Paper No
w6467
Jung Boochun Woo-Jong Lee and Yanhua Sunny Yang 2016 The Impact of Dividend
Covenants on Investment and Operating Performance Journal of Business Finance amp
Accounting 43 414ndash447
Kahle Kathleen M 2002 When a buyback isnrsquot a buyback open market repurchases and
employee options Journal of Financial Economics 63 235ndash261
Lambert Richard A William N Lanen and David F Larcker 1989 Executive stock option plans
and corporate dividend policy Journal of Financial and Quantitative Analysis 24 409ndash425
Lintner John 1956 Distribution of incomes of corporations among dividends retained earnings
and taxes The American Economic Review 46 97-113
Low Angie 2009 Managerial risk-taking behavior and equity-based compensation Journal of
Financial Economics 92 470-490
Miller Merton H and Franco Modigliani 1961 Dividend policy growth and the valuation of
shares The Journal of Business 34 411ndash433
Minnick Kristina and Leonard Rosenthal 2015 Stealth compensation Do CEOs increase their
pay by influencing dividend policy Journal of Corporate Finance 25 435-454
40
Murphy Kevin J 1999 Executive compensation In O Ashenfelter and D Card (eds) North
Holland Handbook of Labor Economics Amsterdam Elsevier Science BV
Murphy Kevin J 2013 Executive compensation Where we are and how we got there Handbook
of the Economics of Finance Elsevier Science North Holland 211-356
Nikolaev Valeri 2010 Debt Covenants and Accounting Conservatism Journal of Accounting
Research 48 143-176
Puri Manju Joumlrg Rocholl and Sascha Steffen 2011 Global retail lending in the aftermath of the
US financial crisis Distinguishing between supply and demand effects Journal of Financial
Economics 100 556-578
Shue Kelly and Richard R Townsend 2014 Swinging for the fences Executive reactions to
quasi-random option grants Working Paper University of Chicago
Skinner Douglas J 2008 The evolving relation between earnings dividends and stock
repurchases Journal of Financial Economics 87 582-609
Weisbenner Scott J 2000 Corporate share repurchases in the 1990s What role do stock options
play FEDS Working Paper No 2000-29
Zhang Dan 2013 CEO dividend protection Working Paper BI Norwegian Business School
41
Figure 1 Trends of dividends and repurchases from 2003 to 2007 Panel A plots the average
Regular DividendTotal Assets of firms in the highest and lowest quartiles of Accounting Impact
measured in 2002 Panel B shows the average Total RepurchaseTotal Assets of firms in the
highest and lowest quartiles of Accounting Impact measured in 2002
Panel A Trends of regular dividends
Panel B Trends of total repurchases
00
05
10
15
20
2003 2004 2005 2006 2007
Regular DividendTotal Assets
Lowest Acc Impact
Highest Acc Impact
Pre Post
00
20
40
60
80
100
2003 2004 2005 2006 2007
Total Repurchase Total Assets
Lowest Acc Impact
Highest Acc Impact
Pre Post
42
Table 1
Summary Statistics
Panel A Firm characteristics - full sample
N Mean Std dev 25 pctl Median 75 pctl
Accounting impact (2002) 1176 173 366 022 052 163
Payout variablesRegular dividendTotal assets 5653 093 148 000 000 142
RepurchaseTotal assets 5653 394 710 000 035 500
Total payoutTotal assets 5653 488 748 000 175 666
Regular dividendTotal payout 4091 3874 4057 000 2237 8833
Level of executive compensation (in $1000)
Salary_$ 5653 450 190 314 409 544
Bonus_$ 5653 476 616 122 295 586
Option grant_$ 5653 791 1137 62 384 1002
Restricted stock grant_$ 5653 458 866 0 58 518
Total pay_$ 5653 2481 2475 890 1647 3074
Percentage of executive compensation
Salary_ 5653 296 183 165 251 382
Bonus_ 5653 197 148 97 177 268
Option grant_ 5653 283 235 67 256 445
Restricted stock grant_ 5653 141 180 00 41 249
Control variables
Size ($M) 5653 11086 27294 1017 2459 8117
Log(size) 5653 7985 1565 6925 7808 9002
Book-to-market 5653 0445 0287 0251 0388 0578
Leverage 5653 0202 0172 0038 0187 0309
Asset tangibility 5653 0806 0184 0691 0853 0965
Free cash flow 5653 0059 0091 0013 0059 0108
Cash holding 5653 0166 0172 0034 0100 0247
ROA volatility 5653 0056 0056 0021 0038 0070
Institutional ownership 5653 0753 0202 0639 0795 0910
Sales growth 5653 0121 0189 0028 0096 0183
Past stock return 5653 0094 0183 -0012 0094 0199
Loss indicator 5653 0164 0370 0000 0000 0000
This table presents summary statistics Panel A shows the descriptive statistics of payout variables compensation
variables and other firm characteristics for the full sample Accounting impact is the implied option expense
measured at fiscal year 2002 All other variables are measured at firm-year level from fiscal year 2003 to 2007
resulting in 5653 firm-year observations (except for Regular dividendTotal Payout which can be measured only
for the 4901 firm-year observations with Total payout greater than zero) Panel B shows the pairwise correlations
between main variables at firm-year level Panel C compares payout variables compensation variables and other
firm characteristics before and after FAS123R The Pre-FAS123R period consists of fiscal year 2003 and 2004
the Post-FAS123R period covers fiscal year 2005-2007 Panel D compares the trends of payout and compensation
variables around FAS123R across four quartile groups ranked by 2002 accounting impact Panel E compares the
trends of payout and compensation variables around FAS123R between the treated and control group under the
alternative treatment definition in Bakke et al (2015) (see Section 22) All variables are defined in Appendix The
notation and in Panel C indicates statistically significant at 10 5 and 1 level in T-tests for equal
means respectively
43
Pa
nel
B
Pea
rso
n c
orr
ela
tio
ns
Reg div
Repurchase
Total payout
Salary_
Bonus_
Option_
RS_
Log(size)
BM
Leverage
Tangibility
FCF
Cash holdingROA vol
Inst own
Sales growth
Past ret
urn
Loss
Reg
div
10
0
Repurc
hase
01
610
0
Tota
l payout
03
509
810
0
Sala
ry_
-0
10
-01
8-0
19
10
0
Bonus_
00
700
100
3-0
01
10
0
Option_
-0
10
00
900
6-0
41
-03
510
0
RS
_
01
000
901
0-0
32
-01
1-0
40
10
0
Log(s
ize)
03
101
802
3-0
56
01
101
202
210
0
BM
-02
1-0
28
-03
103
0-0
03
-02
000
0-0
33
10
0
Levera
ge
-00
1-0
08
-00
8-0
05
00
6-0
11
00
801
9-0
03
10
0
Tangib
ility
00
200
100
101
200
1-0
05
-00
6-0
12
-00
4-0
18
10
0
FC
F02
203
703
9-0
20
00
901
1-0
01
02
4-0
32
-02
1-0
16
10
0
Cash
hold
ing
-01
301
000
700
2-0
14
02
2-0
10
-02
3-0
16
-03
502
901
210
0
RO
A v
ol
-01
5-0
04
-00
700
4-0
11
01
9-0
11
-02
3-0
08
-01
101
2-0
02
03
910
0
Inst
ow
n
-00
901
401
1-0
17
00
200
701
200
7-0
01
00
3-0
08
01
4-0
06
-01
110
0
Sale
s gro
wth
-00
8-0
04
-00
6-0
15
00
501
0-0
02
00
7-0
16
-00
3-0
08
01
300
201
400
410
0
Past
retu
rn00
901
301
4-0
18
01
5-0
01
00
301
6-0
29
-01
000
102
7-0
14
-01
001
602
710
0
Loss
-02
0-0
19
-02
201
8-0
18
00
4-0
05
-02
601
901
300
6-0
41
01
702
3-0
16
-01
8-0
40
10
0
44
Panel C Firm characteristics - before and after FAS123R
Pre FAS 123R Post FAS 123R Difference
Payout variables
Regular dividendTotal assets 083 099 016
RepurchaseTotal assets 245 490 245
Total payoutTotal assets 328 589 261
Regular dividendTotal payout 3914 2790 -1124
Level of executive compensation (in $1000)
Salary_$ 426 463 37
Bonus_$ 418 505 87
Option grant_$ 896 707 -191
Restricted stock grant_$ 269 574 305
Total pay_$ 2263 2584 321
Percentage of executive compensation
Salary_ 305 293 -12
Bonus_ 186 204 18
Option grant_ 343 240 -103
Restricted stock grant_ 87 176 89
Control variables
Size ($M) 9671 11631 1960
Log(size) 7860 8035 0175
Book-to-market 0437 0453 0016
Leverage 0201 0203 0002
Asset tangibility 0822 0793 -0029
Free cash flow 0061 0057 -0004
Cash holding 0175 0159 -0016
ROA volatility 0067 0048 -0019
Institutional ownership 0712 0781 0069
Sales growth 0137 0108 -0029
Past stock return 0080 0101 0021
Loss indicator 0173 0159 -0014
45
Pa
nel
D
Fir
m c
ha
racte
rist
ics
by q
ua
rtil
e o
f a
cco
un
tin
g i
mp
act
- b
efo
re a
nd
aft
er
FA
S1
23
R
Accounting im
pact
(2002)
Num
ber
of
Fir
ms
Pre
Post
Pre
Post
Pre
Post
Pre
Post
Payout
vari
able
s
Regula
r div
idendT
ota
l ass
ets
11
2
12
4
09
4
11
1
09
5
11
3
03
0
04
9
Repurc
hase
Tota
l ass
ets
11
3
26
8
19
2
37
3
32
7
63
1
35
1
68
7
Tota
l payout
Tota
l ass
ets
22
4
39
1
28
5
48
4
42
2
74
4
38
1
73
6
Regula
r div
idendT
ota
l payout
643
7
469
8
474
0
341
1
284
5
195
4
82
5
74
5
Perc
enta
ge o
f executive c
om
pensa
tion
Sala
ry_
337
295
313
287
296
289
276
300
Bonus_
223
226
214
228
172
192
134
169
Option g
rant_
201
167
290
210
373
260
507
325
Rest
ricte
d s
tock g
rant_
116
194
98
180
89
176
43
155
294
294
294
294
1st Q
uart
ile2
nd Q
uart
ile3
rd Q
uart
ile4
th Q
uart
ile
01
2
03
5
09
3
55
1
46
Accounting impact
Number of Firms
By accounting impact quartile
1
2
3
4
Pre Post Pre Post
Payout variables
Regular dividendTotal assets 09 11 08 10
RepurchaseTotal assets 18 31 26 52
Total payoutTotal assets 28 43 34 62
Regular dividendTotal payout 428 357 386 265
Percentage of executive compensation
Salary_ 435 364 282 280
Bonus_ 226 214 179 202
Option grant_ 92 125 387 261
Restricted stock grant_ 125 188 80 174
Percentage of CEO compensation
Salary_(CEO) 485 364 260 259
Bonus_(CEO) 249 228 185 219
Option grant_(CEO) 10 127 406 275
Restricted stock grant_(CEO) 128 182 82 183
Panel E Firm characteristics by alternative treatment definition - before and
after FAS123R
Treated
25
19
997
223
250
256
268
10
177
71
Control
44
37
47
Table 2
Differential effect of FAS123R on the use of option-based compensation
Panel A Two-period first-difference regression
Prediction Coeff t-stat Coeff t-stat Coeff t-stat
Accounting impact rank - -0044 -628
Accounting impact rank=2 - -0044 -327
Accounting impact rank=3 - -0075 -468
Accounting impact rank=4 - -0140 -613
Treated - -0132 -875
ΔLog(size) 0061 202 0061 200 0063 214
ΔBook-to-market 0032 091 0032 092 0051 143
ΔLeverage -0157 -213 -0160 -218 -0111 -153
ΔAsset tangibility -0012 -014 -0020 -023 -0023 -026
ΔFree cash flow -0106 -095 -0108 -097 -0128 -117
ΔCash holding -0197 -211 -0193 -206 -0180 -194
ΔFive-year ROA volatility -0065 -031 -0056 -026 -0098 -047
ΔInstitutional ownership -0044 -091 -0043 -088 -0044 -092
ΔSales growth -0064 -102 -0065 -104 -0090 -153
ΔPast one-year stock return 0051 078 0052 080 0091 138
ΔLoss frequency 0056 207 0057 207 0047 179
Log(size) -0009 -210 -0009 -207 -0002 -035
Book-to-market -0015 -056 -0013 -049 0018 072
Leverage 0022 046 0023 048 0068 150
Asset tangibility 0033 077 0033 078 0053 128
Free cash flow 0227 202 0220 195 0127 117
Cash holding -0002 -004 0012 019 -0078 -141
Five-year ROA volatility -0451 -240 -0430 -228 -0509 -283
Institutional ownership -0123 -360 -0122 -359 -0100 -292
Sales growth -0041 -056 -0040 -055 -0089 -125
Past one-year stock return -0009 -015 -0006 -010 0078 125
Loss frequency 0055 174 0056 178 0054 173
Fixed effect
Standard error
Adj R-squared
Observations
Model (3)
Dependent variable ΔAvg Option grantTotal pay
Huber-White
0156
This table investigates whether the effect of FAS123R on the use of option-based pay varies with its potential accounting impact Panel A
reports the results of estimating three two-period first-differencing models where for each firm we average its characteristics in Pre- and
Post-FAS123R period The Pre-FAS123R period consists of fiscal year 2003 and 2004 the Post-FAS123R period covers fiscal year 2005-
2007 In all three specifications the dependent variable is the change of average Option grantTotal pay from Pre- to Post-FAS123R period
The main independent variable varies by model in Model (1) the Accounting impact rank is the quartile rank of implied option expensetotal
assets measured in 2002 (1=lowest 4=highest) In Model (2) Accounting impact rank=2 (3 4) is an indicator that takes value of one if the
firmrsquos Accounting impact rank equals 2 (3 4) In Model (3) we use an alternative treatment construction following Bakke et al (2015)
where Treated is an indicator that takes value of zero if the firm granted zero option to its CEO in both 2003 and 2004 or the firm began to
voluntarily expense option-based pay at fair value in 2002 or earlier and one otherwise For each control variable we include both its level in
the Pre-FAS123R period and its change across the two periods Panel B shows the results of estimating fixed effect models with firm-year
observations The dependent variable is the firm-year level Option grantTotal pay The main independent variables are the interactions of
Post-FAS123R indicator (Post) with Accounting Impact rank Accounting impact rank indicators and Treated respectively All models in
Penal A have industry fixed effects and the standard errors are Huber-White heteroscedasticity-consistent standard errors All models in
Penal B have firm fixed effects and year fixed effects and the standard errors are clustered at firm level All variables are defined in
Appendix The notation and indicates statistically significant at 10 5 and 1 level respectively
Model (1) Model (2)
11711171 1171
Industry Industry
Huber-White
0124
Huber-White
0123
Industry
48
Panel B Panel fixed effects regression
Prediction Coeff t-stat Coeff t-stat Coeff t-stat
Acc impact rank x Post - -0044 -807
Acc impact rank 2 x Post - -0046 -333
Acc impact rank 3 x Post - -0077 -526
Acc impact rank 4 x Post - -0137 -776
Treated x Post - -0145 -970
Log(size) 0034 221 0034 217 0036 229
Book-to-market 0018 084 0017 083 0015 070
Leverage -0004 -009 -0006 -013 -0007 -015
Asset tangibility 0007 012 0004 006 0011 018
Free cash flow -0074 -151 -0072 -146 -0078 -158
Cash holding -0048 -086 -0050 -090 -0006 -011
Five-year ROA volatility 0250 231 0239 219 0437 414
Institutional ownership 0043 159 0044 161 0041 150
Sales growth -0033 -168 -0034 -171 -0031 -158
Past one-year stock return 0067 221 0068 224 0063 204
Loss indicator 0023 209 0022 207 0024 222
Fixed effects
Standard error
Adj R-squared
Observations
Dependent variable Option grantTotal pay
5653 5653 5653
Clustered by firm
Firm Year
Clustered by firm
Firm Year
Clustered by firm
0523 0523 0526
Model (1) Model (2) Model (3)
Firm Year
49
Table 3
Effect of option-based compensation on dividend policy
Panel A Two-period first-difference regression
Prediction Coeff t-stat Coeff t-stat Coeff t-stat
Accounting impact rank + 0000 077
Accounting impact rank=2 + 0001 091
Accounting impact rank=3 + 0000 044
Accounting impact rank=4 + 0001 092
Treated + 0000 -026
ΔLog(size) 0000 -030 0000 -030 0000 -026
ΔBook-to-market -0002 -190 -0002 -193 -0002 -195
ΔLeverage -0002 -059 -0002 -057 -0002 -059
ΔAsset tangibility 0016 431 0016 429 0016 430
ΔFree cash flow 0017 373 0017 373 0017 375
ΔCash holding -0011 -288 -0011 -285 -0010 -282
ΔFive-year ROA volatility 0003 034 0002 032 0003 035
ΔInstitutional ownership -0002 -073 -0002 -073 -0002 -070
ΔSales growth -0001 -040 -0001 -037 -0001 -038
ΔPast one-year stock return 0002 077 0002 076 0002 070
ΔLoss frequency 0000 -048 0000 -045 0000 -046
Log(size) 0000 183 0000 182 0000 182
Book-to-market -0002 -227 -0002 -225 -0002 -284
Leverage -0001 -037 -0001 -039 -0001 -048
Asset tangibility 0003 179 0003 180 0003 176
Free cash flow 0017 291 0017 291 0017 300
Cash holding 0002 080 0002 077 0002 098
Five-year ROA volatility 0003 035 0002 033 0003 044
Institutional ownership -0001 -068 -0001 -068 -0001 -058
Sales growth -0004 -177 -0004 -175 -0004 -172
Past one-year stock return 0004 169 0004 167 0004 165
Loss frequency -0001 -111 -0001 -109 -0001 -102
Fixed effect
Standard error
Adj R-squared
Observations
Dependent variable ΔAvg Regular dividendTotal assets
This table investigates the causal effect of option-based pay on dividend policy by examining whether changes in dividend policy around
FAS123R vary with its potential accounting impact Panel A reports the results of estimating three two-period first-differencing models
where for each firm we average its characteristics in Pre- and Post-FAS123R period In all three specifications the dependent variable is
the change of average Regular dividendTotal assets from Pre- to Post-FAS123R period The main independent variable varies by model in
Model (1) the Accounting impact rank is the quartile rank of implied option expensetotal assets measured in 2002 (1=lowest 4=highest) In
Model (2) Accounting impact rank=2 (3 4) is an indicator that takes value of one if the firmrsquos Accounting impact rank equals 2 (3 4) In
Model (3) we use an alternative treatment construction following Bakke et al (2015) where Treated is an indicator that takes value of zero
if the firm granted zero option to its CEO in both 2003 and 2004 or the firm began to voluntarily expense option-based pay at fair value in
2002 or earlier and one otherwise For each control variable we include both its level in the Pre-FAS123R period and its change across the
two periods Panel B shows the results of estimating fixed effect models with firm-year observations The dependent variable is the firm-
year level Regular dividendTotal assets The main independent variables are the interactions of Post-FAS123R indicator (Post) with
Accounting Impact rank Accounting impact rank indicators and Treated respectively Panel C examines the intensity of dividend changes
among firms with nonzero dividend per share in 2003 or 2004 In particular we estimates the same three models as in Panel A(with the
same independent variables) but for five dependent variables the change of average Regular dividendTotal assets from Pre- to Post-
FAS123R period (as in Panel A) the percentage change of DPS (dividend per share) from Pre- to Post-FAS123R period and three
indicators denoting respectively whether the percentage change of DPS was greater than 20 40 and 60 Panel D reports four
robustness tests of the dividend intensity regression In each of them a set of possible confounding observations is removed (see Section 33
for details) Panel E compares the trends of dividend initiation and termination around FAS123R across four quartile groups ranked by
accounting impact All models in Panel A C and D have industry fixed effects and the standard errors are Huber-White heteroscedasticity-
consistent standard errors All models in Penal B have firm fixed effects and year fixed effects and the standard errors are clustered at
firm level All variables are defined in Appendix The notation and indicates statistically significant at 10 5 and 1 level
Industry Industry Industry
Model (1) Model (2) Model (3)
1171 1171 1171
Huber-White Huber-White Huber-White
0105 0104 0105
50
Panel B Panel fixed effects regression
Prediction Coeff t-stat Coeff t-stat Coeff t-stat
Acc impact rank x Post + 0000 122
Acc impact rank 2 x Post + 0001 110
Acc impact rank 3 x Post + 0001 094
Acc impact rank 4 x Post + 0001 129
Treated x Post + 0000 -012
Log(size) 0001 179 0001 179 0001 181
Book-to-market 0000 025 0000 024 0000 031
Leverage 0001 062 0001 064 0001 069
Asset tangibility 0009 360 0009 358 0009 363
Free cash flow 0002 090 0002 093 0002 092
Cash holding -0007 -295 -0007 -298 -0007 -298
Five-year ROA volatility 0001 041 0001 038 0000 -006
Institutional ownership 0000 -027 0000 -026 0000 -027
Sales growth 0000 053 0000 051 0000 044
Past one-year stock return 0001 089 0001 088 0001 078
Loss indicator 0000 -060 0000 -057 0000 -076
Fixed effects
Standard error
Adj R-squared
Observations
Dependent variable Regular dividendTotal assets
Model (1) Model (2) Model (3)
Firm Year Firm Year Firm Year
5653 5653 5653
Clustered by firm Clustered by firm Clustered by firm
0877 0877 0877
51
Panel C Intensity of dividend changes around FAS123R
Prediction Coeff t-stat Coeff t-stat Coeff t-stat
Accounting impact rank + 0000 065
Accounting impact rank=2 + 0000 048
Accounting impact rank=3 + 0000 026
Accounting impact rank=4 + 0002 080
Treated + 0001 063
Dependent var DPS pct change
Accounting impact rank + -0145 -072
Accounting impact rank=2 + 0018 006
Accounting impact rank=3 + -0177 -045
Accounting impact rank=4 + -0746 -100
Treated + -0407 -119
Accounting impact rank + 0029 095
Accounting impact rank=2 + 0040 074
Accounting impact rank=3 + 0092 139
Accounting impact rank=4 + 0008 007
Treated + -0007 -012
Accounting impact rank + 0024 076
Accounting impact rank=2 + 0047 088
Accounting impact rank=3 + 0079 114
Accounting impact rank=4 + -0003 -002
Treated + 0030 052
Accounting impact rank + 0030 098
Accounting impact rank=2 + 0078 155
Accounting impact rank=3 + 0085 130
Accounting impact rank=4 + 0014 012
Treated + -0006 -011
Control variables
Fixed effect
Standard error
Observations 572 572 572
Yes Yes Yes
Huber-White Huber-White Huber-White
Industry Industry Industry
Dependent var DPS pct
change gt60 indicator
Model (1) Model (2) Model (3)
Dependent var ΔAvg Regular
dividendAssets
Dependent var DPS pct
change gt20 indicator
Dependent var DPS pct
change gt40 indicator
52
Panel D Robustness tests for intensity of dividend changes around FAS123R
Prediction Coeff t-stat Coeff t-stat Coeff t-stat
Accounting impact rank + 0006 017
Accounting impact rank=2 + 0067 118
Accounting impact rank=3 + 0041 057
Accounting impact rank=4 + -0061 -049
Treated + 0022 035Observations
Accounting impact rank + 0009 027
Accounting impact rank=2 + 0058 106
Accounting impact rank=3 + 0032 043
Accounting impact rank=4 + -0032 -024
Treated + 0018 028
Observations
Accounting impact rank + 0030 089
Accounting impact rank=2 + 0039 071
Accounting impact rank=3 + 0122 168
Accounting impact rank=4 + -0063 -052
Treated + 0075 132
Observations
Accounting impact rank + 0008 023
Accounting impact rank=2 + 0023 042
Accounting impact rank=3 + 0048 064
Accounting impact rank=4 + -0042 -033
Treated + -0010 -016
Observations
Control variables
Fixed effect
Standard error
Exclude firms with stable
payout ratio from 2003 to 2004
506 506 506
Dependent variable DPS pct change gt40 indicator
Model (1) Model (2) Model (3)
Exclude voluntary expensers
519 519
Exclude firms in the top decile
of option reduction (02-04)
Exclude firms that accelerated
option vesting
504 504 504
517 517 517
519
Huber-White Huber-White Huber-White
Yes Yes Yes
Industry Industry Industry
53
Panel E Dividend initiation and termination rates around FAS123R
Pre FAS 123R
1 280 75 7 6 13 173
2 284 135 18 9 27 200
3 286 181 11 14 25 138
4 282 260 9 10 19 73
Total 1132 651 45 39 84 129
Post FAS 123R
1 275 63 4 4 8 127
2 280 116 9 9 18 155
3 276 152 9 3 12 79
4 263 223 5 1 6 27
Total 1094 554 27 17 44 79
Pre FAS 123R
1 280 205 2 0 2 10
2 284 149 7 1 8 54
3 286 105 0 0 0 00
4 282 22 0 0 0 00
Total 1132 481 9 1 10 21
Post FAS 123R
1 275 212 3 6 9 42
2 280 164 1 2 3 18
3 276 124 1 1 2 16
4 263 40 0 3 3 75
Total 1094 540 5 12 17 31
termination
in 2004
03-04
cumulative
03-04
cumulative
Quartile firms
with
dividend in
2004
termination
in 2005
termination
in 2006
05-06
cumulative
05-06
cumulative
Termination
Quartile firms
with
dividend in
2002
termination
in 2003
without
dividend in
2004
initiation in
2003
initiation in
2004
03-04
cumulative
03-04
cumulative firmsQuartile
firmsQuartile initiation in
2005
initiation in
2006
05-06
cumulative
05-06
cumulative
Initiation
without
dividend in
2002
54
Table 4
Effect of option-based compensation on repurchases
Panel A Two-period first-difference regression with total repurchase
Prediction Coeff t-stat Coeff t-stat Coeff t-stat
Accounting impact rank - 0002 122
Accounting impact rank=2 - 0002 071
Accounting impact rank=3 - 0005 123
Accounting impact rank=4 - 0007 102
Treated - 0014 365
Control variables
Fixed effect
Standard error
Adj R-squared
Observations
Panel B Two-period first-difference regression with net repurchase
Prediction Coeff t-stat Coeff t-stat Coeff t-stat
Accounting impact rank - 0003 166
Accounting impact rank=2 - 0002 051
Accounting impact rank=3 - 0006 165
Accounting impact rank=4 - 0009 137
Treated - 0010 300
Control variables
Fixed effect
Standard error
Adj R-squared
Observations
Panel C Two-period first-difference regression with repurchase adjusted for exercised options
Prediction Coeff t-stat Coeff t-stat Coeff t-stat
Accounting impact rank - 0001 056
Accounting impact rank=2 - 0002 062
Accounting impact rank=3 - 0007 172
Accounting impact rank=4 - -0001 -008
Treated - 0006 197
Control variables
Fixed effect
Standard error
Adj R-squared
Observations
Dependent variable ΔAvg RepurchaseTotal assets
This table investigates the causal effect of option-based pay on payout policy by examining whether the changes of repurchase around
FAS123R vary with its potential accounting impact Panel A reports the results of estimating three two-period first-differencing models
where for each firm we average its characteristics in Pre- and Post-FAS123R period In all three specifications the dependent variable is
the change of average RepurchaseTotal assets from Pre- to Post-FAS123R period The main independent variable varies by model in
Model (1) the Accounting impact rank is the quartile rank of implied option expensetotal assets measured in 2002 (1=lowest 4=highest)
In Model (2) Accounting impact rank=2 (3 4) is an indicator that takes value of one if the firmrsquos Accounting impact rank equals 2 (3 4)
In Model (3) we use an alternative treatment construction following Bakke et al (2015) where Treated is an indicator that takes value of
zero if the firm granted zero option to its CEO in both 2003 and 2004 or the firm began to voluntarily expense option-based pay at fair
value in 2002 or earlier and one otherwise Panel B reports the regressions with the change of Net repurchaseTotal assets as the
dependent variable and the same independent variable as in Panel A Panel C reports the regressions with the change of Adjusted
repurchaseTotal assets as the dependent variable and the same independent variable as in Panel A All models in Panel A B and C have
industry fixed effects and the standard errors are Huber-White heteroscedasticity-consistent standard errors All variables are defined in
Appendix The notation and indicates statistically significant at 10 5 and 1 level respectively
Model (1) Model (2) Model (3)
Yes Yes Yes
Industry Industry Industry
Huber-White Huber-White Huber-White
Dependent variable ΔAvg Net repurchaseTotal assets
1171 1171 1171
0238 0237 0245
Model (1) Model (2) Model (3)
Yes Yes Yes
Industry Industry Industry
Huber-White Huber-White Huber-White
Dependent variable ΔAvg Adjusted repurchaseTotal assets
0229 0229 0233
1171 1171 1171
Model (1) Model (2) Model (3)
Yes Yes Yes
Industry Industry Industry
Huber-White Huber-White Huber-White
0111 0112 0114
1168 1168 1168
55
Table 5
Effect of option-based compensation on payout mix
Panel A Two-period first-difference regression with total payout mix
Prediction Coeff t-stat Coeff t-stat Coeff t-stat
Accounting impact rank + 0006 028
Accounting impact rank=2 + 0018 045
Accounting impact rank=3 + -0001 -001
Accounting impact rank=4 + 0043 052
Treated + -0035 -094
Control variables
Fixed effect
Standard error
Adj R-squared
Observations
Panel B Two-period first-difference regression with net payout mix
Prediction Coeff t-stat Coeff t-stat Coeff t-stat
Accounting impact rank + -0002 -008
Accounting impact rank=2 + 0008 016
Accounting impact rank=3 + 0018 034
Accounting impact rank=4 + -0059 -055
Treated + -0050 -101
Control variables
Fixed effect
Standard error
Adj R-squared
Observations
0049 0043 0054
257 257 257
Industry Industry Industry
Huber-White Huber-White Huber-White
Dependent variable ΔAvg Regular dividendNet payout
Model (1) Model (2) Model (3)
Yes Yes Yes
0154 0151 0156
362 362 362
Industry Industry Industry
Huber-White Huber-White Huber-White
This table investigates the causal effect of option-based pay on payout mix for firms using both dividend and repurchase by examining
whether the changes of payout mix around FAS123R vary with its potential accounting impact Panel A reports the results of estimating
three two-period first-differencing models where for each firm we average its characteristics in Pre- and Post-FAS123R period In all three
specifications the dependent variable is the change of average Regular dividendTotal payout from Pre- to Post-FAS123R period The main
independent variable varies by model in Model (1) the Accounting impact rank is the quartile rank of implied option expensetotal assets
measured in 2002 (1=lowest 4=highest) In Model (2) Accounting impact rank=2 (3 4) is an indicator that takes value of one if the firmrsquos
Accounting impact rank equals 2 (3 4) In Model (3) we use an alternative treatment construction following Bakke et al (2015) where
Treated is an indicator that takes value of zero if the firm granted zero option to its CEO in both 2003 and 2004 or the firm began to
voluntarily expense option-based pay at fair value in 2002 or earlier and one otherwise Panel B reports the regressions with the change of
Regular dividendNet payout as the dependent variable and the same independent variables as in Panel A Panel A (Panel B) is based on
observations with nonzero regular dividend and repurchase (net repurchase) in both Pre- and Post-FAS123R period All models in Panel A
and B have industry fixed effects and the standard errors are Huber-White heteroscedasticity-consistent standard errors All variables are
defined in Appendix The notation and indicates statistically significant at 10 5 and 1 level respectively
Yes Yes Yes
Dependent variable ΔAvg Regular dividendTotal payout
Model (1) Model (2) Model (3)

4
reported no expense in their income statements FAS123R required firms to expense ESO in the
income statement at fair value Consistent with FAS123R increasing the perceived cost of stock
options (Murphy 2013) various studies have documented a large decrease in the use of stock
options subsequent to its introduction (Carter Lynch and Tuna 2007) Hayes Lemmon and Qiu
(2012) report a decline in the median ratio of the value of option grants to total pay from 397 to
139 following FAS123Rrsquos implementation Such a sudden change in executive pay
composition is rare (Frydman and Jenter 2010) and thus provides a unique opportunity to
investigate its effect on payout policy
This setting has additional benefits as well One such benefit is that the decrease in ESO
predicts an increase in dividends Settings that predict a decrease in dividends are arguably less
powerful as firms are notoriously reluctant to cut dividends given the evidence of a negative
investorsrsquo reaction (Brav et al 2005)5 Also the period subsequent to FAS123R witnessed a
general increase in corporate payouts (Floyd Li and Skinner 2015) These factors all combine to
produce a powerful setting to detect a compensation-induced increase in dividends
While FAS123R created an exogenous shock to the use of option-based compensation a
major challenge to the research design remains The accounting standard is applied to all public
firms making it difficult to construct control groups To tackle this challenge our empirical
strategy exploits the idea that FAS123Rrsquos impact likely varies across different types of firms We
conjecture that firms facing a larger hit on their reported earnings (as measured by a higher implied
option expense in 2002 prior to FAS123R) will reduce option grants significantly more than other
firms Indeed in our sample option compensation as percentage of total executive pay drops from
507 to 325 for firms in the top quartile of implied option expense versus 201 to 167 for
5 Indeed association studies reporting a negative association between option-based pay and dividends frame the issue
in terms of lower dividend increases (ie repurchases substituting for future dividend increases in option-heavy firms)
rather than in terms of dividend decreases
5
firms in the bottom quartile Using this cross sectional variation our strategy is a difference-in-
difference design where the first difference is the adoption of FAS123R and the second is the pre-
event implied option expense effectively our proxy for the expected accounting-induced reduction
in option-based compensation The key identification assumption is that the level of implied
option expense (prior to the announcement of FAS123R) is not correlated with the potential future
change in payout variables in the absence of treatment (ie FAS123R) We discuss this
assumption further in Section 2
We perform our empirical tests using a sample of SampP 1500 firms between 2003 and 2007
a five-year event window surrounding the 2005 adoption of FAS123R In particular we estimate
the association between implied option expense measured in 2002 and thus prior to the event
window and the change in the average payout variables from the ldquoprerdquo (2003-2004) to the ldquopostrdquo
(2005-2007) period after controlling for known determinants of payout policy Across various
measures of dividend changes we do not find that firms with higher implied option expense
increased their dividends relative to firms with lower implied option expense both in the full
sample and in a sub-sample of firms that paid dividends prior to FAS123R Also among firms
that did not pay dividends prior to FAS123R those with higher implied option expense did not
experience a relative increase in the rate of dividend initiation This lack of an effect on dividend
payouts is remarkable given that the accounting-induced decline in option-based pay was
accompanied by a corresponding increase in restricted stock awards which generally pay
dividends Further we find no association between implied option expense and changes in the
level of repurchases or changes in the relative weights of dividends and repurchases
Our results are robust to using alternative measures of dividends and repurchases
employing a panel regression (rather than a first-difference regression) and excluding the year of
6
adoption 2005 They are also robust to excluding firms that may have taken actions in anticipation
of the expected adoption of FAS123R (eg voluntarily expensing options) Finally to further
address the lack of a control group we follow Bakke Mahmudi Fernando and Salas (2015) and
define control firms as those voluntarily expensing options and those issuing no options to the
CEO prior to FAS123R on the ground that these firms were likely unaffected by the new standard
Our inferences remain unchanged
Overall the evidence is not consistent with the prediction that option-based compensation
has a first-order causal impact on payout policy and suggests that the previously documented
associations perhaps reflect endogeneity rather than a causal influence Our findings should not be
viewed as denying that stock options provide an incentive to favor repurchases over dividends
Rather they suggest this incentive does not imply an unconstrained ability to change payout policy
in a self-serving way likely because of the visibility of payout policy and its relevance to boards
and institutional investors 6 In addition boards may compensate executives for the lack of
dividend-protection in other ways effectively neutralizing those incentives Notably our findings
are consistent with managersrsquo statements that lack of dividend-protection does not affect payout
decisions (Brav et al (2005) who highlight this stark contrast between their survey evidence and
the empirical associations in the literature)7 Our results also provide another explanation for the
persistent lack of dividend protection in executivesrsquo options boards are not concerned with its
6 Note that our results are not inconsistent with evidence that managers take actions to increase personal wealth in
settings where the level of scrutiny is lower (eg timing of option grants backdating Heron and Lie 2007) or where it
is harder for outsiders to detect personal motives (eg risk-taking activities that increase the value of options Bakke et
al 2015) 7 Only 106 of surveyed executives agree that lack of dividend protection may cause managers to favor repurchases
over dividends ndash the lowest level of support among all the questions in the survey Of course it is possible that
managers would not admit to the effect on their behavior but similar surveys have elicited candid responses For
example a large percentage of managers surveyed by Graham Harvey and Rajgopal (2005) admit that they would
sacrifice economic value to smooth earnings or to hit an earnings target
7
effect because they can mitigate it by directly monitoring payout choices andor adjusting
compensation packages
Our study contributes to a vast literature on the determinants of payout policy First while
many studies document an association between option-based pay and payout policy limited
attempts have been made to examine its causal nature8 Addressing this question will enhance our
understanding of temporal changes in payout policy such as the emergence of repurchases as
primary payout vehicle (Farre-Mensa et al 2014) and the recently observed lsquoresiliencersquo of
dividends (Floyd et al 2015) Using the plausible exogenous variation in ESO induced by
FAS123R our evidence calls into question the notion that option-based compensation is a first-
order driver of payout policy and challenges future research to consider alternative explanations
for the trends in corporate payouts Second we extend the research that examines how
institutional changes affect payout policy Most of these studies examine changes in dividend tax
rates (eg Chetty and Saez 2005 Brown Liang and Wesibenner 2007 Aboody and Kasznik 2008
Blouin Raedy and Shackelford 2011 Hanlon and Hoopes 2014) or in the information environment
(Hail Tahoun and Wang 2014) while we examine a new accounting standard that affected the
composition of executive pay
We also contribute to a recent stream of research that uses exogenous shocks to understand
the economic impact of option-based pay (Low 2009 Gormley Matsa and Milbourn 2013) Some
of these studies use FAS123R to examine the causal effect of option-based pay on risk-taking with
mixed findings (Chava and Purnanandam 2010 Hayes Lemmon and Qiu 2012 Bakke et al 2015
Chu and Ma 2015) We extend this research in two ways First we use FAS123R to examine the
8 A notable exception is Shue and Townsend (2014) who instrument change in option grants with predicted new
option grant cycle and find that dividend growth is slower in the first year of a new option grant cycle than other years
An important premise underlying this approach is that the outcomes respond almost instantaneously to the treatment
In this paper we are more concerned with the longer-term effects of ESO as payout tends to be sticky and may
respond to the treatment only gradually (Lambert et al 1989)
8
effect of option-based pay on a different yet important economic outcome payout policy Second
our metholodogy differs from prior studies in that it explicitly incorporates cross-sectional
variation in how firms were affected by FAS123R Future work may use this approach to examine
the effect of option-based pay on other corporate policies
Finally we extend the literature on how accounting rules impact a firmrsquos economic
behavior (eg Carter and Lynch 2003 Carter et al 2007 Bens and Mohanan 2008 Choudhary
Rajgopal and Venkatachalam 2009 Graham Hanlon and Shevlin 2011) as well as the literature on
the accounting treatment for stock options (Aboody 1996 Dechow Hutton and Sloan 1996
Aboody Barth and Kasznik 2004 Ferri and Sandino 2009)
2 Research Design
21 Empirical Strategy
It is commonly recognized that identifying the causal effects of executive compensation in
empirical studies is challenging (Edmans and Gabaix 2015) FAS123R provides a unique
opportunity to address this problem Aside from significantly reducing the use of option
compensation the accounting change should not in itself correlate with the outcomes of interest
(ie change in payout policy)9 However utilizing FAS123R is not easy because it affected all
US firms at the same time making it difficult to measure a counterfactual change around the
event based on a control group A simple before-after comparison of the outcome variable around
the adoption of FAS123R would assume that any change is driven entirely by the event of interest
(ie it would assume away any conterfactual trend in the outcome variable) a questionable
assumption An alternative strategy is to use the change in option-based compensation around
9 Hayes et al (2012) describes FAS123R as an exogenous change in the accounting benefits of stock options without a
change to the economic costs and benefits of stock options while Bakke et al (2015) describes it as causing a change
in executivesrsquo but not shareholdersrsquo incentives
9
FAS123R effectively assuming that such change is ldquoexogenousrdquo (eg Chava and Purnanandam
2010 Anantharaman and Lee 2014) The problem with this approach is that FAS123R per se did
not generate exogenous cross-sectional variation in option compensation Even if the introduction
of FAS123R is exogenous a firmrsquos response cannot be assumed to be entirely exogenous10
To identify the exogenous portion of firmsrsquo response to the new standard we make use of
evidence that FAS123Rrsquos impact on the use of option compensation varies with the firm-specific
expected accounting impact of the new rule as measured by the implied option expense disclosed
in the footnotes prior to FAS123R (Hayes et al 2012) The reduction in option usage is highest in
firms with the largest implied option expense Thus we can use the differential accounting impact
of FAS123R to overcome the problem of lacking control group
To validate our approach we estimate the following first-differencing regression with
ordinary lease square (OLS)
ΔOptioni = β0 + β1 Accounting Impacti + ΛControli +εi (1)
where ΔOptioni is the change in the average value of executive stock options as percentage of total
pay from the pre- to the post-FAS123R period Accounting Impacti is the implied option expense
measured prior to FAS123R (more details in Section 22) We expect β1 to be negative that is a
more pronounced reduction in option-based pay for firms with higher expected accounting impact
Next after validating the differential impact of FAS123R we examine the central question
of this study by estimating the following OLS regression
ΔPayouti = γ0 + γ1 Accounting Impacti + ΓControli +ui (2)
10 A universally assigned encouragement to receive treatment does not make the realization of treatment assignment
free from endogeneity concerns Consider the following example after the adoption of FAS123R firm A reduces the
weight of option-based pay by 20 and firm B by 40 A finding that firm B increases dividends compared to firm A
cannot be interpreted as evidence of a causal influence of option compensation on dividend policy This is because the
additional reduction in option compensation by firm B relative to firm A may not be driven by FAS123R It may
instead reflect an attempt to align executivesrsquo incentives with anticipated changes in dividend policy (reverse
causality) Without a way to incorporate the heterogeneous impact of FAS123R in the research design the cross
sectional variation in changes in option-based compensation is still subject to the usual endogeneity concerns
10
where ΔPayouti represents the change in the average value of one of the payout variables
of interest (described in Section 23) from the the pre- to the post-FAS123R period
Eq (2) is essentially a difference-in-difference approach to estimate the effect of option-
based pay on payout policy using the differential accounting impact of FAS123R to capture the
exogenous (accounting-induced) portion of the change in option-based pay If option-based pay
has a detectable causal effect on dividends (repurchases) in the direction predicted by the
literature γ1 should be positive (negative)
As noted by Bertrand Duflo and Mullainathan (2004) in difference-in-difference studies
with panel data OLS may yield inconsistent standard error estimates because the dependent
variable and the main independent variable tend to be serially correlated within firm To alleviate
this concern following Bertrand et al (2004) in both Eqs (1) and (2) we collapse the panel to a
single ldquoPrerdquo (2003-2004) and a single ldquoPostrdquo (2005-2007) period by averaging across years and
then measuring the changes from Pre to Post11 We choose 2003 as the starting period in order to
capture a period subsequent to the 2003 tax cut on individual dividend income While the
evidence on the effect of the tax cut on payout policy is mixed (Chetty and Saez 2005 Edgerton
2013 Floyd et al 2015) starting with 2003 allows the pre-FAS123R levels of the key variables to
reflect any effect of the tax cut 12 We end our analysis in 2007 to avoid the potentially
confounding effect of the 2008 financial crisis which had a significant impact on payouts (Floyd et
al 2015)13 Following Hayes et al (2012) and Bakke et al (2015) we include 2005 in the Post
11 In the collapsed two-period panel a regression of changes is equivalent to a regression of levels with firm-fixed
effects and an indicator for the Post period Both approaches obviate unobserved time-invariant firm heterogeneity
We choose first differencing equation for a more intuitive interpretation 12 The Jobs and Growth Tax Relief Reconciliation Act of 2003 was signed into law on May 28 2003 but had been
proposed on January 7 2003 and was made retroactive to the beginning of 2003 Chetty and Saez (2005) show that
the tax change affected dividend policy in 2003 13 In November 2006 the Securities and Exchange Commission required more details about the terms of performance-
based incentive plans We are not aware of any evidence that these rules affected the weight of option-based pay
11
period because FAS123R while effective in June 2005 was released in December 2004 14
Alternatively in untabulated tests we exclude 2005 from the analysis and obtain similar results
Another benefit of using a single Pre and Post period is that it is better suited than panel
data to the analysis of repurchases As noted by Skinner (2008) firms engaging in repurchases
tend to do so every other year thus the relation between repurchases and economic determinants is
stronger over two- or three-year periods than one-year periods Factors explaining the timing of
repurchases differ from those explaining their level and the year-to-year variation in repurchases is
not necessarily informative of changes in payout policy As we are not interested in the timing of
repurchases our approach seems to better capture ldquolong-runrdquo changes in payout policy However
for the analysis of dividends (which are generally paid every year and thus not subject to the
above problem) we also present the results using a panel regression with firm- and year-fixed
effects To alleviate the problem of serial correlation discussed earlier we cluster the standard
errors by firm
22 Accounting Impact
As noted earlier all firms were affected by FAS123R making it difficult to identify a
control sample To capture variation in the cross-sectional impact of FAS123R in Eqs (1) and (2)
we use Accounting Impacti defined as the implied option expense disclosed in the footnote of the
income statement for the 2002 fiscal year scaled by total assets (we obtain similar findings when
scaling it by revenues) We measure this variable in 2002 (ie before the Pre period) rather than in
2003 or 2004 to avoid any confounding effect from the expected adopion of FAS123R (see
discussion in Section 33) As this variable is highly skewed (see Table 1) we define it based on
(Gipper 2015) or had any effect on payout policy However we exclude 2007 from the Post period in robustness tests
Our inferences are unchanged 14 FAS123R was released in December 2004 effective as of the beginning of the first interim or annual reporting
period beginning after June 15 2005 Subsequently the SEC allowed a six-month deferral making the standard
effective for fiscal years beginning after December 15 2005
12
its quartile rank We also presents results with separate indicators for the top three quartiles in
order to better isolate the difference between top quartile (the most lsquotreatedrsquo group) and bottom
quartile (the least lsquotreatedrsquo group and thus closer to the notion of a control group)
An alternative way to address the issue of a lack of control group is suggested by Bakke et
al (2015) They argue that two sets of firms were likely lsquounaffectedrsquo by FAS123R (i) firms that
did not grant options to the CEO in 2003 and 2004 as in these firms FAS123R could not affect
CEO option pay and thus her incentives to make policy changes (ii) firms that were already
voluntarily expensing stock options as of 2002 (ie before FASB began discussions of the new
standard) as these firms would not face any additional accounting charge under FAS123R
Our approach offers a number of advantages First instead of collapsing all lsquonon-controlrsquo
firms in a single lsquotreatedrsquo group we exploit cross-sectional variation among treatment firms in
terms of the likely impact of FAS123R effectively using the most and least affected firms
(respectively top and bottom quartile of implied option expense) as treatment and control group
As shown in Table 1 the implied option expense is highly skewed (ie only a relatively small
number of firms was heavily affected by FAS123R) Capturing this variation is likely to increase
the power of the test Second in Bakke et al (2015) what matters is that the treatment definition
captures an accounting-driven change in CEO option grants as their focus is on CEO risk-taking
incentives In our setting we want to capture an accounting-driven change both in CEO option
grants (predicted to affect incentives to use dividends) and in the overall use of stock options
(predicted to affect the use of repurchases) As noted in Section 31 (see footnote 20) many firms
without CEO option grants in 2003 and 2004 were issuing options to non-CEO executives and
other employees and thus facing a potential accounting charge under FAS123R Third about half
of the firms without CEO option grants in 2003 and 2004 issued options to the CEO in the Post-
13
period Hence it is not clear that the control firms were truly unaffected by FAS123R Finally
the implied option expense in 2002 (our measure of the expected accounting impact) is a function
of option grants made in prior years when firms could not anticipate the adoption of FAS123R In
contrast option grant decisions in 2003 and 2004 may be affected by its anticipated adoption as
FASB added accounting for stock-based compensation to its agenda in March 2003
Notwithstanding the above arguments throughout our study we also present the results
using the definition of treatment and control in Bakke et al (2015) In particular we modify Eqs
(1) and (2) by replacing Accounting Impact with Treated an indicator equal to zero for the two
groups of firms identified as lsquocontrolrsquo in Bakke et al (2015) and one for all other firms
23 Payout Variables and Control Variables
Following Brown et al (2007) our baseline measure for changes in dividends is the change
in the DividendAssets ratiomdashcomputed as the regular cash dividends paid during the year scaled
by total assets at the beginning of the yearmdashfrom the Pre to the Post period15 However the
dividend-to-asset ratio is not what managers focus on when making dividend policy decisions
The stability of dividend per share (DPS) among dividend-paying firms (hereinafter payers)
suggests that managers do not target a specific dividend-to-assets ratio but rather a DPS level
(Baker and Wurgler 2016) Survey evidence confirms that executives make dividend policy
decision in terms of changes to the current level of DPS (Brav et al 2005) Therefore we also
examine the percentage change in the average DPS from the Pre to the Post period However this
measure can only be computed for the subset of payers (defined as firms with non-zero DPS in at
15 An alternative choice would be to scale dividends by the market value of equity essentially computing a dividend
yield However a drawback of using the dividend yield in our setting is that after controlling for time-invariant firm
characteristics through fixed effects or first differencing the variation of the ratio comes mainly from the denominator
the stock price (Baker and Wurgler 2004) Thus we choose the more stable book value of total assets as denominator
Also similar to other studies (eg Fenn and Liang 2001) we focus on regular dividends and exclude special dividends
as they are very rare and may introduce large noise to the dividend measures for few observations (DeAngelo
DeAngelo and Skinner 2000)
14
least one of the years of the Pre period) To provide insights into FAS123Rrsquos effect on dividend
policy for non-payers we examine the relation between our Accounting Impact variable and the
rate of dividend initations in the Pre and Post periods
Our main measure for repurchases is the change in RepurchaseAssetsmdashthat is the
aggregate amount of common stock repurchases made during the year scaled by total assets at the
beginning of the yearmdashfrom the Pre to the Post period In the empirical tests we examine
variations suggested in the literature
Finally as an alternative to examining dividends and repurchases separately we also look at a
measure of the payout composition the change in the DividendsTotal Payout ratio from the Pre to
the Post period (Total Payout is the sum of dividends and repurchases) effectively capturing any
substitution effect between dividends and repurchases 16 Examining the causal effect of the
change in option-based pay on payout composition is especially relevant if managers first target a
total payout and then choose the relative weight of dividends and repurchases In practice it is
unclear to what extent managers act this way (Brav et al 2005) Nonetheless for completeness we
also examine this variable We focus on the subsample of firms with both dividends and
repurchases in both Pre and Post period so as to capture changes in payout mix by firms routinely
using both vehicles to return cash to shareholders
As for the control variables in both Eqs (1) and (2) Controli is a vector of firm characteristics
identified in existent literature as determinants of payout policy (eg Fenn and Liang 2001 Brown
et al 2007 Skinner 2008 Cuny et al 2009) firm size book-to-market leverage asset tangibility
free cash flows cash holdings volatility in operating income institutional ownership sales
16 Fama and French (2001) suggest that repurchases are often complement to dividends while Grullon and Michaely
(2002) document that the increase in share repurchases over the past decades has come at the expense of a lower
increase in dividends consistent with a substitution hypothesis Brown et al (2007) also provide evidence of a
substitution effect in response to the 2003 dividend tax cut Survey evidence in Brav et al (2005) suggests an
asymmetric substitution effect with managers more willing to replace dividends with repurchases than the opposite
15
growth past stock returns and an indicator for loss firms For all of these variables we include
both changes from Pre to Post period and levels in the Pre period to allow for the possibility that
levels of these variables affect subsequent changes in payout policy 17 Finally we include
industry-fixed effects (Fama-French 48 industry indicators) to control for industry-level trends in
payout policies and option-based pay In unreported tests we replace free cash flows with two
separate variables operating profit and capital expenditures We also replace volatility in
operating income with volatility in stock returns Our results are unaffected More detailed
definitions of each variable are in the Appendix
24 Identification Assumption
The key identifying assumption underlying the difference-in-difference estimation
technique is that the parallel trends assumption is satisfied In the absence of treatment both
treated and control firms should experience parallel trends in the outcome variable Our approach
assumes that in the absence of FAS123R the change in dividends or repurchases would be the
same for high and low accounting impact firms Note that the well-documented contemporaneous
correlation between levels of option compensation (a key driver of the implied option expense and
thus the accounting impact) and levels of payout variables does not violate our identification
assumption This is because our assumption pertains to the relation between the level of option
compensation and future changes in payout variables
A specific concern is that options may be granted in anticipation of expected future
changes in payout policy (reverse causality problem) Relative to simple association tests this
concern is significantly reduced in our setting because the accounting impact is measured three
years prior to the arrival of treatment and is the result of option grants made over the prior four or
17 In untabulated analyses we run our tests after excluding changes in the control variables (ie including only their
pre-treatment levels) since in difference-in-difference studies controlling variables measured after the shock may
reintroduce selection bias Our inferences remain unchanged
16
five years depending on the vesting schedule18 For the reverse causality to be plausible the
implied option expense in 2002 (the result of option grants made approximately between 1998 and
2002) needs to reflect the anticipated change in payout policy in 2005-2007 This seems unlikely
While the parallel trend assumption is not directly testable similar to other studies (Bakke
et al 2015) we examine the trends in dividends and repurchases during the Pre period Figure 1
suggests that high and low accounting impact firms (respectively top and bottom quartile of
implied option expense) exhibit similar trends in payout variables in the Pre period ie from 2003
to 2004 More formally to examine the correlation between Accounting Impact and trends in the
payout variables during the Pre period we estimate the following regression only with
observations in 2003 and 2004
Payouti = γ0 + γ1 Accounting Impacti FY2004+ γ2 FY2004+ ΓControli +Firm FE +ui (3)
where Payouti is either DividendAssets or RepurchaseAssets FY2004 is an indicator of
fiscal year 2004 Firm FE indicates firm-fixed effects If firms with varying degrees of accounting
impact have different payout trends before the adoption of FAS123R γ1 should be different from
zero However for both payout variables we find that the estimated γ1 is close to zero and not
statistically significant at 10 level (untabulated tests) Overall the parallel trends assumption
seems reasonable in our setting
3 Empirical analyses
31 Sample Selection and Summary Statistics
Our sample is the SampP 1500 firms with available data on implied option expense (from
Compustat) and on executive compensation (from Execucomp) for at least one year in the Pre
18 The accounting treatment for stock options requires their fair value at the grant date to be recognized over the
service period (usually the vesting period) Hence the implied option expense in a given year includes a fraction of
the expense associated with past option grants
17
period and one year in the Post period to ensure consistency in the sample across periods Similar
to prior studies on payout policy (Fama and French 2001 Skinner 2008) we exclude financial
firms (SIC code between 6000 and 6999) and utilities (SIC between code 4900 and 4999) as well as
firms not incorporated in the US Our final sample includes 1176 firms19 We obtain dividend
and stock returns data from CRSP stock repurchases and dividend per share data from
COMPUSTAT and institutional ownership data from Thomson Reuters 13F database Other
control variables are from CRSP and COMPUSTAT To deal with outliers we winsorize all
continuous variables at 1 and 99 by fiscal year A detailed definition of all variables and their
sources is in Appendix
Table 1 Panel A presents summary statistics of the relevant variables for the pooled sample of
5653 firm-year observations Implied option expense in 2002 (our proxy for Accounting Impact)
is on average 173 of total assets with the median at 052 This suggests that the accounting
impact is very large for a small number of firms Over the entire sample period on average
dividends represent 093 of total assets while repurchases represent 394 Untabulated
analyses indicate that in 16 of the firm-year observations only dividends are paid out in 25
only repurchases in 32 both and in 27 neither Within the subset of firm-years with a payout
dividends represent 3874 of total payout This data confirms prior evidence that repurchases
have assumed the primary role as a vehicle to return cash to shareholders (eg Floyd et al 2015)
The mean (median) total executive pay (average across the top 5 executives) is $25 million ($16
million) On average option grants and restricted stock grants represent respectively 283 and
141 of total pay while salary and bonus comprise 296 and 197 respectively The
19 The results presented in the study are similar when (i) we restrict the sample to firms with available data for the
entire (2003-2007) sample period (1009 firms) and (ii) we exclude firms with CEO turnover in the Post period
(reducing the sample size to 780 firms) as a new CEO may have a different compensation package andor adopt a
different payout policy
18
composition of CEO pay (untabulated) is similar As for the control variables the figures are
generally consistent with other studies examining SampP 1500 firms over the same period
Panel B reports the pairwise Pearson correlations among the relevant variables The
correlations are in line with the associations documented in prior studies For example larger
firms and firms with higher profitability (free cash flows) have higher payouts loss firms have
lower payouts greater volatility in operating income is associated with lower dividends
More relevant to our analysis Panel C presents the mean of each variable in the Pre and Post
period for the full sample For each variable we first compute the firm-level mean over the Pre
and the Post Period and then compute the mean of the resulting figure across all firms There is a
striking increase in repurchases which double from 245 to 490 of total assets causing a
similar increase in total payout The increase in dividends is much smaller from 083 to 099
of total assets As a result for firms with positive payout dividends become a smaller fraction of
total payout in the Post period (2790 versus 3914 in the Pre period) This trend is consistent
with Floyd et al (2015) who document a dramatic increase in repurchases in the years leading to
the 2008 financial crisis Consistent with previous studies around FAS123R there is a significant
reduction in option grants as a fraction of total executive pay (from 343 to 240) and a
corresponding increase in the use of restricted stock (from 87 to 176) with little variation in
the weight of salary and bonus (note that restricted stock salary and bonus were expensed both
before and after FAS123R) Similar patterns hold for the composition of CEO pay (untabulated)
Compared to changes in the mix of executive pay changes in the levels of control variables are
generally less pronounced
Panel D reports the change in the key compensation and payout variables from the Pre to the
Post period by quartiles of implied option expense and yields a number of insights First
19
confirming the skewness suggested by Panel A the mean implied option expense is 551 for
firms in the top quartile versus only 093 035 and 012 for firms in the second third and
bottom quartile respectively Second as expected firms with higher implied option expense have
greater use of option-based pay For example in the Pre-period option pay represents 507 of
total executive pay at firms in the top quartile versus 201 in the bottom quartile Third and
more importantly for our research design the use of option pay changes significantly from the Pre
to the Post period as a function of the accounting impact For firms in the top quartile the
percentage of total pay represented by stock options drops by 182 (from 507 to 325)
versus 113 80 and 34 for firms in the second third and bottom quartile respectively The
decline in option usage across quartiles is accompanied by an increase in restricted stock grants
while the weight of salary and bonus shows little change It is important to emphasize the
substitution of stock options with restricted stocks because restricted stocks typically pay
dividends (Zhang 2013) thus providing further reason to expect a dividend increase in response to
the FAS123R-induced decline in option pay
As for the payout variables Panel D suggests that heavy option users (firms with higher
implied option expense) generally use repurchases more than dividends consistent with the
associations documented in earlier studies In the Pre period repurchases (dividends) represent
351 (030) of total assets for the top quartile versus 113 (112) for the bottom quartile
Panel D also indicates that the increase in repurchases documented in Panel C takes place across
all quartiles As for the (much smaller) change in dividends the absolute increase is similar across
the four quartiles though the relative increase (the percentage change) appears to be slightly
higher in the top quartile Overall these figures do not suggest a shift toward dividends and away
from repurchases by firms with a large (accounting-induced) decline in the use of option pay
20
Panel E presents the same data as Panel D but based on the definition of lsquotreatmentrsquo and
lsquocontrolrsquo in Bakke et al (2015) Under this definition 997 firms are classified as treatment group
and 177 as control (171 firms are classified as lsquocontrolrsquo because they did not grant options to the
CEO in the Pre period and 6 because they were voluntarily expensing options before 2003)
Interestingly lsquotreatedrsquo firms are equally distributed across the quartiles suggesting significant
variation in the degree of treatment As discussed earlier one benefit of our approach is that it
exploits cross-sectional variation among treatment firms in terms of the likely impact of FAS123R
Also 40 of the control firms (71 out of 177) are in the lowest quartile while 35 ((37+25)177)
are in the top two quartiles reflecting the different focus of the two approaches in terms of
identifying firms less affected by FAS123R20
As for payout and compensation variables Panel E shows that the treated group experiences a
larger increase in repurchases than the control group while the (less pronounced) increase in
dividends is similar across treated and control firms Treated firms experience a 126 decrease in
option pay (from 387 to 261) with a corresponding 94 increase in the weight of restricted
stock grants (from 80 to 174) The figures are similar at the CEO level (because the
classification is based on options grants to the CEO it is useful to report pay figures at both the top
5 executives and the CEO level) Interestingly the control group experiences a pronounced
increase in the weight of option grants in total CEO pay from 10 to 127 as almost half of the
control firms issued options to their CEOs in the Post period (for these firms options as percentage
of total CEO pay increased from 0 to 254 untabulated analysis) While this increased use of
stock options suggests (ex post) that these firms were not concerned with the impact of FAS123R
another possibility is that the lack of use of option compensation for CEOs in 2003 and 2004 was
20 In untabulated analysis we find that 55 of the 171 firms issuing no options to the CEO in the Pre period granted
options to the other top executives (and perhaps to other non-executive employees) thus explaining the relatively high
implied option expense for the control group (10 versus 19 for the treatment group ndash see Panel E)
21
temporary rather than the effect of a permanent policy If these firms were planning to issue
options to the CEO in the Post period the assumption that they were unaffected by FAS123R (and
thus their use as control sample) is questionable21
32 Differential Impact of FAS123R on the Use of Option-Based Compensation
An important building block of our approach is the presumed differential impact of FAS123R
on option-based pay as a function of pre-existing implied option expense22 While Table 1 Panel
D preliminarily supports the validity of this assumption we formally examine it by estimating Eq
(1)
As reported in Table 2 Panel A we find a significant negative association between Accounting
Impact and the change in option-based pay around the adoption of FAS123R In column (1)
where we use the quartile rank of implied option expense the -0044 coefficient implies that
around FAS123R option grants over total pay decline by 44 as we move from the highest
quartile to the next Thus the reduction in top quartile firms is 132 larger than in bottom
quartile firms In column 2 we replace the quartile rank with three indicators for the highest
quartiles (with the bottom quartile collapsed in the intercept) so as to be able to compare directly
top and bottom quartile without imposing the same effect across quartiles The negative and
significant coefficient on the top quartile indicator at -0140 suggests that the reduction in option
grants over total pay is 140 larger for top quartile firms relative to bottom quartile firms
Finally in column 3 we use the indicator for treated firms following Bakke et al (2015) The
21 Panel E also shows an increase in the use of restricted stock in CEO pay packages (from 128 to 182 almost
comparable to the increase among treated firms) The concurrent increase in options and restricted stock suggests
these firms would have increased option pay significantly more had it not been for FAS123R indicating further
caution in classifying them as control group of unaffected firms 22 This is akin to the relevance assumption of instrumental variable if we interpret the implied option expense as an
instrument to the change in option-based pay
22
negative and significant coefficient at -0132 suggests that treated firms experience a 132
larger drop in the weight of option pay relative to control firms
In Panel B we re-estimate Eq (1) using a panel regression with firm- and year-fixed effects
(5653 firm-year observations) where the dependent variable is the the ratio of option grants to
total executive pay The results are virtually identical in terms of significance and magnitude of
the coefficients of interest (the interaction terms between respectively Accounting impact and
Treated and an indicator for the Post period)
Overall Table 2 suggests that high implied option expense and the introduction of FAS123R
together strongly encouraged firms to cut back option-based compensation for executives It also
supports the general validity of the approach in Bakke et al (2015) in identifying firms most
affected by FAS123R notwithstanding the concerns outlined earlier
Our test of Eq (1) focuses on executive stock options For our dividend-protection hypothesis
it is important to establish that the level of implied option expense predicts a change in executive
stock options (rather than only a change in the use of non-executive employee stock options) as we
want to capture the effect of a change in executivesrsquo incentives on payout policy At the same
time our dilution channel hypothesis assumes a change in the use of all (executive and non-
executive employee) stock options Thus in untabulated analyses we repeat the test in Eq (1) by
replacing the dependent variable with the change in the number of options granted to all
employees (scaled by the total number of outstanding shares note for this analysis we can only
use data from 2004 to 2007 because Compustat began reporting data on ESO in 2004) The
coefficient on Accounting Impact and Treated continues to be negative and significant suggesting
that the differential reduction in the use of option compensation as a function of accounting impact
23
occurred for both executive and non-executive employee stock options Indeed Brown and Lee
(2011) report a similar decrease in executive and employee stock options around FAS123R
33 Option-Based Pay and Dividend Payouts
In this section we examine the effect of an exogenous (accounting-induced) change in option
compensation on dividend policy by estimating Equation (2)
Table 3 Panel A presents the results using the change in dividends from Pre to Post as
dependent variable We find no significant association between Accounting Impact (column 1 and
2) or Treated (column 3) and the change in dividends around the adoption of FAS123R This is in
stark contrast with the negative effect of option-based pay on dividends predicted in the literature
and documented in various association studies
One concern with this lack of effect is that perhaps our setting is not powerful enough to detect
it One way to examine this possibility is the following The coefficient on Accounting Impact
rank=4 in column 2 is 0001 and the standard error (SE) is 00009 Assuming the estimated
standard error is correct then for a two-tailed t test the coefficient needs to be greater than 00015
(=SE1645) or 015 to reach the 10 percent significant level In other words if moving from
the bottom to the top quartile (which predicts a 14 differential decline in option based pay as per
Table 2 Panel A) resulted in a 015 increase of the dividendasset ratio our test would be able to
detect a causal effect of option-based pay on dividends Given the unconditional mean of the
dividendasset ratio at 093 an increase of 015 from the Pre to the Post period seems
plausible In fact the average increase from the Pre to the Post period is 016 (Table 1 Panel C)
Thus if an effect was there our test should detect it
24
Panel B presents the results using a panel regression (5653 firm-year observations) with firm-
and year-fixed effects and interaction terms between Accounting Impact (or Treated) and an
indicator for the Post period Our inferences are unchanged
These analyses are based on our full sample which includes both dividend-paying and non-
dividend-paying firms Hence they implicity treat as equal two potentially different decisions to
initiate dividends and to increase dividends For example an increase in the dividend-to-asset
ratio from 05 to 06 will be treated the same as an increase from 00 to 01 even though
the latter represents a critical dividend initiation decision23 To address this following Chetty and
Saez (2005) we separately examine how FAS123R impacts the intensity of dividend changes (for
the subset of payers) and the likelihood of dividend initiations (for the subset of non-payers)
331 Option-Based Pay and Dividend Payouts Intensity of Dividend Changes
In the first row of Panel C we repeat the analysis in Panel A for the sub-sample of 572 payers
defined as firms with positive DPS in 2003 andor 2004 Note that we report only the coefficients
of interest for parsimony In the second row we replace the dependent variable with the
percentage change in DPS DPS is the choice variable for managers (Brav et al 2005 Baker and
Wurgler 2016) and thus our preferred measure to capture changes in dividend policy To account
for skewness in this variable (Khale 2002) in the third fourth and fifth rows we use indicator
variables to denote whether the change in DPS surpasses a threshold respectively 20 40 and
60 The proportion of firms that surpass these thresholds are 59 44 and 33 respectively24
23 Initiating dividends is a critical decision for boards given the pre-commitment value that investors attach to this
decision and the strong negative market reaction when firms eliminate or reduce dividends (Brav et al 2005) For
executives trying to maximize the value of their own stock options (dividend-protection argument) the ability to
influence a dividend initiation decision is likely lower than the ability to influence a dividend increase decision 24 Although in the third fourth and fifth rows our dependent variable is a binary variable we use a linear model (OLS)
instead of a probit or logit nonlinear model The reason is that estimating fixed effects in binary response models with
panel data can cause the incidental parameters problem The coefficient estimates can be biased when the panel data
25
Across all of these specifications we find no association between Accounting Impact or Treated
and the intensity of dividend changes Thus it does not appear that an exogenous reduction in
option-based pay caused dividend-paying firms to increase dividends
In Panel D we perform four robustness tests For parsimony we show only the coefficients of
interest and only the cases where the dependent variable is an indicator denoting a greater than
40 increase in DPS The results are similar for the other four ldquointensityrdquo dependent variables
reported in Panel C
In the first row we exclude firms that began to voluntarily expense options in 2003 or 2004
(84 firms of which 68 are dividend payers) FASB added accounting for stock-based
compensation to its agenda in March 2003 and issued an Exposure Draft proposing the expensing
of stock options at fair value in March 2004 In anticipation a number of firms began to
voluntarily expense stock options in 2003 and 2004 (Aboody et al 2004) If these firms reduced
option grants and as a result increased dividends during the Pre period then their inclusion may
reduce the power of our tests and thus our ability to detect the hypothesized relation25
In a similar spirit in the second row we exclude firms in the top decile in terms of reduction in
the ratio of option grants to total pay for the top 5 executives between 2002 (the year prior to the
Pre-period) and 2004 (the end of the Pre-period) This encompasses 113 firms of which 55 are
dividend payers If these firms reduced option grants in anticipation of FAS123R and as a result
increased dividends during the Pre period their inclusion may reduce our ability to detect the
hypothesized relation
has a large number of observations but a short time series Examples of studies making a similar choice are Puri
Rocholl and Steffen (2011) and Chu and Ma (2015) 25 This is unlikely to be a serious concern as previous studies suggest that voluntary expensers made limited use of
stock options (Aboody et al 2004) In fact in our sample 79 of these firms are in the bottom two quartiles of
implied option expense (untabulated) Nonetheless we present this test for robustness
26
In the third row we exclude firms that accelerated the vesting of options before FAS123R
became effective in order to avoid recognizing an expense for the unvested portion of these
options (Choudhary et al 2009 Balsam Reitenga and Yin 2008) This encompasses 196 firms of
which 54 are dividend payers If accelerating vesting was used to reduce the impact of FAS123R
the inclusion of these firms may reduce the power of our tests26
In the fourth row we deal with the concern that if firms target a fixed dividend to net income
ratio (Lintner 1956) and do so without adjusting for changes in accounting standards then by
decreasing net income (via option expense) the accounting change would mechanically cause a
reduction in dividends This would potentially offset and confound the increase predicted under
the dividend-protection and dilution hypotheses This seems unlikely for two reasons First firms
are notoriously reluctant to cut dividends (Brav et al 2005) Hence it seems unlikely that they
would reduce dividends in response to a decline in net income with no economic or cash flow
implications (ie re-classification of an expense from the footnotes to the income statement)
Second firms today set dividends in terms of dividend per share rather than by targeting a net
income-based payout ratio (Brav et al (2005)) As noted by Skinner (2008) over the last few
decades as earnings have become more variable the relation between earnings and dividends has
become weaker with dividend payments increasing smoothly and largely independent of the
variation in earnings Nevertheless in the fourth row we exclude the 66 dividend-paying firms that
26 These firms explicitly stated that they accelerated the vesting of stock options to avoid the accounting charge
(Choudhary et al 2009) In fact 72 are classified in the top two quartiles of implied option expense (untabulated)
Thus we would have predicted these firms to experience a significant decline in option pay To the extent that this
decline did not materialize because they minimized the impact of FAS123R by accelerating vesting the ability of
Accounting Impact to predict the reduction in option pay and thus its usefulness in examining changes in dividends
around FAS123R may be reduced The list of firms accelerating vesting was kindly provided by Jack Ciesielsky of
The Analystsrsquo Accounting Observer
27
had a similar payout ratio in 2003 and 2004 as a proxy for firms with a target net income-based
payout ratio in the Pre period27
As shown in Panel D even after excluding these subsets of firms we continue to find no
association between Accounting Impact or Treated and changes in dividends for dividend-paying
firms This is inconsistent with a causal influence of option compensation on dividend policy
Another concern is that by reducing net income and thus retained earnings FAS123R
may have pushed some firms closer to violating dividend covenants in debt contracts and
thus prevented them from increasing dividends This would bias our study against finding a
causal effect of option-based pay on dividends However this does not appear to be a
significant concern for three reasons First the recognition of an option expense does not
imply a decline in net income In fact more than 70 (75) of the full sample firms
(dividend payers) experienced an increase in net income before extraordinary items from
2004 to 2005 (the percentages are similar across the four quartiles of implied option
expense) Second dividend covenants are less common among dividend-paying firms
(Nikolaev 2010) Third most loan contracts in recent years give parties the option to
ldquofreezerdquo GAAP when facing a mandatory change in accounting principles (Christensen and
Nikolaev 2009) Firms expecting an adverse impact of FAS123R on their dividend covenants
would likely exercise this option (particularly given the non-cash nature of option-based
expense) Nonetheless to alleviate this concern we perform three additional analyses
(untabulated) (i) we repeat the tests in Panel C after excluding firms with a drop in net
income between 2004 and 2005 (ie firms that perhaps faced some covenant-related
27 We define a ldquosimilarrdquo payout to be an absolute change in payout ratio of less than 1 from 2003 to 2004 Among
these 66 firms only 39 continued to have a similar payout ratio in 2005 We also try an alternative definition where
a firm is classified as likely to be using a net income-based target payout ratio if the absolute percentage change in the
ratio from 2003 to 2004 is less than 10 (100 firms) Our inferences are unchanged
28
constrains to their payout policy as a result of FAS123R) (ii) we explicitly control for net
income and retained earnings in the regression (as in Skinner 2008) (iii) we repeat the tests
in Panel C for dividend payers with dividendsasset ratio above the sample median on the
basis that dividend covenants are less frequent among firms paying large dividends (Jung
Lee and Yang 2016) Our inferences are unchanged
332 Option-Based Pay and Dividend Payouts Dividend Initiations
In this section we examine whether the accounting-driven change in option pay affected
dividend initiations among non-payers We cannot employ the difference-in-difference approach
adopted so far by definition the same firm cannot initiate dividends in both periods However we
can provide suggestive evidence as follows First we take all firms that did not pay dividends in
2002 and group them into quartiles based on 2002 implied option expense For each quartile we
find the number of firms initiating dividends in 2003 and 2004 (the Pre period) Next we take all
firms that did not pay dividends in 2004 group them into quartiles based on 2002 implied option
expense and for each quartile find the number of firms initiating dividends in 2005 and 2006 (the
Post period) We do not include 2007 so as to have the same number of years in both periods and
make the cumulative initiation rates comparable
The left portion of Panel E reports the results of this exercise There is a general decrease in
the dividend initiation rate from the Pre to the Post period This holds both in the full sample of
non-payers (from 129 to 79) and across all quartiles This decrease may reflect a temporary
spike in 2003 and 2004 in response to the 2003 dividend tax cut documented in Chetty and Saez
(2005) It is noteworthy that initiation rates in both periods are lower among firms with higher
implied option expense This is consistent with option-heavy firms being mostly high-growth
firms less inclined to pay dividends More relevant to our research question if the lower use of
29
option compensation increased the propensity to pay dividends we would expect to see a relative
increase (ie a lower decrease) in dividend initiations among firms with the highest accounting
impact Instead the rate does not differ depending on the accounting impact There is
approximatley a 5 decline in initiation rate in each quartile In the right portion of Panel E we
examine similar data for dividend terminations While the results should be interpreted with
caution due to their rarity firms with higher accounting impact do not experience a greater decline
in termination rates Our inferences in Panel E are similar when we compared treated and control
firms following Bakke et al (2015) (untabulated)
Even after taking into account the different nature of decisions for dividend paying and non-
dividend-paying firms we fail to find evidence of a causal influence of option-based compensation
on dividend policy This finding is in contrast to the associations documented in earlier studies It
is even more remarkable as most firms replaced stock options with restricted stock which are
generally dividend-protected and should provide further incentive to increase dividends28
34 Option-Based Pay and Repurchases
In this section we examine the effect of an exogenous (accounting-induced) change in option
compensation on repurchases by estimating Equation (2)
Table 4 Panel A presents the results using the change in repurchases (scaled by total assets)
from Pre to Post as a dependent variable If the use of option-based pay had a positive effect on
firmsrsquo propensity to engage in repurchases as posited by the dividend-protection and dilution
hypotheses we should find a negative association between Accounting Impact or Treated and
repurchases Firms with a higher (accounting-driven) reduction in option-based pay should reduce
28 In a sample of SampP 500 firms between 2000 and 2009 Zhang (2013) reports that 80 of the firms granting
restricted stocks offer dividend protection In that sense the FAS123R-induced shift from stock options to restricted
stock may be characterized as a ldquoshockrdquo to dividend protection in unearned equity pay Accordingly our results cast
doubt on the causal interpretation of the positive association between dividend protection and dividend payouts
documented in prior studies (Zhang 2013 Burns et al 2015 Minnick and Rosenthal 2015)
30
the use of repurchases either because they are shifting toward a greater use of dividends andor
because they have a lower need to offset the dilutive effects of stock options However we find no
significant association between Accounting Impact (columns 1 and 2) and the change in
repurchases around the adoption of FAS123R When we use the Treated indicator (column 3) we
find a significant positive association rather than a negative one In Panel B we repeat the analysis
using net repurchases (ie repurchases after removing the effect of share issuances) following
Fama and French (2001) and Skinner (2008) Our inferences are unchanged29
This test is subject to two important caveats The first is we may not detect a decline in
repurchases because in the Post period firms need to offset the exercise of options that were
granted during the Pre period That is a post-FAS123R reduction in grants may not (yet) translate
into a reduction in exercises during the Post period which reduces our ability to test the dilution
hypothesis (ie that firms repurchase shares to offset exercises)30 However we can examine a
variation of this hypothesis where firms use repurchases to manage the effect of unexercised
options on diluted EPS (Bens et al 2003) To do so in Panel C we use a measure of adjusted
repurchases where we subtract our estimate of repurchases undertaken to offset the exercise of
ESO31 We effectively test whether firms experiencing an accounting-induced decrease in option
grants engage in less repurchases (net of exercise-driven repurchases) because their need to
manage the effect of unexercised options on diluted EPS is lower However the coefficient on
the variables of interest is either insignificant or positive inconsistent with the hypothesis
29 In the case of repurchases we do not examine separately ldquoinitiationsrdquo and ldquointensityrdquo as we do for dividends
because initiation is not clearly defined for repurchases Unlike dividends the occurrence of a repurchase in a given
year (or the lack thereof) cannot be used to infer a general policy due to the more discretionary nature of the timing of
repurchases 30 To capture the effect of lower option-based compensation on option exercises and thus on repurchases we would
ideally extend the Post period beyond 2007 However as noted by Floyd et al (2015) repurchases declined
dramatically after 2007 because of the financial crisis making it difficult to detect the effect of any other factor 31 As upper bound estimate of exercise-driven repurchases we multiply the number of ESO exercised during the year
times the average stock price during the year Since the number of ESO exercised is available in Compustat starting in
2004 Panel C is based on observations from 2004 to 2007
31
A second important caveat is that most firms replaced stock options with restricted stock
(Table 2 Panel C) Unvested restricted stock is excluded from the denominator in the computation
of basic EPS (once vested it is included) However it is included in the denominator of diluted
EPS using the treasury stock method similar to stock options Given the complexity of this
method without access to all details of restricted stock grants and option grants it is difficult to
determine whether the switch from stock options to restricted stock decreased the need for
dilution-driven repurchases as our test implicitly assumes Hence it is possible that we do not find
a decrease in repurchases because a reduced need to offset the dilutive effect of stock options was
neutralized by an increased need to offset the dilutive effect of restricted stock
Subject to the above caveats the evidence in Table 4 is not consistent with a positive causal
relation between the use of option-based pay and repurchases More precisely it suggests that
option-driven dilution concerns do not have a first-order effect on the magnitude of repurchases
even though they may play a role in the repurchase decision Hence our result is not necessarily
in conflict with the evidence in Brav et al (2005) where two-thirds of the surveyed financial
executives state that offsetting the dilutionary effect of stock option plans or other stock
programs is an important factor to their repurchase decisions
35 Option-Based Pay and Payout Composition
As an alternative to examining dividends and repurchases separately we also look at the
payout composition the change in the DividendsTotal Payout ratio from the Pre to the Post period
where Total Payout is the sum of dividends and repurchases As noted earlier we focus on the
subsample of firms with both dividends and repurchases in both Pre and Post periods so as to
capture the change in payout mix by firms routinely using both vehicles to return cash to
shareholders If the use of option-based pay causes firms to substitute repurchases for dividends
32
we should find a positive association between Accounting Impact or Treated and the payout mix
defined as DividendsTotal Payout ratio Firms with a higher accounting-driven reduction in
option-based pay should have an increase (decrease) in the relative weight of dividends
(repurchases) to the total payout However as reported in Table 5 Panel A we fail to find a
significant association between Accounting Impact (column 1 and 2) or Treated (column 3) and
the change in payout mix The results are similar when we use Net Payout (dividends plus net
repurchases) instead of Total Payout in computing the payout mix (Panel B)
Overall the combined evidence in Tables 3-5 does not support the hypothesis that option-
based compensation has negative (positive) effect on dividends (repurchases) or that it causes
firms to replace dividends with repurchases
4 Conclusion
Prior literature has documented robust associations between option-based compensation and
payout policy yet it remains unclear whether this association reflcts a causal influence We
investigate the causal effect of option-based compensation on payout policy using the adoption of
FAS123R which resulted in a significant decrease in option grants making it a plausible
exogenous shock to the use of option-based pay To overcome the challenge of no control group
we exploit the fact that firms responded differently depending on the firm-specific accounting
impact as measured by the implied option expense disclosed in the footnotes prior to FAS123R
Firms with larger expected accounting impact curtailed option-based compensation much more
aggressively than firms with lower impact Using a sample of SampP 1500 firms we find no
evidence that firms with a larger accounting-induced decline in option compensation increased
dividends reduced repurchases or changed their payout composition contrary to the widely held
belief that option-based pay has a causal influence on payout policy
33
Appendix Variable Definitions and Data Sources
Accounting Impact Variables
Accounting impact Implied option expense (Compustat XINTOPT) divided by total assets
(Compustat AT) This variable is measured at fiscal year 2002 and is time-invariant
Accounting impact rank The quartile rank of Accounting impact (1=lowest 4=highest)
Payout Variables
Regular dividendTotal assets The numerator is total regular cash dividends in the fiscal year
from the distribution dataset in CRSP Regular cash dividends are identified by the distribution
codes 1212 1222 1232 or 1242 The denominator is one-year lagged total assets (Compustat
AT)
DPS Dividend per share (Compustat DVPSX_F)
DPS pct change The percentage change of average DPS from Pre- to Post-FAS123R period
DPS pct change gtX indicator A dummy variable that equals one if DPC pct change is greater
than X and zero otherwise
RepurchaseTotal assets The numerator is the repurchase of common equity which equals total
repurchase (Compustat PRSTK) minus the change in preferred stock redemption value
(Compustat PSTKRV) The denominator is one-year lagged total assets (Compustat AT)
Net repurchaseTotal assets Net repurchase removes the effect of share issuances The
construction follows Fama and French (2001) and Skinner (2008) if the firm uses the treasury
stock method for repurchase net repurchase equals the increase in common treasury stock
(Compustat TSTKC) if the firm uses the retirement method (when common treasury stock is zero
in the current and prior year) net repurchase equals total repurchases minus stock issuance
(Compustat SSTK) and change in preferred stock redemption value (Compustat PSTKRV)
When the above measures give negative value net repurchase is set to zero
Adjusted repurchaseTotal assets Adjusted repurchase removes from total repurchase the potential
effect of repurchasing exercised options This variable equals total repurchase of common stocks
minus the product between the number of options exercised (Compustat OPTEXD) and average
stock price during the year When the above measure gives negative value adjusted repurchase is
set to zero Since the number of options exercised is not available before 2003 we drop
observations in 2003 when we use this variable
34
Total payoutTotal assets the sum of Regular dividendTotal assets and RepurchaseTotal assets
Regular dividendTotal payout regular cash dividend divided by the sum of regular cash dividend
and repurchase from common equity In the two-period analysis (Pre- vs Post-FAS123R) we
separately sum the numerator and the denominator for each firm-period and then calculate the ratio
Regular dividendNet payout regular dividend divided by the sum of regular dividend and net
repurchase In the two-period analysis (Pre- vs Post-FAS123R) we separately sum the numerator
and the denominator for each firm-period and then calculate the ratio
Compensation Variables
Salary_$ Average salary (Execucomp SALARY) of the top 5 highest paid executives in $1000
Salary_ Average salary (Execucomp SALARY) divided by average total pay (Execucomp
TDC1) of the top 5 highest paid executives
Bonus_$ Average bonus (Execucomp BONUS) of the top 5 highest paid executives in $1000
Due to a data format change we add non-equity plan-based awards (Execucomp
NON_EQ_TARG) to this measure after 2006
Bonus_ Bonus_$ divided by average total pay (Execucomp TDC1) of the top 5 highest paid
executives
Option grant_$ Average option grant value (Execucomp OPTION_AWARDS_BLK_VALUE or
OPTION_AWARDS_FV) of the top 5 highest paid executives in $1000 Due to a data format
change we use OPTION_AWARDS_FV for this measure after 2006
Option grant_ Option grant_$ divided by average total pay (Execucomp TDC1) of the top 5
highest paid executives
Restricted stock grant_$ Average restricted stock grant value (Execucomp RSTKGRNT or
STOCK_AWARDS_FV) of the top 5 highest paid executives in $1000 Due to data format
change we use STOCK_AWARDS_FV for this measure after 2006
Restricted stock grant_ Restricted stock grant_$ divided by average total pay (Execucomp
TDC1) of the top 5 highest paid executives
Total pay_$ Average total pay (Execucomp TDC1) of the top 5 highest paid executives in $1000
35
Other Characteristics
Size The book value of total assets (Compustat AT) minus the book value of common equity
(Compustat CEQ) plus the market value of common equity from CRSP in $M
Log(size) the natural logarithm of size
Book-to-market the book value of common equity dividend by its market value
Leverage long term debt plus short term debt (Compustat DLTT + DLC) divided by total assets
Asset tangibility tangible assets (Compustat AT - INTAN) divided by total assets
Free cash flow Operating cash flow (Compustat OANCF) minus capital expenditure (Compustat
CAPX) then divided by lagged total assets
Cash holding Cash and short-term investments (Compustat CHE) divided by total assets
ROA volatility the standard deviation of returns on assets (operating income before tax divided by
lagged total assets) in the past five fiscal years
Institutional ownership the number of shares held by institutional investors divided by the number
of shares outstanding from Thomson Reuters Institutional Holdings database
Sales growth the growth rate of sales (Compustat SALE) from the prior year
Past stock return annual stock return from the prior year
Loss indicator a dummy variable taking value of one if the current net income is negative and
zero otherwise
36
References
Aboody David 1996 Market Valuation of Employee Stock Options Journal of Accounting and
Economics 22 357-391
Aboody David Barth Mary E and Ron Kasznik 2004 Firms Voluntary Recognition of Stock-
Based Compensation Expense Journal of Accounting Research 42 123ndash150
Aboody David and Ron Kasznik 2008 Executive stock-based compensation and firmsrsquo cash
payout the role of shareholdersrsquo tax-related payout preferences Review of Accounting Studies
13 216ndash251
Anantharaman Divya and Yong Gyu Lee 2014 Managerial risk taking incentives and corporate
pension policy Journal of Financial Economics 111 328ndash351
Baker Malcolm and Jeffrey Wurgler 2004 A catering theory of dividends Journal of Finance
59 1125-1165
Baker Malcolm and Jeffrey Wurgler 2016 Dividends as reference points a behavioral signaling
approach Review of Financial Studies 29 697-738
Bakke Tor-Erik Hamed Mahmudi Chitru Fernando and Jesus Salas 2015 The causal effect of
option pay on corporate risk management Journal of Financial Economics forthcoming
Balsam Steven Austin Reitenga and Jennifer Yin 2008 Option acceleration in response to SFAS
No 123 (R) Accounting Horizons 22 23-45
Bens Daniel and Steven Monahan 2008 Altering Investment Decisions to Manage Financial
Reporting Outcomes Asset-Backed Commercial Paper Conduits and FIN 46 Journal of
Accounting Research 46 1017-1055
Bens Daniel A Venky Nagar Douglas J Skinner and MH Franco Wong 2003 Employee stock
options eps dilution and stock repurchases Journal of Accounting and Economics 36 51ndash90
Bertrand Marianne Esther Duflo and Sendhil Mullainathan 2004 How much should we trust
differences-in-differences estimates The Quarterly Journal of Economics 119 249ndash275
Blouin Jennifer L Jana S Raedy and Douglas A Shackelford 2011 Dividends Share
Repurchases and Tax Clienteles Evidence from the 2003 Reductions in Shareholder Taxes
The Accounting Review 86 887-914
Brav Alon John R Graham Campbell R Harvey and Roni Michaely 2005 Payout policy in the
21st century Journal of Financial Economics 77 483ndash527
Brown Lawrence D and Yen-Jung Lee 2011 Changes in Option-Based Compensation Around
the Issuance of SFAS123R Journal of Business Finance amp Accounting 38 1053ndash109
37
Brown Jeffrey R Nellie Liang and Scott Weisbenner 2007 Executive financial incentives and
payout policy Firm responses to the 2003 dividend tax cut Journal of Finance 62 1935ndash
1965
Burns Natasha Brian McTier and Kristina Minnick 2015 Equity-incentive compensation and
payout policy in Europe Journal of Corporate Finance 30 85-97
Carter Mary Ellen and Luann J Lynch 2003 The Consequences of the FASBrsquos 1998 Proposal on
Accounting for Stock Option Repricing Journal of Accounting and Economics 35 51-72
Carter Mary Ellen Luann J Lynch and Irem Tuna 2007 The role of accounting in the design of
CEO equity compensation The Accounting Review 82 327ndash357
Chava Sudheer and Amiyatosh Purnanandam 2010 CEOs versus CFOs Incentives and
corporate policies Journal of Financial Economics 97 263ndash278
Chetty Raj and Emmanuel Saez 2005 Dividend taxes and corporate behavior Evidence from the
2003 dividend tax cut The Quarterly Journal of Economics 120 791ndash833
Choudhary Preeti Shivaram Rajgopal and Mohan Venkatachalam 2009 Accelerated vesting of
employee stock options in anticipation of FAS123R Journal of Accounting Research 47 105ndash
146
Christensen Hans B and Valeri Nikolaev 2009 Contracting on Mandatory Changes to GAAP
New Practice and Its Determinants Working Paper University of Chicago
Chu Yongqiang and Tao Ma 2015 How does management compensation affect bank risk taking
evidence from FAS 123R University of South Carolina Working Paper
Cuny Charles J Gerald S Martin and John J Puthenpurackal 2009 Stock options and total
payout Journal of Financial and Quantitative Analysis 44 391ndash410
DeAngelo Harry Linda DeAngelo and Douglas J Skinner 2000 Special Dividends and the
Evolution of Dividend Signaling Journal of Financial Economics 57 309-354
Dechow Patricia M Amy P Hutton and Richard G Sloan 1996 Economic consequences of
accounting for stock-based compensation Journal of Accounting Research 34 1ndash20
Edgerton J 2013 Four facts about dividend payouts and the 2003 tax cut International Tax and
Public Finance 20 769-784
Edmans Alex and Xavier Gabaix 2015 Executive compensation a modern primer Journal of
Economic Literature forthcoming
38
Fama Eugene F and Kenneth R French 2001 Disappearing dividends changing firm
characteristics or lower propensity to pay Journal of Financial Economics 60 3ndash43
Farre-Mensa Joan Roni Michaely and Martin C Schmalz 2014 Payout policy Annual Review
of Financial Economics 6 75ndash134
Fenn George W and Nellie Liang 2001 Corporate payout policy and managerial stock
incentives Journal of Financial Economics 60 45ndash72
Ferri Fabrizio and Tatiana Sandino 2009 The impact of shareholder activism on financial
reporting and compensation the case of employee stock options expensing The Accounting
Review 84 433ndash466
Floyd Eric Nan Li and Douglas J Skinner 2015 Payout policy through the financial crisis the
growth of repurchases and the resilience of dividends Journal of Financial Economics 118
299-316
Frydman Carola and Dirk Jenter 2010 CEO compensation Annual Review of Financial
Economics 2 75-102
Gipper Brandon 2015 Assessing the Effects of Disclosing Management Compensation Working
Paper University of Chicago
Gormley Todd David Matsa and Todd Milbourn 2013 CEO compensation and corporate risk
evidence from a natural experiment Journal of Accounting and Economics 56 79-101
Graham John Michelle Hanlon and Terry Shevlin 2011 Real effects of accounting rules
evidence from multinational firmsrsquo investment locations and profit repatriation decisions
Journal of Accounting Research 49 137-185
Graham John Campbell Harvey and Shiva Rajgopal 2005 The Economic implications of
corporate financial reporting Journal of Accounting and Economics 40 3-73
Greenspan Alan 2002 Testimony of Alan Greenspan before the Committee on Banking
Housing and Urban Affairs US Senate July 16 Washington DC Government Printing
Office
Grullon Gustavo and Roni Michaely 2002 Dividends Share Repurchases and the Substitution
Hypothesis Journal of Finance 57 1649-1684
Hail Luzi Ahmed Tahoun and Clare Wang 2014 Dividend Payouts and Information Shocks
Journal of Accounting Research 52 403-456
Hall Brian J and Kevin J Murphy 2002 Stock options for undiversified executives Journal of
Accounting amp Economics 33 3-42
39
Hall Brian J and Kevin J Murphy 2003 The trouble with stock options Journal of Economic
Perspectives 17 49ndash70
Hanlon Michelle and Jeffrey L Hoopes 2014 What do firms do when dividend tax rates change
An examination of alternative payout responses Journal of Financial Economics 114 105-
124
Hayes Rachel M Michael Lemmon and Mingming Qiu 2012 Stock options and managerial
incentives for risk taking Evidence from FAS123R Journal of Financial Economics 105
174ndash190
Heron Randall A Erik Lie 2007 Does backdating explain the stock price pattern around
executive stock option grants Journal of Financial Economics 83 271-295
Hribar Paul Nicole Thorne Jenkins and W Bruce Johnson 2006 Stock repurchases as an
earnings management device Journal of Accounting and Economics 41 3ndash27
Jensen Michael C 1986 Agency cost of free cash flow corporate finance and takeovers
American Economic Review 76 323-329
Jolls Christine 1998 Stock repurchases and incentive compensation NBER Working Paper No
w6467
Jung Boochun Woo-Jong Lee and Yanhua Sunny Yang 2016 The Impact of Dividend
Covenants on Investment and Operating Performance Journal of Business Finance amp
Accounting 43 414ndash447
Kahle Kathleen M 2002 When a buyback isnrsquot a buyback open market repurchases and
employee options Journal of Financial Economics 63 235ndash261
Lambert Richard A William N Lanen and David F Larcker 1989 Executive stock option plans
and corporate dividend policy Journal of Financial and Quantitative Analysis 24 409ndash425
Lintner John 1956 Distribution of incomes of corporations among dividends retained earnings
and taxes The American Economic Review 46 97-113
Low Angie 2009 Managerial risk-taking behavior and equity-based compensation Journal of
Financial Economics 92 470-490
Miller Merton H and Franco Modigliani 1961 Dividend policy growth and the valuation of
shares The Journal of Business 34 411ndash433
Minnick Kristina and Leonard Rosenthal 2015 Stealth compensation Do CEOs increase their
pay by influencing dividend policy Journal of Corporate Finance 25 435-454
40
Murphy Kevin J 1999 Executive compensation In O Ashenfelter and D Card (eds) North
Holland Handbook of Labor Economics Amsterdam Elsevier Science BV
Murphy Kevin J 2013 Executive compensation Where we are and how we got there Handbook
of the Economics of Finance Elsevier Science North Holland 211-356
Nikolaev Valeri 2010 Debt Covenants and Accounting Conservatism Journal of Accounting
Research 48 143-176
Puri Manju Joumlrg Rocholl and Sascha Steffen 2011 Global retail lending in the aftermath of the
US financial crisis Distinguishing between supply and demand effects Journal of Financial
Economics 100 556-578
Shue Kelly and Richard R Townsend 2014 Swinging for the fences Executive reactions to
quasi-random option grants Working Paper University of Chicago
Skinner Douglas J 2008 The evolving relation between earnings dividends and stock
repurchases Journal of Financial Economics 87 582-609
Weisbenner Scott J 2000 Corporate share repurchases in the 1990s What role do stock options
play FEDS Working Paper No 2000-29
Zhang Dan 2013 CEO dividend protection Working Paper BI Norwegian Business School
41
Figure 1 Trends of dividends and repurchases from 2003 to 2007 Panel A plots the average
Regular DividendTotal Assets of firms in the highest and lowest quartiles of Accounting Impact
measured in 2002 Panel B shows the average Total RepurchaseTotal Assets of firms in the
highest and lowest quartiles of Accounting Impact measured in 2002
Panel A Trends of regular dividends
Panel B Trends of total repurchases
00
05
10
15
20
2003 2004 2005 2006 2007
Regular DividendTotal Assets
Lowest Acc Impact
Highest Acc Impact
Pre Post
00
20
40
60
80
100
2003 2004 2005 2006 2007
Total Repurchase Total Assets
Lowest Acc Impact
Highest Acc Impact
Pre Post
42
Table 1
Summary Statistics
Panel A Firm characteristics - full sample
N Mean Std dev 25 pctl Median 75 pctl
Accounting impact (2002) 1176 173 366 022 052 163
Payout variablesRegular dividendTotal assets 5653 093 148 000 000 142
RepurchaseTotal assets 5653 394 710 000 035 500
Total payoutTotal assets 5653 488 748 000 175 666
Regular dividendTotal payout 4091 3874 4057 000 2237 8833
Level of executive compensation (in $1000)
Salary_$ 5653 450 190 314 409 544
Bonus_$ 5653 476 616 122 295 586
Option grant_$ 5653 791 1137 62 384 1002
Restricted stock grant_$ 5653 458 866 0 58 518
Total pay_$ 5653 2481 2475 890 1647 3074
Percentage of executive compensation
Salary_ 5653 296 183 165 251 382
Bonus_ 5653 197 148 97 177 268
Option grant_ 5653 283 235 67 256 445
Restricted stock grant_ 5653 141 180 00 41 249
Control variables
Size ($M) 5653 11086 27294 1017 2459 8117
Log(size) 5653 7985 1565 6925 7808 9002
Book-to-market 5653 0445 0287 0251 0388 0578
Leverage 5653 0202 0172 0038 0187 0309
Asset tangibility 5653 0806 0184 0691 0853 0965
Free cash flow 5653 0059 0091 0013 0059 0108
Cash holding 5653 0166 0172 0034 0100 0247
ROA volatility 5653 0056 0056 0021 0038 0070
Institutional ownership 5653 0753 0202 0639 0795 0910
Sales growth 5653 0121 0189 0028 0096 0183
Past stock return 5653 0094 0183 -0012 0094 0199
Loss indicator 5653 0164 0370 0000 0000 0000
This table presents summary statistics Panel A shows the descriptive statistics of payout variables compensation
variables and other firm characteristics for the full sample Accounting impact is the implied option expense
measured at fiscal year 2002 All other variables are measured at firm-year level from fiscal year 2003 to 2007
resulting in 5653 firm-year observations (except for Regular dividendTotal Payout which can be measured only
for the 4901 firm-year observations with Total payout greater than zero) Panel B shows the pairwise correlations
between main variables at firm-year level Panel C compares payout variables compensation variables and other
firm characteristics before and after FAS123R The Pre-FAS123R period consists of fiscal year 2003 and 2004
the Post-FAS123R period covers fiscal year 2005-2007 Panel D compares the trends of payout and compensation
variables around FAS123R across four quartile groups ranked by 2002 accounting impact Panel E compares the
trends of payout and compensation variables around FAS123R between the treated and control group under the
alternative treatment definition in Bakke et al (2015) (see Section 22) All variables are defined in Appendix The
notation and in Panel C indicates statistically significant at 10 5 and 1 level in T-tests for equal
means respectively
43
Pa
nel
B
Pea
rso
n c
orr
ela
tio
ns
Reg div
Repurchase
Total payout
Salary_
Bonus_
Option_
RS_
Log(size)
BM
Leverage
Tangibility
FCF
Cash holdingROA vol
Inst own
Sales growth
Past ret
urn
Loss
Reg
div
10
0
Repurc
hase
01
610
0
Tota
l payout
03
509
810
0
Sala
ry_
-0
10
-01
8-0
19
10
0
Bonus_
00
700
100
3-0
01
10
0
Option_
-0
10
00
900
6-0
41
-03
510
0
RS
_
01
000
901
0-0
32
-01
1-0
40
10
0
Log(s
ize)
03
101
802
3-0
56
01
101
202
210
0
BM
-02
1-0
28
-03
103
0-0
03
-02
000
0-0
33
10
0
Levera
ge
-00
1-0
08
-00
8-0
05
00
6-0
11
00
801
9-0
03
10
0
Tangib
ility
00
200
100
101
200
1-0
05
-00
6-0
12
-00
4-0
18
10
0
FC
F02
203
703
9-0
20
00
901
1-0
01
02
4-0
32
-02
1-0
16
10
0
Cash
hold
ing
-01
301
000
700
2-0
14
02
2-0
10
-02
3-0
16
-03
502
901
210
0
RO
A v
ol
-01
5-0
04
-00
700
4-0
11
01
9-0
11
-02
3-0
08
-01
101
2-0
02
03
910
0
Inst
ow
n
-00
901
401
1-0
17
00
200
701
200
7-0
01
00
3-0
08
01
4-0
06
-01
110
0
Sale
s gro
wth
-00
8-0
04
-00
6-0
15
00
501
0-0
02
00
7-0
16
-00
3-0
08
01
300
201
400
410
0
Past
retu
rn00
901
301
4-0
18
01
5-0
01
00
301
6-0
29
-01
000
102
7-0
14
-01
001
602
710
0
Loss
-02
0-0
19
-02
201
8-0
18
00
4-0
05
-02
601
901
300
6-0
41
01
702
3-0
16
-01
8-0
40
10
0
44
Panel C Firm characteristics - before and after FAS123R
Pre FAS 123R Post FAS 123R Difference
Payout variables
Regular dividendTotal assets 083 099 016
RepurchaseTotal assets 245 490 245
Total payoutTotal assets 328 589 261
Regular dividendTotal payout 3914 2790 -1124
Level of executive compensation (in $1000)
Salary_$ 426 463 37
Bonus_$ 418 505 87
Option grant_$ 896 707 -191
Restricted stock grant_$ 269 574 305
Total pay_$ 2263 2584 321
Percentage of executive compensation
Salary_ 305 293 -12
Bonus_ 186 204 18
Option grant_ 343 240 -103
Restricted stock grant_ 87 176 89
Control variables
Size ($M) 9671 11631 1960
Log(size) 7860 8035 0175
Book-to-market 0437 0453 0016
Leverage 0201 0203 0002
Asset tangibility 0822 0793 -0029
Free cash flow 0061 0057 -0004
Cash holding 0175 0159 -0016
ROA volatility 0067 0048 -0019
Institutional ownership 0712 0781 0069
Sales growth 0137 0108 -0029
Past stock return 0080 0101 0021
Loss indicator 0173 0159 -0014
45
Pa
nel
D
Fir
m c
ha
racte
rist
ics
by q
ua
rtil
e o
f a
cco
un
tin
g i
mp
act
- b
efo
re a
nd
aft
er
FA
S1
23
R
Accounting im
pact
(2002)
Num
ber
of
Fir
ms
Pre
Post
Pre
Post
Pre
Post
Pre
Post
Payout
vari
able
s
Regula
r div
idendT
ota
l ass
ets
11
2
12
4
09
4
11
1
09
5
11
3
03
0
04
9
Repurc
hase
Tota
l ass
ets
11
3
26
8
19
2
37
3
32
7
63
1
35
1
68
7
Tota
l payout
Tota
l ass
ets
22
4
39
1
28
5
48
4
42
2
74
4
38
1
73
6
Regula
r div
idendT
ota
l payout
643
7
469
8
474
0
341
1
284
5
195
4
82
5
74
5
Perc
enta
ge o
f executive c
om
pensa
tion
Sala
ry_
337
295
313
287
296
289
276
300
Bonus_
223
226
214
228
172
192
134
169
Option g
rant_
201
167
290
210
373
260
507
325
Rest
ricte
d s
tock g
rant_
116
194
98
180
89
176
43
155
294
294
294
294
1st Q
uart
ile2
nd Q
uart
ile3
rd Q
uart
ile4
th Q
uart
ile
01
2
03
5
09
3
55
1
46
Accounting impact
Number of Firms
By accounting impact quartile
1
2
3
4
Pre Post Pre Post
Payout variables
Regular dividendTotal assets 09 11 08 10
RepurchaseTotal assets 18 31 26 52
Total payoutTotal assets 28 43 34 62
Regular dividendTotal payout 428 357 386 265
Percentage of executive compensation
Salary_ 435 364 282 280
Bonus_ 226 214 179 202
Option grant_ 92 125 387 261
Restricted stock grant_ 125 188 80 174
Percentage of CEO compensation
Salary_(CEO) 485 364 260 259
Bonus_(CEO) 249 228 185 219
Option grant_(CEO) 10 127 406 275
Restricted stock grant_(CEO) 128 182 82 183
Panel E Firm characteristics by alternative treatment definition - before and
after FAS123R
Treated
25
19
997
223
250
256
268
10
177
71
Control
44
37
47
Table 2
Differential effect of FAS123R on the use of option-based compensation
Panel A Two-period first-difference regression
Prediction Coeff t-stat Coeff t-stat Coeff t-stat
Accounting impact rank - -0044 -628
Accounting impact rank=2 - -0044 -327
Accounting impact rank=3 - -0075 -468
Accounting impact rank=4 - -0140 -613
Treated - -0132 -875
ΔLog(size) 0061 202 0061 200 0063 214
ΔBook-to-market 0032 091 0032 092 0051 143
ΔLeverage -0157 -213 -0160 -218 -0111 -153
ΔAsset tangibility -0012 -014 -0020 -023 -0023 -026
ΔFree cash flow -0106 -095 -0108 -097 -0128 -117
ΔCash holding -0197 -211 -0193 -206 -0180 -194
ΔFive-year ROA volatility -0065 -031 -0056 -026 -0098 -047
ΔInstitutional ownership -0044 -091 -0043 -088 -0044 -092
ΔSales growth -0064 -102 -0065 -104 -0090 -153
ΔPast one-year stock return 0051 078 0052 080 0091 138
ΔLoss frequency 0056 207 0057 207 0047 179
Log(size) -0009 -210 -0009 -207 -0002 -035
Book-to-market -0015 -056 -0013 -049 0018 072
Leverage 0022 046 0023 048 0068 150
Asset tangibility 0033 077 0033 078 0053 128
Free cash flow 0227 202 0220 195 0127 117
Cash holding -0002 -004 0012 019 -0078 -141
Five-year ROA volatility -0451 -240 -0430 -228 -0509 -283
Institutional ownership -0123 -360 -0122 -359 -0100 -292
Sales growth -0041 -056 -0040 -055 -0089 -125
Past one-year stock return -0009 -015 -0006 -010 0078 125
Loss frequency 0055 174 0056 178 0054 173
Fixed effect
Standard error
Adj R-squared
Observations
Model (3)
Dependent variable ΔAvg Option grantTotal pay
Huber-White
0156
This table investigates whether the effect of FAS123R on the use of option-based pay varies with its potential accounting impact Panel A
reports the results of estimating three two-period first-differencing models where for each firm we average its characteristics in Pre- and
Post-FAS123R period The Pre-FAS123R period consists of fiscal year 2003 and 2004 the Post-FAS123R period covers fiscal year 2005-
2007 In all three specifications the dependent variable is the change of average Option grantTotal pay from Pre- to Post-FAS123R period
The main independent variable varies by model in Model (1) the Accounting impact rank is the quartile rank of implied option expensetotal
assets measured in 2002 (1=lowest 4=highest) In Model (2) Accounting impact rank=2 (3 4) is an indicator that takes value of one if the
firmrsquos Accounting impact rank equals 2 (3 4) In Model (3) we use an alternative treatment construction following Bakke et al (2015)
where Treated is an indicator that takes value of zero if the firm granted zero option to its CEO in both 2003 and 2004 or the firm began to
voluntarily expense option-based pay at fair value in 2002 or earlier and one otherwise For each control variable we include both its level in
the Pre-FAS123R period and its change across the two periods Panel B shows the results of estimating fixed effect models with firm-year
observations The dependent variable is the firm-year level Option grantTotal pay The main independent variables are the interactions of
Post-FAS123R indicator (Post) with Accounting Impact rank Accounting impact rank indicators and Treated respectively All models in
Penal A have industry fixed effects and the standard errors are Huber-White heteroscedasticity-consistent standard errors All models in
Penal B have firm fixed effects and year fixed effects and the standard errors are clustered at firm level All variables are defined in
Appendix The notation and indicates statistically significant at 10 5 and 1 level respectively
Model (1) Model (2)
11711171 1171
Industry Industry
Huber-White
0124
Huber-White
0123
Industry
48
Panel B Panel fixed effects regression
Prediction Coeff t-stat Coeff t-stat Coeff t-stat
Acc impact rank x Post - -0044 -807
Acc impact rank 2 x Post - -0046 -333
Acc impact rank 3 x Post - -0077 -526
Acc impact rank 4 x Post - -0137 -776
Treated x Post - -0145 -970
Log(size) 0034 221 0034 217 0036 229
Book-to-market 0018 084 0017 083 0015 070
Leverage -0004 -009 -0006 -013 -0007 -015
Asset tangibility 0007 012 0004 006 0011 018
Free cash flow -0074 -151 -0072 -146 -0078 -158
Cash holding -0048 -086 -0050 -090 -0006 -011
Five-year ROA volatility 0250 231 0239 219 0437 414
Institutional ownership 0043 159 0044 161 0041 150
Sales growth -0033 -168 -0034 -171 -0031 -158
Past one-year stock return 0067 221 0068 224 0063 204
Loss indicator 0023 209 0022 207 0024 222
Fixed effects
Standard error
Adj R-squared
Observations
Dependent variable Option grantTotal pay
5653 5653 5653
Clustered by firm
Firm Year
Clustered by firm
Firm Year
Clustered by firm
0523 0523 0526
Model (1) Model (2) Model (3)
Firm Year
49
Table 3
Effect of option-based compensation on dividend policy
Panel A Two-period first-difference regression
Prediction Coeff t-stat Coeff t-stat Coeff t-stat
Accounting impact rank + 0000 077
Accounting impact rank=2 + 0001 091
Accounting impact rank=3 + 0000 044
Accounting impact rank=4 + 0001 092
Treated + 0000 -026
ΔLog(size) 0000 -030 0000 -030 0000 -026
ΔBook-to-market -0002 -190 -0002 -193 -0002 -195
ΔLeverage -0002 -059 -0002 -057 -0002 -059
ΔAsset tangibility 0016 431 0016 429 0016 430
ΔFree cash flow 0017 373 0017 373 0017 375
ΔCash holding -0011 -288 -0011 -285 -0010 -282
ΔFive-year ROA volatility 0003 034 0002 032 0003 035
ΔInstitutional ownership -0002 -073 -0002 -073 -0002 -070
ΔSales growth -0001 -040 -0001 -037 -0001 -038
ΔPast one-year stock return 0002 077 0002 076 0002 070
ΔLoss frequency 0000 -048 0000 -045 0000 -046
Log(size) 0000 183 0000 182 0000 182
Book-to-market -0002 -227 -0002 -225 -0002 -284
Leverage -0001 -037 -0001 -039 -0001 -048
Asset tangibility 0003 179 0003 180 0003 176
Free cash flow 0017 291 0017 291 0017 300
Cash holding 0002 080 0002 077 0002 098
Five-year ROA volatility 0003 035 0002 033 0003 044
Institutional ownership -0001 -068 -0001 -068 -0001 -058
Sales growth -0004 -177 -0004 -175 -0004 -172
Past one-year stock return 0004 169 0004 167 0004 165
Loss frequency -0001 -111 -0001 -109 -0001 -102
Fixed effect
Standard error
Adj R-squared
Observations
Dependent variable ΔAvg Regular dividendTotal assets
This table investigates the causal effect of option-based pay on dividend policy by examining whether changes in dividend policy around
FAS123R vary with its potential accounting impact Panel A reports the results of estimating three two-period first-differencing models
where for each firm we average its characteristics in Pre- and Post-FAS123R period In all three specifications the dependent variable is
the change of average Regular dividendTotal assets from Pre- to Post-FAS123R period The main independent variable varies by model in
Model (1) the Accounting impact rank is the quartile rank of implied option expensetotal assets measured in 2002 (1=lowest 4=highest) In
Model (2) Accounting impact rank=2 (3 4) is an indicator that takes value of one if the firmrsquos Accounting impact rank equals 2 (3 4) In
Model (3) we use an alternative treatment construction following Bakke et al (2015) where Treated is an indicator that takes value of zero
if the firm granted zero option to its CEO in both 2003 and 2004 or the firm began to voluntarily expense option-based pay at fair value in
2002 or earlier and one otherwise For each control variable we include both its level in the Pre-FAS123R period and its change across the
two periods Panel B shows the results of estimating fixed effect models with firm-year observations The dependent variable is the firm-
year level Regular dividendTotal assets The main independent variables are the interactions of Post-FAS123R indicator (Post) with
Accounting Impact rank Accounting impact rank indicators and Treated respectively Panel C examines the intensity of dividend changes
among firms with nonzero dividend per share in 2003 or 2004 In particular we estimates the same three models as in Panel A(with the
same independent variables) but for five dependent variables the change of average Regular dividendTotal assets from Pre- to Post-
FAS123R period (as in Panel A) the percentage change of DPS (dividend per share) from Pre- to Post-FAS123R period and three
indicators denoting respectively whether the percentage change of DPS was greater than 20 40 and 60 Panel D reports four
robustness tests of the dividend intensity regression In each of them a set of possible confounding observations is removed (see Section 33
for details) Panel E compares the trends of dividend initiation and termination around FAS123R across four quartile groups ranked by
accounting impact All models in Panel A C and D have industry fixed effects and the standard errors are Huber-White heteroscedasticity-
consistent standard errors All models in Penal B have firm fixed effects and year fixed effects and the standard errors are clustered at
firm level All variables are defined in Appendix The notation and indicates statistically significant at 10 5 and 1 level
Industry Industry Industry
Model (1) Model (2) Model (3)
1171 1171 1171
Huber-White Huber-White Huber-White
0105 0104 0105
50
Panel B Panel fixed effects regression
Prediction Coeff t-stat Coeff t-stat Coeff t-stat
Acc impact rank x Post + 0000 122
Acc impact rank 2 x Post + 0001 110
Acc impact rank 3 x Post + 0001 094
Acc impact rank 4 x Post + 0001 129
Treated x Post + 0000 -012
Log(size) 0001 179 0001 179 0001 181
Book-to-market 0000 025 0000 024 0000 031
Leverage 0001 062 0001 064 0001 069
Asset tangibility 0009 360 0009 358 0009 363
Free cash flow 0002 090 0002 093 0002 092
Cash holding -0007 -295 -0007 -298 -0007 -298
Five-year ROA volatility 0001 041 0001 038 0000 -006
Institutional ownership 0000 -027 0000 -026 0000 -027
Sales growth 0000 053 0000 051 0000 044
Past one-year stock return 0001 089 0001 088 0001 078
Loss indicator 0000 -060 0000 -057 0000 -076
Fixed effects
Standard error
Adj R-squared
Observations
Dependent variable Regular dividendTotal assets
Model (1) Model (2) Model (3)
Firm Year Firm Year Firm Year
5653 5653 5653
Clustered by firm Clustered by firm Clustered by firm
0877 0877 0877
51
Panel C Intensity of dividend changes around FAS123R
Prediction Coeff t-stat Coeff t-stat Coeff t-stat
Accounting impact rank + 0000 065
Accounting impact rank=2 + 0000 048
Accounting impact rank=3 + 0000 026
Accounting impact rank=4 + 0002 080
Treated + 0001 063
Dependent var DPS pct change
Accounting impact rank + -0145 -072
Accounting impact rank=2 + 0018 006
Accounting impact rank=3 + -0177 -045
Accounting impact rank=4 + -0746 -100
Treated + -0407 -119
Accounting impact rank + 0029 095
Accounting impact rank=2 + 0040 074
Accounting impact rank=3 + 0092 139
Accounting impact rank=4 + 0008 007
Treated + -0007 -012
Accounting impact rank + 0024 076
Accounting impact rank=2 + 0047 088
Accounting impact rank=3 + 0079 114
Accounting impact rank=4 + -0003 -002
Treated + 0030 052
Accounting impact rank + 0030 098
Accounting impact rank=2 + 0078 155
Accounting impact rank=3 + 0085 130
Accounting impact rank=4 + 0014 012
Treated + -0006 -011
Control variables
Fixed effect
Standard error
Observations 572 572 572
Yes Yes Yes
Huber-White Huber-White Huber-White
Industry Industry Industry
Dependent var DPS pct
change gt60 indicator
Model (1) Model (2) Model (3)
Dependent var ΔAvg Regular
dividendAssets
Dependent var DPS pct
change gt20 indicator
Dependent var DPS pct
change gt40 indicator
52
Panel D Robustness tests for intensity of dividend changes around FAS123R
Prediction Coeff t-stat Coeff t-stat Coeff t-stat
Accounting impact rank + 0006 017
Accounting impact rank=2 + 0067 118
Accounting impact rank=3 + 0041 057
Accounting impact rank=4 + -0061 -049
Treated + 0022 035Observations
Accounting impact rank + 0009 027
Accounting impact rank=2 + 0058 106
Accounting impact rank=3 + 0032 043
Accounting impact rank=4 + -0032 -024
Treated + 0018 028
Observations
Accounting impact rank + 0030 089
Accounting impact rank=2 + 0039 071
Accounting impact rank=3 + 0122 168
Accounting impact rank=4 + -0063 -052
Treated + 0075 132
Observations
Accounting impact rank + 0008 023
Accounting impact rank=2 + 0023 042
Accounting impact rank=3 + 0048 064
Accounting impact rank=4 + -0042 -033
Treated + -0010 -016
Observations
Control variables
Fixed effect
Standard error
Exclude firms with stable
payout ratio from 2003 to 2004
506 506 506
Dependent variable DPS pct change gt40 indicator
Model (1) Model (2) Model (3)
Exclude voluntary expensers
519 519
Exclude firms in the top decile
of option reduction (02-04)
Exclude firms that accelerated
option vesting
504 504 504
517 517 517
519
Huber-White Huber-White Huber-White
Yes Yes Yes
Industry Industry Industry
53
Panel E Dividend initiation and termination rates around FAS123R
Pre FAS 123R
1 280 75 7 6 13 173
2 284 135 18 9 27 200
3 286 181 11 14 25 138
4 282 260 9 10 19 73
Total 1132 651 45 39 84 129
Post FAS 123R
1 275 63 4 4 8 127
2 280 116 9 9 18 155
3 276 152 9 3 12 79
4 263 223 5 1 6 27
Total 1094 554 27 17 44 79
Pre FAS 123R
1 280 205 2 0 2 10
2 284 149 7 1 8 54
3 286 105 0 0 0 00
4 282 22 0 0 0 00
Total 1132 481 9 1 10 21
Post FAS 123R
1 275 212 3 6 9 42
2 280 164 1 2 3 18
3 276 124 1 1 2 16
4 263 40 0 3 3 75
Total 1094 540 5 12 17 31
termination
in 2004
03-04
cumulative
03-04
cumulative
Quartile firms
with
dividend in
2004
termination
in 2005
termination
in 2006
05-06
cumulative
05-06
cumulative
Termination
Quartile firms
with
dividend in
2002
termination
in 2003
without
dividend in
2004
initiation in
2003
initiation in
2004
03-04
cumulative
03-04
cumulative firmsQuartile
firmsQuartile initiation in
2005
initiation in
2006
05-06
cumulative
05-06
cumulative
Initiation
without
dividend in
2002
54
Table 4
Effect of option-based compensation on repurchases
Panel A Two-period first-difference regression with total repurchase
Prediction Coeff t-stat Coeff t-stat Coeff t-stat
Accounting impact rank - 0002 122
Accounting impact rank=2 - 0002 071
Accounting impact rank=3 - 0005 123
Accounting impact rank=4 - 0007 102
Treated - 0014 365
Control variables
Fixed effect
Standard error
Adj R-squared
Observations
Panel B Two-period first-difference regression with net repurchase
Prediction Coeff t-stat Coeff t-stat Coeff t-stat
Accounting impact rank - 0003 166
Accounting impact rank=2 - 0002 051
Accounting impact rank=3 - 0006 165
Accounting impact rank=4 - 0009 137
Treated - 0010 300
Control variables
Fixed effect
Standard error
Adj R-squared
Observations
Panel C Two-period first-difference regression with repurchase adjusted for exercised options
Prediction Coeff t-stat Coeff t-stat Coeff t-stat
Accounting impact rank - 0001 056
Accounting impact rank=2 - 0002 062
Accounting impact rank=3 - 0007 172
Accounting impact rank=4 - -0001 -008
Treated - 0006 197
Control variables
Fixed effect
Standard error
Adj R-squared
Observations
Dependent variable ΔAvg RepurchaseTotal assets
This table investigates the causal effect of option-based pay on payout policy by examining whether the changes of repurchase around
FAS123R vary with its potential accounting impact Panel A reports the results of estimating three two-period first-differencing models
where for each firm we average its characteristics in Pre- and Post-FAS123R period In all three specifications the dependent variable is
the change of average RepurchaseTotal assets from Pre- to Post-FAS123R period The main independent variable varies by model in
Model (1) the Accounting impact rank is the quartile rank of implied option expensetotal assets measured in 2002 (1=lowest 4=highest)
In Model (2) Accounting impact rank=2 (3 4) is an indicator that takes value of one if the firmrsquos Accounting impact rank equals 2 (3 4)
In Model (3) we use an alternative treatment construction following Bakke et al (2015) where Treated is an indicator that takes value of
zero if the firm granted zero option to its CEO in both 2003 and 2004 or the firm began to voluntarily expense option-based pay at fair
value in 2002 or earlier and one otherwise Panel B reports the regressions with the change of Net repurchaseTotal assets as the
dependent variable and the same independent variable as in Panel A Panel C reports the regressions with the change of Adjusted
repurchaseTotal assets as the dependent variable and the same independent variable as in Panel A All models in Panel A B and C have
industry fixed effects and the standard errors are Huber-White heteroscedasticity-consistent standard errors All variables are defined in
Appendix The notation and indicates statistically significant at 10 5 and 1 level respectively
Model (1) Model (2) Model (3)
Yes Yes Yes
Industry Industry Industry
Huber-White Huber-White Huber-White
Dependent variable ΔAvg Net repurchaseTotal assets
1171 1171 1171
0238 0237 0245
Model (1) Model (2) Model (3)
Yes Yes Yes
Industry Industry Industry
Huber-White Huber-White Huber-White
Dependent variable ΔAvg Adjusted repurchaseTotal assets
0229 0229 0233
1171 1171 1171
Model (1) Model (2) Model (3)
Yes Yes Yes
Industry Industry Industry
Huber-White Huber-White Huber-White
0111 0112 0114
1168 1168 1168
55
Table 5
Effect of option-based compensation on payout mix
Panel A Two-period first-difference regression with total payout mix
Prediction Coeff t-stat Coeff t-stat Coeff t-stat
Accounting impact rank + 0006 028
Accounting impact rank=2 + 0018 045
Accounting impact rank=3 + -0001 -001
Accounting impact rank=4 + 0043 052
Treated + -0035 -094
Control variables
Fixed effect
Standard error
Adj R-squared
Observations
Panel B Two-period first-difference regression with net payout mix
Prediction Coeff t-stat Coeff t-stat Coeff t-stat
Accounting impact rank + -0002 -008
Accounting impact rank=2 + 0008 016
Accounting impact rank=3 + 0018 034
Accounting impact rank=4 + -0059 -055
Treated + -0050 -101
Control variables
Fixed effect
Standard error
Adj R-squared
Observations
0049 0043 0054
257 257 257
Industry Industry Industry
Huber-White Huber-White Huber-White
Dependent variable ΔAvg Regular dividendNet payout
Model (1) Model (2) Model (3)
Yes Yes Yes
0154 0151 0156
362 362 362
Industry Industry Industry
Huber-White Huber-White Huber-White
This table investigates the causal effect of option-based pay on payout mix for firms using both dividend and repurchase by examining
whether the changes of payout mix around FAS123R vary with its potential accounting impact Panel A reports the results of estimating
three two-period first-differencing models where for each firm we average its characteristics in Pre- and Post-FAS123R period In all three
specifications the dependent variable is the change of average Regular dividendTotal payout from Pre- to Post-FAS123R period The main
independent variable varies by model in Model (1) the Accounting impact rank is the quartile rank of implied option expensetotal assets
measured in 2002 (1=lowest 4=highest) In Model (2) Accounting impact rank=2 (3 4) is an indicator that takes value of one if the firmrsquos
Accounting impact rank equals 2 (3 4) In Model (3) we use an alternative treatment construction following Bakke et al (2015) where
Treated is an indicator that takes value of zero if the firm granted zero option to its CEO in both 2003 and 2004 or the firm began to
voluntarily expense option-based pay at fair value in 2002 or earlier and one otherwise Panel B reports the regressions with the change of
Regular dividendNet payout as the dependent variable and the same independent variables as in Panel A Panel A (Panel B) is based on
observations with nonzero regular dividend and repurchase (net repurchase) in both Pre- and Post-FAS123R period All models in Panel A
and B have industry fixed effects and the standard errors are Huber-White heteroscedasticity-consistent standard errors All variables are
defined in Appendix The notation and indicates statistically significant at 10 5 and 1 level respectively
Yes Yes Yes
Dependent variable ΔAvg Regular dividendTotal payout
Model (1) Model (2) Model (3)

5
firms in the bottom quartile Using this cross sectional variation our strategy is a difference-in-
difference design where the first difference is the adoption of FAS123R and the second is the pre-
event implied option expense effectively our proxy for the expected accounting-induced reduction
in option-based compensation The key identification assumption is that the level of implied
option expense (prior to the announcement of FAS123R) is not correlated with the potential future
change in payout variables in the absence of treatment (ie FAS123R) We discuss this
assumption further in Section 2
We perform our empirical tests using a sample of SampP 1500 firms between 2003 and 2007
a five-year event window surrounding the 2005 adoption of FAS123R In particular we estimate
the association between implied option expense measured in 2002 and thus prior to the event
window and the change in the average payout variables from the ldquoprerdquo (2003-2004) to the ldquopostrdquo
(2005-2007) period after controlling for known determinants of payout policy Across various
measures of dividend changes we do not find that firms with higher implied option expense
increased their dividends relative to firms with lower implied option expense both in the full
sample and in a sub-sample of firms that paid dividends prior to FAS123R Also among firms
that did not pay dividends prior to FAS123R those with higher implied option expense did not
experience a relative increase in the rate of dividend initiation This lack of an effect on dividend
payouts is remarkable given that the accounting-induced decline in option-based pay was
accompanied by a corresponding increase in restricted stock awards which generally pay
dividends Further we find no association between implied option expense and changes in the
level of repurchases or changes in the relative weights of dividends and repurchases
Our results are robust to using alternative measures of dividends and repurchases
employing a panel regression (rather than a first-difference regression) and excluding the year of
6
adoption 2005 They are also robust to excluding firms that may have taken actions in anticipation
of the expected adoption of FAS123R (eg voluntarily expensing options) Finally to further
address the lack of a control group we follow Bakke Mahmudi Fernando and Salas (2015) and
define control firms as those voluntarily expensing options and those issuing no options to the
CEO prior to FAS123R on the ground that these firms were likely unaffected by the new standard
Our inferences remain unchanged
Overall the evidence is not consistent with the prediction that option-based compensation
has a first-order causal impact on payout policy and suggests that the previously documented
associations perhaps reflect endogeneity rather than a causal influence Our findings should not be
viewed as denying that stock options provide an incentive to favor repurchases over dividends
Rather they suggest this incentive does not imply an unconstrained ability to change payout policy
in a self-serving way likely because of the visibility of payout policy and its relevance to boards
and institutional investors 6 In addition boards may compensate executives for the lack of
dividend-protection in other ways effectively neutralizing those incentives Notably our findings
are consistent with managersrsquo statements that lack of dividend-protection does not affect payout
decisions (Brav et al (2005) who highlight this stark contrast between their survey evidence and
the empirical associations in the literature)7 Our results also provide another explanation for the
persistent lack of dividend protection in executivesrsquo options boards are not concerned with its
6 Note that our results are not inconsistent with evidence that managers take actions to increase personal wealth in
settings where the level of scrutiny is lower (eg timing of option grants backdating Heron and Lie 2007) or where it
is harder for outsiders to detect personal motives (eg risk-taking activities that increase the value of options Bakke et
al 2015) 7 Only 106 of surveyed executives agree that lack of dividend protection may cause managers to favor repurchases
over dividends ndash the lowest level of support among all the questions in the survey Of course it is possible that
managers would not admit to the effect on their behavior but similar surveys have elicited candid responses For
example a large percentage of managers surveyed by Graham Harvey and Rajgopal (2005) admit that they would
sacrifice economic value to smooth earnings or to hit an earnings target
7
effect because they can mitigate it by directly monitoring payout choices andor adjusting
compensation packages
Our study contributes to a vast literature on the determinants of payout policy First while
many studies document an association between option-based pay and payout policy limited
attempts have been made to examine its causal nature8 Addressing this question will enhance our
understanding of temporal changes in payout policy such as the emergence of repurchases as
primary payout vehicle (Farre-Mensa et al 2014) and the recently observed lsquoresiliencersquo of
dividends (Floyd et al 2015) Using the plausible exogenous variation in ESO induced by
FAS123R our evidence calls into question the notion that option-based compensation is a first-
order driver of payout policy and challenges future research to consider alternative explanations
for the trends in corporate payouts Second we extend the research that examines how
institutional changes affect payout policy Most of these studies examine changes in dividend tax
rates (eg Chetty and Saez 2005 Brown Liang and Wesibenner 2007 Aboody and Kasznik 2008
Blouin Raedy and Shackelford 2011 Hanlon and Hoopes 2014) or in the information environment
(Hail Tahoun and Wang 2014) while we examine a new accounting standard that affected the
composition of executive pay
We also contribute to a recent stream of research that uses exogenous shocks to understand
the economic impact of option-based pay (Low 2009 Gormley Matsa and Milbourn 2013) Some
of these studies use FAS123R to examine the causal effect of option-based pay on risk-taking with
mixed findings (Chava and Purnanandam 2010 Hayes Lemmon and Qiu 2012 Bakke et al 2015
Chu and Ma 2015) We extend this research in two ways First we use FAS123R to examine the
8 A notable exception is Shue and Townsend (2014) who instrument change in option grants with predicted new
option grant cycle and find that dividend growth is slower in the first year of a new option grant cycle than other years
An important premise underlying this approach is that the outcomes respond almost instantaneously to the treatment
In this paper we are more concerned with the longer-term effects of ESO as payout tends to be sticky and may
respond to the treatment only gradually (Lambert et al 1989)
8
effect of option-based pay on a different yet important economic outcome payout policy Second
our metholodogy differs from prior studies in that it explicitly incorporates cross-sectional
variation in how firms were affected by FAS123R Future work may use this approach to examine
the effect of option-based pay on other corporate policies
Finally we extend the literature on how accounting rules impact a firmrsquos economic
behavior (eg Carter and Lynch 2003 Carter et al 2007 Bens and Mohanan 2008 Choudhary
Rajgopal and Venkatachalam 2009 Graham Hanlon and Shevlin 2011) as well as the literature on
the accounting treatment for stock options (Aboody 1996 Dechow Hutton and Sloan 1996
Aboody Barth and Kasznik 2004 Ferri and Sandino 2009)
2 Research Design
21 Empirical Strategy
It is commonly recognized that identifying the causal effects of executive compensation in
empirical studies is challenging (Edmans and Gabaix 2015) FAS123R provides a unique
opportunity to address this problem Aside from significantly reducing the use of option
compensation the accounting change should not in itself correlate with the outcomes of interest
(ie change in payout policy)9 However utilizing FAS123R is not easy because it affected all
US firms at the same time making it difficult to measure a counterfactual change around the
event based on a control group A simple before-after comparison of the outcome variable around
the adoption of FAS123R would assume that any change is driven entirely by the event of interest
(ie it would assume away any conterfactual trend in the outcome variable) a questionable
assumption An alternative strategy is to use the change in option-based compensation around
9 Hayes et al (2012) describes FAS123R as an exogenous change in the accounting benefits of stock options without a
change to the economic costs and benefits of stock options while Bakke et al (2015) describes it as causing a change
in executivesrsquo but not shareholdersrsquo incentives
9
FAS123R effectively assuming that such change is ldquoexogenousrdquo (eg Chava and Purnanandam
2010 Anantharaman and Lee 2014) The problem with this approach is that FAS123R per se did
not generate exogenous cross-sectional variation in option compensation Even if the introduction
of FAS123R is exogenous a firmrsquos response cannot be assumed to be entirely exogenous10
To identify the exogenous portion of firmsrsquo response to the new standard we make use of
evidence that FAS123Rrsquos impact on the use of option compensation varies with the firm-specific
expected accounting impact of the new rule as measured by the implied option expense disclosed
in the footnotes prior to FAS123R (Hayes et al 2012) The reduction in option usage is highest in
firms with the largest implied option expense Thus we can use the differential accounting impact
of FAS123R to overcome the problem of lacking control group
To validate our approach we estimate the following first-differencing regression with
ordinary lease square (OLS)
ΔOptioni = β0 + β1 Accounting Impacti + ΛControli +εi (1)
where ΔOptioni is the change in the average value of executive stock options as percentage of total
pay from the pre- to the post-FAS123R period Accounting Impacti is the implied option expense
measured prior to FAS123R (more details in Section 22) We expect β1 to be negative that is a
more pronounced reduction in option-based pay for firms with higher expected accounting impact
Next after validating the differential impact of FAS123R we examine the central question
of this study by estimating the following OLS regression
ΔPayouti = γ0 + γ1 Accounting Impacti + ΓControli +ui (2)
10 A universally assigned encouragement to receive treatment does not make the realization of treatment assignment
free from endogeneity concerns Consider the following example after the adoption of FAS123R firm A reduces the
weight of option-based pay by 20 and firm B by 40 A finding that firm B increases dividends compared to firm A
cannot be interpreted as evidence of a causal influence of option compensation on dividend policy This is because the
additional reduction in option compensation by firm B relative to firm A may not be driven by FAS123R It may
instead reflect an attempt to align executivesrsquo incentives with anticipated changes in dividend policy (reverse
causality) Without a way to incorporate the heterogeneous impact of FAS123R in the research design the cross
sectional variation in changes in option-based compensation is still subject to the usual endogeneity concerns
10
where ΔPayouti represents the change in the average value of one of the payout variables
of interest (described in Section 23) from the the pre- to the post-FAS123R period
Eq (2) is essentially a difference-in-difference approach to estimate the effect of option-
based pay on payout policy using the differential accounting impact of FAS123R to capture the
exogenous (accounting-induced) portion of the change in option-based pay If option-based pay
has a detectable causal effect on dividends (repurchases) in the direction predicted by the
literature γ1 should be positive (negative)
As noted by Bertrand Duflo and Mullainathan (2004) in difference-in-difference studies
with panel data OLS may yield inconsistent standard error estimates because the dependent
variable and the main independent variable tend to be serially correlated within firm To alleviate
this concern following Bertrand et al (2004) in both Eqs (1) and (2) we collapse the panel to a
single ldquoPrerdquo (2003-2004) and a single ldquoPostrdquo (2005-2007) period by averaging across years and
then measuring the changes from Pre to Post11 We choose 2003 as the starting period in order to
capture a period subsequent to the 2003 tax cut on individual dividend income While the
evidence on the effect of the tax cut on payout policy is mixed (Chetty and Saez 2005 Edgerton
2013 Floyd et al 2015) starting with 2003 allows the pre-FAS123R levels of the key variables to
reflect any effect of the tax cut 12 We end our analysis in 2007 to avoid the potentially
confounding effect of the 2008 financial crisis which had a significant impact on payouts (Floyd et
al 2015)13 Following Hayes et al (2012) and Bakke et al (2015) we include 2005 in the Post
11 In the collapsed two-period panel a regression of changes is equivalent to a regression of levels with firm-fixed
effects and an indicator for the Post period Both approaches obviate unobserved time-invariant firm heterogeneity
We choose first differencing equation for a more intuitive interpretation 12 The Jobs and Growth Tax Relief Reconciliation Act of 2003 was signed into law on May 28 2003 but had been
proposed on January 7 2003 and was made retroactive to the beginning of 2003 Chetty and Saez (2005) show that
the tax change affected dividend policy in 2003 13 In November 2006 the Securities and Exchange Commission required more details about the terms of performance-
based incentive plans We are not aware of any evidence that these rules affected the weight of option-based pay
11
period because FAS123R while effective in June 2005 was released in December 2004 14
Alternatively in untabulated tests we exclude 2005 from the analysis and obtain similar results
Another benefit of using a single Pre and Post period is that it is better suited than panel
data to the analysis of repurchases As noted by Skinner (2008) firms engaging in repurchases
tend to do so every other year thus the relation between repurchases and economic determinants is
stronger over two- or three-year periods than one-year periods Factors explaining the timing of
repurchases differ from those explaining their level and the year-to-year variation in repurchases is
not necessarily informative of changes in payout policy As we are not interested in the timing of
repurchases our approach seems to better capture ldquolong-runrdquo changes in payout policy However
for the analysis of dividends (which are generally paid every year and thus not subject to the
above problem) we also present the results using a panel regression with firm- and year-fixed
effects To alleviate the problem of serial correlation discussed earlier we cluster the standard
errors by firm
22 Accounting Impact
As noted earlier all firms were affected by FAS123R making it difficult to identify a
control sample To capture variation in the cross-sectional impact of FAS123R in Eqs (1) and (2)
we use Accounting Impacti defined as the implied option expense disclosed in the footnote of the
income statement for the 2002 fiscal year scaled by total assets (we obtain similar findings when
scaling it by revenues) We measure this variable in 2002 (ie before the Pre period) rather than in
2003 or 2004 to avoid any confounding effect from the expected adopion of FAS123R (see
discussion in Section 33) As this variable is highly skewed (see Table 1) we define it based on
(Gipper 2015) or had any effect on payout policy However we exclude 2007 from the Post period in robustness tests
Our inferences are unchanged 14 FAS123R was released in December 2004 effective as of the beginning of the first interim or annual reporting
period beginning after June 15 2005 Subsequently the SEC allowed a six-month deferral making the standard
effective for fiscal years beginning after December 15 2005
12
its quartile rank We also presents results with separate indicators for the top three quartiles in
order to better isolate the difference between top quartile (the most lsquotreatedrsquo group) and bottom
quartile (the least lsquotreatedrsquo group and thus closer to the notion of a control group)
An alternative way to address the issue of a lack of control group is suggested by Bakke et
al (2015) They argue that two sets of firms were likely lsquounaffectedrsquo by FAS123R (i) firms that
did not grant options to the CEO in 2003 and 2004 as in these firms FAS123R could not affect
CEO option pay and thus her incentives to make policy changes (ii) firms that were already
voluntarily expensing stock options as of 2002 (ie before FASB began discussions of the new
standard) as these firms would not face any additional accounting charge under FAS123R
Our approach offers a number of advantages First instead of collapsing all lsquonon-controlrsquo
firms in a single lsquotreatedrsquo group we exploit cross-sectional variation among treatment firms in
terms of the likely impact of FAS123R effectively using the most and least affected firms
(respectively top and bottom quartile of implied option expense) as treatment and control group
As shown in Table 1 the implied option expense is highly skewed (ie only a relatively small
number of firms was heavily affected by FAS123R) Capturing this variation is likely to increase
the power of the test Second in Bakke et al (2015) what matters is that the treatment definition
captures an accounting-driven change in CEO option grants as their focus is on CEO risk-taking
incentives In our setting we want to capture an accounting-driven change both in CEO option
grants (predicted to affect incentives to use dividends) and in the overall use of stock options
(predicted to affect the use of repurchases) As noted in Section 31 (see footnote 20) many firms
without CEO option grants in 2003 and 2004 were issuing options to non-CEO executives and
other employees and thus facing a potential accounting charge under FAS123R Third about half
of the firms without CEO option grants in 2003 and 2004 issued options to the CEO in the Post-
13
period Hence it is not clear that the control firms were truly unaffected by FAS123R Finally
the implied option expense in 2002 (our measure of the expected accounting impact) is a function
of option grants made in prior years when firms could not anticipate the adoption of FAS123R In
contrast option grant decisions in 2003 and 2004 may be affected by its anticipated adoption as
FASB added accounting for stock-based compensation to its agenda in March 2003
Notwithstanding the above arguments throughout our study we also present the results
using the definition of treatment and control in Bakke et al (2015) In particular we modify Eqs
(1) and (2) by replacing Accounting Impact with Treated an indicator equal to zero for the two
groups of firms identified as lsquocontrolrsquo in Bakke et al (2015) and one for all other firms
23 Payout Variables and Control Variables
Following Brown et al (2007) our baseline measure for changes in dividends is the change
in the DividendAssets ratiomdashcomputed as the regular cash dividends paid during the year scaled
by total assets at the beginning of the yearmdashfrom the Pre to the Post period15 However the
dividend-to-asset ratio is not what managers focus on when making dividend policy decisions
The stability of dividend per share (DPS) among dividend-paying firms (hereinafter payers)
suggests that managers do not target a specific dividend-to-assets ratio but rather a DPS level
(Baker and Wurgler 2016) Survey evidence confirms that executives make dividend policy
decision in terms of changes to the current level of DPS (Brav et al 2005) Therefore we also
examine the percentage change in the average DPS from the Pre to the Post period However this
measure can only be computed for the subset of payers (defined as firms with non-zero DPS in at
15 An alternative choice would be to scale dividends by the market value of equity essentially computing a dividend
yield However a drawback of using the dividend yield in our setting is that after controlling for time-invariant firm
characteristics through fixed effects or first differencing the variation of the ratio comes mainly from the denominator
the stock price (Baker and Wurgler 2004) Thus we choose the more stable book value of total assets as denominator
Also similar to other studies (eg Fenn and Liang 2001) we focus on regular dividends and exclude special dividends
as they are very rare and may introduce large noise to the dividend measures for few observations (DeAngelo
DeAngelo and Skinner 2000)
14
least one of the years of the Pre period) To provide insights into FAS123Rrsquos effect on dividend
policy for non-payers we examine the relation between our Accounting Impact variable and the
rate of dividend initations in the Pre and Post periods
Our main measure for repurchases is the change in RepurchaseAssetsmdashthat is the
aggregate amount of common stock repurchases made during the year scaled by total assets at the
beginning of the yearmdashfrom the Pre to the Post period In the empirical tests we examine
variations suggested in the literature
Finally as an alternative to examining dividends and repurchases separately we also look at a
measure of the payout composition the change in the DividendsTotal Payout ratio from the Pre to
the Post period (Total Payout is the sum of dividends and repurchases) effectively capturing any
substitution effect between dividends and repurchases 16 Examining the causal effect of the
change in option-based pay on payout composition is especially relevant if managers first target a
total payout and then choose the relative weight of dividends and repurchases In practice it is
unclear to what extent managers act this way (Brav et al 2005) Nonetheless for completeness we
also examine this variable We focus on the subsample of firms with both dividends and
repurchases in both Pre and Post period so as to capture changes in payout mix by firms routinely
using both vehicles to return cash to shareholders
As for the control variables in both Eqs (1) and (2) Controli is a vector of firm characteristics
identified in existent literature as determinants of payout policy (eg Fenn and Liang 2001 Brown
et al 2007 Skinner 2008 Cuny et al 2009) firm size book-to-market leverage asset tangibility
free cash flows cash holdings volatility in operating income institutional ownership sales
16 Fama and French (2001) suggest that repurchases are often complement to dividends while Grullon and Michaely
(2002) document that the increase in share repurchases over the past decades has come at the expense of a lower
increase in dividends consistent with a substitution hypothesis Brown et al (2007) also provide evidence of a
substitution effect in response to the 2003 dividend tax cut Survey evidence in Brav et al (2005) suggests an
asymmetric substitution effect with managers more willing to replace dividends with repurchases than the opposite
15
growth past stock returns and an indicator for loss firms For all of these variables we include
both changes from Pre to Post period and levels in the Pre period to allow for the possibility that
levels of these variables affect subsequent changes in payout policy 17 Finally we include
industry-fixed effects (Fama-French 48 industry indicators) to control for industry-level trends in
payout policies and option-based pay In unreported tests we replace free cash flows with two
separate variables operating profit and capital expenditures We also replace volatility in
operating income with volatility in stock returns Our results are unaffected More detailed
definitions of each variable are in the Appendix
24 Identification Assumption
The key identifying assumption underlying the difference-in-difference estimation
technique is that the parallel trends assumption is satisfied In the absence of treatment both
treated and control firms should experience parallel trends in the outcome variable Our approach
assumes that in the absence of FAS123R the change in dividends or repurchases would be the
same for high and low accounting impact firms Note that the well-documented contemporaneous
correlation between levels of option compensation (a key driver of the implied option expense and
thus the accounting impact) and levels of payout variables does not violate our identification
assumption This is because our assumption pertains to the relation between the level of option
compensation and future changes in payout variables
A specific concern is that options may be granted in anticipation of expected future
changes in payout policy (reverse causality problem) Relative to simple association tests this
concern is significantly reduced in our setting because the accounting impact is measured three
years prior to the arrival of treatment and is the result of option grants made over the prior four or
17 In untabulated analyses we run our tests after excluding changes in the control variables (ie including only their
pre-treatment levels) since in difference-in-difference studies controlling variables measured after the shock may
reintroduce selection bias Our inferences remain unchanged
16
five years depending on the vesting schedule18 For the reverse causality to be plausible the
implied option expense in 2002 (the result of option grants made approximately between 1998 and
2002) needs to reflect the anticipated change in payout policy in 2005-2007 This seems unlikely
While the parallel trend assumption is not directly testable similar to other studies (Bakke
et al 2015) we examine the trends in dividends and repurchases during the Pre period Figure 1
suggests that high and low accounting impact firms (respectively top and bottom quartile of
implied option expense) exhibit similar trends in payout variables in the Pre period ie from 2003
to 2004 More formally to examine the correlation between Accounting Impact and trends in the
payout variables during the Pre period we estimate the following regression only with
observations in 2003 and 2004
Payouti = γ0 + γ1 Accounting Impacti FY2004+ γ2 FY2004+ ΓControli +Firm FE +ui (3)
where Payouti is either DividendAssets or RepurchaseAssets FY2004 is an indicator of
fiscal year 2004 Firm FE indicates firm-fixed effects If firms with varying degrees of accounting
impact have different payout trends before the adoption of FAS123R γ1 should be different from
zero However for both payout variables we find that the estimated γ1 is close to zero and not
statistically significant at 10 level (untabulated tests) Overall the parallel trends assumption
seems reasonable in our setting
3 Empirical analyses
31 Sample Selection and Summary Statistics
Our sample is the SampP 1500 firms with available data on implied option expense (from
Compustat) and on executive compensation (from Execucomp) for at least one year in the Pre
18 The accounting treatment for stock options requires their fair value at the grant date to be recognized over the
service period (usually the vesting period) Hence the implied option expense in a given year includes a fraction of
the expense associated with past option grants
17
period and one year in the Post period to ensure consistency in the sample across periods Similar
to prior studies on payout policy (Fama and French 2001 Skinner 2008) we exclude financial
firms (SIC code between 6000 and 6999) and utilities (SIC between code 4900 and 4999) as well as
firms not incorporated in the US Our final sample includes 1176 firms19 We obtain dividend
and stock returns data from CRSP stock repurchases and dividend per share data from
COMPUSTAT and institutional ownership data from Thomson Reuters 13F database Other
control variables are from CRSP and COMPUSTAT To deal with outliers we winsorize all
continuous variables at 1 and 99 by fiscal year A detailed definition of all variables and their
sources is in Appendix
Table 1 Panel A presents summary statistics of the relevant variables for the pooled sample of
5653 firm-year observations Implied option expense in 2002 (our proxy for Accounting Impact)
is on average 173 of total assets with the median at 052 This suggests that the accounting
impact is very large for a small number of firms Over the entire sample period on average
dividends represent 093 of total assets while repurchases represent 394 Untabulated
analyses indicate that in 16 of the firm-year observations only dividends are paid out in 25
only repurchases in 32 both and in 27 neither Within the subset of firm-years with a payout
dividends represent 3874 of total payout This data confirms prior evidence that repurchases
have assumed the primary role as a vehicle to return cash to shareholders (eg Floyd et al 2015)
The mean (median) total executive pay (average across the top 5 executives) is $25 million ($16
million) On average option grants and restricted stock grants represent respectively 283 and
141 of total pay while salary and bonus comprise 296 and 197 respectively The
19 The results presented in the study are similar when (i) we restrict the sample to firms with available data for the
entire (2003-2007) sample period (1009 firms) and (ii) we exclude firms with CEO turnover in the Post period
(reducing the sample size to 780 firms) as a new CEO may have a different compensation package andor adopt a
different payout policy
18
composition of CEO pay (untabulated) is similar As for the control variables the figures are
generally consistent with other studies examining SampP 1500 firms over the same period
Panel B reports the pairwise Pearson correlations among the relevant variables The
correlations are in line with the associations documented in prior studies For example larger
firms and firms with higher profitability (free cash flows) have higher payouts loss firms have
lower payouts greater volatility in operating income is associated with lower dividends
More relevant to our analysis Panel C presents the mean of each variable in the Pre and Post
period for the full sample For each variable we first compute the firm-level mean over the Pre
and the Post Period and then compute the mean of the resulting figure across all firms There is a
striking increase in repurchases which double from 245 to 490 of total assets causing a
similar increase in total payout The increase in dividends is much smaller from 083 to 099
of total assets As a result for firms with positive payout dividends become a smaller fraction of
total payout in the Post period (2790 versus 3914 in the Pre period) This trend is consistent
with Floyd et al (2015) who document a dramatic increase in repurchases in the years leading to
the 2008 financial crisis Consistent with previous studies around FAS123R there is a significant
reduction in option grants as a fraction of total executive pay (from 343 to 240) and a
corresponding increase in the use of restricted stock (from 87 to 176) with little variation in
the weight of salary and bonus (note that restricted stock salary and bonus were expensed both
before and after FAS123R) Similar patterns hold for the composition of CEO pay (untabulated)
Compared to changes in the mix of executive pay changes in the levels of control variables are
generally less pronounced
Panel D reports the change in the key compensation and payout variables from the Pre to the
Post period by quartiles of implied option expense and yields a number of insights First
19
confirming the skewness suggested by Panel A the mean implied option expense is 551 for
firms in the top quartile versus only 093 035 and 012 for firms in the second third and
bottom quartile respectively Second as expected firms with higher implied option expense have
greater use of option-based pay For example in the Pre-period option pay represents 507 of
total executive pay at firms in the top quartile versus 201 in the bottom quartile Third and
more importantly for our research design the use of option pay changes significantly from the Pre
to the Post period as a function of the accounting impact For firms in the top quartile the
percentage of total pay represented by stock options drops by 182 (from 507 to 325)
versus 113 80 and 34 for firms in the second third and bottom quartile respectively The
decline in option usage across quartiles is accompanied by an increase in restricted stock grants
while the weight of salary and bonus shows little change It is important to emphasize the
substitution of stock options with restricted stocks because restricted stocks typically pay
dividends (Zhang 2013) thus providing further reason to expect a dividend increase in response to
the FAS123R-induced decline in option pay
As for the payout variables Panel D suggests that heavy option users (firms with higher
implied option expense) generally use repurchases more than dividends consistent with the
associations documented in earlier studies In the Pre period repurchases (dividends) represent
351 (030) of total assets for the top quartile versus 113 (112) for the bottom quartile
Panel D also indicates that the increase in repurchases documented in Panel C takes place across
all quartiles As for the (much smaller) change in dividends the absolute increase is similar across
the four quartiles though the relative increase (the percentage change) appears to be slightly
higher in the top quartile Overall these figures do not suggest a shift toward dividends and away
from repurchases by firms with a large (accounting-induced) decline in the use of option pay
20
Panel E presents the same data as Panel D but based on the definition of lsquotreatmentrsquo and
lsquocontrolrsquo in Bakke et al (2015) Under this definition 997 firms are classified as treatment group
and 177 as control (171 firms are classified as lsquocontrolrsquo because they did not grant options to the
CEO in the Pre period and 6 because they were voluntarily expensing options before 2003)
Interestingly lsquotreatedrsquo firms are equally distributed across the quartiles suggesting significant
variation in the degree of treatment As discussed earlier one benefit of our approach is that it
exploits cross-sectional variation among treatment firms in terms of the likely impact of FAS123R
Also 40 of the control firms (71 out of 177) are in the lowest quartile while 35 ((37+25)177)
are in the top two quartiles reflecting the different focus of the two approaches in terms of
identifying firms less affected by FAS123R20
As for payout and compensation variables Panel E shows that the treated group experiences a
larger increase in repurchases than the control group while the (less pronounced) increase in
dividends is similar across treated and control firms Treated firms experience a 126 decrease in
option pay (from 387 to 261) with a corresponding 94 increase in the weight of restricted
stock grants (from 80 to 174) The figures are similar at the CEO level (because the
classification is based on options grants to the CEO it is useful to report pay figures at both the top
5 executives and the CEO level) Interestingly the control group experiences a pronounced
increase in the weight of option grants in total CEO pay from 10 to 127 as almost half of the
control firms issued options to their CEOs in the Post period (for these firms options as percentage
of total CEO pay increased from 0 to 254 untabulated analysis) While this increased use of
stock options suggests (ex post) that these firms were not concerned with the impact of FAS123R
another possibility is that the lack of use of option compensation for CEOs in 2003 and 2004 was
20 In untabulated analysis we find that 55 of the 171 firms issuing no options to the CEO in the Pre period granted
options to the other top executives (and perhaps to other non-executive employees) thus explaining the relatively high
implied option expense for the control group (10 versus 19 for the treatment group ndash see Panel E)
21
temporary rather than the effect of a permanent policy If these firms were planning to issue
options to the CEO in the Post period the assumption that they were unaffected by FAS123R (and
thus their use as control sample) is questionable21
32 Differential Impact of FAS123R on the Use of Option-Based Compensation
An important building block of our approach is the presumed differential impact of FAS123R
on option-based pay as a function of pre-existing implied option expense22 While Table 1 Panel
D preliminarily supports the validity of this assumption we formally examine it by estimating Eq
(1)
As reported in Table 2 Panel A we find a significant negative association between Accounting
Impact and the change in option-based pay around the adoption of FAS123R In column (1)
where we use the quartile rank of implied option expense the -0044 coefficient implies that
around FAS123R option grants over total pay decline by 44 as we move from the highest
quartile to the next Thus the reduction in top quartile firms is 132 larger than in bottom
quartile firms In column 2 we replace the quartile rank with three indicators for the highest
quartiles (with the bottom quartile collapsed in the intercept) so as to be able to compare directly
top and bottom quartile without imposing the same effect across quartiles The negative and
significant coefficient on the top quartile indicator at -0140 suggests that the reduction in option
grants over total pay is 140 larger for top quartile firms relative to bottom quartile firms
Finally in column 3 we use the indicator for treated firms following Bakke et al (2015) The
21 Panel E also shows an increase in the use of restricted stock in CEO pay packages (from 128 to 182 almost
comparable to the increase among treated firms) The concurrent increase in options and restricted stock suggests
these firms would have increased option pay significantly more had it not been for FAS123R indicating further
caution in classifying them as control group of unaffected firms 22 This is akin to the relevance assumption of instrumental variable if we interpret the implied option expense as an
instrument to the change in option-based pay
22
negative and significant coefficient at -0132 suggests that treated firms experience a 132
larger drop in the weight of option pay relative to control firms
In Panel B we re-estimate Eq (1) using a panel regression with firm- and year-fixed effects
(5653 firm-year observations) where the dependent variable is the the ratio of option grants to
total executive pay The results are virtually identical in terms of significance and magnitude of
the coefficients of interest (the interaction terms between respectively Accounting impact and
Treated and an indicator for the Post period)
Overall Table 2 suggests that high implied option expense and the introduction of FAS123R
together strongly encouraged firms to cut back option-based compensation for executives It also
supports the general validity of the approach in Bakke et al (2015) in identifying firms most
affected by FAS123R notwithstanding the concerns outlined earlier
Our test of Eq (1) focuses on executive stock options For our dividend-protection hypothesis
it is important to establish that the level of implied option expense predicts a change in executive
stock options (rather than only a change in the use of non-executive employee stock options) as we
want to capture the effect of a change in executivesrsquo incentives on payout policy At the same
time our dilution channel hypothesis assumes a change in the use of all (executive and non-
executive employee) stock options Thus in untabulated analyses we repeat the test in Eq (1) by
replacing the dependent variable with the change in the number of options granted to all
employees (scaled by the total number of outstanding shares note for this analysis we can only
use data from 2004 to 2007 because Compustat began reporting data on ESO in 2004) The
coefficient on Accounting Impact and Treated continues to be negative and significant suggesting
that the differential reduction in the use of option compensation as a function of accounting impact
23
occurred for both executive and non-executive employee stock options Indeed Brown and Lee
(2011) report a similar decrease in executive and employee stock options around FAS123R
33 Option-Based Pay and Dividend Payouts
In this section we examine the effect of an exogenous (accounting-induced) change in option
compensation on dividend policy by estimating Equation (2)
Table 3 Panel A presents the results using the change in dividends from Pre to Post as
dependent variable We find no significant association between Accounting Impact (column 1 and
2) or Treated (column 3) and the change in dividends around the adoption of FAS123R This is in
stark contrast with the negative effect of option-based pay on dividends predicted in the literature
and documented in various association studies
One concern with this lack of effect is that perhaps our setting is not powerful enough to detect
it One way to examine this possibility is the following The coefficient on Accounting Impact
rank=4 in column 2 is 0001 and the standard error (SE) is 00009 Assuming the estimated
standard error is correct then for a two-tailed t test the coefficient needs to be greater than 00015
(=SE1645) or 015 to reach the 10 percent significant level In other words if moving from
the bottom to the top quartile (which predicts a 14 differential decline in option based pay as per
Table 2 Panel A) resulted in a 015 increase of the dividendasset ratio our test would be able to
detect a causal effect of option-based pay on dividends Given the unconditional mean of the
dividendasset ratio at 093 an increase of 015 from the Pre to the Post period seems
plausible In fact the average increase from the Pre to the Post period is 016 (Table 1 Panel C)
Thus if an effect was there our test should detect it
24
Panel B presents the results using a panel regression (5653 firm-year observations) with firm-
and year-fixed effects and interaction terms between Accounting Impact (or Treated) and an
indicator for the Post period Our inferences are unchanged
These analyses are based on our full sample which includes both dividend-paying and non-
dividend-paying firms Hence they implicity treat as equal two potentially different decisions to
initiate dividends and to increase dividends For example an increase in the dividend-to-asset
ratio from 05 to 06 will be treated the same as an increase from 00 to 01 even though
the latter represents a critical dividend initiation decision23 To address this following Chetty and
Saez (2005) we separately examine how FAS123R impacts the intensity of dividend changes (for
the subset of payers) and the likelihood of dividend initiations (for the subset of non-payers)
331 Option-Based Pay and Dividend Payouts Intensity of Dividend Changes
In the first row of Panel C we repeat the analysis in Panel A for the sub-sample of 572 payers
defined as firms with positive DPS in 2003 andor 2004 Note that we report only the coefficients
of interest for parsimony In the second row we replace the dependent variable with the
percentage change in DPS DPS is the choice variable for managers (Brav et al 2005 Baker and
Wurgler 2016) and thus our preferred measure to capture changes in dividend policy To account
for skewness in this variable (Khale 2002) in the third fourth and fifth rows we use indicator
variables to denote whether the change in DPS surpasses a threshold respectively 20 40 and
60 The proportion of firms that surpass these thresholds are 59 44 and 33 respectively24
23 Initiating dividends is a critical decision for boards given the pre-commitment value that investors attach to this
decision and the strong negative market reaction when firms eliminate or reduce dividends (Brav et al 2005) For
executives trying to maximize the value of their own stock options (dividend-protection argument) the ability to
influence a dividend initiation decision is likely lower than the ability to influence a dividend increase decision 24 Although in the third fourth and fifth rows our dependent variable is a binary variable we use a linear model (OLS)
instead of a probit or logit nonlinear model The reason is that estimating fixed effects in binary response models with
panel data can cause the incidental parameters problem The coefficient estimates can be biased when the panel data
25
Across all of these specifications we find no association between Accounting Impact or Treated
and the intensity of dividend changes Thus it does not appear that an exogenous reduction in
option-based pay caused dividend-paying firms to increase dividends
In Panel D we perform four robustness tests For parsimony we show only the coefficients of
interest and only the cases where the dependent variable is an indicator denoting a greater than
40 increase in DPS The results are similar for the other four ldquointensityrdquo dependent variables
reported in Panel C
In the first row we exclude firms that began to voluntarily expense options in 2003 or 2004
(84 firms of which 68 are dividend payers) FASB added accounting for stock-based
compensation to its agenda in March 2003 and issued an Exposure Draft proposing the expensing
of stock options at fair value in March 2004 In anticipation a number of firms began to
voluntarily expense stock options in 2003 and 2004 (Aboody et al 2004) If these firms reduced
option grants and as a result increased dividends during the Pre period then their inclusion may
reduce the power of our tests and thus our ability to detect the hypothesized relation25
In a similar spirit in the second row we exclude firms in the top decile in terms of reduction in
the ratio of option grants to total pay for the top 5 executives between 2002 (the year prior to the
Pre-period) and 2004 (the end of the Pre-period) This encompasses 113 firms of which 55 are
dividend payers If these firms reduced option grants in anticipation of FAS123R and as a result
increased dividends during the Pre period their inclusion may reduce our ability to detect the
hypothesized relation
has a large number of observations but a short time series Examples of studies making a similar choice are Puri
Rocholl and Steffen (2011) and Chu and Ma (2015) 25 This is unlikely to be a serious concern as previous studies suggest that voluntary expensers made limited use of
stock options (Aboody et al 2004) In fact in our sample 79 of these firms are in the bottom two quartiles of
implied option expense (untabulated) Nonetheless we present this test for robustness
26
In the third row we exclude firms that accelerated the vesting of options before FAS123R
became effective in order to avoid recognizing an expense for the unvested portion of these
options (Choudhary et al 2009 Balsam Reitenga and Yin 2008) This encompasses 196 firms of
which 54 are dividend payers If accelerating vesting was used to reduce the impact of FAS123R
the inclusion of these firms may reduce the power of our tests26
In the fourth row we deal with the concern that if firms target a fixed dividend to net income
ratio (Lintner 1956) and do so without adjusting for changes in accounting standards then by
decreasing net income (via option expense) the accounting change would mechanically cause a
reduction in dividends This would potentially offset and confound the increase predicted under
the dividend-protection and dilution hypotheses This seems unlikely for two reasons First firms
are notoriously reluctant to cut dividends (Brav et al 2005) Hence it seems unlikely that they
would reduce dividends in response to a decline in net income with no economic or cash flow
implications (ie re-classification of an expense from the footnotes to the income statement)
Second firms today set dividends in terms of dividend per share rather than by targeting a net
income-based payout ratio (Brav et al (2005)) As noted by Skinner (2008) over the last few
decades as earnings have become more variable the relation between earnings and dividends has
become weaker with dividend payments increasing smoothly and largely independent of the
variation in earnings Nevertheless in the fourth row we exclude the 66 dividend-paying firms that
26 These firms explicitly stated that they accelerated the vesting of stock options to avoid the accounting charge
(Choudhary et al 2009) In fact 72 are classified in the top two quartiles of implied option expense (untabulated)
Thus we would have predicted these firms to experience a significant decline in option pay To the extent that this
decline did not materialize because they minimized the impact of FAS123R by accelerating vesting the ability of
Accounting Impact to predict the reduction in option pay and thus its usefulness in examining changes in dividends
around FAS123R may be reduced The list of firms accelerating vesting was kindly provided by Jack Ciesielsky of
The Analystsrsquo Accounting Observer
27
had a similar payout ratio in 2003 and 2004 as a proxy for firms with a target net income-based
payout ratio in the Pre period27
As shown in Panel D even after excluding these subsets of firms we continue to find no
association between Accounting Impact or Treated and changes in dividends for dividend-paying
firms This is inconsistent with a causal influence of option compensation on dividend policy
Another concern is that by reducing net income and thus retained earnings FAS123R
may have pushed some firms closer to violating dividend covenants in debt contracts and
thus prevented them from increasing dividends This would bias our study against finding a
causal effect of option-based pay on dividends However this does not appear to be a
significant concern for three reasons First the recognition of an option expense does not
imply a decline in net income In fact more than 70 (75) of the full sample firms
(dividend payers) experienced an increase in net income before extraordinary items from
2004 to 2005 (the percentages are similar across the four quartiles of implied option
expense) Second dividend covenants are less common among dividend-paying firms
(Nikolaev 2010) Third most loan contracts in recent years give parties the option to
ldquofreezerdquo GAAP when facing a mandatory change in accounting principles (Christensen and
Nikolaev 2009) Firms expecting an adverse impact of FAS123R on their dividend covenants
would likely exercise this option (particularly given the non-cash nature of option-based
expense) Nonetheless to alleviate this concern we perform three additional analyses
(untabulated) (i) we repeat the tests in Panel C after excluding firms with a drop in net
income between 2004 and 2005 (ie firms that perhaps faced some covenant-related
27 We define a ldquosimilarrdquo payout to be an absolute change in payout ratio of less than 1 from 2003 to 2004 Among
these 66 firms only 39 continued to have a similar payout ratio in 2005 We also try an alternative definition where
a firm is classified as likely to be using a net income-based target payout ratio if the absolute percentage change in the
ratio from 2003 to 2004 is less than 10 (100 firms) Our inferences are unchanged
28
constrains to their payout policy as a result of FAS123R) (ii) we explicitly control for net
income and retained earnings in the regression (as in Skinner 2008) (iii) we repeat the tests
in Panel C for dividend payers with dividendsasset ratio above the sample median on the
basis that dividend covenants are less frequent among firms paying large dividends (Jung
Lee and Yang 2016) Our inferences are unchanged
332 Option-Based Pay and Dividend Payouts Dividend Initiations
In this section we examine whether the accounting-driven change in option pay affected
dividend initiations among non-payers We cannot employ the difference-in-difference approach
adopted so far by definition the same firm cannot initiate dividends in both periods However we
can provide suggestive evidence as follows First we take all firms that did not pay dividends in
2002 and group them into quartiles based on 2002 implied option expense For each quartile we
find the number of firms initiating dividends in 2003 and 2004 (the Pre period) Next we take all
firms that did not pay dividends in 2004 group them into quartiles based on 2002 implied option
expense and for each quartile find the number of firms initiating dividends in 2005 and 2006 (the
Post period) We do not include 2007 so as to have the same number of years in both periods and
make the cumulative initiation rates comparable
The left portion of Panel E reports the results of this exercise There is a general decrease in
the dividend initiation rate from the Pre to the Post period This holds both in the full sample of
non-payers (from 129 to 79) and across all quartiles This decrease may reflect a temporary
spike in 2003 and 2004 in response to the 2003 dividend tax cut documented in Chetty and Saez
(2005) It is noteworthy that initiation rates in both periods are lower among firms with higher
implied option expense This is consistent with option-heavy firms being mostly high-growth
firms less inclined to pay dividends More relevant to our research question if the lower use of
29
option compensation increased the propensity to pay dividends we would expect to see a relative
increase (ie a lower decrease) in dividend initiations among firms with the highest accounting
impact Instead the rate does not differ depending on the accounting impact There is
approximatley a 5 decline in initiation rate in each quartile In the right portion of Panel E we
examine similar data for dividend terminations While the results should be interpreted with
caution due to their rarity firms with higher accounting impact do not experience a greater decline
in termination rates Our inferences in Panel E are similar when we compared treated and control
firms following Bakke et al (2015) (untabulated)
Even after taking into account the different nature of decisions for dividend paying and non-
dividend-paying firms we fail to find evidence of a causal influence of option-based compensation
on dividend policy This finding is in contrast to the associations documented in earlier studies It
is even more remarkable as most firms replaced stock options with restricted stock which are
generally dividend-protected and should provide further incentive to increase dividends28
34 Option-Based Pay and Repurchases
In this section we examine the effect of an exogenous (accounting-induced) change in option
compensation on repurchases by estimating Equation (2)
Table 4 Panel A presents the results using the change in repurchases (scaled by total assets)
from Pre to Post as a dependent variable If the use of option-based pay had a positive effect on
firmsrsquo propensity to engage in repurchases as posited by the dividend-protection and dilution
hypotheses we should find a negative association between Accounting Impact or Treated and
repurchases Firms with a higher (accounting-driven) reduction in option-based pay should reduce
28 In a sample of SampP 500 firms between 2000 and 2009 Zhang (2013) reports that 80 of the firms granting
restricted stocks offer dividend protection In that sense the FAS123R-induced shift from stock options to restricted
stock may be characterized as a ldquoshockrdquo to dividend protection in unearned equity pay Accordingly our results cast
doubt on the causal interpretation of the positive association between dividend protection and dividend payouts
documented in prior studies (Zhang 2013 Burns et al 2015 Minnick and Rosenthal 2015)
30
the use of repurchases either because they are shifting toward a greater use of dividends andor
because they have a lower need to offset the dilutive effects of stock options However we find no
significant association between Accounting Impact (columns 1 and 2) and the change in
repurchases around the adoption of FAS123R When we use the Treated indicator (column 3) we
find a significant positive association rather than a negative one In Panel B we repeat the analysis
using net repurchases (ie repurchases after removing the effect of share issuances) following
Fama and French (2001) and Skinner (2008) Our inferences are unchanged29
This test is subject to two important caveats The first is we may not detect a decline in
repurchases because in the Post period firms need to offset the exercise of options that were
granted during the Pre period That is a post-FAS123R reduction in grants may not (yet) translate
into a reduction in exercises during the Post period which reduces our ability to test the dilution
hypothesis (ie that firms repurchase shares to offset exercises)30 However we can examine a
variation of this hypothesis where firms use repurchases to manage the effect of unexercised
options on diluted EPS (Bens et al 2003) To do so in Panel C we use a measure of adjusted
repurchases where we subtract our estimate of repurchases undertaken to offset the exercise of
ESO31 We effectively test whether firms experiencing an accounting-induced decrease in option
grants engage in less repurchases (net of exercise-driven repurchases) because their need to
manage the effect of unexercised options on diluted EPS is lower However the coefficient on
the variables of interest is either insignificant or positive inconsistent with the hypothesis
29 In the case of repurchases we do not examine separately ldquoinitiationsrdquo and ldquointensityrdquo as we do for dividends
because initiation is not clearly defined for repurchases Unlike dividends the occurrence of a repurchase in a given
year (or the lack thereof) cannot be used to infer a general policy due to the more discretionary nature of the timing of
repurchases 30 To capture the effect of lower option-based compensation on option exercises and thus on repurchases we would
ideally extend the Post period beyond 2007 However as noted by Floyd et al (2015) repurchases declined
dramatically after 2007 because of the financial crisis making it difficult to detect the effect of any other factor 31 As upper bound estimate of exercise-driven repurchases we multiply the number of ESO exercised during the year
times the average stock price during the year Since the number of ESO exercised is available in Compustat starting in
2004 Panel C is based on observations from 2004 to 2007
31
A second important caveat is that most firms replaced stock options with restricted stock
(Table 2 Panel C) Unvested restricted stock is excluded from the denominator in the computation
of basic EPS (once vested it is included) However it is included in the denominator of diluted
EPS using the treasury stock method similar to stock options Given the complexity of this
method without access to all details of restricted stock grants and option grants it is difficult to
determine whether the switch from stock options to restricted stock decreased the need for
dilution-driven repurchases as our test implicitly assumes Hence it is possible that we do not find
a decrease in repurchases because a reduced need to offset the dilutive effect of stock options was
neutralized by an increased need to offset the dilutive effect of restricted stock
Subject to the above caveats the evidence in Table 4 is not consistent with a positive causal
relation between the use of option-based pay and repurchases More precisely it suggests that
option-driven dilution concerns do not have a first-order effect on the magnitude of repurchases
even though they may play a role in the repurchase decision Hence our result is not necessarily
in conflict with the evidence in Brav et al (2005) where two-thirds of the surveyed financial
executives state that offsetting the dilutionary effect of stock option plans or other stock
programs is an important factor to their repurchase decisions
35 Option-Based Pay and Payout Composition
As an alternative to examining dividends and repurchases separately we also look at the
payout composition the change in the DividendsTotal Payout ratio from the Pre to the Post period
where Total Payout is the sum of dividends and repurchases As noted earlier we focus on the
subsample of firms with both dividends and repurchases in both Pre and Post periods so as to
capture the change in payout mix by firms routinely using both vehicles to return cash to
shareholders If the use of option-based pay causes firms to substitute repurchases for dividends
32
we should find a positive association between Accounting Impact or Treated and the payout mix
defined as DividendsTotal Payout ratio Firms with a higher accounting-driven reduction in
option-based pay should have an increase (decrease) in the relative weight of dividends
(repurchases) to the total payout However as reported in Table 5 Panel A we fail to find a
significant association between Accounting Impact (column 1 and 2) or Treated (column 3) and
the change in payout mix The results are similar when we use Net Payout (dividends plus net
repurchases) instead of Total Payout in computing the payout mix (Panel B)
Overall the combined evidence in Tables 3-5 does not support the hypothesis that option-
based compensation has negative (positive) effect on dividends (repurchases) or that it causes
firms to replace dividends with repurchases
4 Conclusion
Prior literature has documented robust associations between option-based compensation and
payout policy yet it remains unclear whether this association reflcts a causal influence We
investigate the causal effect of option-based compensation on payout policy using the adoption of
FAS123R which resulted in a significant decrease in option grants making it a plausible
exogenous shock to the use of option-based pay To overcome the challenge of no control group
we exploit the fact that firms responded differently depending on the firm-specific accounting
impact as measured by the implied option expense disclosed in the footnotes prior to FAS123R
Firms with larger expected accounting impact curtailed option-based compensation much more
aggressively than firms with lower impact Using a sample of SampP 1500 firms we find no
evidence that firms with a larger accounting-induced decline in option compensation increased
dividends reduced repurchases or changed their payout composition contrary to the widely held
belief that option-based pay has a causal influence on payout policy
33
Appendix Variable Definitions and Data Sources
Accounting Impact Variables
Accounting impact Implied option expense (Compustat XINTOPT) divided by total assets
(Compustat AT) This variable is measured at fiscal year 2002 and is time-invariant
Accounting impact rank The quartile rank of Accounting impact (1=lowest 4=highest)
Payout Variables
Regular dividendTotal assets The numerator is total regular cash dividends in the fiscal year
from the distribution dataset in CRSP Regular cash dividends are identified by the distribution
codes 1212 1222 1232 or 1242 The denominator is one-year lagged total assets (Compustat
AT)
DPS Dividend per share (Compustat DVPSX_F)
DPS pct change The percentage change of average DPS from Pre- to Post-FAS123R period
DPS pct change gtX indicator A dummy variable that equals one if DPC pct change is greater
than X and zero otherwise
RepurchaseTotal assets The numerator is the repurchase of common equity which equals total
repurchase (Compustat PRSTK) minus the change in preferred stock redemption value
(Compustat PSTKRV) The denominator is one-year lagged total assets (Compustat AT)
Net repurchaseTotal assets Net repurchase removes the effect of share issuances The
construction follows Fama and French (2001) and Skinner (2008) if the firm uses the treasury
stock method for repurchase net repurchase equals the increase in common treasury stock
(Compustat TSTKC) if the firm uses the retirement method (when common treasury stock is zero
in the current and prior year) net repurchase equals total repurchases minus stock issuance
(Compustat SSTK) and change in preferred stock redemption value (Compustat PSTKRV)
When the above measures give negative value net repurchase is set to zero
Adjusted repurchaseTotal assets Adjusted repurchase removes from total repurchase the potential
effect of repurchasing exercised options This variable equals total repurchase of common stocks
minus the product between the number of options exercised (Compustat OPTEXD) and average
stock price during the year When the above measure gives negative value adjusted repurchase is
set to zero Since the number of options exercised is not available before 2003 we drop
observations in 2003 when we use this variable
34
Total payoutTotal assets the sum of Regular dividendTotal assets and RepurchaseTotal assets
Regular dividendTotal payout regular cash dividend divided by the sum of regular cash dividend
and repurchase from common equity In the two-period analysis (Pre- vs Post-FAS123R) we
separately sum the numerator and the denominator for each firm-period and then calculate the ratio
Regular dividendNet payout regular dividend divided by the sum of regular dividend and net
repurchase In the two-period analysis (Pre- vs Post-FAS123R) we separately sum the numerator
and the denominator for each firm-period and then calculate the ratio
Compensation Variables
Salary_$ Average salary (Execucomp SALARY) of the top 5 highest paid executives in $1000
Salary_ Average salary (Execucomp SALARY) divided by average total pay (Execucomp
TDC1) of the top 5 highest paid executives
Bonus_$ Average bonus (Execucomp BONUS) of the top 5 highest paid executives in $1000
Due to a data format change we add non-equity plan-based awards (Execucomp
NON_EQ_TARG) to this measure after 2006
Bonus_ Bonus_$ divided by average total pay (Execucomp TDC1) of the top 5 highest paid
executives
Option grant_$ Average option grant value (Execucomp OPTION_AWARDS_BLK_VALUE or
OPTION_AWARDS_FV) of the top 5 highest paid executives in $1000 Due to a data format
change we use OPTION_AWARDS_FV for this measure after 2006
Option grant_ Option grant_$ divided by average total pay (Execucomp TDC1) of the top 5
highest paid executives
Restricted stock grant_$ Average restricted stock grant value (Execucomp RSTKGRNT or
STOCK_AWARDS_FV) of the top 5 highest paid executives in $1000 Due to data format
change we use STOCK_AWARDS_FV for this measure after 2006
Restricted stock grant_ Restricted stock grant_$ divided by average total pay (Execucomp
TDC1) of the top 5 highest paid executives
Total pay_$ Average total pay (Execucomp TDC1) of the top 5 highest paid executives in $1000
35
Other Characteristics
Size The book value of total assets (Compustat AT) minus the book value of common equity
(Compustat CEQ) plus the market value of common equity from CRSP in $M
Log(size) the natural logarithm of size
Book-to-market the book value of common equity dividend by its market value
Leverage long term debt plus short term debt (Compustat DLTT + DLC) divided by total assets
Asset tangibility tangible assets (Compustat AT - INTAN) divided by total assets
Free cash flow Operating cash flow (Compustat OANCF) minus capital expenditure (Compustat
CAPX) then divided by lagged total assets
Cash holding Cash and short-term investments (Compustat CHE) divided by total assets
ROA volatility the standard deviation of returns on assets (operating income before tax divided by
lagged total assets) in the past five fiscal years
Institutional ownership the number of shares held by institutional investors divided by the number
of shares outstanding from Thomson Reuters Institutional Holdings database
Sales growth the growth rate of sales (Compustat SALE) from the prior year
Past stock return annual stock return from the prior year
Loss indicator a dummy variable taking value of one if the current net income is negative and
zero otherwise
36
References
Aboody David 1996 Market Valuation of Employee Stock Options Journal of Accounting and
Economics 22 357-391
Aboody David Barth Mary E and Ron Kasznik 2004 Firms Voluntary Recognition of Stock-
Based Compensation Expense Journal of Accounting Research 42 123ndash150
Aboody David and Ron Kasznik 2008 Executive stock-based compensation and firmsrsquo cash
payout the role of shareholdersrsquo tax-related payout preferences Review of Accounting Studies
13 216ndash251
Anantharaman Divya and Yong Gyu Lee 2014 Managerial risk taking incentives and corporate
pension policy Journal of Financial Economics 111 328ndash351
Baker Malcolm and Jeffrey Wurgler 2004 A catering theory of dividends Journal of Finance
59 1125-1165
Baker Malcolm and Jeffrey Wurgler 2016 Dividends as reference points a behavioral signaling
approach Review of Financial Studies 29 697-738
Bakke Tor-Erik Hamed Mahmudi Chitru Fernando and Jesus Salas 2015 The causal effect of
option pay on corporate risk management Journal of Financial Economics forthcoming
Balsam Steven Austin Reitenga and Jennifer Yin 2008 Option acceleration in response to SFAS
No 123 (R) Accounting Horizons 22 23-45
Bens Daniel and Steven Monahan 2008 Altering Investment Decisions to Manage Financial
Reporting Outcomes Asset-Backed Commercial Paper Conduits and FIN 46 Journal of
Accounting Research 46 1017-1055
Bens Daniel A Venky Nagar Douglas J Skinner and MH Franco Wong 2003 Employee stock
options eps dilution and stock repurchases Journal of Accounting and Economics 36 51ndash90
Bertrand Marianne Esther Duflo and Sendhil Mullainathan 2004 How much should we trust
differences-in-differences estimates The Quarterly Journal of Economics 119 249ndash275
Blouin Jennifer L Jana S Raedy and Douglas A Shackelford 2011 Dividends Share
Repurchases and Tax Clienteles Evidence from the 2003 Reductions in Shareholder Taxes
The Accounting Review 86 887-914
Brav Alon John R Graham Campbell R Harvey and Roni Michaely 2005 Payout policy in the
21st century Journal of Financial Economics 77 483ndash527
Brown Lawrence D and Yen-Jung Lee 2011 Changes in Option-Based Compensation Around
the Issuance of SFAS123R Journal of Business Finance amp Accounting 38 1053ndash109
37
Brown Jeffrey R Nellie Liang and Scott Weisbenner 2007 Executive financial incentives and
payout policy Firm responses to the 2003 dividend tax cut Journal of Finance 62 1935ndash
1965
Burns Natasha Brian McTier and Kristina Minnick 2015 Equity-incentive compensation and
payout policy in Europe Journal of Corporate Finance 30 85-97
Carter Mary Ellen and Luann J Lynch 2003 The Consequences of the FASBrsquos 1998 Proposal on
Accounting for Stock Option Repricing Journal of Accounting and Economics 35 51-72
Carter Mary Ellen Luann J Lynch and Irem Tuna 2007 The role of accounting in the design of
CEO equity compensation The Accounting Review 82 327ndash357
Chava Sudheer and Amiyatosh Purnanandam 2010 CEOs versus CFOs Incentives and
corporate policies Journal of Financial Economics 97 263ndash278
Chetty Raj and Emmanuel Saez 2005 Dividend taxes and corporate behavior Evidence from the
2003 dividend tax cut The Quarterly Journal of Economics 120 791ndash833
Choudhary Preeti Shivaram Rajgopal and Mohan Venkatachalam 2009 Accelerated vesting of
employee stock options in anticipation of FAS123R Journal of Accounting Research 47 105ndash
146
Christensen Hans B and Valeri Nikolaev 2009 Contracting on Mandatory Changes to GAAP
New Practice and Its Determinants Working Paper University of Chicago
Chu Yongqiang and Tao Ma 2015 How does management compensation affect bank risk taking
evidence from FAS 123R University of South Carolina Working Paper
Cuny Charles J Gerald S Martin and John J Puthenpurackal 2009 Stock options and total
payout Journal of Financial and Quantitative Analysis 44 391ndash410
DeAngelo Harry Linda DeAngelo and Douglas J Skinner 2000 Special Dividends and the
Evolution of Dividend Signaling Journal of Financial Economics 57 309-354
Dechow Patricia M Amy P Hutton and Richard G Sloan 1996 Economic consequences of
accounting for stock-based compensation Journal of Accounting Research 34 1ndash20
Edgerton J 2013 Four facts about dividend payouts and the 2003 tax cut International Tax and
Public Finance 20 769-784
Edmans Alex and Xavier Gabaix 2015 Executive compensation a modern primer Journal of
Economic Literature forthcoming
38
Fama Eugene F and Kenneth R French 2001 Disappearing dividends changing firm
characteristics or lower propensity to pay Journal of Financial Economics 60 3ndash43
Farre-Mensa Joan Roni Michaely and Martin C Schmalz 2014 Payout policy Annual Review
of Financial Economics 6 75ndash134
Fenn George W and Nellie Liang 2001 Corporate payout policy and managerial stock
incentives Journal of Financial Economics 60 45ndash72
Ferri Fabrizio and Tatiana Sandino 2009 The impact of shareholder activism on financial
reporting and compensation the case of employee stock options expensing The Accounting
Review 84 433ndash466
Floyd Eric Nan Li and Douglas J Skinner 2015 Payout policy through the financial crisis the
growth of repurchases and the resilience of dividends Journal of Financial Economics 118
299-316
Frydman Carola and Dirk Jenter 2010 CEO compensation Annual Review of Financial
Economics 2 75-102
Gipper Brandon 2015 Assessing the Effects of Disclosing Management Compensation Working
Paper University of Chicago
Gormley Todd David Matsa and Todd Milbourn 2013 CEO compensation and corporate risk
evidence from a natural experiment Journal of Accounting and Economics 56 79-101
Graham John Michelle Hanlon and Terry Shevlin 2011 Real effects of accounting rules
evidence from multinational firmsrsquo investment locations and profit repatriation decisions
Journal of Accounting Research 49 137-185
Graham John Campbell Harvey and Shiva Rajgopal 2005 The Economic implications of
corporate financial reporting Journal of Accounting and Economics 40 3-73
Greenspan Alan 2002 Testimony of Alan Greenspan before the Committee on Banking
Housing and Urban Affairs US Senate July 16 Washington DC Government Printing
Office
Grullon Gustavo and Roni Michaely 2002 Dividends Share Repurchases and the Substitution
Hypothesis Journal of Finance 57 1649-1684
Hail Luzi Ahmed Tahoun and Clare Wang 2014 Dividend Payouts and Information Shocks
Journal of Accounting Research 52 403-456
Hall Brian J and Kevin J Murphy 2002 Stock options for undiversified executives Journal of
Accounting amp Economics 33 3-42
39
Hall Brian J and Kevin J Murphy 2003 The trouble with stock options Journal of Economic
Perspectives 17 49ndash70
Hanlon Michelle and Jeffrey L Hoopes 2014 What do firms do when dividend tax rates change
An examination of alternative payout responses Journal of Financial Economics 114 105-
124
Hayes Rachel M Michael Lemmon and Mingming Qiu 2012 Stock options and managerial
incentives for risk taking Evidence from FAS123R Journal of Financial Economics 105
174ndash190
Heron Randall A Erik Lie 2007 Does backdating explain the stock price pattern around
executive stock option grants Journal of Financial Economics 83 271-295
Hribar Paul Nicole Thorne Jenkins and W Bruce Johnson 2006 Stock repurchases as an
earnings management device Journal of Accounting and Economics 41 3ndash27
Jensen Michael C 1986 Agency cost of free cash flow corporate finance and takeovers
American Economic Review 76 323-329
Jolls Christine 1998 Stock repurchases and incentive compensation NBER Working Paper No
w6467
Jung Boochun Woo-Jong Lee and Yanhua Sunny Yang 2016 The Impact of Dividend
Covenants on Investment and Operating Performance Journal of Business Finance amp
Accounting 43 414ndash447
Kahle Kathleen M 2002 When a buyback isnrsquot a buyback open market repurchases and
employee options Journal of Financial Economics 63 235ndash261
Lambert Richard A William N Lanen and David F Larcker 1989 Executive stock option plans
and corporate dividend policy Journal of Financial and Quantitative Analysis 24 409ndash425
Lintner John 1956 Distribution of incomes of corporations among dividends retained earnings
and taxes The American Economic Review 46 97-113
Low Angie 2009 Managerial risk-taking behavior and equity-based compensation Journal of
Financial Economics 92 470-490
Miller Merton H and Franco Modigliani 1961 Dividend policy growth and the valuation of
shares The Journal of Business 34 411ndash433
Minnick Kristina and Leonard Rosenthal 2015 Stealth compensation Do CEOs increase their
pay by influencing dividend policy Journal of Corporate Finance 25 435-454
40
Murphy Kevin J 1999 Executive compensation In O Ashenfelter and D Card (eds) North
Holland Handbook of Labor Economics Amsterdam Elsevier Science BV
Murphy Kevin J 2013 Executive compensation Where we are and how we got there Handbook
of the Economics of Finance Elsevier Science North Holland 211-356
Nikolaev Valeri 2010 Debt Covenants and Accounting Conservatism Journal of Accounting
Research 48 143-176
Puri Manju Joumlrg Rocholl and Sascha Steffen 2011 Global retail lending in the aftermath of the
US financial crisis Distinguishing between supply and demand effects Journal of Financial
Economics 100 556-578
Shue Kelly and Richard R Townsend 2014 Swinging for the fences Executive reactions to
quasi-random option grants Working Paper University of Chicago
Skinner Douglas J 2008 The evolving relation between earnings dividends and stock
repurchases Journal of Financial Economics 87 582-609
Weisbenner Scott J 2000 Corporate share repurchases in the 1990s What role do stock options
play FEDS Working Paper No 2000-29
Zhang Dan 2013 CEO dividend protection Working Paper BI Norwegian Business School
41
Figure 1 Trends of dividends and repurchases from 2003 to 2007 Panel A plots the average
Regular DividendTotal Assets of firms in the highest and lowest quartiles of Accounting Impact
measured in 2002 Panel B shows the average Total RepurchaseTotal Assets of firms in the
highest and lowest quartiles of Accounting Impact measured in 2002
Panel A Trends of regular dividends
Panel B Trends of total repurchases
00
05
10
15
20
2003 2004 2005 2006 2007
Regular DividendTotal Assets
Lowest Acc Impact
Highest Acc Impact
Pre Post
00
20
40
60
80
100
2003 2004 2005 2006 2007
Total Repurchase Total Assets
Lowest Acc Impact
Highest Acc Impact
Pre Post
42
Table 1
Summary Statistics
Panel A Firm characteristics - full sample
N Mean Std dev 25 pctl Median 75 pctl
Accounting impact (2002) 1176 173 366 022 052 163
Payout variablesRegular dividendTotal assets 5653 093 148 000 000 142
RepurchaseTotal assets 5653 394 710 000 035 500
Total payoutTotal assets 5653 488 748 000 175 666
Regular dividendTotal payout 4091 3874 4057 000 2237 8833
Level of executive compensation (in $1000)
Salary_$ 5653 450 190 314 409 544
Bonus_$ 5653 476 616 122 295 586
Option grant_$ 5653 791 1137 62 384 1002
Restricted stock grant_$ 5653 458 866 0 58 518
Total pay_$ 5653 2481 2475 890 1647 3074
Percentage of executive compensation
Salary_ 5653 296 183 165 251 382
Bonus_ 5653 197 148 97 177 268
Option grant_ 5653 283 235 67 256 445
Restricted stock grant_ 5653 141 180 00 41 249
Control variables
Size ($M) 5653 11086 27294 1017 2459 8117
Log(size) 5653 7985 1565 6925 7808 9002
Book-to-market 5653 0445 0287 0251 0388 0578
Leverage 5653 0202 0172 0038 0187 0309
Asset tangibility 5653 0806 0184 0691 0853 0965
Free cash flow 5653 0059 0091 0013 0059 0108
Cash holding 5653 0166 0172 0034 0100 0247
ROA volatility 5653 0056 0056 0021 0038 0070
Institutional ownership 5653 0753 0202 0639 0795 0910
Sales growth 5653 0121 0189 0028 0096 0183
Past stock return 5653 0094 0183 -0012 0094 0199
Loss indicator 5653 0164 0370 0000 0000 0000
This table presents summary statistics Panel A shows the descriptive statistics of payout variables compensation
variables and other firm characteristics for the full sample Accounting impact is the implied option expense
measured at fiscal year 2002 All other variables are measured at firm-year level from fiscal year 2003 to 2007
resulting in 5653 firm-year observations (except for Regular dividendTotal Payout which can be measured only
for the 4901 firm-year observations with Total payout greater than zero) Panel B shows the pairwise correlations
between main variables at firm-year level Panel C compares payout variables compensation variables and other
firm characteristics before and after FAS123R The Pre-FAS123R period consists of fiscal year 2003 and 2004
the Post-FAS123R period covers fiscal year 2005-2007 Panel D compares the trends of payout and compensation
variables around FAS123R across four quartile groups ranked by 2002 accounting impact Panel E compares the
trends of payout and compensation variables around FAS123R between the treated and control group under the
alternative treatment definition in Bakke et al (2015) (see Section 22) All variables are defined in Appendix The
notation and in Panel C indicates statistically significant at 10 5 and 1 level in T-tests for equal
means respectively
43
Pa
nel
B
Pea
rso
n c
orr
ela
tio
ns
Reg div
Repurchase
Total payout
Salary_
Bonus_
Option_
RS_
Log(size)
BM
Leverage
Tangibility
FCF
Cash holdingROA vol
Inst own
Sales growth
Past ret
urn
Loss
Reg
div
10
0
Repurc
hase
01
610
0
Tota
l payout
03
509
810
0
Sala
ry_
-0
10
-01
8-0
19
10
0
Bonus_
00
700
100
3-0
01
10
0
Option_
-0
10
00
900
6-0
41
-03
510
0
RS
_
01
000
901
0-0
32
-01
1-0
40
10
0
Log(s
ize)
03
101
802
3-0
56
01
101
202
210
0
BM
-02
1-0
28
-03
103
0-0
03
-02
000
0-0
33
10
0
Levera
ge
-00
1-0
08
-00
8-0
05
00
6-0
11
00
801
9-0
03
10
0
Tangib
ility
00
200
100
101
200
1-0
05
-00
6-0
12
-00
4-0
18
10
0
FC
F02
203
703
9-0
20
00
901
1-0
01
02
4-0
32
-02
1-0
16
10
0
Cash
hold
ing
-01
301
000
700
2-0
14
02
2-0
10
-02
3-0
16
-03
502
901
210
0
RO
A v
ol
-01
5-0
04
-00
700
4-0
11
01
9-0
11
-02
3-0
08
-01
101
2-0
02
03
910
0
Inst
ow
n
-00
901
401
1-0
17
00
200
701
200
7-0
01
00
3-0
08
01
4-0
06
-01
110
0
Sale
s gro
wth
-00
8-0
04
-00
6-0
15
00
501
0-0
02
00
7-0
16
-00
3-0
08
01
300
201
400
410
0
Past
retu
rn00
901
301
4-0
18
01
5-0
01
00
301
6-0
29
-01
000
102
7-0
14
-01
001
602
710
0
Loss
-02
0-0
19
-02
201
8-0
18
00
4-0
05
-02
601
901
300
6-0
41
01
702
3-0
16
-01
8-0
40
10
0
44
Panel C Firm characteristics - before and after FAS123R
Pre FAS 123R Post FAS 123R Difference
Payout variables
Regular dividendTotal assets 083 099 016
RepurchaseTotal assets 245 490 245
Total payoutTotal assets 328 589 261
Regular dividendTotal payout 3914 2790 -1124
Level of executive compensation (in $1000)
Salary_$ 426 463 37
Bonus_$ 418 505 87
Option grant_$ 896 707 -191
Restricted stock grant_$ 269 574 305
Total pay_$ 2263 2584 321
Percentage of executive compensation
Salary_ 305 293 -12
Bonus_ 186 204 18
Option grant_ 343 240 -103
Restricted stock grant_ 87 176 89
Control variables
Size ($M) 9671 11631 1960
Log(size) 7860 8035 0175
Book-to-market 0437 0453 0016
Leverage 0201 0203 0002
Asset tangibility 0822 0793 -0029
Free cash flow 0061 0057 -0004
Cash holding 0175 0159 -0016
ROA volatility 0067 0048 -0019
Institutional ownership 0712 0781 0069
Sales growth 0137 0108 -0029
Past stock return 0080 0101 0021
Loss indicator 0173 0159 -0014
45
Pa
nel
D
Fir
m c
ha
racte
rist
ics
by q
ua
rtil
e o
f a
cco
un
tin
g i
mp
act
- b
efo
re a
nd
aft
er
FA
S1
23
R
Accounting im
pact
(2002)
Num
ber
of
Fir
ms
Pre
Post
Pre
Post
Pre
Post
Pre
Post
Payout
vari
able
s
Regula
r div
idendT
ota
l ass
ets
11
2
12
4
09
4
11
1
09
5
11
3
03
0
04
9
Repurc
hase
Tota
l ass
ets
11
3
26
8
19
2
37
3
32
7
63
1
35
1
68
7
Tota
l payout
Tota
l ass
ets
22
4
39
1
28
5
48
4
42
2
74
4
38
1
73
6
Regula
r div
idendT
ota
l payout
643
7
469
8
474
0
341
1
284
5
195
4
82
5
74
5
Perc
enta
ge o
f executive c
om
pensa
tion
Sala
ry_
337
295
313
287
296
289
276
300
Bonus_
223
226
214
228
172
192
134
169
Option g
rant_
201
167
290
210
373
260
507
325
Rest
ricte
d s
tock g
rant_
116
194
98
180
89
176
43
155
294
294
294
294
1st Q
uart
ile2
nd Q
uart
ile3
rd Q
uart
ile4
th Q
uart
ile
01
2
03
5
09
3
55
1
46
Accounting impact
Number of Firms
By accounting impact quartile
1
2
3
4
Pre Post Pre Post
Payout variables
Regular dividendTotal assets 09 11 08 10
RepurchaseTotal assets 18 31 26 52
Total payoutTotal assets 28 43 34 62
Regular dividendTotal payout 428 357 386 265
Percentage of executive compensation
Salary_ 435 364 282 280
Bonus_ 226 214 179 202
Option grant_ 92 125 387 261
Restricted stock grant_ 125 188 80 174
Percentage of CEO compensation
Salary_(CEO) 485 364 260 259
Bonus_(CEO) 249 228 185 219
Option grant_(CEO) 10 127 406 275
Restricted stock grant_(CEO) 128 182 82 183
Panel E Firm characteristics by alternative treatment definition - before and
after FAS123R
Treated
25
19
997
223
250
256
268
10
177
71
Control
44
37
47
Table 2
Differential effect of FAS123R on the use of option-based compensation
Panel A Two-period first-difference regression
Prediction Coeff t-stat Coeff t-stat Coeff t-stat
Accounting impact rank - -0044 -628
Accounting impact rank=2 - -0044 -327
Accounting impact rank=3 - -0075 -468
Accounting impact rank=4 - -0140 -613
Treated - -0132 -875
ΔLog(size) 0061 202 0061 200 0063 214
ΔBook-to-market 0032 091 0032 092 0051 143
ΔLeverage -0157 -213 -0160 -218 -0111 -153
ΔAsset tangibility -0012 -014 -0020 -023 -0023 -026
ΔFree cash flow -0106 -095 -0108 -097 -0128 -117
ΔCash holding -0197 -211 -0193 -206 -0180 -194
ΔFive-year ROA volatility -0065 -031 -0056 -026 -0098 -047
ΔInstitutional ownership -0044 -091 -0043 -088 -0044 -092
ΔSales growth -0064 -102 -0065 -104 -0090 -153
ΔPast one-year stock return 0051 078 0052 080 0091 138
ΔLoss frequency 0056 207 0057 207 0047 179
Log(size) -0009 -210 -0009 -207 -0002 -035
Book-to-market -0015 -056 -0013 -049 0018 072
Leverage 0022 046 0023 048 0068 150
Asset tangibility 0033 077 0033 078 0053 128
Free cash flow 0227 202 0220 195 0127 117
Cash holding -0002 -004 0012 019 -0078 -141
Five-year ROA volatility -0451 -240 -0430 -228 -0509 -283
Institutional ownership -0123 -360 -0122 -359 -0100 -292
Sales growth -0041 -056 -0040 -055 -0089 -125
Past one-year stock return -0009 -015 -0006 -010 0078 125
Loss frequency 0055 174 0056 178 0054 173
Fixed effect
Standard error
Adj R-squared
Observations
Model (3)
Dependent variable ΔAvg Option grantTotal pay
Huber-White
0156
This table investigates whether the effect of FAS123R on the use of option-based pay varies with its potential accounting impact Panel A
reports the results of estimating three two-period first-differencing models where for each firm we average its characteristics in Pre- and
Post-FAS123R period The Pre-FAS123R period consists of fiscal year 2003 and 2004 the Post-FAS123R period covers fiscal year 2005-
2007 In all three specifications the dependent variable is the change of average Option grantTotal pay from Pre- to Post-FAS123R period
The main independent variable varies by model in Model (1) the Accounting impact rank is the quartile rank of implied option expensetotal
assets measured in 2002 (1=lowest 4=highest) In Model (2) Accounting impact rank=2 (3 4) is an indicator that takes value of one if the
firmrsquos Accounting impact rank equals 2 (3 4) In Model (3) we use an alternative treatment construction following Bakke et al (2015)
where Treated is an indicator that takes value of zero if the firm granted zero option to its CEO in both 2003 and 2004 or the firm began to
voluntarily expense option-based pay at fair value in 2002 or earlier and one otherwise For each control variable we include both its level in
the Pre-FAS123R period and its change across the two periods Panel B shows the results of estimating fixed effect models with firm-year
observations The dependent variable is the firm-year level Option grantTotal pay The main independent variables are the interactions of
Post-FAS123R indicator (Post) with Accounting Impact rank Accounting impact rank indicators and Treated respectively All models in
Penal A have industry fixed effects and the standard errors are Huber-White heteroscedasticity-consistent standard errors All models in
Penal B have firm fixed effects and year fixed effects and the standard errors are clustered at firm level All variables are defined in
Appendix The notation and indicates statistically significant at 10 5 and 1 level respectively
Model (1) Model (2)
11711171 1171
Industry Industry
Huber-White
0124
Huber-White
0123
Industry
48
Panel B Panel fixed effects regression
Prediction Coeff t-stat Coeff t-stat Coeff t-stat
Acc impact rank x Post - -0044 -807
Acc impact rank 2 x Post - -0046 -333
Acc impact rank 3 x Post - -0077 -526
Acc impact rank 4 x Post - -0137 -776
Treated x Post - -0145 -970
Log(size) 0034 221 0034 217 0036 229
Book-to-market 0018 084 0017 083 0015 070
Leverage -0004 -009 -0006 -013 -0007 -015
Asset tangibility 0007 012 0004 006 0011 018
Free cash flow -0074 -151 -0072 -146 -0078 -158
Cash holding -0048 -086 -0050 -090 -0006 -011
Five-year ROA volatility 0250 231 0239 219 0437 414
Institutional ownership 0043 159 0044 161 0041 150
Sales growth -0033 -168 -0034 -171 -0031 -158
Past one-year stock return 0067 221 0068 224 0063 204
Loss indicator 0023 209 0022 207 0024 222
Fixed effects
Standard error
Adj R-squared
Observations
Dependent variable Option grantTotal pay
5653 5653 5653
Clustered by firm
Firm Year
Clustered by firm
Firm Year
Clustered by firm
0523 0523 0526
Model (1) Model (2) Model (3)
Firm Year
49
Table 3
Effect of option-based compensation on dividend policy
Panel A Two-period first-difference regression
Prediction Coeff t-stat Coeff t-stat Coeff t-stat
Accounting impact rank + 0000 077
Accounting impact rank=2 + 0001 091
Accounting impact rank=3 + 0000 044
Accounting impact rank=4 + 0001 092
Treated + 0000 -026
ΔLog(size) 0000 -030 0000 -030 0000 -026
ΔBook-to-market -0002 -190 -0002 -193 -0002 -195
ΔLeverage -0002 -059 -0002 -057 -0002 -059
ΔAsset tangibility 0016 431 0016 429 0016 430
ΔFree cash flow 0017 373 0017 373 0017 375
ΔCash holding -0011 -288 -0011 -285 -0010 -282
ΔFive-year ROA volatility 0003 034 0002 032 0003 035
ΔInstitutional ownership -0002 -073 -0002 -073 -0002 -070
ΔSales growth -0001 -040 -0001 -037 -0001 -038
ΔPast one-year stock return 0002 077 0002 076 0002 070
ΔLoss frequency 0000 -048 0000 -045 0000 -046
Log(size) 0000 183 0000 182 0000 182
Book-to-market -0002 -227 -0002 -225 -0002 -284
Leverage -0001 -037 -0001 -039 -0001 -048
Asset tangibility 0003 179 0003 180 0003 176
Free cash flow 0017 291 0017 291 0017 300
Cash holding 0002 080 0002 077 0002 098
Five-year ROA volatility 0003 035 0002 033 0003 044
Institutional ownership -0001 -068 -0001 -068 -0001 -058
Sales growth -0004 -177 -0004 -175 -0004 -172
Past one-year stock return 0004 169 0004 167 0004 165
Loss frequency -0001 -111 -0001 -109 -0001 -102
Fixed effect
Standard error
Adj R-squared
Observations
Dependent variable ΔAvg Regular dividendTotal assets
This table investigates the causal effect of option-based pay on dividend policy by examining whether changes in dividend policy around
FAS123R vary with its potential accounting impact Panel A reports the results of estimating three two-period first-differencing models
where for each firm we average its characteristics in Pre- and Post-FAS123R period In all three specifications the dependent variable is
the change of average Regular dividendTotal assets from Pre- to Post-FAS123R period The main independent variable varies by model in
Model (1) the Accounting impact rank is the quartile rank of implied option expensetotal assets measured in 2002 (1=lowest 4=highest) In
Model (2) Accounting impact rank=2 (3 4) is an indicator that takes value of one if the firmrsquos Accounting impact rank equals 2 (3 4) In
Model (3) we use an alternative treatment construction following Bakke et al (2015) where Treated is an indicator that takes value of zero
if the firm granted zero option to its CEO in both 2003 and 2004 or the firm began to voluntarily expense option-based pay at fair value in
2002 or earlier and one otherwise For each control variable we include both its level in the Pre-FAS123R period and its change across the
two periods Panel B shows the results of estimating fixed effect models with firm-year observations The dependent variable is the firm-
year level Regular dividendTotal assets The main independent variables are the interactions of Post-FAS123R indicator (Post) with
Accounting Impact rank Accounting impact rank indicators and Treated respectively Panel C examines the intensity of dividend changes
among firms with nonzero dividend per share in 2003 or 2004 In particular we estimates the same three models as in Panel A(with the
same independent variables) but for five dependent variables the change of average Regular dividendTotal assets from Pre- to Post-
FAS123R period (as in Panel A) the percentage change of DPS (dividend per share) from Pre- to Post-FAS123R period and three
indicators denoting respectively whether the percentage change of DPS was greater than 20 40 and 60 Panel D reports four
robustness tests of the dividend intensity regression In each of them a set of possible confounding observations is removed (see Section 33
for details) Panel E compares the trends of dividend initiation and termination around FAS123R across four quartile groups ranked by
accounting impact All models in Panel A C and D have industry fixed effects and the standard errors are Huber-White heteroscedasticity-
consistent standard errors All models in Penal B have firm fixed effects and year fixed effects and the standard errors are clustered at
firm level All variables are defined in Appendix The notation and indicates statistically significant at 10 5 and 1 level
Industry Industry Industry
Model (1) Model (2) Model (3)
1171 1171 1171
Huber-White Huber-White Huber-White
0105 0104 0105
50
Panel B Panel fixed effects regression
Prediction Coeff t-stat Coeff t-stat Coeff t-stat
Acc impact rank x Post + 0000 122
Acc impact rank 2 x Post + 0001 110
Acc impact rank 3 x Post + 0001 094
Acc impact rank 4 x Post + 0001 129
Treated x Post + 0000 -012
Log(size) 0001 179 0001 179 0001 181
Book-to-market 0000 025 0000 024 0000 031
Leverage 0001 062 0001 064 0001 069
Asset tangibility 0009 360 0009 358 0009 363
Free cash flow 0002 090 0002 093 0002 092
Cash holding -0007 -295 -0007 -298 -0007 -298
Five-year ROA volatility 0001 041 0001 038 0000 -006
Institutional ownership 0000 -027 0000 -026 0000 -027
Sales growth 0000 053 0000 051 0000 044
Past one-year stock return 0001 089 0001 088 0001 078
Loss indicator 0000 -060 0000 -057 0000 -076
Fixed effects
Standard error
Adj R-squared
Observations
Dependent variable Regular dividendTotal assets
Model (1) Model (2) Model (3)
Firm Year Firm Year Firm Year
5653 5653 5653
Clustered by firm Clustered by firm Clustered by firm
0877 0877 0877
51
Panel C Intensity of dividend changes around FAS123R
Prediction Coeff t-stat Coeff t-stat Coeff t-stat
Accounting impact rank + 0000 065
Accounting impact rank=2 + 0000 048
Accounting impact rank=3 + 0000 026
Accounting impact rank=4 + 0002 080
Treated + 0001 063
Dependent var DPS pct change
Accounting impact rank + -0145 -072
Accounting impact rank=2 + 0018 006
Accounting impact rank=3 + -0177 -045
Accounting impact rank=4 + -0746 -100
Treated + -0407 -119
Accounting impact rank + 0029 095
Accounting impact rank=2 + 0040 074
Accounting impact rank=3 + 0092 139
Accounting impact rank=4 + 0008 007
Treated + -0007 -012
Accounting impact rank + 0024 076
Accounting impact rank=2 + 0047 088
Accounting impact rank=3 + 0079 114
Accounting impact rank=4 + -0003 -002
Treated + 0030 052
Accounting impact rank + 0030 098
Accounting impact rank=2 + 0078 155
Accounting impact rank=3 + 0085 130
Accounting impact rank=4 + 0014 012
Treated + -0006 -011
Control variables
Fixed effect
Standard error
Observations 572 572 572
Yes Yes Yes
Huber-White Huber-White Huber-White
Industry Industry Industry
Dependent var DPS pct
change gt60 indicator
Model (1) Model (2) Model (3)
Dependent var ΔAvg Regular
dividendAssets
Dependent var DPS pct
change gt20 indicator
Dependent var DPS pct
change gt40 indicator
52
Panel D Robustness tests for intensity of dividend changes around FAS123R
Prediction Coeff t-stat Coeff t-stat Coeff t-stat
Accounting impact rank + 0006 017
Accounting impact rank=2 + 0067 118
Accounting impact rank=3 + 0041 057
Accounting impact rank=4 + -0061 -049
Treated + 0022 035Observations
Accounting impact rank + 0009 027
Accounting impact rank=2 + 0058 106
Accounting impact rank=3 + 0032 043
Accounting impact rank=4 + -0032 -024
Treated + 0018 028
Observations
Accounting impact rank + 0030 089
Accounting impact rank=2 + 0039 071
Accounting impact rank=3 + 0122 168
Accounting impact rank=4 + -0063 -052
Treated + 0075 132
Observations
Accounting impact rank + 0008 023
Accounting impact rank=2 + 0023 042
Accounting impact rank=3 + 0048 064
Accounting impact rank=4 + -0042 -033
Treated + -0010 -016
Observations
Control variables
Fixed effect
Standard error
Exclude firms with stable
payout ratio from 2003 to 2004
506 506 506
Dependent variable DPS pct change gt40 indicator
Model (1) Model (2) Model (3)
Exclude voluntary expensers
519 519
Exclude firms in the top decile
of option reduction (02-04)
Exclude firms that accelerated
option vesting
504 504 504
517 517 517
519
Huber-White Huber-White Huber-White
Yes Yes Yes
Industry Industry Industry
53
Panel E Dividend initiation and termination rates around FAS123R
Pre FAS 123R
1 280 75 7 6 13 173
2 284 135 18 9 27 200
3 286 181 11 14 25 138
4 282 260 9 10 19 73
Total 1132 651 45 39 84 129
Post FAS 123R
1 275 63 4 4 8 127
2 280 116 9 9 18 155
3 276 152 9 3 12 79
4 263 223 5 1 6 27
Total 1094 554 27 17 44 79
Pre FAS 123R
1 280 205 2 0 2 10
2 284 149 7 1 8 54
3 286 105 0 0 0 00
4 282 22 0 0 0 00
Total 1132 481 9 1 10 21
Post FAS 123R
1 275 212 3 6 9 42
2 280 164 1 2 3 18
3 276 124 1 1 2 16
4 263 40 0 3 3 75
Total 1094 540 5 12 17 31
termination
in 2004
03-04
cumulative
03-04
cumulative
Quartile firms
with
dividend in
2004
termination
in 2005
termination
in 2006
05-06
cumulative
05-06
cumulative
Termination
Quartile firms
with
dividend in
2002
termination
in 2003
without
dividend in
2004
initiation in
2003
initiation in
2004
03-04
cumulative
03-04
cumulative firmsQuartile
firmsQuartile initiation in
2005
initiation in
2006
05-06
cumulative
05-06
cumulative
Initiation
without
dividend in
2002
54
Table 4
Effect of option-based compensation on repurchases
Panel A Two-period first-difference regression with total repurchase
Prediction Coeff t-stat Coeff t-stat Coeff t-stat
Accounting impact rank - 0002 122
Accounting impact rank=2 - 0002 071
Accounting impact rank=3 - 0005 123
Accounting impact rank=4 - 0007 102
Treated - 0014 365
Control variables
Fixed effect
Standard error
Adj R-squared
Observations
Panel B Two-period first-difference regression with net repurchase
Prediction Coeff t-stat Coeff t-stat Coeff t-stat
Accounting impact rank - 0003 166
Accounting impact rank=2 - 0002 051
Accounting impact rank=3 - 0006 165
Accounting impact rank=4 - 0009 137
Treated - 0010 300
Control variables
Fixed effect
Standard error
Adj R-squared
Observations
Panel C Two-period first-difference regression with repurchase adjusted for exercised options
Prediction Coeff t-stat Coeff t-stat Coeff t-stat
Accounting impact rank - 0001 056
Accounting impact rank=2 - 0002 062
Accounting impact rank=3 - 0007 172
Accounting impact rank=4 - -0001 -008
Treated - 0006 197
Control variables
Fixed effect
Standard error
Adj R-squared
Observations
Dependent variable ΔAvg RepurchaseTotal assets
This table investigates the causal effect of option-based pay on payout policy by examining whether the changes of repurchase around
FAS123R vary with its potential accounting impact Panel A reports the results of estimating three two-period first-differencing models
where for each firm we average its characteristics in Pre- and Post-FAS123R period In all three specifications the dependent variable is
the change of average RepurchaseTotal assets from Pre- to Post-FAS123R period The main independent variable varies by model in
Model (1) the Accounting impact rank is the quartile rank of implied option expensetotal assets measured in 2002 (1=lowest 4=highest)
In Model (2) Accounting impact rank=2 (3 4) is an indicator that takes value of one if the firmrsquos Accounting impact rank equals 2 (3 4)
In Model (3) we use an alternative treatment construction following Bakke et al (2015) where Treated is an indicator that takes value of
zero if the firm granted zero option to its CEO in both 2003 and 2004 or the firm began to voluntarily expense option-based pay at fair
value in 2002 or earlier and one otherwise Panel B reports the regressions with the change of Net repurchaseTotal assets as the
dependent variable and the same independent variable as in Panel A Panel C reports the regressions with the change of Adjusted
repurchaseTotal assets as the dependent variable and the same independent variable as in Panel A All models in Panel A B and C have
industry fixed effects and the standard errors are Huber-White heteroscedasticity-consistent standard errors All variables are defined in
Appendix The notation and indicates statistically significant at 10 5 and 1 level respectively
Model (1) Model (2) Model (3)
Yes Yes Yes
Industry Industry Industry
Huber-White Huber-White Huber-White
Dependent variable ΔAvg Net repurchaseTotal assets
1171 1171 1171
0238 0237 0245
Model (1) Model (2) Model (3)
Yes Yes Yes
Industry Industry Industry
Huber-White Huber-White Huber-White
Dependent variable ΔAvg Adjusted repurchaseTotal assets
0229 0229 0233
1171 1171 1171
Model (1) Model (2) Model (3)
Yes Yes Yes
Industry Industry Industry
Huber-White Huber-White Huber-White
0111 0112 0114
1168 1168 1168
55
Table 5
Effect of option-based compensation on payout mix
Panel A Two-period first-difference regression with total payout mix
Prediction Coeff t-stat Coeff t-stat Coeff t-stat
Accounting impact rank + 0006 028
Accounting impact rank=2 + 0018 045
Accounting impact rank=3 + -0001 -001
Accounting impact rank=4 + 0043 052
Treated + -0035 -094
Control variables
Fixed effect
Standard error
Adj R-squared
Observations
Panel B Two-period first-difference regression with net payout mix
Prediction Coeff t-stat Coeff t-stat Coeff t-stat
Accounting impact rank + -0002 -008
Accounting impact rank=2 + 0008 016
Accounting impact rank=3 + 0018 034
Accounting impact rank=4 + -0059 -055
Treated + -0050 -101
Control variables
Fixed effect
Standard error
Adj R-squared
Observations
0049 0043 0054
257 257 257
Industry Industry Industry
Huber-White Huber-White Huber-White
Dependent variable ΔAvg Regular dividendNet payout
Model (1) Model (2) Model (3)
Yes Yes Yes
0154 0151 0156
362 362 362
Industry Industry Industry
Huber-White Huber-White Huber-White
This table investigates the causal effect of option-based pay on payout mix for firms using both dividend and repurchase by examining
whether the changes of payout mix around FAS123R vary with its potential accounting impact Panel A reports the results of estimating
three two-period first-differencing models where for each firm we average its characteristics in Pre- and Post-FAS123R period In all three
specifications the dependent variable is the change of average Regular dividendTotal payout from Pre- to Post-FAS123R period The main
independent variable varies by model in Model (1) the Accounting impact rank is the quartile rank of implied option expensetotal assets
measured in 2002 (1=lowest 4=highest) In Model (2) Accounting impact rank=2 (3 4) is an indicator that takes value of one if the firmrsquos
Accounting impact rank equals 2 (3 4) In Model (3) we use an alternative treatment construction following Bakke et al (2015) where
Treated is an indicator that takes value of zero if the firm granted zero option to its CEO in both 2003 and 2004 or the firm began to
voluntarily expense option-based pay at fair value in 2002 or earlier and one otherwise Panel B reports the regressions with the change of
Regular dividendNet payout as the dependent variable and the same independent variables as in Panel A Panel A (Panel B) is based on
observations with nonzero regular dividend and repurchase (net repurchase) in both Pre- and Post-FAS123R period All models in Panel A
and B have industry fixed effects and the standard errors are Huber-White heteroscedasticity-consistent standard errors All variables are
defined in Appendix The notation and indicates statistically significant at 10 5 and 1 level respectively
Yes Yes Yes
Dependent variable ΔAvg Regular dividendTotal payout
Model (1) Model (2) Model (3)

6
adoption 2005 They are also robust to excluding firms that may have taken actions in anticipation
of the expected adoption of FAS123R (eg voluntarily expensing options) Finally to further
address the lack of a control group we follow Bakke Mahmudi Fernando and Salas (2015) and
define control firms as those voluntarily expensing options and those issuing no options to the
CEO prior to FAS123R on the ground that these firms were likely unaffected by the new standard
Our inferences remain unchanged
Overall the evidence is not consistent with the prediction that option-based compensation
has a first-order causal impact on payout policy and suggests that the previously documented
associations perhaps reflect endogeneity rather than a causal influence Our findings should not be
viewed as denying that stock options provide an incentive to favor repurchases over dividends
Rather they suggest this incentive does not imply an unconstrained ability to change payout policy
in a self-serving way likely because of the visibility of payout policy and its relevance to boards
and institutional investors 6 In addition boards may compensate executives for the lack of
dividend-protection in other ways effectively neutralizing those incentives Notably our findings
are consistent with managersrsquo statements that lack of dividend-protection does not affect payout
decisions (Brav et al (2005) who highlight this stark contrast between their survey evidence and
the empirical associations in the literature)7 Our results also provide another explanation for the
persistent lack of dividend protection in executivesrsquo options boards are not concerned with its
6 Note that our results are not inconsistent with evidence that managers take actions to increase personal wealth in
settings where the level of scrutiny is lower (eg timing of option grants backdating Heron and Lie 2007) or where it
is harder for outsiders to detect personal motives (eg risk-taking activities that increase the value of options Bakke et
al 2015) 7 Only 106 of surveyed executives agree that lack of dividend protection may cause managers to favor repurchases
over dividends ndash the lowest level of support among all the questions in the survey Of course it is possible that
managers would not admit to the effect on their behavior but similar surveys have elicited candid responses For
example a large percentage of managers surveyed by Graham Harvey and Rajgopal (2005) admit that they would
sacrifice economic value to smooth earnings or to hit an earnings target
7
effect because they can mitigate it by directly monitoring payout choices andor adjusting
compensation packages
Our study contributes to a vast literature on the determinants of payout policy First while
many studies document an association between option-based pay and payout policy limited
attempts have been made to examine its causal nature8 Addressing this question will enhance our
understanding of temporal changes in payout policy such as the emergence of repurchases as
primary payout vehicle (Farre-Mensa et al 2014) and the recently observed lsquoresiliencersquo of
dividends (Floyd et al 2015) Using the plausible exogenous variation in ESO induced by
FAS123R our evidence calls into question the notion that option-based compensation is a first-
order driver of payout policy and challenges future research to consider alternative explanations
for the trends in corporate payouts Second we extend the research that examines how
institutional changes affect payout policy Most of these studies examine changes in dividend tax
rates (eg Chetty and Saez 2005 Brown Liang and Wesibenner 2007 Aboody and Kasznik 2008
Blouin Raedy and Shackelford 2011 Hanlon and Hoopes 2014) or in the information environment
(Hail Tahoun and Wang 2014) while we examine a new accounting standard that affected the
composition of executive pay
We also contribute to a recent stream of research that uses exogenous shocks to understand
the economic impact of option-based pay (Low 2009 Gormley Matsa and Milbourn 2013) Some
of these studies use FAS123R to examine the causal effect of option-based pay on risk-taking with
mixed findings (Chava and Purnanandam 2010 Hayes Lemmon and Qiu 2012 Bakke et al 2015
Chu and Ma 2015) We extend this research in two ways First we use FAS123R to examine the
8 A notable exception is Shue and Townsend (2014) who instrument change in option grants with predicted new
option grant cycle and find that dividend growth is slower in the first year of a new option grant cycle than other years
An important premise underlying this approach is that the outcomes respond almost instantaneously to the treatment
In this paper we are more concerned with the longer-term effects of ESO as payout tends to be sticky and may
respond to the treatment only gradually (Lambert et al 1989)
8
effect of option-based pay on a different yet important economic outcome payout policy Second
our metholodogy differs from prior studies in that it explicitly incorporates cross-sectional
variation in how firms were affected by FAS123R Future work may use this approach to examine
the effect of option-based pay on other corporate policies
Finally we extend the literature on how accounting rules impact a firmrsquos economic
behavior (eg Carter and Lynch 2003 Carter et al 2007 Bens and Mohanan 2008 Choudhary
Rajgopal and Venkatachalam 2009 Graham Hanlon and Shevlin 2011) as well as the literature on
the accounting treatment for stock options (Aboody 1996 Dechow Hutton and Sloan 1996
Aboody Barth and Kasznik 2004 Ferri and Sandino 2009)
2 Research Design
21 Empirical Strategy
It is commonly recognized that identifying the causal effects of executive compensation in
empirical studies is challenging (Edmans and Gabaix 2015) FAS123R provides a unique
opportunity to address this problem Aside from significantly reducing the use of option
compensation the accounting change should not in itself correlate with the outcomes of interest
(ie change in payout policy)9 However utilizing FAS123R is not easy because it affected all
US firms at the same time making it difficult to measure a counterfactual change around the
event based on a control group A simple before-after comparison of the outcome variable around
the adoption of FAS123R would assume that any change is driven entirely by the event of interest
(ie it would assume away any conterfactual trend in the outcome variable) a questionable
assumption An alternative strategy is to use the change in option-based compensation around
9 Hayes et al (2012) describes FAS123R as an exogenous change in the accounting benefits of stock options without a
change to the economic costs and benefits of stock options while Bakke et al (2015) describes it as causing a change
in executivesrsquo but not shareholdersrsquo incentives
9
FAS123R effectively assuming that such change is ldquoexogenousrdquo (eg Chava and Purnanandam
2010 Anantharaman and Lee 2014) The problem with this approach is that FAS123R per se did
not generate exogenous cross-sectional variation in option compensation Even if the introduction
of FAS123R is exogenous a firmrsquos response cannot be assumed to be entirely exogenous10
To identify the exogenous portion of firmsrsquo response to the new standard we make use of
evidence that FAS123Rrsquos impact on the use of option compensation varies with the firm-specific
expected accounting impact of the new rule as measured by the implied option expense disclosed
in the footnotes prior to FAS123R (Hayes et al 2012) The reduction in option usage is highest in
firms with the largest implied option expense Thus we can use the differential accounting impact
of FAS123R to overcome the problem of lacking control group
To validate our approach we estimate the following first-differencing regression with
ordinary lease square (OLS)
ΔOptioni = β0 + β1 Accounting Impacti + ΛControli +εi (1)
where ΔOptioni is the change in the average value of executive stock options as percentage of total
pay from the pre- to the post-FAS123R period Accounting Impacti is the implied option expense
measured prior to FAS123R (more details in Section 22) We expect β1 to be negative that is a
more pronounced reduction in option-based pay for firms with higher expected accounting impact
Next after validating the differential impact of FAS123R we examine the central question
of this study by estimating the following OLS regression
ΔPayouti = γ0 + γ1 Accounting Impacti + ΓControli +ui (2)
10 A universally assigned encouragement to receive treatment does not make the realization of treatment assignment
free from endogeneity concerns Consider the following example after the adoption of FAS123R firm A reduces the
weight of option-based pay by 20 and firm B by 40 A finding that firm B increases dividends compared to firm A
cannot be interpreted as evidence of a causal influence of option compensation on dividend policy This is because the
additional reduction in option compensation by firm B relative to firm A may not be driven by FAS123R It may
instead reflect an attempt to align executivesrsquo incentives with anticipated changes in dividend policy (reverse
causality) Without a way to incorporate the heterogeneous impact of FAS123R in the research design the cross
sectional variation in changes in option-based compensation is still subject to the usual endogeneity concerns
10
where ΔPayouti represents the change in the average value of one of the payout variables
of interest (described in Section 23) from the the pre- to the post-FAS123R period
Eq (2) is essentially a difference-in-difference approach to estimate the effect of option-
based pay on payout policy using the differential accounting impact of FAS123R to capture the
exogenous (accounting-induced) portion of the change in option-based pay If option-based pay
has a detectable causal effect on dividends (repurchases) in the direction predicted by the
literature γ1 should be positive (negative)
As noted by Bertrand Duflo and Mullainathan (2004) in difference-in-difference studies
with panel data OLS may yield inconsistent standard error estimates because the dependent
variable and the main independent variable tend to be serially correlated within firm To alleviate
this concern following Bertrand et al (2004) in both Eqs (1) and (2) we collapse the panel to a
single ldquoPrerdquo (2003-2004) and a single ldquoPostrdquo (2005-2007) period by averaging across years and
then measuring the changes from Pre to Post11 We choose 2003 as the starting period in order to
capture a period subsequent to the 2003 tax cut on individual dividend income While the
evidence on the effect of the tax cut on payout policy is mixed (Chetty and Saez 2005 Edgerton
2013 Floyd et al 2015) starting with 2003 allows the pre-FAS123R levels of the key variables to
reflect any effect of the tax cut 12 We end our analysis in 2007 to avoid the potentially
confounding effect of the 2008 financial crisis which had a significant impact on payouts (Floyd et
al 2015)13 Following Hayes et al (2012) and Bakke et al (2015) we include 2005 in the Post
11 In the collapsed two-period panel a regression of changes is equivalent to a regression of levels with firm-fixed
effects and an indicator for the Post period Both approaches obviate unobserved time-invariant firm heterogeneity
We choose first differencing equation for a more intuitive interpretation 12 The Jobs and Growth Tax Relief Reconciliation Act of 2003 was signed into law on May 28 2003 but had been
proposed on January 7 2003 and was made retroactive to the beginning of 2003 Chetty and Saez (2005) show that
the tax change affected dividend policy in 2003 13 In November 2006 the Securities and Exchange Commission required more details about the terms of performance-
based incentive plans We are not aware of any evidence that these rules affected the weight of option-based pay
11
period because FAS123R while effective in June 2005 was released in December 2004 14
Alternatively in untabulated tests we exclude 2005 from the analysis and obtain similar results
Another benefit of using a single Pre and Post period is that it is better suited than panel
data to the analysis of repurchases As noted by Skinner (2008) firms engaging in repurchases
tend to do so every other year thus the relation between repurchases and economic determinants is
stronger over two- or three-year periods than one-year periods Factors explaining the timing of
repurchases differ from those explaining their level and the year-to-year variation in repurchases is
not necessarily informative of changes in payout policy As we are not interested in the timing of
repurchases our approach seems to better capture ldquolong-runrdquo changes in payout policy However
for the analysis of dividends (which are generally paid every year and thus not subject to the
above problem) we also present the results using a panel regression with firm- and year-fixed
effects To alleviate the problem of serial correlation discussed earlier we cluster the standard
errors by firm
22 Accounting Impact
As noted earlier all firms were affected by FAS123R making it difficult to identify a
control sample To capture variation in the cross-sectional impact of FAS123R in Eqs (1) and (2)
we use Accounting Impacti defined as the implied option expense disclosed in the footnote of the
income statement for the 2002 fiscal year scaled by total assets (we obtain similar findings when
scaling it by revenues) We measure this variable in 2002 (ie before the Pre period) rather than in
2003 or 2004 to avoid any confounding effect from the expected adopion of FAS123R (see
discussion in Section 33) As this variable is highly skewed (see Table 1) we define it based on
(Gipper 2015) or had any effect on payout policy However we exclude 2007 from the Post period in robustness tests
Our inferences are unchanged 14 FAS123R was released in December 2004 effective as of the beginning of the first interim or annual reporting
period beginning after June 15 2005 Subsequently the SEC allowed a six-month deferral making the standard
effective for fiscal years beginning after December 15 2005
12
its quartile rank We also presents results with separate indicators for the top three quartiles in
order to better isolate the difference between top quartile (the most lsquotreatedrsquo group) and bottom
quartile (the least lsquotreatedrsquo group and thus closer to the notion of a control group)
An alternative way to address the issue of a lack of control group is suggested by Bakke et
al (2015) They argue that two sets of firms were likely lsquounaffectedrsquo by FAS123R (i) firms that
did not grant options to the CEO in 2003 and 2004 as in these firms FAS123R could not affect
CEO option pay and thus her incentives to make policy changes (ii) firms that were already
voluntarily expensing stock options as of 2002 (ie before FASB began discussions of the new
standard) as these firms would not face any additional accounting charge under FAS123R
Our approach offers a number of advantages First instead of collapsing all lsquonon-controlrsquo
firms in a single lsquotreatedrsquo group we exploit cross-sectional variation among treatment firms in
terms of the likely impact of FAS123R effectively using the most and least affected firms
(respectively top and bottom quartile of implied option expense) as treatment and control group
As shown in Table 1 the implied option expense is highly skewed (ie only a relatively small
number of firms was heavily affected by FAS123R) Capturing this variation is likely to increase
the power of the test Second in Bakke et al (2015) what matters is that the treatment definition
captures an accounting-driven change in CEO option grants as their focus is on CEO risk-taking
incentives In our setting we want to capture an accounting-driven change both in CEO option
grants (predicted to affect incentives to use dividends) and in the overall use of stock options
(predicted to affect the use of repurchases) As noted in Section 31 (see footnote 20) many firms
without CEO option grants in 2003 and 2004 were issuing options to non-CEO executives and
other employees and thus facing a potential accounting charge under FAS123R Third about half
of the firms without CEO option grants in 2003 and 2004 issued options to the CEO in the Post-
13
period Hence it is not clear that the control firms were truly unaffected by FAS123R Finally
the implied option expense in 2002 (our measure of the expected accounting impact) is a function
of option grants made in prior years when firms could not anticipate the adoption of FAS123R In
contrast option grant decisions in 2003 and 2004 may be affected by its anticipated adoption as
FASB added accounting for stock-based compensation to its agenda in March 2003
Notwithstanding the above arguments throughout our study we also present the results
using the definition of treatment and control in Bakke et al (2015) In particular we modify Eqs
(1) and (2) by replacing Accounting Impact with Treated an indicator equal to zero for the two
groups of firms identified as lsquocontrolrsquo in Bakke et al (2015) and one for all other firms
23 Payout Variables and Control Variables
Following Brown et al (2007) our baseline measure for changes in dividends is the change
in the DividendAssets ratiomdashcomputed as the regular cash dividends paid during the year scaled
by total assets at the beginning of the yearmdashfrom the Pre to the Post period15 However the
dividend-to-asset ratio is not what managers focus on when making dividend policy decisions
The stability of dividend per share (DPS) among dividend-paying firms (hereinafter payers)
suggests that managers do not target a specific dividend-to-assets ratio but rather a DPS level
(Baker and Wurgler 2016) Survey evidence confirms that executives make dividend policy
decision in terms of changes to the current level of DPS (Brav et al 2005) Therefore we also
examine the percentage change in the average DPS from the Pre to the Post period However this
measure can only be computed for the subset of payers (defined as firms with non-zero DPS in at
15 An alternative choice would be to scale dividends by the market value of equity essentially computing a dividend
yield However a drawback of using the dividend yield in our setting is that after controlling for time-invariant firm
characteristics through fixed effects or first differencing the variation of the ratio comes mainly from the denominator
the stock price (Baker and Wurgler 2004) Thus we choose the more stable book value of total assets as denominator
Also similar to other studies (eg Fenn and Liang 2001) we focus on regular dividends and exclude special dividends
as they are very rare and may introduce large noise to the dividend measures for few observations (DeAngelo
DeAngelo and Skinner 2000)
14
least one of the years of the Pre period) To provide insights into FAS123Rrsquos effect on dividend
policy for non-payers we examine the relation between our Accounting Impact variable and the
rate of dividend initations in the Pre and Post periods
Our main measure for repurchases is the change in RepurchaseAssetsmdashthat is the
aggregate amount of common stock repurchases made during the year scaled by total assets at the
beginning of the yearmdashfrom the Pre to the Post period In the empirical tests we examine
variations suggested in the literature
Finally as an alternative to examining dividends and repurchases separately we also look at a
measure of the payout composition the change in the DividendsTotal Payout ratio from the Pre to
the Post period (Total Payout is the sum of dividends and repurchases) effectively capturing any
substitution effect between dividends and repurchases 16 Examining the causal effect of the
change in option-based pay on payout composition is especially relevant if managers first target a
total payout and then choose the relative weight of dividends and repurchases In practice it is
unclear to what extent managers act this way (Brav et al 2005) Nonetheless for completeness we
also examine this variable We focus on the subsample of firms with both dividends and
repurchases in both Pre and Post period so as to capture changes in payout mix by firms routinely
using both vehicles to return cash to shareholders
As for the control variables in both Eqs (1) and (2) Controli is a vector of firm characteristics
identified in existent literature as determinants of payout policy (eg Fenn and Liang 2001 Brown
et al 2007 Skinner 2008 Cuny et al 2009) firm size book-to-market leverage asset tangibility
free cash flows cash holdings volatility in operating income institutional ownership sales
16 Fama and French (2001) suggest that repurchases are often complement to dividends while Grullon and Michaely
(2002) document that the increase in share repurchases over the past decades has come at the expense of a lower
increase in dividends consistent with a substitution hypothesis Brown et al (2007) also provide evidence of a
substitution effect in response to the 2003 dividend tax cut Survey evidence in Brav et al (2005) suggests an
asymmetric substitution effect with managers more willing to replace dividends with repurchases than the opposite
15
growth past stock returns and an indicator for loss firms For all of these variables we include
both changes from Pre to Post period and levels in the Pre period to allow for the possibility that
levels of these variables affect subsequent changes in payout policy 17 Finally we include
industry-fixed effects (Fama-French 48 industry indicators) to control for industry-level trends in
payout policies and option-based pay In unreported tests we replace free cash flows with two
separate variables operating profit and capital expenditures We also replace volatility in
operating income with volatility in stock returns Our results are unaffected More detailed
definitions of each variable are in the Appendix
24 Identification Assumption
The key identifying assumption underlying the difference-in-difference estimation
technique is that the parallel trends assumption is satisfied In the absence of treatment both
treated and control firms should experience parallel trends in the outcome variable Our approach
assumes that in the absence of FAS123R the change in dividends or repurchases would be the
same for high and low accounting impact firms Note that the well-documented contemporaneous
correlation between levels of option compensation (a key driver of the implied option expense and
thus the accounting impact) and levels of payout variables does not violate our identification
assumption This is because our assumption pertains to the relation between the level of option
compensation and future changes in payout variables
A specific concern is that options may be granted in anticipation of expected future
changes in payout policy (reverse causality problem) Relative to simple association tests this
concern is significantly reduced in our setting because the accounting impact is measured three
years prior to the arrival of treatment and is the result of option grants made over the prior four or
17 In untabulated analyses we run our tests after excluding changes in the control variables (ie including only their
pre-treatment levels) since in difference-in-difference studies controlling variables measured after the shock may
reintroduce selection bias Our inferences remain unchanged
16
five years depending on the vesting schedule18 For the reverse causality to be plausible the
implied option expense in 2002 (the result of option grants made approximately between 1998 and
2002) needs to reflect the anticipated change in payout policy in 2005-2007 This seems unlikely
While the parallel trend assumption is not directly testable similar to other studies (Bakke
et al 2015) we examine the trends in dividends and repurchases during the Pre period Figure 1
suggests that high and low accounting impact firms (respectively top and bottom quartile of
implied option expense) exhibit similar trends in payout variables in the Pre period ie from 2003
to 2004 More formally to examine the correlation between Accounting Impact and trends in the
payout variables during the Pre period we estimate the following regression only with
observations in 2003 and 2004
Payouti = γ0 + γ1 Accounting Impacti FY2004+ γ2 FY2004+ ΓControli +Firm FE +ui (3)
where Payouti is either DividendAssets or RepurchaseAssets FY2004 is an indicator of
fiscal year 2004 Firm FE indicates firm-fixed effects If firms with varying degrees of accounting
impact have different payout trends before the adoption of FAS123R γ1 should be different from
zero However for both payout variables we find that the estimated γ1 is close to zero and not
statistically significant at 10 level (untabulated tests) Overall the parallel trends assumption
seems reasonable in our setting
3 Empirical analyses
31 Sample Selection and Summary Statistics
Our sample is the SampP 1500 firms with available data on implied option expense (from
Compustat) and on executive compensation (from Execucomp) for at least one year in the Pre
18 The accounting treatment for stock options requires their fair value at the grant date to be recognized over the
service period (usually the vesting period) Hence the implied option expense in a given year includes a fraction of
the expense associated with past option grants
17
period and one year in the Post period to ensure consistency in the sample across periods Similar
to prior studies on payout policy (Fama and French 2001 Skinner 2008) we exclude financial
firms (SIC code between 6000 and 6999) and utilities (SIC between code 4900 and 4999) as well as
firms not incorporated in the US Our final sample includes 1176 firms19 We obtain dividend
and stock returns data from CRSP stock repurchases and dividend per share data from
COMPUSTAT and institutional ownership data from Thomson Reuters 13F database Other
control variables are from CRSP and COMPUSTAT To deal with outliers we winsorize all
continuous variables at 1 and 99 by fiscal year A detailed definition of all variables and their
sources is in Appendix
Table 1 Panel A presents summary statistics of the relevant variables for the pooled sample of
5653 firm-year observations Implied option expense in 2002 (our proxy for Accounting Impact)
is on average 173 of total assets with the median at 052 This suggests that the accounting
impact is very large for a small number of firms Over the entire sample period on average
dividends represent 093 of total assets while repurchases represent 394 Untabulated
analyses indicate that in 16 of the firm-year observations only dividends are paid out in 25
only repurchases in 32 both and in 27 neither Within the subset of firm-years with a payout
dividends represent 3874 of total payout This data confirms prior evidence that repurchases
have assumed the primary role as a vehicle to return cash to shareholders (eg Floyd et al 2015)
The mean (median) total executive pay (average across the top 5 executives) is $25 million ($16
million) On average option grants and restricted stock grants represent respectively 283 and
141 of total pay while salary and bonus comprise 296 and 197 respectively The
19 The results presented in the study are similar when (i) we restrict the sample to firms with available data for the
entire (2003-2007) sample period (1009 firms) and (ii) we exclude firms with CEO turnover in the Post period
(reducing the sample size to 780 firms) as a new CEO may have a different compensation package andor adopt a
different payout policy
18
composition of CEO pay (untabulated) is similar As for the control variables the figures are
generally consistent with other studies examining SampP 1500 firms over the same period
Panel B reports the pairwise Pearson correlations among the relevant variables The
correlations are in line with the associations documented in prior studies For example larger
firms and firms with higher profitability (free cash flows) have higher payouts loss firms have
lower payouts greater volatility in operating income is associated with lower dividends
More relevant to our analysis Panel C presents the mean of each variable in the Pre and Post
period for the full sample For each variable we first compute the firm-level mean over the Pre
and the Post Period and then compute the mean of the resulting figure across all firms There is a
striking increase in repurchases which double from 245 to 490 of total assets causing a
similar increase in total payout The increase in dividends is much smaller from 083 to 099
of total assets As a result for firms with positive payout dividends become a smaller fraction of
total payout in the Post period (2790 versus 3914 in the Pre period) This trend is consistent
with Floyd et al (2015) who document a dramatic increase in repurchases in the years leading to
the 2008 financial crisis Consistent with previous studies around FAS123R there is a significant
reduction in option grants as a fraction of total executive pay (from 343 to 240) and a
corresponding increase in the use of restricted stock (from 87 to 176) with little variation in
the weight of salary and bonus (note that restricted stock salary and bonus were expensed both
before and after FAS123R) Similar patterns hold for the composition of CEO pay (untabulated)
Compared to changes in the mix of executive pay changes in the levels of control variables are
generally less pronounced
Panel D reports the change in the key compensation and payout variables from the Pre to the
Post period by quartiles of implied option expense and yields a number of insights First
19
confirming the skewness suggested by Panel A the mean implied option expense is 551 for
firms in the top quartile versus only 093 035 and 012 for firms in the second third and
bottom quartile respectively Second as expected firms with higher implied option expense have
greater use of option-based pay For example in the Pre-period option pay represents 507 of
total executive pay at firms in the top quartile versus 201 in the bottom quartile Third and
more importantly for our research design the use of option pay changes significantly from the Pre
to the Post period as a function of the accounting impact For firms in the top quartile the
percentage of total pay represented by stock options drops by 182 (from 507 to 325)
versus 113 80 and 34 for firms in the second third and bottom quartile respectively The
decline in option usage across quartiles is accompanied by an increase in restricted stock grants
while the weight of salary and bonus shows little change It is important to emphasize the
substitution of stock options with restricted stocks because restricted stocks typically pay
dividends (Zhang 2013) thus providing further reason to expect a dividend increase in response to
the FAS123R-induced decline in option pay
As for the payout variables Panel D suggests that heavy option users (firms with higher
implied option expense) generally use repurchases more than dividends consistent with the
associations documented in earlier studies In the Pre period repurchases (dividends) represent
351 (030) of total assets for the top quartile versus 113 (112) for the bottom quartile
Panel D also indicates that the increase in repurchases documented in Panel C takes place across
all quartiles As for the (much smaller) change in dividends the absolute increase is similar across
the four quartiles though the relative increase (the percentage change) appears to be slightly
higher in the top quartile Overall these figures do not suggest a shift toward dividends and away
from repurchases by firms with a large (accounting-induced) decline in the use of option pay
20
Panel E presents the same data as Panel D but based on the definition of lsquotreatmentrsquo and
lsquocontrolrsquo in Bakke et al (2015) Under this definition 997 firms are classified as treatment group
and 177 as control (171 firms are classified as lsquocontrolrsquo because they did not grant options to the
CEO in the Pre period and 6 because they were voluntarily expensing options before 2003)
Interestingly lsquotreatedrsquo firms are equally distributed across the quartiles suggesting significant
variation in the degree of treatment As discussed earlier one benefit of our approach is that it
exploits cross-sectional variation among treatment firms in terms of the likely impact of FAS123R
Also 40 of the control firms (71 out of 177) are in the lowest quartile while 35 ((37+25)177)
are in the top two quartiles reflecting the different focus of the two approaches in terms of
identifying firms less affected by FAS123R20
As for payout and compensation variables Panel E shows that the treated group experiences a
larger increase in repurchases than the control group while the (less pronounced) increase in
dividends is similar across treated and control firms Treated firms experience a 126 decrease in
option pay (from 387 to 261) with a corresponding 94 increase in the weight of restricted
stock grants (from 80 to 174) The figures are similar at the CEO level (because the
classification is based on options grants to the CEO it is useful to report pay figures at both the top
5 executives and the CEO level) Interestingly the control group experiences a pronounced
increase in the weight of option grants in total CEO pay from 10 to 127 as almost half of the
control firms issued options to their CEOs in the Post period (for these firms options as percentage
of total CEO pay increased from 0 to 254 untabulated analysis) While this increased use of
stock options suggests (ex post) that these firms were not concerned with the impact of FAS123R
another possibility is that the lack of use of option compensation for CEOs in 2003 and 2004 was
20 In untabulated analysis we find that 55 of the 171 firms issuing no options to the CEO in the Pre period granted
options to the other top executives (and perhaps to other non-executive employees) thus explaining the relatively high
implied option expense for the control group (10 versus 19 for the treatment group ndash see Panel E)
21
temporary rather than the effect of a permanent policy If these firms were planning to issue
options to the CEO in the Post period the assumption that they were unaffected by FAS123R (and
thus their use as control sample) is questionable21
32 Differential Impact of FAS123R on the Use of Option-Based Compensation
An important building block of our approach is the presumed differential impact of FAS123R
on option-based pay as a function of pre-existing implied option expense22 While Table 1 Panel
D preliminarily supports the validity of this assumption we formally examine it by estimating Eq
(1)
As reported in Table 2 Panel A we find a significant negative association between Accounting
Impact and the change in option-based pay around the adoption of FAS123R In column (1)
where we use the quartile rank of implied option expense the -0044 coefficient implies that
around FAS123R option grants over total pay decline by 44 as we move from the highest
quartile to the next Thus the reduction in top quartile firms is 132 larger than in bottom
quartile firms In column 2 we replace the quartile rank with three indicators for the highest
quartiles (with the bottom quartile collapsed in the intercept) so as to be able to compare directly
top and bottom quartile without imposing the same effect across quartiles The negative and
significant coefficient on the top quartile indicator at -0140 suggests that the reduction in option
grants over total pay is 140 larger for top quartile firms relative to bottom quartile firms
Finally in column 3 we use the indicator for treated firms following Bakke et al (2015) The
21 Panel E also shows an increase in the use of restricted stock in CEO pay packages (from 128 to 182 almost
comparable to the increase among treated firms) The concurrent increase in options and restricted stock suggests
these firms would have increased option pay significantly more had it not been for FAS123R indicating further
caution in classifying them as control group of unaffected firms 22 This is akin to the relevance assumption of instrumental variable if we interpret the implied option expense as an
instrument to the change in option-based pay
22
negative and significant coefficient at -0132 suggests that treated firms experience a 132
larger drop in the weight of option pay relative to control firms
In Panel B we re-estimate Eq (1) using a panel regression with firm- and year-fixed effects
(5653 firm-year observations) where the dependent variable is the the ratio of option grants to
total executive pay The results are virtually identical in terms of significance and magnitude of
the coefficients of interest (the interaction terms between respectively Accounting impact and
Treated and an indicator for the Post period)
Overall Table 2 suggests that high implied option expense and the introduction of FAS123R
together strongly encouraged firms to cut back option-based compensation for executives It also
supports the general validity of the approach in Bakke et al (2015) in identifying firms most
affected by FAS123R notwithstanding the concerns outlined earlier
Our test of Eq (1) focuses on executive stock options For our dividend-protection hypothesis
it is important to establish that the level of implied option expense predicts a change in executive
stock options (rather than only a change in the use of non-executive employee stock options) as we
want to capture the effect of a change in executivesrsquo incentives on payout policy At the same
time our dilution channel hypothesis assumes a change in the use of all (executive and non-
executive employee) stock options Thus in untabulated analyses we repeat the test in Eq (1) by
replacing the dependent variable with the change in the number of options granted to all
employees (scaled by the total number of outstanding shares note for this analysis we can only
use data from 2004 to 2007 because Compustat began reporting data on ESO in 2004) The
coefficient on Accounting Impact and Treated continues to be negative and significant suggesting
that the differential reduction in the use of option compensation as a function of accounting impact
23
occurred for both executive and non-executive employee stock options Indeed Brown and Lee
(2011) report a similar decrease in executive and employee stock options around FAS123R
33 Option-Based Pay and Dividend Payouts
In this section we examine the effect of an exogenous (accounting-induced) change in option
compensation on dividend policy by estimating Equation (2)
Table 3 Panel A presents the results using the change in dividends from Pre to Post as
dependent variable We find no significant association between Accounting Impact (column 1 and
2) or Treated (column 3) and the change in dividends around the adoption of FAS123R This is in
stark contrast with the negative effect of option-based pay on dividends predicted in the literature
and documented in various association studies
One concern with this lack of effect is that perhaps our setting is not powerful enough to detect
it One way to examine this possibility is the following The coefficient on Accounting Impact
rank=4 in column 2 is 0001 and the standard error (SE) is 00009 Assuming the estimated
standard error is correct then for a two-tailed t test the coefficient needs to be greater than 00015
(=SE1645) or 015 to reach the 10 percent significant level In other words if moving from
the bottom to the top quartile (which predicts a 14 differential decline in option based pay as per
Table 2 Panel A) resulted in a 015 increase of the dividendasset ratio our test would be able to
detect a causal effect of option-based pay on dividends Given the unconditional mean of the
dividendasset ratio at 093 an increase of 015 from the Pre to the Post period seems
plausible In fact the average increase from the Pre to the Post period is 016 (Table 1 Panel C)
Thus if an effect was there our test should detect it
24
Panel B presents the results using a panel regression (5653 firm-year observations) with firm-
and year-fixed effects and interaction terms between Accounting Impact (or Treated) and an
indicator for the Post period Our inferences are unchanged
These analyses are based on our full sample which includes both dividend-paying and non-
dividend-paying firms Hence they implicity treat as equal two potentially different decisions to
initiate dividends and to increase dividends For example an increase in the dividend-to-asset
ratio from 05 to 06 will be treated the same as an increase from 00 to 01 even though
the latter represents a critical dividend initiation decision23 To address this following Chetty and
Saez (2005) we separately examine how FAS123R impacts the intensity of dividend changes (for
the subset of payers) and the likelihood of dividend initiations (for the subset of non-payers)
331 Option-Based Pay and Dividend Payouts Intensity of Dividend Changes
In the first row of Panel C we repeat the analysis in Panel A for the sub-sample of 572 payers
defined as firms with positive DPS in 2003 andor 2004 Note that we report only the coefficients
of interest for parsimony In the second row we replace the dependent variable with the
percentage change in DPS DPS is the choice variable for managers (Brav et al 2005 Baker and
Wurgler 2016) and thus our preferred measure to capture changes in dividend policy To account
for skewness in this variable (Khale 2002) in the third fourth and fifth rows we use indicator
variables to denote whether the change in DPS surpasses a threshold respectively 20 40 and
60 The proportion of firms that surpass these thresholds are 59 44 and 33 respectively24
23 Initiating dividends is a critical decision for boards given the pre-commitment value that investors attach to this
decision and the strong negative market reaction when firms eliminate or reduce dividends (Brav et al 2005) For
executives trying to maximize the value of their own stock options (dividend-protection argument) the ability to
influence a dividend initiation decision is likely lower than the ability to influence a dividend increase decision 24 Although in the third fourth and fifth rows our dependent variable is a binary variable we use a linear model (OLS)
instead of a probit or logit nonlinear model The reason is that estimating fixed effects in binary response models with
panel data can cause the incidental parameters problem The coefficient estimates can be biased when the panel data
25
Across all of these specifications we find no association between Accounting Impact or Treated
and the intensity of dividend changes Thus it does not appear that an exogenous reduction in
option-based pay caused dividend-paying firms to increase dividends
In Panel D we perform four robustness tests For parsimony we show only the coefficients of
interest and only the cases where the dependent variable is an indicator denoting a greater than
40 increase in DPS The results are similar for the other four ldquointensityrdquo dependent variables
reported in Panel C
In the first row we exclude firms that began to voluntarily expense options in 2003 or 2004
(84 firms of which 68 are dividend payers) FASB added accounting for stock-based
compensation to its agenda in March 2003 and issued an Exposure Draft proposing the expensing
of stock options at fair value in March 2004 In anticipation a number of firms began to
voluntarily expense stock options in 2003 and 2004 (Aboody et al 2004) If these firms reduced
option grants and as a result increased dividends during the Pre period then their inclusion may
reduce the power of our tests and thus our ability to detect the hypothesized relation25
In a similar spirit in the second row we exclude firms in the top decile in terms of reduction in
the ratio of option grants to total pay for the top 5 executives between 2002 (the year prior to the
Pre-period) and 2004 (the end of the Pre-period) This encompasses 113 firms of which 55 are
dividend payers If these firms reduced option grants in anticipation of FAS123R and as a result
increased dividends during the Pre period their inclusion may reduce our ability to detect the
hypothesized relation
has a large number of observations but a short time series Examples of studies making a similar choice are Puri
Rocholl and Steffen (2011) and Chu and Ma (2015) 25 This is unlikely to be a serious concern as previous studies suggest that voluntary expensers made limited use of
stock options (Aboody et al 2004) In fact in our sample 79 of these firms are in the bottom two quartiles of
implied option expense (untabulated) Nonetheless we present this test for robustness
26
In the third row we exclude firms that accelerated the vesting of options before FAS123R
became effective in order to avoid recognizing an expense for the unvested portion of these
options (Choudhary et al 2009 Balsam Reitenga and Yin 2008) This encompasses 196 firms of
which 54 are dividend payers If accelerating vesting was used to reduce the impact of FAS123R
the inclusion of these firms may reduce the power of our tests26
In the fourth row we deal with the concern that if firms target a fixed dividend to net income
ratio (Lintner 1956) and do so without adjusting for changes in accounting standards then by
decreasing net income (via option expense) the accounting change would mechanically cause a
reduction in dividends This would potentially offset and confound the increase predicted under
the dividend-protection and dilution hypotheses This seems unlikely for two reasons First firms
are notoriously reluctant to cut dividends (Brav et al 2005) Hence it seems unlikely that they
would reduce dividends in response to a decline in net income with no economic or cash flow
implications (ie re-classification of an expense from the footnotes to the income statement)
Second firms today set dividends in terms of dividend per share rather than by targeting a net
income-based payout ratio (Brav et al (2005)) As noted by Skinner (2008) over the last few
decades as earnings have become more variable the relation between earnings and dividends has
become weaker with dividend payments increasing smoothly and largely independent of the
variation in earnings Nevertheless in the fourth row we exclude the 66 dividend-paying firms that
26 These firms explicitly stated that they accelerated the vesting of stock options to avoid the accounting charge
(Choudhary et al 2009) In fact 72 are classified in the top two quartiles of implied option expense (untabulated)
Thus we would have predicted these firms to experience a significant decline in option pay To the extent that this
decline did not materialize because they minimized the impact of FAS123R by accelerating vesting the ability of
Accounting Impact to predict the reduction in option pay and thus its usefulness in examining changes in dividends
around FAS123R may be reduced The list of firms accelerating vesting was kindly provided by Jack Ciesielsky of
The Analystsrsquo Accounting Observer
27
had a similar payout ratio in 2003 and 2004 as a proxy for firms with a target net income-based
payout ratio in the Pre period27
As shown in Panel D even after excluding these subsets of firms we continue to find no
association between Accounting Impact or Treated and changes in dividends for dividend-paying
firms This is inconsistent with a causal influence of option compensation on dividend policy
Another concern is that by reducing net income and thus retained earnings FAS123R
may have pushed some firms closer to violating dividend covenants in debt contracts and
thus prevented them from increasing dividends This would bias our study against finding a
causal effect of option-based pay on dividends However this does not appear to be a
significant concern for three reasons First the recognition of an option expense does not
imply a decline in net income In fact more than 70 (75) of the full sample firms
(dividend payers) experienced an increase in net income before extraordinary items from
2004 to 2005 (the percentages are similar across the four quartiles of implied option
expense) Second dividend covenants are less common among dividend-paying firms
(Nikolaev 2010) Third most loan contracts in recent years give parties the option to
ldquofreezerdquo GAAP when facing a mandatory change in accounting principles (Christensen and
Nikolaev 2009) Firms expecting an adverse impact of FAS123R on their dividend covenants
would likely exercise this option (particularly given the non-cash nature of option-based
expense) Nonetheless to alleviate this concern we perform three additional analyses
(untabulated) (i) we repeat the tests in Panel C after excluding firms with a drop in net
income between 2004 and 2005 (ie firms that perhaps faced some covenant-related
27 We define a ldquosimilarrdquo payout to be an absolute change in payout ratio of less than 1 from 2003 to 2004 Among
these 66 firms only 39 continued to have a similar payout ratio in 2005 We also try an alternative definition where
a firm is classified as likely to be using a net income-based target payout ratio if the absolute percentage change in the
ratio from 2003 to 2004 is less than 10 (100 firms) Our inferences are unchanged
28
constrains to their payout policy as a result of FAS123R) (ii) we explicitly control for net
income and retained earnings in the regression (as in Skinner 2008) (iii) we repeat the tests
in Panel C for dividend payers with dividendsasset ratio above the sample median on the
basis that dividend covenants are less frequent among firms paying large dividends (Jung
Lee and Yang 2016) Our inferences are unchanged
332 Option-Based Pay and Dividend Payouts Dividend Initiations
In this section we examine whether the accounting-driven change in option pay affected
dividend initiations among non-payers We cannot employ the difference-in-difference approach
adopted so far by definition the same firm cannot initiate dividends in both periods However we
can provide suggestive evidence as follows First we take all firms that did not pay dividends in
2002 and group them into quartiles based on 2002 implied option expense For each quartile we
find the number of firms initiating dividends in 2003 and 2004 (the Pre period) Next we take all
firms that did not pay dividends in 2004 group them into quartiles based on 2002 implied option
expense and for each quartile find the number of firms initiating dividends in 2005 and 2006 (the
Post period) We do not include 2007 so as to have the same number of years in both periods and
make the cumulative initiation rates comparable
The left portion of Panel E reports the results of this exercise There is a general decrease in
the dividend initiation rate from the Pre to the Post period This holds both in the full sample of
non-payers (from 129 to 79) and across all quartiles This decrease may reflect a temporary
spike in 2003 and 2004 in response to the 2003 dividend tax cut documented in Chetty and Saez
(2005) It is noteworthy that initiation rates in both periods are lower among firms with higher
implied option expense This is consistent with option-heavy firms being mostly high-growth
firms less inclined to pay dividends More relevant to our research question if the lower use of
29
option compensation increased the propensity to pay dividends we would expect to see a relative
increase (ie a lower decrease) in dividend initiations among firms with the highest accounting
impact Instead the rate does not differ depending on the accounting impact There is
approximatley a 5 decline in initiation rate in each quartile In the right portion of Panel E we
examine similar data for dividend terminations While the results should be interpreted with
caution due to their rarity firms with higher accounting impact do not experience a greater decline
in termination rates Our inferences in Panel E are similar when we compared treated and control
firms following Bakke et al (2015) (untabulated)
Even after taking into account the different nature of decisions for dividend paying and non-
dividend-paying firms we fail to find evidence of a causal influence of option-based compensation
on dividend policy This finding is in contrast to the associations documented in earlier studies It
is even more remarkable as most firms replaced stock options with restricted stock which are
generally dividend-protected and should provide further incentive to increase dividends28
34 Option-Based Pay and Repurchases
In this section we examine the effect of an exogenous (accounting-induced) change in option
compensation on repurchases by estimating Equation (2)
Table 4 Panel A presents the results using the change in repurchases (scaled by total assets)
from Pre to Post as a dependent variable If the use of option-based pay had a positive effect on
firmsrsquo propensity to engage in repurchases as posited by the dividend-protection and dilution
hypotheses we should find a negative association between Accounting Impact or Treated and
repurchases Firms with a higher (accounting-driven) reduction in option-based pay should reduce
28 In a sample of SampP 500 firms between 2000 and 2009 Zhang (2013) reports that 80 of the firms granting
restricted stocks offer dividend protection In that sense the FAS123R-induced shift from stock options to restricted
stock may be characterized as a ldquoshockrdquo to dividend protection in unearned equity pay Accordingly our results cast
doubt on the causal interpretation of the positive association between dividend protection and dividend payouts
documented in prior studies (Zhang 2013 Burns et al 2015 Minnick and Rosenthal 2015)
30
the use of repurchases either because they are shifting toward a greater use of dividends andor
because they have a lower need to offset the dilutive effects of stock options However we find no
significant association between Accounting Impact (columns 1 and 2) and the change in
repurchases around the adoption of FAS123R When we use the Treated indicator (column 3) we
find a significant positive association rather than a negative one In Panel B we repeat the analysis
using net repurchases (ie repurchases after removing the effect of share issuances) following
Fama and French (2001) and Skinner (2008) Our inferences are unchanged29
This test is subject to two important caveats The first is we may not detect a decline in
repurchases because in the Post period firms need to offset the exercise of options that were
granted during the Pre period That is a post-FAS123R reduction in grants may not (yet) translate
into a reduction in exercises during the Post period which reduces our ability to test the dilution
hypothesis (ie that firms repurchase shares to offset exercises)30 However we can examine a
variation of this hypothesis where firms use repurchases to manage the effect of unexercised
options on diluted EPS (Bens et al 2003) To do so in Panel C we use a measure of adjusted
repurchases where we subtract our estimate of repurchases undertaken to offset the exercise of
ESO31 We effectively test whether firms experiencing an accounting-induced decrease in option
grants engage in less repurchases (net of exercise-driven repurchases) because their need to
manage the effect of unexercised options on diluted EPS is lower However the coefficient on
the variables of interest is either insignificant or positive inconsistent with the hypothesis
29 In the case of repurchases we do not examine separately ldquoinitiationsrdquo and ldquointensityrdquo as we do for dividends
because initiation is not clearly defined for repurchases Unlike dividends the occurrence of a repurchase in a given
year (or the lack thereof) cannot be used to infer a general policy due to the more discretionary nature of the timing of
repurchases 30 To capture the effect of lower option-based compensation on option exercises and thus on repurchases we would
ideally extend the Post period beyond 2007 However as noted by Floyd et al (2015) repurchases declined
dramatically after 2007 because of the financial crisis making it difficult to detect the effect of any other factor 31 As upper bound estimate of exercise-driven repurchases we multiply the number of ESO exercised during the year
times the average stock price during the year Since the number of ESO exercised is available in Compustat starting in
2004 Panel C is based on observations from 2004 to 2007
31
A second important caveat is that most firms replaced stock options with restricted stock
(Table 2 Panel C) Unvested restricted stock is excluded from the denominator in the computation
of basic EPS (once vested it is included) However it is included in the denominator of diluted
EPS using the treasury stock method similar to stock options Given the complexity of this
method without access to all details of restricted stock grants and option grants it is difficult to
determine whether the switch from stock options to restricted stock decreased the need for
dilution-driven repurchases as our test implicitly assumes Hence it is possible that we do not find
a decrease in repurchases because a reduced need to offset the dilutive effect of stock options was
neutralized by an increased need to offset the dilutive effect of restricted stock
Subject to the above caveats the evidence in Table 4 is not consistent with a positive causal
relation between the use of option-based pay and repurchases More precisely it suggests that
option-driven dilution concerns do not have a first-order effect on the magnitude of repurchases
even though they may play a role in the repurchase decision Hence our result is not necessarily
in conflict with the evidence in Brav et al (2005) where two-thirds of the surveyed financial
executives state that offsetting the dilutionary effect of stock option plans or other stock
programs is an important factor to their repurchase decisions
35 Option-Based Pay and Payout Composition
As an alternative to examining dividends and repurchases separately we also look at the
payout composition the change in the DividendsTotal Payout ratio from the Pre to the Post period
where Total Payout is the sum of dividends and repurchases As noted earlier we focus on the
subsample of firms with both dividends and repurchases in both Pre and Post periods so as to
capture the change in payout mix by firms routinely using both vehicles to return cash to
shareholders If the use of option-based pay causes firms to substitute repurchases for dividends
32
we should find a positive association between Accounting Impact or Treated and the payout mix
defined as DividendsTotal Payout ratio Firms with a higher accounting-driven reduction in
option-based pay should have an increase (decrease) in the relative weight of dividends
(repurchases) to the total payout However as reported in Table 5 Panel A we fail to find a
significant association between Accounting Impact (column 1 and 2) or Treated (column 3) and
the change in payout mix The results are similar when we use Net Payout (dividends plus net
repurchases) instead of Total Payout in computing the payout mix (Panel B)
Overall the combined evidence in Tables 3-5 does not support the hypothesis that option-
based compensation has negative (positive) effect on dividends (repurchases) or that it causes
firms to replace dividends with repurchases
4 Conclusion
Prior literature has documented robust associations between option-based compensation and
payout policy yet it remains unclear whether this association reflcts a causal influence We
investigate the causal effect of option-based compensation on payout policy using the adoption of
FAS123R which resulted in a significant decrease in option grants making it a plausible
exogenous shock to the use of option-based pay To overcome the challenge of no control group
we exploit the fact that firms responded differently depending on the firm-specific accounting
impact as measured by the implied option expense disclosed in the footnotes prior to FAS123R
Firms with larger expected accounting impact curtailed option-based compensation much more
aggressively than firms with lower impact Using a sample of SampP 1500 firms we find no
evidence that firms with a larger accounting-induced decline in option compensation increased
dividends reduced repurchases or changed their payout composition contrary to the widely held
belief that option-based pay has a causal influence on payout policy
33
Appendix Variable Definitions and Data Sources
Accounting Impact Variables
Accounting impact Implied option expense (Compustat XINTOPT) divided by total assets
(Compustat AT) This variable is measured at fiscal year 2002 and is time-invariant
Accounting impact rank The quartile rank of Accounting impact (1=lowest 4=highest)
Payout Variables
Regular dividendTotal assets The numerator is total regular cash dividends in the fiscal year
from the distribution dataset in CRSP Regular cash dividends are identified by the distribution
codes 1212 1222 1232 or 1242 The denominator is one-year lagged total assets (Compustat
AT)
DPS Dividend per share (Compustat DVPSX_F)
DPS pct change The percentage change of average DPS from Pre- to Post-FAS123R period
DPS pct change gtX indicator A dummy variable that equals one if DPC pct change is greater
than X and zero otherwise
RepurchaseTotal assets The numerator is the repurchase of common equity which equals total
repurchase (Compustat PRSTK) minus the change in preferred stock redemption value
(Compustat PSTKRV) The denominator is one-year lagged total assets (Compustat AT)
Net repurchaseTotal assets Net repurchase removes the effect of share issuances The
construction follows Fama and French (2001) and Skinner (2008) if the firm uses the treasury
stock method for repurchase net repurchase equals the increase in common treasury stock
(Compustat TSTKC) if the firm uses the retirement method (when common treasury stock is zero
in the current and prior year) net repurchase equals total repurchases minus stock issuance
(Compustat SSTK) and change in preferred stock redemption value (Compustat PSTKRV)
When the above measures give negative value net repurchase is set to zero
Adjusted repurchaseTotal assets Adjusted repurchase removes from total repurchase the potential
effect of repurchasing exercised options This variable equals total repurchase of common stocks
minus the product between the number of options exercised (Compustat OPTEXD) and average
stock price during the year When the above measure gives negative value adjusted repurchase is
set to zero Since the number of options exercised is not available before 2003 we drop
observations in 2003 when we use this variable
34
Total payoutTotal assets the sum of Regular dividendTotal assets and RepurchaseTotal assets
Regular dividendTotal payout regular cash dividend divided by the sum of regular cash dividend
and repurchase from common equity In the two-period analysis (Pre- vs Post-FAS123R) we
separately sum the numerator and the denominator for each firm-period and then calculate the ratio
Regular dividendNet payout regular dividend divided by the sum of regular dividend and net
repurchase In the two-period analysis (Pre- vs Post-FAS123R) we separately sum the numerator
and the denominator for each firm-period and then calculate the ratio
Compensation Variables
Salary_$ Average salary (Execucomp SALARY) of the top 5 highest paid executives in $1000
Salary_ Average salary (Execucomp SALARY) divided by average total pay (Execucomp
TDC1) of the top 5 highest paid executives
Bonus_$ Average bonus (Execucomp BONUS) of the top 5 highest paid executives in $1000
Due to a data format change we add non-equity plan-based awards (Execucomp
NON_EQ_TARG) to this measure after 2006
Bonus_ Bonus_$ divided by average total pay (Execucomp TDC1) of the top 5 highest paid
executives
Option grant_$ Average option grant value (Execucomp OPTION_AWARDS_BLK_VALUE or
OPTION_AWARDS_FV) of the top 5 highest paid executives in $1000 Due to a data format
change we use OPTION_AWARDS_FV for this measure after 2006
Option grant_ Option grant_$ divided by average total pay (Execucomp TDC1) of the top 5
highest paid executives
Restricted stock grant_$ Average restricted stock grant value (Execucomp RSTKGRNT or
STOCK_AWARDS_FV) of the top 5 highest paid executives in $1000 Due to data format
change we use STOCK_AWARDS_FV for this measure after 2006
Restricted stock grant_ Restricted stock grant_$ divided by average total pay (Execucomp
TDC1) of the top 5 highest paid executives
Total pay_$ Average total pay (Execucomp TDC1) of the top 5 highest paid executives in $1000
35
Other Characteristics
Size The book value of total assets (Compustat AT) minus the book value of common equity
(Compustat CEQ) plus the market value of common equity from CRSP in $M
Log(size) the natural logarithm of size
Book-to-market the book value of common equity dividend by its market value
Leverage long term debt plus short term debt (Compustat DLTT + DLC) divided by total assets
Asset tangibility tangible assets (Compustat AT - INTAN) divided by total assets
Free cash flow Operating cash flow (Compustat OANCF) minus capital expenditure (Compustat
CAPX) then divided by lagged total assets
Cash holding Cash and short-term investments (Compustat CHE) divided by total assets
ROA volatility the standard deviation of returns on assets (operating income before tax divided by
lagged total assets) in the past five fiscal years
Institutional ownership the number of shares held by institutional investors divided by the number
of shares outstanding from Thomson Reuters Institutional Holdings database
Sales growth the growth rate of sales (Compustat SALE) from the prior year
Past stock return annual stock return from the prior year
Loss indicator a dummy variable taking value of one if the current net income is negative and
zero otherwise
36
References
Aboody David 1996 Market Valuation of Employee Stock Options Journal of Accounting and
Economics 22 357-391
Aboody David Barth Mary E and Ron Kasznik 2004 Firms Voluntary Recognition of Stock-
Based Compensation Expense Journal of Accounting Research 42 123ndash150
Aboody David and Ron Kasznik 2008 Executive stock-based compensation and firmsrsquo cash
payout the role of shareholdersrsquo tax-related payout preferences Review of Accounting Studies
13 216ndash251
Anantharaman Divya and Yong Gyu Lee 2014 Managerial risk taking incentives and corporate
pension policy Journal of Financial Economics 111 328ndash351
Baker Malcolm and Jeffrey Wurgler 2004 A catering theory of dividends Journal of Finance
59 1125-1165
Baker Malcolm and Jeffrey Wurgler 2016 Dividends as reference points a behavioral signaling
approach Review of Financial Studies 29 697-738
Bakke Tor-Erik Hamed Mahmudi Chitru Fernando and Jesus Salas 2015 The causal effect of
option pay on corporate risk management Journal of Financial Economics forthcoming
Balsam Steven Austin Reitenga and Jennifer Yin 2008 Option acceleration in response to SFAS
No 123 (R) Accounting Horizons 22 23-45
Bens Daniel and Steven Monahan 2008 Altering Investment Decisions to Manage Financial
Reporting Outcomes Asset-Backed Commercial Paper Conduits and FIN 46 Journal of
Accounting Research 46 1017-1055
Bens Daniel A Venky Nagar Douglas J Skinner and MH Franco Wong 2003 Employee stock
options eps dilution and stock repurchases Journal of Accounting and Economics 36 51ndash90
Bertrand Marianne Esther Duflo and Sendhil Mullainathan 2004 How much should we trust
differences-in-differences estimates The Quarterly Journal of Economics 119 249ndash275
Blouin Jennifer L Jana S Raedy and Douglas A Shackelford 2011 Dividends Share
Repurchases and Tax Clienteles Evidence from the 2003 Reductions in Shareholder Taxes
The Accounting Review 86 887-914
Brav Alon John R Graham Campbell R Harvey and Roni Michaely 2005 Payout policy in the
21st century Journal of Financial Economics 77 483ndash527
Brown Lawrence D and Yen-Jung Lee 2011 Changes in Option-Based Compensation Around
the Issuance of SFAS123R Journal of Business Finance amp Accounting 38 1053ndash109
37
Brown Jeffrey R Nellie Liang and Scott Weisbenner 2007 Executive financial incentives and
payout policy Firm responses to the 2003 dividend tax cut Journal of Finance 62 1935ndash
1965
Burns Natasha Brian McTier and Kristina Minnick 2015 Equity-incentive compensation and
payout policy in Europe Journal of Corporate Finance 30 85-97
Carter Mary Ellen and Luann J Lynch 2003 The Consequences of the FASBrsquos 1998 Proposal on
Accounting for Stock Option Repricing Journal of Accounting and Economics 35 51-72
Carter Mary Ellen Luann J Lynch and Irem Tuna 2007 The role of accounting in the design of
CEO equity compensation The Accounting Review 82 327ndash357
Chava Sudheer and Amiyatosh Purnanandam 2010 CEOs versus CFOs Incentives and
corporate policies Journal of Financial Economics 97 263ndash278
Chetty Raj and Emmanuel Saez 2005 Dividend taxes and corporate behavior Evidence from the
2003 dividend tax cut The Quarterly Journal of Economics 120 791ndash833
Choudhary Preeti Shivaram Rajgopal and Mohan Venkatachalam 2009 Accelerated vesting of
employee stock options in anticipation of FAS123R Journal of Accounting Research 47 105ndash
146
Christensen Hans B and Valeri Nikolaev 2009 Contracting on Mandatory Changes to GAAP
New Practice and Its Determinants Working Paper University of Chicago
Chu Yongqiang and Tao Ma 2015 How does management compensation affect bank risk taking
evidence from FAS 123R University of South Carolina Working Paper
Cuny Charles J Gerald S Martin and John J Puthenpurackal 2009 Stock options and total
payout Journal of Financial and Quantitative Analysis 44 391ndash410
DeAngelo Harry Linda DeAngelo and Douglas J Skinner 2000 Special Dividends and the
Evolution of Dividend Signaling Journal of Financial Economics 57 309-354
Dechow Patricia M Amy P Hutton and Richard G Sloan 1996 Economic consequences of
accounting for stock-based compensation Journal of Accounting Research 34 1ndash20
Edgerton J 2013 Four facts about dividend payouts and the 2003 tax cut International Tax and
Public Finance 20 769-784
Edmans Alex and Xavier Gabaix 2015 Executive compensation a modern primer Journal of
Economic Literature forthcoming
38
Fama Eugene F and Kenneth R French 2001 Disappearing dividends changing firm
characteristics or lower propensity to pay Journal of Financial Economics 60 3ndash43
Farre-Mensa Joan Roni Michaely and Martin C Schmalz 2014 Payout policy Annual Review
of Financial Economics 6 75ndash134
Fenn George W and Nellie Liang 2001 Corporate payout policy and managerial stock
incentives Journal of Financial Economics 60 45ndash72
Ferri Fabrizio and Tatiana Sandino 2009 The impact of shareholder activism on financial
reporting and compensation the case of employee stock options expensing The Accounting
Review 84 433ndash466
Floyd Eric Nan Li and Douglas J Skinner 2015 Payout policy through the financial crisis the
growth of repurchases and the resilience of dividends Journal of Financial Economics 118
299-316
Frydman Carola and Dirk Jenter 2010 CEO compensation Annual Review of Financial
Economics 2 75-102
Gipper Brandon 2015 Assessing the Effects of Disclosing Management Compensation Working
Paper University of Chicago
Gormley Todd David Matsa and Todd Milbourn 2013 CEO compensation and corporate risk
evidence from a natural experiment Journal of Accounting and Economics 56 79-101
Graham John Michelle Hanlon and Terry Shevlin 2011 Real effects of accounting rules
evidence from multinational firmsrsquo investment locations and profit repatriation decisions
Journal of Accounting Research 49 137-185
Graham John Campbell Harvey and Shiva Rajgopal 2005 The Economic implications of
corporate financial reporting Journal of Accounting and Economics 40 3-73
Greenspan Alan 2002 Testimony of Alan Greenspan before the Committee on Banking
Housing and Urban Affairs US Senate July 16 Washington DC Government Printing
Office
Grullon Gustavo and Roni Michaely 2002 Dividends Share Repurchases and the Substitution
Hypothesis Journal of Finance 57 1649-1684
Hail Luzi Ahmed Tahoun and Clare Wang 2014 Dividend Payouts and Information Shocks
Journal of Accounting Research 52 403-456
Hall Brian J and Kevin J Murphy 2002 Stock options for undiversified executives Journal of
Accounting amp Economics 33 3-42
39
Hall Brian J and Kevin J Murphy 2003 The trouble with stock options Journal of Economic
Perspectives 17 49ndash70
Hanlon Michelle and Jeffrey L Hoopes 2014 What do firms do when dividend tax rates change
An examination of alternative payout responses Journal of Financial Economics 114 105-
124
Hayes Rachel M Michael Lemmon and Mingming Qiu 2012 Stock options and managerial
incentives for risk taking Evidence from FAS123R Journal of Financial Economics 105
174ndash190
Heron Randall A Erik Lie 2007 Does backdating explain the stock price pattern around
executive stock option grants Journal of Financial Economics 83 271-295
Hribar Paul Nicole Thorne Jenkins and W Bruce Johnson 2006 Stock repurchases as an
earnings management device Journal of Accounting and Economics 41 3ndash27
Jensen Michael C 1986 Agency cost of free cash flow corporate finance and takeovers
American Economic Review 76 323-329
Jolls Christine 1998 Stock repurchases and incentive compensation NBER Working Paper No
w6467
Jung Boochun Woo-Jong Lee and Yanhua Sunny Yang 2016 The Impact of Dividend
Covenants on Investment and Operating Performance Journal of Business Finance amp
Accounting 43 414ndash447
Kahle Kathleen M 2002 When a buyback isnrsquot a buyback open market repurchases and
employee options Journal of Financial Economics 63 235ndash261
Lambert Richard A William N Lanen and David F Larcker 1989 Executive stock option plans
and corporate dividend policy Journal of Financial and Quantitative Analysis 24 409ndash425
Lintner John 1956 Distribution of incomes of corporations among dividends retained earnings
and taxes The American Economic Review 46 97-113
Low Angie 2009 Managerial risk-taking behavior and equity-based compensation Journal of
Financial Economics 92 470-490
Miller Merton H and Franco Modigliani 1961 Dividend policy growth and the valuation of
shares The Journal of Business 34 411ndash433
Minnick Kristina and Leonard Rosenthal 2015 Stealth compensation Do CEOs increase their
pay by influencing dividend policy Journal of Corporate Finance 25 435-454
40
Murphy Kevin J 1999 Executive compensation In O Ashenfelter and D Card (eds) North
Holland Handbook of Labor Economics Amsterdam Elsevier Science BV
Murphy Kevin J 2013 Executive compensation Where we are and how we got there Handbook
of the Economics of Finance Elsevier Science North Holland 211-356
Nikolaev Valeri 2010 Debt Covenants and Accounting Conservatism Journal of Accounting
Research 48 143-176
Puri Manju Joumlrg Rocholl and Sascha Steffen 2011 Global retail lending in the aftermath of the
US financial crisis Distinguishing between supply and demand effects Journal of Financial
Economics 100 556-578
Shue Kelly and Richard R Townsend 2014 Swinging for the fences Executive reactions to
quasi-random option grants Working Paper University of Chicago
Skinner Douglas J 2008 The evolving relation between earnings dividends and stock
repurchases Journal of Financial Economics 87 582-609
Weisbenner Scott J 2000 Corporate share repurchases in the 1990s What role do stock options
play FEDS Working Paper No 2000-29
Zhang Dan 2013 CEO dividend protection Working Paper BI Norwegian Business School
41
Figure 1 Trends of dividends and repurchases from 2003 to 2007 Panel A plots the average
Regular DividendTotal Assets of firms in the highest and lowest quartiles of Accounting Impact
measured in 2002 Panel B shows the average Total RepurchaseTotal Assets of firms in the
highest and lowest quartiles of Accounting Impact measured in 2002
Panel A Trends of regular dividends
Panel B Trends of total repurchases
00
05
10
15
20
2003 2004 2005 2006 2007
Regular DividendTotal Assets
Lowest Acc Impact
Highest Acc Impact
Pre Post
00
20
40
60
80
100
2003 2004 2005 2006 2007
Total Repurchase Total Assets
Lowest Acc Impact
Highest Acc Impact
Pre Post
42
Table 1
Summary Statistics
Panel A Firm characteristics - full sample
N Mean Std dev 25 pctl Median 75 pctl
Accounting impact (2002) 1176 173 366 022 052 163
Payout variablesRegular dividendTotal assets 5653 093 148 000 000 142
RepurchaseTotal assets 5653 394 710 000 035 500
Total payoutTotal assets 5653 488 748 000 175 666
Regular dividendTotal payout 4091 3874 4057 000 2237 8833
Level of executive compensation (in $1000)
Salary_$ 5653 450 190 314 409 544
Bonus_$ 5653 476 616 122 295 586
Option grant_$ 5653 791 1137 62 384 1002
Restricted stock grant_$ 5653 458 866 0 58 518
Total pay_$ 5653 2481 2475 890 1647 3074
Percentage of executive compensation
Salary_ 5653 296 183 165 251 382
Bonus_ 5653 197 148 97 177 268
Option grant_ 5653 283 235 67 256 445
Restricted stock grant_ 5653 141 180 00 41 249
Control variables
Size ($M) 5653 11086 27294 1017 2459 8117
Log(size) 5653 7985 1565 6925 7808 9002
Book-to-market 5653 0445 0287 0251 0388 0578
Leverage 5653 0202 0172 0038 0187 0309
Asset tangibility 5653 0806 0184 0691 0853 0965
Free cash flow 5653 0059 0091 0013 0059 0108
Cash holding 5653 0166 0172 0034 0100 0247
ROA volatility 5653 0056 0056 0021 0038 0070
Institutional ownership 5653 0753 0202 0639 0795 0910
Sales growth 5653 0121 0189 0028 0096 0183
Past stock return 5653 0094 0183 -0012 0094 0199
Loss indicator 5653 0164 0370 0000 0000 0000
This table presents summary statistics Panel A shows the descriptive statistics of payout variables compensation
variables and other firm characteristics for the full sample Accounting impact is the implied option expense
measured at fiscal year 2002 All other variables are measured at firm-year level from fiscal year 2003 to 2007
resulting in 5653 firm-year observations (except for Regular dividendTotal Payout which can be measured only
for the 4901 firm-year observations with Total payout greater than zero) Panel B shows the pairwise correlations
between main variables at firm-year level Panel C compares payout variables compensation variables and other
firm characteristics before and after FAS123R The Pre-FAS123R period consists of fiscal year 2003 and 2004
the Post-FAS123R period covers fiscal year 2005-2007 Panel D compares the trends of payout and compensation
variables around FAS123R across four quartile groups ranked by 2002 accounting impact Panel E compares the
trends of payout and compensation variables around FAS123R between the treated and control group under the
alternative treatment definition in Bakke et al (2015) (see Section 22) All variables are defined in Appendix The
notation and in Panel C indicates statistically significant at 10 5 and 1 level in T-tests for equal
means respectively
43
Pa
nel
B
Pea
rso
n c
orr
ela
tio
ns
Reg div
Repurchase
Total payout
Salary_
Bonus_
Option_
RS_
Log(size)
BM
Leverage
Tangibility
FCF
Cash holdingROA vol
Inst own
Sales growth
Past ret
urn
Loss
Reg
div
10
0
Repurc
hase
01
610
0
Tota
l payout
03
509
810
0
Sala
ry_
-0
10
-01
8-0
19
10
0
Bonus_
00
700
100
3-0
01
10
0
Option_
-0
10
00
900
6-0
41
-03
510
0
RS
_
01
000
901
0-0
32
-01
1-0
40
10
0
Log(s
ize)
03
101
802
3-0
56
01
101
202
210
0
BM
-02
1-0
28
-03
103
0-0
03
-02
000
0-0
33
10
0
Levera
ge
-00
1-0
08
-00
8-0
05
00
6-0
11
00
801
9-0
03
10
0
Tangib
ility
00
200
100
101
200
1-0
05
-00
6-0
12
-00
4-0
18
10
0
FC
F02
203
703
9-0
20
00
901
1-0
01
02
4-0
32
-02
1-0
16
10
0
Cash
hold
ing
-01
301
000
700
2-0
14
02
2-0
10
-02
3-0
16
-03
502
901
210
0
RO
A v
ol
-01
5-0
04
-00
700
4-0
11
01
9-0
11
-02
3-0
08
-01
101
2-0
02
03
910
0
Inst
ow
n
-00
901
401
1-0
17
00
200
701
200
7-0
01
00
3-0
08
01
4-0
06
-01
110
0
Sale
s gro
wth
-00
8-0
04
-00
6-0
15
00
501
0-0
02
00
7-0
16
-00
3-0
08
01
300
201
400
410
0
Past
retu
rn00
901
301
4-0
18
01
5-0
01
00
301
6-0
29
-01
000
102
7-0
14
-01
001
602
710
0
Loss
-02
0-0
19
-02
201
8-0
18
00
4-0
05
-02
601
901
300
6-0
41
01
702
3-0
16
-01
8-0
40
10
0
44
Panel C Firm characteristics - before and after FAS123R
Pre FAS 123R Post FAS 123R Difference
Payout variables
Regular dividendTotal assets 083 099 016
RepurchaseTotal assets 245 490 245
Total payoutTotal assets 328 589 261
Regular dividendTotal payout 3914 2790 -1124
Level of executive compensation (in $1000)
Salary_$ 426 463 37
Bonus_$ 418 505 87
Option grant_$ 896 707 -191
Restricted stock grant_$ 269 574 305
Total pay_$ 2263 2584 321
Percentage of executive compensation
Salary_ 305 293 -12
Bonus_ 186 204 18
Option grant_ 343 240 -103
Restricted stock grant_ 87 176 89
Control variables
Size ($M) 9671 11631 1960
Log(size) 7860 8035 0175
Book-to-market 0437 0453 0016
Leverage 0201 0203 0002
Asset tangibility 0822 0793 -0029
Free cash flow 0061 0057 -0004
Cash holding 0175 0159 -0016
ROA volatility 0067 0048 -0019
Institutional ownership 0712 0781 0069
Sales growth 0137 0108 -0029
Past stock return 0080 0101 0021
Loss indicator 0173 0159 -0014
45
Pa
nel
D
Fir
m c
ha
racte
rist
ics
by q
ua
rtil
e o
f a
cco
un
tin
g i
mp
act
- b
efo
re a
nd
aft
er
FA
S1
23
R
Accounting im
pact
(2002)
Num
ber
of
Fir
ms
Pre
Post
Pre
Post
Pre
Post
Pre
Post
Payout
vari
able
s
Regula
r div
idendT
ota
l ass
ets
11
2
12
4
09
4
11
1
09
5
11
3
03
0
04
9
Repurc
hase
Tota
l ass
ets
11
3
26
8
19
2
37
3
32
7
63
1
35
1
68
7
Tota
l payout
Tota
l ass
ets
22
4
39
1
28
5
48
4
42
2
74
4
38
1
73
6
Regula
r div
idendT
ota
l payout
643
7
469
8
474
0
341
1
284
5
195
4
82
5
74
5
Perc
enta
ge o
f executive c
om
pensa
tion
Sala
ry_
337
295
313
287
296
289
276
300
Bonus_
223
226
214
228
172
192
134
169
Option g
rant_
201
167
290
210
373
260
507
325
Rest
ricte
d s
tock g
rant_
116
194
98
180
89
176
43
155
294
294
294
294
1st Q
uart
ile2
nd Q
uart
ile3
rd Q
uart
ile4
th Q
uart
ile
01
2
03
5
09
3
55
1
46
Accounting impact
Number of Firms
By accounting impact quartile
1
2
3
4
Pre Post Pre Post
Payout variables
Regular dividendTotal assets 09 11 08 10
RepurchaseTotal assets 18 31 26 52
Total payoutTotal assets 28 43 34 62
Regular dividendTotal payout 428 357 386 265
Percentage of executive compensation
Salary_ 435 364 282 280
Bonus_ 226 214 179 202
Option grant_ 92 125 387 261
Restricted stock grant_ 125 188 80 174
Percentage of CEO compensation
Salary_(CEO) 485 364 260 259
Bonus_(CEO) 249 228 185 219
Option grant_(CEO) 10 127 406 275
Restricted stock grant_(CEO) 128 182 82 183
Panel E Firm characteristics by alternative treatment definition - before and
after FAS123R
Treated
25
19
997
223
250
256
268
10
177
71
Control
44
37
47
Table 2
Differential effect of FAS123R on the use of option-based compensation
Panel A Two-period first-difference regression
Prediction Coeff t-stat Coeff t-stat Coeff t-stat
Accounting impact rank - -0044 -628
Accounting impact rank=2 - -0044 -327
Accounting impact rank=3 - -0075 -468
Accounting impact rank=4 - -0140 -613
Treated - -0132 -875
ΔLog(size) 0061 202 0061 200 0063 214
ΔBook-to-market 0032 091 0032 092 0051 143
ΔLeverage -0157 -213 -0160 -218 -0111 -153
ΔAsset tangibility -0012 -014 -0020 -023 -0023 -026
ΔFree cash flow -0106 -095 -0108 -097 -0128 -117
ΔCash holding -0197 -211 -0193 -206 -0180 -194
ΔFive-year ROA volatility -0065 -031 -0056 -026 -0098 -047
ΔInstitutional ownership -0044 -091 -0043 -088 -0044 -092
ΔSales growth -0064 -102 -0065 -104 -0090 -153
ΔPast one-year stock return 0051 078 0052 080 0091 138
ΔLoss frequency 0056 207 0057 207 0047 179
Log(size) -0009 -210 -0009 -207 -0002 -035
Book-to-market -0015 -056 -0013 -049 0018 072
Leverage 0022 046 0023 048 0068 150
Asset tangibility 0033 077 0033 078 0053 128
Free cash flow 0227 202 0220 195 0127 117
Cash holding -0002 -004 0012 019 -0078 -141
Five-year ROA volatility -0451 -240 -0430 -228 -0509 -283
Institutional ownership -0123 -360 -0122 -359 -0100 -292
Sales growth -0041 -056 -0040 -055 -0089 -125
Past one-year stock return -0009 -015 -0006 -010 0078 125
Loss frequency 0055 174 0056 178 0054 173
Fixed effect
Standard error
Adj R-squared
Observations
Model (3)
Dependent variable ΔAvg Option grantTotal pay
Huber-White
0156
This table investigates whether the effect of FAS123R on the use of option-based pay varies with its potential accounting impact Panel A
reports the results of estimating three two-period first-differencing models where for each firm we average its characteristics in Pre- and
Post-FAS123R period The Pre-FAS123R period consists of fiscal year 2003 and 2004 the Post-FAS123R period covers fiscal year 2005-
2007 In all three specifications the dependent variable is the change of average Option grantTotal pay from Pre- to Post-FAS123R period
The main independent variable varies by model in Model (1) the Accounting impact rank is the quartile rank of implied option expensetotal
assets measured in 2002 (1=lowest 4=highest) In Model (2) Accounting impact rank=2 (3 4) is an indicator that takes value of one if the
firmrsquos Accounting impact rank equals 2 (3 4) In Model (3) we use an alternative treatment construction following Bakke et al (2015)
where Treated is an indicator that takes value of zero if the firm granted zero option to its CEO in both 2003 and 2004 or the firm began to
voluntarily expense option-based pay at fair value in 2002 or earlier and one otherwise For each control variable we include both its level in
the Pre-FAS123R period and its change across the two periods Panel B shows the results of estimating fixed effect models with firm-year
observations The dependent variable is the firm-year level Option grantTotal pay The main independent variables are the interactions of
Post-FAS123R indicator (Post) with Accounting Impact rank Accounting impact rank indicators and Treated respectively All models in
Penal A have industry fixed effects and the standard errors are Huber-White heteroscedasticity-consistent standard errors All models in
Penal B have firm fixed effects and year fixed effects and the standard errors are clustered at firm level All variables are defined in
Appendix The notation and indicates statistically significant at 10 5 and 1 level respectively
Model (1) Model (2)
11711171 1171
Industry Industry
Huber-White
0124
Huber-White
0123
Industry
48
Panel B Panel fixed effects regression
Prediction Coeff t-stat Coeff t-stat Coeff t-stat
Acc impact rank x Post - -0044 -807
Acc impact rank 2 x Post - -0046 -333
Acc impact rank 3 x Post - -0077 -526
Acc impact rank 4 x Post - -0137 -776
Treated x Post - -0145 -970
Log(size) 0034 221 0034 217 0036 229
Book-to-market 0018 084 0017 083 0015 070
Leverage -0004 -009 -0006 -013 -0007 -015
Asset tangibility 0007 012 0004 006 0011 018
Free cash flow -0074 -151 -0072 -146 -0078 -158
Cash holding -0048 -086 -0050 -090 -0006 -011
Five-year ROA volatility 0250 231 0239 219 0437 414
Institutional ownership 0043 159 0044 161 0041 150
Sales growth -0033 -168 -0034 -171 -0031 -158
Past one-year stock return 0067 221 0068 224 0063 204
Loss indicator 0023 209 0022 207 0024 222
Fixed effects
Standard error
Adj R-squared
Observations
Dependent variable Option grantTotal pay
5653 5653 5653
Clustered by firm
Firm Year
Clustered by firm
Firm Year
Clustered by firm
0523 0523 0526
Model (1) Model (2) Model (3)
Firm Year
49
Table 3
Effect of option-based compensation on dividend policy
Panel A Two-period first-difference regression
Prediction Coeff t-stat Coeff t-stat Coeff t-stat
Accounting impact rank + 0000 077
Accounting impact rank=2 + 0001 091
Accounting impact rank=3 + 0000 044
Accounting impact rank=4 + 0001 092
Treated + 0000 -026
ΔLog(size) 0000 -030 0000 -030 0000 -026
ΔBook-to-market -0002 -190 -0002 -193 -0002 -195
ΔLeverage -0002 -059 -0002 -057 -0002 -059
ΔAsset tangibility 0016 431 0016 429 0016 430
ΔFree cash flow 0017 373 0017 373 0017 375
ΔCash holding -0011 -288 -0011 -285 -0010 -282
ΔFive-year ROA volatility 0003 034 0002 032 0003 035
ΔInstitutional ownership -0002 -073 -0002 -073 -0002 -070
ΔSales growth -0001 -040 -0001 -037 -0001 -038
ΔPast one-year stock return 0002 077 0002 076 0002 070
ΔLoss frequency 0000 -048 0000 -045 0000 -046
Log(size) 0000 183 0000 182 0000 182
Book-to-market -0002 -227 -0002 -225 -0002 -284
Leverage -0001 -037 -0001 -039 -0001 -048
Asset tangibility 0003 179 0003 180 0003 176
Free cash flow 0017 291 0017 291 0017 300
Cash holding 0002 080 0002 077 0002 098
Five-year ROA volatility 0003 035 0002 033 0003 044
Institutional ownership -0001 -068 -0001 -068 -0001 -058
Sales growth -0004 -177 -0004 -175 -0004 -172
Past one-year stock return 0004 169 0004 167 0004 165
Loss frequency -0001 -111 -0001 -109 -0001 -102
Fixed effect
Standard error
Adj R-squared
Observations
Dependent variable ΔAvg Regular dividendTotal assets
This table investigates the causal effect of option-based pay on dividend policy by examining whether changes in dividend policy around
FAS123R vary with its potential accounting impact Panel A reports the results of estimating three two-period first-differencing models
where for each firm we average its characteristics in Pre- and Post-FAS123R period In all three specifications the dependent variable is
the change of average Regular dividendTotal assets from Pre- to Post-FAS123R period The main independent variable varies by model in
Model (1) the Accounting impact rank is the quartile rank of implied option expensetotal assets measured in 2002 (1=lowest 4=highest) In
Model (2) Accounting impact rank=2 (3 4) is an indicator that takes value of one if the firmrsquos Accounting impact rank equals 2 (3 4) In
Model (3) we use an alternative treatment construction following Bakke et al (2015) where Treated is an indicator that takes value of zero
if the firm granted zero option to its CEO in both 2003 and 2004 or the firm began to voluntarily expense option-based pay at fair value in
2002 or earlier and one otherwise For each control variable we include both its level in the Pre-FAS123R period and its change across the
two periods Panel B shows the results of estimating fixed effect models with firm-year observations The dependent variable is the firm-
year level Regular dividendTotal assets The main independent variables are the interactions of Post-FAS123R indicator (Post) with
Accounting Impact rank Accounting impact rank indicators and Treated respectively Panel C examines the intensity of dividend changes
among firms with nonzero dividend per share in 2003 or 2004 In particular we estimates the same three models as in Panel A(with the
same independent variables) but for five dependent variables the change of average Regular dividendTotal assets from Pre- to Post-
FAS123R period (as in Panel A) the percentage change of DPS (dividend per share) from Pre- to Post-FAS123R period and three
indicators denoting respectively whether the percentage change of DPS was greater than 20 40 and 60 Panel D reports four
robustness tests of the dividend intensity regression In each of them a set of possible confounding observations is removed (see Section 33
for details) Panel E compares the trends of dividend initiation and termination around FAS123R across four quartile groups ranked by
accounting impact All models in Panel A C and D have industry fixed effects and the standard errors are Huber-White heteroscedasticity-
consistent standard errors All models in Penal B have firm fixed effects and year fixed effects and the standard errors are clustered at
firm level All variables are defined in Appendix The notation and indicates statistically significant at 10 5 and 1 level
Industry Industry Industry
Model (1) Model (2) Model (3)
1171 1171 1171
Huber-White Huber-White Huber-White
0105 0104 0105
50
Panel B Panel fixed effects regression
Prediction Coeff t-stat Coeff t-stat Coeff t-stat
Acc impact rank x Post + 0000 122
Acc impact rank 2 x Post + 0001 110
Acc impact rank 3 x Post + 0001 094
Acc impact rank 4 x Post + 0001 129
Treated x Post + 0000 -012
Log(size) 0001 179 0001 179 0001 181
Book-to-market 0000 025 0000 024 0000 031
Leverage 0001 062 0001 064 0001 069
Asset tangibility 0009 360 0009 358 0009 363
Free cash flow 0002 090 0002 093 0002 092
Cash holding -0007 -295 -0007 -298 -0007 -298
Five-year ROA volatility 0001 041 0001 038 0000 -006
Institutional ownership 0000 -027 0000 -026 0000 -027
Sales growth 0000 053 0000 051 0000 044
Past one-year stock return 0001 089 0001 088 0001 078
Loss indicator 0000 -060 0000 -057 0000 -076
Fixed effects
Standard error
Adj R-squared
Observations
Dependent variable Regular dividendTotal assets
Model (1) Model (2) Model (3)
Firm Year Firm Year Firm Year
5653 5653 5653
Clustered by firm Clustered by firm Clustered by firm
0877 0877 0877
51
Panel C Intensity of dividend changes around FAS123R
Prediction Coeff t-stat Coeff t-stat Coeff t-stat
Accounting impact rank + 0000 065
Accounting impact rank=2 + 0000 048
Accounting impact rank=3 + 0000 026
Accounting impact rank=4 + 0002 080
Treated + 0001 063
Dependent var DPS pct change
Accounting impact rank + -0145 -072
Accounting impact rank=2 + 0018 006
Accounting impact rank=3 + -0177 -045
Accounting impact rank=4 + -0746 -100
Treated + -0407 -119
Accounting impact rank + 0029 095
Accounting impact rank=2 + 0040 074
Accounting impact rank=3 + 0092 139
Accounting impact rank=4 + 0008 007
Treated + -0007 -012
Accounting impact rank + 0024 076
Accounting impact rank=2 + 0047 088
Accounting impact rank=3 + 0079 114
Accounting impact rank=4 + -0003 -002
Treated + 0030 052
Accounting impact rank + 0030 098
Accounting impact rank=2 + 0078 155
Accounting impact rank=3 + 0085 130
Accounting impact rank=4 + 0014 012
Treated + -0006 -011
Control variables
Fixed effect
Standard error
Observations 572 572 572
Yes Yes Yes
Huber-White Huber-White Huber-White
Industry Industry Industry
Dependent var DPS pct
change gt60 indicator
Model (1) Model (2) Model (3)
Dependent var ΔAvg Regular
dividendAssets
Dependent var DPS pct
change gt20 indicator
Dependent var DPS pct
change gt40 indicator
52
Panel D Robustness tests for intensity of dividend changes around FAS123R
Prediction Coeff t-stat Coeff t-stat Coeff t-stat
Accounting impact rank + 0006 017
Accounting impact rank=2 + 0067 118
Accounting impact rank=3 + 0041 057
Accounting impact rank=4 + -0061 -049
Treated + 0022 035Observations
Accounting impact rank + 0009 027
Accounting impact rank=2 + 0058 106
Accounting impact rank=3 + 0032 043
Accounting impact rank=4 + -0032 -024
Treated + 0018 028
Observations
Accounting impact rank + 0030 089
Accounting impact rank=2 + 0039 071
Accounting impact rank=3 + 0122 168
Accounting impact rank=4 + -0063 -052
Treated + 0075 132
Observations
Accounting impact rank + 0008 023
Accounting impact rank=2 + 0023 042
Accounting impact rank=3 + 0048 064
Accounting impact rank=4 + -0042 -033
Treated + -0010 -016
Observations
Control variables
Fixed effect
Standard error
Exclude firms with stable
payout ratio from 2003 to 2004
506 506 506
Dependent variable DPS pct change gt40 indicator
Model (1) Model (2) Model (3)
Exclude voluntary expensers
519 519
Exclude firms in the top decile
of option reduction (02-04)
Exclude firms that accelerated
option vesting
504 504 504
517 517 517
519
Huber-White Huber-White Huber-White
Yes Yes Yes
Industry Industry Industry
53
Panel E Dividend initiation and termination rates around FAS123R
Pre FAS 123R
1 280 75 7 6 13 173
2 284 135 18 9 27 200
3 286 181 11 14 25 138
4 282 260 9 10 19 73
Total 1132 651 45 39 84 129
Post FAS 123R
1 275 63 4 4 8 127
2 280 116 9 9 18 155
3 276 152 9 3 12 79
4 263 223 5 1 6 27
Total 1094 554 27 17 44 79
Pre FAS 123R
1 280 205 2 0 2 10
2 284 149 7 1 8 54
3 286 105 0 0 0 00
4 282 22 0 0 0 00
Total 1132 481 9 1 10 21
Post FAS 123R
1 275 212 3 6 9 42
2 280 164 1 2 3 18
3 276 124 1 1 2 16
4 263 40 0 3 3 75
Total 1094 540 5 12 17 31
termination
in 2004
03-04
cumulative
03-04
cumulative
Quartile firms
with
dividend in
2004
termination
in 2005
termination
in 2006
05-06
cumulative
05-06
cumulative
Termination
Quartile firms
with
dividend in
2002
termination
in 2003
without
dividend in
2004
initiation in
2003
initiation in
2004
03-04
cumulative
03-04
cumulative firmsQuartile
firmsQuartile initiation in
2005
initiation in
2006
05-06
cumulative
05-06
cumulative
Initiation
without
dividend in
2002
54
Table 4
Effect of option-based compensation on repurchases
Panel A Two-period first-difference regression with total repurchase
Prediction Coeff t-stat Coeff t-stat Coeff t-stat
Accounting impact rank - 0002 122
Accounting impact rank=2 - 0002 071
Accounting impact rank=3 - 0005 123
Accounting impact rank=4 - 0007 102
Treated - 0014 365
Control variables
Fixed effect
Standard error
Adj R-squared
Observations
Panel B Two-period first-difference regression with net repurchase
Prediction Coeff t-stat Coeff t-stat Coeff t-stat
Accounting impact rank - 0003 166
Accounting impact rank=2 - 0002 051
Accounting impact rank=3 - 0006 165
Accounting impact rank=4 - 0009 137
Treated - 0010 300
Control variables
Fixed effect
Standard error
Adj R-squared
Observations
Panel C Two-period first-difference regression with repurchase adjusted for exercised options
Prediction Coeff t-stat Coeff t-stat Coeff t-stat
Accounting impact rank - 0001 056
Accounting impact rank=2 - 0002 062
Accounting impact rank=3 - 0007 172
Accounting impact rank=4 - -0001 -008
Treated - 0006 197
Control variables
Fixed effect
Standard error
Adj R-squared
Observations
Dependent variable ΔAvg RepurchaseTotal assets
This table investigates the causal effect of option-based pay on payout policy by examining whether the changes of repurchase around
FAS123R vary with its potential accounting impact Panel A reports the results of estimating three two-period first-differencing models
where for each firm we average its characteristics in Pre- and Post-FAS123R period In all three specifications the dependent variable is
the change of average RepurchaseTotal assets from Pre- to Post-FAS123R period The main independent variable varies by model in
Model (1) the Accounting impact rank is the quartile rank of implied option expensetotal assets measured in 2002 (1=lowest 4=highest)
In Model (2) Accounting impact rank=2 (3 4) is an indicator that takes value of one if the firmrsquos Accounting impact rank equals 2 (3 4)
In Model (3) we use an alternative treatment construction following Bakke et al (2015) where Treated is an indicator that takes value of
zero if the firm granted zero option to its CEO in both 2003 and 2004 or the firm began to voluntarily expense option-based pay at fair
value in 2002 or earlier and one otherwise Panel B reports the regressions with the change of Net repurchaseTotal assets as the
dependent variable and the same independent variable as in Panel A Panel C reports the regressions with the change of Adjusted
repurchaseTotal assets as the dependent variable and the same independent variable as in Panel A All models in Panel A B and C have
industry fixed effects and the standard errors are Huber-White heteroscedasticity-consistent standard errors All variables are defined in
Appendix The notation and indicates statistically significant at 10 5 and 1 level respectively
Model (1) Model (2) Model (3)
Yes Yes Yes
Industry Industry Industry
Huber-White Huber-White Huber-White
Dependent variable ΔAvg Net repurchaseTotal assets
1171 1171 1171
0238 0237 0245
Model (1) Model (2) Model (3)
Yes Yes Yes
Industry Industry Industry
Huber-White Huber-White Huber-White
Dependent variable ΔAvg Adjusted repurchaseTotal assets
0229 0229 0233
1171 1171 1171
Model (1) Model (2) Model (3)
Yes Yes Yes
Industry Industry Industry
Huber-White Huber-White Huber-White
0111 0112 0114
1168 1168 1168
55
Table 5
Effect of option-based compensation on payout mix
Panel A Two-period first-difference regression with total payout mix
Prediction Coeff t-stat Coeff t-stat Coeff t-stat
Accounting impact rank + 0006 028
Accounting impact rank=2 + 0018 045
Accounting impact rank=3 + -0001 -001
Accounting impact rank=4 + 0043 052
Treated + -0035 -094
Control variables
Fixed effect
Standard error
Adj R-squared
Observations
Panel B Two-period first-difference regression with net payout mix
Prediction Coeff t-stat Coeff t-stat Coeff t-stat
Accounting impact rank + -0002 -008
Accounting impact rank=2 + 0008 016
Accounting impact rank=3 + 0018 034
Accounting impact rank=4 + -0059 -055
Treated + -0050 -101
Control variables
Fixed effect
Standard error
Adj R-squared
Observations
0049 0043 0054
257 257 257
Industry Industry Industry
Huber-White Huber-White Huber-White
Dependent variable ΔAvg Regular dividendNet payout
Model (1) Model (2) Model (3)
Yes Yes Yes
0154 0151 0156
362 362 362
Industry Industry Industry
Huber-White Huber-White Huber-White
This table investigates the causal effect of option-based pay on payout mix for firms using both dividend and repurchase by examining
whether the changes of payout mix around FAS123R vary with its potential accounting impact Panel A reports the results of estimating
three two-period first-differencing models where for each firm we average its characteristics in Pre- and Post-FAS123R period In all three
specifications the dependent variable is the change of average Regular dividendTotal payout from Pre- to Post-FAS123R period The main
independent variable varies by model in Model (1) the Accounting impact rank is the quartile rank of implied option expensetotal assets
measured in 2002 (1=lowest 4=highest) In Model (2) Accounting impact rank=2 (3 4) is an indicator that takes value of one if the firmrsquos
Accounting impact rank equals 2 (3 4) In Model (3) we use an alternative treatment construction following Bakke et al (2015) where
Treated is an indicator that takes value of zero if the firm granted zero option to its CEO in both 2003 and 2004 or the firm began to
voluntarily expense option-based pay at fair value in 2002 or earlier and one otherwise Panel B reports the regressions with the change of
Regular dividendNet payout as the dependent variable and the same independent variables as in Panel A Panel A (Panel B) is based on
observations with nonzero regular dividend and repurchase (net repurchase) in both Pre- and Post-FAS123R period All models in Panel A
and B have industry fixed effects and the standard errors are Huber-White heteroscedasticity-consistent standard errors All variables are
defined in Appendix The notation and indicates statistically significant at 10 5 and 1 level respectively
Yes Yes Yes
Dependent variable ΔAvg Regular dividendTotal payout
Model (1) Model (2) Model (3)

7
effect because they can mitigate it by directly monitoring payout choices andor adjusting
compensation packages
Our study contributes to a vast literature on the determinants of payout policy First while
many studies document an association between option-based pay and payout policy limited
attempts have been made to examine its causal nature8 Addressing this question will enhance our
understanding of temporal changes in payout policy such as the emergence of repurchases as
primary payout vehicle (Farre-Mensa et al 2014) and the recently observed lsquoresiliencersquo of
dividends (Floyd et al 2015) Using the plausible exogenous variation in ESO induced by
FAS123R our evidence calls into question the notion that option-based compensation is a first-
order driver of payout policy and challenges future research to consider alternative explanations
for the trends in corporate payouts Second we extend the research that examines how
institutional changes affect payout policy Most of these studies examine changes in dividend tax
rates (eg Chetty and Saez 2005 Brown Liang and Wesibenner 2007 Aboody and Kasznik 2008
Blouin Raedy and Shackelford 2011 Hanlon and Hoopes 2014) or in the information environment
(Hail Tahoun and Wang 2014) while we examine a new accounting standard that affected the
composition of executive pay
We also contribute to a recent stream of research that uses exogenous shocks to understand
the economic impact of option-based pay (Low 2009 Gormley Matsa and Milbourn 2013) Some
of these studies use FAS123R to examine the causal effect of option-based pay on risk-taking with
mixed findings (Chava and Purnanandam 2010 Hayes Lemmon and Qiu 2012 Bakke et al 2015
Chu and Ma 2015) We extend this research in two ways First we use FAS123R to examine the
8 A notable exception is Shue and Townsend (2014) who instrument change in option grants with predicted new
option grant cycle and find that dividend growth is slower in the first year of a new option grant cycle than other years
An important premise underlying this approach is that the outcomes respond almost instantaneously to the treatment
In this paper we are more concerned with the longer-term effects of ESO as payout tends to be sticky and may
respond to the treatment only gradually (Lambert et al 1989)
8
effect of option-based pay on a different yet important economic outcome payout policy Second
our metholodogy differs from prior studies in that it explicitly incorporates cross-sectional
variation in how firms were affected by FAS123R Future work may use this approach to examine
the effect of option-based pay on other corporate policies
Finally we extend the literature on how accounting rules impact a firmrsquos economic
behavior (eg Carter and Lynch 2003 Carter et al 2007 Bens and Mohanan 2008 Choudhary
Rajgopal and Venkatachalam 2009 Graham Hanlon and Shevlin 2011) as well as the literature on
the accounting treatment for stock options (Aboody 1996 Dechow Hutton and Sloan 1996
Aboody Barth and Kasznik 2004 Ferri and Sandino 2009)
2 Research Design
21 Empirical Strategy
It is commonly recognized that identifying the causal effects of executive compensation in
empirical studies is challenging (Edmans and Gabaix 2015) FAS123R provides a unique
opportunity to address this problem Aside from significantly reducing the use of option
compensation the accounting change should not in itself correlate with the outcomes of interest
(ie change in payout policy)9 However utilizing FAS123R is not easy because it affected all
US firms at the same time making it difficult to measure a counterfactual change around the
event based on a control group A simple before-after comparison of the outcome variable around
the adoption of FAS123R would assume that any change is driven entirely by the event of interest
(ie it would assume away any conterfactual trend in the outcome variable) a questionable
assumption An alternative strategy is to use the change in option-based compensation around
9 Hayes et al (2012) describes FAS123R as an exogenous change in the accounting benefits of stock options without a
change to the economic costs and benefits of stock options while Bakke et al (2015) describes it as causing a change
in executivesrsquo but not shareholdersrsquo incentives
9
FAS123R effectively assuming that such change is ldquoexogenousrdquo (eg Chava and Purnanandam
2010 Anantharaman and Lee 2014) The problem with this approach is that FAS123R per se did
not generate exogenous cross-sectional variation in option compensation Even if the introduction
of FAS123R is exogenous a firmrsquos response cannot be assumed to be entirely exogenous10
To identify the exogenous portion of firmsrsquo response to the new standard we make use of
evidence that FAS123Rrsquos impact on the use of option compensation varies with the firm-specific
expected accounting impact of the new rule as measured by the implied option expense disclosed
in the footnotes prior to FAS123R (Hayes et al 2012) The reduction in option usage is highest in
firms with the largest implied option expense Thus we can use the differential accounting impact
of FAS123R to overcome the problem of lacking control group
To validate our approach we estimate the following first-differencing regression with
ordinary lease square (OLS)
ΔOptioni = β0 + β1 Accounting Impacti + ΛControli +εi (1)
where ΔOptioni is the change in the average value of executive stock options as percentage of total
pay from the pre- to the post-FAS123R period Accounting Impacti is the implied option expense
measured prior to FAS123R (more details in Section 22) We expect β1 to be negative that is a
more pronounced reduction in option-based pay for firms with higher expected accounting impact
Next after validating the differential impact of FAS123R we examine the central question
of this study by estimating the following OLS regression
ΔPayouti = γ0 + γ1 Accounting Impacti + ΓControli +ui (2)
10 A universally assigned encouragement to receive treatment does not make the realization of treatment assignment
free from endogeneity concerns Consider the following example after the adoption of FAS123R firm A reduces the
weight of option-based pay by 20 and firm B by 40 A finding that firm B increases dividends compared to firm A
cannot be interpreted as evidence of a causal influence of option compensation on dividend policy This is because the
additional reduction in option compensation by firm B relative to firm A may not be driven by FAS123R It may
instead reflect an attempt to align executivesrsquo incentives with anticipated changes in dividend policy (reverse
causality) Without a way to incorporate the heterogeneous impact of FAS123R in the research design the cross
sectional variation in changes in option-based compensation is still subject to the usual endogeneity concerns
10
where ΔPayouti represents the change in the average value of one of the payout variables
of interest (described in Section 23) from the the pre- to the post-FAS123R period
Eq (2) is essentially a difference-in-difference approach to estimate the effect of option-
based pay on payout policy using the differential accounting impact of FAS123R to capture the
exogenous (accounting-induced) portion of the change in option-based pay If option-based pay
has a detectable causal effect on dividends (repurchases) in the direction predicted by the
literature γ1 should be positive (negative)
As noted by Bertrand Duflo and Mullainathan (2004) in difference-in-difference studies
with panel data OLS may yield inconsistent standard error estimates because the dependent
variable and the main independent variable tend to be serially correlated within firm To alleviate
this concern following Bertrand et al (2004) in both Eqs (1) and (2) we collapse the panel to a
single ldquoPrerdquo (2003-2004) and a single ldquoPostrdquo (2005-2007) period by averaging across years and
then measuring the changes from Pre to Post11 We choose 2003 as the starting period in order to
capture a period subsequent to the 2003 tax cut on individual dividend income While the
evidence on the effect of the tax cut on payout policy is mixed (Chetty and Saez 2005 Edgerton
2013 Floyd et al 2015) starting with 2003 allows the pre-FAS123R levels of the key variables to
reflect any effect of the tax cut 12 We end our analysis in 2007 to avoid the potentially
confounding effect of the 2008 financial crisis which had a significant impact on payouts (Floyd et
al 2015)13 Following Hayes et al (2012) and Bakke et al (2015) we include 2005 in the Post
11 In the collapsed two-period panel a regression of changes is equivalent to a regression of levels with firm-fixed
effects and an indicator for the Post period Both approaches obviate unobserved time-invariant firm heterogeneity
We choose first differencing equation for a more intuitive interpretation 12 The Jobs and Growth Tax Relief Reconciliation Act of 2003 was signed into law on May 28 2003 but had been
proposed on January 7 2003 and was made retroactive to the beginning of 2003 Chetty and Saez (2005) show that
the tax change affected dividend policy in 2003 13 In November 2006 the Securities and Exchange Commission required more details about the terms of performance-
based incentive plans We are not aware of any evidence that these rules affected the weight of option-based pay
11
period because FAS123R while effective in June 2005 was released in December 2004 14
Alternatively in untabulated tests we exclude 2005 from the analysis and obtain similar results
Another benefit of using a single Pre and Post period is that it is better suited than panel
data to the analysis of repurchases As noted by Skinner (2008) firms engaging in repurchases
tend to do so every other year thus the relation between repurchases and economic determinants is
stronger over two- or three-year periods than one-year periods Factors explaining the timing of
repurchases differ from those explaining their level and the year-to-year variation in repurchases is
not necessarily informative of changes in payout policy As we are not interested in the timing of
repurchases our approach seems to better capture ldquolong-runrdquo changes in payout policy However
for the analysis of dividends (which are generally paid every year and thus not subject to the
above problem) we also present the results using a panel regression with firm- and year-fixed
effects To alleviate the problem of serial correlation discussed earlier we cluster the standard
errors by firm
22 Accounting Impact
As noted earlier all firms were affected by FAS123R making it difficult to identify a
control sample To capture variation in the cross-sectional impact of FAS123R in Eqs (1) and (2)
we use Accounting Impacti defined as the implied option expense disclosed in the footnote of the
income statement for the 2002 fiscal year scaled by total assets (we obtain similar findings when
scaling it by revenues) We measure this variable in 2002 (ie before the Pre period) rather than in
2003 or 2004 to avoid any confounding effect from the expected adopion of FAS123R (see
discussion in Section 33) As this variable is highly skewed (see Table 1) we define it based on
(Gipper 2015) or had any effect on payout policy However we exclude 2007 from the Post period in robustness tests
Our inferences are unchanged 14 FAS123R was released in December 2004 effective as of the beginning of the first interim or annual reporting
period beginning after June 15 2005 Subsequently the SEC allowed a six-month deferral making the standard
effective for fiscal years beginning after December 15 2005
12
its quartile rank We also presents results with separate indicators for the top three quartiles in
order to better isolate the difference between top quartile (the most lsquotreatedrsquo group) and bottom
quartile (the least lsquotreatedrsquo group and thus closer to the notion of a control group)
An alternative way to address the issue of a lack of control group is suggested by Bakke et
al (2015) They argue that two sets of firms were likely lsquounaffectedrsquo by FAS123R (i) firms that
did not grant options to the CEO in 2003 and 2004 as in these firms FAS123R could not affect
CEO option pay and thus her incentives to make policy changes (ii) firms that were already
voluntarily expensing stock options as of 2002 (ie before FASB began discussions of the new
standard) as these firms would not face any additional accounting charge under FAS123R
Our approach offers a number of advantages First instead of collapsing all lsquonon-controlrsquo
firms in a single lsquotreatedrsquo group we exploit cross-sectional variation among treatment firms in
terms of the likely impact of FAS123R effectively using the most and least affected firms
(respectively top and bottom quartile of implied option expense) as treatment and control group
As shown in Table 1 the implied option expense is highly skewed (ie only a relatively small
number of firms was heavily affected by FAS123R) Capturing this variation is likely to increase
the power of the test Second in Bakke et al (2015) what matters is that the treatment definition
captures an accounting-driven change in CEO option grants as their focus is on CEO risk-taking
incentives In our setting we want to capture an accounting-driven change both in CEO option
grants (predicted to affect incentives to use dividends) and in the overall use of stock options
(predicted to affect the use of repurchases) As noted in Section 31 (see footnote 20) many firms
without CEO option grants in 2003 and 2004 were issuing options to non-CEO executives and
other employees and thus facing a potential accounting charge under FAS123R Third about half
of the firms without CEO option grants in 2003 and 2004 issued options to the CEO in the Post-
13
period Hence it is not clear that the control firms were truly unaffected by FAS123R Finally
the implied option expense in 2002 (our measure of the expected accounting impact) is a function
of option grants made in prior years when firms could not anticipate the adoption of FAS123R In
contrast option grant decisions in 2003 and 2004 may be affected by its anticipated adoption as
FASB added accounting for stock-based compensation to its agenda in March 2003
Notwithstanding the above arguments throughout our study we also present the results
using the definition of treatment and control in Bakke et al (2015) In particular we modify Eqs
(1) and (2) by replacing Accounting Impact with Treated an indicator equal to zero for the two
groups of firms identified as lsquocontrolrsquo in Bakke et al (2015) and one for all other firms
23 Payout Variables and Control Variables
Following Brown et al (2007) our baseline measure for changes in dividends is the change
in the DividendAssets ratiomdashcomputed as the regular cash dividends paid during the year scaled
by total assets at the beginning of the yearmdashfrom the Pre to the Post period15 However the
dividend-to-asset ratio is not what managers focus on when making dividend policy decisions
The stability of dividend per share (DPS) among dividend-paying firms (hereinafter payers)
suggests that managers do not target a specific dividend-to-assets ratio but rather a DPS level
(Baker and Wurgler 2016) Survey evidence confirms that executives make dividend policy
decision in terms of changes to the current level of DPS (Brav et al 2005) Therefore we also
examine the percentage change in the average DPS from the Pre to the Post period However this
measure can only be computed for the subset of payers (defined as firms with non-zero DPS in at
15 An alternative choice would be to scale dividends by the market value of equity essentially computing a dividend
yield However a drawback of using the dividend yield in our setting is that after controlling for time-invariant firm
characteristics through fixed effects or first differencing the variation of the ratio comes mainly from the denominator
the stock price (Baker and Wurgler 2004) Thus we choose the more stable book value of total assets as denominator
Also similar to other studies (eg Fenn and Liang 2001) we focus on regular dividends and exclude special dividends
as they are very rare and may introduce large noise to the dividend measures for few observations (DeAngelo
DeAngelo and Skinner 2000)
14
least one of the years of the Pre period) To provide insights into FAS123Rrsquos effect on dividend
policy for non-payers we examine the relation between our Accounting Impact variable and the
rate of dividend initations in the Pre and Post periods
Our main measure for repurchases is the change in RepurchaseAssetsmdashthat is the
aggregate amount of common stock repurchases made during the year scaled by total assets at the
beginning of the yearmdashfrom the Pre to the Post period In the empirical tests we examine
variations suggested in the literature
Finally as an alternative to examining dividends and repurchases separately we also look at a
measure of the payout composition the change in the DividendsTotal Payout ratio from the Pre to
the Post period (Total Payout is the sum of dividends and repurchases) effectively capturing any
substitution effect between dividends and repurchases 16 Examining the causal effect of the
change in option-based pay on payout composition is especially relevant if managers first target a
total payout and then choose the relative weight of dividends and repurchases In practice it is
unclear to what extent managers act this way (Brav et al 2005) Nonetheless for completeness we
also examine this variable We focus on the subsample of firms with both dividends and
repurchases in both Pre and Post period so as to capture changes in payout mix by firms routinely
using both vehicles to return cash to shareholders
As for the control variables in both Eqs (1) and (2) Controli is a vector of firm characteristics
identified in existent literature as determinants of payout policy (eg Fenn and Liang 2001 Brown
et al 2007 Skinner 2008 Cuny et al 2009) firm size book-to-market leverage asset tangibility
free cash flows cash holdings volatility in operating income institutional ownership sales
16 Fama and French (2001) suggest that repurchases are often complement to dividends while Grullon and Michaely
(2002) document that the increase in share repurchases over the past decades has come at the expense of a lower
increase in dividends consistent with a substitution hypothesis Brown et al (2007) also provide evidence of a
substitution effect in response to the 2003 dividend tax cut Survey evidence in Brav et al (2005) suggests an
asymmetric substitution effect with managers more willing to replace dividends with repurchases than the opposite
15
growth past stock returns and an indicator for loss firms For all of these variables we include
both changes from Pre to Post period and levels in the Pre period to allow for the possibility that
levels of these variables affect subsequent changes in payout policy 17 Finally we include
industry-fixed effects (Fama-French 48 industry indicators) to control for industry-level trends in
payout policies and option-based pay In unreported tests we replace free cash flows with two
separate variables operating profit and capital expenditures We also replace volatility in
operating income with volatility in stock returns Our results are unaffected More detailed
definitions of each variable are in the Appendix
24 Identification Assumption
The key identifying assumption underlying the difference-in-difference estimation
technique is that the parallel trends assumption is satisfied In the absence of treatment both
treated and control firms should experience parallel trends in the outcome variable Our approach
assumes that in the absence of FAS123R the change in dividends or repurchases would be the
same for high and low accounting impact firms Note that the well-documented contemporaneous
correlation between levels of option compensation (a key driver of the implied option expense and
thus the accounting impact) and levels of payout variables does not violate our identification
assumption This is because our assumption pertains to the relation between the level of option
compensation and future changes in payout variables
A specific concern is that options may be granted in anticipation of expected future
changes in payout policy (reverse causality problem) Relative to simple association tests this
concern is significantly reduced in our setting because the accounting impact is measured three
years prior to the arrival of treatment and is the result of option grants made over the prior four or
17 In untabulated analyses we run our tests after excluding changes in the control variables (ie including only their
pre-treatment levels) since in difference-in-difference studies controlling variables measured after the shock may
reintroduce selection bias Our inferences remain unchanged
16
five years depending on the vesting schedule18 For the reverse causality to be plausible the
implied option expense in 2002 (the result of option grants made approximately between 1998 and
2002) needs to reflect the anticipated change in payout policy in 2005-2007 This seems unlikely
While the parallel trend assumption is not directly testable similar to other studies (Bakke
et al 2015) we examine the trends in dividends and repurchases during the Pre period Figure 1
suggests that high and low accounting impact firms (respectively top and bottom quartile of
implied option expense) exhibit similar trends in payout variables in the Pre period ie from 2003
to 2004 More formally to examine the correlation between Accounting Impact and trends in the
payout variables during the Pre period we estimate the following regression only with
observations in 2003 and 2004
Payouti = γ0 + γ1 Accounting Impacti FY2004+ γ2 FY2004+ ΓControli +Firm FE +ui (3)
where Payouti is either DividendAssets or RepurchaseAssets FY2004 is an indicator of
fiscal year 2004 Firm FE indicates firm-fixed effects If firms with varying degrees of accounting
impact have different payout trends before the adoption of FAS123R γ1 should be different from
zero However for both payout variables we find that the estimated γ1 is close to zero and not
statistically significant at 10 level (untabulated tests) Overall the parallel trends assumption
seems reasonable in our setting
3 Empirical analyses
31 Sample Selection and Summary Statistics
Our sample is the SampP 1500 firms with available data on implied option expense (from
Compustat) and on executive compensation (from Execucomp) for at least one year in the Pre
18 The accounting treatment for stock options requires their fair value at the grant date to be recognized over the
service period (usually the vesting period) Hence the implied option expense in a given year includes a fraction of
the expense associated with past option grants
17
period and one year in the Post period to ensure consistency in the sample across periods Similar
to prior studies on payout policy (Fama and French 2001 Skinner 2008) we exclude financial
firms (SIC code between 6000 and 6999) and utilities (SIC between code 4900 and 4999) as well as
firms not incorporated in the US Our final sample includes 1176 firms19 We obtain dividend
and stock returns data from CRSP stock repurchases and dividend per share data from
COMPUSTAT and institutional ownership data from Thomson Reuters 13F database Other
control variables are from CRSP and COMPUSTAT To deal with outliers we winsorize all
continuous variables at 1 and 99 by fiscal year A detailed definition of all variables and their
sources is in Appendix
Table 1 Panel A presents summary statistics of the relevant variables for the pooled sample of
5653 firm-year observations Implied option expense in 2002 (our proxy for Accounting Impact)
is on average 173 of total assets with the median at 052 This suggests that the accounting
impact is very large for a small number of firms Over the entire sample period on average
dividends represent 093 of total assets while repurchases represent 394 Untabulated
analyses indicate that in 16 of the firm-year observations only dividends are paid out in 25
only repurchases in 32 both and in 27 neither Within the subset of firm-years with a payout
dividends represent 3874 of total payout This data confirms prior evidence that repurchases
have assumed the primary role as a vehicle to return cash to shareholders (eg Floyd et al 2015)
The mean (median) total executive pay (average across the top 5 executives) is $25 million ($16
million) On average option grants and restricted stock grants represent respectively 283 and
141 of total pay while salary and bonus comprise 296 and 197 respectively The
19 The results presented in the study are similar when (i) we restrict the sample to firms with available data for the
entire (2003-2007) sample period (1009 firms) and (ii) we exclude firms with CEO turnover in the Post period
(reducing the sample size to 780 firms) as a new CEO may have a different compensation package andor adopt a
different payout policy
18
composition of CEO pay (untabulated) is similar As for the control variables the figures are
generally consistent with other studies examining SampP 1500 firms over the same period
Panel B reports the pairwise Pearson correlations among the relevant variables The
correlations are in line with the associations documented in prior studies For example larger
firms and firms with higher profitability (free cash flows) have higher payouts loss firms have
lower payouts greater volatility in operating income is associated with lower dividends
More relevant to our analysis Panel C presents the mean of each variable in the Pre and Post
period for the full sample For each variable we first compute the firm-level mean over the Pre
and the Post Period and then compute the mean of the resulting figure across all firms There is a
striking increase in repurchases which double from 245 to 490 of total assets causing a
similar increase in total payout The increase in dividends is much smaller from 083 to 099
of total assets As a result for firms with positive payout dividends become a smaller fraction of
total payout in the Post period (2790 versus 3914 in the Pre period) This trend is consistent
with Floyd et al (2015) who document a dramatic increase in repurchases in the years leading to
the 2008 financial crisis Consistent with previous studies around FAS123R there is a significant
reduction in option grants as a fraction of total executive pay (from 343 to 240) and a
corresponding increase in the use of restricted stock (from 87 to 176) with little variation in
the weight of salary and bonus (note that restricted stock salary and bonus were expensed both
before and after FAS123R) Similar patterns hold for the composition of CEO pay (untabulated)
Compared to changes in the mix of executive pay changes in the levels of control variables are
generally less pronounced
Panel D reports the change in the key compensation and payout variables from the Pre to the
Post period by quartiles of implied option expense and yields a number of insights First
19
confirming the skewness suggested by Panel A the mean implied option expense is 551 for
firms in the top quartile versus only 093 035 and 012 for firms in the second third and
bottom quartile respectively Second as expected firms with higher implied option expense have
greater use of option-based pay For example in the Pre-period option pay represents 507 of
total executive pay at firms in the top quartile versus 201 in the bottom quartile Third and
more importantly for our research design the use of option pay changes significantly from the Pre
to the Post period as a function of the accounting impact For firms in the top quartile the
percentage of total pay represented by stock options drops by 182 (from 507 to 325)
versus 113 80 and 34 for firms in the second third and bottom quartile respectively The
decline in option usage across quartiles is accompanied by an increase in restricted stock grants
while the weight of salary and bonus shows little change It is important to emphasize the
substitution of stock options with restricted stocks because restricted stocks typically pay
dividends (Zhang 2013) thus providing further reason to expect a dividend increase in response to
the FAS123R-induced decline in option pay
As for the payout variables Panel D suggests that heavy option users (firms with higher
implied option expense) generally use repurchases more than dividends consistent with the
associations documented in earlier studies In the Pre period repurchases (dividends) represent
351 (030) of total assets for the top quartile versus 113 (112) for the bottom quartile
Panel D also indicates that the increase in repurchases documented in Panel C takes place across
all quartiles As for the (much smaller) change in dividends the absolute increase is similar across
the four quartiles though the relative increase (the percentage change) appears to be slightly
higher in the top quartile Overall these figures do not suggest a shift toward dividends and away
from repurchases by firms with a large (accounting-induced) decline in the use of option pay
20
Panel E presents the same data as Panel D but based on the definition of lsquotreatmentrsquo and
lsquocontrolrsquo in Bakke et al (2015) Under this definition 997 firms are classified as treatment group
and 177 as control (171 firms are classified as lsquocontrolrsquo because they did not grant options to the
CEO in the Pre period and 6 because they were voluntarily expensing options before 2003)
Interestingly lsquotreatedrsquo firms are equally distributed across the quartiles suggesting significant
variation in the degree of treatment As discussed earlier one benefit of our approach is that it
exploits cross-sectional variation among treatment firms in terms of the likely impact of FAS123R
Also 40 of the control firms (71 out of 177) are in the lowest quartile while 35 ((37+25)177)
are in the top two quartiles reflecting the different focus of the two approaches in terms of
identifying firms less affected by FAS123R20
As for payout and compensation variables Panel E shows that the treated group experiences a
larger increase in repurchases than the control group while the (less pronounced) increase in
dividends is similar across treated and control firms Treated firms experience a 126 decrease in
option pay (from 387 to 261) with a corresponding 94 increase in the weight of restricted
stock grants (from 80 to 174) The figures are similar at the CEO level (because the
classification is based on options grants to the CEO it is useful to report pay figures at both the top
5 executives and the CEO level) Interestingly the control group experiences a pronounced
increase in the weight of option grants in total CEO pay from 10 to 127 as almost half of the
control firms issued options to their CEOs in the Post period (for these firms options as percentage
of total CEO pay increased from 0 to 254 untabulated analysis) While this increased use of
stock options suggests (ex post) that these firms were not concerned with the impact of FAS123R
another possibility is that the lack of use of option compensation for CEOs in 2003 and 2004 was
20 In untabulated analysis we find that 55 of the 171 firms issuing no options to the CEO in the Pre period granted
options to the other top executives (and perhaps to other non-executive employees) thus explaining the relatively high
implied option expense for the control group (10 versus 19 for the treatment group ndash see Panel E)
21
temporary rather than the effect of a permanent policy If these firms were planning to issue
options to the CEO in the Post period the assumption that they were unaffected by FAS123R (and
thus their use as control sample) is questionable21
32 Differential Impact of FAS123R on the Use of Option-Based Compensation
An important building block of our approach is the presumed differential impact of FAS123R
on option-based pay as a function of pre-existing implied option expense22 While Table 1 Panel
D preliminarily supports the validity of this assumption we formally examine it by estimating Eq
(1)
As reported in Table 2 Panel A we find a significant negative association between Accounting
Impact and the change in option-based pay around the adoption of FAS123R In column (1)
where we use the quartile rank of implied option expense the -0044 coefficient implies that
around FAS123R option grants over total pay decline by 44 as we move from the highest
quartile to the next Thus the reduction in top quartile firms is 132 larger than in bottom
quartile firms In column 2 we replace the quartile rank with three indicators for the highest
quartiles (with the bottom quartile collapsed in the intercept) so as to be able to compare directly
top and bottom quartile without imposing the same effect across quartiles The negative and
significant coefficient on the top quartile indicator at -0140 suggests that the reduction in option
grants over total pay is 140 larger for top quartile firms relative to bottom quartile firms
Finally in column 3 we use the indicator for treated firms following Bakke et al (2015) The
21 Panel E also shows an increase in the use of restricted stock in CEO pay packages (from 128 to 182 almost
comparable to the increase among treated firms) The concurrent increase in options and restricted stock suggests
these firms would have increased option pay significantly more had it not been for FAS123R indicating further
caution in classifying them as control group of unaffected firms 22 This is akin to the relevance assumption of instrumental variable if we interpret the implied option expense as an
instrument to the change in option-based pay
22
negative and significant coefficient at -0132 suggests that treated firms experience a 132
larger drop in the weight of option pay relative to control firms
In Panel B we re-estimate Eq (1) using a panel regression with firm- and year-fixed effects
(5653 firm-year observations) where the dependent variable is the the ratio of option grants to
total executive pay The results are virtually identical in terms of significance and magnitude of
the coefficients of interest (the interaction terms between respectively Accounting impact and
Treated and an indicator for the Post period)
Overall Table 2 suggests that high implied option expense and the introduction of FAS123R
together strongly encouraged firms to cut back option-based compensation for executives It also
supports the general validity of the approach in Bakke et al (2015) in identifying firms most
affected by FAS123R notwithstanding the concerns outlined earlier
Our test of Eq (1) focuses on executive stock options For our dividend-protection hypothesis
it is important to establish that the level of implied option expense predicts a change in executive
stock options (rather than only a change in the use of non-executive employee stock options) as we
want to capture the effect of a change in executivesrsquo incentives on payout policy At the same
time our dilution channel hypothesis assumes a change in the use of all (executive and non-
executive employee) stock options Thus in untabulated analyses we repeat the test in Eq (1) by
replacing the dependent variable with the change in the number of options granted to all
employees (scaled by the total number of outstanding shares note for this analysis we can only
use data from 2004 to 2007 because Compustat began reporting data on ESO in 2004) The
coefficient on Accounting Impact and Treated continues to be negative and significant suggesting
that the differential reduction in the use of option compensation as a function of accounting impact
23
occurred for both executive and non-executive employee stock options Indeed Brown and Lee
(2011) report a similar decrease in executive and employee stock options around FAS123R
33 Option-Based Pay and Dividend Payouts
In this section we examine the effect of an exogenous (accounting-induced) change in option
compensation on dividend policy by estimating Equation (2)
Table 3 Panel A presents the results using the change in dividends from Pre to Post as
dependent variable We find no significant association between Accounting Impact (column 1 and
2) or Treated (column 3) and the change in dividends around the adoption of FAS123R This is in
stark contrast with the negative effect of option-based pay on dividends predicted in the literature
and documented in various association studies
One concern with this lack of effect is that perhaps our setting is not powerful enough to detect
it One way to examine this possibility is the following The coefficient on Accounting Impact
rank=4 in column 2 is 0001 and the standard error (SE) is 00009 Assuming the estimated
standard error is correct then for a two-tailed t test the coefficient needs to be greater than 00015
(=SE1645) or 015 to reach the 10 percent significant level In other words if moving from
the bottom to the top quartile (which predicts a 14 differential decline in option based pay as per
Table 2 Panel A) resulted in a 015 increase of the dividendasset ratio our test would be able to
detect a causal effect of option-based pay on dividends Given the unconditional mean of the
dividendasset ratio at 093 an increase of 015 from the Pre to the Post period seems
plausible In fact the average increase from the Pre to the Post period is 016 (Table 1 Panel C)
Thus if an effect was there our test should detect it
24
Panel B presents the results using a panel regression (5653 firm-year observations) with firm-
and year-fixed effects and interaction terms between Accounting Impact (or Treated) and an
indicator for the Post period Our inferences are unchanged
These analyses are based on our full sample which includes both dividend-paying and non-
dividend-paying firms Hence they implicity treat as equal two potentially different decisions to
initiate dividends and to increase dividends For example an increase in the dividend-to-asset
ratio from 05 to 06 will be treated the same as an increase from 00 to 01 even though
the latter represents a critical dividend initiation decision23 To address this following Chetty and
Saez (2005) we separately examine how FAS123R impacts the intensity of dividend changes (for
the subset of payers) and the likelihood of dividend initiations (for the subset of non-payers)
331 Option-Based Pay and Dividend Payouts Intensity of Dividend Changes
In the first row of Panel C we repeat the analysis in Panel A for the sub-sample of 572 payers
defined as firms with positive DPS in 2003 andor 2004 Note that we report only the coefficients
of interest for parsimony In the second row we replace the dependent variable with the
percentage change in DPS DPS is the choice variable for managers (Brav et al 2005 Baker and
Wurgler 2016) and thus our preferred measure to capture changes in dividend policy To account
for skewness in this variable (Khale 2002) in the third fourth and fifth rows we use indicator
variables to denote whether the change in DPS surpasses a threshold respectively 20 40 and
60 The proportion of firms that surpass these thresholds are 59 44 and 33 respectively24
23 Initiating dividends is a critical decision for boards given the pre-commitment value that investors attach to this
decision and the strong negative market reaction when firms eliminate or reduce dividends (Brav et al 2005) For
executives trying to maximize the value of their own stock options (dividend-protection argument) the ability to
influence a dividend initiation decision is likely lower than the ability to influence a dividend increase decision 24 Although in the third fourth and fifth rows our dependent variable is a binary variable we use a linear model (OLS)
instead of a probit or logit nonlinear model The reason is that estimating fixed effects in binary response models with
panel data can cause the incidental parameters problem The coefficient estimates can be biased when the panel data
25
Across all of these specifications we find no association between Accounting Impact or Treated
and the intensity of dividend changes Thus it does not appear that an exogenous reduction in
option-based pay caused dividend-paying firms to increase dividends
In Panel D we perform four robustness tests For parsimony we show only the coefficients of
interest and only the cases where the dependent variable is an indicator denoting a greater than
40 increase in DPS The results are similar for the other four ldquointensityrdquo dependent variables
reported in Panel C
In the first row we exclude firms that began to voluntarily expense options in 2003 or 2004
(84 firms of which 68 are dividend payers) FASB added accounting for stock-based
compensation to its agenda in March 2003 and issued an Exposure Draft proposing the expensing
of stock options at fair value in March 2004 In anticipation a number of firms began to
voluntarily expense stock options in 2003 and 2004 (Aboody et al 2004) If these firms reduced
option grants and as a result increased dividends during the Pre period then their inclusion may
reduce the power of our tests and thus our ability to detect the hypothesized relation25
In a similar spirit in the second row we exclude firms in the top decile in terms of reduction in
the ratio of option grants to total pay for the top 5 executives between 2002 (the year prior to the
Pre-period) and 2004 (the end of the Pre-period) This encompasses 113 firms of which 55 are
dividend payers If these firms reduced option grants in anticipation of FAS123R and as a result
increased dividends during the Pre period their inclusion may reduce our ability to detect the
hypothesized relation
has a large number of observations but a short time series Examples of studies making a similar choice are Puri
Rocholl and Steffen (2011) and Chu and Ma (2015) 25 This is unlikely to be a serious concern as previous studies suggest that voluntary expensers made limited use of
stock options (Aboody et al 2004) In fact in our sample 79 of these firms are in the bottom two quartiles of
implied option expense (untabulated) Nonetheless we present this test for robustness
26
In the third row we exclude firms that accelerated the vesting of options before FAS123R
became effective in order to avoid recognizing an expense for the unvested portion of these
options (Choudhary et al 2009 Balsam Reitenga and Yin 2008) This encompasses 196 firms of
which 54 are dividend payers If accelerating vesting was used to reduce the impact of FAS123R
the inclusion of these firms may reduce the power of our tests26
In the fourth row we deal with the concern that if firms target a fixed dividend to net income
ratio (Lintner 1956) and do so without adjusting for changes in accounting standards then by
decreasing net income (via option expense) the accounting change would mechanically cause a
reduction in dividends This would potentially offset and confound the increase predicted under
the dividend-protection and dilution hypotheses This seems unlikely for two reasons First firms
are notoriously reluctant to cut dividends (Brav et al 2005) Hence it seems unlikely that they
would reduce dividends in response to a decline in net income with no economic or cash flow
implications (ie re-classification of an expense from the footnotes to the income statement)
Second firms today set dividends in terms of dividend per share rather than by targeting a net
income-based payout ratio (Brav et al (2005)) As noted by Skinner (2008) over the last few
decades as earnings have become more variable the relation between earnings and dividends has
become weaker with dividend payments increasing smoothly and largely independent of the
variation in earnings Nevertheless in the fourth row we exclude the 66 dividend-paying firms that
26 These firms explicitly stated that they accelerated the vesting of stock options to avoid the accounting charge
(Choudhary et al 2009) In fact 72 are classified in the top two quartiles of implied option expense (untabulated)
Thus we would have predicted these firms to experience a significant decline in option pay To the extent that this
decline did not materialize because they minimized the impact of FAS123R by accelerating vesting the ability of
Accounting Impact to predict the reduction in option pay and thus its usefulness in examining changes in dividends
around FAS123R may be reduced The list of firms accelerating vesting was kindly provided by Jack Ciesielsky of
The Analystsrsquo Accounting Observer
27
had a similar payout ratio in 2003 and 2004 as a proxy for firms with a target net income-based
payout ratio in the Pre period27
As shown in Panel D even after excluding these subsets of firms we continue to find no
association between Accounting Impact or Treated and changes in dividends for dividend-paying
firms This is inconsistent with a causal influence of option compensation on dividend policy
Another concern is that by reducing net income and thus retained earnings FAS123R
may have pushed some firms closer to violating dividend covenants in debt contracts and
thus prevented them from increasing dividends This would bias our study against finding a
causal effect of option-based pay on dividends However this does not appear to be a
significant concern for three reasons First the recognition of an option expense does not
imply a decline in net income In fact more than 70 (75) of the full sample firms
(dividend payers) experienced an increase in net income before extraordinary items from
2004 to 2005 (the percentages are similar across the four quartiles of implied option
expense) Second dividend covenants are less common among dividend-paying firms
(Nikolaev 2010) Third most loan contracts in recent years give parties the option to
ldquofreezerdquo GAAP when facing a mandatory change in accounting principles (Christensen and
Nikolaev 2009) Firms expecting an adverse impact of FAS123R on their dividend covenants
would likely exercise this option (particularly given the non-cash nature of option-based
expense) Nonetheless to alleviate this concern we perform three additional analyses
(untabulated) (i) we repeat the tests in Panel C after excluding firms with a drop in net
income between 2004 and 2005 (ie firms that perhaps faced some covenant-related
27 We define a ldquosimilarrdquo payout to be an absolute change in payout ratio of less than 1 from 2003 to 2004 Among
these 66 firms only 39 continued to have a similar payout ratio in 2005 We also try an alternative definition where
a firm is classified as likely to be using a net income-based target payout ratio if the absolute percentage change in the
ratio from 2003 to 2004 is less than 10 (100 firms) Our inferences are unchanged
28
constrains to their payout policy as a result of FAS123R) (ii) we explicitly control for net
income and retained earnings in the regression (as in Skinner 2008) (iii) we repeat the tests
in Panel C for dividend payers with dividendsasset ratio above the sample median on the
basis that dividend covenants are less frequent among firms paying large dividends (Jung
Lee and Yang 2016) Our inferences are unchanged
332 Option-Based Pay and Dividend Payouts Dividend Initiations
In this section we examine whether the accounting-driven change in option pay affected
dividend initiations among non-payers We cannot employ the difference-in-difference approach
adopted so far by definition the same firm cannot initiate dividends in both periods However we
can provide suggestive evidence as follows First we take all firms that did not pay dividends in
2002 and group them into quartiles based on 2002 implied option expense For each quartile we
find the number of firms initiating dividends in 2003 and 2004 (the Pre period) Next we take all
firms that did not pay dividends in 2004 group them into quartiles based on 2002 implied option
expense and for each quartile find the number of firms initiating dividends in 2005 and 2006 (the
Post period) We do not include 2007 so as to have the same number of years in both periods and
make the cumulative initiation rates comparable
The left portion of Panel E reports the results of this exercise There is a general decrease in
the dividend initiation rate from the Pre to the Post period This holds both in the full sample of
non-payers (from 129 to 79) and across all quartiles This decrease may reflect a temporary
spike in 2003 and 2004 in response to the 2003 dividend tax cut documented in Chetty and Saez
(2005) It is noteworthy that initiation rates in both periods are lower among firms with higher
implied option expense This is consistent with option-heavy firms being mostly high-growth
firms less inclined to pay dividends More relevant to our research question if the lower use of
29
option compensation increased the propensity to pay dividends we would expect to see a relative
increase (ie a lower decrease) in dividend initiations among firms with the highest accounting
impact Instead the rate does not differ depending on the accounting impact There is
approximatley a 5 decline in initiation rate in each quartile In the right portion of Panel E we
examine similar data for dividend terminations While the results should be interpreted with
caution due to their rarity firms with higher accounting impact do not experience a greater decline
in termination rates Our inferences in Panel E are similar when we compared treated and control
firms following Bakke et al (2015) (untabulated)
Even after taking into account the different nature of decisions for dividend paying and non-
dividend-paying firms we fail to find evidence of a causal influence of option-based compensation
on dividend policy This finding is in contrast to the associations documented in earlier studies It
is even more remarkable as most firms replaced stock options with restricted stock which are
generally dividend-protected and should provide further incentive to increase dividends28
34 Option-Based Pay and Repurchases
In this section we examine the effect of an exogenous (accounting-induced) change in option
compensation on repurchases by estimating Equation (2)
Table 4 Panel A presents the results using the change in repurchases (scaled by total assets)
from Pre to Post as a dependent variable If the use of option-based pay had a positive effect on
firmsrsquo propensity to engage in repurchases as posited by the dividend-protection and dilution
hypotheses we should find a negative association between Accounting Impact or Treated and
repurchases Firms with a higher (accounting-driven) reduction in option-based pay should reduce
28 In a sample of SampP 500 firms between 2000 and 2009 Zhang (2013) reports that 80 of the firms granting
restricted stocks offer dividend protection In that sense the FAS123R-induced shift from stock options to restricted
stock may be characterized as a ldquoshockrdquo to dividend protection in unearned equity pay Accordingly our results cast
doubt on the causal interpretation of the positive association between dividend protection and dividend payouts
documented in prior studies (Zhang 2013 Burns et al 2015 Minnick and Rosenthal 2015)
30
the use of repurchases either because they are shifting toward a greater use of dividends andor
because they have a lower need to offset the dilutive effects of stock options However we find no
significant association between Accounting Impact (columns 1 and 2) and the change in
repurchases around the adoption of FAS123R When we use the Treated indicator (column 3) we
find a significant positive association rather than a negative one In Panel B we repeat the analysis
using net repurchases (ie repurchases after removing the effect of share issuances) following
Fama and French (2001) and Skinner (2008) Our inferences are unchanged29
This test is subject to two important caveats The first is we may not detect a decline in
repurchases because in the Post period firms need to offset the exercise of options that were
granted during the Pre period That is a post-FAS123R reduction in grants may not (yet) translate
into a reduction in exercises during the Post period which reduces our ability to test the dilution
hypothesis (ie that firms repurchase shares to offset exercises)30 However we can examine a
variation of this hypothesis where firms use repurchases to manage the effect of unexercised
options on diluted EPS (Bens et al 2003) To do so in Panel C we use a measure of adjusted
repurchases where we subtract our estimate of repurchases undertaken to offset the exercise of
ESO31 We effectively test whether firms experiencing an accounting-induced decrease in option
grants engage in less repurchases (net of exercise-driven repurchases) because their need to
manage the effect of unexercised options on diluted EPS is lower However the coefficient on
the variables of interest is either insignificant or positive inconsistent with the hypothesis
29 In the case of repurchases we do not examine separately ldquoinitiationsrdquo and ldquointensityrdquo as we do for dividends
because initiation is not clearly defined for repurchases Unlike dividends the occurrence of a repurchase in a given
year (or the lack thereof) cannot be used to infer a general policy due to the more discretionary nature of the timing of
repurchases 30 To capture the effect of lower option-based compensation on option exercises and thus on repurchases we would
ideally extend the Post period beyond 2007 However as noted by Floyd et al (2015) repurchases declined
dramatically after 2007 because of the financial crisis making it difficult to detect the effect of any other factor 31 As upper bound estimate of exercise-driven repurchases we multiply the number of ESO exercised during the year
times the average stock price during the year Since the number of ESO exercised is available in Compustat starting in
2004 Panel C is based on observations from 2004 to 2007
31
A second important caveat is that most firms replaced stock options with restricted stock
(Table 2 Panel C) Unvested restricted stock is excluded from the denominator in the computation
of basic EPS (once vested it is included) However it is included in the denominator of diluted
EPS using the treasury stock method similar to stock options Given the complexity of this
method without access to all details of restricted stock grants and option grants it is difficult to
determine whether the switch from stock options to restricted stock decreased the need for
dilution-driven repurchases as our test implicitly assumes Hence it is possible that we do not find
a decrease in repurchases because a reduced need to offset the dilutive effect of stock options was
neutralized by an increased need to offset the dilutive effect of restricted stock
Subject to the above caveats the evidence in Table 4 is not consistent with a positive causal
relation between the use of option-based pay and repurchases More precisely it suggests that
option-driven dilution concerns do not have a first-order effect on the magnitude of repurchases
even though they may play a role in the repurchase decision Hence our result is not necessarily
in conflict with the evidence in Brav et al (2005) where two-thirds of the surveyed financial
executives state that offsetting the dilutionary effect of stock option plans or other stock
programs is an important factor to their repurchase decisions
35 Option-Based Pay and Payout Composition
As an alternative to examining dividends and repurchases separately we also look at the
payout composition the change in the DividendsTotal Payout ratio from the Pre to the Post period
where Total Payout is the sum of dividends and repurchases As noted earlier we focus on the
subsample of firms with both dividends and repurchases in both Pre and Post periods so as to
capture the change in payout mix by firms routinely using both vehicles to return cash to
shareholders If the use of option-based pay causes firms to substitute repurchases for dividends
32
we should find a positive association between Accounting Impact or Treated and the payout mix
defined as DividendsTotal Payout ratio Firms with a higher accounting-driven reduction in
option-based pay should have an increase (decrease) in the relative weight of dividends
(repurchases) to the total payout However as reported in Table 5 Panel A we fail to find a
significant association between Accounting Impact (column 1 and 2) or Treated (column 3) and
the change in payout mix The results are similar when we use Net Payout (dividends plus net
repurchases) instead of Total Payout in computing the payout mix (Panel B)
Overall the combined evidence in Tables 3-5 does not support the hypothesis that option-
based compensation has negative (positive) effect on dividends (repurchases) or that it causes
firms to replace dividends with repurchases
4 Conclusion
Prior literature has documented robust associations between option-based compensation and
payout policy yet it remains unclear whether this association reflcts a causal influence We
investigate the causal effect of option-based compensation on payout policy using the adoption of
FAS123R which resulted in a significant decrease in option grants making it a plausible
exogenous shock to the use of option-based pay To overcome the challenge of no control group
we exploit the fact that firms responded differently depending on the firm-specific accounting
impact as measured by the implied option expense disclosed in the footnotes prior to FAS123R
Firms with larger expected accounting impact curtailed option-based compensation much more
aggressively than firms with lower impact Using a sample of SampP 1500 firms we find no
evidence that firms with a larger accounting-induced decline in option compensation increased
dividends reduced repurchases or changed their payout composition contrary to the widely held
belief that option-based pay has a causal influence on payout policy
33
Appendix Variable Definitions and Data Sources
Accounting Impact Variables
Accounting impact Implied option expense (Compustat XINTOPT) divided by total assets
(Compustat AT) This variable is measured at fiscal year 2002 and is time-invariant
Accounting impact rank The quartile rank of Accounting impact (1=lowest 4=highest)
Payout Variables
Regular dividendTotal assets The numerator is total regular cash dividends in the fiscal year
from the distribution dataset in CRSP Regular cash dividends are identified by the distribution
codes 1212 1222 1232 or 1242 The denominator is one-year lagged total assets (Compustat
AT)
DPS Dividend per share (Compustat DVPSX_F)
DPS pct change The percentage change of average DPS from Pre- to Post-FAS123R period
DPS pct change gtX indicator A dummy variable that equals one if DPC pct change is greater
than X and zero otherwise
RepurchaseTotal assets The numerator is the repurchase of common equity which equals total
repurchase (Compustat PRSTK) minus the change in preferred stock redemption value
(Compustat PSTKRV) The denominator is one-year lagged total assets (Compustat AT)
Net repurchaseTotal assets Net repurchase removes the effect of share issuances The
construction follows Fama and French (2001) and Skinner (2008) if the firm uses the treasury
stock method for repurchase net repurchase equals the increase in common treasury stock
(Compustat TSTKC) if the firm uses the retirement method (when common treasury stock is zero
in the current and prior year) net repurchase equals total repurchases minus stock issuance
(Compustat SSTK) and change in preferred stock redemption value (Compustat PSTKRV)
When the above measures give negative value net repurchase is set to zero
Adjusted repurchaseTotal assets Adjusted repurchase removes from total repurchase the potential
effect of repurchasing exercised options This variable equals total repurchase of common stocks
minus the product between the number of options exercised (Compustat OPTEXD) and average
stock price during the year When the above measure gives negative value adjusted repurchase is
set to zero Since the number of options exercised is not available before 2003 we drop
observations in 2003 when we use this variable
34
Total payoutTotal assets the sum of Regular dividendTotal assets and RepurchaseTotal assets
Regular dividendTotal payout regular cash dividend divided by the sum of regular cash dividend
and repurchase from common equity In the two-period analysis (Pre- vs Post-FAS123R) we
separately sum the numerator and the denominator for each firm-period and then calculate the ratio
Regular dividendNet payout regular dividend divided by the sum of regular dividend and net
repurchase In the two-period analysis (Pre- vs Post-FAS123R) we separately sum the numerator
and the denominator for each firm-period and then calculate the ratio
Compensation Variables
Salary_$ Average salary (Execucomp SALARY) of the top 5 highest paid executives in $1000
Salary_ Average salary (Execucomp SALARY) divided by average total pay (Execucomp
TDC1) of the top 5 highest paid executives
Bonus_$ Average bonus (Execucomp BONUS) of the top 5 highest paid executives in $1000
Due to a data format change we add non-equity plan-based awards (Execucomp
NON_EQ_TARG) to this measure after 2006
Bonus_ Bonus_$ divided by average total pay (Execucomp TDC1) of the top 5 highest paid
executives
Option grant_$ Average option grant value (Execucomp OPTION_AWARDS_BLK_VALUE or
OPTION_AWARDS_FV) of the top 5 highest paid executives in $1000 Due to a data format
change we use OPTION_AWARDS_FV for this measure after 2006
Option grant_ Option grant_$ divided by average total pay (Execucomp TDC1) of the top 5
highest paid executives
Restricted stock grant_$ Average restricted stock grant value (Execucomp RSTKGRNT or
STOCK_AWARDS_FV) of the top 5 highest paid executives in $1000 Due to data format
change we use STOCK_AWARDS_FV for this measure after 2006
Restricted stock grant_ Restricted stock grant_$ divided by average total pay (Execucomp
TDC1) of the top 5 highest paid executives
Total pay_$ Average total pay (Execucomp TDC1) of the top 5 highest paid executives in $1000
35
Other Characteristics
Size The book value of total assets (Compustat AT) minus the book value of common equity
(Compustat CEQ) plus the market value of common equity from CRSP in $M
Log(size) the natural logarithm of size
Book-to-market the book value of common equity dividend by its market value
Leverage long term debt plus short term debt (Compustat DLTT + DLC) divided by total assets
Asset tangibility tangible assets (Compustat AT - INTAN) divided by total assets
Free cash flow Operating cash flow (Compustat OANCF) minus capital expenditure (Compustat
CAPX) then divided by lagged total assets
Cash holding Cash and short-term investments (Compustat CHE) divided by total assets
ROA volatility the standard deviation of returns on assets (operating income before tax divided by
lagged total assets) in the past five fiscal years
Institutional ownership the number of shares held by institutional investors divided by the number
of shares outstanding from Thomson Reuters Institutional Holdings database
Sales growth the growth rate of sales (Compustat SALE) from the prior year
Past stock return annual stock return from the prior year
Loss indicator a dummy variable taking value of one if the current net income is negative and
zero otherwise
36
References
Aboody David 1996 Market Valuation of Employee Stock Options Journal of Accounting and
Economics 22 357-391
Aboody David Barth Mary E and Ron Kasznik 2004 Firms Voluntary Recognition of Stock-
Based Compensation Expense Journal of Accounting Research 42 123ndash150
Aboody David and Ron Kasznik 2008 Executive stock-based compensation and firmsrsquo cash
payout the role of shareholdersrsquo tax-related payout preferences Review of Accounting Studies
13 216ndash251
Anantharaman Divya and Yong Gyu Lee 2014 Managerial risk taking incentives and corporate
pension policy Journal of Financial Economics 111 328ndash351
Baker Malcolm and Jeffrey Wurgler 2004 A catering theory of dividends Journal of Finance
59 1125-1165
Baker Malcolm and Jeffrey Wurgler 2016 Dividends as reference points a behavioral signaling
approach Review of Financial Studies 29 697-738
Bakke Tor-Erik Hamed Mahmudi Chitru Fernando and Jesus Salas 2015 The causal effect of
option pay on corporate risk management Journal of Financial Economics forthcoming
Balsam Steven Austin Reitenga and Jennifer Yin 2008 Option acceleration in response to SFAS
No 123 (R) Accounting Horizons 22 23-45
Bens Daniel and Steven Monahan 2008 Altering Investment Decisions to Manage Financial
Reporting Outcomes Asset-Backed Commercial Paper Conduits and FIN 46 Journal of
Accounting Research 46 1017-1055
Bens Daniel A Venky Nagar Douglas J Skinner and MH Franco Wong 2003 Employee stock
options eps dilution and stock repurchases Journal of Accounting and Economics 36 51ndash90
Bertrand Marianne Esther Duflo and Sendhil Mullainathan 2004 How much should we trust
differences-in-differences estimates The Quarterly Journal of Economics 119 249ndash275
Blouin Jennifer L Jana S Raedy and Douglas A Shackelford 2011 Dividends Share
Repurchases and Tax Clienteles Evidence from the 2003 Reductions in Shareholder Taxes
The Accounting Review 86 887-914
Brav Alon John R Graham Campbell R Harvey and Roni Michaely 2005 Payout policy in the
21st century Journal of Financial Economics 77 483ndash527
Brown Lawrence D and Yen-Jung Lee 2011 Changes in Option-Based Compensation Around
the Issuance of SFAS123R Journal of Business Finance amp Accounting 38 1053ndash109
37
Brown Jeffrey R Nellie Liang and Scott Weisbenner 2007 Executive financial incentives and
payout policy Firm responses to the 2003 dividend tax cut Journal of Finance 62 1935ndash
1965
Burns Natasha Brian McTier and Kristina Minnick 2015 Equity-incentive compensation and
payout policy in Europe Journal of Corporate Finance 30 85-97
Carter Mary Ellen and Luann J Lynch 2003 The Consequences of the FASBrsquos 1998 Proposal on
Accounting for Stock Option Repricing Journal of Accounting and Economics 35 51-72
Carter Mary Ellen Luann J Lynch and Irem Tuna 2007 The role of accounting in the design of
CEO equity compensation The Accounting Review 82 327ndash357
Chava Sudheer and Amiyatosh Purnanandam 2010 CEOs versus CFOs Incentives and
corporate policies Journal of Financial Economics 97 263ndash278
Chetty Raj and Emmanuel Saez 2005 Dividend taxes and corporate behavior Evidence from the
2003 dividend tax cut The Quarterly Journal of Economics 120 791ndash833
Choudhary Preeti Shivaram Rajgopal and Mohan Venkatachalam 2009 Accelerated vesting of
employee stock options in anticipation of FAS123R Journal of Accounting Research 47 105ndash
146
Christensen Hans B and Valeri Nikolaev 2009 Contracting on Mandatory Changes to GAAP
New Practice and Its Determinants Working Paper University of Chicago
Chu Yongqiang and Tao Ma 2015 How does management compensation affect bank risk taking
evidence from FAS 123R University of South Carolina Working Paper
Cuny Charles J Gerald S Martin and John J Puthenpurackal 2009 Stock options and total
payout Journal of Financial and Quantitative Analysis 44 391ndash410
DeAngelo Harry Linda DeAngelo and Douglas J Skinner 2000 Special Dividends and the
Evolution of Dividend Signaling Journal of Financial Economics 57 309-354
Dechow Patricia M Amy P Hutton and Richard G Sloan 1996 Economic consequences of
accounting for stock-based compensation Journal of Accounting Research 34 1ndash20
Edgerton J 2013 Four facts about dividend payouts and the 2003 tax cut International Tax and
Public Finance 20 769-784
Edmans Alex and Xavier Gabaix 2015 Executive compensation a modern primer Journal of
Economic Literature forthcoming
38
Fama Eugene F and Kenneth R French 2001 Disappearing dividends changing firm
characteristics or lower propensity to pay Journal of Financial Economics 60 3ndash43
Farre-Mensa Joan Roni Michaely and Martin C Schmalz 2014 Payout policy Annual Review
of Financial Economics 6 75ndash134
Fenn George W and Nellie Liang 2001 Corporate payout policy and managerial stock
incentives Journal of Financial Economics 60 45ndash72
Ferri Fabrizio and Tatiana Sandino 2009 The impact of shareholder activism on financial
reporting and compensation the case of employee stock options expensing The Accounting
Review 84 433ndash466
Floyd Eric Nan Li and Douglas J Skinner 2015 Payout policy through the financial crisis the
growth of repurchases and the resilience of dividends Journal of Financial Economics 118
299-316
Frydman Carola and Dirk Jenter 2010 CEO compensation Annual Review of Financial
Economics 2 75-102
Gipper Brandon 2015 Assessing the Effects of Disclosing Management Compensation Working
Paper University of Chicago
Gormley Todd David Matsa and Todd Milbourn 2013 CEO compensation and corporate risk
evidence from a natural experiment Journal of Accounting and Economics 56 79-101
Graham John Michelle Hanlon and Terry Shevlin 2011 Real effects of accounting rules
evidence from multinational firmsrsquo investment locations and profit repatriation decisions
Journal of Accounting Research 49 137-185
Graham John Campbell Harvey and Shiva Rajgopal 2005 The Economic implications of
corporate financial reporting Journal of Accounting and Economics 40 3-73
Greenspan Alan 2002 Testimony of Alan Greenspan before the Committee on Banking
Housing and Urban Affairs US Senate July 16 Washington DC Government Printing
Office
Grullon Gustavo and Roni Michaely 2002 Dividends Share Repurchases and the Substitution
Hypothesis Journal of Finance 57 1649-1684
Hail Luzi Ahmed Tahoun and Clare Wang 2014 Dividend Payouts and Information Shocks
Journal of Accounting Research 52 403-456
Hall Brian J and Kevin J Murphy 2002 Stock options for undiversified executives Journal of
Accounting amp Economics 33 3-42
39
Hall Brian J and Kevin J Murphy 2003 The trouble with stock options Journal of Economic
Perspectives 17 49ndash70
Hanlon Michelle and Jeffrey L Hoopes 2014 What do firms do when dividend tax rates change
An examination of alternative payout responses Journal of Financial Economics 114 105-
124
Hayes Rachel M Michael Lemmon and Mingming Qiu 2012 Stock options and managerial
incentives for risk taking Evidence from FAS123R Journal of Financial Economics 105
174ndash190
Heron Randall A Erik Lie 2007 Does backdating explain the stock price pattern around
executive stock option grants Journal of Financial Economics 83 271-295
Hribar Paul Nicole Thorne Jenkins and W Bruce Johnson 2006 Stock repurchases as an
earnings management device Journal of Accounting and Economics 41 3ndash27
Jensen Michael C 1986 Agency cost of free cash flow corporate finance and takeovers
American Economic Review 76 323-329
Jolls Christine 1998 Stock repurchases and incentive compensation NBER Working Paper No
w6467
Jung Boochun Woo-Jong Lee and Yanhua Sunny Yang 2016 The Impact of Dividend
Covenants on Investment and Operating Performance Journal of Business Finance amp
Accounting 43 414ndash447
Kahle Kathleen M 2002 When a buyback isnrsquot a buyback open market repurchases and
employee options Journal of Financial Economics 63 235ndash261
Lambert Richard A William N Lanen and David F Larcker 1989 Executive stock option plans
and corporate dividend policy Journal of Financial and Quantitative Analysis 24 409ndash425
Lintner John 1956 Distribution of incomes of corporations among dividends retained earnings
and taxes The American Economic Review 46 97-113
Low Angie 2009 Managerial risk-taking behavior and equity-based compensation Journal of
Financial Economics 92 470-490
Miller Merton H and Franco Modigliani 1961 Dividend policy growth and the valuation of
shares The Journal of Business 34 411ndash433
Minnick Kristina and Leonard Rosenthal 2015 Stealth compensation Do CEOs increase their
pay by influencing dividend policy Journal of Corporate Finance 25 435-454
40
Murphy Kevin J 1999 Executive compensation In O Ashenfelter and D Card (eds) North
Holland Handbook of Labor Economics Amsterdam Elsevier Science BV
Murphy Kevin J 2013 Executive compensation Where we are and how we got there Handbook
of the Economics of Finance Elsevier Science North Holland 211-356
Nikolaev Valeri 2010 Debt Covenants and Accounting Conservatism Journal of Accounting
Research 48 143-176
Puri Manju Joumlrg Rocholl and Sascha Steffen 2011 Global retail lending in the aftermath of the
US financial crisis Distinguishing between supply and demand effects Journal of Financial
Economics 100 556-578
Shue Kelly and Richard R Townsend 2014 Swinging for the fences Executive reactions to
quasi-random option grants Working Paper University of Chicago
Skinner Douglas J 2008 The evolving relation between earnings dividends and stock
repurchases Journal of Financial Economics 87 582-609
Weisbenner Scott J 2000 Corporate share repurchases in the 1990s What role do stock options
play FEDS Working Paper No 2000-29
Zhang Dan 2013 CEO dividend protection Working Paper BI Norwegian Business School
41
Figure 1 Trends of dividends and repurchases from 2003 to 2007 Panel A plots the average
Regular DividendTotal Assets of firms in the highest and lowest quartiles of Accounting Impact
measured in 2002 Panel B shows the average Total RepurchaseTotal Assets of firms in the
highest and lowest quartiles of Accounting Impact measured in 2002
Panel A Trends of regular dividends
Panel B Trends of total repurchases
00
05
10
15
20
2003 2004 2005 2006 2007
Regular DividendTotal Assets
Lowest Acc Impact
Highest Acc Impact
Pre Post
00
20
40
60
80
100
2003 2004 2005 2006 2007
Total Repurchase Total Assets
Lowest Acc Impact
Highest Acc Impact
Pre Post
42
Table 1
Summary Statistics
Panel A Firm characteristics - full sample
N Mean Std dev 25 pctl Median 75 pctl
Accounting impact (2002) 1176 173 366 022 052 163
Payout variablesRegular dividendTotal assets 5653 093 148 000 000 142
RepurchaseTotal assets 5653 394 710 000 035 500
Total payoutTotal assets 5653 488 748 000 175 666
Regular dividendTotal payout 4091 3874 4057 000 2237 8833
Level of executive compensation (in $1000)
Salary_$ 5653 450 190 314 409 544
Bonus_$ 5653 476 616 122 295 586
Option grant_$ 5653 791 1137 62 384 1002
Restricted stock grant_$ 5653 458 866 0 58 518
Total pay_$ 5653 2481 2475 890 1647 3074
Percentage of executive compensation
Salary_ 5653 296 183 165 251 382
Bonus_ 5653 197 148 97 177 268
Option grant_ 5653 283 235 67 256 445
Restricted stock grant_ 5653 141 180 00 41 249
Control variables
Size ($M) 5653 11086 27294 1017 2459 8117
Log(size) 5653 7985 1565 6925 7808 9002
Book-to-market 5653 0445 0287 0251 0388 0578
Leverage 5653 0202 0172 0038 0187 0309
Asset tangibility 5653 0806 0184 0691 0853 0965
Free cash flow 5653 0059 0091 0013 0059 0108
Cash holding 5653 0166 0172 0034 0100 0247
ROA volatility 5653 0056 0056 0021 0038 0070
Institutional ownership 5653 0753 0202 0639 0795 0910
Sales growth 5653 0121 0189 0028 0096 0183
Past stock return 5653 0094 0183 -0012 0094 0199
Loss indicator 5653 0164 0370 0000 0000 0000
This table presents summary statistics Panel A shows the descriptive statistics of payout variables compensation
variables and other firm characteristics for the full sample Accounting impact is the implied option expense
measured at fiscal year 2002 All other variables are measured at firm-year level from fiscal year 2003 to 2007
resulting in 5653 firm-year observations (except for Regular dividendTotal Payout which can be measured only
for the 4901 firm-year observations with Total payout greater than zero) Panel B shows the pairwise correlations
between main variables at firm-year level Panel C compares payout variables compensation variables and other
firm characteristics before and after FAS123R The Pre-FAS123R period consists of fiscal year 2003 and 2004
the Post-FAS123R period covers fiscal year 2005-2007 Panel D compares the trends of payout and compensation
variables around FAS123R across four quartile groups ranked by 2002 accounting impact Panel E compares the
trends of payout and compensation variables around FAS123R between the treated and control group under the
alternative treatment definition in Bakke et al (2015) (see Section 22) All variables are defined in Appendix The
notation and in Panel C indicates statistically significant at 10 5 and 1 level in T-tests for equal
means respectively
43
Pa
nel
B
Pea
rso
n c
orr
ela
tio
ns
Reg div
Repurchase
Total payout
Salary_
Bonus_
Option_
RS_
Log(size)
BM
Leverage
Tangibility
FCF
Cash holdingROA vol
Inst own
Sales growth
Past ret
urn
Loss
Reg
div
10
0
Repurc
hase
01
610
0
Tota
l payout
03
509
810
0
Sala
ry_
-0
10
-01
8-0
19
10
0
Bonus_
00
700
100
3-0
01
10
0
Option_
-0
10
00
900
6-0
41
-03
510
0
RS
_
01
000
901
0-0
32
-01
1-0
40
10
0
Log(s
ize)
03
101
802
3-0
56
01
101
202
210
0
BM
-02
1-0
28
-03
103
0-0
03
-02
000
0-0
33
10
0
Levera
ge
-00
1-0
08
-00
8-0
05
00
6-0
11
00
801
9-0
03
10
0
Tangib
ility
00
200
100
101
200
1-0
05
-00
6-0
12
-00
4-0
18
10
0
FC
F02
203
703
9-0
20
00
901
1-0
01
02
4-0
32
-02
1-0
16
10
0
Cash
hold
ing
-01
301
000
700
2-0
14
02
2-0
10
-02
3-0
16
-03
502
901
210
0
RO
A v
ol
-01
5-0
04
-00
700
4-0
11
01
9-0
11
-02
3-0
08
-01
101
2-0
02
03
910
0
Inst
ow
n
-00
901
401
1-0
17
00
200
701
200
7-0
01
00
3-0
08
01
4-0
06
-01
110
0
Sale
s gro
wth
-00
8-0
04
-00
6-0
15
00
501
0-0
02
00
7-0
16
-00
3-0
08
01
300
201
400
410
0
Past
retu
rn00
901
301
4-0
18
01
5-0
01
00
301
6-0
29
-01
000
102
7-0
14
-01
001
602
710
0
Loss
-02
0-0
19
-02
201
8-0
18
00
4-0
05
-02
601
901
300
6-0
41
01
702
3-0
16
-01
8-0
40
10
0
44
Panel C Firm characteristics - before and after FAS123R
Pre FAS 123R Post FAS 123R Difference
Payout variables
Regular dividendTotal assets 083 099 016
RepurchaseTotal assets 245 490 245
Total payoutTotal assets 328 589 261
Regular dividendTotal payout 3914 2790 -1124
Level of executive compensation (in $1000)
Salary_$ 426 463 37
Bonus_$ 418 505 87
Option grant_$ 896 707 -191
Restricted stock grant_$ 269 574 305
Total pay_$ 2263 2584 321
Percentage of executive compensation
Salary_ 305 293 -12
Bonus_ 186 204 18
Option grant_ 343 240 -103
Restricted stock grant_ 87 176 89
Control variables
Size ($M) 9671 11631 1960
Log(size) 7860 8035 0175
Book-to-market 0437 0453 0016
Leverage 0201 0203 0002
Asset tangibility 0822 0793 -0029
Free cash flow 0061 0057 -0004
Cash holding 0175 0159 -0016
ROA volatility 0067 0048 -0019
Institutional ownership 0712 0781 0069
Sales growth 0137 0108 -0029
Past stock return 0080 0101 0021
Loss indicator 0173 0159 -0014
45
Pa
nel
D
Fir
m c
ha
racte
rist
ics
by q
ua
rtil
e o
f a
cco
un
tin
g i
mp
act
- b
efo
re a
nd
aft
er
FA
S1
23
R
Accounting im
pact
(2002)
Num
ber
of
Fir
ms
Pre
Post
Pre
Post
Pre
Post
Pre
Post
Payout
vari
able
s
Regula
r div
idendT
ota
l ass
ets
11
2
12
4
09
4
11
1
09
5
11
3
03
0
04
9
Repurc
hase
Tota
l ass
ets
11
3
26
8
19
2
37
3
32
7
63
1
35
1
68
7
Tota
l payout
Tota
l ass
ets
22
4
39
1
28
5
48
4
42
2
74
4
38
1
73
6
Regula
r div
idendT
ota
l payout
643
7
469
8
474
0
341
1
284
5
195
4
82
5
74
5
Perc
enta
ge o
f executive c
om
pensa
tion
Sala
ry_
337
295
313
287
296
289
276
300
Bonus_
223
226
214
228
172
192
134
169
Option g
rant_
201
167
290
210
373
260
507
325
Rest
ricte
d s
tock g
rant_
116
194
98
180
89
176
43
155
294
294
294
294
1st Q
uart
ile2
nd Q
uart
ile3
rd Q
uart
ile4
th Q
uart
ile
01
2
03
5
09
3
55
1
46
Accounting impact
Number of Firms
By accounting impact quartile
1
2
3
4
Pre Post Pre Post
Payout variables
Regular dividendTotal assets 09 11 08 10
RepurchaseTotal assets 18 31 26 52
Total payoutTotal assets 28 43 34 62
Regular dividendTotal payout 428 357 386 265
Percentage of executive compensation
Salary_ 435 364 282 280
Bonus_ 226 214 179 202
Option grant_ 92 125 387 261
Restricted stock grant_ 125 188 80 174
Percentage of CEO compensation
Salary_(CEO) 485 364 260 259
Bonus_(CEO) 249 228 185 219
Option grant_(CEO) 10 127 406 275
Restricted stock grant_(CEO) 128 182 82 183
Panel E Firm characteristics by alternative treatment definition - before and
after FAS123R
Treated
25
19
997
223
250
256
268
10
177
71
Control
44
37
47
Table 2
Differential effect of FAS123R on the use of option-based compensation
Panel A Two-period first-difference regression
Prediction Coeff t-stat Coeff t-stat Coeff t-stat
Accounting impact rank - -0044 -628
Accounting impact rank=2 - -0044 -327
Accounting impact rank=3 - -0075 -468
Accounting impact rank=4 - -0140 -613
Treated - -0132 -875
ΔLog(size) 0061 202 0061 200 0063 214
ΔBook-to-market 0032 091 0032 092 0051 143
ΔLeverage -0157 -213 -0160 -218 -0111 -153
ΔAsset tangibility -0012 -014 -0020 -023 -0023 -026
ΔFree cash flow -0106 -095 -0108 -097 -0128 -117
ΔCash holding -0197 -211 -0193 -206 -0180 -194
ΔFive-year ROA volatility -0065 -031 -0056 -026 -0098 -047
ΔInstitutional ownership -0044 -091 -0043 -088 -0044 -092
ΔSales growth -0064 -102 -0065 -104 -0090 -153
ΔPast one-year stock return 0051 078 0052 080 0091 138
ΔLoss frequency 0056 207 0057 207 0047 179
Log(size) -0009 -210 -0009 -207 -0002 -035
Book-to-market -0015 -056 -0013 -049 0018 072
Leverage 0022 046 0023 048 0068 150
Asset tangibility 0033 077 0033 078 0053 128
Free cash flow 0227 202 0220 195 0127 117
Cash holding -0002 -004 0012 019 -0078 -141
Five-year ROA volatility -0451 -240 -0430 -228 -0509 -283
Institutional ownership -0123 -360 -0122 -359 -0100 -292
Sales growth -0041 -056 -0040 -055 -0089 -125
Past one-year stock return -0009 -015 -0006 -010 0078 125
Loss frequency 0055 174 0056 178 0054 173
Fixed effect
Standard error
Adj R-squared
Observations
Model (3)
Dependent variable ΔAvg Option grantTotal pay
Huber-White
0156
This table investigates whether the effect of FAS123R on the use of option-based pay varies with its potential accounting impact Panel A
reports the results of estimating three two-period first-differencing models where for each firm we average its characteristics in Pre- and
Post-FAS123R period The Pre-FAS123R period consists of fiscal year 2003 and 2004 the Post-FAS123R period covers fiscal year 2005-
2007 In all three specifications the dependent variable is the change of average Option grantTotal pay from Pre- to Post-FAS123R period
The main independent variable varies by model in Model (1) the Accounting impact rank is the quartile rank of implied option expensetotal
assets measured in 2002 (1=lowest 4=highest) In Model (2) Accounting impact rank=2 (3 4) is an indicator that takes value of one if the
firmrsquos Accounting impact rank equals 2 (3 4) In Model (3) we use an alternative treatment construction following Bakke et al (2015)
where Treated is an indicator that takes value of zero if the firm granted zero option to its CEO in both 2003 and 2004 or the firm began to
voluntarily expense option-based pay at fair value in 2002 or earlier and one otherwise For each control variable we include both its level in
the Pre-FAS123R period and its change across the two periods Panel B shows the results of estimating fixed effect models with firm-year
observations The dependent variable is the firm-year level Option grantTotal pay The main independent variables are the interactions of
Post-FAS123R indicator (Post) with Accounting Impact rank Accounting impact rank indicators and Treated respectively All models in
Penal A have industry fixed effects and the standard errors are Huber-White heteroscedasticity-consistent standard errors All models in
Penal B have firm fixed effects and year fixed effects and the standard errors are clustered at firm level All variables are defined in
Appendix The notation and indicates statistically significant at 10 5 and 1 level respectively
Model (1) Model (2)
11711171 1171
Industry Industry
Huber-White
0124
Huber-White
0123
Industry
48
Panel B Panel fixed effects regression
Prediction Coeff t-stat Coeff t-stat Coeff t-stat
Acc impact rank x Post - -0044 -807
Acc impact rank 2 x Post - -0046 -333
Acc impact rank 3 x Post - -0077 -526
Acc impact rank 4 x Post - -0137 -776
Treated x Post - -0145 -970
Log(size) 0034 221 0034 217 0036 229
Book-to-market 0018 084 0017 083 0015 070
Leverage -0004 -009 -0006 -013 -0007 -015
Asset tangibility 0007 012 0004 006 0011 018
Free cash flow -0074 -151 -0072 -146 -0078 -158
Cash holding -0048 -086 -0050 -090 -0006 -011
Five-year ROA volatility 0250 231 0239 219 0437 414
Institutional ownership 0043 159 0044 161 0041 150
Sales growth -0033 -168 -0034 -171 -0031 -158
Past one-year stock return 0067 221 0068 224 0063 204
Loss indicator 0023 209 0022 207 0024 222
Fixed effects
Standard error
Adj R-squared
Observations
Dependent variable Option grantTotal pay
5653 5653 5653
Clustered by firm
Firm Year
Clustered by firm
Firm Year
Clustered by firm
0523 0523 0526
Model (1) Model (2) Model (3)
Firm Year
49
Table 3
Effect of option-based compensation on dividend policy
Panel A Two-period first-difference regression
Prediction Coeff t-stat Coeff t-stat Coeff t-stat
Accounting impact rank + 0000 077
Accounting impact rank=2 + 0001 091
Accounting impact rank=3 + 0000 044
Accounting impact rank=4 + 0001 092
Treated + 0000 -026
ΔLog(size) 0000 -030 0000 -030 0000 -026
ΔBook-to-market -0002 -190 -0002 -193 -0002 -195
ΔLeverage -0002 -059 -0002 -057 -0002 -059
ΔAsset tangibility 0016 431 0016 429 0016 430
ΔFree cash flow 0017 373 0017 373 0017 375
ΔCash holding -0011 -288 -0011 -285 -0010 -282
ΔFive-year ROA volatility 0003 034 0002 032 0003 035
ΔInstitutional ownership -0002 -073 -0002 -073 -0002 -070
ΔSales growth -0001 -040 -0001 -037 -0001 -038
ΔPast one-year stock return 0002 077 0002 076 0002 070
ΔLoss frequency 0000 -048 0000 -045 0000 -046
Log(size) 0000 183 0000 182 0000 182
Book-to-market -0002 -227 -0002 -225 -0002 -284
Leverage -0001 -037 -0001 -039 -0001 -048
Asset tangibility 0003 179 0003 180 0003 176
Free cash flow 0017 291 0017 291 0017 300
Cash holding 0002 080 0002 077 0002 098
Five-year ROA volatility 0003 035 0002 033 0003 044
Institutional ownership -0001 -068 -0001 -068 -0001 -058
Sales growth -0004 -177 -0004 -175 -0004 -172
Past one-year stock return 0004 169 0004 167 0004 165
Loss frequency -0001 -111 -0001 -109 -0001 -102
Fixed effect
Standard error
Adj R-squared
Observations
Dependent variable ΔAvg Regular dividendTotal assets
This table investigates the causal effect of option-based pay on dividend policy by examining whether changes in dividend policy around
FAS123R vary with its potential accounting impact Panel A reports the results of estimating three two-period first-differencing models
where for each firm we average its characteristics in Pre- and Post-FAS123R period In all three specifications the dependent variable is
the change of average Regular dividendTotal assets from Pre- to Post-FAS123R period The main independent variable varies by model in
Model (1) the Accounting impact rank is the quartile rank of implied option expensetotal assets measured in 2002 (1=lowest 4=highest) In
Model (2) Accounting impact rank=2 (3 4) is an indicator that takes value of one if the firmrsquos Accounting impact rank equals 2 (3 4) In
Model (3) we use an alternative treatment construction following Bakke et al (2015) where Treated is an indicator that takes value of zero
if the firm granted zero option to its CEO in both 2003 and 2004 or the firm began to voluntarily expense option-based pay at fair value in
2002 or earlier and one otherwise For each control variable we include both its level in the Pre-FAS123R period and its change across the
two periods Panel B shows the results of estimating fixed effect models with firm-year observations The dependent variable is the firm-
year level Regular dividendTotal assets The main independent variables are the interactions of Post-FAS123R indicator (Post) with
Accounting Impact rank Accounting impact rank indicators and Treated respectively Panel C examines the intensity of dividend changes
among firms with nonzero dividend per share in 2003 or 2004 In particular we estimates the same three models as in Panel A(with the
same independent variables) but for five dependent variables the change of average Regular dividendTotal assets from Pre- to Post-
FAS123R period (as in Panel A) the percentage change of DPS (dividend per share) from Pre- to Post-FAS123R period and three
indicators denoting respectively whether the percentage change of DPS was greater than 20 40 and 60 Panel D reports four
robustness tests of the dividend intensity regression In each of them a set of possible confounding observations is removed (see Section 33
for details) Panel E compares the trends of dividend initiation and termination around FAS123R across four quartile groups ranked by
accounting impact All models in Panel A C and D have industry fixed effects and the standard errors are Huber-White heteroscedasticity-
consistent standard errors All models in Penal B have firm fixed effects and year fixed effects and the standard errors are clustered at
firm level All variables are defined in Appendix The notation and indicates statistically significant at 10 5 and 1 level
Industry Industry Industry
Model (1) Model (2) Model (3)
1171 1171 1171
Huber-White Huber-White Huber-White
0105 0104 0105
50
Panel B Panel fixed effects regression
Prediction Coeff t-stat Coeff t-stat Coeff t-stat
Acc impact rank x Post + 0000 122
Acc impact rank 2 x Post + 0001 110
Acc impact rank 3 x Post + 0001 094
Acc impact rank 4 x Post + 0001 129
Treated x Post + 0000 -012
Log(size) 0001 179 0001 179 0001 181
Book-to-market 0000 025 0000 024 0000 031
Leverage 0001 062 0001 064 0001 069
Asset tangibility 0009 360 0009 358 0009 363
Free cash flow 0002 090 0002 093 0002 092
Cash holding -0007 -295 -0007 -298 -0007 -298
Five-year ROA volatility 0001 041 0001 038 0000 -006
Institutional ownership 0000 -027 0000 -026 0000 -027
Sales growth 0000 053 0000 051 0000 044
Past one-year stock return 0001 089 0001 088 0001 078
Loss indicator 0000 -060 0000 -057 0000 -076
Fixed effects
Standard error
Adj R-squared
Observations
Dependent variable Regular dividendTotal assets
Model (1) Model (2) Model (3)
Firm Year Firm Year Firm Year
5653 5653 5653
Clustered by firm Clustered by firm Clustered by firm
0877 0877 0877
51
Panel C Intensity of dividend changes around FAS123R
Prediction Coeff t-stat Coeff t-stat Coeff t-stat
Accounting impact rank + 0000 065
Accounting impact rank=2 + 0000 048
Accounting impact rank=3 + 0000 026
Accounting impact rank=4 + 0002 080
Treated + 0001 063
Dependent var DPS pct change
Accounting impact rank + -0145 -072
Accounting impact rank=2 + 0018 006
Accounting impact rank=3 + -0177 -045
Accounting impact rank=4 + -0746 -100
Treated + -0407 -119
Accounting impact rank + 0029 095
Accounting impact rank=2 + 0040 074
Accounting impact rank=3 + 0092 139
Accounting impact rank=4 + 0008 007
Treated + -0007 -012
Accounting impact rank + 0024 076
Accounting impact rank=2 + 0047 088
Accounting impact rank=3 + 0079 114
Accounting impact rank=4 + -0003 -002
Treated + 0030 052
Accounting impact rank + 0030 098
Accounting impact rank=2 + 0078 155
Accounting impact rank=3 + 0085 130
Accounting impact rank=4 + 0014 012
Treated + -0006 -011
Control variables
Fixed effect
Standard error
Observations 572 572 572
Yes Yes Yes
Huber-White Huber-White Huber-White
Industry Industry Industry
Dependent var DPS pct
change gt60 indicator
Model (1) Model (2) Model (3)
Dependent var ΔAvg Regular
dividendAssets
Dependent var DPS pct
change gt20 indicator
Dependent var DPS pct
change gt40 indicator
52
Panel D Robustness tests for intensity of dividend changes around FAS123R
Prediction Coeff t-stat Coeff t-stat Coeff t-stat
Accounting impact rank + 0006 017
Accounting impact rank=2 + 0067 118
Accounting impact rank=3 + 0041 057
Accounting impact rank=4 + -0061 -049
Treated + 0022 035Observations
Accounting impact rank + 0009 027
Accounting impact rank=2 + 0058 106
Accounting impact rank=3 + 0032 043
Accounting impact rank=4 + -0032 -024
Treated + 0018 028
Observations
Accounting impact rank + 0030 089
Accounting impact rank=2 + 0039 071
Accounting impact rank=3 + 0122 168
Accounting impact rank=4 + -0063 -052
Treated + 0075 132
Observations
Accounting impact rank + 0008 023
Accounting impact rank=2 + 0023 042
Accounting impact rank=3 + 0048 064
Accounting impact rank=4 + -0042 -033
Treated + -0010 -016
Observations
Control variables
Fixed effect
Standard error
Exclude firms with stable
payout ratio from 2003 to 2004
506 506 506
Dependent variable DPS pct change gt40 indicator
Model (1) Model (2) Model (3)
Exclude voluntary expensers
519 519
Exclude firms in the top decile
of option reduction (02-04)
Exclude firms that accelerated
option vesting
504 504 504
517 517 517
519
Huber-White Huber-White Huber-White
Yes Yes Yes
Industry Industry Industry
53
Panel E Dividend initiation and termination rates around FAS123R
Pre FAS 123R
1 280 75 7 6 13 173
2 284 135 18 9 27 200
3 286 181 11 14 25 138
4 282 260 9 10 19 73
Total 1132 651 45 39 84 129
Post FAS 123R
1 275 63 4 4 8 127
2 280 116 9 9 18 155
3 276 152 9 3 12 79
4 263 223 5 1 6 27
Total 1094 554 27 17 44 79
Pre FAS 123R
1 280 205 2 0 2 10
2 284 149 7 1 8 54
3 286 105 0 0 0 00
4 282 22 0 0 0 00
Total 1132 481 9 1 10 21
Post FAS 123R
1 275 212 3 6 9 42
2 280 164 1 2 3 18
3 276 124 1 1 2 16
4 263 40 0 3 3 75
Total 1094 540 5 12 17 31
termination
in 2004
03-04
cumulative
03-04
cumulative
Quartile firms
with
dividend in
2004
termination
in 2005
termination
in 2006
05-06
cumulative
05-06
cumulative
Termination
Quartile firms
with
dividend in
2002
termination
in 2003
without
dividend in
2004
initiation in
2003
initiation in
2004
03-04
cumulative
03-04
cumulative firmsQuartile
firmsQuartile initiation in
2005
initiation in
2006
05-06
cumulative
05-06
cumulative
Initiation
without
dividend in
2002
54
Table 4
Effect of option-based compensation on repurchases
Panel A Two-period first-difference regression with total repurchase
Prediction Coeff t-stat Coeff t-stat Coeff t-stat
Accounting impact rank - 0002 122
Accounting impact rank=2 - 0002 071
Accounting impact rank=3 - 0005 123
Accounting impact rank=4 - 0007 102
Treated - 0014 365
Control variables
Fixed effect
Standard error
Adj R-squared
Observations
Panel B Two-period first-difference regression with net repurchase
Prediction Coeff t-stat Coeff t-stat Coeff t-stat
Accounting impact rank - 0003 166
Accounting impact rank=2 - 0002 051
Accounting impact rank=3 - 0006 165
Accounting impact rank=4 - 0009 137
Treated - 0010 300
Control variables
Fixed effect
Standard error
Adj R-squared
Observations
Panel C Two-period first-difference regression with repurchase adjusted for exercised options
Prediction Coeff t-stat Coeff t-stat Coeff t-stat
Accounting impact rank - 0001 056
Accounting impact rank=2 - 0002 062
Accounting impact rank=3 - 0007 172
Accounting impact rank=4 - -0001 -008
Treated - 0006 197
Control variables
Fixed effect
Standard error
Adj R-squared
Observations
Dependent variable ΔAvg RepurchaseTotal assets
This table investigates the causal effect of option-based pay on payout policy by examining whether the changes of repurchase around
FAS123R vary with its potential accounting impact Panel A reports the results of estimating three two-period first-differencing models
where for each firm we average its characteristics in Pre- and Post-FAS123R period In all three specifications the dependent variable is
the change of average RepurchaseTotal assets from Pre- to Post-FAS123R period The main independent variable varies by model in
Model (1) the Accounting impact rank is the quartile rank of implied option expensetotal assets measured in 2002 (1=lowest 4=highest)
In Model (2) Accounting impact rank=2 (3 4) is an indicator that takes value of one if the firmrsquos Accounting impact rank equals 2 (3 4)
In Model (3) we use an alternative treatment construction following Bakke et al (2015) where Treated is an indicator that takes value of
zero if the firm granted zero option to its CEO in both 2003 and 2004 or the firm began to voluntarily expense option-based pay at fair
value in 2002 or earlier and one otherwise Panel B reports the regressions with the change of Net repurchaseTotal assets as the
dependent variable and the same independent variable as in Panel A Panel C reports the regressions with the change of Adjusted
repurchaseTotal assets as the dependent variable and the same independent variable as in Panel A All models in Panel A B and C have
industry fixed effects and the standard errors are Huber-White heteroscedasticity-consistent standard errors All variables are defined in
Appendix The notation and indicates statistically significant at 10 5 and 1 level respectively
Model (1) Model (2) Model (3)
Yes Yes Yes
Industry Industry Industry
Huber-White Huber-White Huber-White
Dependent variable ΔAvg Net repurchaseTotal assets
1171 1171 1171
0238 0237 0245
Model (1) Model (2) Model (3)
Yes Yes Yes
Industry Industry Industry
Huber-White Huber-White Huber-White
Dependent variable ΔAvg Adjusted repurchaseTotal assets
0229 0229 0233
1171 1171 1171
Model (1) Model (2) Model (3)
Yes Yes Yes
Industry Industry Industry
Huber-White Huber-White Huber-White
0111 0112 0114
1168 1168 1168
55
Table 5
Effect of option-based compensation on payout mix
Panel A Two-period first-difference regression with total payout mix
Prediction Coeff t-stat Coeff t-stat Coeff t-stat
Accounting impact rank + 0006 028
Accounting impact rank=2 + 0018 045
Accounting impact rank=3 + -0001 -001
Accounting impact rank=4 + 0043 052
Treated + -0035 -094
Control variables
Fixed effect
Standard error
Adj R-squared
Observations
Panel B Two-period first-difference regression with net payout mix
Prediction Coeff t-stat Coeff t-stat Coeff t-stat
Accounting impact rank + -0002 -008
Accounting impact rank=2 + 0008 016
Accounting impact rank=3 + 0018 034
Accounting impact rank=4 + -0059 -055
Treated + -0050 -101
Control variables
Fixed effect
Standard error
Adj R-squared
Observations
0049 0043 0054
257 257 257
Industry Industry Industry
Huber-White Huber-White Huber-White
Dependent variable ΔAvg Regular dividendNet payout
Model (1) Model (2) Model (3)
Yes Yes Yes
0154 0151 0156
362 362 362
Industry Industry Industry
Huber-White Huber-White Huber-White
This table investigates the causal effect of option-based pay on payout mix for firms using both dividend and repurchase by examining
whether the changes of payout mix around FAS123R vary with its potential accounting impact Panel A reports the results of estimating
three two-period first-differencing models where for each firm we average its characteristics in Pre- and Post-FAS123R period In all three
specifications the dependent variable is the change of average Regular dividendTotal payout from Pre- to Post-FAS123R period The main
independent variable varies by model in Model (1) the Accounting impact rank is the quartile rank of implied option expensetotal assets
measured in 2002 (1=lowest 4=highest) In Model (2) Accounting impact rank=2 (3 4) is an indicator that takes value of one if the firmrsquos
Accounting impact rank equals 2 (3 4) In Model (3) we use an alternative treatment construction following Bakke et al (2015) where
Treated is an indicator that takes value of zero if the firm granted zero option to its CEO in both 2003 and 2004 or the firm began to
voluntarily expense option-based pay at fair value in 2002 or earlier and one otherwise Panel B reports the regressions with the change of
Regular dividendNet payout as the dependent variable and the same independent variables as in Panel A Panel A (Panel B) is based on
observations with nonzero regular dividend and repurchase (net repurchase) in both Pre- and Post-FAS123R period All models in Panel A
and B have industry fixed effects and the standard errors are Huber-White heteroscedasticity-consistent standard errors All variables are
defined in Appendix The notation and indicates statistically significant at 10 5 and 1 level respectively
Yes Yes Yes
Dependent variable ΔAvg Regular dividendTotal payout
Model (1) Model (2) Model (3)

8
effect of option-based pay on a different yet important economic outcome payout policy Second
our metholodogy differs from prior studies in that it explicitly incorporates cross-sectional
variation in how firms were affected by FAS123R Future work may use this approach to examine
the effect of option-based pay on other corporate policies
Finally we extend the literature on how accounting rules impact a firmrsquos economic
behavior (eg Carter and Lynch 2003 Carter et al 2007 Bens and Mohanan 2008 Choudhary
Rajgopal and Venkatachalam 2009 Graham Hanlon and Shevlin 2011) as well as the literature on
the accounting treatment for stock options (Aboody 1996 Dechow Hutton and Sloan 1996
Aboody Barth and Kasznik 2004 Ferri and Sandino 2009)
2 Research Design
21 Empirical Strategy
It is commonly recognized that identifying the causal effects of executive compensation in
empirical studies is challenging (Edmans and Gabaix 2015) FAS123R provides a unique
opportunity to address this problem Aside from significantly reducing the use of option
compensation the accounting change should not in itself correlate with the outcomes of interest
(ie change in payout policy)9 However utilizing FAS123R is not easy because it affected all
US firms at the same time making it difficult to measure a counterfactual change around the
event based on a control group A simple before-after comparison of the outcome variable around
the adoption of FAS123R would assume that any change is driven entirely by the event of interest
(ie it would assume away any conterfactual trend in the outcome variable) a questionable
assumption An alternative strategy is to use the change in option-based compensation around
9 Hayes et al (2012) describes FAS123R as an exogenous change in the accounting benefits of stock options without a
change to the economic costs and benefits of stock options while Bakke et al (2015) describes it as causing a change
in executivesrsquo but not shareholdersrsquo incentives
9
FAS123R effectively assuming that such change is ldquoexogenousrdquo (eg Chava and Purnanandam
2010 Anantharaman and Lee 2014) The problem with this approach is that FAS123R per se did
not generate exogenous cross-sectional variation in option compensation Even if the introduction
of FAS123R is exogenous a firmrsquos response cannot be assumed to be entirely exogenous10
To identify the exogenous portion of firmsrsquo response to the new standard we make use of
evidence that FAS123Rrsquos impact on the use of option compensation varies with the firm-specific
expected accounting impact of the new rule as measured by the implied option expense disclosed
in the footnotes prior to FAS123R (Hayes et al 2012) The reduction in option usage is highest in
firms with the largest implied option expense Thus we can use the differential accounting impact
of FAS123R to overcome the problem of lacking control group
To validate our approach we estimate the following first-differencing regression with
ordinary lease square (OLS)
ΔOptioni = β0 + β1 Accounting Impacti + ΛControli +εi (1)
where ΔOptioni is the change in the average value of executive stock options as percentage of total
pay from the pre- to the post-FAS123R period Accounting Impacti is the implied option expense
measured prior to FAS123R (more details in Section 22) We expect β1 to be negative that is a
more pronounced reduction in option-based pay for firms with higher expected accounting impact
Next after validating the differential impact of FAS123R we examine the central question
of this study by estimating the following OLS regression
ΔPayouti = γ0 + γ1 Accounting Impacti + ΓControli +ui (2)
10 A universally assigned encouragement to receive treatment does not make the realization of treatment assignment
free from endogeneity concerns Consider the following example after the adoption of FAS123R firm A reduces the
weight of option-based pay by 20 and firm B by 40 A finding that firm B increases dividends compared to firm A
cannot be interpreted as evidence of a causal influence of option compensation on dividend policy This is because the
additional reduction in option compensation by firm B relative to firm A may not be driven by FAS123R It may
instead reflect an attempt to align executivesrsquo incentives with anticipated changes in dividend policy (reverse
causality) Without a way to incorporate the heterogeneous impact of FAS123R in the research design the cross
sectional variation in changes in option-based compensation is still subject to the usual endogeneity concerns
10
where ΔPayouti represents the change in the average value of one of the payout variables
of interest (described in Section 23) from the the pre- to the post-FAS123R period
Eq (2) is essentially a difference-in-difference approach to estimate the effect of option-
based pay on payout policy using the differential accounting impact of FAS123R to capture the
exogenous (accounting-induced) portion of the change in option-based pay If option-based pay
has a detectable causal effect on dividends (repurchases) in the direction predicted by the
literature γ1 should be positive (negative)
As noted by Bertrand Duflo and Mullainathan (2004) in difference-in-difference studies
with panel data OLS may yield inconsistent standard error estimates because the dependent
variable and the main independent variable tend to be serially correlated within firm To alleviate
this concern following Bertrand et al (2004) in both Eqs (1) and (2) we collapse the panel to a
single ldquoPrerdquo (2003-2004) and a single ldquoPostrdquo (2005-2007) period by averaging across years and
then measuring the changes from Pre to Post11 We choose 2003 as the starting period in order to
capture a period subsequent to the 2003 tax cut on individual dividend income While the
evidence on the effect of the tax cut on payout policy is mixed (Chetty and Saez 2005 Edgerton
2013 Floyd et al 2015) starting with 2003 allows the pre-FAS123R levels of the key variables to
reflect any effect of the tax cut 12 We end our analysis in 2007 to avoid the potentially
confounding effect of the 2008 financial crisis which had a significant impact on payouts (Floyd et
al 2015)13 Following Hayes et al (2012) and Bakke et al (2015) we include 2005 in the Post
11 In the collapsed two-period panel a regression of changes is equivalent to a regression of levels with firm-fixed
effects and an indicator for the Post period Both approaches obviate unobserved time-invariant firm heterogeneity
We choose first differencing equation for a more intuitive interpretation 12 The Jobs and Growth Tax Relief Reconciliation Act of 2003 was signed into law on May 28 2003 but had been
proposed on January 7 2003 and was made retroactive to the beginning of 2003 Chetty and Saez (2005) show that
the tax change affected dividend policy in 2003 13 In November 2006 the Securities and Exchange Commission required more details about the terms of performance-
based incentive plans We are not aware of any evidence that these rules affected the weight of option-based pay
11
period because FAS123R while effective in June 2005 was released in December 2004 14
Alternatively in untabulated tests we exclude 2005 from the analysis and obtain similar results
Another benefit of using a single Pre and Post period is that it is better suited than panel
data to the analysis of repurchases As noted by Skinner (2008) firms engaging in repurchases
tend to do so every other year thus the relation between repurchases and economic determinants is
stronger over two- or three-year periods than one-year periods Factors explaining the timing of
repurchases differ from those explaining their level and the year-to-year variation in repurchases is
not necessarily informative of changes in payout policy As we are not interested in the timing of
repurchases our approach seems to better capture ldquolong-runrdquo changes in payout policy However
for the analysis of dividends (which are generally paid every year and thus not subject to the
above problem) we also present the results using a panel regression with firm- and year-fixed
effects To alleviate the problem of serial correlation discussed earlier we cluster the standard
errors by firm
22 Accounting Impact
As noted earlier all firms were affected by FAS123R making it difficult to identify a
control sample To capture variation in the cross-sectional impact of FAS123R in Eqs (1) and (2)
we use Accounting Impacti defined as the implied option expense disclosed in the footnote of the
income statement for the 2002 fiscal year scaled by total assets (we obtain similar findings when
scaling it by revenues) We measure this variable in 2002 (ie before the Pre period) rather than in
2003 or 2004 to avoid any confounding effect from the expected adopion of FAS123R (see
discussion in Section 33) As this variable is highly skewed (see Table 1) we define it based on
(Gipper 2015) or had any effect on payout policy However we exclude 2007 from the Post period in robustness tests
Our inferences are unchanged 14 FAS123R was released in December 2004 effective as of the beginning of the first interim or annual reporting
period beginning after June 15 2005 Subsequently the SEC allowed a six-month deferral making the standard
effective for fiscal years beginning after December 15 2005
12
its quartile rank We also presents results with separate indicators for the top three quartiles in
order to better isolate the difference between top quartile (the most lsquotreatedrsquo group) and bottom
quartile (the least lsquotreatedrsquo group and thus closer to the notion of a control group)
An alternative way to address the issue of a lack of control group is suggested by Bakke et
al (2015) They argue that two sets of firms were likely lsquounaffectedrsquo by FAS123R (i) firms that
did not grant options to the CEO in 2003 and 2004 as in these firms FAS123R could not affect
CEO option pay and thus her incentives to make policy changes (ii) firms that were already
voluntarily expensing stock options as of 2002 (ie before FASB began discussions of the new
standard) as these firms would not face any additional accounting charge under FAS123R
Our approach offers a number of advantages First instead of collapsing all lsquonon-controlrsquo
firms in a single lsquotreatedrsquo group we exploit cross-sectional variation among treatment firms in
terms of the likely impact of FAS123R effectively using the most and least affected firms
(respectively top and bottom quartile of implied option expense) as treatment and control group
As shown in Table 1 the implied option expense is highly skewed (ie only a relatively small
number of firms was heavily affected by FAS123R) Capturing this variation is likely to increase
the power of the test Second in Bakke et al (2015) what matters is that the treatment definition
captures an accounting-driven change in CEO option grants as their focus is on CEO risk-taking
incentives In our setting we want to capture an accounting-driven change both in CEO option
grants (predicted to affect incentives to use dividends) and in the overall use of stock options
(predicted to affect the use of repurchases) As noted in Section 31 (see footnote 20) many firms
without CEO option grants in 2003 and 2004 were issuing options to non-CEO executives and
other employees and thus facing a potential accounting charge under FAS123R Third about half
of the firms without CEO option grants in 2003 and 2004 issued options to the CEO in the Post-
13
period Hence it is not clear that the control firms were truly unaffected by FAS123R Finally
the implied option expense in 2002 (our measure of the expected accounting impact) is a function
of option grants made in prior years when firms could not anticipate the adoption of FAS123R In
contrast option grant decisions in 2003 and 2004 may be affected by its anticipated adoption as
FASB added accounting for stock-based compensation to its agenda in March 2003
Notwithstanding the above arguments throughout our study we also present the results
using the definition of treatment and control in Bakke et al (2015) In particular we modify Eqs
(1) and (2) by replacing Accounting Impact with Treated an indicator equal to zero for the two
groups of firms identified as lsquocontrolrsquo in Bakke et al (2015) and one for all other firms
23 Payout Variables and Control Variables
Following Brown et al (2007) our baseline measure for changes in dividends is the change
in the DividendAssets ratiomdashcomputed as the regular cash dividends paid during the year scaled
by total assets at the beginning of the yearmdashfrom the Pre to the Post period15 However the
dividend-to-asset ratio is not what managers focus on when making dividend policy decisions
The stability of dividend per share (DPS) among dividend-paying firms (hereinafter payers)
suggests that managers do not target a specific dividend-to-assets ratio but rather a DPS level
(Baker and Wurgler 2016) Survey evidence confirms that executives make dividend policy
decision in terms of changes to the current level of DPS (Brav et al 2005) Therefore we also
examine the percentage change in the average DPS from the Pre to the Post period However this
measure can only be computed for the subset of payers (defined as firms with non-zero DPS in at
15 An alternative choice would be to scale dividends by the market value of equity essentially computing a dividend
yield However a drawback of using the dividend yield in our setting is that after controlling for time-invariant firm
characteristics through fixed effects or first differencing the variation of the ratio comes mainly from the denominator
the stock price (Baker and Wurgler 2004) Thus we choose the more stable book value of total assets as denominator
Also similar to other studies (eg Fenn and Liang 2001) we focus on regular dividends and exclude special dividends
as they are very rare and may introduce large noise to the dividend measures for few observations (DeAngelo
DeAngelo and Skinner 2000)
14
least one of the years of the Pre period) To provide insights into FAS123Rrsquos effect on dividend
policy for non-payers we examine the relation between our Accounting Impact variable and the
rate of dividend initations in the Pre and Post periods
Our main measure for repurchases is the change in RepurchaseAssetsmdashthat is the
aggregate amount of common stock repurchases made during the year scaled by total assets at the
beginning of the yearmdashfrom the Pre to the Post period In the empirical tests we examine
variations suggested in the literature
Finally as an alternative to examining dividends and repurchases separately we also look at a
measure of the payout composition the change in the DividendsTotal Payout ratio from the Pre to
the Post period (Total Payout is the sum of dividends and repurchases) effectively capturing any
substitution effect between dividends and repurchases 16 Examining the causal effect of the
change in option-based pay on payout composition is especially relevant if managers first target a
total payout and then choose the relative weight of dividends and repurchases In practice it is
unclear to what extent managers act this way (Brav et al 2005) Nonetheless for completeness we
also examine this variable We focus on the subsample of firms with both dividends and
repurchases in both Pre and Post period so as to capture changes in payout mix by firms routinely
using both vehicles to return cash to shareholders
As for the control variables in both Eqs (1) and (2) Controli is a vector of firm characteristics
identified in existent literature as determinants of payout policy (eg Fenn and Liang 2001 Brown
et al 2007 Skinner 2008 Cuny et al 2009) firm size book-to-market leverage asset tangibility
free cash flows cash holdings volatility in operating income institutional ownership sales
16 Fama and French (2001) suggest that repurchases are often complement to dividends while Grullon and Michaely
(2002) document that the increase in share repurchases over the past decades has come at the expense of a lower
increase in dividends consistent with a substitution hypothesis Brown et al (2007) also provide evidence of a
substitution effect in response to the 2003 dividend tax cut Survey evidence in Brav et al (2005) suggests an
asymmetric substitution effect with managers more willing to replace dividends with repurchases than the opposite
15
growth past stock returns and an indicator for loss firms For all of these variables we include
both changes from Pre to Post period and levels in the Pre period to allow for the possibility that
levels of these variables affect subsequent changes in payout policy 17 Finally we include
industry-fixed effects (Fama-French 48 industry indicators) to control for industry-level trends in
payout policies and option-based pay In unreported tests we replace free cash flows with two
separate variables operating profit and capital expenditures We also replace volatility in
operating income with volatility in stock returns Our results are unaffected More detailed
definitions of each variable are in the Appendix
24 Identification Assumption
The key identifying assumption underlying the difference-in-difference estimation
technique is that the parallel trends assumption is satisfied In the absence of treatment both
treated and control firms should experience parallel trends in the outcome variable Our approach
assumes that in the absence of FAS123R the change in dividends or repurchases would be the
same for high and low accounting impact firms Note that the well-documented contemporaneous
correlation between levels of option compensation (a key driver of the implied option expense and
thus the accounting impact) and levels of payout variables does not violate our identification
assumption This is because our assumption pertains to the relation between the level of option
compensation and future changes in payout variables
A specific concern is that options may be granted in anticipation of expected future
changes in payout policy (reverse causality problem) Relative to simple association tests this
concern is significantly reduced in our setting because the accounting impact is measured three
years prior to the arrival of treatment and is the result of option grants made over the prior four or
17 In untabulated analyses we run our tests after excluding changes in the control variables (ie including only their
pre-treatment levels) since in difference-in-difference studies controlling variables measured after the shock may
reintroduce selection bias Our inferences remain unchanged
16
five years depending on the vesting schedule18 For the reverse causality to be plausible the
implied option expense in 2002 (the result of option grants made approximately between 1998 and
2002) needs to reflect the anticipated change in payout policy in 2005-2007 This seems unlikely
While the parallel trend assumption is not directly testable similar to other studies (Bakke
et al 2015) we examine the trends in dividends and repurchases during the Pre period Figure 1
suggests that high and low accounting impact firms (respectively top and bottom quartile of
implied option expense) exhibit similar trends in payout variables in the Pre period ie from 2003
to 2004 More formally to examine the correlation between Accounting Impact and trends in the
payout variables during the Pre period we estimate the following regression only with
observations in 2003 and 2004
Payouti = γ0 + γ1 Accounting Impacti FY2004+ γ2 FY2004+ ΓControli +Firm FE +ui (3)
where Payouti is either DividendAssets or RepurchaseAssets FY2004 is an indicator of
fiscal year 2004 Firm FE indicates firm-fixed effects If firms with varying degrees of accounting
impact have different payout trends before the adoption of FAS123R γ1 should be different from
zero However for both payout variables we find that the estimated γ1 is close to zero and not
statistically significant at 10 level (untabulated tests) Overall the parallel trends assumption
seems reasonable in our setting
3 Empirical analyses
31 Sample Selection and Summary Statistics
Our sample is the SampP 1500 firms with available data on implied option expense (from
Compustat) and on executive compensation (from Execucomp) for at least one year in the Pre
18 The accounting treatment for stock options requires their fair value at the grant date to be recognized over the
service period (usually the vesting period) Hence the implied option expense in a given year includes a fraction of
the expense associated with past option grants
17
period and one year in the Post period to ensure consistency in the sample across periods Similar
to prior studies on payout policy (Fama and French 2001 Skinner 2008) we exclude financial
firms (SIC code between 6000 and 6999) and utilities (SIC between code 4900 and 4999) as well as
firms not incorporated in the US Our final sample includes 1176 firms19 We obtain dividend
and stock returns data from CRSP stock repurchases and dividend per share data from
COMPUSTAT and institutional ownership data from Thomson Reuters 13F database Other
control variables are from CRSP and COMPUSTAT To deal with outliers we winsorize all
continuous variables at 1 and 99 by fiscal year A detailed definition of all variables and their
sources is in Appendix
Table 1 Panel A presents summary statistics of the relevant variables for the pooled sample of
5653 firm-year observations Implied option expense in 2002 (our proxy for Accounting Impact)
is on average 173 of total assets with the median at 052 This suggests that the accounting
impact is very large for a small number of firms Over the entire sample period on average
dividends represent 093 of total assets while repurchases represent 394 Untabulated
analyses indicate that in 16 of the firm-year observations only dividends are paid out in 25
only repurchases in 32 both and in 27 neither Within the subset of firm-years with a payout
dividends represent 3874 of total payout This data confirms prior evidence that repurchases
have assumed the primary role as a vehicle to return cash to shareholders (eg Floyd et al 2015)
The mean (median) total executive pay (average across the top 5 executives) is $25 million ($16
million) On average option grants and restricted stock grants represent respectively 283 and
141 of total pay while salary and bonus comprise 296 and 197 respectively The
19 The results presented in the study are similar when (i) we restrict the sample to firms with available data for the
entire (2003-2007) sample period (1009 firms) and (ii) we exclude firms with CEO turnover in the Post period
(reducing the sample size to 780 firms) as a new CEO may have a different compensation package andor adopt a
different payout policy
18
composition of CEO pay (untabulated) is similar As for the control variables the figures are
generally consistent with other studies examining SampP 1500 firms over the same period
Panel B reports the pairwise Pearson correlations among the relevant variables The
correlations are in line with the associations documented in prior studies For example larger
firms and firms with higher profitability (free cash flows) have higher payouts loss firms have
lower payouts greater volatility in operating income is associated with lower dividends
More relevant to our analysis Panel C presents the mean of each variable in the Pre and Post
period for the full sample For each variable we first compute the firm-level mean over the Pre
and the Post Period and then compute the mean of the resulting figure across all firms There is a
striking increase in repurchases which double from 245 to 490 of total assets causing a
similar increase in total payout The increase in dividends is much smaller from 083 to 099
of total assets As a result for firms with positive payout dividends become a smaller fraction of
total payout in the Post period (2790 versus 3914 in the Pre period) This trend is consistent
with Floyd et al (2015) who document a dramatic increase in repurchases in the years leading to
the 2008 financial crisis Consistent with previous studies around FAS123R there is a significant
reduction in option grants as a fraction of total executive pay (from 343 to 240) and a
corresponding increase in the use of restricted stock (from 87 to 176) with little variation in
the weight of salary and bonus (note that restricted stock salary and bonus were expensed both
before and after FAS123R) Similar patterns hold for the composition of CEO pay (untabulated)
Compared to changes in the mix of executive pay changes in the levels of control variables are
generally less pronounced
Panel D reports the change in the key compensation and payout variables from the Pre to the
Post period by quartiles of implied option expense and yields a number of insights First
19
confirming the skewness suggested by Panel A the mean implied option expense is 551 for
firms in the top quartile versus only 093 035 and 012 for firms in the second third and
bottom quartile respectively Second as expected firms with higher implied option expense have
greater use of option-based pay For example in the Pre-period option pay represents 507 of
total executive pay at firms in the top quartile versus 201 in the bottom quartile Third and
more importantly for our research design the use of option pay changes significantly from the Pre
to the Post period as a function of the accounting impact For firms in the top quartile the
percentage of total pay represented by stock options drops by 182 (from 507 to 325)
versus 113 80 and 34 for firms in the second third and bottom quartile respectively The
decline in option usage across quartiles is accompanied by an increase in restricted stock grants
while the weight of salary and bonus shows little change It is important to emphasize the
substitution of stock options with restricted stocks because restricted stocks typically pay
dividends (Zhang 2013) thus providing further reason to expect a dividend increase in response to
the FAS123R-induced decline in option pay
As for the payout variables Panel D suggests that heavy option users (firms with higher
implied option expense) generally use repurchases more than dividends consistent with the
associations documented in earlier studies In the Pre period repurchases (dividends) represent
351 (030) of total assets for the top quartile versus 113 (112) for the bottom quartile
Panel D also indicates that the increase in repurchases documented in Panel C takes place across
all quartiles As for the (much smaller) change in dividends the absolute increase is similar across
the four quartiles though the relative increase (the percentage change) appears to be slightly
higher in the top quartile Overall these figures do not suggest a shift toward dividends and away
from repurchases by firms with a large (accounting-induced) decline in the use of option pay
20
Panel E presents the same data as Panel D but based on the definition of lsquotreatmentrsquo and
lsquocontrolrsquo in Bakke et al (2015) Under this definition 997 firms are classified as treatment group
and 177 as control (171 firms are classified as lsquocontrolrsquo because they did not grant options to the
CEO in the Pre period and 6 because they were voluntarily expensing options before 2003)
Interestingly lsquotreatedrsquo firms are equally distributed across the quartiles suggesting significant
variation in the degree of treatment As discussed earlier one benefit of our approach is that it
exploits cross-sectional variation among treatment firms in terms of the likely impact of FAS123R
Also 40 of the control firms (71 out of 177) are in the lowest quartile while 35 ((37+25)177)
are in the top two quartiles reflecting the different focus of the two approaches in terms of
identifying firms less affected by FAS123R20
As for payout and compensation variables Panel E shows that the treated group experiences a
larger increase in repurchases than the control group while the (less pronounced) increase in
dividends is similar across treated and control firms Treated firms experience a 126 decrease in
option pay (from 387 to 261) with a corresponding 94 increase in the weight of restricted
stock grants (from 80 to 174) The figures are similar at the CEO level (because the
classification is based on options grants to the CEO it is useful to report pay figures at both the top
5 executives and the CEO level) Interestingly the control group experiences a pronounced
increase in the weight of option grants in total CEO pay from 10 to 127 as almost half of the
control firms issued options to their CEOs in the Post period (for these firms options as percentage
of total CEO pay increased from 0 to 254 untabulated analysis) While this increased use of
stock options suggests (ex post) that these firms were not concerned with the impact of FAS123R
another possibility is that the lack of use of option compensation for CEOs in 2003 and 2004 was
20 In untabulated analysis we find that 55 of the 171 firms issuing no options to the CEO in the Pre period granted
options to the other top executives (and perhaps to other non-executive employees) thus explaining the relatively high
implied option expense for the control group (10 versus 19 for the treatment group ndash see Panel E)
21
temporary rather than the effect of a permanent policy If these firms were planning to issue
options to the CEO in the Post period the assumption that they were unaffected by FAS123R (and
thus their use as control sample) is questionable21
32 Differential Impact of FAS123R on the Use of Option-Based Compensation
An important building block of our approach is the presumed differential impact of FAS123R
on option-based pay as a function of pre-existing implied option expense22 While Table 1 Panel
D preliminarily supports the validity of this assumption we formally examine it by estimating Eq
(1)
As reported in Table 2 Panel A we find a significant negative association between Accounting
Impact and the change in option-based pay around the adoption of FAS123R In column (1)
where we use the quartile rank of implied option expense the -0044 coefficient implies that
around FAS123R option grants over total pay decline by 44 as we move from the highest
quartile to the next Thus the reduction in top quartile firms is 132 larger than in bottom
quartile firms In column 2 we replace the quartile rank with three indicators for the highest
quartiles (with the bottom quartile collapsed in the intercept) so as to be able to compare directly
top and bottom quartile without imposing the same effect across quartiles The negative and
significant coefficient on the top quartile indicator at -0140 suggests that the reduction in option
grants over total pay is 140 larger for top quartile firms relative to bottom quartile firms
Finally in column 3 we use the indicator for treated firms following Bakke et al (2015) The
21 Panel E also shows an increase in the use of restricted stock in CEO pay packages (from 128 to 182 almost
comparable to the increase among treated firms) The concurrent increase in options and restricted stock suggests
these firms would have increased option pay significantly more had it not been for FAS123R indicating further
caution in classifying them as control group of unaffected firms 22 This is akin to the relevance assumption of instrumental variable if we interpret the implied option expense as an
instrument to the change in option-based pay
22
negative and significant coefficient at -0132 suggests that treated firms experience a 132
larger drop in the weight of option pay relative to control firms
In Panel B we re-estimate Eq (1) using a panel regression with firm- and year-fixed effects
(5653 firm-year observations) where the dependent variable is the the ratio of option grants to
total executive pay The results are virtually identical in terms of significance and magnitude of
the coefficients of interest (the interaction terms between respectively Accounting impact and
Treated and an indicator for the Post period)
Overall Table 2 suggests that high implied option expense and the introduction of FAS123R
together strongly encouraged firms to cut back option-based compensation for executives It also
supports the general validity of the approach in Bakke et al (2015) in identifying firms most
affected by FAS123R notwithstanding the concerns outlined earlier
Our test of Eq (1) focuses on executive stock options For our dividend-protection hypothesis
it is important to establish that the level of implied option expense predicts a change in executive
stock options (rather than only a change in the use of non-executive employee stock options) as we
want to capture the effect of a change in executivesrsquo incentives on payout policy At the same
time our dilution channel hypothesis assumes a change in the use of all (executive and non-
executive employee) stock options Thus in untabulated analyses we repeat the test in Eq (1) by
replacing the dependent variable with the change in the number of options granted to all
employees (scaled by the total number of outstanding shares note for this analysis we can only
use data from 2004 to 2007 because Compustat began reporting data on ESO in 2004) The
coefficient on Accounting Impact and Treated continues to be negative and significant suggesting
that the differential reduction in the use of option compensation as a function of accounting impact
23
occurred for both executive and non-executive employee stock options Indeed Brown and Lee
(2011) report a similar decrease in executive and employee stock options around FAS123R
33 Option-Based Pay and Dividend Payouts
In this section we examine the effect of an exogenous (accounting-induced) change in option
compensation on dividend policy by estimating Equation (2)
Table 3 Panel A presents the results using the change in dividends from Pre to Post as
dependent variable We find no significant association between Accounting Impact (column 1 and
2) or Treated (column 3) and the change in dividends around the adoption of FAS123R This is in
stark contrast with the negative effect of option-based pay on dividends predicted in the literature
and documented in various association studies
One concern with this lack of effect is that perhaps our setting is not powerful enough to detect
it One way to examine this possibility is the following The coefficient on Accounting Impact
rank=4 in column 2 is 0001 and the standard error (SE) is 00009 Assuming the estimated
standard error is correct then for a two-tailed t test the coefficient needs to be greater than 00015
(=SE1645) or 015 to reach the 10 percent significant level In other words if moving from
the bottom to the top quartile (which predicts a 14 differential decline in option based pay as per
Table 2 Panel A) resulted in a 015 increase of the dividendasset ratio our test would be able to
detect a causal effect of option-based pay on dividends Given the unconditional mean of the
dividendasset ratio at 093 an increase of 015 from the Pre to the Post period seems
plausible In fact the average increase from the Pre to the Post period is 016 (Table 1 Panel C)
Thus if an effect was there our test should detect it
24
Panel B presents the results using a panel regression (5653 firm-year observations) with firm-
and year-fixed effects and interaction terms between Accounting Impact (or Treated) and an
indicator for the Post period Our inferences are unchanged
These analyses are based on our full sample which includes both dividend-paying and non-
dividend-paying firms Hence they implicity treat as equal two potentially different decisions to
initiate dividends and to increase dividends For example an increase in the dividend-to-asset
ratio from 05 to 06 will be treated the same as an increase from 00 to 01 even though
the latter represents a critical dividend initiation decision23 To address this following Chetty and
Saez (2005) we separately examine how FAS123R impacts the intensity of dividend changes (for
the subset of payers) and the likelihood of dividend initiations (for the subset of non-payers)
331 Option-Based Pay and Dividend Payouts Intensity of Dividend Changes
In the first row of Panel C we repeat the analysis in Panel A for the sub-sample of 572 payers
defined as firms with positive DPS in 2003 andor 2004 Note that we report only the coefficients
of interest for parsimony In the second row we replace the dependent variable with the
percentage change in DPS DPS is the choice variable for managers (Brav et al 2005 Baker and
Wurgler 2016) and thus our preferred measure to capture changes in dividend policy To account
for skewness in this variable (Khale 2002) in the third fourth and fifth rows we use indicator
variables to denote whether the change in DPS surpasses a threshold respectively 20 40 and
60 The proportion of firms that surpass these thresholds are 59 44 and 33 respectively24
23 Initiating dividends is a critical decision for boards given the pre-commitment value that investors attach to this
decision and the strong negative market reaction when firms eliminate or reduce dividends (Brav et al 2005) For
executives trying to maximize the value of their own stock options (dividend-protection argument) the ability to
influence a dividend initiation decision is likely lower than the ability to influence a dividend increase decision 24 Although in the third fourth and fifth rows our dependent variable is a binary variable we use a linear model (OLS)
instead of a probit or logit nonlinear model The reason is that estimating fixed effects in binary response models with
panel data can cause the incidental parameters problem The coefficient estimates can be biased when the panel data
25
Across all of these specifications we find no association between Accounting Impact or Treated
and the intensity of dividend changes Thus it does not appear that an exogenous reduction in
option-based pay caused dividend-paying firms to increase dividends
In Panel D we perform four robustness tests For parsimony we show only the coefficients of
interest and only the cases where the dependent variable is an indicator denoting a greater than
40 increase in DPS The results are similar for the other four ldquointensityrdquo dependent variables
reported in Panel C
In the first row we exclude firms that began to voluntarily expense options in 2003 or 2004
(84 firms of which 68 are dividend payers) FASB added accounting for stock-based
compensation to its agenda in March 2003 and issued an Exposure Draft proposing the expensing
of stock options at fair value in March 2004 In anticipation a number of firms began to
voluntarily expense stock options in 2003 and 2004 (Aboody et al 2004) If these firms reduced
option grants and as a result increased dividends during the Pre period then their inclusion may
reduce the power of our tests and thus our ability to detect the hypothesized relation25
In a similar spirit in the second row we exclude firms in the top decile in terms of reduction in
the ratio of option grants to total pay for the top 5 executives between 2002 (the year prior to the
Pre-period) and 2004 (the end of the Pre-period) This encompasses 113 firms of which 55 are
dividend payers If these firms reduced option grants in anticipation of FAS123R and as a result
increased dividends during the Pre period their inclusion may reduce our ability to detect the
hypothesized relation
has a large number of observations but a short time series Examples of studies making a similar choice are Puri
Rocholl and Steffen (2011) and Chu and Ma (2015) 25 This is unlikely to be a serious concern as previous studies suggest that voluntary expensers made limited use of
stock options (Aboody et al 2004) In fact in our sample 79 of these firms are in the bottom two quartiles of
implied option expense (untabulated) Nonetheless we present this test for robustness
26
In the third row we exclude firms that accelerated the vesting of options before FAS123R
became effective in order to avoid recognizing an expense for the unvested portion of these
options (Choudhary et al 2009 Balsam Reitenga and Yin 2008) This encompasses 196 firms of
which 54 are dividend payers If accelerating vesting was used to reduce the impact of FAS123R
the inclusion of these firms may reduce the power of our tests26
In the fourth row we deal with the concern that if firms target a fixed dividend to net income
ratio (Lintner 1956) and do so without adjusting for changes in accounting standards then by
decreasing net income (via option expense) the accounting change would mechanically cause a
reduction in dividends This would potentially offset and confound the increase predicted under
the dividend-protection and dilution hypotheses This seems unlikely for two reasons First firms
are notoriously reluctant to cut dividends (Brav et al 2005) Hence it seems unlikely that they
would reduce dividends in response to a decline in net income with no economic or cash flow
implications (ie re-classification of an expense from the footnotes to the income statement)
Second firms today set dividends in terms of dividend per share rather than by targeting a net
income-based payout ratio (Brav et al (2005)) As noted by Skinner (2008) over the last few
decades as earnings have become more variable the relation between earnings and dividends has
become weaker with dividend payments increasing smoothly and largely independent of the
variation in earnings Nevertheless in the fourth row we exclude the 66 dividend-paying firms that
26 These firms explicitly stated that they accelerated the vesting of stock options to avoid the accounting charge
(Choudhary et al 2009) In fact 72 are classified in the top two quartiles of implied option expense (untabulated)
Thus we would have predicted these firms to experience a significant decline in option pay To the extent that this
decline did not materialize because they minimized the impact of FAS123R by accelerating vesting the ability of
Accounting Impact to predict the reduction in option pay and thus its usefulness in examining changes in dividends
around FAS123R may be reduced The list of firms accelerating vesting was kindly provided by Jack Ciesielsky of
The Analystsrsquo Accounting Observer
27
had a similar payout ratio in 2003 and 2004 as a proxy for firms with a target net income-based
payout ratio in the Pre period27
As shown in Panel D even after excluding these subsets of firms we continue to find no
association between Accounting Impact or Treated and changes in dividends for dividend-paying
firms This is inconsistent with a causal influence of option compensation on dividend policy
Another concern is that by reducing net income and thus retained earnings FAS123R
may have pushed some firms closer to violating dividend covenants in debt contracts and
thus prevented them from increasing dividends This would bias our study against finding a
causal effect of option-based pay on dividends However this does not appear to be a
significant concern for three reasons First the recognition of an option expense does not
imply a decline in net income In fact more than 70 (75) of the full sample firms
(dividend payers) experienced an increase in net income before extraordinary items from
2004 to 2005 (the percentages are similar across the four quartiles of implied option
expense) Second dividend covenants are less common among dividend-paying firms
(Nikolaev 2010) Third most loan contracts in recent years give parties the option to
ldquofreezerdquo GAAP when facing a mandatory change in accounting principles (Christensen and
Nikolaev 2009) Firms expecting an adverse impact of FAS123R on their dividend covenants
would likely exercise this option (particularly given the non-cash nature of option-based
expense) Nonetheless to alleviate this concern we perform three additional analyses
(untabulated) (i) we repeat the tests in Panel C after excluding firms with a drop in net
income between 2004 and 2005 (ie firms that perhaps faced some covenant-related
27 We define a ldquosimilarrdquo payout to be an absolute change in payout ratio of less than 1 from 2003 to 2004 Among
these 66 firms only 39 continued to have a similar payout ratio in 2005 We also try an alternative definition where
a firm is classified as likely to be using a net income-based target payout ratio if the absolute percentage change in the
ratio from 2003 to 2004 is less than 10 (100 firms) Our inferences are unchanged
28
constrains to their payout policy as a result of FAS123R) (ii) we explicitly control for net
income and retained earnings in the regression (as in Skinner 2008) (iii) we repeat the tests
in Panel C for dividend payers with dividendsasset ratio above the sample median on the
basis that dividend covenants are less frequent among firms paying large dividends (Jung
Lee and Yang 2016) Our inferences are unchanged
332 Option-Based Pay and Dividend Payouts Dividend Initiations
In this section we examine whether the accounting-driven change in option pay affected
dividend initiations among non-payers We cannot employ the difference-in-difference approach
adopted so far by definition the same firm cannot initiate dividends in both periods However we
can provide suggestive evidence as follows First we take all firms that did not pay dividends in
2002 and group them into quartiles based on 2002 implied option expense For each quartile we
find the number of firms initiating dividends in 2003 and 2004 (the Pre period) Next we take all
firms that did not pay dividends in 2004 group them into quartiles based on 2002 implied option
expense and for each quartile find the number of firms initiating dividends in 2005 and 2006 (the
Post period) We do not include 2007 so as to have the same number of years in both periods and
make the cumulative initiation rates comparable
The left portion of Panel E reports the results of this exercise There is a general decrease in
the dividend initiation rate from the Pre to the Post period This holds both in the full sample of
non-payers (from 129 to 79) and across all quartiles This decrease may reflect a temporary
spike in 2003 and 2004 in response to the 2003 dividend tax cut documented in Chetty and Saez
(2005) It is noteworthy that initiation rates in both periods are lower among firms with higher
implied option expense This is consistent with option-heavy firms being mostly high-growth
firms less inclined to pay dividends More relevant to our research question if the lower use of
29
option compensation increased the propensity to pay dividends we would expect to see a relative
increase (ie a lower decrease) in dividend initiations among firms with the highest accounting
impact Instead the rate does not differ depending on the accounting impact There is
approximatley a 5 decline in initiation rate in each quartile In the right portion of Panel E we
examine similar data for dividend terminations While the results should be interpreted with
caution due to their rarity firms with higher accounting impact do not experience a greater decline
in termination rates Our inferences in Panel E are similar when we compared treated and control
firms following Bakke et al (2015) (untabulated)
Even after taking into account the different nature of decisions for dividend paying and non-
dividend-paying firms we fail to find evidence of a causal influence of option-based compensation
on dividend policy This finding is in contrast to the associations documented in earlier studies It
is even more remarkable as most firms replaced stock options with restricted stock which are
generally dividend-protected and should provide further incentive to increase dividends28
34 Option-Based Pay and Repurchases
In this section we examine the effect of an exogenous (accounting-induced) change in option
compensation on repurchases by estimating Equation (2)
Table 4 Panel A presents the results using the change in repurchases (scaled by total assets)
from Pre to Post as a dependent variable If the use of option-based pay had a positive effect on
firmsrsquo propensity to engage in repurchases as posited by the dividend-protection and dilution
hypotheses we should find a negative association between Accounting Impact or Treated and
repurchases Firms with a higher (accounting-driven) reduction in option-based pay should reduce
28 In a sample of SampP 500 firms between 2000 and 2009 Zhang (2013) reports that 80 of the firms granting
restricted stocks offer dividend protection In that sense the FAS123R-induced shift from stock options to restricted
stock may be characterized as a ldquoshockrdquo to dividend protection in unearned equity pay Accordingly our results cast
doubt on the causal interpretation of the positive association between dividend protection and dividend payouts
documented in prior studies (Zhang 2013 Burns et al 2015 Minnick and Rosenthal 2015)
30
the use of repurchases either because they are shifting toward a greater use of dividends andor
because they have a lower need to offset the dilutive effects of stock options However we find no
significant association between Accounting Impact (columns 1 and 2) and the change in
repurchases around the adoption of FAS123R When we use the Treated indicator (column 3) we
find a significant positive association rather than a negative one In Panel B we repeat the analysis
using net repurchases (ie repurchases after removing the effect of share issuances) following
Fama and French (2001) and Skinner (2008) Our inferences are unchanged29
This test is subject to two important caveats The first is we may not detect a decline in
repurchases because in the Post period firms need to offset the exercise of options that were
granted during the Pre period That is a post-FAS123R reduction in grants may not (yet) translate
into a reduction in exercises during the Post period which reduces our ability to test the dilution
hypothesis (ie that firms repurchase shares to offset exercises)30 However we can examine a
variation of this hypothesis where firms use repurchases to manage the effect of unexercised
options on diluted EPS (Bens et al 2003) To do so in Panel C we use a measure of adjusted
repurchases where we subtract our estimate of repurchases undertaken to offset the exercise of
ESO31 We effectively test whether firms experiencing an accounting-induced decrease in option
grants engage in less repurchases (net of exercise-driven repurchases) because their need to
manage the effect of unexercised options on diluted EPS is lower However the coefficient on
the variables of interest is either insignificant or positive inconsistent with the hypothesis
29 In the case of repurchases we do not examine separately ldquoinitiationsrdquo and ldquointensityrdquo as we do for dividends
because initiation is not clearly defined for repurchases Unlike dividends the occurrence of a repurchase in a given
year (or the lack thereof) cannot be used to infer a general policy due to the more discretionary nature of the timing of
repurchases 30 To capture the effect of lower option-based compensation on option exercises and thus on repurchases we would
ideally extend the Post period beyond 2007 However as noted by Floyd et al (2015) repurchases declined
dramatically after 2007 because of the financial crisis making it difficult to detect the effect of any other factor 31 As upper bound estimate of exercise-driven repurchases we multiply the number of ESO exercised during the year
times the average stock price during the year Since the number of ESO exercised is available in Compustat starting in
2004 Panel C is based on observations from 2004 to 2007
31
A second important caveat is that most firms replaced stock options with restricted stock
(Table 2 Panel C) Unvested restricted stock is excluded from the denominator in the computation
of basic EPS (once vested it is included) However it is included in the denominator of diluted
EPS using the treasury stock method similar to stock options Given the complexity of this
method without access to all details of restricted stock grants and option grants it is difficult to
determine whether the switch from stock options to restricted stock decreased the need for
dilution-driven repurchases as our test implicitly assumes Hence it is possible that we do not find
a decrease in repurchases because a reduced need to offset the dilutive effect of stock options was
neutralized by an increased need to offset the dilutive effect of restricted stock
Subject to the above caveats the evidence in Table 4 is not consistent with a positive causal
relation between the use of option-based pay and repurchases More precisely it suggests that
option-driven dilution concerns do not have a first-order effect on the magnitude of repurchases
even though they may play a role in the repurchase decision Hence our result is not necessarily
in conflict with the evidence in Brav et al (2005) where two-thirds of the surveyed financial
executives state that offsetting the dilutionary effect of stock option plans or other stock
programs is an important factor to their repurchase decisions
35 Option-Based Pay and Payout Composition
As an alternative to examining dividends and repurchases separately we also look at the
payout composition the change in the DividendsTotal Payout ratio from the Pre to the Post period
where Total Payout is the sum of dividends and repurchases As noted earlier we focus on the
subsample of firms with both dividends and repurchases in both Pre and Post periods so as to
capture the change in payout mix by firms routinely using both vehicles to return cash to
shareholders If the use of option-based pay causes firms to substitute repurchases for dividends
32
we should find a positive association between Accounting Impact or Treated and the payout mix
defined as DividendsTotal Payout ratio Firms with a higher accounting-driven reduction in
option-based pay should have an increase (decrease) in the relative weight of dividends
(repurchases) to the total payout However as reported in Table 5 Panel A we fail to find a
significant association between Accounting Impact (column 1 and 2) or Treated (column 3) and
the change in payout mix The results are similar when we use Net Payout (dividends plus net
repurchases) instead of Total Payout in computing the payout mix (Panel B)
Overall the combined evidence in Tables 3-5 does not support the hypothesis that option-
based compensation has negative (positive) effect on dividends (repurchases) or that it causes
firms to replace dividends with repurchases
4 Conclusion
Prior literature has documented robust associations between option-based compensation and
payout policy yet it remains unclear whether this association reflcts a causal influence We
investigate the causal effect of option-based compensation on payout policy using the adoption of
FAS123R which resulted in a significant decrease in option grants making it a plausible
exogenous shock to the use of option-based pay To overcome the challenge of no control group
we exploit the fact that firms responded differently depending on the firm-specific accounting
impact as measured by the implied option expense disclosed in the footnotes prior to FAS123R
Firms with larger expected accounting impact curtailed option-based compensation much more
aggressively than firms with lower impact Using a sample of SampP 1500 firms we find no
evidence that firms with a larger accounting-induced decline in option compensation increased
dividends reduced repurchases or changed their payout composition contrary to the widely held
belief that option-based pay has a causal influence on payout policy
33
Appendix Variable Definitions and Data Sources
Accounting Impact Variables
Accounting impact Implied option expense (Compustat XINTOPT) divided by total assets
(Compustat AT) This variable is measured at fiscal year 2002 and is time-invariant
Accounting impact rank The quartile rank of Accounting impact (1=lowest 4=highest)
Payout Variables
Regular dividendTotal assets The numerator is total regular cash dividends in the fiscal year
from the distribution dataset in CRSP Regular cash dividends are identified by the distribution
codes 1212 1222 1232 or 1242 The denominator is one-year lagged total assets (Compustat
AT)
DPS Dividend per share (Compustat DVPSX_F)
DPS pct change The percentage change of average DPS from Pre- to Post-FAS123R period
DPS pct change gtX indicator A dummy variable that equals one if DPC pct change is greater
than X and zero otherwise
RepurchaseTotal assets The numerator is the repurchase of common equity which equals total
repurchase (Compustat PRSTK) minus the change in preferred stock redemption value
(Compustat PSTKRV) The denominator is one-year lagged total assets (Compustat AT)
Net repurchaseTotal assets Net repurchase removes the effect of share issuances The
construction follows Fama and French (2001) and Skinner (2008) if the firm uses the treasury
stock method for repurchase net repurchase equals the increase in common treasury stock
(Compustat TSTKC) if the firm uses the retirement method (when common treasury stock is zero
in the current and prior year) net repurchase equals total repurchases minus stock issuance
(Compustat SSTK) and change in preferred stock redemption value (Compustat PSTKRV)
When the above measures give negative value net repurchase is set to zero
Adjusted repurchaseTotal assets Adjusted repurchase removes from total repurchase the potential
effect of repurchasing exercised options This variable equals total repurchase of common stocks
minus the product between the number of options exercised (Compustat OPTEXD) and average
stock price during the year When the above measure gives negative value adjusted repurchase is
set to zero Since the number of options exercised is not available before 2003 we drop
observations in 2003 when we use this variable
34
Total payoutTotal assets the sum of Regular dividendTotal assets and RepurchaseTotal assets
Regular dividendTotal payout regular cash dividend divided by the sum of regular cash dividend
and repurchase from common equity In the two-period analysis (Pre- vs Post-FAS123R) we
separately sum the numerator and the denominator for each firm-period and then calculate the ratio
Regular dividendNet payout regular dividend divided by the sum of regular dividend and net
repurchase In the two-period analysis (Pre- vs Post-FAS123R) we separately sum the numerator
and the denominator for each firm-period and then calculate the ratio
Compensation Variables
Salary_$ Average salary (Execucomp SALARY) of the top 5 highest paid executives in $1000
Salary_ Average salary (Execucomp SALARY) divided by average total pay (Execucomp
TDC1) of the top 5 highest paid executives
Bonus_$ Average bonus (Execucomp BONUS) of the top 5 highest paid executives in $1000
Due to a data format change we add non-equity plan-based awards (Execucomp
NON_EQ_TARG) to this measure after 2006
Bonus_ Bonus_$ divided by average total pay (Execucomp TDC1) of the top 5 highest paid
executives
Option grant_$ Average option grant value (Execucomp OPTION_AWARDS_BLK_VALUE or
OPTION_AWARDS_FV) of the top 5 highest paid executives in $1000 Due to a data format
change we use OPTION_AWARDS_FV for this measure after 2006
Option grant_ Option grant_$ divided by average total pay (Execucomp TDC1) of the top 5
highest paid executives
Restricted stock grant_$ Average restricted stock grant value (Execucomp RSTKGRNT or
STOCK_AWARDS_FV) of the top 5 highest paid executives in $1000 Due to data format
change we use STOCK_AWARDS_FV for this measure after 2006
Restricted stock grant_ Restricted stock grant_$ divided by average total pay (Execucomp
TDC1) of the top 5 highest paid executives
Total pay_$ Average total pay (Execucomp TDC1) of the top 5 highest paid executives in $1000
35
Other Characteristics
Size The book value of total assets (Compustat AT) minus the book value of common equity
(Compustat CEQ) plus the market value of common equity from CRSP in $M
Log(size) the natural logarithm of size
Book-to-market the book value of common equity dividend by its market value
Leverage long term debt plus short term debt (Compustat DLTT + DLC) divided by total assets
Asset tangibility tangible assets (Compustat AT - INTAN) divided by total assets
Free cash flow Operating cash flow (Compustat OANCF) minus capital expenditure (Compustat
CAPX) then divided by lagged total assets
Cash holding Cash and short-term investments (Compustat CHE) divided by total assets
ROA volatility the standard deviation of returns on assets (operating income before tax divided by
lagged total assets) in the past five fiscal years
Institutional ownership the number of shares held by institutional investors divided by the number
of shares outstanding from Thomson Reuters Institutional Holdings database
Sales growth the growth rate of sales (Compustat SALE) from the prior year
Past stock return annual stock return from the prior year
Loss indicator a dummy variable taking value of one if the current net income is negative and
zero otherwise
36
References
Aboody David 1996 Market Valuation of Employee Stock Options Journal of Accounting and
Economics 22 357-391
Aboody David Barth Mary E and Ron Kasznik 2004 Firms Voluntary Recognition of Stock-
Based Compensation Expense Journal of Accounting Research 42 123ndash150
Aboody David and Ron Kasznik 2008 Executive stock-based compensation and firmsrsquo cash
payout the role of shareholdersrsquo tax-related payout preferences Review of Accounting Studies
13 216ndash251
Anantharaman Divya and Yong Gyu Lee 2014 Managerial risk taking incentives and corporate
pension policy Journal of Financial Economics 111 328ndash351
Baker Malcolm and Jeffrey Wurgler 2004 A catering theory of dividends Journal of Finance
59 1125-1165
Baker Malcolm and Jeffrey Wurgler 2016 Dividends as reference points a behavioral signaling
approach Review of Financial Studies 29 697-738
Bakke Tor-Erik Hamed Mahmudi Chitru Fernando and Jesus Salas 2015 The causal effect of
option pay on corporate risk management Journal of Financial Economics forthcoming
Balsam Steven Austin Reitenga and Jennifer Yin 2008 Option acceleration in response to SFAS
No 123 (R) Accounting Horizons 22 23-45
Bens Daniel and Steven Monahan 2008 Altering Investment Decisions to Manage Financial
Reporting Outcomes Asset-Backed Commercial Paper Conduits and FIN 46 Journal of
Accounting Research 46 1017-1055
Bens Daniel A Venky Nagar Douglas J Skinner and MH Franco Wong 2003 Employee stock
options eps dilution and stock repurchases Journal of Accounting and Economics 36 51ndash90
Bertrand Marianne Esther Duflo and Sendhil Mullainathan 2004 How much should we trust
differences-in-differences estimates The Quarterly Journal of Economics 119 249ndash275
Blouin Jennifer L Jana S Raedy and Douglas A Shackelford 2011 Dividends Share
Repurchases and Tax Clienteles Evidence from the 2003 Reductions in Shareholder Taxes
The Accounting Review 86 887-914
Brav Alon John R Graham Campbell R Harvey and Roni Michaely 2005 Payout policy in the
21st century Journal of Financial Economics 77 483ndash527
Brown Lawrence D and Yen-Jung Lee 2011 Changes in Option-Based Compensation Around
the Issuance of SFAS123R Journal of Business Finance amp Accounting 38 1053ndash109
37
Brown Jeffrey R Nellie Liang and Scott Weisbenner 2007 Executive financial incentives and
payout policy Firm responses to the 2003 dividend tax cut Journal of Finance 62 1935ndash
1965
Burns Natasha Brian McTier and Kristina Minnick 2015 Equity-incentive compensation and
payout policy in Europe Journal of Corporate Finance 30 85-97
Carter Mary Ellen and Luann J Lynch 2003 The Consequences of the FASBrsquos 1998 Proposal on
Accounting for Stock Option Repricing Journal of Accounting and Economics 35 51-72
Carter Mary Ellen Luann J Lynch and Irem Tuna 2007 The role of accounting in the design of
CEO equity compensation The Accounting Review 82 327ndash357
Chava Sudheer and Amiyatosh Purnanandam 2010 CEOs versus CFOs Incentives and
corporate policies Journal of Financial Economics 97 263ndash278
Chetty Raj and Emmanuel Saez 2005 Dividend taxes and corporate behavior Evidence from the
2003 dividend tax cut The Quarterly Journal of Economics 120 791ndash833
Choudhary Preeti Shivaram Rajgopal and Mohan Venkatachalam 2009 Accelerated vesting of
employee stock options in anticipation of FAS123R Journal of Accounting Research 47 105ndash
146
Christensen Hans B and Valeri Nikolaev 2009 Contracting on Mandatory Changes to GAAP
New Practice and Its Determinants Working Paper University of Chicago
Chu Yongqiang and Tao Ma 2015 How does management compensation affect bank risk taking
evidence from FAS 123R University of South Carolina Working Paper
Cuny Charles J Gerald S Martin and John J Puthenpurackal 2009 Stock options and total
payout Journal of Financial and Quantitative Analysis 44 391ndash410
DeAngelo Harry Linda DeAngelo and Douglas J Skinner 2000 Special Dividends and the
Evolution of Dividend Signaling Journal of Financial Economics 57 309-354
Dechow Patricia M Amy P Hutton and Richard G Sloan 1996 Economic consequences of
accounting for stock-based compensation Journal of Accounting Research 34 1ndash20
Edgerton J 2013 Four facts about dividend payouts and the 2003 tax cut International Tax and
Public Finance 20 769-784
Edmans Alex and Xavier Gabaix 2015 Executive compensation a modern primer Journal of
Economic Literature forthcoming
38
Fama Eugene F and Kenneth R French 2001 Disappearing dividends changing firm
characteristics or lower propensity to pay Journal of Financial Economics 60 3ndash43
Farre-Mensa Joan Roni Michaely and Martin C Schmalz 2014 Payout policy Annual Review
of Financial Economics 6 75ndash134
Fenn George W and Nellie Liang 2001 Corporate payout policy and managerial stock
incentives Journal of Financial Economics 60 45ndash72
Ferri Fabrizio and Tatiana Sandino 2009 The impact of shareholder activism on financial
reporting and compensation the case of employee stock options expensing The Accounting
Review 84 433ndash466
Floyd Eric Nan Li and Douglas J Skinner 2015 Payout policy through the financial crisis the
growth of repurchases and the resilience of dividends Journal of Financial Economics 118
299-316
Frydman Carola and Dirk Jenter 2010 CEO compensation Annual Review of Financial
Economics 2 75-102
Gipper Brandon 2015 Assessing the Effects of Disclosing Management Compensation Working
Paper University of Chicago
Gormley Todd David Matsa and Todd Milbourn 2013 CEO compensation and corporate risk
evidence from a natural experiment Journal of Accounting and Economics 56 79-101
Graham John Michelle Hanlon and Terry Shevlin 2011 Real effects of accounting rules
evidence from multinational firmsrsquo investment locations and profit repatriation decisions
Journal of Accounting Research 49 137-185
Graham John Campbell Harvey and Shiva Rajgopal 2005 The Economic implications of
corporate financial reporting Journal of Accounting and Economics 40 3-73
Greenspan Alan 2002 Testimony of Alan Greenspan before the Committee on Banking
Housing and Urban Affairs US Senate July 16 Washington DC Government Printing
Office
Grullon Gustavo and Roni Michaely 2002 Dividends Share Repurchases and the Substitution
Hypothesis Journal of Finance 57 1649-1684
Hail Luzi Ahmed Tahoun and Clare Wang 2014 Dividend Payouts and Information Shocks
Journal of Accounting Research 52 403-456
Hall Brian J and Kevin J Murphy 2002 Stock options for undiversified executives Journal of
Accounting amp Economics 33 3-42
39
Hall Brian J and Kevin J Murphy 2003 The trouble with stock options Journal of Economic
Perspectives 17 49ndash70
Hanlon Michelle and Jeffrey L Hoopes 2014 What do firms do when dividend tax rates change
An examination of alternative payout responses Journal of Financial Economics 114 105-
124
Hayes Rachel M Michael Lemmon and Mingming Qiu 2012 Stock options and managerial
incentives for risk taking Evidence from FAS123R Journal of Financial Economics 105
174ndash190
Heron Randall A Erik Lie 2007 Does backdating explain the stock price pattern around
executive stock option grants Journal of Financial Economics 83 271-295
Hribar Paul Nicole Thorne Jenkins and W Bruce Johnson 2006 Stock repurchases as an
earnings management device Journal of Accounting and Economics 41 3ndash27
Jensen Michael C 1986 Agency cost of free cash flow corporate finance and takeovers
American Economic Review 76 323-329
Jolls Christine 1998 Stock repurchases and incentive compensation NBER Working Paper No
w6467
Jung Boochun Woo-Jong Lee and Yanhua Sunny Yang 2016 The Impact of Dividend
Covenants on Investment and Operating Performance Journal of Business Finance amp
Accounting 43 414ndash447
Kahle Kathleen M 2002 When a buyback isnrsquot a buyback open market repurchases and
employee options Journal of Financial Economics 63 235ndash261
Lambert Richard A William N Lanen and David F Larcker 1989 Executive stock option plans
and corporate dividend policy Journal of Financial and Quantitative Analysis 24 409ndash425
Lintner John 1956 Distribution of incomes of corporations among dividends retained earnings
and taxes The American Economic Review 46 97-113
Low Angie 2009 Managerial risk-taking behavior and equity-based compensation Journal of
Financial Economics 92 470-490
Miller Merton H and Franco Modigliani 1961 Dividend policy growth and the valuation of
shares The Journal of Business 34 411ndash433
Minnick Kristina and Leonard Rosenthal 2015 Stealth compensation Do CEOs increase their
pay by influencing dividend policy Journal of Corporate Finance 25 435-454
40
Murphy Kevin J 1999 Executive compensation In O Ashenfelter and D Card (eds) North
Holland Handbook of Labor Economics Amsterdam Elsevier Science BV
Murphy Kevin J 2013 Executive compensation Where we are and how we got there Handbook
of the Economics of Finance Elsevier Science North Holland 211-356
Nikolaev Valeri 2010 Debt Covenants and Accounting Conservatism Journal of Accounting
Research 48 143-176
Puri Manju Joumlrg Rocholl and Sascha Steffen 2011 Global retail lending in the aftermath of the
US financial crisis Distinguishing between supply and demand effects Journal of Financial
Economics 100 556-578
Shue Kelly and Richard R Townsend 2014 Swinging for the fences Executive reactions to
quasi-random option grants Working Paper University of Chicago
Skinner Douglas J 2008 The evolving relation between earnings dividends and stock
repurchases Journal of Financial Economics 87 582-609
Weisbenner Scott J 2000 Corporate share repurchases in the 1990s What role do stock options
play FEDS Working Paper No 2000-29
Zhang Dan 2013 CEO dividend protection Working Paper BI Norwegian Business School
41
Figure 1 Trends of dividends and repurchases from 2003 to 2007 Panel A plots the average
Regular DividendTotal Assets of firms in the highest and lowest quartiles of Accounting Impact
measured in 2002 Panel B shows the average Total RepurchaseTotal Assets of firms in the
highest and lowest quartiles of Accounting Impact measured in 2002
Panel A Trends of regular dividends
Panel B Trends of total repurchases
00
05
10
15
20
2003 2004 2005 2006 2007
Regular DividendTotal Assets
Lowest Acc Impact
Highest Acc Impact
Pre Post
00
20
40
60
80
100
2003 2004 2005 2006 2007
Total Repurchase Total Assets
Lowest Acc Impact
Highest Acc Impact
Pre Post
42
Table 1
Summary Statistics
Panel A Firm characteristics - full sample
N Mean Std dev 25 pctl Median 75 pctl
Accounting impact (2002) 1176 173 366 022 052 163
Payout variablesRegular dividendTotal assets 5653 093 148 000 000 142
RepurchaseTotal assets 5653 394 710 000 035 500
Total payoutTotal assets 5653 488 748 000 175 666
Regular dividendTotal payout 4091 3874 4057 000 2237 8833
Level of executive compensation (in $1000)
Salary_$ 5653 450 190 314 409 544
Bonus_$ 5653 476 616 122 295 586
Option grant_$ 5653 791 1137 62 384 1002
Restricted stock grant_$ 5653 458 866 0 58 518
Total pay_$ 5653 2481 2475 890 1647 3074
Percentage of executive compensation
Salary_ 5653 296 183 165 251 382
Bonus_ 5653 197 148 97 177 268
Option grant_ 5653 283 235 67 256 445
Restricted stock grant_ 5653 141 180 00 41 249
Control variables
Size ($M) 5653 11086 27294 1017 2459 8117
Log(size) 5653 7985 1565 6925 7808 9002
Book-to-market 5653 0445 0287 0251 0388 0578
Leverage 5653 0202 0172 0038 0187 0309
Asset tangibility 5653 0806 0184 0691 0853 0965
Free cash flow 5653 0059 0091 0013 0059 0108
Cash holding 5653 0166 0172 0034 0100 0247
ROA volatility 5653 0056 0056 0021 0038 0070
Institutional ownership 5653 0753 0202 0639 0795 0910
Sales growth 5653 0121 0189 0028 0096 0183
Past stock return 5653 0094 0183 -0012 0094 0199
Loss indicator 5653 0164 0370 0000 0000 0000
This table presents summary statistics Panel A shows the descriptive statistics of payout variables compensation
variables and other firm characteristics for the full sample Accounting impact is the implied option expense
measured at fiscal year 2002 All other variables are measured at firm-year level from fiscal year 2003 to 2007
resulting in 5653 firm-year observations (except for Regular dividendTotal Payout which can be measured only
for the 4901 firm-year observations with Total payout greater than zero) Panel B shows the pairwise correlations
between main variables at firm-year level Panel C compares payout variables compensation variables and other
firm characteristics before and after FAS123R The Pre-FAS123R period consists of fiscal year 2003 and 2004
the Post-FAS123R period covers fiscal year 2005-2007 Panel D compares the trends of payout and compensation
variables around FAS123R across four quartile groups ranked by 2002 accounting impact Panel E compares the
trends of payout and compensation variables around FAS123R between the treated and control group under the
alternative treatment definition in Bakke et al (2015) (see Section 22) All variables are defined in Appendix The
notation and in Panel C indicates statistically significant at 10 5 and 1 level in T-tests for equal
means respectively
43
Pa
nel
B
Pea
rso
n c
orr
ela
tio
ns
Reg div
Repurchase
Total payout
Salary_
Bonus_
Option_
RS_
Log(size)
BM
Leverage
Tangibility
FCF
Cash holdingROA vol
Inst own
Sales growth
Past ret
urn
Loss
Reg
div
10
0
Repurc
hase
01
610
0
Tota
l payout
03
509
810
0
Sala
ry_
-0
10
-01
8-0
19
10
0
Bonus_
00
700
100
3-0
01
10
0
Option_
-0
10
00
900
6-0
41
-03
510
0
RS
_
01
000
901
0-0
32
-01
1-0
40
10
0
Log(s
ize)
03
101
802
3-0
56
01
101
202
210
0
BM
-02
1-0
28
-03
103
0-0
03
-02
000
0-0
33
10
0
Levera
ge
-00
1-0
08
-00
8-0
05
00
6-0
11
00
801
9-0
03
10
0
Tangib
ility
00
200
100
101
200
1-0
05
-00
6-0
12
-00
4-0
18
10
0
FC
F02
203
703
9-0
20
00
901
1-0
01
02
4-0
32
-02
1-0
16
10
0
Cash
hold
ing
-01
301
000
700
2-0
14
02
2-0
10
-02
3-0
16
-03
502
901
210
0
RO
A v
ol
-01
5-0
04
-00
700
4-0
11
01
9-0
11
-02
3-0
08
-01
101
2-0
02
03
910
0
Inst
ow
n
-00
901
401
1-0
17
00
200
701
200
7-0
01
00
3-0
08
01
4-0
06
-01
110
0
Sale
s gro
wth
-00
8-0
04
-00
6-0
15
00
501
0-0
02
00
7-0
16
-00
3-0
08
01
300
201
400
410
0
Past
retu
rn00
901
301
4-0
18
01
5-0
01
00
301
6-0
29
-01
000
102
7-0
14
-01
001
602
710
0
Loss
-02
0-0
19
-02
201
8-0
18
00
4-0
05
-02
601
901
300
6-0
41
01
702
3-0
16
-01
8-0
40
10
0
44
Panel C Firm characteristics - before and after FAS123R
Pre FAS 123R Post FAS 123R Difference
Payout variables
Regular dividendTotal assets 083 099 016
RepurchaseTotal assets 245 490 245
Total payoutTotal assets 328 589 261
Regular dividendTotal payout 3914 2790 -1124
Level of executive compensation (in $1000)
Salary_$ 426 463 37
Bonus_$ 418 505 87
Option grant_$ 896 707 -191
Restricted stock grant_$ 269 574 305
Total pay_$ 2263 2584 321
Percentage of executive compensation
Salary_ 305 293 -12
Bonus_ 186 204 18
Option grant_ 343 240 -103
Restricted stock grant_ 87 176 89
Control variables
Size ($M) 9671 11631 1960
Log(size) 7860 8035 0175
Book-to-market 0437 0453 0016
Leverage 0201 0203 0002
Asset tangibility 0822 0793 -0029
Free cash flow 0061 0057 -0004
Cash holding 0175 0159 -0016
ROA volatility 0067 0048 -0019
Institutional ownership 0712 0781 0069
Sales growth 0137 0108 -0029
Past stock return 0080 0101 0021
Loss indicator 0173 0159 -0014
45
Pa
nel
D
Fir
m c
ha
racte
rist
ics
by q
ua
rtil
e o
f a
cco
un
tin
g i
mp
act
- b
efo
re a
nd
aft
er
FA
S1
23
R
Accounting im
pact
(2002)
Num
ber
of
Fir
ms
Pre
Post
Pre
Post
Pre
Post
Pre
Post
Payout
vari
able
s
Regula
r div
idendT
ota
l ass
ets
11
2
12
4
09
4
11
1
09
5
11
3
03
0
04
9
Repurc
hase
Tota
l ass
ets
11
3
26
8
19
2
37
3
32
7
63
1
35
1
68
7
Tota
l payout
Tota
l ass
ets
22
4
39
1
28
5
48
4
42
2
74
4
38
1
73
6
Regula
r div
idendT
ota
l payout
643
7
469
8
474
0
341
1
284
5
195
4
82
5
74
5
Perc
enta
ge o
f executive c
om
pensa
tion
Sala
ry_
337
295
313
287
296
289
276
300
Bonus_
223
226
214
228
172
192
134
169
Option g
rant_
201
167
290
210
373
260
507
325
Rest
ricte
d s
tock g
rant_
116
194
98
180
89
176
43
155
294
294
294
294
1st Q
uart
ile2
nd Q
uart
ile3
rd Q
uart
ile4
th Q
uart
ile
01
2
03
5
09
3
55
1
46
Accounting impact
Number of Firms
By accounting impact quartile
1
2
3
4
Pre Post Pre Post
Payout variables
Regular dividendTotal assets 09 11 08 10
RepurchaseTotal assets 18 31 26 52
Total payoutTotal assets 28 43 34 62
Regular dividendTotal payout 428 357 386 265
Percentage of executive compensation
Salary_ 435 364 282 280
Bonus_ 226 214 179 202
Option grant_ 92 125 387 261
Restricted stock grant_ 125 188 80 174
Percentage of CEO compensation
Salary_(CEO) 485 364 260 259
Bonus_(CEO) 249 228 185 219
Option grant_(CEO) 10 127 406 275
Restricted stock grant_(CEO) 128 182 82 183
Panel E Firm characteristics by alternative treatment definition - before and
after FAS123R
Treated
25
19
997
223
250
256
268
10
177
71
Control
44
37
47
Table 2
Differential effect of FAS123R on the use of option-based compensation
Panel A Two-period first-difference regression
Prediction Coeff t-stat Coeff t-stat Coeff t-stat
Accounting impact rank - -0044 -628
Accounting impact rank=2 - -0044 -327
Accounting impact rank=3 - -0075 -468
Accounting impact rank=4 - -0140 -613
Treated - -0132 -875
ΔLog(size) 0061 202 0061 200 0063 214
ΔBook-to-market 0032 091 0032 092 0051 143
ΔLeverage -0157 -213 -0160 -218 -0111 -153
ΔAsset tangibility -0012 -014 -0020 -023 -0023 -026
ΔFree cash flow -0106 -095 -0108 -097 -0128 -117
ΔCash holding -0197 -211 -0193 -206 -0180 -194
ΔFive-year ROA volatility -0065 -031 -0056 -026 -0098 -047
ΔInstitutional ownership -0044 -091 -0043 -088 -0044 -092
ΔSales growth -0064 -102 -0065 -104 -0090 -153
ΔPast one-year stock return 0051 078 0052 080 0091 138
ΔLoss frequency 0056 207 0057 207 0047 179
Log(size) -0009 -210 -0009 -207 -0002 -035
Book-to-market -0015 -056 -0013 -049 0018 072
Leverage 0022 046 0023 048 0068 150
Asset tangibility 0033 077 0033 078 0053 128
Free cash flow 0227 202 0220 195 0127 117
Cash holding -0002 -004 0012 019 -0078 -141
Five-year ROA volatility -0451 -240 -0430 -228 -0509 -283
Institutional ownership -0123 -360 -0122 -359 -0100 -292
Sales growth -0041 -056 -0040 -055 -0089 -125
Past one-year stock return -0009 -015 -0006 -010 0078 125
Loss frequency 0055 174 0056 178 0054 173
Fixed effect
Standard error
Adj R-squared
Observations
Model (3)
Dependent variable ΔAvg Option grantTotal pay
Huber-White
0156
This table investigates whether the effect of FAS123R on the use of option-based pay varies with its potential accounting impact Panel A
reports the results of estimating three two-period first-differencing models where for each firm we average its characteristics in Pre- and
Post-FAS123R period The Pre-FAS123R period consists of fiscal year 2003 and 2004 the Post-FAS123R period covers fiscal year 2005-
2007 In all three specifications the dependent variable is the change of average Option grantTotal pay from Pre- to Post-FAS123R period
The main independent variable varies by model in Model (1) the Accounting impact rank is the quartile rank of implied option expensetotal
assets measured in 2002 (1=lowest 4=highest) In Model (2) Accounting impact rank=2 (3 4) is an indicator that takes value of one if the
firmrsquos Accounting impact rank equals 2 (3 4) In Model (3) we use an alternative treatment construction following Bakke et al (2015)
where Treated is an indicator that takes value of zero if the firm granted zero option to its CEO in both 2003 and 2004 or the firm began to
voluntarily expense option-based pay at fair value in 2002 or earlier and one otherwise For each control variable we include both its level in
the Pre-FAS123R period and its change across the two periods Panel B shows the results of estimating fixed effect models with firm-year
observations The dependent variable is the firm-year level Option grantTotal pay The main independent variables are the interactions of
Post-FAS123R indicator (Post) with Accounting Impact rank Accounting impact rank indicators and Treated respectively All models in
Penal A have industry fixed effects and the standard errors are Huber-White heteroscedasticity-consistent standard errors All models in
Penal B have firm fixed effects and year fixed effects and the standard errors are clustered at firm level All variables are defined in
Appendix The notation and indicates statistically significant at 10 5 and 1 level respectively
Model (1) Model (2)
11711171 1171
Industry Industry
Huber-White
0124
Huber-White
0123
Industry
48
Panel B Panel fixed effects regression
Prediction Coeff t-stat Coeff t-stat Coeff t-stat
Acc impact rank x Post - -0044 -807
Acc impact rank 2 x Post - -0046 -333
Acc impact rank 3 x Post - -0077 -526
Acc impact rank 4 x Post - -0137 -776
Treated x Post - -0145 -970
Log(size) 0034 221 0034 217 0036 229
Book-to-market 0018 084 0017 083 0015 070
Leverage -0004 -009 -0006 -013 -0007 -015
Asset tangibility 0007 012 0004 006 0011 018
Free cash flow -0074 -151 -0072 -146 -0078 -158
Cash holding -0048 -086 -0050 -090 -0006 -011
Five-year ROA volatility 0250 231 0239 219 0437 414
Institutional ownership 0043 159 0044 161 0041 150
Sales growth -0033 -168 -0034 -171 -0031 -158
Past one-year stock return 0067 221 0068 224 0063 204
Loss indicator 0023 209 0022 207 0024 222
Fixed effects
Standard error
Adj R-squared
Observations
Dependent variable Option grantTotal pay
5653 5653 5653
Clustered by firm
Firm Year
Clustered by firm
Firm Year
Clustered by firm
0523 0523 0526
Model (1) Model (2) Model (3)
Firm Year
49
Table 3
Effect of option-based compensation on dividend policy
Panel A Two-period first-difference regression
Prediction Coeff t-stat Coeff t-stat Coeff t-stat
Accounting impact rank + 0000 077
Accounting impact rank=2 + 0001 091
Accounting impact rank=3 + 0000 044
Accounting impact rank=4 + 0001 092
Treated + 0000 -026
ΔLog(size) 0000 -030 0000 -030 0000 -026
ΔBook-to-market -0002 -190 -0002 -193 -0002 -195
ΔLeverage -0002 -059 -0002 -057 -0002 -059
ΔAsset tangibility 0016 431 0016 429 0016 430
ΔFree cash flow 0017 373 0017 373 0017 375
ΔCash holding -0011 -288 -0011 -285 -0010 -282
ΔFive-year ROA volatility 0003 034 0002 032 0003 035
ΔInstitutional ownership -0002 -073 -0002 -073 -0002 -070
ΔSales growth -0001 -040 -0001 -037 -0001 -038
ΔPast one-year stock return 0002 077 0002 076 0002 070
ΔLoss frequency 0000 -048 0000 -045 0000 -046
Log(size) 0000 183 0000 182 0000 182
Book-to-market -0002 -227 -0002 -225 -0002 -284
Leverage -0001 -037 -0001 -039 -0001 -048
Asset tangibility 0003 179 0003 180 0003 176
Free cash flow 0017 291 0017 291 0017 300
Cash holding 0002 080 0002 077 0002 098
Five-year ROA volatility 0003 035 0002 033 0003 044
Institutional ownership -0001 -068 -0001 -068 -0001 -058
Sales growth -0004 -177 -0004 -175 -0004 -172
Past one-year stock return 0004 169 0004 167 0004 165
Loss frequency -0001 -111 -0001 -109 -0001 -102
Fixed effect
Standard error
Adj R-squared
Observations
Dependent variable ΔAvg Regular dividendTotal assets
This table investigates the causal effect of option-based pay on dividend policy by examining whether changes in dividend policy around
FAS123R vary with its potential accounting impact Panel A reports the results of estimating three two-period first-differencing models
where for each firm we average its characteristics in Pre- and Post-FAS123R period In all three specifications the dependent variable is
the change of average Regular dividendTotal assets from Pre- to Post-FAS123R period The main independent variable varies by model in
Model (1) the Accounting impact rank is the quartile rank of implied option expensetotal assets measured in 2002 (1=lowest 4=highest) In
Model (2) Accounting impact rank=2 (3 4) is an indicator that takes value of one if the firmrsquos Accounting impact rank equals 2 (3 4) In
Model (3) we use an alternative treatment construction following Bakke et al (2015) where Treated is an indicator that takes value of zero
if the firm granted zero option to its CEO in both 2003 and 2004 or the firm began to voluntarily expense option-based pay at fair value in
2002 or earlier and one otherwise For each control variable we include both its level in the Pre-FAS123R period and its change across the
two periods Panel B shows the results of estimating fixed effect models with firm-year observations The dependent variable is the firm-
year level Regular dividendTotal assets The main independent variables are the interactions of Post-FAS123R indicator (Post) with
Accounting Impact rank Accounting impact rank indicators and Treated respectively Panel C examines the intensity of dividend changes
among firms with nonzero dividend per share in 2003 or 2004 In particular we estimates the same three models as in Panel A(with the
same independent variables) but for five dependent variables the change of average Regular dividendTotal assets from Pre- to Post-
FAS123R period (as in Panel A) the percentage change of DPS (dividend per share) from Pre- to Post-FAS123R period and three
indicators denoting respectively whether the percentage change of DPS was greater than 20 40 and 60 Panel D reports four
robustness tests of the dividend intensity regression In each of them a set of possible confounding observations is removed (see Section 33
for details) Panel E compares the trends of dividend initiation and termination around FAS123R across four quartile groups ranked by
accounting impact All models in Panel A C and D have industry fixed effects and the standard errors are Huber-White heteroscedasticity-
consistent standard errors All models in Penal B have firm fixed effects and year fixed effects and the standard errors are clustered at
firm level All variables are defined in Appendix The notation and indicates statistically significant at 10 5 and 1 level
Industry Industry Industry
Model (1) Model (2) Model (3)
1171 1171 1171
Huber-White Huber-White Huber-White
0105 0104 0105
50
Panel B Panel fixed effects regression
Prediction Coeff t-stat Coeff t-stat Coeff t-stat
Acc impact rank x Post + 0000 122
Acc impact rank 2 x Post + 0001 110
Acc impact rank 3 x Post + 0001 094
Acc impact rank 4 x Post + 0001 129
Treated x Post + 0000 -012
Log(size) 0001 179 0001 179 0001 181
Book-to-market 0000 025 0000 024 0000 031
Leverage 0001 062 0001 064 0001 069
Asset tangibility 0009 360 0009 358 0009 363
Free cash flow 0002 090 0002 093 0002 092
Cash holding -0007 -295 -0007 -298 -0007 -298
Five-year ROA volatility 0001 041 0001 038 0000 -006
Institutional ownership 0000 -027 0000 -026 0000 -027
Sales growth 0000 053 0000 051 0000 044
Past one-year stock return 0001 089 0001 088 0001 078
Loss indicator 0000 -060 0000 -057 0000 -076
Fixed effects
Standard error
Adj R-squared
Observations
Dependent variable Regular dividendTotal assets
Model (1) Model (2) Model (3)
Firm Year Firm Year Firm Year
5653 5653 5653
Clustered by firm Clustered by firm Clustered by firm
0877 0877 0877
51
Panel C Intensity of dividend changes around FAS123R
Prediction Coeff t-stat Coeff t-stat Coeff t-stat
Accounting impact rank + 0000 065
Accounting impact rank=2 + 0000 048
Accounting impact rank=3 + 0000 026
Accounting impact rank=4 + 0002 080
Treated + 0001 063
Dependent var DPS pct change
Accounting impact rank + -0145 -072
Accounting impact rank=2 + 0018 006
Accounting impact rank=3 + -0177 -045
Accounting impact rank=4 + -0746 -100
Treated + -0407 -119
Accounting impact rank + 0029 095
Accounting impact rank=2 + 0040 074
Accounting impact rank=3 + 0092 139
Accounting impact rank=4 + 0008 007
Treated + -0007 -012
Accounting impact rank + 0024 076
Accounting impact rank=2 + 0047 088
Accounting impact rank=3 + 0079 114
Accounting impact rank=4 + -0003 -002
Treated + 0030 052
Accounting impact rank + 0030 098
Accounting impact rank=2 + 0078 155
Accounting impact rank=3 + 0085 130
Accounting impact rank=4 + 0014 012
Treated + -0006 -011
Control variables
Fixed effect
Standard error
Observations 572 572 572
Yes Yes Yes
Huber-White Huber-White Huber-White
Industry Industry Industry
Dependent var DPS pct
change gt60 indicator
Model (1) Model (2) Model (3)
Dependent var ΔAvg Regular
dividendAssets
Dependent var DPS pct
change gt20 indicator
Dependent var DPS pct
change gt40 indicator
52
Panel D Robustness tests for intensity of dividend changes around FAS123R
Prediction Coeff t-stat Coeff t-stat Coeff t-stat
Accounting impact rank + 0006 017
Accounting impact rank=2 + 0067 118
Accounting impact rank=3 + 0041 057
Accounting impact rank=4 + -0061 -049
Treated + 0022 035Observations
Accounting impact rank + 0009 027
Accounting impact rank=2 + 0058 106
Accounting impact rank=3 + 0032 043
Accounting impact rank=4 + -0032 -024
Treated + 0018 028
Observations
Accounting impact rank + 0030 089
Accounting impact rank=2 + 0039 071
Accounting impact rank=3 + 0122 168
Accounting impact rank=4 + -0063 -052
Treated + 0075 132
Observations
Accounting impact rank + 0008 023
Accounting impact rank=2 + 0023 042
Accounting impact rank=3 + 0048 064
Accounting impact rank=4 + -0042 -033
Treated + -0010 -016
Observations
Control variables
Fixed effect
Standard error
Exclude firms with stable
payout ratio from 2003 to 2004
506 506 506
Dependent variable DPS pct change gt40 indicator
Model (1) Model (2) Model (3)
Exclude voluntary expensers
519 519
Exclude firms in the top decile
of option reduction (02-04)
Exclude firms that accelerated
option vesting
504 504 504
517 517 517
519
Huber-White Huber-White Huber-White
Yes Yes Yes
Industry Industry Industry
53
Panel E Dividend initiation and termination rates around FAS123R
Pre FAS 123R
1 280 75 7 6 13 173
2 284 135 18 9 27 200
3 286 181 11 14 25 138
4 282 260 9 10 19 73
Total 1132 651 45 39 84 129
Post FAS 123R
1 275 63 4 4 8 127
2 280 116 9 9 18 155
3 276 152 9 3 12 79
4 263 223 5 1 6 27
Total 1094 554 27 17 44 79
Pre FAS 123R
1 280 205 2 0 2 10
2 284 149 7 1 8 54
3 286 105 0 0 0 00
4 282 22 0 0 0 00
Total 1132 481 9 1 10 21
Post FAS 123R
1 275 212 3 6 9 42
2 280 164 1 2 3 18
3 276 124 1 1 2 16
4 263 40 0 3 3 75
Total 1094 540 5 12 17 31
termination
in 2004
03-04
cumulative
03-04
cumulative
Quartile firms
with
dividend in
2004
termination
in 2005
termination
in 2006
05-06
cumulative
05-06
cumulative
Termination
Quartile firms
with
dividend in
2002
termination
in 2003
without
dividend in
2004
initiation in
2003
initiation in
2004
03-04
cumulative
03-04
cumulative firmsQuartile
firmsQuartile initiation in
2005
initiation in
2006
05-06
cumulative
05-06
cumulative
Initiation
without
dividend in
2002
54
Table 4
Effect of option-based compensation on repurchases
Panel A Two-period first-difference regression with total repurchase
Prediction Coeff t-stat Coeff t-stat Coeff t-stat
Accounting impact rank - 0002 122
Accounting impact rank=2 - 0002 071
Accounting impact rank=3 - 0005 123
Accounting impact rank=4 - 0007 102
Treated - 0014 365
Control variables
Fixed effect
Standard error
Adj R-squared
Observations
Panel B Two-period first-difference regression with net repurchase
Prediction Coeff t-stat Coeff t-stat Coeff t-stat
Accounting impact rank - 0003 166
Accounting impact rank=2 - 0002 051
Accounting impact rank=3 - 0006 165
Accounting impact rank=4 - 0009 137
Treated - 0010 300
Control variables
Fixed effect
Standard error
Adj R-squared
Observations
Panel C Two-period first-difference regression with repurchase adjusted for exercised options
Prediction Coeff t-stat Coeff t-stat Coeff t-stat
Accounting impact rank - 0001 056
Accounting impact rank=2 - 0002 062
Accounting impact rank=3 - 0007 172
Accounting impact rank=4 - -0001 -008
Treated - 0006 197
Control variables
Fixed effect
Standard error
Adj R-squared
Observations
Dependent variable ΔAvg RepurchaseTotal assets
This table investigates the causal effect of option-based pay on payout policy by examining whether the changes of repurchase around
FAS123R vary with its potential accounting impact Panel A reports the results of estimating three two-period first-differencing models
where for each firm we average its characteristics in Pre- and Post-FAS123R period In all three specifications the dependent variable is
the change of average RepurchaseTotal assets from Pre- to Post-FAS123R period The main independent variable varies by model in
Model (1) the Accounting impact rank is the quartile rank of implied option expensetotal assets measured in 2002 (1=lowest 4=highest)
In Model (2) Accounting impact rank=2 (3 4) is an indicator that takes value of one if the firmrsquos Accounting impact rank equals 2 (3 4)
In Model (3) we use an alternative treatment construction following Bakke et al (2015) where Treated is an indicator that takes value of
zero if the firm granted zero option to its CEO in both 2003 and 2004 or the firm began to voluntarily expense option-based pay at fair
value in 2002 or earlier and one otherwise Panel B reports the regressions with the change of Net repurchaseTotal assets as the
dependent variable and the same independent variable as in Panel A Panel C reports the regressions with the change of Adjusted
repurchaseTotal assets as the dependent variable and the same independent variable as in Panel A All models in Panel A B and C have
industry fixed effects and the standard errors are Huber-White heteroscedasticity-consistent standard errors All variables are defined in
Appendix The notation and indicates statistically significant at 10 5 and 1 level respectively
Model (1) Model (2) Model (3)
Yes Yes Yes
Industry Industry Industry
Huber-White Huber-White Huber-White
Dependent variable ΔAvg Net repurchaseTotal assets
1171 1171 1171
0238 0237 0245
Model (1) Model (2) Model (3)
Yes Yes Yes
Industry Industry Industry
Huber-White Huber-White Huber-White
Dependent variable ΔAvg Adjusted repurchaseTotal assets
0229 0229 0233
1171 1171 1171
Model (1) Model (2) Model (3)
Yes Yes Yes
Industry Industry Industry
Huber-White Huber-White Huber-White
0111 0112 0114
1168 1168 1168
55
Table 5
Effect of option-based compensation on payout mix
Panel A Two-period first-difference regression with total payout mix
Prediction Coeff t-stat Coeff t-stat Coeff t-stat
Accounting impact rank + 0006 028
Accounting impact rank=2 + 0018 045
Accounting impact rank=3 + -0001 -001
Accounting impact rank=4 + 0043 052
Treated + -0035 -094
Control variables
Fixed effect
Standard error
Adj R-squared
Observations
Panel B Two-period first-difference regression with net payout mix
Prediction Coeff t-stat Coeff t-stat Coeff t-stat
Accounting impact rank + -0002 -008
Accounting impact rank=2 + 0008 016
Accounting impact rank=3 + 0018 034
Accounting impact rank=4 + -0059 -055
Treated + -0050 -101
Control variables
Fixed effect
Standard error
Adj R-squared
Observations
0049 0043 0054
257 257 257
Industry Industry Industry
Huber-White Huber-White Huber-White
Dependent variable ΔAvg Regular dividendNet payout
Model (1) Model (2) Model (3)
Yes Yes Yes
0154 0151 0156
362 362 362
Industry Industry Industry
Huber-White Huber-White Huber-White
This table investigates the causal effect of option-based pay on payout mix for firms using both dividend and repurchase by examining
whether the changes of payout mix around FAS123R vary with its potential accounting impact Panel A reports the results of estimating
three two-period first-differencing models where for each firm we average its characteristics in Pre- and Post-FAS123R period In all three
specifications the dependent variable is the change of average Regular dividendTotal payout from Pre- to Post-FAS123R period The main
independent variable varies by model in Model (1) the Accounting impact rank is the quartile rank of implied option expensetotal assets
measured in 2002 (1=lowest 4=highest) In Model (2) Accounting impact rank=2 (3 4) is an indicator that takes value of one if the firmrsquos
Accounting impact rank equals 2 (3 4) In Model (3) we use an alternative treatment construction following Bakke et al (2015) where
Treated is an indicator that takes value of zero if the firm granted zero option to its CEO in both 2003 and 2004 or the firm began to
voluntarily expense option-based pay at fair value in 2002 or earlier and one otherwise Panel B reports the regressions with the change of
Regular dividendNet payout as the dependent variable and the same independent variables as in Panel A Panel A (Panel B) is based on
observations with nonzero regular dividend and repurchase (net repurchase) in both Pre- and Post-FAS123R period All models in Panel A
and B have industry fixed effects and the standard errors are Huber-White heteroscedasticity-consistent standard errors All variables are
defined in Appendix The notation and indicates statistically significant at 10 5 and 1 level respectively
Yes Yes Yes
Dependent variable ΔAvg Regular dividendTotal payout
Model (1) Model (2) Model (3)

9
FAS123R effectively assuming that such change is ldquoexogenousrdquo (eg Chava and Purnanandam
2010 Anantharaman and Lee 2014) The problem with this approach is that FAS123R per se did
not generate exogenous cross-sectional variation in option compensation Even if the introduction
of FAS123R is exogenous a firmrsquos response cannot be assumed to be entirely exogenous10
To identify the exogenous portion of firmsrsquo response to the new standard we make use of
evidence that FAS123Rrsquos impact on the use of option compensation varies with the firm-specific
expected accounting impact of the new rule as measured by the implied option expense disclosed
in the footnotes prior to FAS123R (Hayes et al 2012) The reduction in option usage is highest in
firms with the largest implied option expense Thus we can use the differential accounting impact
of FAS123R to overcome the problem of lacking control group
To validate our approach we estimate the following first-differencing regression with
ordinary lease square (OLS)
ΔOptioni = β0 + β1 Accounting Impacti + ΛControli +εi (1)
where ΔOptioni is the change in the average value of executive stock options as percentage of total
pay from the pre- to the post-FAS123R period Accounting Impacti is the implied option expense
measured prior to FAS123R (more details in Section 22) We expect β1 to be negative that is a
more pronounced reduction in option-based pay for firms with higher expected accounting impact
Next after validating the differential impact of FAS123R we examine the central question
of this study by estimating the following OLS regression
ΔPayouti = γ0 + γ1 Accounting Impacti + ΓControli +ui (2)
10 A universally assigned encouragement to receive treatment does not make the realization of treatment assignment
free from endogeneity concerns Consider the following example after the adoption of FAS123R firm A reduces the
weight of option-based pay by 20 and firm B by 40 A finding that firm B increases dividends compared to firm A
cannot be interpreted as evidence of a causal influence of option compensation on dividend policy This is because the
additional reduction in option compensation by firm B relative to firm A may not be driven by FAS123R It may
instead reflect an attempt to align executivesrsquo incentives with anticipated changes in dividend policy (reverse
causality) Without a way to incorporate the heterogeneous impact of FAS123R in the research design the cross
sectional variation in changes in option-based compensation is still subject to the usual endogeneity concerns
10
where ΔPayouti represents the change in the average value of one of the payout variables
of interest (described in Section 23) from the the pre- to the post-FAS123R period
Eq (2) is essentially a difference-in-difference approach to estimate the effect of option-
based pay on payout policy using the differential accounting impact of FAS123R to capture the
exogenous (accounting-induced) portion of the change in option-based pay If option-based pay
has a detectable causal effect on dividends (repurchases) in the direction predicted by the
literature γ1 should be positive (negative)
As noted by Bertrand Duflo and Mullainathan (2004) in difference-in-difference studies
with panel data OLS may yield inconsistent standard error estimates because the dependent
variable and the main independent variable tend to be serially correlated within firm To alleviate
this concern following Bertrand et al (2004) in both Eqs (1) and (2) we collapse the panel to a
single ldquoPrerdquo (2003-2004) and a single ldquoPostrdquo (2005-2007) period by averaging across years and
then measuring the changes from Pre to Post11 We choose 2003 as the starting period in order to
capture a period subsequent to the 2003 tax cut on individual dividend income While the
evidence on the effect of the tax cut on payout policy is mixed (Chetty and Saez 2005 Edgerton
2013 Floyd et al 2015) starting with 2003 allows the pre-FAS123R levels of the key variables to
reflect any effect of the tax cut 12 We end our analysis in 2007 to avoid the potentially
confounding effect of the 2008 financial crisis which had a significant impact on payouts (Floyd et
al 2015)13 Following Hayes et al (2012) and Bakke et al (2015) we include 2005 in the Post
11 In the collapsed two-period panel a regression of changes is equivalent to a regression of levels with firm-fixed
effects and an indicator for the Post period Both approaches obviate unobserved time-invariant firm heterogeneity
We choose first differencing equation for a more intuitive interpretation 12 The Jobs and Growth Tax Relief Reconciliation Act of 2003 was signed into law on May 28 2003 but had been
proposed on January 7 2003 and was made retroactive to the beginning of 2003 Chetty and Saez (2005) show that
the tax change affected dividend policy in 2003 13 In November 2006 the Securities and Exchange Commission required more details about the terms of performance-
based incentive plans We are not aware of any evidence that these rules affected the weight of option-based pay
11
period because FAS123R while effective in June 2005 was released in December 2004 14
Alternatively in untabulated tests we exclude 2005 from the analysis and obtain similar results
Another benefit of using a single Pre and Post period is that it is better suited than panel
data to the analysis of repurchases As noted by Skinner (2008) firms engaging in repurchases
tend to do so every other year thus the relation between repurchases and economic determinants is
stronger over two- or three-year periods than one-year periods Factors explaining the timing of
repurchases differ from those explaining their level and the year-to-year variation in repurchases is
not necessarily informative of changes in payout policy As we are not interested in the timing of
repurchases our approach seems to better capture ldquolong-runrdquo changes in payout policy However
for the analysis of dividends (which are generally paid every year and thus not subject to the
above problem) we also present the results using a panel regression with firm- and year-fixed
effects To alleviate the problem of serial correlation discussed earlier we cluster the standard
errors by firm
22 Accounting Impact
As noted earlier all firms were affected by FAS123R making it difficult to identify a
control sample To capture variation in the cross-sectional impact of FAS123R in Eqs (1) and (2)
we use Accounting Impacti defined as the implied option expense disclosed in the footnote of the
income statement for the 2002 fiscal year scaled by total assets (we obtain similar findings when
scaling it by revenues) We measure this variable in 2002 (ie before the Pre period) rather than in
2003 or 2004 to avoid any confounding effect from the expected adopion of FAS123R (see
discussion in Section 33) As this variable is highly skewed (see Table 1) we define it based on
(Gipper 2015) or had any effect on payout policy However we exclude 2007 from the Post period in robustness tests
Our inferences are unchanged 14 FAS123R was released in December 2004 effective as of the beginning of the first interim or annual reporting
period beginning after June 15 2005 Subsequently the SEC allowed a six-month deferral making the standard
effective for fiscal years beginning after December 15 2005
12
its quartile rank We also presents results with separate indicators for the top three quartiles in
order to better isolate the difference between top quartile (the most lsquotreatedrsquo group) and bottom
quartile (the least lsquotreatedrsquo group and thus closer to the notion of a control group)
An alternative way to address the issue of a lack of control group is suggested by Bakke et
al (2015) They argue that two sets of firms were likely lsquounaffectedrsquo by FAS123R (i) firms that
did not grant options to the CEO in 2003 and 2004 as in these firms FAS123R could not affect
CEO option pay and thus her incentives to make policy changes (ii) firms that were already
voluntarily expensing stock options as of 2002 (ie before FASB began discussions of the new
standard) as these firms would not face any additional accounting charge under FAS123R
Our approach offers a number of advantages First instead of collapsing all lsquonon-controlrsquo
firms in a single lsquotreatedrsquo group we exploit cross-sectional variation among treatment firms in
terms of the likely impact of FAS123R effectively using the most and least affected firms
(respectively top and bottom quartile of implied option expense) as treatment and control group
As shown in Table 1 the implied option expense is highly skewed (ie only a relatively small
number of firms was heavily affected by FAS123R) Capturing this variation is likely to increase
the power of the test Second in Bakke et al (2015) what matters is that the treatment definition
captures an accounting-driven change in CEO option grants as their focus is on CEO risk-taking
incentives In our setting we want to capture an accounting-driven change both in CEO option
grants (predicted to affect incentives to use dividends) and in the overall use of stock options
(predicted to affect the use of repurchases) As noted in Section 31 (see footnote 20) many firms
without CEO option grants in 2003 and 2004 were issuing options to non-CEO executives and
other employees and thus facing a potential accounting charge under FAS123R Third about half
of the firms without CEO option grants in 2003 and 2004 issued options to the CEO in the Post-
13
period Hence it is not clear that the control firms were truly unaffected by FAS123R Finally
the implied option expense in 2002 (our measure of the expected accounting impact) is a function
of option grants made in prior years when firms could not anticipate the adoption of FAS123R In
contrast option grant decisions in 2003 and 2004 may be affected by its anticipated adoption as
FASB added accounting for stock-based compensation to its agenda in March 2003
Notwithstanding the above arguments throughout our study we also present the results
using the definition of treatment and control in Bakke et al (2015) In particular we modify Eqs
(1) and (2) by replacing Accounting Impact with Treated an indicator equal to zero for the two
groups of firms identified as lsquocontrolrsquo in Bakke et al (2015) and one for all other firms
23 Payout Variables and Control Variables
Following Brown et al (2007) our baseline measure for changes in dividends is the change
in the DividendAssets ratiomdashcomputed as the regular cash dividends paid during the year scaled
by total assets at the beginning of the yearmdashfrom the Pre to the Post period15 However the
dividend-to-asset ratio is not what managers focus on when making dividend policy decisions
The stability of dividend per share (DPS) among dividend-paying firms (hereinafter payers)
suggests that managers do not target a specific dividend-to-assets ratio but rather a DPS level
(Baker and Wurgler 2016) Survey evidence confirms that executives make dividend policy
decision in terms of changes to the current level of DPS (Brav et al 2005) Therefore we also
examine the percentage change in the average DPS from the Pre to the Post period However this
measure can only be computed for the subset of payers (defined as firms with non-zero DPS in at
15 An alternative choice would be to scale dividends by the market value of equity essentially computing a dividend
yield However a drawback of using the dividend yield in our setting is that after controlling for time-invariant firm
characteristics through fixed effects or first differencing the variation of the ratio comes mainly from the denominator
the stock price (Baker and Wurgler 2004) Thus we choose the more stable book value of total assets as denominator
Also similar to other studies (eg Fenn and Liang 2001) we focus on regular dividends and exclude special dividends
as they are very rare and may introduce large noise to the dividend measures for few observations (DeAngelo
DeAngelo and Skinner 2000)
14
least one of the years of the Pre period) To provide insights into FAS123Rrsquos effect on dividend
policy for non-payers we examine the relation between our Accounting Impact variable and the
rate of dividend initations in the Pre and Post periods
Our main measure for repurchases is the change in RepurchaseAssetsmdashthat is the
aggregate amount of common stock repurchases made during the year scaled by total assets at the
beginning of the yearmdashfrom the Pre to the Post period In the empirical tests we examine
variations suggested in the literature
Finally as an alternative to examining dividends and repurchases separately we also look at a
measure of the payout composition the change in the DividendsTotal Payout ratio from the Pre to
the Post period (Total Payout is the sum of dividends and repurchases) effectively capturing any
substitution effect between dividends and repurchases 16 Examining the causal effect of the
change in option-based pay on payout composition is especially relevant if managers first target a
total payout and then choose the relative weight of dividends and repurchases In practice it is
unclear to what extent managers act this way (Brav et al 2005) Nonetheless for completeness we
also examine this variable We focus on the subsample of firms with both dividends and
repurchases in both Pre and Post period so as to capture changes in payout mix by firms routinely
using both vehicles to return cash to shareholders
As for the control variables in both Eqs (1) and (2) Controli is a vector of firm characteristics
identified in existent literature as determinants of payout policy (eg Fenn and Liang 2001 Brown
et al 2007 Skinner 2008 Cuny et al 2009) firm size book-to-market leverage asset tangibility
free cash flows cash holdings volatility in operating income institutional ownership sales
16 Fama and French (2001) suggest that repurchases are often complement to dividends while Grullon and Michaely
(2002) document that the increase in share repurchases over the past decades has come at the expense of a lower
increase in dividends consistent with a substitution hypothesis Brown et al (2007) also provide evidence of a
substitution effect in response to the 2003 dividend tax cut Survey evidence in Brav et al (2005) suggests an
asymmetric substitution effect with managers more willing to replace dividends with repurchases than the opposite
15
growth past stock returns and an indicator for loss firms For all of these variables we include
both changes from Pre to Post period and levels in the Pre period to allow for the possibility that
levels of these variables affect subsequent changes in payout policy 17 Finally we include
industry-fixed effects (Fama-French 48 industry indicators) to control for industry-level trends in
payout policies and option-based pay In unreported tests we replace free cash flows with two
separate variables operating profit and capital expenditures We also replace volatility in
operating income with volatility in stock returns Our results are unaffected More detailed
definitions of each variable are in the Appendix
24 Identification Assumption
The key identifying assumption underlying the difference-in-difference estimation
technique is that the parallel trends assumption is satisfied In the absence of treatment both
treated and control firms should experience parallel trends in the outcome variable Our approach
assumes that in the absence of FAS123R the change in dividends or repurchases would be the
same for high and low accounting impact firms Note that the well-documented contemporaneous
correlation between levels of option compensation (a key driver of the implied option expense and
thus the accounting impact) and levels of payout variables does not violate our identification
assumption This is because our assumption pertains to the relation between the level of option
compensation and future changes in payout variables
A specific concern is that options may be granted in anticipation of expected future
changes in payout policy (reverse causality problem) Relative to simple association tests this
concern is significantly reduced in our setting because the accounting impact is measured three
years prior to the arrival of treatment and is the result of option grants made over the prior four or
17 In untabulated analyses we run our tests after excluding changes in the control variables (ie including only their
pre-treatment levels) since in difference-in-difference studies controlling variables measured after the shock may
reintroduce selection bias Our inferences remain unchanged
16
five years depending on the vesting schedule18 For the reverse causality to be plausible the
implied option expense in 2002 (the result of option grants made approximately between 1998 and
2002) needs to reflect the anticipated change in payout policy in 2005-2007 This seems unlikely
While the parallel trend assumption is not directly testable similar to other studies (Bakke
et al 2015) we examine the trends in dividends and repurchases during the Pre period Figure 1
suggests that high and low accounting impact firms (respectively top and bottom quartile of
implied option expense) exhibit similar trends in payout variables in the Pre period ie from 2003
to 2004 More formally to examine the correlation between Accounting Impact and trends in the
payout variables during the Pre period we estimate the following regression only with
observations in 2003 and 2004
Payouti = γ0 + γ1 Accounting Impacti FY2004+ γ2 FY2004+ ΓControli +Firm FE +ui (3)
where Payouti is either DividendAssets or RepurchaseAssets FY2004 is an indicator of
fiscal year 2004 Firm FE indicates firm-fixed effects If firms with varying degrees of accounting
impact have different payout trends before the adoption of FAS123R γ1 should be different from
zero However for both payout variables we find that the estimated γ1 is close to zero and not
statistically significant at 10 level (untabulated tests) Overall the parallel trends assumption
seems reasonable in our setting
3 Empirical analyses
31 Sample Selection and Summary Statistics
Our sample is the SampP 1500 firms with available data on implied option expense (from
Compustat) and on executive compensation (from Execucomp) for at least one year in the Pre
18 The accounting treatment for stock options requires their fair value at the grant date to be recognized over the
service period (usually the vesting period) Hence the implied option expense in a given year includes a fraction of
the expense associated with past option grants
17
period and one year in the Post period to ensure consistency in the sample across periods Similar
to prior studies on payout policy (Fama and French 2001 Skinner 2008) we exclude financial
firms (SIC code between 6000 and 6999) and utilities (SIC between code 4900 and 4999) as well as
firms not incorporated in the US Our final sample includes 1176 firms19 We obtain dividend
and stock returns data from CRSP stock repurchases and dividend per share data from
COMPUSTAT and institutional ownership data from Thomson Reuters 13F database Other
control variables are from CRSP and COMPUSTAT To deal with outliers we winsorize all
continuous variables at 1 and 99 by fiscal year A detailed definition of all variables and their
sources is in Appendix
Table 1 Panel A presents summary statistics of the relevant variables for the pooled sample of
5653 firm-year observations Implied option expense in 2002 (our proxy for Accounting Impact)
is on average 173 of total assets with the median at 052 This suggests that the accounting
impact is very large for a small number of firms Over the entire sample period on average
dividends represent 093 of total assets while repurchases represent 394 Untabulated
analyses indicate that in 16 of the firm-year observations only dividends are paid out in 25
only repurchases in 32 both and in 27 neither Within the subset of firm-years with a payout
dividends represent 3874 of total payout This data confirms prior evidence that repurchases
have assumed the primary role as a vehicle to return cash to shareholders (eg Floyd et al 2015)
The mean (median) total executive pay (average across the top 5 executives) is $25 million ($16
million) On average option grants and restricted stock grants represent respectively 283 and
141 of total pay while salary and bonus comprise 296 and 197 respectively The
19 The results presented in the study are similar when (i) we restrict the sample to firms with available data for the
entire (2003-2007) sample period (1009 firms) and (ii) we exclude firms with CEO turnover in the Post period
(reducing the sample size to 780 firms) as a new CEO may have a different compensation package andor adopt a
different payout policy
18
composition of CEO pay (untabulated) is similar As for the control variables the figures are
generally consistent with other studies examining SampP 1500 firms over the same period
Panel B reports the pairwise Pearson correlations among the relevant variables The
correlations are in line with the associations documented in prior studies For example larger
firms and firms with higher profitability (free cash flows) have higher payouts loss firms have
lower payouts greater volatility in operating income is associated with lower dividends
More relevant to our analysis Panel C presents the mean of each variable in the Pre and Post
period for the full sample For each variable we first compute the firm-level mean over the Pre
and the Post Period and then compute the mean of the resulting figure across all firms There is a
striking increase in repurchases which double from 245 to 490 of total assets causing a
similar increase in total payout The increase in dividends is much smaller from 083 to 099
of total assets As a result for firms with positive payout dividends become a smaller fraction of
total payout in the Post period (2790 versus 3914 in the Pre period) This trend is consistent
with Floyd et al (2015) who document a dramatic increase in repurchases in the years leading to
the 2008 financial crisis Consistent with previous studies around FAS123R there is a significant
reduction in option grants as a fraction of total executive pay (from 343 to 240) and a
corresponding increase in the use of restricted stock (from 87 to 176) with little variation in
the weight of salary and bonus (note that restricted stock salary and bonus were expensed both
before and after FAS123R) Similar patterns hold for the composition of CEO pay (untabulated)
Compared to changes in the mix of executive pay changes in the levels of control variables are
generally less pronounced
Panel D reports the change in the key compensation and payout variables from the Pre to the
Post period by quartiles of implied option expense and yields a number of insights First
19
confirming the skewness suggested by Panel A the mean implied option expense is 551 for
firms in the top quartile versus only 093 035 and 012 for firms in the second third and
bottom quartile respectively Second as expected firms with higher implied option expense have
greater use of option-based pay For example in the Pre-period option pay represents 507 of
total executive pay at firms in the top quartile versus 201 in the bottom quartile Third and
more importantly for our research design the use of option pay changes significantly from the Pre
to the Post period as a function of the accounting impact For firms in the top quartile the
percentage of total pay represented by stock options drops by 182 (from 507 to 325)
versus 113 80 and 34 for firms in the second third and bottom quartile respectively The
decline in option usage across quartiles is accompanied by an increase in restricted stock grants
while the weight of salary and bonus shows little change It is important to emphasize the
substitution of stock options with restricted stocks because restricted stocks typically pay
dividends (Zhang 2013) thus providing further reason to expect a dividend increase in response to
the FAS123R-induced decline in option pay
As for the payout variables Panel D suggests that heavy option users (firms with higher
implied option expense) generally use repurchases more than dividends consistent with the
associations documented in earlier studies In the Pre period repurchases (dividends) represent
351 (030) of total assets for the top quartile versus 113 (112) for the bottom quartile
Panel D also indicates that the increase in repurchases documented in Panel C takes place across
all quartiles As for the (much smaller) change in dividends the absolute increase is similar across
the four quartiles though the relative increase (the percentage change) appears to be slightly
higher in the top quartile Overall these figures do not suggest a shift toward dividends and away
from repurchases by firms with a large (accounting-induced) decline in the use of option pay
20
Panel E presents the same data as Panel D but based on the definition of lsquotreatmentrsquo and
lsquocontrolrsquo in Bakke et al (2015) Under this definition 997 firms are classified as treatment group
and 177 as control (171 firms are classified as lsquocontrolrsquo because they did not grant options to the
CEO in the Pre period and 6 because they were voluntarily expensing options before 2003)
Interestingly lsquotreatedrsquo firms are equally distributed across the quartiles suggesting significant
variation in the degree of treatment As discussed earlier one benefit of our approach is that it
exploits cross-sectional variation among treatment firms in terms of the likely impact of FAS123R
Also 40 of the control firms (71 out of 177) are in the lowest quartile while 35 ((37+25)177)
are in the top two quartiles reflecting the different focus of the two approaches in terms of
identifying firms less affected by FAS123R20
As for payout and compensation variables Panel E shows that the treated group experiences a
larger increase in repurchases than the control group while the (less pronounced) increase in
dividends is similar across treated and control firms Treated firms experience a 126 decrease in
option pay (from 387 to 261) with a corresponding 94 increase in the weight of restricted
stock grants (from 80 to 174) The figures are similar at the CEO level (because the
classification is based on options grants to the CEO it is useful to report pay figures at both the top
5 executives and the CEO level) Interestingly the control group experiences a pronounced
increase in the weight of option grants in total CEO pay from 10 to 127 as almost half of the
control firms issued options to their CEOs in the Post period (for these firms options as percentage
of total CEO pay increased from 0 to 254 untabulated analysis) While this increased use of
stock options suggests (ex post) that these firms were not concerned with the impact of FAS123R
another possibility is that the lack of use of option compensation for CEOs in 2003 and 2004 was
20 In untabulated analysis we find that 55 of the 171 firms issuing no options to the CEO in the Pre period granted
options to the other top executives (and perhaps to other non-executive employees) thus explaining the relatively high
implied option expense for the control group (10 versus 19 for the treatment group ndash see Panel E)
21
temporary rather than the effect of a permanent policy If these firms were planning to issue
options to the CEO in the Post period the assumption that they were unaffected by FAS123R (and
thus their use as control sample) is questionable21
32 Differential Impact of FAS123R on the Use of Option-Based Compensation
An important building block of our approach is the presumed differential impact of FAS123R
on option-based pay as a function of pre-existing implied option expense22 While Table 1 Panel
D preliminarily supports the validity of this assumption we formally examine it by estimating Eq
(1)
As reported in Table 2 Panel A we find a significant negative association between Accounting
Impact and the change in option-based pay around the adoption of FAS123R In column (1)
where we use the quartile rank of implied option expense the -0044 coefficient implies that
around FAS123R option grants over total pay decline by 44 as we move from the highest
quartile to the next Thus the reduction in top quartile firms is 132 larger than in bottom
quartile firms In column 2 we replace the quartile rank with three indicators for the highest
quartiles (with the bottom quartile collapsed in the intercept) so as to be able to compare directly
top and bottom quartile without imposing the same effect across quartiles The negative and
significant coefficient on the top quartile indicator at -0140 suggests that the reduction in option
grants over total pay is 140 larger for top quartile firms relative to bottom quartile firms
Finally in column 3 we use the indicator for treated firms following Bakke et al (2015) The
21 Panel E also shows an increase in the use of restricted stock in CEO pay packages (from 128 to 182 almost
comparable to the increase among treated firms) The concurrent increase in options and restricted stock suggests
these firms would have increased option pay significantly more had it not been for FAS123R indicating further
caution in classifying them as control group of unaffected firms 22 This is akin to the relevance assumption of instrumental variable if we interpret the implied option expense as an
instrument to the change in option-based pay
22
negative and significant coefficient at -0132 suggests that treated firms experience a 132
larger drop in the weight of option pay relative to control firms
In Panel B we re-estimate Eq (1) using a panel regression with firm- and year-fixed effects
(5653 firm-year observations) where the dependent variable is the the ratio of option grants to
total executive pay The results are virtually identical in terms of significance and magnitude of
the coefficients of interest (the interaction terms between respectively Accounting impact and
Treated and an indicator for the Post period)
Overall Table 2 suggests that high implied option expense and the introduction of FAS123R
together strongly encouraged firms to cut back option-based compensation for executives It also
supports the general validity of the approach in Bakke et al (2015) in identifying firms most
affected by FAS123R notwithstanding the concerns outlined earlier
Our test of Eq (1) focuses on executive stock options For our dividend-protection hypothesis
it is important to establish that the level of implied option expense predicts a change in executive
stock options (rather than only a change in the use of non-executive employee stock options) as we
want to capture the effect of a change in executivesrsquo incentives on payout policy At the same
time our dilution channel hypothesis assumes a change in the use of all (executive and non-
executive employee) stock options Thus in untabulated analyses we repeat the test in Eq (1) by
replacing the dependent variable with the change in the number of options granted to all
employees (scaled by the total number of outstanding shares note for this analysis we can only
use data from 2004 to 2007 because Compustat began reporting data on ESO in 2004) The
coefficient on Accounting Impact and Treated continues to be negative and significant suggesting
that the differential reduction in the use of option compensation as a function of accounting impact
23
occurred for both executive and non-executive employee stock options Indeed Brown and Lee
(2011) report a similar decrease in executive and employee stock options around FAS123R
33 Option-Based Pay and Dividend Payouts
In this section we examine the effect of an exogenous (accounting-induced) change in option
compensation on dividend policy by estimating Equation (2)
Table 3 Panel A presents the results using the change in dividends from Pre to Post as
dependent variable We find no significant association between Accounting Impact (column 1 and
2) or Treated (column 3) and the change in dividends around the adoption of FAS123R This is in
stark contrast with the negative effect of option-based pay on dividends predicted in the literature
and documented in various association studies
One concern with this lack of effect is that perhaps our setting is not powerful enough to detect
it One way to examine this possibility is the following The coefficient on Accounting Impact
rank=4 in column 2 is 0001 and the standard error (SE) is 00009 Assuming the estimated
standard error is correct then for a two-tailed t test the coefficient needs to be greater than 00015
(=SE1645) or 015 to reach the 10 percent significant level In other words if moving from
the bottom to the top quartile (which predicts a 14 differential decline in option based pay as per
Table 2 Panel A) resulted in a 015 increase of the dividendasset ratio our test would be able to
detect a causal effect of option-based pay on dividends Given the unconditional mean of the
dividendasset ratio at 093 an increase of 015 from the Pre to the Post period seems
plausible In fact the average increase from the Pre to the Post period is 016 (Table 1 Panel C)
Thus if an effect was there our test should detect it
24
Panel B presents the results using a panel regression (5653 firm-year observations) with firm-
and year-fixed effects and interaction terms between Accounting Impact (or Treated) and an
indicator for the Post period Our inferences are unchanged
These analyses are based on our full sample which includes both dividend-paying and non-
dividend-paying firms Hence they implicity treat as equal two potentially different decisions to
initiate dividends and to increase dividends For example an increase in the dividend-to-asset
ratio from 05 to 06 will be treated the same as an increase from 00 to 01 even though
the latter represents a critical dividend initiation decision23 To address this following Chetty and
Saez (2005) we separately examine how FAS123R impacts the intensity of dividend changes (for
the subset of payers) and the likelihood of dividend initiations (for the subset of non-payers)
331 Option-Based Pay and Dividend Payouts Intensity of Dividend Changes
In the first row of Panel C we repeat the analysis in Panel A for the sub-sample of 572 payers
defined as firms with positive DPS in 2003 andor 2004 Note that we report only the coefficients
of interest for parsimony In the second row we replace the dependent variable with the
percentage change in DPS DPS is the choice variable for managers (Brav et al 2005 Baker and
Wurgler 2016) and thus our preferred measure to capture changes in dividend policy To account
for skewness in this variable (Khale 2002) in the third fourth and fifth rows we use indicator
variables to denote whether the change in DPS surpasses a threshold respectively 20 40 and
60 The proportion of firms that surpass these thresholds are 59 44 and 33 respectively24
23 Initiating dividends is a critical decision for boards given the pre-commitment value that investors attach to this
decision and the strong negative market reaction when firms eliminate or reduce dividends (Brav et al 2005) For
executives trying to maximize the value of their own stock options (dividend-protection argument) the ability to
influence a dividend initiation decision is likely lower than the ability to influence a dividend increase decision 24 Although in the third fourth and fifth rows our dependent variable is a binary variable we use a linear model (OLS)
instead of a probit or logit nonlinear model The reason is that estimating fixed effects in binary response models with
panel data can cause the incidental parameters problem The coefficient estimates can be biased when the panel data
25
Across all of these specifications we find no association between Accounting Impact or Treated
and the intensity of dividend changes Thus it does not appear that an exogenous reduction in
option-based pay caused dividend-paying firms to increase dividends
In Panel D we perform four robustness tests For parsimony we show only the coefficients of
interest and only the cases where the dependent variable is an indicator denoting a greater than
40 increase in DPS The results are similar for the other four ldquointensityrdquo dependent variables
reported in Panel C
In the first row we exclude firms that began to voluntarily expense options in 2003 or 2004
(84 firms of which 68 are dividend payers) FASB added accounting for stock-based
compensation to its agenda in March 2003 and issued an Exposure Draft proposing the expensing
of stock options at fair value in March 2004 In anticipation a number of firms began to
voluntarily expense stock options in 2003 and 2004 (Aboody et al 2004) If these firms reduced
option grants and as a result increased dividends during the Pre period then their inclusion may
reduce the power of our tests and thus our ability to detect the hypothesized relation25
In a similar spirit in the second row we exclude firms in the top decile in terms of reduction in
the ratio of option grants to total pay for the top 5 executives between 2002 (the year prior to the
Pre-period) and 2004 (the end of the Pre-period) This encompasses 113 firms of which 55 are
dividend payers If these firms reduced option grants in anticipation of FAS123R and as a result
increased dividends during the Pre period their inclusion may reduce our ability to detect the
hypothesized relation
has a large number of observations but a short time series Examples of studies making a similar choice are Puri
Rocholl and Steffen (2011) and Chu and Ma (2015) 25 This is unlikely to be a serious concern as previous studies suggest that voluntary expensers made limited use of
stock options (Aboody et al 2004) In fact in our sample 79 of these firms are in the bottom two quartiles of
implied option expense (untabulated) Nonetheless we present this test for robustness
26
In the third row we exclude firms that accelerated the vesting of options before FAS123R
became effective in order to avoid recognizing an expense for the unvested portion of these
options (Choudhary et al 2009 Balsam Reitenga and Yin 2008) This encompasses 196 firms of
which 54 are dividend payers If accelerating vesting was used to reduce the impact of FAS123R
the inclusion of these firms may reduce the power of our tests26
In the fourth row we deal with the concern that if firms target a fixed dividend to net income
ratio (Lintner 1956) and do so without adjusting for changes in accounting standards then by
decreasing net income (via option expense) the accounting change would mechanically cause a
reduction in dividends This would potentially offset and confound the increase predicted under
the dividend-protection and dilution hypotheses This seems unlikely for two reasons First firms
are notoriously reluctant to cut dividends (Brav et al 2005) Hence it seems unlikely that they
would reduce dividends in response to a decline in net income with no economic or cash flow
implications (ie re-classification of an expense from the footnotes to the income statement)
Second firms today set dividends in terms of dividend per share rather than by targeting a net
income-based payout ratio (Brav et al (2005)) As noted by Skinner (2008) over the last few
decades as earnings have become more variable the relation between earnings and dividends has
become weaker with dividend payments increasing smoothly and largely independent of the
variation in earnings Nevertheless in the fourth row we exclude the 66 dividend-paying firms that
26 These firms explicitly stated that they accelerated the vesting of stock options to avoid the accounting charge
(Choudhary et al 2009) In fact 72 are classified in the top two quartiles of implied option expense (untabulated)
Thus we would have predicted these firms to experience a significant decline in option pay To the extent that this
decline did not materialize because they minimized the impact of FAS123R by accelerating vesting the ability of
Accounting Impact to predict the reduction in option pay and thus its usefulness in examining changes in dividends
around FAS123R may be reduced The list of firms accelerating vesting was kindly provided by Jack Ciesielsky of
The Analystsrsquo Accounting Observer
27
had a similar payout ratio in 2003 and 2004 as a proxy for firms with a target net income-based
payout ratio in the Pre period27
As shown in Panel D even after excluding these subsets of firms we continue to find no
association between Accounting Impact or Treated and changes in dividends for dividend-paying
firms This is inconsistent with a causal influence of option compensation on dividend policy
Another concern is that by reducing net income and thus retained earnings FAS123R
may have pushed some firms closer to violating dividend covenants in debt contracts and
thus prevented them from increasing dividends This would bias our study against finding a
causal effect of option-based pay on dividends However this does not appear to be a
significant concern for three reasons First the recognition of an option expense does not
imply a decline in net income In fact more than 70 (75) of the full sample firms
(dividend payers) experienced an increase in net income before extraordinary items from
2004 to 2005 (the percentages are similar across the four quartiles of implied option
expense) Second dividend covenants are less common among dividend-paying firms
(Nikolaev 2010) Third most loan contracts in recent years give parties the option to
ldquofreezerdquo GAAP when facing a mandatory change in accounting principles (Christensen and
Nikolaev 2009) Firms expecting an adverse impact of FAS123R on their dividend covenants
would likely exercise this option (particularly given the non-cash nature of option-based
expense) Nonetheless to alleviate this concern we perform three additional analyses
(untabulated) (i) we repeat the tests in Panel C after excluding firms with a drop in net
income between 2004 and 2005 (ie firms that perhaps faced some covenant-related
27 We define a ldquosimilarrdquo payout to be an absolute change in payout ratio of less than 1 from 2003 to 2004 Among
these 66 firms only 39 continued to have a similar payout ratio in 2005 We also try an alternative definition where
a firm is classified as likely to be using a net income-based target payout ratio if the absolute percentage change in the
ratio from 2003 to 2004 is less than 10 (100 firms) Our inferences are unchanged
28
constrains to their payout policy as a result of FAS123R) (ii) we explicitly control for net
income and retained earnings in the regression (as in Skinner 2008) (iii) we repeat the tests
in Panel C for dividend payers with dividendsasset ratio above the sample median on the
basis that dividend covenants are less frequent among firms paying large dividends (Jung
Lee and Yang 2016) Our inferences are unchanged
332 Option-Based Pay and Dividend Payouts Dividend Initiations
In this section we examine whether the accounting-driven change in option pay affected
dividend initiations among non-payers We cannot employ the difference-in-difference approach
adopted so far by definition the same firm cannot initiate dividends in both periods However we
can provide suggestive evidence as follows First we take all firms that did not pay dividends in
2002 and group them into quartiles based on 2002 implied option expense For each quartile we
find the number of firms initiating dividends in 2003 and 2004 (the Pre period) Next we take all
firms that did not pay dividends in 2004 group them into quartiles based on 2002 implied option
expense and for each quartile find the number of firms initiating dividends in 2005 and 2006 (the
Post period) We do not include 2007 so as to have the same number of years in both periods and
make the cumulative initiation rates comparable
The left portion of Panel E reports the results of this exercise There is a general decrease in
the dividend initiation rate from the Pre to the Post period This holds both in the full sample of
non-payers (from 129 to 79) and across all quartiles This decrease may reflect a temporary
spike in 2003 and 2004 in response to the 2003 dividend tax cut documented in Chetty and Saez
(2005) It is noteworthy that initiation rates in both periods are lower among firms with higher
implied option expense This is consistent with option-heavy firms being mostly high-growth
firms less inclined to pay dividends More relevant to our research question if the lower use of
29
option compensation increased the propensity to pay dividends we would expect to see a relative
increase (ie a lower decrease) in dividend initiations among firms with the highest accounting
impact Instead the rate does not differ depending on the accounting impact There is
approximatley a 5 decline in initiation rate in each quartile In the right portion of Panel E we
examine similar data for dividend terminations While the results should be interpreted with
caution due to their rarity firms with higher accounting impact do not experience a greater decline
in termination rates Our inferences in Panel E are similar when we compared treated and control
firms following Bakke et al (2015) (untabulated)
Even after taking into account the different nature of decisions for dividend paying and non-
dividend-paying firms we fail to find evidence of a causal influence of option-based compensation
on dividend policy This finding is in contrast to the associations documented in earlier studies It
is even more remarkable as most firms replaced stock options with restricted stock which are
generally dividend-protected and should provide further incentive to increase dividends28
34 Option-Based Pay and Repurchases
In this section we examine the effect of an exogenous (accounting-induced) change in option
compensation on repurchases by estimating Equation (2)
Table 4 Panel A presents the results using the change in repurchases (scaled by total assets)
from Pre to Post as a dependent variable If the use of option-based pay had a positive effect on
firmsrsquo propensity to engage in repurchases as posited by the dividend-protection and dilution
hypotheses we should find a negative association between Accounting Impact or Treated and
repurchases Firms with a higher (accounting-driven) reduction in option-based pay should reduce
28 In a sample of SampP 500 firms between 2000 and 2009 Zhang (2013) reports that 80 of the firms granting
restricted stocks offer dividend protection In that sense the FAS123R-induced shift from stock options to restricted
stock may be characterized as a ldquoshockrdquo to dividend protection in unearned equity pay Accordingly our results cast
doubt on the causal interpretation of the positive association between dividend protection and dividend payouts
documented in prior studies (Zhang 2013 Burns et al 2015 Minnick and Rosenthal 2015)
30
the use of repurchases either because they are shifting toward a greater use of dividends andor
because they have a lower need to offset the dilutive effects of stock options However we find no
significant association between Accounting Impact (columns 1 and 2) and the change in
repurchases around the adoption of FAS123R When we use the Treated indicator (column 3) we
find a significant positive association rather than a negative one In Panel B we repeat the analysis
using net repurchases (ie repurchases after removing the effect of share issuances) following
Fama and French (2001) and Skinner (2008) Our inferences are unchanged29
This test is subject to two important caveats The first is we may not detect a decline in
repurchases because in the Post period firms need to offset the exercise of options that were
granted during the Pre period That is a post-FAS123R reduction in grants may not (yet) translate
into a reduction in exercises during the Post period which reduces our ability to test the dilution
hypothesis (ie that firms repurchase shares to offset exercises)30 However we can examine a
variation of this hypothesis where firms use repurchases to manage the effect of unexercised
options on diluted EPS (Bens et al 2003) To do so in Panel C we use a measure of adjusted
repurchases where we subtract our estimate of repurchases undertaken to offset the exercise of
ESO31 We effectively test whether firms experiencing an accounting-induced decrease in option
grants engage in less repurchases (net of exercise-driven repurchases) because their need to
manage the effect of unexercised options on diluted EPS is lower However the coefficient on
the variables of interest is either insignificant or positive inconsistent with the hypothesis
29 In the case of repurchases we do not examine separately ldquoinitiationsrdquo and ldquointensityrdquo as we do for dividends
because initiation is not clearly defined for repurchases Unlike dividends the occurrence of a repurchase in a given
year (or the lack thereof) cannot be used to infer a general policy due to the more discretionary nature of the timing of
repurchases 30 To capture the effect of lower option-based compensation on option exercises and thus on repurchases we would
ideally extend the Post period beyond 2007 However as noted by Floyd et al (2015) repurchases declined
dramatically after 2007 because of the financial crisis making it difficult to detect the effect of any other factor 31 As upper bound estimate of exercise-driven repurchases we multiply the number of ESO exercised during the year
times the average stock price during the year Since the number of ESO exercised is available in Compustat starting in
2004 Panel C is based on observations from 2004 to 2007
31
A second important caveat is that most firms replaced stock options with restricted stock
(Table 2 Panel C) Unvested restricted stock is excluded from the denominator in the computation
of basic EPS (once vested it is included) However it is included in the denominator of diluted
EPS using the treasury stock method similar to stock options Given the complexity of this
method without access to all details of restricted stock grants and option grants it is difficult to
determine whether the switch from stock options to restricted stock decreased the need for
dilution-driven repurchases as our test implicitly assumes Hence it is possible that we do not find
a decrease in repurchases because a reduced need to offset the dilutive effect of stock options was
neutralized by an increased need to offset the dilutive effect of restricted stock
Subject to the above caveats the evidence in Table 4 is not consistent with a positive causal
relation between the use of option-based pay and repurchases More precisely it suggests that
option-driven dilution concerns do not have a first-order effect on the magnitude of repurchases
even though they may play a role in the repurchase decision Hence our result is not necessarily
in conflict with the evidence in Brav et al (2005) where two-thirds of the surveyed financial
executives state that offsetting the dilutionary effect of stock option plans or other stock
programs is an important factor to their repurchase decisions
35 Option-Based Pay and Payout Composition
As an alternative to examining dividends and repurchases separately we also look at the
payout composition the change in the DividendsTotal Payout ratio from the Pre to the Post period
where Total Payout is the sum of dividends and repurchases As noted earlier we focus on the
subsample of firms with both dividends and repurchases in both Pre and Post periods so as to
capture the change in payout mix by firms routinely using both vehicles to return cash to
shareholders If the use of option-based pay causes firms to substitute repurchases for dividends
32
we should find a positive association between Accounting Impact or Treated and the payout mix
defined as DividendsTotal Payout ratio Firms with a higher accounting-driven reduction in
option-based pay should have an increase (decrease) in the relative weight of dividends
(repurchases) to the total payout However as reported in Table 5 Panel A we fail to find a
significant association between Accounting Impact (column 1 and 2) or Treated (column 3) and
the change in payout mix The results are similar when we use Net Payout (dividends plus net
repurchases) instead of Total Payout in computing the payout mix (Panel B)
Overall the combined evidence in Tables 3-5 does not support the hypothesis that option-
based compensation has negative (positive) effect on dividends (repurchases) or that it causes
firms to replace dividends with repurchases
4 Conclusion
Prior literature has documented robust associations between option-based compensation and
payout policy yet it remains unclear whether this association reflcts a causal influence We
investigate the causal effect of option-based compensation on payout policy using the adoption of
FAS123R which resulted in a significant decrease in option grants making it a plausible
exogenous shock to the use of option-based pay To overcome the challenge of no control group
we exploit the fact that firms responded differently depending on the firm-specific accounting
impact as measured by the implied option expense disclosed in the footnotes prior to FAS123R
Firms with larger expected accounting impact curtailed option-based compensation much more
aggressively than firms with lower impact Using a sample of SampP 1500 firms we find no
evidence that firms with a larger accounting-induced decline in option compensation increased
dividends reduced repurchases or changed their payout composition contrary to the widely held
belief that option-based pay has a causal influence on payout policy
33
Appendix Variable Definitions and Data Sources
Accounting Impact Variables
Accounting impact Implied option expense (Compustat XINTOPT) divided by total assets
(Compustat AT) This variable is measured at fiscal year 2002 and is time-invariant
Accounting impact rank The quartile rank of Accounting impact (1=lowest 4=highest)
Payout Variables
Regular dividendTotal assets The numerator is total regular cash dividends in the fiscal year
from the distribution dataset in CRSP Regular cash dividends are identified by the distribution
codes 1212 1222 1232 or 1242 The denominator is one-year lagged total assets (Compustat
AT)
DPS Dividend per share (Compustat DVPSX_F)
DPS pct change The percentage change of average DPS from Pre- to Post-FAS123R period
DPS pct change gtX indicator A dummy variable that equals one if DPC pct change is greater
than X and zero otherwise
RepurchaseTotal assets The numerator is the repurchase of common equity which equals total
repurchase (Compustat PRSTK) minus the change in preferred stock redemption value
(Compustat PSTKRV) The denominator is one-year lagged total assets (Compustat AT)
Net repurchaseTotal assets Net repurchase removes the effect of share issuances The
construction follows Fama and French (2001) and Skinner (2008) if the firm uses the treasury
stock method for repurchase net repurchase equals the increase in common treasury stock
(Compustat TSTKC) if the firm uses the retirement method (when common treasury stock is zero
in the current and prior year) net repurchase equals total repurchases minus stock issuance
(Compustat SSTK) and change in preferred stock redemption value (Compustat PSTKRV)
When the above measures give negative value net repurchase is set to zero
Adjusted repurchaseTotal assets Adjusted repurchase removes from total repurchase the potential
effect of repurchasing exercised options This variable equals total repurchase of common stocks
minus the product between the number of options exercised (Compustat OPTEXD) and average
stock price during the year When the above measure gives negative value adjusted repurchase is
set to zero Since the number of options exercised is not available before 2003 we drop
observations in 2003 when we use this variable
34
Total payoutTotal assets the sum of Regular dividendTotal assets and RepurchaseTotal assets
Regular dividendTotal payout regular cash dividend divided by the sum of regular cash dividend
and repurchase from common equity In the two-period analysis (Pre- vs Post-FAS123R) we
separately sum the numerator and the denominator for each firm-period and then calculate the ratio
Regular dividendNet payout regular dividend divided by the sum of regular dividend and net
repurchase In the two-period analysis (Pre- vs Post-FAS123R) we separately sum the numerator
and the denominator for each firm-period and then calculate the ratio
Compensation Variables
Salary_$ Average salary (Execucomp SALARY) of the top 5 highest paid executives in $1000
Salary_ Average salary (Execucomp SALARY) divided by average total pay (Execucomp
TDC1) of the top 5 highest paid executives
Bonus_$ Average bonus (Execucomp BONUS) of the top 5 highest paid executives in $1000
Due to a data format change we add non-equity plan-based awards (Execucomp
NON_EQ_TARG) to this measure after 2006
Bonus_ Bonus_$ divided by average total pay (Execucomp TDC1) of the top 5 highest paid
executives
Option grant_$ Average option grant value (Execucomp OPTION_AWARDS_BLK_VALUE or
OPTION_AWARDS_FV) of the top 5 highest paid executives in $1000 Due to a data format
change we use OPTION_AWARDS_FV for this measure after 2006
Option grant_ Option grant_$ divided by average total pay (Execucomp TDC1) of the top 5
highest paid executives
Restricted stock grant_$ Average restricted stock grant value (Execucomp RSTKGRNT or
STOCK_AWARDS_FV) of the top 5 highest paid executives in $1000 Due to data format
change we use STOCK_AWARDS_FV for this measure after 2006
Restricted stock grant_ Restricted stock grant_$ divided by average total pay (Execucomp
TDC1) of the top 5 highest paid executives
Total pay_$ Average total pay (Execucomp TDC1) of the top 5 highest paid executives in $1000
35
Other Characteristics
Size The book value of total assets (Compustat AT) minus the book value of common equity
(Compustat CEQ) plus the market value of common equity from CRSP in $M
Log(size) the natural logarithm of size
Book-to-market the book value of common equity dividend by its market value
Leverage long term debt plus short term debt (Compustat DLTT + DLC) divided by total assets
Asset tangibility tangible assets (Compustat AT - INTAN) divided by total assets
Free cash flow Operating cash flow (Compustat OANCF) minus capital expenditure (Compustat
CAPX) then divided by lagged total assets
Cash holding Cash and short-term investments (Compustat CHE) divided by total assets
ROA volatility the standard deviation of returns on assets (operating income before tax divided by
lagged total assets) in the past five fiscal years
Institutional ownership the number of shares held by institutional investors divided by the number
of shares outstanding from Thomson Reuters Institutional Holdings database
Sales growth the growth rate of sales (Compustat SALE) from the prior year
Past stock return annual stock return from the prior year
Loss indicator a dummy variable taking value of one if the current net income is negative and
zero otherwise
36
References
Aboody David 1996 Market Valuation of Employee Stock Options Journal of Accounting and
Economics 22 357-391
Aboody David Barth Mary E and Ron Kasznik 2004 Firms Voluntary Recognition of Stock-
Based Compensation Expense Journal of Accounting Research 42 123ndash150
Aboody David and Ron Kasznik 2008 Executive stock-based compensation and firmsrsquo cash
payout the role of shareholdersrsquo tax-related payout preferences Review of Accounting Studies
13 216ndash251
Anantharaman Divya and Yong Gyu Lee 2014 Managerial risk taking incentives and corporate
pension policy Journal of Financial Economics 111 328ndash351
Baker Malcolm and Jeffrey Wurgler 2004 A catering theory of dividends Journal of Finance
59 1125-1165
Baker Malcolm and Jeffrey Wurgler 2016 Dividends as reference points a behavioral signaling
approach Review of Financial Studies 29 697-738
Bakke Tor-Erik Hamed Mahmudi Chitru Fernando and Jesus Salas 2015 The causal effect of
option pay on corporate risk management Journal of Financial Economics forthcoming
Balsam Steven Austin Reitenga and Jennifer Yin 2008 Option acceleration in response to SFAS
No 123 (R) Accounting Horizons 22 23-45
Bens Daniel and Steven Monahan 2008 Altering Investment Decisions to Manage Financial
Reporting Outcomes Asset-Backed Commercial Paper Conduits and FIN 46 Journal of
Accounting Research 46 1017-1055
Bens Daniel A Venky Nagar Douglas J Skinner and MH Franco Wong 2003 Employee stock
options eps dilution and stock repurchases Journal of Accounting and Economics 36 51ndash90
Bertrand Marianne Esther Duflo and Sendhil Mullainathan 2004 How much should we trust
differences-in-differences estimates The Quarterly Journal of Economics 119 249ndash275
Blouin Jennifer L Jana S Raedy and Douglas A Shackelford 2011 Dividends Share
Repurchases and Tax Clienteles Evidence from the 2003 Reductions in Shareholder Taxes
The Accounting Review 86 887-914
Brav Alon John R Graham Campbell R Harvey and Roni Michaely 2005 Payout policy in the
21st century Journal of Financial Economics 77 483ndash527
Brown Lawrence D and Yen-Jung Lee 2011 Changes in Option-Based Compensation Around
the Issuance of SFAS123R Journal of Business Finance amp Accounting 38 1053ndash109
37
Brown Jeffrey R Nellie Liang and Scott Weisbenner 2007 Executive financial incentives and
payout policy Firm responses to the 2003 dividend tax cut Journal of Finance 62 1935ndash
1965
Burns Natasha Brian McTier and Kristina Minnick 2015 Equity-incentive compensation and
payout policy in Europe Journal of Corporate Finance 30 85-97
Carter Mary Ellen and Luann J Lynch 2003 The Consequences of the FASBrsquos 1998 Proposal on
Accounting for Stock Option Repricing Journal of Accounting and Economics 35 51-72
Carter Mary Ellen Luann J Lynch and Irem Tuna 2007 The role of accounting in the design of
CEO equity compensation The Accounting Review 82 327ndash357
Chava Sudheer and Amiyatosh Purnanandam 2010 CEOs versus CFOs Incentives and
corporate policies Journal of Financial Economics 97 263ndash278
Chetty Raj and Emmanuel Saez 2005 Dividend taxes and corporate behavior Evidence from the
2003 dividend tax cut The Quarterly Journal of Economics 120 791ndash833
Choudhary Preeti Shivaram Rajgopal and Mohan Venkatachalam 2009 Accelerated vesting of
employee stock options in anticipation of FAS123R Journal of Accounting Research 47 105ndash
146
Christensen Hans B and Valeri Nikolaev 2009 Contracting on Mandatory Changes to GAAP
New Practice and Its Determinants Working Paper University of Chicago
Chu Yongqiang and Tao Ma 2015 How does management compensation affect bank risk taking
evidence from FAS 123R University of South Carolina Working Paper
Cuny Charles J Gerald S Martin and John J Puthenpurackal 2009 Stock options and total
payout Journal of Financial and Quantitative Analysis 44 391ndash410
DeAngelo Harry Linda DeAngelo and Douglas J Skinner 2000 Special Dividends and the
Evolution of Dividend Signaling Journal of Financial Economics 57 309-354
Dechow Patricia M Amy P Hutton and Richard G Sloan 1996 Economic consequences of
accounting for stock-based compensation Journal of Accounting Research 34 1ndash20
Edgerton J 2013 Four facts about dividend payouts and the 2003 tax cut International Tax and
Public Finance 20 769-784
Edmans Alex and Xavier Gabaix 2015 Executive compensation a modern primer Journal of
Economic Literature forthcoming
38
Fama Eugene F and Kenneth R French 2001 Disappearing dividends changing firm
characteristics or lower propensity to pay Journal of Financial Economics 60 3ndash43
Farre-Mensa Joan Roni Michaely and Martin C Schmalz 2014 Payout policy Annual Review
of Financial Economics 6 75ndash134
Fenn George W and Nellie Liang 2001 Corporate payout policy and managerial stock
incentives Journal of Financial Economics 60 45ndash72
Ferri Fabrizio and Tatiana Sandino 2009 The impact of shareholder activism on financial
reporting and compensation the case of employee stock options expensing The Accounting
Review 84 433ndash466
Floyd Eric Nan Li and Douglas J Skinner 2015 Payout policy through the financial crisis the
growth of repurchases and the resilience of dividends Journal of Financial Economics 118
299-316
Frydman Carola and Dirk Jenter 2010 CEO compensation Annual Review of Financial
Economics 2 75-102
Gipper Brandon 2015 Assessing the Effects of Disclosing Management Compensation Working
Paper University of Chicago
Gormley Todd David Matsa and Todd Milbourn 2013 CEO compensation and corporate risk
evidence from a natural experiment Journal of Accounting and Economics 56 79-101
Graham John Michelle Hanlon and Terry Shevlin 2011 Real effects of accounting rules
evidence from multinational firmsrsquo investment locations and profit repatriation decisions
Journal of Accounting Research 49 137-185
Graham John Campbell Harvey and Shiva Rajgopal 2005 The Economic implications of
corporate financial reporting Journal of Accounting and Economics 40 3-73
Greenspan Alan 2002 Testimony of Alan Greenspan before the Committee on Banking
Housing and Urban Affairs US Senate July 16 Washington DC Government Printing
Office
Grullon Gustavo and Roni Michaely 2002 Dividends Share Repurchases and the Substitution
Hypothesis Journal of Finance 57 1649-1684
Hail Luzi Ahmed Tahoun and Clare Wang 2014 Dividend Payouts and Information Shocks
Journal of Accounting Research 52 403-456
Hall Brian J and Kevin J Murphy 2002 Stock options for undiversified executives Journal of
Accounting amp Economics 33 3-42
39
Hall Brian J and Kevin J Murphy 2003 The trouble with stock options Journal of Economic
Perspectives 17 49ndash70
Hanlon Michelle and Jeffrey L Hoopes 2014 What do firms do when dividend tax rates change
An examination of alternative payout responses Journal of Financial Economics 114 105-
124
Hayes Rachel M Michael Lemmon and Mingming Qiu 2012 Stock options and managerial
incentives for risk taking Evidence from FAS123R Journal of Financial Economics 105
174ndash190
Heron Randall A Erik Lie 2007 Does backdating explain the stock price pattern around
executive stock option grants Journal of Financial Economics 83 271-295
Hribar Paul Nicole Thorne Jenkins and W Bruce Johnson 2006 Stock repurchases as an
earnings management device Journal of Accounting and Economics 41 3ndash27
Jensen Michael C 1986 Agency cost of free cash flow corporate finance and takeovers
American Economic Review 76 323-329
Jolls Christine 1998 Stock repurchases and incentive compensation NBER Working Paper No
w6467
Jung Boochun Woo-Jong Lee and Yanhua Sunny Yang 2016 The Impact of Dividend
Covenants on Investment and Operating Performance Journal of Business Finance amp
Accounting 43 414ndash447
Kahle Kathleen M 2002 When a buyback isnrsquot a buyback open market repurchases and
employee options Journal of Financial Economics 63 235ndash261
Lambert Richard A William N Lanen and David F Larcker 1989 Executive stock option plans
and corporate dividend policy Journal of Financial and Quantitative Analysis 24 409ndash425
Lintner John 1956 Distribution of incomes of corporations among dividends retained earnings
and taxes The American Economic Review 46 97-113
Low Angie 2009 Managerial risk-taking behavior and equity-based compensation Journal of
Financial Economics 92 470-490
Miller Merton H and Franco Modigliani 1961 Dividend policy growth and the valuation of
shares The Journal of Business 34 411ndash433
Minnick Kristina and Leonard Rosenthal 2015 Stealth compensation Do CEOs increase their
pay by influencing dividend policy Journal of Corporate Finance 25 435-454
40
Murphy Kevin J 1999 Executive compensation In O Ashenfelter and D Card (eds) North
Holland Handbook of Labor Economics Amsterdam Elsevier Science BV
Murphy Kevin J 2013 Executive compensation Where we are and how we got there Handbook
of the Economics of Finance Elsevier Science North Holland 211-356
Nikolaev Valeri 2010 Debt Covenants and Accounting Conservatism Journal of Accounting
Research 48 143-176
Puri Manju Joumlrg Rocholl and Sascha Steffen 2011 Global retail lending in the aftermath of the
US financial crisis Distinguishing between supply and demand effects Journal of Financial
Economics 100 556-578
Shue Kelly and Richard R Townsend 2014 Swinging for the fences Executive reactions to
quasi-random option grants Working Paper University of Chicago
Skinner Douglas J 2008 The evolving relation between earnings dividends and stock
repurchases Journal of Financial Economics 87 582-609
Weisbenner Scott J 2000 Corporate share repurchases in the 1990s What role do stock options
play FEDS Working Paper No 2000-29
Zhang Dan 2013 CEO dividend protection Working Paper BI Norwegian Business School
41
Figure 1 Trends of dividends and repurchases from 2003 to 2007 Panel A plots the average
Regular DividendTotal Assets of firms in the highest and lowest quartiles of Accounting Impact
measured in 2002 Panel B shows the average Total RepurchaseTotal Assets of firms in the
highest and lowest quartiles of Accounting Impact measured in 2002
Panel A Trends of regular dividends
Panel B Trends of total repurchases
00
05
10
15
20
2003 2004 2005 2006 2007
Regular DividendTotal Assets
Lowest Acc Impact
Highest Acc Impact
Pre Post
00
20
40
60
80
100
2003 2004 2005 2006 2007
Total Repurchase Total Assets
Lowest Acc Impact
Highest Acc Impact
Pre Post
42
Table 1
Summary Statistics
Panel A Firm characteristics - full sample
N Mean Std dev 25 pctl Median 75 pctl
Accounting impact (2002) 1176 173 366 022 052 163
Payout variablesRegular dividendTotal assets 5653 093 148 000 000 142
RepurchaseTotal assets 5653 394 710 000 035 500
Total payoutTotal assets 5653 488 748 000 175 666
Regular dividendTotal payout 4091 3874 4057 000 2237 8833
Level of executive compensation (in $1000)
Salary_$ 5653 450 190 314 409 544
Bonus_$ 5653 476 616 122 295 586
Option grant_$ 5653 791 1137 62 384 1002
Restricted stock grant_$ 5653 458 866 0 58 518
Total pay_$ 5653 2481 2475 890 1647 3074
Percentage of executive compensation
Salary_ 5653 296 183 165 251 382
Bonus_ 5653 197 148 97 177 268
Option grant_ 5653 283 235 67 256 445
Restricted stock grant_ 5653 141 180 00 41 249
Control variables
Size ($M) 5653 11086 27294 1017 2459 8117
Log(size) 5653 7985 1565 6925 7808 9002
Book-to-market 5653 0445 0287 0251 0388 0578
Leverage 5653 0202 0172 0038 0187 0309
Asset tangibility 5653 0806 0184 0691 0853 0965
Free cash flow 5653 0059 0091 0013 0059 0108
Cash holding 5653 0166 0172 0034 0100 0247
ROA volatility 5653 0056 0056 0021 0038 0070
Institutional ownership 5653 0753 0202 0639 0795 0910
Sales growth 5653 0121 0189 0028 0096 0183
Past stock return 5653 0094 0183 -0012 0094 0199
Loss indicator 5653 0164 0370 0000 0000 0000
This table presents summary statistics Panel A shows the descriptive statistics of payout variables compensation
variables and other firm characteristics for the full sample Accounting impact is the implied option expense
measured at fiscal year 2002 All other variables are measured at firm-year level from fiscal year 2003 to 2007
resulting in 5653 firm-year observations (except for Regular dividendTotal Payout which can be measured only
for the 4901 firm-year observations with Total payout greater than zero) Panel B shows the pairwise correlations
between main variables at firm-year level Panel C compares payout variables compensation variables and other
firm characteristics before and after FAS123R The Pre-FAS123R period consists of fiscal year 2003 and 2004
the Post-FAS123R period covers fiscal year 2005-2007 Panel D compares the trends of payout and compensation
variables around FAS123R across four quartile groups ranked by 2002 accounting impact Panel E compares the
trends of payout and compensation variables around FAS123R between the treated and control group under the
alternative treatment definition in Bakke et al (2015) (see Section 22) All variables are defined in Appendix The
notation and in Panel C indicates statistically significant at 10 5 and 1 level in T-tests for equal
means respectively
43
Pa
nel
B
Pea
rso
n c
orr
ela
tio
ns
Reg div
Repurchase
Total payout
Salary_
Bonus_
Option_
RS_
Log(size)
BM
Leverage
Tangibility
FCF
Cash holdingROA vol
Inst own
Sales growth
Past ret
urn
Loss
Reg
div
10
0
Repurc
hase
01
610
0
Tota
l payout
03
509
810
0
Sala
ry_
-0
10
-01
8-0
19
10
0
Bonus_
00
700
100
3-0
01
10
0
Option_
-0
10
00
900
6-0
41
-03
510
0
RS
_
01
000
901
0-0
32
-01
1-0
40
10
0
Log(s
ize)
03
101
802
3-0
56
01
101
202
210
0
BM
-02
1-0
28
-03
103
0-0
03
-02
000
0-0
33
10
0
Levera
ge
-00
1-0
08
-00
8-0
05
00
6-0
11
00
801
9-0
03
10
0
Tangib
ility
00
200
100
101
200
1-0
05
-00
6-0
12
-00
4-0
18
10
0
FC
F02
203
703
9-0
20
00
901
1-0
01
02
4-0
32
-02
1-0
16
10
0
Cash
hold
ing
-01
301
000
700
2-0
14
02
2-0
10
-02
3-0
16
-03
502
901
210
0
RO
A v
ol
-01
5-0
04
-00
700
4-0
11
01
9-0
11
-02
3-0
08
-01
101
2-0
02
03
910
0
Inst
ow
n
-00
901
401
1-0
17
00
200
701
200
7-0
01
00
3-0
08
01
4-0
06
-01
110
0
Sale
s gro
wth
-00
8-0
04
-00
6-0
15
00
501
0-0
02
00
7-0
16
-00
3-0
08
01
300
201
400
410
0
Past
retu
rn00
901
301
4-0
18
01
5-0
01
00
301
6-0
29
-01
000
102
7-0
14
-01
001
602
710
0
Loss
-02
0-0
19
-02
201
8-0
18
00
4-0
05
-02
601
901
300
6-0
41
01
702
3-0
16
-01
8-0
40
10
0
44
Panel C Firm characteristics - before and after FAS123R
Pre FAS 123R Post FAS 123R Difference
Payout variables
Regular dividendTotal assets 083 099 016
RepurchaseTotal assets 245 490 245
Total payoutTotal assets 328 589 261
Regular dividendTotal payout 3914 2790 -1124
Level of executive compensation (in $1000)
Salary_$ 426 463 37
Bonus_$ 418 505 87
Option grant_$ 896 707 -191
Restricted stock grant_$ 269 574 305
Total pay_$ 2263 2584 321
Percentage of executive compensation
Salary_ 305 293 -12
Bonus_ 186 204 18
Option grant_ 343 240 -103
Restricted stock grant_ 87 176 89
Control variables
Size ($M) 9671 11631 1960
Log(size) 7860 8035 0175
Book-to-market 0437 0453 0016
Leverage 0201 0203 0002
Asset tangibility 0822 0793 -0029
Free cash flow 0061 0057 -0004
Cash holding 0175 0159 -0016
ROA volatility 0067 0048 -0019
Institutional ownership 0712 0781 0069
Sales growth 0137 0108 -0029
Past stock return 0080 0101 0021
Loss indicator 0173 0159 -0014
45
Pa
nel
D
Fir
m c
ha
racte
rist
ics
by q
ua
rtil
e o
f a
cco
un
tin
g i
mp
act
- b
efo
re a
nd
aft
er
FA
S1
23
R
Accounting im
pact
(2002)
Num
ber
of
Fir
ms
Pre
Post
Pre
Post
Pre
Post
Pre
Post
Payout
vari
able
s
Regula
r div
idendT
ota
l ass
ets
11
2
12
4
09
4
11
1
09
5
11
3
03
0
04
9
Repurc
hase
Tota
l ass
ets
11
3
26
8
19
2
37
3
32
7
63
1
35
1
68
7
Tota
l payout
Tota
l ass
ets
22
4
39
1
28
5
48
4
42
2
74
4
38
1
73
6
Regula
r div
idendT
ota
l payout
643
7
469
8
474
0
341
1
284
5
195
4
82
5
74
5
Perc
enta
ge o
f executive c
om
pensa
tion
Sala
ry_
337
295
313
287
296
289
276
300
Bonus_
223
226
214
228
172
192
134
169
Option g
rant_
201
167
290
210
373
260
507
325
Rest
ricte
d s
tock g
rant_
116
194
98
180
89
176
43
155
294
294
294
294
1st Q
uart
ile2
nd Q
uart
ile3
rd Q
uart
ile4
th Q
uart
ile
01
2
03
5
09
3
55
1
46
Accounting impact
Number of Firms
By accounting impact quartile
1
2
3
4
Pre Post Pre Post
Payout variables
Regular dividendTotal assets 09 11 08 10
RepurchaseTotal assets 18 31 26 52
Total payoutTotal assets 28 43 34 62
Regular dividendTotal payout 428 357 386 265
Percentage of executive compensation
Salary_ 435 364 282 280
Bonus_ 226 214 179 202
Option grant_ 92 125 387 261
Restricted stock grant_ 125 188 80 174
Percentage of CEO compensation
Salary_(CEO) 485 364 260 259
Bonus_(CEO) 249 228 185 219
Option grant_(CEO) 10 127 406 275
Restricted stock grant_(CEO) 128 182 82 183
Panel E Firm characteristics by alternative treatment definition - before and
after FAS123R
Treated
25
19
997
223
250
256
268
10
177
71
Control
44
37
47
Table 2
Differential effect of FAS123R on the use of option-based compensation
Panel A Two-period first-difference regression
Prediction Coeff t-stat Coeff t-stat Coeff t-stat
Accounting impact rank - -0044 -628
Accounting impact rank=2 - -0044 -327
Accounting impact rank=3 - -0075 -468
Accounting impact rank=4 - -0140 -613
Treated - -0132 -875
ΔLog(size) 0061 202 0061 200 0063 214
ΔBook-to-market 0032 091 0032 092 0051 143
ΔLeverage -0157 -213 -0160 -218 -0111 -153
ΔAsset tangibility -0012 -014 -0020 -023 -0023 -026
ΔFree cash flow -0106 -095 -0108 -097 -0128 -117
ΔCash holding -0197 -211 -0193 -206 -0180 -194
ΔFive-year ROA volatility -0065 -031 -0056 -026 -0098 -047
ΔInstitutional ownership -0044 -091 -0043 -088 -0044 -092
ΔSales growth -0064 -102 -0065 -104 -0090 -153
ΔPast one-year stock return 0051 078 0052 080 0091 138
ΔLoss frequency 0056 207 0057 207 0047 179
Log(size) -0009 -210 -0009 -207 -0002 -035
Book-to-market -0015 -056 -0013 -049 0018 072
Leverage 0022 046 0023 048 0068 150
Asset tangibility 0033 077 0033 078 0053 128
Free cash flow 0227 202 0220 195 0127 117
Cash holding -0002 -004 0012 019 -0078 -141
Five-year ROA volatility -0451 -240 -0430 -228 -0509 -283
Institutional ownership -0123 -360 -0122 -359 -0100 -292
Sales growth -0041 -056 -0040 -055 -0089 -125
Past one-year stock return -0009 -015 -0006 -010 0078 125
Loss frequency 0055 174 0056 178 0054 173
Fixed effect
Standard error
Adj R-squared
Observations
Model (3)
Dependent variable ΔAvg Option grantTotal pay
Huber-White
0156
This table investigates whether the effect of FAS123R on the use of option-based pay varies with its potential accounting impact Panel A
reports the results of estimating three two-period first-differencing models where for each firm we average its characteristics in Pre- and
Post-FAS123R period The Pre-FAS123R period consists of fiscal year 2003 and 2004 the Post-FAS123R period covers fiscal year 2005-
2007 In all three specifications the dependent variable is the change of average Option grantTotal pay from Pre- to Post-FAS123R period
The main independent variable varies by model in Model (1) the Accounting impact rank is the quartile rank of implied option expensetotal
assets measured in 2002 (1=lowest 4=highest) In Model (2) Accounting impact rank=2 (3 4) is an indicator that takes value of one if the
firmrsquos Accounting impact rank equals 2 (3 4) In Model (3) we use an alternative treatment construction following Bakke et al (2015)
where Treated is an indicator that takes value of zero if the firm granted zero option to its CEO in both 2003 and 2004 or the firm began to
voluntarily expense option-based pay at fair value in 2002 or earlier and one otherwise For each control variable we include both its level in
the Pre-FAS123R period and its change across the two periods Panel B shows the results of estimating fixed effect models with firm-year
observations The dependent variable is the firm-year level Option grantTotal pay The main independent variables are the interactions of
Post-FAS123R indicator (Post) with Accounting Impact rank Accounting impact rank indicators and Treated respectively All models in
Penal A have industry fixed effects and the standard errors are Huber-White heteroscedasticity-consistent standard errors All models in
Penal B have firm fixed effects and year fixed effects and the standard errors are clustered at firm level All variables are defined in
Appendix The notation and indicates statistically significant at 10 5 and 1 level respectively
Model (1) Model (2)
11711171 1171
Industry Industry
Huber-White
0124
Huber-White
0123
Industry
48
Panel B Panel fixed effects regression
Prediction Coeff t-stat Coeff t-stat Coeff t-stat
Acc impact rank x Post - -0044 -807
Acc impact rank 2 x Post - -0046 -333
Acc impact rank 3 x Post - -0077 -526
Acc impact rank 4 x Post - -0137 -776
Treated x Post - -0145 -970
Log(size) 0034 221 0034 217 0036 229
Book-to-market 0018 084 0017 083 0015 070
Leverage -0004 -009 -0006 -013 -0007 -015
Asset tangibility 0007 012 0004 006 0011 018
Free cash flow -0074 -151 -0072 -146 -0078 -158
Cash holding -0048 -086 -0050 -090 -0006 -011
Five-year ROA volatility 0250 231 0239 219 0437 414
Institutional ownership 0043 159 0044 161 0041 150
Sales growth -0033 -168 -0034 -171 -0031 -158
Past one-year stock return 0067 221 0068 224 0063 204
Loss indicator 0023 209 0022 207 0024 222
Fixed effects
Standard error
Adj R-squared
Observations
Dependent variable Option grantTotal pay
5653 5653 5653
Clustered by firm
Firm Year
Clustered by firm
Firm Year
Clustered by firm
0523 0523 0526
Model (1) Model (2) Model (3)
Firm Year
49
Table 3
Effect of option-based compensation on dividend policy
Panel A Two-period first-difference regression
Prediction Coeff t-stat Coeff t-stat Coeff t-stat
Accounting impact rank + 0000 077
Accounting impact rank=2 + 0001 091
Accounting impact rank=3 + 0000 044
Accounting impact rank=4 + 0001 092
Treated + 0000 -026
ΔLog(size) 0000 -030 0000 -030 0000 -026
ΔBook-to-market -0002 -190 -0002 -193 -0002 -195
ΔLeverage -0002 -059 -0002 -057 -0002 -059
ΔAsset tangibility 0016 431 0016 429 0016 430
ΔFree cash flow 0017 373 0017 373 0017 375
ΔCash holding -0011 -288 -0011 -285 -0010 -282
ΔFive-year ROA volatility 0003 034 0002 032 0003 035
ΔInstitutional ownership -0002 -073 -0002 -073 -0002 -070
ΔSales growth -0001 -040 -0001 -037 -0001 -038
ΔPast one-year stock return 0002 077 0002 076 0002 070
ΔLoss frequency 0000 -048 0000 -045 0000 -046
Log(size) 0000 183 0000 182 0000 182
Book-to-market -0002 -227 -0002 -225 -0002 -284
Leverage -0001 -037 -0001 -039 -0001 -048
Asset tangibility 0003 179 0003 180 0003 176
Free cash flow 0017 291 0017 291 0017 300
Cash holding 0002 080 0002 077 0002 098
Five-year ROA volatility 0003 035 0002 033 0003 044
Institutional ownership -0001 -068 -0001 -068 -0001 -058
Sales growth -0004 -177 -0004 -175 -0004 -172
Past one-year stock return 0004 169 0004 167 0004 165
Loss frequency -0001 -111 -0001 -109 -0001 -102
Fixed effect
Standard error
Adj R-squared
Observations
Dependent variable ΔAvg Regular dividendTotal assets
This table investigates the causal effect of option-based pay on dividend policy by examining whether changes in dividend policy around
FAS123R vary with its potential accounting impact Panel A reports the results of estimating three two-period first-differencing models
where for each firm we average its characteristics in Pre- and Post-FAS123R period In all three specifications the dependent variable is
the change of average Regular dividendTotal assets from Pre- to Post-FAS123R period The main independent variable varies by model in
Model (1) the Accounting impact rank is the quartile rank of implied option expensetotal assets measured in 2002 (1=lowest 4=highest) In
Model (2) Accounting impact rank=2 (3 4) is an indicator that takes value of one if the firmrsquos Accounting impact rank equals 2 (3 4) In
Model (3) we use an alternative treatment construction following Bakke et al (2015) where Treated is an indicator that takes value of zero
if the firm granted zero option to its CEO in both 2003 and 2004 or the firm began to voluntarily expense option-based pay at fair value in
2002 or earlier and one otherwise For each control variable we include both its level in the Pre-FAS123R period and its change across the
two periods Panel B shows the results of estimating fixed effect models with firm-year observations The dependent variable is the firm-
year level Regular dividendTotal assets The main independent variables are the interactions of Post-FAS123R indicator (Post) with
Accounting Impact rank Accounting impact rank indicators and Treated respectively Panel C examines the intensity of dividend changes
among firms with nonzero dividend per share in 2003 or 2004 In particular we estimates the same three models as in Panel A(with the
same independent variables) but for five dependent variables the change of average Regular dividendTotal assets from Pre- to Post-
FAS123R period (as in Panel A) the percentage change of DPS (dividend per share) from Pre- to Post-FAS123R period and three
indicators denoting respectively whether the percentage change of DPS was greater than 20 40 and 60 Panel D reports four
robustness tests of the dividend intensity regression In each of them a set of possible confounding observations is removed (see Section 33
for details) Panel E compares the trends of dividend initiation and termination around FAS123R across four quartile groups ranked by
accounting impact All models in Panel A C and D have industry fixed effects and the standard errors are Huber-White heteroscedasticity-
consistent standard errors All models in Penal B have firm fixed effects and year fixed effects and the standard errors are clustered at
firm level All variables are defined in Appendix The notation and indicates statistically significant at 10 5 and 1 level
Industry Industry Industry
Model (1) Model (2) Model (3)
1171 1171 1171
Huber-White Huber-White Huber-White
0105 0104 0105
50
Panel B Panel fixed effects regression
Prediction Coeff t-stat Coeff t-stat Coeff t-stat
Acc impact rank x Post + 0000 122
Acc impact rank 2 x Post + 0001 110
Acc impact rank 3 x Post + 0001 094
Acc impact rank 4 x Post + 0001 129
Treated x Post + 0000 -012
Log(size) 0001 179 0001 179 0001 181
Book-to-market 0000 025 0000 024 0000 031
Leverage 0001 062 0001 064 0001 069
Asset tangibility 0009 360 0009 358 0009 363
Free cash flow 0002 090 0002 093 0002 092
Cash holding -0007 -295 -0007 -298 -0007 -298
Five-year ROA volatility 0001 041 0001 038 0000 -006
Institutional ownership 0000 -027 0000 -026 0000 -027
Sales growth 0000 053 0000 051 0000 044
Past one-year stock return 0001 089 0001 088 0001 078
Loss indicator 0000 -060 0000 -057 0000 -076
Fixed effects
Standard error
Adj R-squared
Observations
Dependent variable Regular dividendTotal assets
Model (1) Model (2) Model (3)
Firm Year Firm Year Firm Year
5653 5653 5653
Clustered by firm Clustered by firm Clustered by firm
0877 0877 0877
51
Panel C Intensity of dividend changes around FAS123R
Prediction Coeff t-stat Coeff t-stat Coeff t-stat
Accounting impact rank + 0000 065
Accounting impact rank=2 + 0000 048
Accounting impact rank=3 + 0000 026
Accounting impact rank=4 + 0002 080
Treated + 0001 063
Dependent var DPS pct change
Accounting impact rank + -0145 -072
Accounting impact rank=2 + 0018 006
Accounting impact rank=3 + -0177 -045
Accounting impact rank=4 + -0746 -100
Treated + -0407 -119
Accounting impact rank + 0029 095
Accounting impact rank=2 + 0040 074
Accounting impact rank=3 + 0092 139
Accounting impact rank=4 + 0008 007
Treated + -0007 -012
Accounting impact rank + 0024 076
Accounting impact rank=2 + 0047 088
Accounting impact rank=3 + 0079 114
Accounting impact rank=4 + -0003 -002
Treated + 0030 052
Accounting impact rank + 0030 098
Accounting impact rank=2 + 0078 155
Accounting impact rank=3 + 0085 130
Accounting impact rank=4 + 0014 012
Treated + -0006 -011
Control variables
Fixed effect
Standard error
Observations 572 572 572
Yes Yes Yes
Huber-White Huber-White Huber-White
Industry Industry Industry
Dependent var DPS pct
change gt60 indicator
Model (1) Model (2) Model (3)
Dependent var ΔAvg Regular
dividendAssets
Dependent var DPS pct
change gt20 indicator
Dependent var DPS pct
change gt40 indicator
52
Panel D Robustness tests for intensity of dividend changes around FAS123R
Prediction Coeff t-stat Coeff t-stat Coeff t-stat
Accounting impact rank + 0006 017
Accounting impact rank=2 + 0067 118
Accounting impact rank=3 + 0041 057
Accounting impact rank=4 + -0061 -049
Treated + 0022 035Observations
Accounting impact rank + 0009 027
Accounting impact rank=2 + 0058 106
Accounting impact rank=3 + 0032 043
Accounting impact rank=4 + -0032 -024
Treated + 0018 028
Observations
Accounting impact rank + 0030 089
Accounting impact rank=2 + 0039 071
Accounting impact rank=3 + 0122 168
Accounting impact rank=4 + -0063 -052
Treated + 0075 132
Observations
Accounting impact rank + 0008 023
Accounting impact rank=2 + 0023 042
Accounting impact rank=3 + 0048 064
Accounting impact rank=4 + -0042 -033
Treated + -0010 -016
Observations
Control variables
Fixed effect
Standard error
Exclude firms with stable
payout ratio from 2003 to 2004
506 506 506
Dependent variable DPS pct change gt40 indicator
Model (1) Model (2) Model (3)
Exclude voluntary expensers
519 519
Exclude firms in the top decile
of option reduction (02-04)
Exclude firms that accelerated
option vesting
504 504 504
517 517 517
519
Huber-White Huber-White Huber-White
Yes Yes Yes
Industry Industry Industry
53
Panel E Dividend initiation and termination rates around FAS123R
Pre FAS 123R
1 280 75 7 6 13 173
2 284 135 18 9 27 200
3 286 181 11 14 25 138
4 282 260 9 10 19 73
Total 1132 651 45 39 84 129
Post FAS 123R
1 275 63 4 4 8 127
2 280 116 9 9 18 155
3 276 152 9 3 12 79
4 263 223 5 1 6 27
Total 1094 554 27 17 44 79
Pre FAS 123R
1 280 205 2 0 2 10
2 284 149 7 1 8 54
3 286 105 0 0 0 00
4 282 22 0 0 0 00
Total 1132 481 9 1 10 21
Post FAS 123R
1 275 212 3 6 9 42
2 280 164 1 2 3 18
3 276 124 1 1 2 16
4 263 40 0 3 3 75
Total 1094 540 5 12 17 31
termination
in 2004
03-04
cumulative
03-04
cumulative
Quartile firms
with
dividend in
2004
termination
in 2005
termination
in 2006
05-06
cumulative
05-06
cumulative
Termination
Quartile firms
with
dividend in
2002
termination
in 2003
without
dividend in
2004
initiation in
2003
initiation in
2004
03-04
cumulative
03-04
cumulative firmsQuartile
firmsQuartile initiation in
2005
initiation in
2006
05-06
cumulative
05-06
cumulative
Initiation
without
dividend in
2002
54
Table 4
Effect of option-based compensation on repurchases
Panel A Two-period first-difference regression with total repurchase
Prediction Coeff t-stat Coeff t-stat Coeff t-stat
Accounting impact rank - 0002 122
Accounting impact rank=2 - 0002 071
Accounting impact rank=3 - 0005 123
Accounting impact rank=4 - 0007 102
Treated - 0014 365
Control variables
Fixed effect
Standard error
Adj R-squared
Observations
Panel B Two-period first-difference regression with net repurchase
Prediction Coeff t-stat Coeff t-stat Coeff t-stat
Accounting impact rank - 0003 166
Accounting impact rank=2 - 0002 051
Accounting impact rank=3 - 0006 165
Accounting impact rank=4 - 0009 137
Treated - 0010 300
Control variables
Fixed effect
Standard error
Adj R-squared
Observations
Panel C Two-period first-difference regression with repurchase adjusted for exercised options
Prediction Coeff t-stat Coeff t-stat Coeff t-stat
Accounting impact rank - 0001 056
Accounting impact rank=2 - 0002 062
Accounting impact rank=3 - 0007 172
Accounting impact rank=4 - -0001 -008
Treated - 0006 197
Control variables
Fixed effect
Standard error
Adj R-squared
Observations
Dependent variable ΔAvg RepurchaseTotal assets
This table investigates the causal effect of option-based pay on payout policy by examining whether the changes of repurchase around
FAS123R vary with its potential accounting impact Panel A reports the results of estimating three two-period first-differencing models
where for each firm we average its characteristics in Pre- and Post-FAS123R period In all three specifications the dependent variable is
the change of average RepurchaseTotal assets from Pre- to Post-FAS123R period The main independent variable varies by model in
Model (1) the Accounting impact rank is the quartile rank of implied option expensetotal assets measured in 2002 (1=lowest 4=highest)
In Model (2) Accounting impact rank=2 (3 4) is an indicator that takes value of one if the firmrsquos Accounting impact rank equals 2 (3 4)
In Model (3) we use an alternative treatment construction following Bakke et al (2015) where Treated is an indicator that takes value of
zero if the firm granted zero option to its CEO in both 2003 and 2004 or the firm began to voluntarily expense option-based pay at fair
value in 2002 or earlier and one otherwise Panel B reports the regressions with the change of Net repurchaseTotal assets as the
dependent variable and the same independent variable as in Panel A Panel C reports the regressions with the change of Adjusted
repurchaseTotal assets as the dependent variable and the same independent variable as in Panel A All models in Panel A B and C have
industry fixed effects and the standard errors are Huber-White heteroscedasticity-consistent standard errors All variables are defined in
Appendix The notation and indicates statistically significant at 10 5 and 1 level respectively
Model (1) Model (2) Model (3)
Yes Yes Yes
Industry Industry Industry
Huber-White Huber-White Huber-White
Dependent variable ΔAvg Net repurchaseTotal assets
1171 1171 1171
0238 0237 0245
Model (1) Model (2) Model (3)
Yes Yes Yes
Industry Industry Industry
Huber-White Huber-White Huber-White
Dependent variable ΔAvg Adjusted repurchaseTotal assets
0229 0229 0233
1171 1171 1171
Model (1) Model (2) Model (3)
Yes Yes Yes
Industry Industry Industry
Huber-White Huber-White Huber-White
0111 0112 0114
1168 1168 1168
55
Table 5
Effect of option-based compensation on payout mix
Panel A Two-period first-difference regression with total payout mix
Prediction Coeff t-stat Coeff t-stat Coeff t-stat
Accounting impact rank + 0006 028
Accounting impact rank=2 + 0018 045
Accounting impact rank=3 + -0001 -001
Accounting impact rank=4 + 0043 052
Treated + -0035 -094
Control variables
Fixed effect
Standard error
Adj R-squared
Observations
Panel B Two-period first-difference regression with net payout mix
Prediction Coeff t-stat Coeff t-stat Coeff t-stat
Accounting impact rank + -0002 -008
Accounting impact rank=2 + 0008 016
Accounting impact rank=3 + 0018 034
Accounting impact rank=4 + -0059 -055
Treated + -0050 -101
Control variables
Fixed effect
Standard error
Adj R-squared
Observations
0049 0043 0054
257 257 257
Industry Industry Industry
Huber-White Huber-White Huber-White
Dependent variable ΔAvg Regular dividendNet payout
Model (1) Model (2) Model (3)
Yes Yes Yes
0154 0151 0156
362 362 362
Industry Industry Industry
Huber-White Huber-White Huber-White
This table investigates the causal effect of option-based pay on payout mix for firms using both dividend and repurchase by examining
whether the changes of payout mix around FAS123R vary with its potential accounting impact Panel A reports the results of estimating
three two-period first-differencing models where for each firm we average its characteristics in Pre- and Post-FAS123R period In all three
specifications the dependent variable is the change of average Regular dividendTotal payout from Pre- to Post-FAS123R period The main
independent variable varies by model in Model (1) the Accounting impact rank is the quartile rank of implied option expensetotal assets
measured in 2002 (1=lowest 4=highest) In Model (2) Accounting impact rank=2 (3 4) is an indicator that takes value of one if the firmrsquos
Accounting impact rank equals 2 (3 4) In Model (3) we use an alternative treatment construction following Bakke et al (2015) where
Treated is an indicator that takes value of zero if the firm granted zero option to its CEO in both 2003 and 2004 or the firm began to
voluntarily expense option-based pay at fair value in 2002 or earlier and one otherwise Panel B reports the regressions with the change of
Regular dividendNet payout as the dependent variable and the same independent variables as in Panel A Panel A (Panel B) is based on
observations with nonzero regular dividend and repurchase (net repurchase) in both Pre- and Post-FAS123R period All models in Panel A
and B have industry fixed effects and the standard errors are Huber-White heteroscedasticity-consistent standard errors All variables are
defined in Appendix The notation and indicates statistically significant at 10 5 and 1 level respectively
Yes Yes Yes
Dependent variable ΔAvg Regular dividendTotal payout
Model (1) Model (2) Model (3)

10
where ΔPayouti represents the change in the average value of one of the payout variables
of interest (described in Section 23) from the the pre- to the post-FAS123R period
Eq (2) is essentially a difference-in-difference approach to estimate the effect of option-
based pay on payout policy using the differential accounting impact of FAS123R to capture the
exogenous (accounting-induced) portion of the change in option-based pay If option-based pay
has a detectable causal effect on dividends (repurchases) in the direction predicted by the
literature γ1 should be positive (negative)
As noted by Bertrand Duflo and Mullainathan (2004) in difference-in-difference studies
with panel data OLS may yield inconsistent standard error estimates because the dependent
variable and the main independent variable tend to be serially correlated within firm To alleviate
this concern following Bertrand et al (2004) in both Eqs (1) and (2) we collapse the panel to a
single ldquoPrerdquo (2003-2004) and a single ldquoPostrdquo (2005-2007) period by averaging across years and
then measuring the changes from Pre to Post11 We choose 2003 as the starting period in order to
capture a period subsequent to the 2003 tax cut on individual dividend income While the
evidence on the effect of the tax cut on payout policy is mixed (Chetty and Saez 2005 Edgerton
2013 Floyd et al 2015) starting with 2003 allows the pre-FAS123R levels of the key variables to
reflect any effect of the tax cut 12 We end our analysis in 2007 to avoid the potentially
confounding effect of the 2008 financial crisis which had a significant impact on payouts (Floyd et
al 2015)13 Following Hayes et al (2012) and Bakke et al (2015) we include 2005 in the Post
11 In the collapsed two-period panel a regression of changes is equivalent to a regression of levels with firm-fixed
effects and an indicator for the Post period Both approaches obviate unobserved time-invariant firm heterogeneity
We choose first differencing equation for a more intuitive interpretation 12 The Jobs and Growth Tax Relief Reconciliation Act of 2003 was signed into law on May 28 2003 but had been
proposed on January 7 2003 and was made retroactive to the beginning of 2003 Chetty and Saez (2005) show that
the tax change affected dividend policy in 2003 13 In November 2006 the Securities and Exchange Commission required more details about the terms of performance-
based incentive plans We are not aware of any evidence that these rules affected the weight of option-based pay
11
period because FAS123R while effective in June 2005 was released in December 2004 14
Alternatively in untabulated tests we exclude 2005 from the analysis and obtain similar results
Another benefit of using a single Pre and Post period is that it is better suited than panel
data to the analysis of repurchases As noted by Skinner (2008) firms engaging in repurchases
tend to do so every other year thus the relation between repurchases and economic determinants is
stronger over two- or three-year periods than one-year periods Factors explaining the timing of
repurchases differ from those explaining their level and the year-to-year variation in repurchases is
not necessarily informative of changes in payout policy As we are not interested in the timing of
repurchases our approach seems to better capture ldquolong-runrdquo changes in payout policy However
for the analysis of dividends (which are generally paid every year and thus not subject to the
above problem) we also present the results using a panel regression with firm- and year-fixed
effects To alleviate the problem of serial correlation discussed earlier we cluster the standard
errors by firm
22 Accounting Impact
As noted earlier all firms were affected by FAS123R making it difficult to identify a
control sample To capture variation in the cross-sectional impact of FAS123R in Eqs (1) and (2)
we use Accounting Impacti defined as the implied option expense disclosed in the footnote of the
income statement for the 2002 fiscal year scaled by total assets (we obtain similar findings when
scaling it by revenues) We measure this variable in 2002 (ie before the Pre period) rather than in
2003 or 2004 to avoid any confounding effect from the expected adopion of FAS123R (see
discussion in Section 33) As this variable is highly skewed (see Table 1) we define it based on
(Gipper 2015) or had any effect on payout policy However we exclude 2007 from the Post period in robustness tests
Our inferences are unchanged 14 FAS123R was released in December 2004 effective as of the beginning of the first interim or annual reporting
period beginning after June 15 2005 Subsequently the SEC allowed a six-month deferral making the standard
effective for fiscal years beginning after December 15 2005
12
its quartile rank We also presents results with separate indicators for the top three quartiles in
order to better isolate the difference between top quartile (the most lsquotreatedrsquo group) and bottom
quartile (the least lsquotreatedrsquo group and thus closer to the notion of a control group)
An alternative way to address the issue of a lack of control group is suggested by Bakke et
al (2015) They argue that two sets of firms were likely lsquounaffectedrsquo by FAS123R (i) firms that
did not grant options to the CEO in 2003 and 2004 as in these firms FAS123R could not affect
CEO option pay and thus her incentives to make policy changes (ii) firms that were already
voluntarily expensing stock options as of 2002 (ie before FASB began discussions of the new
standard) as these firms would not face any additional accounting charge under FAS123R
Our approach offers a number of advantages First instead of collapsing all lsquonon-controlrsquo
firms in a single lsquotreatedrsquo group we exploit cross-sectional variation among treatment firms in
terms of the likely impact of FAS123R effectively using the most and least affected firms
(respectively top and bottom quartile of implied option expense) as treatment and control group
As shown in Table 1 the implied option expense is highly skewed (ie only a relatively small
number of firms was heavily affected by FAS123R) Capturing this variation is likely to increase
the power of the test Second in Bakke et al (2015) what matters is that the treatment definition
captures an accounting-driven change in CEO option grants as their focus is on CEO risk-taking
incentives In our setting we want to capture an accounting-driven change both in CEO option
grants (predicted to affect incentives to use dividends) and in the overall use of stock options
(predicted to affect the use of repurchases) As noted in Section 31 (see footnote 20) many firms
without CEO option grants in 2003 and 2004 were issuing options to non-CEO executives and
other employees and thus facing a potential accounting charge under FAS123R Third about half
of the firms without CEO option grants in 2003 and 2004 issued options to the CEO in the Post-
13
period Hence it is not clear that the control firms were truly unaffected by FAS123R Finally
the implied option expense in 2002 (our measure of the expected accounting impact) is a function
of option grants made in prior years when firms could not anticipate the adoption of FAS123R In
contrast option grant decisions in 2003 and 2004 may be affected by its anticipated adoption as
FASB added accounting for stock-based compensation to its agenda in March 2003
Notwithstanding the above arguments throughout our study we also present the results
using the definition of treatment and control in Bakke et al (2015) In particular we modify Eqs
(1) and (2) by replacing Accounting Impact with Treated an indicator equal to zero for the two
groups of firms identified as lsquocontrolrsquo in Bakke et al (2015) and one for all other firms
23 Payout Variables and Control Variables
Following Brown et al (2007) our baseline measure for changes in dividends is the change
in the DividendAssets ratiomdashcomputed as the regular cash dividends paid during the year scaled
by total assets at the beginning of the yearmdashfrom the Pre to the Post period15 However the
dividend-to-asset ratio is not what managers focus on when making dividend policy decisions
The stability of dividend per share (DPS) among dividend-paying firms (hereinafter payers)
suggests that managers do not target a specific dividend-to-assets ratio but rather a DPS level
(Baker and Wurgler 2016) Survey evidence confirms that executives make dividend policy
decision in terms of changes to the current level of DPS (Brav et al 2005) Therefore we also
examine the percentage change in the average DPS from the Pre to the Post period However this
measure can only be computed for the subset of payers (defined as firms with non-zero DPS in at
15 An alternative choice would be to scale dividends by the market value of equity essentially computing a dividend
yield However a drawback of using the dividend yield in our setting is that after controlling for time-invariant firm
characteristics through fixed effects or first differencing the variation of the ratio comes mainly from the denominator
the stock price (Baker and Wurgler 2004) Thus we choose the more stable book value of total assets as denominator
Also similar to other studies (eg Fenn and Liang 2001) we focus on regular dividends and exclude special dividends
as they are very rare and may introduce large noise to the dividend measures for few observations (DeAngelo
DeAngelo and Skinner 2000)
14
least one of the years of the Pre period) To provide insights into FAS123Rrsquos effect on dividend
policy for non-payers we examine the relation between our Accounting Impact variable and the
rate of dividend initations in the Pre and Post periods
Our main measure for repurchases is the change in RepurchaseAssetsmdashthat is the
aggregate amount of common stock repurchases made during the year scaled by total assets at the
beginning of the yearmdashfrom the Pre to the Post period In the empirical tests we examine
variations suggested in the literature
Finally as an alternative to examining dividends and repurchases separately we also look at a
measure of the payout composition the change in the DividendsTotal Payout ratio from the Pre to
the Post period (Total Payout is the sum of dividends and repurchases) effectively capturing any
substitution effect between dividends and repurchases 16 Examining the causal effect of the
change in option-based pay on payout composition is especially relevant if managers first target a
total payout and then choose the relative weight of dividends and repurchases In practice it is
unclear to what extent managers act this way (Brav et al 2005) Nonetheless for completeness we
also examine this variable We focus on the subsample of firms with both dividends and
repurchases in both Pre and Post period so as to capture changes in payout mix by firms routinely
using both vehicles to return cash to shareholders
As for the control variables in both Eqs (1) and (2) Controli is a vector of firm characteristics
identified in existent literature as determinants of payout policy (eg Fenn and Liang 2001 Brown
et al 2007 Skinner 2008 Cuny et al 2009) firm size book-to-market leverage asset tangibility
free cash flows cash holdings volatility in operating income institutional ownership sales
16 Fama and French (2001) suggest that repurchases are often complement to dividends while Grullon and Michaely
(2002) document that the increase in share repurchases over the past decades has come at the expense of a lower
increase in dividends consistent with a substitution hypothesis Brown et al (2007) also provide evidence of a
substitution effect in response to the 2003 dividend tax cut Survey evidence in Brav et al (2005) suggests an
asymmetric substitution effect with managers more willing to replace dividends with repurchases than the opposite
15
growth past stock returns and an indicator for loss firms For all of these variables we include
both changes from Pre to Post period and levels in the Pre period to allow for the possibility that
levels of these variables affect subsequent changes in payout policy 17 Finally we include
industry-fixed effects (Fama-French 48 industry indicators) to control for industry-level trends in
payout policies and option-based pay In unreported tests we replace free cash flows with two
separate variables operating profit and capital expenditures We also replace volatility in
operating income with volatility in stock returns Our results are unaffected More detailed
definitions of each variable are in the Appendix
24 Identification Assumption
The key identifying assumption underlying the difference-in-difference estimation
technique is that the parallel trends assumption is satisfied In the absence of treatment both
treated and control firms should experience parallel trends in the outcome variable Our approach
assumes that in the absence of FAS123R the change in dividends or repurchases would be the
same for high and low accounting impact firms Note that the well-documented contemporaneous
correlation between levels of option compensation (a key driver of the implied option expense and
thus the accounting impact) and levels of payout variables does not violate our identification
assumption This is because our assumption pertains to the relation between the level of option
compensation and future changes in payout variables
A specific concern is that options may be granted in anticipation of expected future
changes in payout policy (reverse causality problem) Relative to simple association tests this
concern is significantly reduced in our setting because the accounting impact is measured three
years prior to the arrival of treatment and is the result of option grants made over the prior four or
17 In untabulated analyses we run our tests after excluding changes in the control variables (ie including only their
pre-treatment levels) since in difference-in-difference studies controlling variables measured after the shock may
reintroduce selection bias Our inferences remain unchanged
16
five years depending on the vesting schedule18 For the reverse causality to be plausible the
implied option expense in 2002 (the result of option grants made approximately between 1998 and
2002) needs to reflect the anticipated change in payout policy in 2005-2007 This seems unlikely
While the parallel trend assumption is not directly testable similar to other studies (Bakke
et al 2015) we examine the trends in dividends and repurchases during the Pre period Figure 1
suggests that high and low accounting impact firms (respectively top and bottom quartile of
implied option expense) exhibit similar trends in payout variables in the Pre period ie from 2003
to 2004 More formally to examine the correlation between Accounting Impact and trends in the
payout variables during the Pre period we estimate the following regression only with
observations in 2003 and 2004
Payouti = γ0 + γ1 Accounting Impacti FY2004+ γ2 FY2004+ ΓControli +Firm FE +ui (3)
where Payouti is either DividendAssets or RepurchaseAssets FY2004 is an indicator of
fiscal year 2004 Firm FE indicates firm-fixed effects If firms with varying degrees of accounting
impact have different payout trends before the adoption of FAS123R γ1 should be different from
zero However for both payout variables we find that the estimated γ1 is close to zero and not
statistically significant at 10 level (untabulated tests) Overall the parallel trends assumption
seems reasonable in our setting
3 Empirical analyses
31 Sample Selection and Summary Statistics
Our sample is the SampP 1500 firms with available data on implied option expense (from
Compustat) and on executive compensation (from Execucomp) for at least one year in the Pre
18 The accounting treatment for stock options requires their fair value at the grant date to be recognized over the
service period (usually the vesting period) Hence the implied option expense in a given year includes a fraction of
the expense associated with past option grants
17
period and one year in the Post period to ensure consistency in the sample across periods Similar
to prior studies on payout policy (Fama and French 2001 Skinner 2008) we exclude financial
firms (SIC code between 6000 and 6999) and utilities (SIC between code 4900 and 4999) as well as
firms not incorporated in the US Our final sample includes 1176 firms19 We obtain dividend
and stock returns data from CRSP stock repurchases and dividend per share data from
COMPUSTAT and institutional ownership data from Thomson Reuters 13F database Other
control variables are from CRSP and COMPUSTAT To deal with outliers we winsorize all
continuous variables at 1 and 99 by fiscal year A detailed definition of all variables and their
sources is in Appendix
Table 1 Panel A presents summary statistics of the relevant variables for the pooled sample of
5653 firm-year observations Implied option expense in 2002 (our proxy for Accounting Impact)
is on average 173 of total assets with the median at 052 This suggests that the accounting
impact is very large for a small number of firms Over the entire sample period on average
dividends represent 093 of total assets while repurchases represent 394 Untabulated
analyses indicate that in 16 of the firm-year observations only dividends are paid out in 25
only repurchases in 32 both and in 27 neither Within the subset of firm-years with a payout
dividends represent 3874 of total payout This data confirms prior evidence that repurchases
have assumed the primary role as a vehicle to return cash to shareholders (eg Floyd et al 2015)
The mean (median) total executive pay (average across the top 5 executives) is $25 million ($16
million) On average option grants and restricted stock grants represent respectively 283 and
141 of total pay while salary and bonus comprise 296 and 197 respectively The
19 The results presented in the study are similar when (i) we restrict the sample to firms with available data for the
entire (2003-2007) sample period (1009 firms) and (ii) we exclude firms with CEO turnover in the Post period
(reducing the sample size to 780 firms) as a new CEO may have a different compensation package andor adopt a
different payout policy
18
composition of CEO pay (untabulated) is similar As for the control variables the figures are
generally consistent with other studies examining SampP 1500 firms over the same period
Panel B reports the pairwise Pearson correlations among the relevant variables The
correlations are in line with the associations documented in prior studies For example larger
firms and firms with higher profitability (free cash flows) have higher payouts loss firms have
lower payouts greater volatility in operating income is associated with lower dividends
More relevant to our analysis Panel C presents the mean of each variable in the Pre and Post
period for the full sample For each variable we first compute the firm-level mean over the Pre
and the Post Period and then compute the mean of the resulting figure across all firms There is a
striking increase in repurchases which double from 245 to 490 of total assets causing a
similar increase in total payout The increase in dividends is much smaller from 083 to 099
of total assets As a result for firms with positive payout dividends become a smaller fraction of
total payout in the Post period (2790 versus 3914 in the Pre period) This trend is consistent
with Floyd et al (2015) who document a dramatic increase in repurchases in the years leading to
the 2008 financial crisis Consistent with previous studies around FAS123R there is a significant
reduction in option grants as a fraction of total executive pay (from 343 to 240) and a
corresponding increase in the use of restricted stock (from 87 to 176) with little variation in
the weight of salary and bonus (note that restricted stock salary and bonus were expensed both
before and after FAS123R) Similar patterns hold for the composition of CEO pay (untabulated)
Compared to changes in the mix of executive pay changes in the levels of control variables are
generally less pronounced
Panel D reports the change in the key compensation and payout variables from the Pre to the
Post period by quartiles of implied option expense and yields a number of insights First
19
confirming the skewness suggested by Panel A the mean implied option expense is 551 for
firms in the top quartile versus only 093 035 and 012 for firms in the second third and
bottom quartile respectively Second as expected firms with higher implied option expense have
greater use of option-based pay For example in the Pre-period option pay represents 507 of
total executive pay at firms in the top quartile versus 201 in the bottom quartile Third and
more importantly for our research design the use of option pay changes significantly from the Pre
to the Post period as a function of the accounting impact For firms in the top quartile the
percentage of total pay represented by stock options drops by 182 (from 507 to 325)
versus 113 80 and 34 for firms in the second third and bottom quartile respectively The
decline in option usage across quartiles is accompanied by an increase in restricted stock grants
while the weight of salary and bonus shows little change It is important to emphasize the
substitution of stock options with restricted stocks because restricted stocks typically pay
dividends (Zhang 2013) thus providing further reason to expect a dividend increase in response to
the FAS123R-induced decline in option pay
As for the payout variables Panel D suggests that heavy option users (firms with higher
implied option expense) generally use repurchases more than dividends consistent with the
associations documented in earlier studies In the Pre period repurchases (dividends) represent
351 (030) of total assets for the top quartile versus 113 (112) for the bottom quartile
Panel D also indicates that the increase in repurchases documented in Panel C takes place across
all quartiles As for the (much smaller) change in dividends the absolute increase is similar across
the four quartiles though the relative increase (the percentage change) appears to be slightly
higher in the top quartile Overall these figures do not suggest a shift toward dividends and away
from repurchases by firms with a large (accounting-induced) decline in the use of option pay
20
Panel E presents the same data as Panel D but based on the definition of lsquotreatmentrsquo and
lsquocontrolrsquo in Bakke et al (2015) Under this definition 997 firms are classified as treatment group
and 177 as control (171 firms are classified as lsquocontrolrsquo because they did not grant options to the
CEO in the Pre period and 6 because they were voluntarily expensing options before 2003)
Interestingly lsquotreatedrsquo firms are equally distributed across the quartiles suggesting significant
variation in the degree of treatment As discussed earlier one benefit of our approach is that it
exploits cross-sectional variation among treatment firms in terms of the likely impact of FAS123R
Also 40 of the control firms (71 out of 177) are in the lowest quartile while 35 ((37+25)177)
are in the top two quartiles reflecting the different focus of the two approaches in terms of
identifying firms less affected by FAS123R20
As for payout and compensation variables Panel E shows that the treated group experiences a
larger increase in repurchases than the control group while the (less pronounced) increase in
dividends is similar across treated and control firms Treated firms experience a 126 decrease in
option pay (from 387 to 261) with a corresponding 94 increase in the weight of restricted
stock grants (from 80 to 174) The figures are similar at the CEO level (because the
classification is based on options grants to the CEO it is useful to report pay figures at both the top
5 executives and the CEO level) Interestingly the control group experiences a pronounced
increase in the weight of option grants in total CEO pay from 10 to 127 as almost half of the
control firms issued options to their CEOs in the Post period (for these firms options as percentage
of total CEO pay increased from 0 to 254 untabulated analysis) While this increased use of
stock options suggests (ex post) that these firms were not concerned with the impact of FAS123R
another possibility is that the lack of use of option compensation for CEOs in 2003 and 2004 was
20 In untabulated analysis we find that 55 of the 171 firms issuing no options to the CEO in the Pre period granted
options to the other top executives (and perhaps to other non-executive employees) thus explaining the relatively high
implied option expense for the control group (10 versus 19 for the treatment group ndash see Panel E)
21
temporary rather than the effect of a permanent policy If these firms were planning to issue
options to the CEO in the Post period the assumption that they were unaffected by FAS123R (and
thus their use as control sample) is questionable21
32 Differential Impact of FAS123R on the Use of Option-Based Compensation
An important building block of our approach is the presumed differential impact of FAS123R
on option-based pay as a function of pre-existing implied option expense22 While Table 1 Panel
D preliminarily supports the validity of this assumption we formally examine it by estimating Eq
(1)
As reported in Table 2 Panel A we find a significant negative association between Accounting
Impact and the change in option-based pay around the adoption of FAS123R In column (1)
where we use the quartile rank of implied option expense the -0044 coefficient implies that
around FAS123R option grants over total pay decline by 44 as we move from the highest
quartile to the next Thus the reduction in top quartile firms is 132 larger than in bottom
quartile firms In column 2 we replace the quartile rank with three indicators for the highest
quartiles (with the bottom quartile collapsed in the intercept) so as to be able to compare directly
top and bottom quartile without imposing the same effect across quartiles The negative and
significant coefficient on the top quartile indicator at -0140 suggests that the reduction in option
grants over total pay is 140 larger for top quartile firms relative to bottom quartile firms
Finally in column 3 we use the indicator for treated firms following Bakke et al (2015) The
21 Panel E also shows an increase in the use of restricted stock in CEO pay packages (from 128 to 182 almost
comparable to the increase among treated firms) The concurrent increase in options and restricted stock suggests
these firms would have increased option pay significantly more had it not been for FAS123R indicating further
caution in classifying them as control group of unaffected firms 22 This is akin to the relevance assumption of instrumental variable if we interpret the implied option expense as an
instrument to the change in option-based pay
22
negative and significant coefficient at -0132 suggests that treated firms experience a 132
larger drop in the weight of option pay relative to control firms
In Panel B we re-estimate Eq (1) using a panel regression with firm- and year-fixed effects
(5653 firm-year observations) where the dependent variable is the the ratio of option grants to
total executive pay The results are virtually identical in terms of significance and magnitude of
the coefficients of interest (the interaction terms between respectively Accounting impact and
Treated and an indicator for the Post period)
Overall Table 2 suggests that high implied option expense and the introduction of FAS123R
together strongly encouraged firms to cut back option-based compensation for executives It also
supports the general validity of the approach in Bakke et al (2015) in identifying firms most
affected by FAS123R notwithstanding the concerns outlined earlier
Our test of Eq (1) focuses on executive stock options For our dividend-protection hypothesis
it is important to establish that the level of implied option expense predicts a change in executive
stock options (rather than only a change in the use of non-executive employee stock options) as we
want to capture the effect of a change in executivesrsquo incentives on payout policy At the same
time our dilution channel hypothesis assumes a change in the use of all (executive and non-
executive employee) stock options Thus in untabulated analyses we repeat the test in Eq (1) by
replacing the dependent variable with the change in the number of options granted to all
employees (scaled by the total number of outstanding shares note for this analysis we can only
use data from 2004 to 2007 because Compustat began reporting data on ESO in 2004) The
coefficient on Accounting Impact and Treated continues to be negative and significant suggesting
that the differential reduction in the use of option compensation as a function of accounting impact
23
occurred for both executive and non-executive employee stock options Indeed Brown and Lee
(2011) report a similar decrease in executive and employee stock options around FAS123R
33 Option-Based Pay and Dividend Payouts
In this section we examine the effect of an exogenous (accounting-induced) change in option
compensation on dividend policy by estimating Equation (2)
Table 3 Panel A presents the results using the change in dividends from Pre to Post as
dependent variable We find no significant association between Accounting Impact (column 1 and
2) or Treated (column 3) and the change in dividends around the adoption of FAS123R This is in
stark contrast with the negative effect of option-based pay on dividends predicted in the literature
and documented in various association studies
One concern with this lack of effect is that perhaps our setting is not powerful enough to detect
it One way to examine this possibility is the following The coefficient on Accounting Impact
rank=4 in column 2 is 0001 and the standard error (SE) is 00009 Assuming the estimated
standard error is correct then for a two-tailed t test the coefficient needs to be greater than 00015
(=SE1645) or 015 to reach the 10 percent significant level In other words if moving from
the bottom to the top quartile (which predicts a 14 differential decline in option based pay as per
Table 2 Panel A) resulted in a 015 increase of the dividendasset ratio our test would be able to
detect a causal effect of option-based pay on dividends Given the unconditional mean of the
dividendasset ratio at 093 an increase of 015 from the Pre to the Post period seems
plausible In fact the average increase from the Pre to the Post period is 016 (Table 1 Panel C)
Thus if an effect was there our test should detect it
24
Panel B presents the results using a panel regression (5653 firm-year observations) with firm-
and year-fixed effects and interaction terms between Accounting Impact (or Treated) and an
indicator for the Post period Our inferences are unchanged
These analyses are based on our full sample which includes both dividend-paying and non-
dividend-paying firms Hence they implicity treat as equal two potentially different decisions to
initiate dividends and to increase dividends For example an increase in the dividend-to-asset
ratio from 05 to 06 will be treated the same as an increase from 00 to 01 even though
the latter represents a critical dividend initiation decision23 To address this following Chetty and
Saez (2005) we separately examine how FAS123R impacts the intensity of dividend changes (for
the subset of payers) and the likelihood of dividend initiations (for the subset of non-payers)
331 Option-Based Pay and Dividend Payouts Intensity of Dividend Changes
In the first row of Panel C we repeat the analysis in Panel A for the sub-sample of 572 payers
defined as firms with positive DPS in 2003 andor 2004 Note that we report only the coefficients
of interest for parsimony In the second row we replace the dependent variable with the
percentage change in DPS DPS is the choice variable for managers (Brav et al 2005 Baker and
Wurgler 2016) and thus our preferred measure to capture changes in dividend policy To account
for skewness in this variable (Khale 2002) in the third fourth and fifth rows we use indicator
variables to denote whether the change in DPS surpasses a threshold respectively 20 40 and
60 The proportion of firms that surpass these thresholds are 59 44 and 33 respectively24
23 Initiating dividends is a critical decision for boards given the pre-commitment value that investors attach to this
decision and the strong negative market reaction when firms eliminate or reduce dividends (Brav et al 2005) For
executives trying to maximize the value of their own stock options (dividend-protection argument) the ability to
influence a dividend initiation decision is likely lower than the ability to influence a dividend increase decision 24 Although in the third fourth and fifth rows our dependent variable is a binary variable we use a linear model (OLS)
instead of a probit or logit nonlinear model The reason is that estimating fixed effects in binary response models with
panel data can cause the incidental parameters problem The coefficient estimates can be biased when the panel data
25
Across all of these specifications we find no association between Accounting Impact or Treated
and the intensity of dividend changes Thus it does not appear that an exogenous reduction in
option-based pay caused dividend-paying firms to increase dividends
In Panel D we perform four robustness tests For parsimony we show only the coefficients of
interest and only the cases where the dependent variable is an indicator denoting a greater than
40 increase in DPS The results are similar for the other four ldquointensityrdquo dependent variables
reported in Panel C
In the first row we exclude firms that began to voluntarily expense options in 2003 or 2004
(84 firms of which 68 are dividend payers) FASB added accounting for stock-based
compensation to its agenda in March 2003 and issued an Exposure Draft proposing the expensing
of stock options at fair value in March 2004 In anticipation a number of firms began to
voluntarily expense stock options in 2003 and 2004 (Aboody et al 2004) If these firms reduced
option grants and as a result increased dividends during the Pre period then their inclusion may
reduce the power of our tests and thus our ability to detect the hypothesized relation25
In a similar spirit in the second row we exclude firms in the top decile in terms of reduction in
the ratio of option grants to total pay for the top 5 executives between 2002 (the year prior to the
Pre-period) and 2004 (the end of the Pre-period) This encompasses 113 firms of which 55 are
dividend payers If these firms reduced option grants in anticipation of FAS123R and as a result
increased dividends during the Pre period their inclusion may reduce our ability to detect the
hypothesized relation
has a large number of observations but a short time series Examples of studies making a similar choice are Puri
Rocholl and Steffen (2011) and Chu and Ma (2015) 25 This is unlikely to be a serious concern as previous studies suggest that voluntary expensers made limited use of
stock options (Aboody et al 2004) In fact in our sample 79 of these firms are in the bottom two quartiles of
implied option expense (untabulated) Nonetheless we present this test for robustness
26
In the third row we exclude firms that accelerated the vesting of options before FAS123R
became effective in order to avoid recognizing an expense for the unvested portion of these
options (Choudhary et al 2009 Balsam Reitenga and Yin 2008) This encompasses 196 firms of
which 54 are dividend payers If accelerating vesting was used to reduce the impact of FAS123R
the inclusion of these firms may reduce the power of our tests26
In the fourth row we deal with the concern that if firms target a fixed dividend to net income
ratio (Lintner 1956) and do so without adjusting for changes in accounting standards then by
decreasing net income (via option expense) the accounting change would mechanically cause a
reduction in dividends This would potentially offset and confound the increase predicted under
the dividend-protection and dilution hypotheses This seems unlikely for two reasons First firms
are notoriously reluctant to cut dividends (Brav et al 2005) Hence it seems unlikely that they
would reduce dividends in response to a decline in net income with no economic or cash flow
implications (ie re-classification of an expense from the footnotes to the income statement)
Second firms today set dividends in terms of dividend per share rather than by targeting a net
income-based payout ratio (Brav et al (2005)) As noted by Skinner (2008) over the last few
decades as earnings have become more variable the relation between earnings and dividends has
become weaker with dividend payments increasing smoothly and largely independent of the
variation in earnings Nevertheless in the fourth row we exclude the 66 dividend-paying firms that
26 These firms explicitly stated that they accelerated the vesting of stock options to avoid the accounting charge
(Choudhary et al 2009) In fact 72 are classified in the top two quartiles of implied option expense (untabulated)
Thus we would have predicted these firms to experience a significant decline in option pay To the extent that this
decline did not materialize because they minimized the impact of FAS123R by accelerating vesting the ability of
Accounting Impact to predict the reduction in option pay and thus its usefulness in examining changes in dividends
around FAS123R may be reduced The list of firms accelerating vesting was kindly provided by Jack Ciesielsky of
The Analystsrsquo Accounting Observer
27
had a similar payout ratio in 2003 and 2004 as a proxy for firms with a target net income-based
payout ratio in the Pre period27
As shown in Panel D even after excluding these subsets of firms we continue to find no
association between Accounting Impact or Treated and changes in dividends for dividend-paying
firms This is inconsistent with a causal influence of option compensation on dividend policy
Another concern is that by reducing net income and thus retained earnings FAS123R
may have pushed some firms closer to violating dividend covenants in debt contracts and
thus prevented them from increasing dividends This would bias our study against finding a
causal effect of option-based pay on dividends However this does not appear to be a
significant concern for three reasons First the recognition of an option expense does not
imply a decline in net income In fact more than 70 (75) of the full sample firms
(dividend payers) experienced an increase in net income before extraordinary items from
2004 to 2005 (the percentages are similar across the four quartiles of implied option
expense) Second dividend covenants are less common among dividend-paying firms
(Nikolaev 2010) Third most loan contracts in recent years give parties the option to
ldquofreezerdquo GAAP when facing a mandatory change in accounting principles (Christensen and
Nikolaev 2009) Firms expecting an adverse impact of FAS123R on their dividend covenants
would likely exercise this option (particularly given the non-cash nature of option-based
expense) Nonetheless to alleviate this concern we perform three additional analyses
(untabulated) (i) we repeat the tests in Panel C after excluding firms with a drop in net
income between 2004 and 2005 (ie firms that perhaps faced some covenant-related
27 We define a ldquosimilarrdquo payout to be an absolute change in payout ratio of less than 1 from 2003 to 2004 Among
these 66 firms only 39 continued to have a similar payout ratio in 2005 We also try an alternative definition where
a firm is classified as likely to be using a net income-based target payout ratio if the absolute percentage change in the
ratio from 2003 to 2004 is less than 10 (100 firms) Our inferences are unchanged
28
constrains to their payout policy as a result of FAS123R) (ii) we explicitly control for net
income and retained earnings in the regression (as in Skinner 2008) (iii) we repeat the tests
in Panel C for dividend payers with dividendsasset ratio above the sample median on the
basis that dividend covenants are less frequent among firms paying large dividends (Jung
Lee and Yang 2016) Our inferences are unchanged
332 Option-Based Pay and Dividend Payouts Dividend Initiations
In this section we examine whether the accounting-driven change in option pay affected
dividend initiations among non-payers We cannot employ the difference-in-difference approach
adopted so far by definition the same firm cannot initiate dividends in both periods However we
can provide suggestive evidence as follows First we take all firms that did not pay dividends in
2002 and group them into quartiles based on 2002 implied option expense For each quartile we
find the number of firms initiating dividends in 2003 and 2004 (the Pre period) Next we take all
firms that did not pay dividends in 2004 group them into quartiles based on 2002 implied option
expense and for each quartile find the number of firms initiating dividends in 2005 and 2006 (the
Post period) We do not include 2007 so as to have the same number of years in both periods and
make the cumulative initiation rates comparable
The left portion of Panel E reports the results of this exercise There is a general decrease in
the dividend initiation rate from the Pre to the Post period This holds both in the full sample of
non-payers (from 129 to 79) and across all quartiles This decrease may reflect a temporary
spike in 2003 and 2004 in response to the 2003 dividend tax cut documented in Chetty and Saez
(2005) It is noteworthy that initiation rates in both periods are lower among firms with higher
implied option expense This is consistent with option-heavy firms being mostly high-growth
firms less inclined to pay dividends More relevant to our research question if the lower use of
29
option compensation increased the propensity to pay dividends we would expect to see a relative
increase (ie a lower decrease) in dividend initiations among firms with the highest accounting
impact Instead the rate does not differ depending on the accounting impact There is
approximatley a 5 decline in initiation rate in each quartile In the right portion of Panel E we
examine similar data for dividend terminations While the results should be interpreted with
caution due to their rarity firms with higher accounting impact do not experience a greater decline
in termination rates Our inferences in Panel E are similar when we compared treated and control
firms following Bakke et al (2015) (untabulated)
Even after taking into account the different nature of decisions for dividend paying and non-
dividend-paying firms we fail to find evidence of a causal influence of option-based compensation
on dividend policy This finding is in contrast to the associations documented in earlier studies It
is even more remarkable as most firms replaced stock options with restricted stock which are
generally dividend-protected and should provide further incentive to increase dividends28
34 Option-Based Pay and Repurchases
In this section we examine the effect of an exogenous (accounting-induced) change in option
compensation on repurchases by estimating Equation (2)
Table 4 Panel A presents the results using the change in repurchases (scaled by total assets)
from Pre to Post as a dependent variable If the use of option-based pay had a positive effect on
firmsrsquo propensity to engage in repurchases as posited by the dividend-protection and dilution
hypotheses we should find a negative association between Accounting Impact or Treated and
repurchases Firms with a higher (accounting-driven) reduction in option-based pay should reduce
28 In a sample of SampP 500 firms between 2000 and 2009 Zhang (2013) reports that 80 of the firms granting
restricted stocks offer dividend protection In that sense the FAS123R-induced shift from stock options to restricted
stock may be characterized as a ldquoshockrdquo to dividend protection in unearned equity pay Accordingly our results cast
doubt on the causal interpretation of the positive association between dividend protection and dividend payouts
documented in prior studies (Zhang 2013 Burns et al 2015 Minnick and Rosenthal 2015)
30
the use of repurchases either because they are shifting toward a greater use of dividends andor
because they have a lower need to offset the dilutive effects of stock options However we find no
significant association between Accounting Impact (columns 1 and 2) and the change in
repurchases around the adoption of FAS123R When we use the Treated indicator (column 3) we
find a significant positive association rather than a negative one In Panel B we repeat the analysis
using net repurchases (ie repurchases after removing the effect of share issuances) following
Fama and French (2001) and Skinner (2008) Our inferences are unchanged29
This test is subject to two important caveats The first is we may not detect a decline in
repurchases because in the Post period firms need to offset the exercise of options that were
granted during the Pre period That is a post-FAS123R reduction in grants may not (yet) translate
into a reduction in exercises during the Post period which reduces our ability to test the dilution
hypothesis (ie that firms repurchase shares to offset exercises)30 However we can examine a
variation of this hypothesis where firms use repurchases to manage the effect of unexercised
options on diluted EPS (Bens et al 2003) To do so in Panel C we use a measure of adjusted
repurchases where we subtract our estimate of repurchases undertaken to offset the exercise of
ESO31 We effectively test whether firms experiencing an accounting-induced decrease in option
grants engage in less repurchases (net of exercise-driven repurchases) because their need to
manage the effect of unexercised options on diluted EPS is lower However the coefficient on
the variables of interest is either insignificant or positive inconsistent with the hypothesis
29 In the case of repurchases we do not examine separately ldquoinitiationsrdquo and ldquointensityrdquo as we do for dividends
because initiation is not clearly defined for repurchases Unlike dividends the occurrence of a repurchase in a given
year (or the lack thereof) cannot be used to infer a general policy due to the more discretionary nature of the timing of
repurchases 30 To capture the effect of lower option-based compensation on option exercises and thus on repurchases we would
ideally extend the Post period beyond 2007 However as noted by Floyd et al (2015) repurchases declined
dramatically after 2007 because of the financial crisis making it difficult to detect the effect of any other factor 31 As upper bound estimate of exercise-driven repurchases we multiply the number of ESO exercised during the year
times the average stock price during the year Since the number of ESO exercised is available in Compustat starting in
2004 Panel C is based on observations from 2004 to 2007
31
A second important caveat is that most firms replaced stock options with restricted stock
(Table 2 Panel C) Unvested restricted stock is excluded from the denominator in the computation
of basic EPS (once vested it is included) However it is included in the denominator of diluted
EPS using the treasury stock method similar to stock options Given the complexity of this
method without access to all details of restricted stock grants and option grants it is difficult to
determine whether the switch from stock options to restricted stock decreased the need for
dilution-driven repurchases as our test implicitly assumes Hence it is possible that we do not find
a decrease in repurchases because a reduced need to offset the dilutive effect of stock options was
neutralized by an increased need to offset the dilutive effect of restricted stock
Subject to the above caveats the evidence in Table 4 is not consistent with a positive causal
relation between the use of option-based pay and repurchases More precisely it suggests that
option-driven dilution concerns do not have a first-order effect on the magnitude of repurchases
even though they may play a role in the repurchase decision Hence our result is not necessarily
in conflict with the evidence in Brav et al (2005) where two-thirds of the surveyed financial
executives state that offsetting the dilutionary effect of stock option plans or other stock
programs is an important factor to their repurchase decisions
35 Option-Based Pay and Payout Composition
As an alternative to examining dividends and repurchases separately we also look at the
payout composition the change in the DividendsTotal Payout ratio from the Pre to the Post period
where Total Payout is the sum of dividends and repurchases As noted earlier we focus on the
subsample of firms with both dividends and repurchases in both Pre and Post periods so as to
capture the change in payout mix by firms routinely using both vehicles to return cash to
shareholders If the use of option-based pay causes firms to substitute repurchases for dividends
32
we should find a positive association between Accounting Impact or Treated and the payout mix
defined as DividendsTotal Payout ratio Firms with a higher accounting-driven reduction in
option-based pay should have an increase (decrease) in the relative weight of dividends
(repurchases) to the total payout However as reported in Table 5 Panel A we fail to find a
significant association between Accounting Impact (column 1 and 2) or Treated (column 3) and
the change in payout mix The results are similar when we use Net Payout (dividends plus net
repurchases) instead of Total Payout in computing the payout mix (Panel B)
Overall the combined evidence in Tables 3-5 does not support the hypothesis that option-
based compensation has negative (positive) effect on dividends (repurchases) or that it causes
firms to replace dividends with repurchases
4 Conclusion
Prior literature has documented robust associations between option-based compensation and
payout policy yet it remains unclear whether this association reflcts a causal influence We
investigate the causal effect of option-based compensation on payout policy using the adoption of
FAS123R which resulted in a significant decrease in option grants making it a plausible
exogenous shock to the use of option-based pay To overcome the challenge of no control group
we exploit the fact that firms responded differently depending on the firm-specific accounting
impact as measured by the implied option expense disclosed in the footnotes prior to FAS123R
Firms with larger expected accounting impact curtailed option-based compensation much more
aggressively than firms with lower impact Using a sample of SampP 1500 firms we find no
evidence that firms with a larger accounting-induced decline in option compensation increased
dividends reduced repurchases or changed their payout composition contrary to the widely held
belief that option-based pay has a causal influence on payout policy
33
Appendix Variable Definitions and Data Sources
Accounting Impact Variables
Accounting impact Implied option expense (Compustat XINTOPT) divided by total assets
(Compustat AT) This variable is measured at fiscal year 2002 and is time-invariant
Accounting impact rank The quartile rank of Accounting impact (1=lowest 4=highest)
Payout Variables
Regular dividendTotal assets The numerator is total regular cash dividends in the fiscal year
from the distribution dataset in CRSP Regular cash dividends are identified by the distribution
codes 1212 1222 1232 or 1242 The denominator is one-year lagged total assets (Compustat
AT)
DPS Dividend per share (Compustat DVPSX_F)
DPS pct change The percentage change of average DPS from Pre- to Post-FAS123R period
DPS pct change gtX indicator A dummy variable that equals one if DPC pct change is greater
than X and zero otherwise
RepurchaseTotal assets The numerator is the repurchase of common equity which equals total
repurchase (Compustat PRSTK) minus the change in preferred stock redemption value
(Compustat PSTKRV) The denominator is one-year lagged total assets (Compustat AT)
Net repurchaseTotal assets Net repurchase removes the effect of share issuances The
construction follows Fama and French (2001) and Skinner (2008) if the firm uses the treasury
stock method for repurchase net repurchase equals the increase in common treasury stock
(Compustat TSTKC) if the firm uses the retirement method (when common treasury stock is zero
in the current and prior year) net repurchase equals total repurchases minus stock issuance
(Compustat SSTK) and change in preferred stock redemption value (Compustat PSTKRV)
When the above measures give negative value net repurchase is set to zero
Adjusted repurchaseTotal assets Adjusted repurchase removes from total repurchase the potential
effect of repurchasing exercised options This variable equals total repurchase of common stocks
minus the product between the number of options exercised (Compustat OPTEXD) and average
stock price during the year When the above measure gives negative value adjusted repurchase is
set to zero Since the number of options exercised is not available before 2003 we drop
observations in 2003 when we use this variable
34
Total payoutTotal assets the sum of Regular dividendTotal assets and RepurchaseTotal assets
Regular dividendTotal payout regular cash dividend divided by the sum of regular cash dividend
and repurchase from common equity In the two-period analysis (Pre- vs Post-FAS123R) we
separately sum the numerator and the denominator for each firm-period and then calculate the ratio
Regular dividendNet payout regular dividend divided by the sum of regular dividend and net
repurchase In the two-period analysis (Pre- vs Post-FAS123R) we separately sum the numerator
and the denominator for each firm-period and then calculate the ratio
Compensation Variables
Salary_$ Average salary (Execucomp SALARY) of the top 5 highest paid executives in $1000
Salary_ Average salary (Execucomp SALARY) divided by average total pay (Execucomp
TDC1) of the top 5 highest paid executives
Bonus_$ Average bonus (Execucomp BONUS) of the top 5 highest paid executives in $1000
Due to a data format change we add non-equity plan-based awards (Execucomp
NON_EQ_TARG) to this measure after 2006
Bonus_ Bonus_$ divided by average total pay (Execucomp TDC1) of the top 5 highest paid
executives
Option grant_$ Average option grant value (Execucomp OPTION_AWARDS_BLK_VALUE or
OPTION_AWARDS_FV) of the top 5 highest paid executives in $1000 Due to a data format
change we use OPTION_AWARDS_FV for this measure after 2006
Option grant_ Option grant_$ divided by average total pay (Execucomp TDC1) of the top 5
highest paid executives
Restricted stock grant_$ Average restricted stock grant value (Execucomp RSTKGRNT or
STOCK_AWARDS_FV) of the top 5 highest paid executives in $1000 Due to data format
change we use STOCK_AWARDS_FV for this measure after 2006
Restricted stock grant_ Restricted stock grant_$ divided by average total pay (Execucomp
TDC1) of the top 5 highest paid executives
Total pay_$ Average total pay (Execucomp TDC1) of the top 5 highest paid executives in $1000
35
Other Characteristics
Size The book value of total assets (Compustat AT) minus the book value of common equity
(Compustat CEQ) plus the market value of common equity from CRSP in $M
Log(size) the natural logarithm of size
Book-to-market the book value of common equity dividend by its market value
Leverage long term debt plus short term debt (Compustat DLTT + DLC) divided by total assets
Asset tangibility tangible assets (Compustat AT - INTAN) divided by total assets
Free cash flow Operating cash flow (Compustat OANCF) minus capital expenditure (Compustat
CAPX) then divided by lagged total assets
Cash holding Cash and short-term investments (Compustat CHE) divided by total assets
ROA volatility the standard deviation of returns on assets (operating income before tax divided by
lagged total assets) in the past five fiscal years
Institutional ownership the number of shares held by institutional investors divided by the number
of shares outstanding from Thomson Reuters Institutional Holdings database
Sales growth the growth rate of sales (Compustat SALE) from the prior year
Past stock return annual stock return from the prior year
Loss indicator a dummy variable taking value of one if the current net income is negative and
zero otherwise
36
References
Aboody David 1996 Market Valuation of Employee Stock Options Journal of Accounting and
Economics 22 357-391
Aboody David Barth Mary E and Ron Kasznik 2004 Firms Voluntary Recognition of Stock-
Based Compensation Expense Journal of Accounting Research 42 123ndash150
Aboody David and Ron Kasznik 2008 Executive stock-based compensation and firmsrsquo cash
payout the role of shareholdersrsquo tax-related payout preferences Review of Accounting Studies
13 216ndash251
Anantharaman Divya and Yong Gyu Lee 2014 Managerial risk taking incentives and corporate
pension policy Journal of Financial Economics 111 328ndash351
Baker Malcolm and Jeffrey Wurgler 2004 A catering theory of dividends Journal of Finance
59 1125-1165
Baker Malcolm and Jeffrey Wurgler 2016 Dividends as reference points a behavioral signaling
approach Review of Financial Studies 29 697-738
Bakke Tor-Erik Hamed Mahmudi Chitru Fernando and Jesus Salas 2015 The causal effect of
option pay on corporate risk management Journal of Financial Economics forthcoming
Balsam Steven Austin Reitenga and Jennifer Yin 2008 Option acceleration in response to SFAS
No 123 (R) Accounting Horizons 22 23-45
Bens Daniel and Steven Monahan 2008 Altering Investment Decisions to Manage Financial
Reporting Outcomes Asset-Backed Commercial Paper Conduits and FIN 46 Journal of
Accounting Research 46 1017-1055
Bens Daniel A Venky Nagar Douglas J Skinner and MH Franco Wong 2003 Employee stock
options eps dilution and stock repurchases Journal of Accounting and Economics 36 51ndash90
Bertrand Marianne Esther Duflo and Sendhil Mullainathan 2004 How much should we trust
differences-in-differences estimates The Quarterly Journal of Economics 119 249ndash275
Blouin Jennifer L Jana S Raedy and Douglas A Shackelford 2011 Dividends Share
Repurchases and Tax Clienteles Evidence from the 2003 Reductions in Shareholder Taxes
The Accounting Review 86 887-914
Brav Alon John R Graham Campbell R Harvey and Roni Michaely 2005 Payout policy in the
21st century Journal of Financial Economics 77 483ndash527
Brown Lawrence D and Yen-Jung Lee 2011 Changes in Option-Based Compensation Around
the Issuance of SFAS123R Journal of Business Finance amp Accounting 38 1053ndash109
37
Brown Jeffrey R Nellie Liang and Scott Weisbenner 2007 Executive financial incentives and
payout policy Firm responses to the 2003 dividend tax cut Journal of Finance 62 1935ndash
1965
Burns Natasha Brian McTier and Kristina Minnick 2015 Equity-incentive compensation and
payout policy in Europe Journal of Corporate Finance 30 85-97
Carter Mary Ellen and Luann J Lynch 2003 The Consequences of the FASBrsquos 1998 Proposal on
Accounting for Stock Option Repricing Journal of Accounting and Economics 35 51-72
Carter Mary Ellen Luann J Lynch and Irem Tuna 2007 The role of accounting in the design of
CEO equity compensation The Accounting Review 82 327ndash357
Chava Sudheer and Amiyatosh Purnanandam 2010 CEOs versus CFOs Incentives and
corporate policies Journal of Financial Economics 97 263ndash278
Chetty Raj and Emmanuel Saez 2005 Dividend taxes and corporate behavior Evidence from the
2003 dividend tax cut The Quarterly Journal of Economics 120 791ndash833
Choudhary Preeti Shivaram Rajgopal and Mohan Venkatachalam 2009 Accelerated vesting of
employee stock options in anticipation of FAS123R Journal of Accounting Research 47 105ndash
146
Christensen Hans B and Valeri Nikolaev 2009 Contracting on Mandatory Changes to GAAP
New Practice and Its Determinants Working Paper University of Chicago
Chu Yongqiang and Tao Ma 2015 How does management compensation affect bank risk taking
evidence from FAS 123R University of South Carolina Working Paper
Cuny Charles J Gerald S Martin and John J Puthenpurackal 2009 Stock options and total
payout Journal of Financial and Quantitative Analysis 44 391ndash410
DeAngelo Harry Linda DeAngelo and Douglas J Skinner 2000 Special Dividends and the
Evolution of Dividend Signaling Journal of Financial Economics 57 309-354
Dechow Patricia M Amy P Hutton and Richard G Sloan 1996 Economic consequences of
accounting for stock-based compensation Journal of Accounting Research 34 1ndash20
Edgerton J 2013 Four facts about dividend payouts and the 2003 tax cut International Tax and
Public Finance 20 769-784
Edmans Alex and Xavier Gabaix 2015 Executive compensation a modern primer Journal of
Economic Literature forthcoming
38
Fama Eugene F and Kenneth R French 2001 Disappearing dividends changing firm
characteristics or lower propensity to pay Journal of Financial Economics 60 3ndash43
Farre-Mensa Joan Roni Michaely and Martin C Schmalz 2014 Payout policy Annual Review
of Financial Economics 6 75ndash134
Fenn George W and Nellie Liang 2001 Corporate payout policy and managerial stock
incentives Journal of Financial Economics 60 45ndash72
Ferri Fabrizio and Tatiana Sandino 2009 The impact of shareholder activism on financial
reporting and compensation the case of employee stock options expensing The Accounting
Review 84 433ndash466
Floyd Eric Nan Li and Douglas J Skinner 2015 Payout policy through the financial crisis the
growth of repurchases and the resilience of dividends Journal of Financial Economics 118
299-316
Frydman Carola and Dirk Jenter 2010 CEO compensation Annual Review of Financial
Economics 2 75-102
Gipper Brandon 2015 Assessing the Effects of Disclosing Management Compensation Working
Paper University of Chicago
Gormley Todd David Matsa and Todd Milbourn 2013 CEO compensation and corporate risk
evidence from a natural experiment Journal of Accounting and Economics 56 79-101
Graham John Michelle Hanlon and Terry Shevlin 2011 Real effects of accounting rules
evidence from multinational firmsrsquo investment locations and profit repatriation decisions
Journal of Accounting Research 49 137-185
Graham John Campbell Harvey and Shiva Rajgopal 2005 The Economic implications of
corporate financial reporting Journal of Accounting and Economics 40 3-73
Greenspan Alan 2002 Testimony of Alan Greenspan before the Committee on Banking
Housing and Urban Affairs US Senate July 16 Washington DC Government Printing
Office
Grullon Gustavo and Roni Michaely 2002 Dividends Share Repurchases and the Substitution
Hypothesis Journal of Finance 57 1649-1684
Hail Luzi Ahmed Tahoun and Clare Wang 2014 Dividend Payouts and Information Shocks
Journal of Accounting Research 52 403-456
Hall Brian J and Kevin J Murphy 2002 Stock options for undiversified executives Journal of
Accounting amp Economics 33 3-42
39
Hall Brian J and Kevin J Murphy 2003 The trouble with stock options Journal of Economic
Perspectives 17 49ndash70
Hanlon Michelle and Jeffrey L Hoopes 2014 What do firms do when dividend tax rates change
An examination of alternative payout responses Journal of Financial Economics 114 105-
124
Hayes Rachel M Michael Lemmon and Mingming Qiu 2012 Stock options and managerial
incentives for risk taking Evidence from FAS123R Journal of Financial Economics 105
174ndash190
Heron Randall A Erik Lie 2007 Does backdating explain the stock price pattern around
executive stock option grants Journal of Financial Economics 83 271-295
Hribar Paul Nicole Thorne Jenkins and W Bruce Johnson 2006 Stock repurchases as an
earnings management device Journal of Accounting and Economics 41 3ndash27
Jensen Michael C 1986 Agency cost of free cash flow corporate finance and takeovers
American Economic Review 76 323-329
Jolls Christine 1998 Stock repurchases and incentive compensation NBER Working Paper No
w6467
Jung Boochun Woo-Jong Lee and Yanhua Sunny Yang 2016 The Impact of Dividend
Covenants on Investment and Operating Performance Journal of Business Finance amp
Accounting 43 414ndash447
Kahle Kathleen M 2002 When a buyback isnrsquot a buyback open market repurchases and
employee options Journal of Financial Economics 63 235ndash261
Lambert Richard A William N Lanen and David F Larcker 1989 Executive stock option plans
and corporate dividend policy Journal of Financial and Quantitative Analysis 24 409ndash425
Lintner John 1956 Distribution of incomes of corporations among dividends retained earnings
and taxes The American Economic Review 46 97-113
Low Angie 2009 Managerial risk-taking behavior and equity-based compensation Journal of
Financial Economics 92 470-490
Miller Merton H and Franco Modigliani 1961 Dividend policy growth and the valuation of
shares The Journal of Business 34 411ndash433
Minnick Kristina and Leonard Rosenthal 2015 Stealth compensation Do CEOs increase their
pay by influencing dividend policy Journal of Corporate Finance 25 435-454
40
Murphy Kevin J 1999 Executive compensation In O Ashenfelter and D Card (eds) North
Holland Handbook of Labor Economics Amsterdam Elsevier Science BV
Murphy Kevin J 2013 Executive compensation Where we are and how we got there Handbook
of the Economics of Finance Elsevier Science North Holland 211-356
Nikolaev Valeri 2010 Debt Covenants and Accounting Conservatism Journal of Accounting
Research 48 143-176
Puri Manju Joumlrg Rocholl and Sascha Steffen 2011 Global retail lending in the aftermath of the
US financial crisis Distinguishing between supply and demand effects Journal of Financial
Economics 100 556-578
Shue Kelly and Richard R Townsend 2014 Swinging for the fences Executive reactions to
quasi-random option grants Working Paper University of Chicago
Skinner Douglas J 2008 The evolving relation between earnings dividends and stock
repurchases Journal of Financial Economics 87 582-609
Weisbenner Scott J 2000 Corporate share repurchases in the 1990s What role do stock options
play FEDS Working Paper No 2000-29
Zhang Dan 2013 CEO dividend protection Working Paper BI Norwegian Business School
41
Figure 1 Trends of dividends and repurchases from 2003 to 2007 Panel A plots the average
Regular DividendTotal Assets of firms in the highest and lowest quartiles of Accounting Impact
measured in 2002 Panel B shows the average Total RepurchaseTotal Assets of firms in the
highest and lowest quartiles of Accounting Impact measured in 2002
Panel A Trends of regular dividends
Panel B Trends of total repurchases
00
05
10
15
20
2003 2004 2005 2006 2007
Regular DividendTotal Assets
Lowest Acc Impact
Highest Acc Impact
Pre Post
00
20
40
60
80
100
2003 2004 2005 2006 2007
Total Repurchase Total Assets
Lowest Acc Impact
Highest Acc Impact
Pre Post
42
Table 1
Summary Statistics
Panel A Firm characteristics - full sample
N Mean Std dev 25 pctl Median 75 pctl
Accounting impact (2002) 1176 173 366 022 052 163
Payout variablesRegular dividendTotal assets 5653 093 148 000 000 142
RepurchaseTotal assets 5653 394 710 000 035 500
Total payoutTotal assets 5653 488 748 000 175 666
Regular dividendTotal payout 4091 3874 4057 000 2237 8833
Level of executive compensation (in $1000)
Salary_$ 5653 450 190 314 409 544
Bonus_$ 5653 476 616 122 295 586
Option grant_$ 5653 791 1137 62 384 1002
Restricted stock grant_$ 5653 458 866 0 58 518
Total pay_$ 5653 2481 2475 890 1647 3074
Percentage of executive compensation
Salary_ 5653 296 183 165 251 382
Bonus_ 5653 197 148 97 177 268
Option grant_ 5653 283 235 67 256 445
Restricted stock grant_ 5653 141 180 00 41 249
Control variables
Size ($M) 5653 11086 27294 1017 2459 8117
Log(size) 5653 7985 1565 6925 7808 9002
Book-to-market 5653 0445 0287 0251 0388 0578
Leverage 5653 0202 0172 0038 0187 0309
Asset tangibility 5653 0806 0184 0691 0853 0965
Free cash flow 5653 0059 0091 0013 0059 0108
Cash holding 5653 0166 0172 0034 0100 0247
ROA volatility 5653 0056 0056 0021 0038 0070
Institutional ownership 5653 0753 0202 0639 0795 0910
Sales growth 5653 0121 0189 0028 0096 0183
Past stock return 5653 0094 0183 -0012 0094 0199
Loss indicator 5653 0164 0370 0000 0000 0000
This table presents summary statistics Panel A shows the descriptive statistics of payout variables compensation
variables and other firm characteristics for the full sample Accounting impact is the implied option expense
measured at fiscal year 2002 All other variables are measured at firm-year level from fiscal year 2003 to 2007
resulting in 5653 firm-year observations (except for Regular dividendTotal Payout which can be measured only
for the 4901 firm-year observations with Total payout greater than zero) Panel B shows the pairwise correlations
between main variables at firm-year level Panel C compares payout variables compensation variables and other
firm characteristics before and after FAS123R The Pre-FAS123R period consists of fiscal year 2003 and 2004
the Post-FAS123R period covers fiscal year 2005-2007 Panel D compares the trends of payout and compensation
variables around FAS123R across four quartile groups ranked by 2002 accounting impact Panel E compares the
trends of payout and compensation variables around FAS123R between the treated and control group under the
alternative treatment definition in Bakke et al (2015) (see Section 22) All variables are defined in Appendix The
notation and in Panel C indicates statistically significant at 10 5 and 1 level in T-tests for equal
means respectively
43
Pa
nel
B
Pea
rso
n c
orr
ela
tio
ns
Reg div
Repurchase
Total payout
Salary_
Bonus_
Option_
RS_
Log(size)
BM
Leverage
Tangibility
FCF
Cash holdingROA vol
Inst own
Sales growth
Past ret
urn
Loss
Reg
div
10
0
Repurc
hase
01
610
0
Tota
l payout
03
509
810
0
Sala
ry_
-0
10
-01
8-0
19
10
0
Bonus_
00
700
100
3-0
01
10
0
Option_
-0
10
00
900
6-0
41
-03
510
0
RS
_
01
000
901
0-0
32
-01
1-0
40
10
0
Log(s
ize)
03
101
802
3-0
56
01
101
202
210
0
BM
-02
1-0
28
-03
103
0-0
03
-02
000
0-0
33
10
0
Levera
ge
-00
1-0
08
-00
8-0
05
00
6-0
11
00
801
9-0
03
10
0
Tangib
ility
00
200
100
101
200
1-0
05
-00
6-0
12
-00
4-0
18
10
0
FC
F02
203
703
9-0
20
00
901
1-0
01
02
4-0
32
-02
1-0
16
10
0
Cash
hold
ing
-01
301
000
700
2-0
14
02
2-0
10
-02
3-0
16
-03
502
901
210
0
RO
A v
ol
-01
5-0
04
-00
700
4-0
11
01
9-0
11
-02
3-0
08
-01
101
2-0
02
03
910
0
Inst
ow
n
-00
901
401
1-0
17
00
200
701
200
7-0
01
00
3-0
08
01
4-0
06
-01
110
0
Sale
s gro
wth
-00
8-0
04
-00
6-0
15
00
501
0-0
02
00
7-0
16
-00
3-0
08
01
300
201
400
410
0
Past
retu
rn00
901
301
4-0
18
01
5-0
01
00
301
6-0
29
-01
000
102
7-0
14
-01
001
602
710
0
Loss
-02
0-0
19
-02
201
8-0
18
00
4-0
05
-02
601
901
300
6-0
41
01
702
3-0
16
-01
8-0
40
10
0
44
Panel C Firm characteristics - before and after FAS123R
Pre FAS 123R Post FAS 123R Difference
Payout variables
Regular dividendTotal assets 083 099 016
RepurchaseTotal assets 245 490 245
Total payoutTotal assets 328 589 261
Regular dividendTotal payout 3914 2790 -1124
Level of executive compensation (in $1000)
Salary_$ 426 463 37
Bonus_$ 418 505 87
Option grant_$ 896 707 -191
Restricted stock grant_$ 269 574 305
Total pay_$ 2263 2584 321
Percentage of executive compensation
Salary_ 305 293 -12
Bonus_ 186 204 18
Option grant_ 343 240 -103
Restricted stock grant_ 87 176 89
Control variables
Size ($M) 9671 11631 1960
Log(size) 7860 8035 0175
Book-to-market 0437 0453 0016
Leverage 0201 0203 0002
Asset tangibility 0822 0793 -0029
Free cash flow 0061 0057 -0004
Cash holding 0175 0159 -0016
ROA volatility 0067 0048 -0019
Institutional ownership 0712 0781 0069
Sales growth 0137 0108 -0029
Past stock return 0080 0101 0021
Loss indicator 0173 0159 -0014
45
Pa
nel
D
Fir
m c
ha
racte
rist
ics
by q
ua
rtil
e o
f a
cco
un
tin
g i
mp
act
- b
efo
re a
nd
aft
er
FA
S1
23
R
Accounting im
pact
(2002)
Num
ber
of
Fir
ms
Pre
Post
Pre
Post
Pre
Post
Pre
Post
Payout
vari
able
s
Regula
r div
idendT
ota
l ass
ets
11
2
12
4
09
4
11
1
09
5
11
3
03
0
04
9
Repurc
hase
Tota
l ass
ets
11
3
26
8
19
2
37
3
32
7
63
1
35
1
68
7
Tota
l payout
Tota
l ass
ets
22
4
39
1
28
5
48
4
42
2
74
4
38
1
73
6
Regula
r div
idendT
ota
l payout
643
7
469
8
474
0
341
1
284
5
195
4
82
5
74
5
Perc
enta
ge o
f executive c
om
pensa
tion
Sala
ry_
337
295
313
287
296
289
276
300
Bonus_
223
226
214
228
172
192
134
169
Option g
rant_
201
167
290
210
373
260
507
325
Rest
ricte
d s
tock g
rant_
116
194
98
180
89
176
43
155
294
294
294
294
1st Q
uart
ile2
nd Q
uart
ile3
rd Q
uart
ile4
th Q
uart
ile
01
2
03
5
09
3
55
1
46
Accounting impact
Number of Firms
By accounting impact quartile
1
2
3
4
Pre Post Pre Post
Payout variables
Regular dividendTotal assets 09 11 08 10
RepurchaseTotal assets 18 31 26 52
Total payoutTotal assets 28 43 34 62
Regular dividendTotal payout 428 357 386 265
Percentage of executive compensation
Salary_ 435 364 282 280
Bonus_ 226 214 179 202
Option grant_ 92 125 387 261
Restricted stock grant_ 125 188 80 174
Percentage of CEO compensation
Salary_(CEO) 485 364 260 259
Bonus_(CEO) 249 228 185 219
Option grant_(CEO) 10 127 406 275
Restricted stock grant_(CEO) 128 182 82 183
Panel E Firm characteristics by alternative treatment definition - before and
after FAS123R
Treated
25
19
997
223
250
256
268
10
177
71
Control
44
37
47
Table 2
Differential effect of FAS123R on the use of option-based compensation
Panel A Two-period first-difference regression
Prediction Coeff t-stat Coeff t-stat Coeff t-stat
Accounting impact rank - -0044 -628
Accounting impact rank=2 - -0044 -327
Accounting impact rank=3 - -0075 -468
Accounting impact rank=4 - -0140 -613
Treated - -0132 -875
ΔLog(size) 0061 202 0061 200 0063 214
ΔBook-to-market 0032 091 0032 092 0051 143
ΔLeverage -0157 -213 -0160 -218 -0111 -153
ΔAsset tangibility -0012 -014 -0020 -023 -0023 -026
ΔFree cash flow -0106 -095 -0108 -097 -0128 -117
ΔCash holding -0197 -211 -0193 -206 -0180 -194
ΔFive-year ROA volatility -0065 -031 -0056 -026 -0098 -047
ΔInstitutional ownership -0044 -091 -0043 -088 -0044 -092
ΔSales growth -0064 -102 -0065 -104 -0090 -153
ΔPast one-year stock return 0051 078 0052 080 0091 138
ΔLoss frequency 0056 207 0057 207 0047 179
Log(size) -0009 -210 -0009 -207 -0002 -035
Book-to-market -0015 -056 -0013 -049 0018 072
Leverage 0022 046 0023 048 0068 150
Asset tangibility 0033 077 0033 078 0053 128
Free cash flow 0227 202 0220 195 0127 117
Cash holding -0002 -004 0012 019 -0078 -141
Five-year ROA volatility -0451 -240 -0430 -228 -0509 -283
Institutional ownership -0123 -360 -0122 -359 -0100 -292
Sales growth -0041 -056 -0040 -055 -0089 -125
Past one-year stock return -0009 -015 -0006 -010 0078 125
Loss frequency 0055 174 0056 178 0054 173
Fixed effect
Standard error
Adj R-squared
Observations
Model (3)
Dependent variable ΔAvg Option grantTotal pay
Huber-White
0156
This table investigates whether the effect of FAS123R on the use of option-based pay varies with its potential accounting impact Panel A
reports the results of estimating three two-period first-differencing models where for each firm we average its characteristics in Pre- and
Post-FAS123R period The Pre-FAS123R period consists of fiscal year 2003 and 2004 the Post-FAS123R period covers fiscal year 2005-
2007 In all three specifications the dependent variable is the change of average Option grantTotal pay from Pre- to Post-FAS123R period
The main independent variable varies by model in Model (1) the Accounting impact rank is the quartile rank of implied option expensetotal
assets measured in 2002 (1=lowest 4=highest) In Model (2) Accounting impact rank=2 (3 4) is an indicator that takes value of one if the
firmrsquos Accounting impact rank equals 2 (3 4) In Model (3) we use an alternative treatment construction following Bakke et al (2015)
where Treated is an indicator that takes value of zero if the firm granted zero option to its CEO in both 2003 and 2004 or the firm began to
voluntarily expense option-based pay at fair value in 2002 or earlier and one otherwise For each control variable we include both its level in
the Pre-FAS123R period and its change across the two periods Panel B shows the results of estimating fixed effect models with firm-year
observations The dependent variable is the firm-year level Option grantTotal pay The main independent variables are the interactions of
Post-FAS123R indicator (Post) with Accounting Impact rank Accounting impact rank indicators and Treated respectively All models in
Penal A have industry fixed effects and the standard errors are Huber-White heteroscedasticity-consistent standard errors All models in
Penal B have firm fixed effects and year fixed effects and the standard errors are clustered at firm level All variables are defined in
Appendix The notation and indicates statistically significant at 10 5 and 1 level respectively
Model (1) Model (2)
11711171 1171
Industry Industry
Huber-White
0124
Huber-White
0123
Industry
48
Panel B Panel fixed effects regression
Prediction Coeff t-stat Coeff t-stat Coeff t-stat
Acc impact rank x Post - -0044 -807
Acc impact rank 2 x Post - -0046 -333
Acc impact rank 3 x Post - -0077 -526
Acc impact rank 4 x Post - -0137 -776
Treated x Post - -0145 -970
Log(size) 0034 221 0034 217 0036 229
Book-to-market 0018 084 0017 083 0015 070
Leverage -0004 -009 -0006 -013 -0007 -015
Asset tangibility 0007 012 0004 006 0011 018
Free cash flow -0074 -151 -0072 -146 -0078 -158
Cash holding -0048 -086 -0050 -090 -0006 -011
Five-year ROA volatility 0250 231 0239 219 0437 414
Institutional ownership 0043 159 0044 161 0041 150
Sales growth -0033 -168 -0034 -171 -0031 -158
Past one-year stock return 0067 221 0068 224 0063 204
Loss indicator 0023 209 0022 207 0024 222
Fixed effects
Standard error
Adj R-squared
Observations
Dependent variable Option grantTotal pay
5653 5653 5653
Clustered by firm
Firm Year
Clustered by firm
Firm Year
Clustered by firm
0523 0523 0526
Model (1) Model (2) Model (3)
Firm Year
49
Table 3
Effect of option-based compensation on dividend policy
Panel A Two-period first-difference regression
Prediction Coeff t-stat Coeff t-stat Coeff t-stat
Accounting impact rank + 0000 077
Accounting impact rank=2 + 0001 091
Accounting impact rank=3 + 0000 044
Accounting impact rank=4 + 0001 092
Treated + 0000 -026
ΔLog(size) 0000 -030 0000 -030 0000 -026
ΔBook-to-market -0002 -190 -0002 -193 -0002 -195
ΔLeverage -0002 -059 -0002 -057 -0002 -059
ΔAsset tangibility 0016 431 0016 429 0016 430
ΔFree cash flow 0017 373 0017 373 0017 375
ΔCash holding -0011 -288 -0011 -285 -0010 -282
ΔFive-year ROA volatility 0003 034 0002 032 0003 035
ΔInstitutional ownership -0002 -073 -0002 -073 -0002 -070
ΔSales growth -0001 -040 -0001 -037 -0001 -038
ΔPast one-year stock return 0002 077 0002 076 0002 070
ΔLoss frequency 0000 -048 0000 -045 0000 -046
Log(size) 0000 183 0000 182 0000 182
Book-to-market -0002 -227 -0002 -225 -0002 -284
Leverage -0001 -037 -0001 -039 -0001 -048
Asset tangibility 0003 179 0003 180 0003 176
Free cash flow 0017 291 0017 291 0017 300
Cash holding 0002 080 0002 077 0002 098
Five-year ROA volatility 0003 035 0002 033 0003 044
Institutional ownership -0001 -068 -0001 -068 -0001 -058
Sales growth -0004 -177 -0004 -175 -0004 -172
Past one-year stock return 0004 169 0004 167 0004 165
Loss frequency -0001 -111 -0001 -109 -0001 -102
Fixed effect
Standard error
Adj R-squared
Observations
Dependent variable ΔAvg Regular dividendTotal assets
This table investigates the causal effect of option-based pay on dividend policy by examining whether changes in dividend policy around
FAS123R vary with its potential accounting impact Panel A reports the results of estimating three two-period first-differencing models
where for each firm we average its characteristics in Pre- and Post-FAS123R period In all three specifications the dependent variable is
the change of average Regular dividendTotal assets from Pre- to Post-FAS123R period The main independent variable varies by model in
Model (1) the Accounting impact rank is the quartile rank of implied option expensetotal assets measured in 2002 (1=lowest 4=highest) In
Model (2) Accounting impact rank=2 (3 4) is an indicator that takes value of one if the firmrsquos Accounting impact rank equals 2 (3 4) In
Model (3) we use an alternative treatment construction following Bakke et al (2015) where Treated is an indicator that takes value of zero
if the firm granted zero option to its CEO in both 2003 and 2004 or the firm began to voluntarily expense option-based pay at fair value in
2002 or earlier and one otherwise For each control variable we include both its level in the Pre-FAS123R period and its change across the
two periods Panel B shows the results of estimating fixed effect models with firm-year observations The dependent variable is the firm-
year level Regular dividendTotal assets The main independent variables are the interactions of Post-FAS123R indicator (Post) with
Accounting Impact rank Accounting impact rank indicators and Treated respectively Panel C examines the intensity of dividend changes
among firms with nonzero dividend per share in 2003 or 2004 In particular we estimates the same three models as in Panel A(with the
same independent variables) but for five dependent variables the change of average Regular dividendTotal assets from Pre- to Post-
FAS123R period (as in Panel A) the percentage change of DPS (dividend per share) from Pre- to Post-FAS123R period and three
indicators denoting respectively whether the percentage change of DPS was greater than 20 40 and 60 Panel D reports four
robustness tests of the dividend intensity regression In each of them a set of possible confounding observations is removed (see Section 33
for details) Panel E compares the trends of dividend initiation and termination around FAS123R across four quartile groups ranked by
accounting impact All models in Panel A C and D have industry fixed effects and the standard errors are Huber-White heteroscedasticity-
consistent standard errors All models in Penal B have firm fixed effects and year fixed effects and the standard errors are clustered at
firm level All variables are defined in Appendix The notation and indicates statistically significant at 10 5 and 1 level
Industry Industry Industry
Model (1) Model (2) Model (3)
1171 1171 1171
Huber-White Huber-White Huber-White
0105 0104 0105
50
Panel B Panel fixed effects regression
Prediction Coeff t-stat Coeff t-stat Coeff t-stat
Acc impact rank x Post + 0000 122
Acc impact rank 2 x Post + 0001 110
Acc impact rank 3 x Post + 0001 094
Acc impact rank 4 x Post + 0001 129
Treated x Post + 0000 -012
Log(size) 0001 179 0001 179 0001 181
Book-to-market 0000 025 0000 024 0000 031
Leverage 0001 062 0001 064 0001 069
Asset tangibility 0009 360 0009 358 0009 363
Free cash flow 0002 090 0002 093 0002 092
Cash holding -0007 -295 -0007 -298 -0007 -298
Five-year ROA volatility 0001 041 0001 038 0000 -006
Institutional ownership 0000 -027 0000 -026 0000 -027
Sales growth 0000 053 0000 051 0000 044
Past one-year stock return 0001 089 0001 088 0001 078
Loss indicator 0000 -060 0000 -057 0000 -076
Fixed effects
Standard error
Adj R-squared
Observations
Dependent variable Regular dividendTotal assets
Model (1) Model (2) Model (3)
Firm Year Firm Year Firm Year
5653 5653 5653
Clustered by firm Clustered by firm Clustered by firm
0877 0877 0877
51
Panel C Intensity of dividend changes around FAS123R
Prediction Coeff t-stat Coeff t-stat Coeff t-stat
Accounting impact rank + 0000 065
Accounting impact rank=2 + 0000 048
Accounting impact rank=3 + 0000 026
Accounting impact rank=4 + 0002 080
Treated + 0001 063
Dependent var DPS pct change
Accounting impact rank + -0145 -072
Accounting impact rank=2 + 0018 006
Accounting impact rank=3 + -0177 -045
Accounting impact rank=4 + -0746 -100
Treated + -0407 -119
Accounting impact rank + 0029 095
Accounting impact rank=2 + 0040 074
Accounting impact rank=3 + 0092 139
Accounting impact rank=4 + 0008 007
Treated + -0007 -012
Accounting impact rank + 0024 076
Accounting impact rank=2 + 0047 088
Accounting impact rank=3 + 0079 114
Accounting impact rank=4 + -0003 -002
Treated + 0030 052
Accounting impact rank + 0030 098
Accounting impact rank=2 + 0078 155
Accounting impact rank=3 + 0085 130
Accounting impact rank=4 + 0014 012
Treated + -0006 -011
Control variables
Fixed effect
Standard error
Observations 572 572 572
Yes Yes Yes
Huber-White Huber-White Huber-White
Industry Industry Industry
Dependent var DPS pct
change gt60 indicator
Model (1) Model (2) Model (3)
Dependent var ΔAvg Regular
dividendAssets
Dependent var DPS pct
change gt20 indicator
Dependent var DPS pct
change gt40 indicator
52
Panel D Robustness tests for intensity of dividend changes around FAS123R
Prediction Coeff t-stat Coeff t-stat Coeff t-stat
Accounting impact rank + 0006 017
Accounting impact rank=2 + 0067 118
Accounting impact rank=3 + 0041 057
Accounting impact rank=4 + -0061 -049
Treated + 0022 035Observations
Accounting impact rank + 0009 027
Accounting impact rank=2 + 0058 106
Accounting impact rank=3 + 0032 043
Accounting impact rank=4 + -0032 -024
Treated + 0018 028
Observations
Accounting impact rank + 0030 089
Accounting impact rank=2 + 0039 071
Accounting impact rank=3 + 0122 168
Accounting impact rank=4 + -0063 -052
Treated + 0075 132
Observations
Accounting impact rank + 0008 023
Accounting impact rank=2 + 0023 042
Accounting impact rank=3 + 0048 064
Accounting impact rank=4 + -0042 -033
Treated + -0010 -016
Observations
Control variables
Fixed effect
Standard error
Exclude firms with stable
payout ratio from 2003 to 2004
506 506 506
Dependent variable DPS pct change gt40 indicator
Model (1) Model (2) Model (3)
Exclude voluntary expensers
519 519
Exclude firms in the top decile
of option reduction (02-04)
Exclude firms that accelerated
option vesting
504 504 504
517 517 517
519
Huber-White Huber-White Huber-White
Yes Yes Yes
Industry Industry Industry
53
Panel E Dividend initiation and termination rates around FAS123R
Pre FAS 123R
1 280 75 7 6 13 173
2 284 135 18 9 27 200
3 286 181 11 14 25 138
4 282 260 9 10 19 73
Total 1132 651 45 39 84 129
Post FAS 123R
1 275 63 4 4 8 127
2 280 116 9 9 18 155
3 276 152 9 3 12 79
4 263 223 5 1 6 27
Total 1094 554 27 17 44 79
Pre FAS 123R
1 280 205 2 0 2 10
2 284 149 7 1 8 54
3 286 105 0 0 0 00
4 282 22 0 0 0 00
Total 1132 481 9 1 10 21
Post FAS 123R
1 275 212 3 6 9 42
2 280 164 1 2 3 18
3 276 124 1 1 2 16
4 263 40 0 3 3 75
Total 1094 540 5 12 17 31
termination
in 2004
03-04
cumulative
03-04
cumulative
Quartile firms
with
dividend in
2004
termination
in 2005
termination
in 2006
05-06
cumulative
05-06
cumulative
Termination
Quartile firms
with
dividend in
2002
termination
in 2003
without
dividend in
2004
initiation in
2003
initiation in
2004
03-04
cumulative
03-04
cumulative firmsQuartile
firmsQuartile initiation in
2005
initiation in
2006
05-06
cumulative
05-06
cumulative
Initiation
without
dividend in
2002
54
Table 4
Effect of option-based compensation on repurchases
Panel A Two-period first-difference regression with total repurchase
Prediction Coeff t-stat Coeff t-stat Coeff t-stat
Accounting impact rank - 0002 122
Accounting impact rank=2 - 0002 071
Accounting impact rank=3 - 0005 123
Accounting impact rank=4 - 0007 102
Treated - 0014 365
Control variables
Fixed effect
Standard error
Adj R-squared
Observations
Panel B Two-period first-difference regression with net repurchase
Prediction Coeff t-stat Coeff t-stat Coeff t-stat
Accounting impact rank - 0003 166
Accounting impact rank=2 - 0002 051
Accounting impact rank=3 - 0006 165
Accounting impact rank=4 - 0009 137
Treated - 0010 300
Control variables
Fixed effect
Standard error
Adj R-squared
Observations
Panel C Two-period first-difference regression with repurchase adjusted for exercised options
Prediction Coeff t-stat Coeff t-stat Coeff t-stat
Accounting impact rank - 0001 056
Accounting impact rank=2 - 0002 062
Accounting impact rank=3 - 0007 172
Accounting impact rank=4 - -0001 -008
Treated - 0006 197
Control variables
Fixed effect
Standard error
Adj R-squared
Observations
Dependent variable ΔAvg RepurchaseTotal assets
This table investigates the causal effect of option-based pay on payout policy by examining whether the changes of repurchase around
FAS123R vary with its potential accounting impact Panel A reports the results of estimating three two-period first-differencing models
where for each firm we average its characteristics in Pre- and Post-FAS123R period In all three specifications the dependent variable is
the change of average RepurchaseTotal assets from Pre- to Post-FAS123R period The main independent variable varies by model in
Model (1) the Accounting impact rank is the quartile rank of implied option expensetotal assets measured in 2002 (1=lowest 4=highest)
In Model (2) Accounting impact rank=2 (3 4) is an indicator that takes value of one if the firmrsquos Accounting impact rank equals 2 (3 4)
In Model (3) we use an alternative treatment construction following Bakke et al (2015) where Treated is an indicator that takes value of
zero if the firm granted zero option to its CEO in both 2003 and 2004 or the firm began to voluntarily expense option-based pay at fair
value in 2002 or earlier and one otherwise Panel B reports the regressions with the change of Net repurchaseTotal assets as the
dependent variable and the same independent variable as in Panel A Panel C reports the regressions with the change of Adjusted
repurchaseTotal assets as the dependent variable and the same independent variable as in Panel A All models in Panel A B and C have
industry fixed effects and the standard errors are Huber-White heteroscedasticity-consistent standard errors All variables are defined in
Appendix The notation and indicates statistically significant at 10 5 and 1 level respectively
Model (1) Model (2) Model (3)
Yes Yes Yes
Industry Industry Industry
Huber-White Huber-White Huber-White
Dependent variable ΔAvg Net repurchaseTotal assets
1171 1171 1171
0238 0237 0245
Model (1) Model (2) Model (3)
Yes Yes Yes
Industry Industry Industry
Huber-White Huber-White Huber-White
Dependent variable ΔAvg Adjusted repurchaseTotal assets
0229 0229 0233
1171 1171 1171
Model (1) Model (2) Model (3)
Yes Yes Yes
Industry Industry Industry
Huber-White Huber-White Huber-White
0111 0112 0114
1168 1168 1168
55
Table 5
Effect of option-based compensation on payout mix
Panel A Two-period first-difference regression with total payout mix
Prediction Coeff t-stat Coeff t-stat Coeff t-stat
Accounting impact rank + 0006 028
Accounting impact rank=2 + 0018 045
Accounting impact rank=3 + -0001 -001
Accounting impact rank=4 + 0043 052
Treated + -0035 -094
Control variables
Fixed effect
Standard error
Adj R-squared
Observations
Panel B Two-period first-difference regression with net payout mix
Prediction Coeff t-stat Coeff t-stat Coeff t-stat
Accounting impact rank + -0002 -008
Accounting impact rank=2 + 0008 016
Accounting impact rank=3 + 0018 034
Accounting impact rank=4 + -0059 -055
Treated + -0050 -101
Control variables
Fixed effect
Standard error
Adj R-squared
Observations
0049 0043 0054
257 257 257
Industry Industry Industry
Huber-White Huber-White Huber-White
Dependent variable ΔAvg Regular dividendNet payout
Model (1) Model (2) Model (3)
Yes Yes Yes
0154 0151 0156
362 362 362
Industry Industry Industry
Huber-White Huber-White Huber-White
This table investigates the causal effect of option-based pay on payout mix for firms using both dividend and repurchase by examining
whether the changes of payout mix around FAS123R vary with its potential accounting impact Panel A reports the results of estimating
three two-period first-differencing models where for each firm we average its characteristics in Pre- and Post-FAS123R period In all three
specifications the dependent variable is the change of average Regular dividendTotal payout from Pre- to Post-FAS123R period The main
independent variable varies by model in Model (1) the Accounting impact rank is the quartile rank of implied option expensetotal assets
measured in 2002 (1=lowest 4=highest) In Model (2) Accounting impact rank=2 (3 4) is an indicator that takes value of one if the firmrsquos
Accounting impact rank equals 2 (3 4) In Model (3) we use an alternative treatment construction following Bakke et al (2015) where
Treated is an indicator that takes value of zero if the firm granted zero option to its CEO in both 2003 and 2004 or the firm began to
voluntarily expense option-based pay at fair value in 2002 or earlier and one otherwise Panel B reports the regressions with the change of
Regular dividendNet payout as the dependent variable and the same independent variables as in Panel A Panel A (Panel B) is based on
observations with nonzero regular dividend and repurchase (net repurchase) in both Pre- and Post-FAS123R period All models in Panel A
and B have industry fixed effects and the standard errors are Huber-White heteroscedasticity-consistent standard errors All variables are
defined in Appendix The notation and indicates statistically significant at 10 5 and 1 level respectively
Yes Yes Yes
Dependent variable ΔAvg Regular dividendTotal payout
Model (1) Model (2) Model (3)

11
period because FAS123R while effective in June 2005 was released in December 2004 14
Alternatively in untabulated tests we exclude 2005 from the analysis and obtain similar results
Another benefit of using a single Pre and Post period is that it is better suited than panel
data to the analysis of repurchases As noted by Skinner (2008) firms engaging in repurchases
tend to do so every other year thus the relation between repurchases and economic determinants is
stronger over two- or three-year periods than one-year periods Factors explaining the timing of
repurchases differ from those explaining their level and the year-to-year variation in repurchases is
not necessarily informative of changes in payout policy As we are not interested in the timing of
repurchases our approach seems to better capture ldquolong-runrdquo changes in payout policy However
for the analysis of dividends (which are generally paid every year and thus not subject to the
above problem) we also present the results using a panel regression with firm- and year-fixed
effects To alleviate the problem of serial correlation discussed earlier we cluster the standard
errors by firm
22 Accounting Impact
As noted earlier all firms were affected by FAS123R making it difficult to identify a
control sample To capture variation in the cross-sectional impact of FAS123R in Eqs (1) and (2)
we use Accounting Impacti defined as the implied option expense disclosed in the footnote of the
income statement for the 2002 fiscal year scaled by total assets (we obtain similar findings when
scaling it by revenues) We measure this variable in 2002 (ie before the Pre period) rather than in
2003 or 2004 to avoid any confounding effect from the expected adopion of FAS123R (see
discussion in Section 33) As this variable is highly skewed (see Table 1) we define it based on
(Gipper 2015) or had any effect on payout policy However we exclude 2007 from the Post period in robustness tests
Our inferences are unchanged 14 FAS123R was released in December 2004 effective as of the beginning of the first interim or annual reporting
period beginning after June 15 2005 Subsequently the SEC allowed a six-month deferral making the standard
effective for fiscal years beginning after December 15 2005
12
its quartile rank We also presents results with separate indicators for the top three quartiles in
order to better isolate the difference between top quartile (the most lsquotreatedrsquo group) and bottom
quartile (the least lsquotreatedrsquo group and thus closer to the notion of a control group)
An alternative way to address the issue of a lack of control group is suggested by Bakke et
al (2015) They argue that two sets of firms were likely lsquounaffectedrsquo by FAS123R (i) firms that
did not grant options to the CEO in 2003 and 2004 as in these firms FAS123R could not affect
CEO option pay and thus her incentives to make policy changes (ii) firms that were already
voluntarily expensing stock options as of 2002 (ie before FASB began discussions of the new
standard) as these firms would not face any additional accounting charge under FAS123R
Our approach offers a number of advantages First instead of collapsing all lsquonon-controlrsquo
firms in a single lsquotreatedrsquo group we exploit cross-sectional variation among treatment firms in
terms of the likely impact of FAS123R effectively using the most and least affected firms
(respectively top and bottom quartile of implied option expense) as treatment and control group
As shown in Table 1 the implied option expense is highly skewed (ie only a relatively small
number of firms was heavily affected by FAS123R) Capturing this variation is likely to increase
the power of the test Second in Bakke et al (2015) what matters is that the treatment definition
captures an accounting-driven change in CEO option grants as their focus is on CEO risk-taking
incentives In our setting we want to capture an accounting-driven change both in CEO option
grants (predicted to affect incentives to use dividends) and in the overall use of stock options
(predicted to affect the use of repurchases) As noted in Section 31 (see footnote 20) many firms
without CEO option grants in 2003 and 2004 were issuing options to non-CEO executives and
other employees and thus facing a potential accounting charge under FAS123R Third about half
of the firms without CEO option grants in 2003 and 2004 issued options to the CEO in the Post-
13
period Hence it is not clear that the control firms were truly unaffected by FAS123R Finally
the implied option expense in 2002 (our measure of the expected accounting impact) is a function
of option grants made in prior years when firms could not anticipate the adoption of FAS123R In
contrast option grant decisions in 2003 and 2004 may be affected by its anticipated adoption as
FASB added accounting for stock-based compensation to its agenda in March 2003
Notwithstanding the above arguments throughout our study we also present the results
using the definition of treatment and control in Bakke et al (2015) In particular we modify Eqs
(1) and (2) by replacing Accounting Impact with Treated an indicator equal to zero for the two
groups of firms identified as lsquocontrolrsquo in Bakke et al (2015) and one for all other firms
23 Payout Variables and Control Variables
Following Brown et al (2007) our baseline measure for changes in dividends is the change
in the DividendAssets ratiomdashcomputed as the regular cash dividends paid during the year scaled
by total assets at the beginning of the yearmdashfrom the Pre to the Post period15 However the
dividend-to-asset ratio is not what managers focus on when making dividend policy decisions
The stability of dividend per share (DPS) among dividend-paying firms (hereinafter payers)
suggests that managers do not target a specific dividend-to-assets ratio but rather a DPS level
(Baker and Wurgler 2016) Survey evidence confirms that executives make dividend policy
decision in terms of changes to the current level of DPS (Brav et al 2005) Therefore we also
examine the percentage change in the average DPS from the Pre to the Post period However this
measure can only be computed for the subset of payers (defined as firms with non-zero DPS in at
15 An alternative choice would be to scale dividends by the market value of equity essentially computing a dividend
yield However a drawback of using the dividend yield in our setting is that after controlling for time-invariant firm
characteristics through fixed effects or first differencing the variation of the ratio comes mainly from the denominator
the stock price (Baker and Wurgler 2004) Thus we choose the more stable book value of total assets as denominator
Also similar to other studies (eg Fenn and Liang 2001) we focus on regular dividends and exclude special dividends
as they are very rare and may introduce large noise to the dividend measures for few observations (DeAngelo
DeAngelo and Skinner 2000)
14
least one of the years of the Pre period) To provide insights into FAS123Rrsquos effect on dividend
policy for non-payers we examine the relation between our Accounting Impact variable and the
rate of dividend initations in the Pre and Post periods
Our main measure for repurchases is the change in RepurchaseAssetsmdashthat is the
aggregate amount of common stock repurchases made during the year scaled by total assets at the
beginning of the yearmdashfrom the Pre to the Post period In the empirical tests we examine
variations suggested in the literature
Finally as an alternative to examining dividends and repurchases separately we also look at a
measure of the payout composition the change in the DividendsTotal Payout ratio from the Pre to
the Post period (Total Payout is the sum of dividends and repurchases) effectively capturing any
substitution effect between dividends and repurchases 16 Examining the causal effect of the
change in option-based pay on payout composition is especially relevant if managers first target a
total payout and then choose the relative weight of dividends and repurchases In practice it is
unclear to what extent managers act this way (Brav et al 2005) Nonetheless for completeness we
also examine this variable We focus on the subsample of firms with both dividends and
repurchases in both Pre and Post period so as to capture changes in payout mix by firms routinely
using both vehicles to return cash to shareholders
As for the control variables in both Eqs (1) and (2) Controli is a vector of firm characteristics
identified in existent literature as determinants of payout policy (eg Fenn and Liang 2001 Brown
et al 2007 Skinner 2008 Cuny et al 2009) firm size book-to-market leverage asset tangibility
free cash flows cash holdings volatility in operating income institutional ownership sales
16 Fama and French (2001) suggest that repurchases are often complement to dividends while Grullon and Michaely
(2002) document that the increase in share repurchases over the past decades has come at the expense of a lower
increase in dividends consistent with a substitution hypothesis Brown et al (2007) also provide evidence of a
substitution effect in response to the 2003 dividend tax cut Survey evidence in Brav et al (2005) suggests an
asymmetric substitution effect with managers more willing to replace dividends with repurchases than the opposite
15
growth past stock returns and an indicator for loss firms For all of these variables we include
both changes from Pre to Post period and levels in the Pre period to allow for the possibility that
levels of these variables affect subsequent changes in payout policy 17 Finally we include
industry-fixed effects (Fama-French 48 industry indicators) to control for industry-level trends in
payout policies and option-based pay In unreported tests we replace free cash flows with two
separate variables operating profit and capital expenditures We also replace volatility in
operating income with volatility in stock returns Our results are unaffected More detailed
definitions of each variable are in the Appendix
24 Identification Assumption
The key identifying assumption underlying the difference-in-difference estimation
technique is that the parallel trends assumption is satisfied In the absence of treatment both
treated and control firms should experience parallel trends in the outcome variable Our approach
assumes that in the absence of FAS123R the change in dividends or repurchases would be the
same for high and low accounting impact firms Note that the well-documented contemporaneous
correlation between levels of option compensation (a key driver of the implied option expense and
thus the accounting impact) and levels of payout variables does not violate our identification
assumption This is because our assumption pertains to the relation between the level of option
compensation and future changes in payout variables
A specific concern is that options may be granted in anticipation of expected future
changes in payout policy (reverse causality problem) Relative to simple association tests this
concern is significantly reduced in our setting because the accounting impact is measured three
years prior to the arrival of treatment and is the result of option grants made over the prior four or
17 In untabulated analyses we run our tests after excluding changes in the control variables (ie including only their
pre-treatment levels) since in difference-in-difference studies controlling variables measured after the shock may
reintroduce selection bias Our inferences remain unchanged
16
five years depending on the vesting schedule18 For the reverse causality to be plausible the
implied option expense in 2002 (the result of option grants made approximately between 1998 and
2002) needs to reflect the anticipated change in payout policy in 2005-2007 This seems unlikely
While the parallel trend assumption is not directly testable similar to other studies (Bakke
et al 2015) we examine the trends in dividends and repurchases during the Pre period Figure 1
suggests that high and low accounting impact firms (respectively top and bottom quartile of
implied option expense) exhibit similar trends in payout variables in the Pre period ie from 2003
to 2004 More formally to examine the correlation between Accounting Impact and trends in the
payout variables during the Pre period we estimate the following regression only with
observations in 2003 and 2004
Payouti = γ0 + γ1 Accounting Impacti FY2004+ γ2 FY2004+ ΓControli +Firm FE +ui (3)
where Payouti is either DividendAssets or RepurchaseAssets FY2004 is an indicator of
fiscal year 2004 Firm FE indicates firm-fixed effects If firms with varying degrees of accounting
impact have different payout trends before the adoption of FAS123R γ1 should be different from
zero However for both payout variables we find that the estimated γ1 is close to zero and not
statistically significant at 10 level (untabulated tests) Overall the parallel trends assumption
seems reasonable in our setting
3 Empirical analyses
31 Sample Selection and Summary Statistics
Our sample is the SampP 1500 firms with available data on implied option expense (from
Compustat) and on executive compensation (from Execucomp) for at least one year in the Pre
18 The accounting treatment for stock options requires their fair value at the grant date to be recognized over the
service period (usually the vesting period) Hence the implied option expense in a given year includes a fraction of
the expense associated with past option grants
17
period and one year in the Post period to ensure consistency in the sample across periods Similar
to prior studies on payout policy (Fama and French 2001 Skinner 2008) we exclude financial
firms (SIC code between 6000 and 6999) and utilities (SIC between code 4900 and 4999) as well as
firms not incorporated in the US Our final sample includes 1176 firms19 We obtain dividend
and stock returns data from CRSP stock repurchases and dividend per share data from
COMPUSTAT and institutional ownership data from Thomson Reuters 13F database Other
control variables are from CRSP and COMPUSTAT To deal with outliers we winsorize all
continuous variables at 1 and 99 by fiscal year A detailed definition of all variables and their
sources is in Appendix
Table 1 Panel A presents summary statistics of the relevant variables for the pooled sample of
5653 firm-year observations Implied option expense in 2002 (our proxy for Accounting Impact)
is on average 173 of total assets with the median at 052 This suggests that the accounting
impact is very large for a small number of firms Over the entire sample period on average
dividends represent 093 of total assets while repurchases represent 394 Untabulated
analyses indicate that in 16 of the firm-year observations only dividends are paid out in 25
only repurchases in 32 both and in 27 neither Within the subset of firm-years with a payout
dividends represent 3874 of total payout This data confirms prior evidence that repurchases
have assumed the primary role as a vehicle to return cash to shareholders (eg Floyd et al 2015)
The mean (median) total executive pay (average across the top 5 executives) is $25 million ($16
million) On average option grants and restricted stock grants represent respectively 283 and
141 of total pay while salary and bonus comprise 296 and 197 respectively The
19 The results presented in the study are similar when (i) we restrict the sample to firms with available data for the
entire (2003-2007) sample period (1009 firms) and (ii) we exclude firms with CEO turnover in the Post period
(reducing the sample size to 780 firms) as a new CEO may have a different compensation package andor adopt a
different payout policy
18
composition of CEO pay (untabulated) is similar As for the control variables the figures are
generally consistent with other studies examining SampP 1500 firms over the same period
Panel B reports the pairwise Pearson correlations among the relevant variables The
correlations are in line with the associations documented in prior studies For example larger
firms and firms with higher profitability (free cash flows) have higher payouts loss firms have
lower payouts greater volatility in operating income is associated with lower dividends
More relevant to our analysis Panel C presents the mean of each variable in the Pre and Post
period for the full sample For each variable we first compute the firm-level mean over the Pre
and the Post Period and then compute the mean of the resulting figure across all firms There is a
striking increase in repurchases which double from 245 to 490 of total assets causing a
similar increase in total payout The increase in dividends is much smaller from 083 to 099
of total assets As a result for firms with positive payout dividends become a smaller fraction of
total payout in the Post period (2790 versus 3914 in the Pre period) This trend is consistent
with Floyd et al (2015) who document a dramatic increase in repurchases in the years leading to
the 2008 financial crisis Consistent with previous studies around FAS123R there is a significant
reduction in option grants as a fraction of total executive pay (from 343 to 240) and a
corresponding increase in the use of restricted stock (from 87 to 176) with little variation in
the weight of salary and bonus (note that restricted stock salary and bonus were expensed both
before and after FAS123R) Similar patterns hold for the composition of CEO pay (untabulated)
Compared to changes in the mix of executive pay changes in the levels of control variables are
generally less pronounced
Panel D reports the change in the key compensation and payout variables from the Pre to the
Post period by quartiles of implied option expense and yields a number of insights First
19
confirming the skewness suggested by Panel A the mean implied option expense is 551 for
firms in the top quartile versus only 093 035 and 012 for firms in the second third and
bottom quartile respectively Second as expected firms with higher implied option expense have
greater use of option-based pay For example in the Pre-period option pay represents 507 of
total executive pay at firms in the top quartile versus 201 in the bottom quartile Third and
more importantly for our research design the use of option pay changes significantly from the Pre
to the Post period as a function of the accounting impact For firms in the top quartile the
percentage of total pay represented by stock options drops by 182 (from 507 to 325)
versus 113 80 and 34 for firms in the second third and bottom quartile respectively The
decline in option usage across quartiles is accompanied by an increase in restricted stock grants
while the weight of salary and bonus shows little change It is important to emphasize the
substitution of stock options with restricted stocks because restricted stocks typically pay
dividends (Zhang 2013) thus providing further reason to expect a dividend increase in response to
the FAS123R-induced decline in option pay
As for the payout variables Panel D suggests that heavy option users (firms with higher
implied option expense) generally use repurchases more than dividends consistent with the
associations documented in earlier studies In the Pre period repurchases (dividends) represent
351 (030) of total assets for the top quartile versus 113 (112) for the bottom quartile
Panel D also indicates that the increase in repurchases documented in Panel C takes place across
all quartiles As for the (much smaller) change in dividends the absolute increase is similar across
the four quartiles though the relative increase (the percentage change) appears to be slightly
higher in the top quartile Overall these figures do not suggest a shift toward dividends and away
from repurchases by firms with a large (accounting-induced) decline in the use of option pay
20
Panel E presents the same data as Panel D but based on the definition of lsquotreatmentrsquo and
lsquocontrolrsquo in Bakke et al (2015) Under this definition 997 firms are classified as treatment group
and 177 as control (171 firms are classified as lsquocontrolrsquo because they did not grant options to the
CEO in the Pre period and 6 because they were voluntarily expensing options before 2003)
Interestingly lsquotreatedrsquo firms are equally distributed across the quartiles suggesting significant
variation in the degree of treatment As discussed earlier one benefit of our approach is that it
exploits cross-sectional variation among treatment firms in terms of the likely impact of FAS123R
Also 40 of the control firms (71 out of 177) are in the lowest quartile while 35 ((37+25)177)
are in the top two quartiles reflecting the different focus of the two approaches in terms of
identifying firms less affected by FAS123R20
As for payout and compensation variables Panel E shows that the treated group experiences a
larger increase in repurchases than the control group while the (less pronounced) increase in
dividends is similar across treated and control firms Treated firms experience a 126 decrease in
option pay (from 387 to 261) with a corresponding 94 increase in the weight of restricted
stock grants (from 80 to 174) The figures are similar at the CEO level (because the
classification is based on options grants to the CEO it is useful to report pay figures at both the top
5 executives and the CEO level) Interestingly the control group experiences a pronounced
increase in the weight of option grants in total CEO pay from 10 to 127 as almost half of the
control firms issued options to their CEOs in the Post period (for these firms options as percentage
of total CEO pay increased from 0 to 254 untabulated analysis) While this increased use of
stock options suggests (ex post) that these firms were not concerned with the impact of FAS123R
another possibility is that the lack of use of option compensation for CEOs in 2003 and 2004 was
20 In untabulated analysis we find that 55 of the 171 firms issuing no options to the CEO in the Pre period granted
options to the other top executives (and perhaps to other non-executive employees) thus explaining the relatively high
implied option expense for the control group (10 versus 19 for the treatment group ndash see Panel E)
21
temporary rather than the effect of a permanent policy If these firms were planning to issue
options to the CEO in the Post period the assumption that they were unaffected by FAS123R (and
thus their use as control sample) is questionable21
32 Differential Impact of FAS123R on the Use of Option-Based Compensation
An important building block of our approach is the presumed differential impact of FAS123R
on option-based pay as a function of pre-existing implied option expense22 While Table 1 Panel
D preliminarily supports the validity of this assumption we formally examine it by estimating Eq
(1)
As reported in Table 2 Panel A we find a significant negative association between Accounting
Impact and the change in option-based pay around the adoption of FAS123R In column (1)
where we use the quartile rank of implied option expense the -0044 coefficient implies that
around FAS123R option grants over total pay decline by 44 as we move from the highest
quartile to the next Thus the reduction in top quartile firms is 132 larger than in bottom
quartile firms In column 2 we replace the quartile rank with three indicators for the highest
quartiles (with the bottom quartile collapsed in the intercept) so as to be able to compare directly
top and bottom quartile without imposing the same effect across quartiles The negative and
significant coefficient on the top quartile indicator at -0140 suggests that the reduction in option
grants over total pay is 140 larger for top quartile firms relative to bottom quartile firms
Finally in column 3 we use the indicator for treated firms following Bakke et al (2015) The
21 Panel E also shows an increase in the use of restricted stock in CEO pay packages (from 128 to 182 almost
comparable to the increase among treated firms) The concurrent increase in options and restricted stock suggests
these firms would have increased option pay significantly more had it not been for FAS123R indicating further
caution in classifying them as control group of unaffected firms 22 This is akin to the relevance assumption of instrumental variable if we interpret the implied option expense as an
instrument to the change in option-based pay
22
negative and significant coefficient at -0132 suggests that treated firms experience a 132
larger drop in the weight of option pay relative to control firms
In Panel B we re-estimate Eq (1) using a panel regression with firm- and year-fixed effects
(5653 firm-year observations) where the dependent variable is the the ratio of option grants to
total executive pay The results are virtually identical in terms of significance and magnitude of
the coefficients of interest (the interaction terms between respectively Accounting impact and
Treated and an indicator for the Post period)
Overall Table 2 suggests that high implied option expense and the introduction of FAS123R
together strongly encouraged firms to cut back option-based compensation for executives It also
supports the general validity of the approach in Bakke et al (2015) in identifying firms most
affected by FAS123R notwithstanding the concerns outlined earlier
Our test of Eq (1) focuses on executive stock options For our dividend-protection hypothesis
it is important to establish that the level of implied option expense predicts a change in executive
stock options (rather than only a change in the use of non-executive employee stock options) as we
want to capture the effect of a change in executivesrsquo incentives on payout policy At the same
time our dilution channel hypothesis assumes a change in the use of all (executive and non-
executive employee) stock options Thus in untabulated analyses we repeat the test in Eq (1) by
replacing the dependent variable with the change in the number of options granted to all
employees (scaled by the total number of outstanding shares note for this analysis we can only
use data from 2004 to 2007 because Compustat began reporting data on ESO in 2004) The
coefficient on Accounting Impact and Treated continues to be negative and significant suggesting
that the differential reduction in the use of option compensation as a function of accounting impact
23
occurred for both executive and non-executive employee stock options Indeed Brown and Lee
(2011) report a similar decrease in executive and employee stock options around FAS123R
33 Option-Based Pay and Dividend Payouts
In this section we examine the effect of an exogenous (accounting-induced) change in option
compensation on dividend policy by estimating Equation (2)
Table 3 Panel A presents the results using the change in dividends from Pre to Post as
dependent variable We find no significant association between Accounting Impact (column 1 and
2) or Treated (column 3) and the change in dividends around the adoption of FAS123R This is in
stark contrast with the negative effect of option-based pay on dividends predicted in the literature
and documented in various association studies
One concern with this lack of effect is that perhaps our setting is not powerful enough to detect
it One way to examine this possibility is the following The coefficient on Accounting Impact
rank=4 in column 2 is 0001 and the standard error (SE) is 00009 Assuming the estimated
standard error is correct then for a two-tailed t test the coefficient needs to be greater than 00015
(=SE1645) or 015 to reach the 10 percent significant level In other words if moving from
the bottom to the top quartile (which predicts a 14 differential decline in option based pay as per
Table 2 Panel A) resulted in a 015 increase of the dividendasset ratio our test would be able to
detect a causal effect of option-based pay on dividends Given the unconditional mean of the
dividendasset ratio at 093 an increase of 015 from the Pre to the Post period seems
plausible In fact the average increase from the Pre to the Post period is 016 (Table 1 Panel C)
Thus if an effect was there our test should detect it
24
Panel B presents the results using a panel regression (5653 firm-year observations) with firm-
and year-fixed effects and interaction terms between Accounting Impact (or Treated) and an
indicator for the Post period Our inferences are unchanged
These analyses are based on our full sample which includes both dividend-paying and non-
dividend-paying firms Hence they implicity treat as equal two potentially different decisions to
initiate dividends and to increase dividends For example an increase in the dividend-to-asset
ratio from 05 to 06 will be treated the same as an increase from 00 to 01 even though
the latter represents a critical dividend initiation decision23 To address this following Chetty and
Saez (2005) we separately examine how FAS123R impacts the intensity of dividend changes (for
the subset of payers) and the likelihood of dividend initiations (for the subset of non-payers)
331 Option-Based Pay and Dividend Payouts Intensity of Dividend Changes
In the first row of Panel C we repeat the analysis in Panel A for the sub-sample of 572 payers
defined as firms with positive DPS in 2003 andor 2004 Note that we report only the coefficients
of interest for parsimony In the second row we replace the dependent variable with the
percentage change in DPS DPS is the choice variable for managers (Brav et al 2005 Baker and
Wurgler 2016) and thus our preferred measure to capture changes in dividend policy To account
for skewness in this variable (Khale 2002) in the third fourth and fifth rows we use indicator
variables to denote whether the change in DPS surpasses a threshold respectively 20 40 and
60 The proportion of firms that surpass these thresholds are 59 44 and 33 respectively24
23 Initiating dividends is a critical decision for boards given the pre-commitment value that investors attach to this
decision and the strong negative market reaction when firms eliminate or reduce dividends (Brav et al 2005) For
executives trying to maximize the value of their own stock options (dividend-protection argument) the ability to
influence a dividend initiation decision is likely lower than the ability to influence a dividend increase decision 24 Although in the third fourth and fifth rows our dependent variable is a binary variable we use a linear model (OLS)
instead of a probit or logit nonlinear model The reason is that estimating fixed effects in binary response models with
panel data can cause the incidental parameters problem The coefficient estimates can be biased when the panel data
25
Across all of these specifications we find no association between Accounting Impact or Treated
and the intensity of dividend changes Thus it does not appear that an exogenous reduction in
option-based pay caused dividend-paying firms to increase dividends
In Panel D we perform four robustness tests For parsimony we show only the coefficients of
interest and only the cases where the dependent variable is an indicator denoting a greater than
40 increase in DPS The results are similar for the other four ldquointensityrdquo dependent variables
reported in Panel C
In the first row we exclude firms that began to voluntarily expense options in 2003 or 2004
(84 firms of which 68 are dividend payers) FASB added accounting for stock-based
compensation to its agenda in March 2003 and issued an Exposure Draft proposing the expensing
of stock options at fair value in March 2004 In anticipation a number of firms began to
voluntarily expense stock options in 2003 and 2004 (Aboody et al 2004) If these firms reduced
option grants and as a result increased dividends during the Pre period then their inclusion may
reduce the power of our tests and thus our ability to detect the hypothesized relation25
In a similar spirit in the second row we exclude firms in the top decile in terms of reduction in
the ratio of option grants to total pay for the top 5 executives between 2002 (the year prior to the
Pre-period) and 2004 (the end of the Pre-period) This encompasses 113 firms of which 55 are
dividend payers If these firms reduced option grants in anticipation of FAS123R and as a result
increased dividends during the Pre period their inclusion may reduce our ability to detect the
hypothesized relation
has a large number of observations but a short time series Examples of studies making a similar choice are Puri
Rocholl and Steffen (2011) and Chu and Ma (2015) 25 This is unlikely to be a serious concern as previous studies suggest that voluntary expensers made limited use of
stock options (Aboody et al 2004) In fact in our sample 79 of these firms are in the bottom two quartiles of
implied option expense (untabulated) Nonetheless we present this test for robustness
26
In the third row we exclude firms that accelerated the vesting of options before FAS123R
became effective in order to avoid recognizing an expense for the unvested portion of these
options (Choudhary et al 2009 Balsam Reitenga and Yin 2008) This encompasses 196 firms of
which 54 are dividend payers If accelerating vesting was used to reduce the impact of FAS123R
the inclusion of these firms may reduce the power of our tests26
In the fourth row we deal with the concern that if firms target a fixed dividend to net income
ratio (Lintner 1956) and do so without adjusting for changes in accounting standards then by
decreasing net income (via option expense) the accounting change would mechanically cause a
reduction in dividends This would potentially offset and confound the increase predicted under
the dividend-protection and dilution hypotheses This seems unlikely for two reasons First firms
are notoriously reluctant to cut dividends (Brav et al 2005) Hence it seems unlikely that they
would reduce dividends in response to a decline in net income with no economic or cash flow
implications (ie re-classification of an expense from the footnotes to the income statement)
Second firms today set dividends in terms of dividend per share rather than by targeting a net
income-based payout ratio (Brav et al (2005)) As noted by Skinner (2008) over the last few
decades as earnings have become more variable the relation between earnings and dividends has
become weaker with dividend payments increasing smoothly and largely independent of the
variation in earnings Nevertheless in the fourth row we exclude the 66 dividend-paying firms that
26 These firms explicitly stated that they accelerated the vesting of stock options to avoid the accounting charge
(Choudhary et al 2009) In fact 72 are classified in the top two quartiles of implied option expense (untabulated)
Thus we would have predicted these firms to experience a significant decline in option pay To the extent that this
decline did not materialize because they minimized the impact of FAS123R by accelerating vesting the ability of
Accounting Impact to predict the reduction in option pay and thus its usefulness in examining changes in dividends
around FAS123R may be reduced The list of firms accelerating vesting was kindly provided by Jack Ciesielsky of
The Analystsrsquo Accounting Observer
27
had a similar payout ratio in 2003 and 2004 as a proxy for firms with a target net income-based
payout ratio in the Pre period27
As shown in Panel D even after excluding these subsets of firms we continue to find no
association between Accounting Impact or Treated and changes in dividends for dividend-paying
firms This is inconsistent with a causal influence of option compensation on dividend policy
Another concern is that by reducing net income and thus retained earnings FAS123R
may have pushed some firms closer to violating dividend covenants in debt contracts and
thus prevented them from increasing dividends This would bias our study against finding a
causal effect of option-based pay on dividends However this does not appear to be a
significant concern for three reasons First the recognition of an option expense does not
imply a decline in net income In fact more than 70 (75) of the full sample firms
(dividend payers) experienced an increase in net income before extraordinary items from
2004 to 2005 (the percentages are similar across the four quartiles of implied option
expense) Second dividend covenants are less common among dividend-paying firms
(Nikolaev 2010) Third most loan contracts in recent years give parties the option to
ldquofreezerdquo GAAP when facing a mandatory change in accounting principles (Christensen and
Nikolaev 2009) Firms expecting an adverse impact of FAS123R on their dividend covenants
would likely exercise this option (particularly given the non-cash nature of option-based
expense) Nonetheless to alleviate this concern we perform three additional analyses
(untabulated) (i) we repeat the tests in Panel C after excluding firms with a drop in net
income between 2004 and 2005 (ie firms that perhaps faced some covenant-related
27 We define a ldquosimilarrdquo payout to be an absolute change in payout ratio of less than 1 from 2003 to 2004 Among
these 66 firms only 39 continued to have a similar payout ratio in 2005 We also try an alternative definition where
a firm is classified as likely to be using a net income-based target payout ratio if the absolute percentage change in the
ratio from 2003 to 2004 is less than 10 (100 firms) Our inferences are unchanged
28
constrains to their payout policy as a result of FAS123R) (ii) we explicitly control for net
income and retained earnings in the regression (as in Skinner 2008) (iii) we repeat the tests
in Panel C for dividend payers with dividendsasset ratio above the sample median on the
basis that dividend covenants are less frequent among firms paying large dividends (Jung
Lee and Yang 2016) Our inferences are unchanged
332 Option-Based Pay and Dividend Payouts Dividend Initiations
In this section we examine whether the accounting-driven change in option pay affected
dividend initiations among non-payers We cannot employ the difference-in-difference approach
adopted so far by definition the same firm cannot initiate dividends in both periods However we
can provide suggestive evidence as follows First we take all firms that did not pay dividends in
2002 and group them into quartiles based on 2002 implied option expense For each quartile we
find the number of firms initiating dividends in 2003 and 2004 (the Pre period) Next we take all
firms that did not pay dividends in 2004 group them into quartiles based on 2002 implied option
expense and for each quartile find the number of firms initiating dividends in 2005 and 2006 (the
Post period) We do not include 2007 so as to have the same number of years in both periods and
make the cumulative initiation rates comparable
The left portion of Panel E reports the results of this exercise There is a general decrease in
the dividend initiation rate from the Pre to the Post period This holds both in the full sample of
non-payers (from 129 to 79) and across all quartiles This decrease may reflect a temporary
spike in 2003 and 2004 in response to the 2003 dividend tax cut documented in Chetty and Saez
(2005) It is noteworthy that initiation rates in both periods are lower among firms with higher
implied option expense This is consistent with option-heavy firms being mostly high-growth
firms less inclined to pay dividends More relevant to our research question if the lower use of
29
option compensation increased the propensity to pay dividends we would expect to see a relative
increase (ie a lower decrease) in dividend initiations among firms with the highest accounting
impact Instead the rate does not differ depending on the accounting impact There is
approximatley a 5 decline in initiation rate in each quartile In the right portion of Panel E we
examine similar data for dividend terminations While the results should be interpreted with
caution due to their rarity firms with higher accounting impact do not experience a greater decline
in termination rates Our inferences in Panel E are similar when we compared treated and control
firms following Bakke et al (2015) (untabulated)
Even after taking into account the different nature of decisions for dividend paying and non-
dividend-paying firms we fail to find evidence of a causal influence of option-based compensation
on dividend policy This finding is in contrast to the associations documented in earlier studies It
is even more remarkable as most firms replaced stock options with restricted stock which are
generally dividend-protected and should provide further incentive to increase dividends28
34 Option-Based Pay and Repurchases
In this section we examine the effect of an exogenous (accounting-induced) change in option
compensation on repurchases by estimating Equation (2)
Table 4 Panel A presents the results using the change in repurchases (scaled by total assets)
from Pre to Post as a dependent variable If the use of option-based pay had a positive effect on
firmsrsquo propensity to engage in repurchases as posited by the dividend-protection and dilution
hypotheses we should find a negative association between Accounting Impact or Treated and
repurchases Firms with a higher (accounting-driven) reduction in option-based pay should reduce
28 In a sample of SampP 500 firms between 2000 and 2009 Zhang (2013) reports that 80 of the firms granting
restricted stocks offer dividend protection In that sense the FAS123R-induced shift from stock options to restricted
stock may be characterized as a ldquoshockrdquo to dividend protection in unearned equity pay Accordingly our results cast
doubt on the causal interpretation of the positive association between dividend protection and dividend payouts
documented in prior studies (Zhang 2013 Burns et al 2015 Minnick and Rosenthal 2015)
30
the use of repurchases either because they are shifting toward a greater use of dividends andor
because they have a lower need to offset the dilutive effects of stock options However we find no
significant association between Accounting Impact (columns 1 and 2) and the change in
repurchases around the adoption of FAS123R When we use the Treated indicator (column 3) we
find a significant positive association rather than a negative one In Panel B we repeat the analysis
using net repurchases (ie repurchases after removing the effect of share issuances) following
Fama and French (2001) and Skinner (2008) Our inferences are unchanged29
This test is subject to two important caveats The first is we may not detect a decline in
repurchases because in the Post period firms need to offset the exercise of options that were
granted during the Pre period That is a post-FAS123R reduction in grants may not (yet) translate
into a reduction in exercises during the Post period which reduces our ability to test the dilution
hypothesis (ie that firms repurchase shares to offset exercises)30 However we can examine a
variation of this hypothesis where firms use repurchases to manage the effect of unexercised
options on diluted EPS (Bens et al 2003) To do so in Panel C we use a measure of adjusted
repurchases where we subtract our estimate of repurchases undertaken to offset the exercise of
ESO31 We effectively test whether firms experiencing an accounting-induced decrease in option
grants engage in less repurchases (net of exercise-driven repurchases) because their need to
manage the effect of unexercised options on diluted EPS is lower However the coefficient on
the variables of interest is either insignificant or positive inconsistent with the hypothesis
29 In the case of repurchases we do not examine separately ldquoinitiationsrdquo and ldquointensityrdquo as we do for dividends
because initiation is not clearly defined for repurchases Unlike dividends the occurrence of a repurchase in a given
year (or the lack thereof) cannot be used to infer a general policy due to the more discretionary nature of the timing of
repurchases 30 To capture the effect of lower option-based compensation on option exercises and thus on repurchases we would
ideally extend the Post period beyond 2007 However as noted by Floyd et al (2015) repurchases declined
dramatically after 2007 because of the financial crisis making it difficult to detect the effect of any other factor 31 As upper bound estimate of exercise-driven repurchases we multiply the number of ESO exercised during the year
times the average stock price during the year Since the number of ESO exercised is available in Compustat starting in
2004 Panel C is based on observations from 2004 to 2007
31
A second important caveat is that most firms replaced stock options with restricted stock
(Table 2 Panel C) Unvested restricted stock is excluded from the denominator in the computation
of basic EPS (once vested it is included) However it is included in the denominator of diluted
EPS using the treasury stock method similar to stock options Given the complexity of this
method without access to all details of restricted stock grants and option grants it is difficult to
determine whether the switch from stock options to restricted stock decreased the need for
dilution-driven repurchases as our test implicitly assumes Hence it is possible that we do not find
a decrease in repurchases because a reduced need to offset the dilutive effect of stock options was
neutralized by an increased need to offset the dilutive effect of restricted stock
Subject to the above caveats the evidence in Table 4 is not consistent with a positive causal
relation between the use of option-based pay and repurchases More precisely it suggests that
option-driven dilution concerns do not have a first-order effect on the magnitude of repurchases
even though they may play a role in the repurchase decision Hence our result is not necessarily
in conflict with the evidence in Brav et al (2005) where two-thirds of the surveyed financial
executives state that offsetting the dilutionary effect of stock option plans or other stock
programs is an important factor to their repurchase decisions
35 Option-Based Pay and Payout Composition
As an alternative to examining dividends and repurchases separately we also look at the
payout composition the change in the DividendsTotal Payout ratio from the Pre to the Post period
where Total Payout is the sum of dividends and repurchases As noted earlier we focus on the
subsample of firms with both dividends and repurchases in both Pre and Post periods so as to
capture the change in payout mix by firms routinely using both vehicles to return cash to
shareholders If the use of option-based pay causes firms to substitute repurchases for dividends
32
we should find a positive association between Accounting Impact or Treated and the payout mix
defined as DividendsTotal Payout ratio Firms with a higher accounting-driven reduction in
option-based pay should have an increase (decrease) in the relative weight of dividends
(repurchases) to the total payout However as reported in Table 5 Panel A we fail to find a
significant association between Accounting Impact (column 1 and 2) or Treated (column 3) and
the change in payout mix The results are similar when we use Net Payout (dividends plus net
repurchases) instead of Total Payout in computing the payout mix (Panel B)
Overall the combined evidence in Tables 3-5 does not support the hypothesis that option-
based compensation has negative (positive) effect on dividends (repurchases) or that it causes
firms to replace dividends with repurchases
4 Conclusion
Prior literature has documented robust associations between option-based compensation and
payout policy yet it remains unclear whether this association reflcts a causal influence We
investigate the causal effect of option-based compensation on payout policy using the adoption of
FAS123R which resulted in a significant decrease in option grants making it a plausible
exogenous shock to the use of option-based pay To overcome the challenge of no control group
we exploit the fact that firms responded differently depending on the firm-specific accounting
impact as measured by the implied option expense disclosed in the footnotes prior to FAS123R
Firms with larger expected accounting impact curtailed option-based compensation much more
aggressively than firms with lower impact Using a sample of SampP 1500 firms we find no
evidence that firms with a larger accounting-induced decline in option compensation increased
dividends reduced repurchases or changed their payout composition contrary to the widely held
belief that option-based pay has a causal influence on payout policy
33
Appendix Variable Definitions and Data Sources
Accounting Impact Variables
Accounting impact Implied option expense (Compustat XINTOPT) divided by total assets
(Compustat AT) This variable is measured at fiscal year 2002 and is time-invariant
Accounting impact rank The quartile rank of Accounting impact (1=lowest 4=highest)
Payout Variables
Regular dividendTotal assets The numerator is total regular cash dividends in the fiscal year
from the distribution dataset in CRSP Regular cash dividends are identified by the distribution
codes 1212 1222 1232 or 1242 The denominator is one-year lagged total assets (Compustat
AT)
DPS Dividend per share (Compustat DVPSX_F)
DPS pct change The percentage change of average DPS from Pre- to Post-FAS123R period
DPS pct change gtX indicator A dummy variable that equals one if DPC pct change is greater
than X and zero otherwise
RepurchaseTotal assets The numerator is the repurchase of common equity which equals total
repurchase (Compustat PRSTK) minus the change in preferred stock redemption value
(Compustat PSTKRV) The denominator is one-year lagged total assets (Compustat AT)
Net repurchaseTotal assets Net repurchase removes the effect of share issuances The
construction follows Fama and French (2001) and Skinner (2008) if the firm uses the treasury
stock method for repurchase net repurchase equals the increase in common treasury stock
(Compustat TSTKC) if the firm uses the retirement method (when common treasury stock is zero
in the current and prior year) net repurchase equals total repurchases minus stock issuance
(Compustat SSTK) and change in preferred stock redemption value (Compustat PSTKRV)
When the above measures give negative value net repurchase is set to zero
Adjusted repurchaseTotal assets Adjusted repurchase removes from total repurchase the potential
effect of repurchasing exercised options This variable equals total repurchase of common stocks
minus the product between the number of options exercised (Compustat OPTEXD) and average
stock price during the year When the above measure gives negative value adjusted repurchase is
set to zero Since the number of options exercised is not available before 2003 we drop
observations in 2003 when we use this variable
34
Total payoutTotal assets the sum of Regular dividendTotal assets and RepurchaseTotal assets
Regular dividendTotal payout regular cash dividend divided by the sum of regular cash dividend
and repurchase from common equity In the two-period analysis (Pre- vs Post-FAS123R) we
separately sum the numerator and the denominator for each firm-period and then calculate the ratio
Regular dividendNet payout regular dividend divided by the sum of regular dividend and net
repurchase In the two-period analysis (Pre- vs Post-FAS123R) we separately sum the numerator
and the denominator for each firm-period and then calculate the ratio
Compensation Variables
Salary_$ Average salary (Execucomp SALARY) of the top 5 highest paid executives in $1000
Salary_ Average salary (Execucomp SALARY) divided by average total pay (Execucomp
TDC1) of the top 5 highest paid executives
Bonus_$ Average bonus (Execucomp BONUS) of the top 5 highest paid executives in $1000
Due to a data format change we add non-equity plan-based awards (Execucomp
NON_EQ_TARG) to this measure after 2006
Bonus_ Bonus_$ divided by average total pay (Execucomp TDC1) of the top 5 highest paid
executives
Option grant_$ Average option grant value (Execucomp OPTION_AWARDS_BLK_VALUE or
OPTION_AWARDS_FV) of the top 5 highest paid executives in $1000 Due to a data format
change we use OPTION_AWARDS_FV for this measure after 2006
Option grant_ Option grant_$ divided by average total pay (Execucomp TDC1) of the top 5
highest paid executives
Restricted stock grant_$ Average restricted stock grant value (Execucomp RSTKGRNT or
STOCK_AWARDS_FV) of the top 5 highest paid executives in $1000 Due to data format
change we use STOCK_AWARDS_FV for this measure after 2006
Restricted stock grant_ Restricted stock grant_$ divided by average total pay (Execucomp
TDC1) of the top 5 highest paid executives
Total pay_$ Average total pay (Execucomp TDC1) of the top 5 highest paid executives in $1000
35
Other Characteristics
Size The book value of total assets (Compustat AT) minus the book value of common equity
(Compustat CEQ) plus the market value of common equity from CRSP in $M
Log(size) the natural logarithm of size
Book-to-market the book value of common equity dividend by its market value
Leverage long term debt plus short term debt (Compustat DLTT + DLC) divided by total assets
Asset tangibility tangible assets (Compustat AT - INTAN) divided by total assets
Free cash flow Operating cash flow (Compustat OANCF) minus capital expenditure (Compustat
CAPX) then divided by lagged total assets
Cash holding Cash and short-term investments (Compustat CHE) divided by total assets
ROA volatility the standard deviation of returns on assets (operating income before tax divided by
lagged total assets) in the past five fiscal years
Institutional ownership the number of shares held by institutional investors divided by the number
of shares outstanding from Thomson Reuters Institutional Holdings database
Sales growth the growth rate of sales (Compustat SALE) from the prior year
Past stock return annual stock return from the prior year
Loss indicator a dummy variable taking value of one if the current net income is negative and
zero otherwise
36
References
Aboody David 1996 Market Valuation of Employee Stock Options Journal of Accounting and
Economics 22 357-391
Aboody David Barth Mary E and Ron Kasznik 2004 Firms Voluntary Recognition of Stock-
Based Compensation Expense Journal of Accounting Research 42 123ndash150
Aboody David and Ron Kasznik 2008 Executive stock-based compensation and firmsrsquo cash
payout the role of shareholdersrsquo tax-related payout preferences Review of Accounting Studies
13 216ndash251
Anantharaman Divya and Yong Gyu Lee 2014 Managerial risk taking incentives and corporate
pension policy Journal of Financial Economics 111 328ndash351
Baker Malcolm and Jeffrey Wurgler 2004 A catering theory of dividends Journal of Finance
59 1125-1165
Baker Malcolm and Jeffrey Wurgler 2016 Dividends as reference points a behavioral signaling
approach Review of Financial Studies 29 697-738
Bakke Tor-Erik Hamed Mahmudi Chitru Fernando and Jesus Salas 2015 The causal effect of
option pay on corporate risk management Journal of Financial Economics forthcoming
Balsam Steven Austin Reitenga and Jennifer Yin 2008 Option acceleration in response to SFAS
No 123 (R) Accounting Horizons 22 23-45
Bens Daniel and Steven Monahan 2008 Altering Investment Decisions to Manage Financial
Reporting Outcomes Asset-Backed Commercial Paper Conduits and FIN 46 Journal of
Accounting Research 46 1017-1055
Bens Daniel A Venky Nagar Douglas J Skinner and MH Franco Wong 2003 Employee stock
options eps dilution and stock repurchases Journal of Accounting and Economics 36 51ndash90
Bertrand Marianne Esther Duflo and Sendhil Mullainathan 2004 How much should we trust
differences-in-differences estimates The Quarterly Journal of Economics 119 249ndash275
Blouin Jennifer L Jana S Raedy and Douglas A Shackelford 2011 Dividends Share
Repurchases and Tax Clienteles Evidence from the 2003 Reductions in Shareholder Taxes
The Accounting Review 86 887-914
Brav Alon John R Graham Campbell R Harvey and Roni Michaely 2005 Payout policy in the
21st century Journal of Financial Economics 77 483ndash527
Brown Lawrence D and Yen-Jung Lee 2011 Changes in Option-Based Compensation Around
the Issuance of SFAS123R Journal of Business Finance amp Accounting 38 1053ndash109
37
Brown Jeffrey R Nellie Liang and Scott Weisbenner 2007 Executive financial incentives and
payout policy Firm responses to the 2003 dividend tax cut Journal of Finance 62 1935ndash
1965
Burns Natasha Brian McTier and Kristina Minnick 2015 Equity-incentive compensation and
payout policy in Europe Journal of Corporate Finance 30 85-97
Carter Mary Ellen and Luann J Lynch 2003 The Consequences of the FASBrsquos 1998 Proposal on
Accounting for Stock Option Repricing Journal of Accounting and Economics 35 51-72
Carter Mary Ellen Luann J Lynch and Irem Tuna 2007 The role of accounting in the design of
CEO equity compensation The Accounting Review 82 327ndash357
Chava Sudheer and Amiyatosh Purnanandam 2010 CEOs versus CFOs Incentives and
corporate policies Journal of Financial Economics 97 263ndash278
Chetty Raj and Emmanuel Saez 2005 Dividend taxes and corporate behavior Evidence from the
2003 dividend tax cut The Quarterly Journal of Economics 120 791ndash833
Choudhary Preeti Shivaram Rajgopal and Mohan Venkatachalam 2009 Accelerated vesting of
employee stock options in anticipation of FAS123R Journal of Accounting Research 47 105ndash
146
Christensen Hans B and Valeri Nikolaev 2009 Contracting on Mandatory Changes to GAAP
New Practice and Its Determinants Working Paper University of Chicago
Chu Yongqiang and Tao Ma 2015 How does management compensation affect bank risk taking
evidence from FAS 123R University of South Carolina Working Paper
Cuny Charles J Gerald S Martin and John J Puthenpurackal 2009 Stock options and total
payout Journal of Financial and Quantitative Analysis 44 391ndash410
DeAngelo Harry Linda DeAngelo and Douglas J Skinner 2000 Special Dividends and the
Evolution of Dividend Signaling Journal of Financial Economics 57 309-354
Dechow Patricia M Amy P Hutton and Richard G Sloan 1996 Economic consequences of
accounting for stock-based compensation Journal of Accounting Research 34 1ndash20
Edgerton J 2013 Four facts about dividend payouts and the 2003 tax cut International Tax and
Public Finance 20 769-784
Edmans Alex and Xavier Gabaix 2015 Executive compensation a modern primer Journal of
Economic Literature forthcoming
38
Fama Eugene F and Kenneth R French 2001 Disappearing dividends changing firm
characteristics or lower propensity to pay Journal of Financial Economics 60 3ndash43
Farre-Mensa Joan Roni Michaely and Martin C Schmalz 2014 Payout policy Annual Review
of Financial Economics 6 75ndash134
Fenn George W and Nellie Liang 2001 Corporate payout policy and managerial stock
incentives Journal of Financial Economics 60 45ndash72
Ferri Fabrizio and Tatiana Sandino 2009 The impact of shareholder activism on financial
reporting and compensation the case of employee stock options expensing The Accounting
Review 84 433ndash466
Floyd Eric Nan Li and Douglas J Skinner 2015 Payout policy through the financial crisis the
growth of repurchases and the resilience of dividends Journal of Financial Economics 118
299-316
Frydman Carola and Dirk Jenter 2010 CEO compensation Annual Review of Financial
Economics 2 75-102
Gipper Brandon 2015 Assessing the Effects of Disclosing Management Compensation Working
Paper University of Chicago
Gormley Todd David Matsa and Todd Milbourn 2013 CEO compensation and corporate risk
evidence from a natural experiment Journal of Accounting and Economics 56 79-101
Graham John Michelle Hanlon and Terry Shevlin 2011 Real effects of accounting rules
evidence from multinational firmsrsquo investment locations and profit repatriation decisions
Journal of Accounting Research 49 137-185
Graham John Campbell Harvey and Shiva Rajgopal 2005 The Economic implications of
corporate financial reporting Journal of Accounting and Economics 40 3-73
Greenspan Alan 2002 Testimony of Alan Greenspan before the Committee on Banking
Housing and Urban Affairs US Senate July 16 Washington DC Government Printing
Office
Grullon Gustavo and Roni Michaely 2002 Dividends Share Repurchases and the Substitution
Hypothesis Journal of Finance 57 1649-1684
Hail Luzi Ahmed Tahoun and Clare Wang 2014 Dividend Payouts and Information Shocks
Journal of Accounting Research 52 403-456
Hall Brian J and Kevin J Murphy 2002 Stock options for undiversified executives Journal of
Accounting amp Economics 33 3-42
39
Hall Brian J and Kevin J Murphy 2003 The trouble with stock options Journal of Economic
Perspectives 17 49ndash70
Hanlon Michelle and Jeffrey L Hoopes 2014 What do firms do when dividend tax rates change
An examination of alternative payout responses Journal of Financial Economics 114 105-
124
Hayes Rachel M Michael Lemmon and Mingming Qiu 2012 Stock options and managerial
incentives for risk taking Evidence from FAS123R Journal of Financial Economics 105
174ndash190
Heron Randall A Erik Lie 2007 Does backdating explain the stock price pattern around
executive stock option grants Journal of Financial Economics 83 271-295
Hribar Paul Nicole Thorne Jenkins and W Bruce Johnson 2006 Stock repurchases as an
earnings management device Journal of Accounting and Economics 41 3ndash27
Jensen Michael C 1986 Agency cost of free cash flow corporate finance and takeovers
American Economic Review 76 323-329
Jolls Christine 1998 Stock repurchases and incentive compensation NBER Working Paper No
w6467
Jung Boochun Woo-Jong Lee and Yanhua Sunny Yang 2016 The Impact of Dividend
Covenants on Investment and Operating Performance Journal of Business Finance amp
Accounting 43 414ndash447
Kahle Kathleen M 2002 When a buyback isnrsquot a buyback open market repurchases and
employee options Journal of Financial Economics 63 235ndash261
Lambert Richard A William N Lanen and David F Larcker 1989 Executive stock option plans
and corporate dividend policy Journal of Financial and Quantitative Analysis 24 409ndash425
Lintner John 1956 Distribution of incomes of corporations among dividends retained earnings
and taxes The American Economic Review 46 97-113
Low Angie 2009 Managerial risk-taking behavior and equity-based compensation Journal of
Financial Economics 92 470-490
Miller Merton H and Franco Modigliani 1961 Dividend policy growth and the valuation of
shares The Journal of Business 34 411ndash433
Minnick Kristina and Leonard Rosenthal 2015 Stealth compensation Do CEOs increase their
pay by influencing dividend policy Journal of Corporate Finance 25 435-454
40
Murphy Kevin J 1999 Executive compensation In O Ashenfelter and D Card (eds) North
Holland Handbook of Labor Economics Amsterdam Elsevier Science BV
Murphy Kevin J 2013 Executive compensation Where we are and how we got there Handbook
of the Economics of Finance Elsevier Science North Holland 211-356
Nikolaev Valeri 2010 Debt Covenants and Accounting Conservatism Journal of Accounting
Research 48 143-176
Puri Manju Joumlrg Rocholl and Sascha Steffen 2011 Global retail lending in the aftermath of the
US financial crisis Distinguishing between supply and demand effects Journal of Financial
Economics 100 556-578
Shue Kelly and Richard R Townsend 2014 Swinging for the fences Executive reactions to
quasi-random option grants Working Paper University of Chicago
Skinner Douglas J 2008 The evolving relation between earnings dividends and stock
repurchases Journal of Financial Economics 87 582-609
Weisbenner Scott J 2000 Corporate share repurchases in the 1990s What role do stock options
play FEDS Working Paper No 2000-29
Zhang Dan 2013 CEO dividend protection Working Paper BI Norwegian Business School
41
Figure 1 Trends of dividends and repurchases from 2003 to 2007 Panel A plots the average
Regular DividendTotal Assets of firms in the highest and lowest quartiles of Accounting Impact
measured in 2002 Panel B shows the average Total RepurchaseTotal Assets of firms in the
highest and lowest quartiles of Accounting Impact measured in 2002
Panel A Trends of regular dividends
Panel B Trends of total repurchases
00
05
10
15
20
2003 2004 2005 2006 2007
Regular DividendTotal Assets
Lowest Acc Impact
Highest Acc Impact
Pre Post
00
20
40
60
80
100
2003 2004 2005 2006 2007
Total Repurchase Total Assets
Lowest Acc Impact
Highest Acc Impact
Pre Post
42
Table 1
Summary Statistics
Panel A Firm characteristics - full sample
N Mean Std dev 25 pctl Median 75 pctl
Accounting impact (2002) 1176 173 366 022 052 163
Payout variablesRegular dividendTotal assets 5653 093 148 000 000 142
RepurchaseTotal assets 5653 394 710 000 035 500
Total payoutTotal assets 5653 488 748 000 175 666
Regular dividendTotal payout 4091 3874 4057 000 2237 8833
Level of executive compensation (in $1000)
Salary_$ 5653 450 190 314 409 544
Bonus_$ 5653 476 616 122 295 586
Option grant_$ 5653 791 1137 62 384 1002
Restricted stock grant_$ 5653 458 866 0 58 518
Total pay_$ 5653 2481 2475 890 1647 3074
Percentage of executive compensation
Salary_ 5653 296 183 165 251 382
Bonus_ 5653 197 148 97 177 268
Option grant_ 5653 283 235 67 256 445
Restricted stock grant_ 5653 141 180 00 41 249
Control variables
Size ($M) 5653 11086 27294 1017 2459 8117
Log(size) 5653 7985 1565 6925 7808 9002
Book-to-market 5653 0445 0287 0251 0388 0578
Leverage 5653 0202 0172 0038 0187 0309
Asset tangibility 5653 0806 0184 0691 0853 0965
Free cash flow 5653 0059 0091 0013 0059 0108
Cash holding 5653 0166 0172 0034 0100 0247
ROA volatility 5653 0056 0056 0021 0038 0070
Institutional ownership 5653 0753 0202 0639 0795 0910
Sales growth 5653 0121 0189 0028 0096 0183
Past stock return 5653 0094 0183 -0012 0094 0199
Loss indicator 5653 0164 0370 0000 0000 0000
This table presents summary statistics Panel A shows the descriptive statistics of payout variables compensation
variables and other firm characteristics for the full sample Accounting impact is the implied option expense
measured at fiscal year 2002 All other variables are measured at firm-year level from fiscal year 2003 to 2007
resulting in 5653 firm-year observations (except for Regular dividendTotal Payout which can be measured only
for the 4901 firm-year observations with Total payout greater than zero) Panel B shows the pairwise correlations
between main variables at firm-year level Panel C compares payout variables compensation variables and other
firm characteristics before and after FAS123R The Pre-FAS123R period consists of fiscal year 2003 and 2004
the Post-FAS123R period covers fiscal year 2005-2007 Panel D compares the trends of payout and compensation
variables around FAS123R across four quartile groups ranked by 2002 accounting impact Panel E compares the
trends of payout and compensation variables around FAS123R between the treated and control group under the
alternative treatment definition in Bakke et al (2015) (see Section 22) All variables are defined in Appendix The
notation and in Panel C indicates statistically significant at 10 5 and 1 level in T-tests for equal
means respectively
43
Pa
nel
B
Pea
rso
n c
orr
ela
tio
ns
Reg div
Repurchase
Total payout
Salary_
Bonus_
Option_
RS_
Log(size)
BM
Leverage
Tangibility
FCF
Cash holdingROA vol
Inst own
Sales growth
Past ret
urn
Loss
Reg
div
10
0
Repurc
hase
01
610
0
Tota
l payout
03
509
810
0
Sala
ry_
-0
10
-01
8-0
19
10
0
Bonus_
00
700
100
3-0
01
10
0
Option_
-0
10
00
900
6-0
41
-03
510
0
RS
_
01
000
901
0-0
32
-01
1-0
40
10
0
Log(s
ize)
03
101
802
3-0
56
01
101
202
210
0
BM
-02
1-0
28
-03
103
0-0
03
-02
000
0-0
33
10
0
Levera
ge
-00
1-0
08
-00
8-0
05
00
6-0
11
00
801
9-0
03
10
0
Tangib
ility
00
200
100
101
200
1-0
05
-00
6-0
12
-00
4-0
18
10
0
FC
F02
203
703
9-0
20
00
901
1-0
01
02
4-0
32
-02
1-0
16
10
0
Cash
hold
ing
-01
301
000
700
2-0
14
02
2-0
10
-02
3-0
16
-03
502
901
210
0
RO
A v
ol
-01
5-0
04
-00
700
4-0
11
01
9-0
11
-02
3-0
08
-01
101
2-0
02
03
910
0
Inst
ow
n
-00
901
401
1-0
17
00
200
701
200
7-0
01
00
3-0
08
01
4-0
06
-01
110
0
Sale
s gro
wth
-00
8-0
04
-00
6-0
15
00
501
0-0
02
00
7-0
16
-00
3-0
08
01
300
201
400
410
0
Past
retu
rn00
901
301
4-0
18
01
5-0
01
00
301
6-0
29
-01
000
102
7-0
14
-01
001
602
710
0
Loss
-02
0-0
19
-02
201
8-0
18
00
4-0
05
-02
601
901
300
6-0
41
01
702
3-0
16
-01
8-0
40
10
0
44
Panel C Firm characteristics - before and after FAS123R
Pre FAS 123R Post FAS 123R Difference
Payout variables
Regular dividendTotal assets 083 099 016
RepurchaseTotal assets 245 490 245
Total payoutTotal assets 328 589 261
Regular dividendTotal payout 3914 2790 -1124
Level of executive compensation (in $1000)
Salary_$ 426 463 37
Bonus_$ 418 505 87
Option grant_$ 896 707 -191
Restricted stock grant_$ 269 574 305
Total pay_$ 2263 2584 321
Percentage of executive compensation
Salary_ 305 293 -12
Bonus_ 186 204 18
Option grant_ 343 240 -103
Restricted stock grant_ 87 176 89
Control variables
Size ($M) 9671 11631 1960
Log(size) 7860 8035 0175
Book-to-market 0437 0453 0016
Leverage 0201 0203 0002
Asset tangibility 0822 0793 -0029
Free cash flow 0061 0057 -0004
Cash holding 0175 0159 -0016
ROA volatility 0067 0048 -0019
Institutional ownership 0712 0781 0069
Sales growth 0137 0108 -0029
Past stock return 0080 0101 0021
Loss indicator 0173 0159 -0014
45
Pa
nel
D
Fir
m c
ha
racte
rist
ics
by q
ua
rtil
e o
f a
cco
un
tin
g i
mp
act
- b
efo
re a
nd
aft
er
FA
S1
23
R
Accounting im
pact
(2002)
Num
ber
of
Fir
ms
Pre
Post
Pre
Post
Pre
Post
Pre
Post
Payout
vari
able
s
Regula
r div
idendT
ota
l ass
ets
11
2
12
4
09
4
11
1
09
5
11
3
03
0
04
9
Repurc
hase
Tota
l ass
ets
11
3
26
8
19
2
37
3
32
7
63
1
35
1
68
7
Tota
l payout
Tota
l ass
ets
22
4
39
1
28
5
48
4
42
2
74
4
38
1
73
6
Regula
r div
idendT
ota
l payout
643
7
469
8
474
0
341
1
284
5
195
4
82
5
74
5
Perc
enta
ge o
f executive c
om
pensa
tion
Sala
ry_
337
295
313
287
296
289
276
300
Bonus_
223
226
214
228
172
192
134
169
Option g
rant_
201
167
290
210
373
260
507
325
Rest
ricte
d s
tock g
rant_
116
194
98
180
89
176
43
155
294
294
294
294
1st Q
uart
ile2
nd Q
uart
ile3
rd Q
uart
ile4
th Q
uart
ile
01
2
03
5
09
3
55
1
46
Accounting impact
Number of Firms
By accounting impact quartile
1
2
3
4
Pre Post Pre Post
Payout variables
Regular dividendTotal assets 09 11 08 10
RepurchaseTotal assets 18 31 26 52
Total payoutTotal assets 28 43 34 62
Regular dividendTotal payout 428 357 386 265
Percentage of executive compensation
Salary_ 435 364 282 280
Bonus_ 226 214 179 202
Option grant_ 92 125 387 261
Restricted stock grant_ 125 188 80 174
Percentage of CEO compensation
Salary_(CEO) 485 364 260 259
Bonus_(CEO) 249 228 185 219
Option grant_(CEO) 10 127 406 275
Restricted stock grant_(CEO) 128 182 82 183
Panel E Firm characteristics by alternative treatment definition - before and
after FAS123R
Treated
25
19
997
223
250
256
268
10
177
71
Control
44
37
47
Table 2
Differential effect of FAS123R on the use of option-based compensation
Panel A Two-period first-difference regression
Prediction Coeff t-stat Coeff t-stat Coeff t-stat
Accounting impact rank - -0044 -628
Accounting impact rank=2 - -0044 -327
Accounting impact rank=3 - -0075 -468
Accounting impact rank=4 - -0140 -613
Treated - -0132 -875
ΔLog(size) 0061 202 0061 200 0063 214
ΔBook-to-market 0032 091 0032 092 0051 143
ΔLeverage -0157 -213 -0160 -218 -0111 -153
ΔAsset tangibility -0012 -014 -0020 -023 -0023 -026
ΔFree cash flow -0106 -095 -0108 -097 -0128 -117
ΔCash holding -0197 -211 -0193 -206 -0180 -194
ΔFive-year ROA volatility -0065 -031 -0056 -026 -0098 -047
ΔInstitutional ownership -0044 -091 -0043 -088 -0044 -092
ΔSales growth -0064 -102 -0065 -104 -0090 -153
ΔPast one-year stock return 0051 078 0052 080 0091 138
ΔLoss frequency 0056 207 0057 207 0047 179
Log(size) -0009 -210 -0009 -207 -0002 -035
Book-to-market -0015 -056 -0013 -049 0018 072
Leverage 0022 046 0023 048 0068 150
Asset tangibility 0033 077 0033 078 0053 128
Free cash flow 0227 202 0220 195 0127 117
Cash holding -0002 -004 0012 019 -0078 -141
Five-year ROA volatility -0451 -240 -0430 -228 -0509 -283
Institutional ownership -0123 -360 -0122 -359 -0100 -292
Sales growth -0041 -056 -0040 -055 -0089 -125
Past one-year stock return -0009 -015 -0006 -010 0078 125
Loss frequency 0055 174 0056 178 0054 173
Fixed effect
Standard error
Adj R-squared
Observations
Model (3)
Dependent variable ΔAvg Option grantTotal pay
Huber-White
0156
This table investigates whether the effect of FAS123R on the use of option-based pay varies with its potential accounting impact Panel A
reports the results of estimating three two-period first-differencing models where for each firm we average its characteristics in Pre- and
Post-FAS123R period The Pre-FAS123R period consists of fiscal year 2003 and 2004 the Post-FAS123R period covers fiscal year 2005-
2007 In all three specifications the dependent variable is the change of average Option grantTotal pay from Pre- to Post-FAS123R period
The main independent variable varies by model in Model (1) the Accounting impact rank is the quartile rank of implied option expensetotal
assets measured in 2002 (1=lowest 4=highest) In Model (2) Accounting impact rank=2 (3 4) is an indicator that takes value of one if the
firmrsquos Accounting impact rank equals 2 (3 4) In Model (3) we use an alternative treatment construction following Bakke et al (2015)
where Treated is an indicator that takes value of zero if the firm granted zero option to its CEO in both 2003 and 2004 or the firm began to
voluntarily expense option-based pay at fair value in 2002 or earlier and one otherwise For each control variable we include both its level in
the Pre-FAS123R period and its change across the two periods Panel B shows the results of estimating fixed effect models with firm-year
observations The dependent variable is the firm-year level Option grantTotal pay The main independent variables are the interactions of
Post-FAS123R indicator (Post) with Accounting Impact rank Accounting impact rank indicators and Treated respectively All models in
Penal A have industry fixed effects and the standard errors are Huber-White heteroscedasticity-consistent standard errors All models in
Penal B have firm fixed effects and year fixed effects and the standard errors are clustered at firm level All variables are defined in
Appendix The notation and indicates statistically significant at 10 5 and 1 level respectively
Model (1) Model (2)
11711171 1171
Industry Industry
Huber-White
0124
Huber-White
0123
Industry
48
Panel B Panel fixed effects regression
Prediction Coeff t-stat Coeff t-stat Coeff t-stat
Acc impact rank x Post - -0044 -807
Acc impact rank 2 x Post - -0046 -333
Acc impact rank 3 x Post - -0077 -526
Acc impact rank 4 x Post - -0137 -776
Treated x Post - -0145 -970
Log(size) 0034 221 0034 217 0036 229
Book-to-market 0018 084 0017 083 0015 070
Leverage -0004 -009 -0006 -013 -0007 -015
Asset tangibility 0007 012 0004 006 0011 018
Free cash flow -0074 -151 -0072 -146 -0078 -158
Cash holding -0048 -086 -0050 -090 -0006 -011
Five-year ROA volatility 0250 231 0239 219 0437 414
Institutional ownership 0043 159 0044 161 0041 150
Sales growth -0033 -168 -0034 -171 -0031 -158
Past one-year stock return 0067 221 0068 224 0063 204
Loss indicator 0023 209 0022 207 0024 222
Fixed effects
Standard error
Adj R-squared
Observations
Dependent variable Option grantTotal pay
5653 5653 5653
Clustered by firm
Firm Year
Clustered by firm
Firm Year
Clustered by firm
0523 0523 0526
Model (1) Model (2) Model (3)
Firm Year
49
Table 3
Effect of option-based compensation on dividend policy
Panel A Two-period first-difference regression
Prediction Coeff t-stat Coeff t-stat Coeff t-stat
Accounting impact rank + 0000 077
Accounting impact rank=2 + 0001 091
Accounting impact rank=3 + 0000 044
Accounting impact rank=4 + 0001 092
Treated + 0000 -026
ΔLog(size) 0000 -030 0000 -030 0000 -026
ΔBook-to-market -0002 -190 -0002 -193 -0002 -195
ΔLeverage -0002 -059 -0002 -057 -0002 -059
ΔAsset tangibility 0016 431 0016 429 0016 430
ΔFree cash flow 0017 373 0017 373 0017 375
ΔCash holding -0011 -288 -0011 -285 -0010 -282
ΔFive-year ROA volatility 0003 034 0002 032 0003 035
ΔInstitutional ownership -0002 -073 -0002 -073 -0002 -070
ΔSales growth -0001 -040 -0001 -037 -0001 -038
ΔPast one-year stock return 0002 077 0002 076 0002 070
ΔLoss frequency 0000 -048 0000 -045 0000 -046
Log(size) 0000 183 0000 182 0000 182
Book-to-market -0002 -227 -0002 -225 -0002 -284
Leverage -0001 -037 -0001 -039 -0001 -048
Asset tangibility 0003 179 0003 180 0003 176
Free cash flow 0017 291 0017 291 0017 300
Cash holding 0002 080 0002 077 0002 098
Five-year ROA volatility 0003 035 0002 033 0003 044
Institutional ownership -0001 -068 -0001 -068 -0001 -058
Sales growth -0004 -177 -0004 -175 -0004 -172
Past one-year stock return 0004 169 0004 167 0004 165
Loss frequency -0001 -111 -0001 -109 -0001 -102
Fixed effect
Standard error
Adj R-squared
Observations
Dependent variable ΔAvg Regular dividendTotal assets
This table investigates the causal effect of option-based pay on dividend policy by examining whether changes in dividend policy around
FAS123R vary with its potential accounting impact Panel A reports the results of estimating three two-period first-differencing models
where for each firm we average its characteristics in Pre- and Post-FAS123R period In all three specifications the dependent variable is
the change of average Regular dividendTotal assets from Pre- to Post-FAS123R period The main independent variable varies by model in
Model (1) the Accounting impact rank is the quartile rank of implied option expensetotal assets measured in 2002 (1=lowest 4=highest) In
Model (2) Accounting impact rank=2 (3 4) is an indicator that takes value of one if the firmrsquos Accounting impact rank equals 2 (3 4) In
Model (3) we use an alternative treatment construction following Bakke et al (2015) where Treated is an indicator that takes value of zero
if the firm granted zero option to its CEO in both 2003 and 2004 or the firm began to voluntarily expense option-based pay at fair value in
2002 or earlier and one otherwise For each control variable we include both its level in the Pre-FAS123R period and its change across the
two periods Panel B shows the results of estimating fixed effect models with firm-year observations The dependent variable is the firm-
year level Regular dividendTotal assets The main independent variables are the interactions of Post-FAS123R indicator (Post) with
Accounting Impact rank Accounting impact rank indicators and Treated respectively Panel C examines the intensity of dividend changes
among firms with nonzero dividend per share in 2003 or 2004 In particular we estimates the same three models as in Panel A(with the
same independent variables) but for five dependent variables the change of average Regular dividendTotal assets from Pre- to Post-
FAS123R period (as in Panel A) the percentage change of DPS (dividend per share) from Pre- to Post-FAS123R period and three
indicators denoting respectively whether the percentage change of DPS was greater than 20 40 and 60 Panel D reports four
robustness tests of the dividend intensity regression In each of them a set of possible confounding observations is removed (see Section 33
for details) Panel E compares the trends of dividend initiation and termination around FAS123R across four quartile groups ranked by
accounting impact All models in Panel A C and D have industry fixed effects and the standard errors are Huber-White heteroscedasticity-
consistent standard errors All models in Penal B have firm fixed effects and year fixed effects and the standard errors are clustered at
firm level All variables are defined in Appendix The notation and indicates statistically significant at 10 5 and 1 level
Industry Industry Industry
Model (1) Model (2) Model (3)
1171 1171 1171
Huber-White Huber-White Huber-White
0105 0104 0105
50
Panel B Panel fixed effects regression
Prediction Coeff t-stat Coeff t-stat Coeff t-stat
Acc impact rank x Post + 0000 122
Acc impact rank 2 x Post + 0001 110
Acc impact rank 3 x Post + 0001 094
Acc impact rank 4 x Post + 0001 129
Treated x Post + 0000 -012
Log(size) 0001 179 0001 179 0001 181
Book-to-market 0000 025 0000 024 0000 031
Leverage 0001 062 0001 064 0001 069
Asset tangibility 0009 360 0009 358 0009 363
Free cash flow 0002 090 0002 093 0002 092
Cash holding -0007 -295 -0007 -298 -0007 -298
Five-year ROA volatility 0001 041 0001 038 0000 -006
Institutional ownership 0000 -027 0000 -026 0000 -027
Sales growth 0000 053 0000 051 0000 044
Past one-year stock return 0001 089 0001 088 0001 078
Loss indicator 0000 -060 0000 -057 0000 -076
Fixed effects
Standard error
Adj R-squared
Observations
Dependent variable Regular dividendTotal assets
Model (1) Model (2) Model (3)
Firm Year Firm Year Firm Year
5653 5653 5653
Clustered by firm Clustered by firm Clustered by firm
0877 0877 0877
51
Panel C Intensity of dividend changes around FAS123R
Prediction Coeff t-stat Coeff t-stat Coeff t-stat
Accounting impact rank + 0000 065
Accounting impact rank=2 + 0000 048
Accounting impact rank=3 + 0000 026
Accounting impact rank=4 + 0002 080
Treated + 0001 063
Dependent var DPS pct change
Accounting impact rank + -0145 -072
Accounting impact rank=2 + 0018 006
Accounting impact rank=3 + -0177 -045
Accounting impact rank=4 + -0746 -100
Treated + -0407 -119
Accounting impact rank + 0029 095
Accounting impact rank=2 + 0040 074
Accounting impact rank=3 + 0092 139
Accounting impact rank=4 + 0008 007
Treated + -0007 -012
Accounting impact rank + 0024 076
Accounting impact rank=2 + 0047 088
Accounting impact rank=3 + 0079 114
Accounting impact rank=4 + -0003 -002
Treated + 0030 052
Accounting impact rank + 0030 098
Accounting impact rank=2 + 0078 155
Accounting impact rank=3 + 0085 130
Accounting impact rank=4 + 0014 012
Treated + -0006 -011
Control variables
Fixed effect
Standard error
Observations 572 572 572
Yes Yes Yes
Huber-White Huber-White Huber-White
Industry Industry Industry
Dependent var DPS pct
change gt60 indicator
Model (1) Model (2) Model (3)
Dependent var ΔAvg Regular
dividendAssets
Dependent var DPS pct
change gt20 indicator
Dependent var DPS pct
change gt40 indicator
52
Panel D Robustness tests for intensity of dividend changes around FAS123R
Prediction Coeff t-stat Coeff t-stat Coeff t-stat
Accounting impact rank + 0006 017
Accounting impact rank=2 + 0067 118
Accounting impact rank=3 + 0041 057
Accounting impact rank=4 + -0061 -049
Treated + 0022 035Observations
Accounting impact rank + 0009 027
Accounting impact rank=2 + 0058 106
Accounting impact rank=3 + 0032 043
Accounting impact rank=4 + -0032 -024
Treated + 0018 028
Observations
Accounting impact rank + 0030 089
Accounting impact rank=2 + 0039 071
Accounting impact rank=3 + 0122 168
Accounting impact rank=4 + -0063 -052
Treated + 0075 132
Observations
Accounting impact rank + 0008 023
Accounting impact rank=2 + 0023 042
Accounting impact rank=3 + 0048 064
Accounting impact rank=4 + -0042 -033
Treated + -0010 -016
Observations
Control variables
Fixed effect
Standard error
Exclude firms with stable
payout ratio from 2003 to 2004
506 506 506
Dependent variable DPS pct change gt40 indicator
Model (1) Model (2) Model (3)
Exclude voluntary expensers
519 519
Exclude firms in the top decile
of option reduction (02-04)
Exclude firms that accelerated
option vesting
504 504 504
517 517 517
519
Huber-White Huber-White Huber-White
Yes Yes Yes
Industry Industry Industry
53
Panel E Dividend initiation and termination rates around FAS123R
Pre FAS 123R
1 280 75 7 6 13 173
2 284 135 18 9 27 200
3 286 181 11 14 25 138
4 282 260 9 10 19 73
Total 1132 651 45 39 84 129
Post FAS 123R
1 275 63 4 4 8 127
2 280 116 9 9 18 155
3 276 152 9 3 12 79
4 263 223 5 1 6 27
Total 1094 554 27 17 44 79
Pre FAS 123R
1 280 205 2 0 2 10
2 284 149 7 1 8 54
3 286 105 0 0 0 00
4 282 22 0 0 0 00
Total 1132 481 9 1 10 21
Post FAS 123R
1 275 212 3 6 9 42
2 280 164 1 2 3 18
3 276 124 1 1 2 16
4 263 40 0 3 3 75
Total 1094 540 5 12 17 31
termination
in 2004
03-04
cumulative
03-04
cumulative
Quartile firms
with
dividend in
2004
termination
in 2005
termination
in 2006
05-06
cumulative
05-06
cumulative
Termination
Quartile firms
with
dividend in
2002
termination
in 2003
without
dividend in
2004
initiation in
2003
initiation in
2004
03-04
cumulative
03-04
cumulative firmsQuartile
firmsQuartile initiation in
2005
initiation in
2006
05-06
cumulative
05-06
cumulative
Initiation
without
dividend in
2002
54
Table 4
Effect of option-based compensation on repurchases
Panel A Two-period first-difference regression with total repurchase
Prediction Coeff t-stat Coeff t-stat Coeff t-stat
Accounting impact rank - 0002 122
Accounting impact rank=2 - 0002 071
Accounting impact rank=3 - 0005 123
Accounting impact rank=4 - 0007 102
Treated - 0014 365
Control variables
Fixed effect
Standard error
Adj R-squared
Observations
Panel B Two-period first-difference regression with net repurchase
Prediction Coeff t-stat Coeff t-stat Coeff t-stat
Accounting impact rank - 0003 166
Accounting impact rank=2 - 0002 051
Accounting impact rank=3 - 0006 165
Accounting impact rank=4 - 0009 137
Treated - 0010 300
Control variables
Fixed effect
Standard error
Adj R-squared
Observations
Panel C Two-period first-difference regression with repurchase adjusted for exercised options
Prediction Coeff t-stat Coeff t-stat Coeff t-stat
Accounting impact rank - 0001 056
Accounting impact rank=2 - 0002 062
Accounting impact rank=3 - 0007 172
Accounting impact rank=4 - -0001 -008
Treated - 0006 197
Control variables
Fixed effect
Standard error
Adj R-squared
Observations
Dependent variable ΔAvg RepurchaseTotal assets
This table investigates the causal effect of option-based pay on payout policy by examining whether the changes of repurchase around
FAS123R vary with its potential accounting impact Panel A reports the results of estimating three two-period first-differencing models
where for each firm we average its characteristics in Pre- and Post-FAS123R period In all three specifications the dependent variable is
the change of average RepurchaseTotal assets from Pre- to Post-FAS123R period The main independent variable varies by model in
Model (1) the Accounting impact rank is the quartile rank of implied option expensetotal assets measured in 2002 (1=lowest 4=highest)
In Model (2) Accounting impact rank=2 (3 4) is an indicator that takes value of one if the firmrsquos Accounting impact rank equals 2 (3 4)
In Model (3) we use an alternative treatment construction following Bakke et al (2015) where Treated is an indicator that takes value of
zero if the firm granted zero option to its CEO in both 2003 and 2004 or the firm began to voluntarily expense option-based pay at fair
value in 2002 or earlier and one otherwise Panel B reports the regressions with the change of Net repurchaseTotal assets as the
dependent variable and the same independent variable as in Panel A Panel C reports the regressions with the change of Adjusted
repurchaseTotal assets as the dependent variable and the same independent variable as in Panel A All models in Panel A B and C have
industry fixed effects and the standard errors are Huber-White heteroscedasticity-consistent standard errors All variables are defined in
Appendix The notation and indicates statistically significant at 10 5 and 1 level respectively
Model (1) Model (2) Model (3)
Yes Yes Yes
Industry Industry Industry
Huber-White Huber-White Huber-White
Dependent variable ΔAvg Net repurchaseTotal assets
1171 1171 1171
0238 0237 0245
Model (1) Model (2) Model (3)
Yes Yes Yes
Industry Industry Industry
Huber-White Huber-White Huber-White
Dependent variable ΔAvg Adjusted repurchaseTotal assets
0229 0229 0233
1171 1171 1171
Model (1) Model (2) Model (3)
Yes Yes Yes
Industry Industry Industry
Huber-White Huber-White Huber-White
0111 0112 0114
1168 1168 1168
55
Table 5
Effect of option-based compensation on payout mix
Panel A Two-period first-difference regression with total payout mix
Prediction Coeff t-stat Coeff t-stat Coeff t-stat
Accounting impact rank + 0006 028
Accounting impact rank=2 + 0018 045
Accounting impact rank=3 + -0001 -001
Accounting impact rank=4 + 0043 052
Treated + -0035 -094
Control variables
Fixed effect
Standard error
Adj R-squared
Observations
Panel B Two-period first-difference regression with net payout mix
Prediction Coeff t-stat Coeff t-stat Coeff t-stat
Accounting impact rank + -0002 -008
Accounting impact rank=2 + 0008 016
Accounting impact rank=3 + 0018 034
Accounting impact rank=4 + -0059 -055
Treated + -0050 -101
Control variables
Fixed effect
Standard error
Adj R-squared
Observations
0049 0043 0054
257 257 257
Industry Industry Industry
Huber-White Huber-White Huber-White
Dependent variable ΔAvg Regular dividendNet payout
Model (1) Model (2) Model (3)
Yes Yes Yes
0154 0151 0156
362 362 362
Industry Industry Industry
Huber-White Huber-White Huber-White
This table investigates the causal effect of option-based pay on payout mix for firms using both dividend and repurchase by examining
whether the changes of payout mix around FAS123R vary with its potential accounting impact Panel A reports the results of estimating
three two-period first-differencing models where for each firm we average its characteristics in Pre- and Post-FAS123R period In all three
specifications the dependent variable is the change of average Regular dividendTotal payout from Pre- to Post-FAS123R period The main
independent variable varies by model in Model (1) the Accounting impact rank is the quartile rank of implied option expensetotal assets
measured in 2002 (1=lowest 4=highest) In Model (2) Accounting impact rank=2 (3 4) is an indicator that takes value of one if the firmrsquos
Accounting impact rank equals 2 (3 4) In Model (3) we use an alternative treatment construction following Bakke et al (2015) where
Treated is an indicator that takes value of zero if the firm granted zero option to its CEO in both 2003 and 2004 or the firm began to
voluntarily expense option-based pay at fair value in 2002 or earlier and one otherwise Panel B reports the regressions with the change of
Regular dividendNet payout as the dependent variable and the same independent variables as in Panel A Panel A (Panel B) is based on
observations with nonzero regular dividend and repurchase (net repurchase) in both Pre- and Post-FAS123R period All models in Panel A
and B have industry fixed effects and the standard errors are Huber-White heteroscedasticity-consistent standard errors All variables are
defined in Appendix The notation and indicates statistically significant at 10 5 and 1 level respectively
Yes Yes Yes
Dependent variable ΔAvg Regular dividendTotal payout
Model (1) Model (2) Model (3)

12
its quartile rank We also presents results with separate indicators for the top three quartiles in
order to better isolate the difference between top quartile (the most lsquotreatedrsquo group) and bottom
quartile (the least lsquotreatedrsquo group and thus closer to the notion of a control group)
An alternative way to address the issue of a lack of control group is suggested by Bakke et
al (2015) They argue that two sets of firms were likely lsquounaffectedrsquo by FAS123R (i) firms that
did not grant options to the CEO in 2003 and 2004 as in these firms FAS123R could not affect
CEO option pay and thus her incentives to make policy changes (ii) firms that were already
voluntarily expensing stock options as of 2002 (ie before FASB began discussions of the new
standard) as these firms would not face any additional accounting charge under FAS123R
Our approach offers a number of advantages First instead of collapsing all lsquonon-controlrsquo
firms in a single lsquotreatedrsquo group we exploit cross-sectional variation among treatment firms in
terms of the likely impact of FAS123R effectively using the most and least affected firms
(respectively top and bottom quartile of implied option expense) as treatment and control group
As shown in Table 1 the implied option expense is highly skewed (ie only a relatively small
number of firms was heavily affected by FAS123R) Capturing this variation is likely to increase
the power of the test Second in Bakke et al (2015) what matters is that the treatment definition
captures an accounting-driven change in CEO option grants as their focus is on CEO risk-taking
incentives In our setting we want to capture an accounting-driven change both in CEO option
grants (predicted to affect incentives to use dividends) and in the overall use of stock options
(predicted to affect the use of repurchases) As noted in Section 31 (see footnote 20) many firms
without CEO option grants in 2003 and 2004 were issuing options to non-CEO executives and
other employees and thus facing a potential accounting charge under FAS123R Third about half
of the firms without CEO option grants in 2003 and 2004 issued options to the CEO in the Post-
13
period Hence it is not clear that the control firms were truly unaffected by FAS123R Finally
the implied option expense in 2002 (our measure of the expected accounting impact) is a function
of option grants made in prior years when firms could not anticipate the adoption of FAS123R In
contrast option grant decisions in 2003 and 2004 may be affected by its anticipated adoption as
FASB added accounting for stock-based compensation to its agenda in March 2003
Notwithstanding the above arguments throughout our study we also present the results
using the definition of treatment and control in Bakke et al (2015) In particular we modify Eqs
(1) and (2) by replacing Accounting Impact with Treated an indicator equal to zero for the two
groups of firms identified as lsquocontrolrsquo in Bakke et al (2015) and one for all other firms
23 Payout Variables and Control Variables
Following Brown et al (2007) our baseline measure for changes in dividends is the change
in the DividendAssets ratiomdashcomputed as the regular cash dividends paid during the year scaled
by total assets at the beginning of the yearmdashfrom the Pre to the Post period15 However the
dividend-to-asset ratio is not what managers focus on when making dividend policy decisions
The stability of dividend per share (DPS) among dividend-paying firms (hereinafter payers)
suggests that managers do not target a specific dividend-to-assets ratio but rather a DPS level
(Baker and Wurgler 2016) Survey evidence confirms that executives make dividend policy
decision in terms of changes to the current level of DPS (Brav et al 2005) Therefore we also
examine the percentage change in the average DPS from the Pre to the Post period However this
measure can only be computed for the subset of payers (defined as firms with non-zero DPS in at
15 An alternative choice would be to scale dividends by the market value of equity essentially computing a dividend
yield However a drawback of using the dividend yield in our setting is that after controlling for time-invariant firm
characteristics through fixed effects or first differencing the variation of the ratio comes mainly from the denominator
the stock price (Baker and Wurgler 2004) Thus we choose the more stable book value of total assets as denominator
Also similar to other studies (eg Fenn and Liang 2001) we focus on regular dividends and exclude special dividends
as they are very rare and may introduce large noise to the dividend measures for few observations (DeAngelo
DeAngelo and Skinner 2000)
14
least one of the years of the Pre period) To provide insights into FAS123Rrsquos effect on dividend
policy for non-payers we examine the relation between our Accounting Impact variable and the
rate of dividend initations in the Pre and Post periods
Our main measure for repurchases is the change in RepurchaseAssetsmdashthat is the
aggregate amount of common stock repurchases made during the year scaled by total assets at the
beginning of the yearmdashfrom the Pre to the Post period In the empirical tests we examine
variations suggested in the literature
Finally as an alternative to examining dividends and repurchases separately we also look at a
measure of the payout composition the change in the DividendsTotal Payout ratio from the Pre to
the Post period (Total Payout is the sum of dividends and repurchases) effectively capturing any
substitution effect between dividends and repurchases 16 Examining the causal effect of the
change in option-based pay on payout composition is especially relevant if managers first target a
total payout and then choose the relative weight of dividends and repurchases In practice it is
unclear to what extent managers act this way (Brav et al 2005) Nonetheless for completeness we
also examine this variable We focus on the subsample of firms with both dividends and
repurchases in both Pre and Post period so as to capture changes in payout mix by firms routinely
using both vehicles to return cash to shareholders
As for the control variables in both Eqs (1) and (2) Controli is a vector of firm characteristics
identified in existent literature as determinants of payout policy (eg Fenn and Liang 2001 Brown
et al 2007 Skinner 2008 Cuny et al 2009) firm size book-to-market leverage asset tangibility
free cash flows cash holdings volatility in operating income institutional ownership sales
16 Fama and French (2001) suggest that repurchases are often complement to dividends while Grullon and Michaely
(2002) document that the increase in share repurchases over the past decades has come at the expense of a lower
increase in dividends consistent with a substitution hypothesis Brown et al (2007) also provide evidence of a
substitution effect in response to the 2003 dividend tax cut Survey evidence in Brav et al (2005) suggests an
asymmetric substitution effect with managers more willing to replace dividends with repurchases than the opposite
15
growth past stock returns and an indicator for loss firms For all of these variables we include
both changes from Pre to Post period and levels in the Pre period to allow for the possibility that
levels of these variables affect subsequent changes in payout policy 17 Finally we include
industry-fixed effects (Fama-French 48 industry indicators) to control for industry-level trends in
payout policies and option-based pay In unreported tests we replace free cash flows with two
separate variables operating profit and capital expenditures We also replace volatility in
operating income with volatility in stock returns Our results are unaffected More detailed
definitions of each variable are in the Appendix
24 Identification Assumption
The key identifying assumption underlying the difference-in-difference estimation
technique is that the parallel trends assumption is satisfied In the absence of treatment both
treated and control firms should experience parallel trends in the outcome variable Our approach
assumes that in the absence of FAS123R the change in dividends or repurchases would be the
same for high and low accounting impact firms Note that the well-documented contemporaneous
correlation between levels of option compensation (a key driver of the implied option expense and
thus the accounting impact) and levels of payout variables does not violate our identification
assumption This is because our assumption pertains to the relation between the level of option
compensation and future changes in payout variables
A specific concern is that options may be granted in anticipation of expected future
changes in payout policy (reverse causality problem) Relative to simple association tests this
concern is significantly reduced in our setting because the accounting impact is measured three
years prior to the arrival of treatment and is the result of option grants made over the prior four or
17 In untabulated analyses we run our tests after excluding changes in the control variables (ie including only their
pre-treatment levels) since in difference-in-difference studies controlling variables measured after the shock may
reintroduce selection bias Our inferences remain unchanged
16
five years depending on the vesting schedule18 For the reverse causality to be plausible the
implied option expense in 2002 (the result of option grants made approximately between 1998 and
2002) needs to reflect the anticipated change in payout policy in 2005-2007 This seems unlikely
While the parallel trend assumption is not directly testable similar to other studies (Bakke
et al 2015) we examine the trends in dividends and repurchases during the Pre period Figure 1
suggests that high and low accounting impact firms (respectively top and bottom quartile of
implied option expense) exhibit similar trends in payout variables in the Pre period ie from 2003
to 2004 More formally to examine the correlation between Accounting Impact and trends in the
payout variables during the Pre period we estimate the following regression only with
observations in 2003 and 2004
Payouti = γ0 + γ1 Accounting Impacti FY2004+ γ2 FY2004+ ΓControli +Firm FE +ui (3)
where Payouti is either DividendAssets or RepurchaseAssets FY2004 is an indicator of
fiscal year 2004 Firm FE indicates firm-fixed effects If firms with varying degrees of accounting
impact have different payout trends before the adoption of FAS123R γ1 should be different from
zero However for both payout variables we find that the estimated γ1 is close to zero and not
statistically significant at 10 level (untabulated tests) Overall the parallel trends assumption
seems reasonable in our setting
3 Empirical analyses
31 Sample Selection and Summary Statistics
Our sample is the SampP 1500 firms with available data on implied option expense (from
Compustat) and on executive compensation (from Execucomp) for at least one year in the Pre
18 The accounting treatment for stock options requires their fair value at the grant date to be recognized over the
service period (usually the vesting period) Hence the implied option expense in a given year includes a fraction of
the expense associated with past option grants
17
period and one year in the Post period to ensure consistency in the sample across periods Similar
to prior studies on payout policy (Fama and French 2001 Skinner 2008) we exclude financial
firms (SIC code between 6000 and 6999) and utilities (SIC between code 4900 and 4999) as well as
firms not incorporated in the US Our final sample includes 1176 firms19 We obtain dividend
and stock returns data from CRSP stock repurchases and dividend per share data from
COMPUSTAT and institutional ownership data from Thomson Reuters 13F database Other
control variables are from CRSP and COMPUSTAT To deal with outliers we winsorize all
continuous variables at 1 and 99 by fiscal year A detailed definition of all variables and their
sources is in Appendix
Table 1 Panel A presents summary statistics of the relevant variables for the pooled sample of
5653 firm-year observations Implied option expense in 2002 (our proxy for Accounting Impact)
is on average 173 of total assets with the median at 052 This suggests that the accounting
impact is very large for a small number of firms Over the entire sample period on average
dividends represent 093 of total assets while repurchases represent 394 Untabulated
analyses indicate that in 16 of the firm-year observations only dividends are paid out in 25
only repurchases in 32 both and in 27 neither Within the subset of firm-years with a payout
dividends represent 3874 of total payout This data confirms prior evidence that repurchases
have assumed the primary role as a vehicle to return cash to shareholders (eg Floyd et al 2015)
The mean (median) total executive pay (average across the top 5 executives) is $25 million ($16
million) On average option grants and restricted stock grants represent respectively 283 and
141 of total pay while salary and bonus comprise 296 and 197 respectively The
19 The results presented in the study are similar when (i) we restrict the sample to firms with available data for the
entire (2003-2007) sample period (1009 firms) and (ii) we exclude firms with CEO turnover in the Post period
(reducing the sample size to 780 firms) as a new CEO may have a different compensation package andor adopt a
different payout policy
18
composition of CEO pay (untabulated) is similar As for the control variables the figures are
generally consistent with other studies examining SampP 1500 firms over the same period
Panel B reports the pairwise Pearson correlations among the relevant variables The
correlations are in line with the associations documented in prior studies For example larger
firms and firms with higher profitability (free cash flows) have higher payouts loss firms have
lower payouts greater volatility in operating income is associated with lower dividends
More relevant to our analysis Panel C presents the mean of each variable in the Pre and Post
period for the full sample For each variable we first compute the firm-level mean over the Pre
and the Post Period and then compute the mean of the resulting figure across all firms There is a
striking increase in repurchases which double from 245 to 490 of total assets causing a
similar increase in total payout The increase in dividends is much smaller from 083 to 099
of total assets As a result for firms with positive payout dividends become a smaller fraction of
total payout in the Post period (2790 versus 3914 in the Pre period) This trend is consistent
with Floyd et al (2015) who document a dramatic increase in repurchases in the years leading to
the 2008 financial crisis Consistent with previous studies around FAS123R there is a significant
reduction in option grants as a fraction of total executive pay (from 343 to 240) and a
corresponding increase in the use of restricted stock (from 87 to 176) with little variation in
the weight of salary and bonus (note that restricted stock salary and bonus were expensed both
before and after FAS123R) Similar patterns hold for the composition of CEO pay (untabulated)
Compared to changes in the mix of executive pay changes in the levels of control variables are
generally less pronounced
Panel D reports the change in the key compensation and payout variables from the Pre to the
Post period by quartiles of implied option expense and yields a number of insights First
19
confirming the skewness suggested by Panel A the mean implied option expense is 551 for
firms in the top quartile versus only 093 035 and 012 for firms in the second third and
bottom quartile respectively Second as expected firms with higher implied option expense have
greater use of option-based pay For example in the Pre-period option pay represents 507 of
total executive pay at firms in the top quartile versus 201 in the bottom quartile Third and
more importantly for our research design the use of option pay changes significantly from the Pre
to the Post period as a function of the accounting impact For firms in the top quartile the
percentage of total pay represented by stock options drops by 182 (from 507 to 325)
versus 113 80 and 34 for firms in the second third and bottom quartile respectively The
decline in option usage across quartiles is accompanied by an increase in restricted stock grants
while the weight of salary and bonus shows little change It is important to emphasize the
substitution of stock options with restricted stocks because restricted stocks typically pay
dividends (Zhang 2013) thus providing further reason to expect a dividend increase in response to
the FAS123R-induced decline in option pay
As for the payout variables Panel D suggests that heavy option users (firms with higher
implied option expense) generally use repurchases more than dividends consistent with the
associations documented in earlier studies In the Pre period repurchases (dividends) represent
351 (030) of total assets for the top quartile versus 113 (112) for the bottom quartile
Panel D also indicates that the increase in repurchases documented in Panel C takes place across
all quartiles As for the (much smaller) change in dividends the absolute increase is similar across
the four quartiles though the relative increase (the percentage change) appears to be slightly
higher in the top quartile Overall these figures do not suggest a shift toward dividends and away
from repurchases by firms with a large (accounting-induced) decline in the use of option pay
20
Panel E presents the same data as Panel D but based on the definition of lsquotreatmentrsquo and
lsquocontrolrsquo in Bakke et al (2015) Under this definition 997 firms are classified as treatment group
and 177 as control (171 firms are classified as lsquocontrolrsquo because they did not grant options to the
CEO in the Pre period and 6 because they were voluntarily expensing options before 2003)
Interestingly lsquotreatedrsquo firms are equally distributed across the quartiles suggesting significant
variation in the degree of treatment As discussed earlier one benefit of our approach is that it
exploits cross-sectional variation among treatment firms in terms of the likely impact of FAS123R
Also 40 of the control firms (71 out of 177) are in the lowest quartile while 35 ((37+25)177)
are in the top two quartiles reflecting the different focus of the two approaches in terms of
identifying firms less affected by FAS123R20
As for payout and compensation variables Panel E shows that the treated group experiences a
larger increase in repurchases than the control group while the (less pronounced) increase in
dividends is similar across treated and control firms Treated firms experience a 126 decrease in
option pay (from 387 to 261) with a corresponding 94 increase in the weight of restricted
stock grants (from 80 to 174) The figures are similar at the CEO level (because the
classification is based on options grants to the CEO it is useful to report pay figures at both the top
5 executives and the CEO level) Interestingly the control group experiences a pronounced
increase in the weight of option grants in total CEO pay from 10 to 127 as almost half of the
control firms issued options to their CEOs in the Post period (for these firms options as percentage
of total CEO pay increased from 0 to 254 untabulated analysis) While this increased use of
stock options suggests (ex post) that these firms were not concerned with the impact of FAS123R
another possibility is that the lack of use of option compensation for CEOs in 2003 and 2004 was
20 In untabulated analysis we find that 55 of the 171 firms issuing no options to the CEO in the Pre period granted
options to the other top executives (and perhaps to other non-executive employees) thus explaining the relatively high
implied option expense for the control group (10 versus 19 for the treatment group ndash see Panel E)
21
temporary rather than the effect of a permanent policy If these firms were planning to issue
options to the CEO in the Post period the assumption that they were unaffected by FAS123R (and
thus their use as control sample) is questionable21
32 Differential Impact of FAS123R on the Use of Option-Based Compensation
An important building block of our approach is the presumed differential impact of FAS123R
on option-based pay as a function of pre-existing implied option expense22 While Table 1 Panel
D preliminarily supports the validity of this assumption we formally examine it by estimating Eq
(1)
As reported in Table 2 Panel A we find a significant negative association between Accounting
Impact and the change in option-based pay around the adoption of FAS123R In column (1)
where we use the quartile rank of implied option expense the -0044 coefficient implies that
around FAS123R option grants over total pay decline by 44 as we move from the highest
quartile to the next Thus the reduction in top quartile firms is 132 larger than in bottom
quartile firms In column 2 we replace the quartile rank with three indicators for the highest
quartiles (with the bottom quartile collapsed in the intercept) so as to be able to compare directly
top and bottom quartile without imposing the same effect across quartiles The negative and
significant coefficient on the top quartile indicator at -0140 suggests that the reduction in option
grants over total pay is 140 larger for top quartile firms relative to bottom quartile firms
Finally in column 3 we use the indicator for treated firms following Bakke et al (2015) The
21 Panel E also shows an increase in the use of restricted stock in CEO pay packages (from 128 to 182 almost
comparable to the increase among treated firms) The concurrent increase in options and restricted stock suggests
these firms would have increased option pay significantly more had it not been for FAS123R indicating further
caution in classifying them as control group of unaffected firms 22 This is akin to the relevance assumption of instrumental variable if we interpret the implied option expense as an
instrument to the change in option-based pay
22
negative and significant coefficient at -0132 suggests that treated firms experience a 132
larger drop in the weight of option pay relative to control firms
In Panel B we re-estimate Eq (1) using a panel regression with firm- and year-fixed effects
(5653 firm-year observations) where the dependent variable is the the ratio of option grants to
total executive pay The results are virtually identical in terms of significance and magnitude of
the coefficients of interest (the interaction terms between respectively Accounting impact and
Treated and an indicator for the Post period)
Overall Table 2 suggests that high implied option expense and the introduction of FAS123R
together strongly encouraged firms to cut back option-based compensation for executives It also
supports the general validity of the approach in Bakke et al (2015) in identifying firms most
affected by FAS123R notwithstanding the concerns outlined earlier
Our test of Eq (1) focuses on executive stock options For our dividend-protection hypothesis
it is important to establish that the level of implied option expense predicts a change in executive
stock options (rather than only a change in the use of non-executive employee stock options) as we
want to capture the effect of a change in executivesrsquo incentives on payout policy At the same
time our dilution channel hypothesis assumes a change in the use of all (executive and non-
executive employee) stock options Thus in untabulated analyses we repeat the test in Eq (1) by
replacing the dependent variable with the change in the number of options granted to all
employees (scaled by the total number of outstanding shares note for this analysis we can only
use data from 2004 to 2007 because Compustat began reporting data on ESO in 2004) The
coefficient on Accounting Impact and Treated continues to be negative and significant suggesting
that the differential reduction in the use of option compensation as a function of accounting impact
23
occurred for both executive and non-executive employee stock options Indeed Brown and Lee
(2011) report a similar decrease in executive and employee stock options around FAS123R
33 Option-Based Pay and Dividend Payouts
In this section we examine the effect of an exogenous (accounting-induced) change in option
compensation on dividend policy by estimating Equation (2)
Table 3 Panel A presents the results using the change in dividends from Pre to Post as
dependent variable We find no significant association between Accounting Impact (column 1 and
2) or Treated (column 3) and the change in dividends around the adoption of FAS123R This is in
stark contrast with the negative effect of option-based pay on dividends predicted in the literature
and documented in various association studies
One concern with this lack of effect is that perhaps our setting is not powerful enough to detect
it One way to examine this possibility is the following The coefficient on Accounting Impact
rank=4 in column 2 is 0001 and the standard error (SE) is 00009 Assuming the estimated
standard error is correct then for a two-tailed t test the coefficient needs to be greater than 00015
(=SE1645) or 015 to reach the 10 percent significant level In other words if moving from
the bottom to the top quartile (which predicts a 14 differential decline in option based pay as per
Table 2 Panel A) resulted in a 015 increase of the dividendasset ratio our test would be able to
detect a causal effect of option-based pay on dividends Given the unconditional mean of the
dividendasset ratio at 093 an increase of 015 from the Pre to the Post period seems
plausible In fact the average increase from the Pre to the Post period is 016 (Table 1 Panel C)
Thus if an effect was there our test should detect it
24
Panel B presents the results using a panel regression (5653 firm-year observations) with firm-
and year-fixed effects and interaction terms between Accounting Impact (or Treated) and an
indicator for the Post period Our inferences are unchanged
These analyses are based on our full sample which includes both dividend-paying and non-
dividend-paying firms Hence they implicity treat as equal two potentially different decisions to
initiate dividends and to increase dividends For example an increase in the dividend-to-asset
ratio from 05 to 06 will be treated the same as an increase from 00 to 01 even though
the latter represents a critical dividend initiation decision23 To address this following Chetty and
Saez (2005) we separately examine how FAS123R impacts the intensity of dividend changes (for
the subset of payers) and the likelihood of dividend initiations (for the subset of non-payers)
331 Option-Based Pay and Dividend Payouts Intensity of Dividend Changes
In the first row of Panel C we repeat the analysis in Panel A for the sub-sample of 572 payers
defined as firms with positive DPS in 2003 andor 2004 Note that we report only the coefficients
of interest for parsimony In the second row we replace the dependent variable with the
percentage change in DPS DPS is the choice variable for managers (Brav et al 2005 Baker and
Wurgler 2016) and thus our preferred measure to capture changes in dividend policy To account
for skewness in this variable (Khale 2002) in the third fourth and fifth rows we use indicator
variables to denote whether the change in DPS surpasses a threshold respectively 20 40 and
60 The proportion of firms that surpass these thresholds are 59 44 and 33 respectively24
23 Initiating dividends is a critical decision for boards given the pre-commitment value that investors attach to this
decision and the strong negative market reaction when firms eliminate or reduce dividends (Brav et al 2005) For
executives trying to maximize the value of their own stock options (dividend-protection argument) the ability to
influence a dividend initiation decision is likely lower than the ability to influence a dividend increase decision 24 Although in the third fourth and fifth rows our dependent variable is a binary variable we use a linear model (OLS)
instead of a probit or logit nonlinear model The reason is that estimating fixed effects in binary response models with
panel data can cause the incidental parameters problem The coefficient estimates can be biased when the panel data
25
Across all of these specifications we find no association between Accounting Impact or Treated
and the intensity of dividend changes Thus it does not appear that an exogenous reduction in
option-based pay caused dividend-paying firms to increase dividends
In Panel D we perform four robustness tests For parsimony we show only the coefficients of
interest and only the cases where the dependent variable is an indicator denoting a greater than
40 increase in DPS The results are similar for the other four ldquointensityrdquo dependent variables
reported in Panel C
In the first row we exclude firms that began to voluntarily expense options in 2003 or 2004
(84 firms of which 68 are dividend payers) FASB added accounting for stock-based
compensation to its agenda in March 2003 and issued an Exposure Draft proposing the expensing
of stock options at fair value in March 2004 In anticipation a number of firms began to
voluntarily expense stock options in 2003 and 2004 (Aboody et al 2004) If these firms reduced
option grants and as a result increased dividends during the Pre period then their inclusion may
reduce the power of our tests and thus our ability to detect the hypothesized relation25
In a similar spirit in the second row we exclude firms in the top decile in terms of reduction in
the ratio of option grants to total pay for the top 5 executives between 2002 (the year prior to the
Pre-period) and 2004 (the end of the Pre-period) This encompasses 113 firms of which 55 are
dividend payers If these firms reduced option grants in anticipation of FAS123R and as a result
increased dividends during the Pre period their inclusion may reduce our ability to detect the
hypothesized relation
has a large number of observations but a short time series Examples of studies making a similar choice are Puri
Rocholl and Steffen (2011) and Chu and Ma (2015) 25 This is unlikely to be a serious concern as previous studies suggest that voluntary expensers made limited use of
stock options (Aboody et al 2004) In fact in our sample 79 of these firms are in the bottom two quartiles of
implied option expense (untabulated) Nonetheless we present this test for robustness
26
In the third row we exclude firms that accelerated the vesting of options before FAS123R
became effective in order to avoid recognizing an expense for the unvested portion of these
options (Choudhary et al 2009 Balsam Reitenga and Yin 2008) This encompasses 196 firms of
which 54 are dividend payers If accelerating vesting was used to reduce the impact of FAS123R
the inclusion of these firms may reduce the power of our tests26
In the fourth row we deal with the concern that if firms target a fixed dividend to net income
ratio (Lintner 1956) and do so without adjusting for changes in accounting standards then by
decreasing net income (via option expense) the accounting change would mechanically cause a
reduction in dividends This would potentially offset and confound the increase predicted under
the dividend-protection and dilution hypotheses This seems unlikely for two reasons First firms
are notoriously reluctant to cut dividends (Brav et al 2005) Hence it seems unlikely that they
would reduce dividends in response to a decline in net income with no economic or cash flow
implications (ie re-classification of an expense from the footnotes to the income statement)
Second firms today set dividends in terms of dividend per share rather than by targeting a net
income-based payout ratio (Brav et al (2005)) As noted by Skinner (2008) over the last few
decades as earnings have become more variable the relation between earnings and dividends has
become weaker with dividend payments increasing smoothly and largely independent of the
variation in earnings Nevertheless in the fourth row we exclude the 66 dividend-paying firms that
26 These firms explicitly stated that they accelerated the vesting of stock options to avoid the accounting charge
(Choudhary et al 2009) In fact 72 are classified in the top two quartiles of implied option expense (untabulated)
Thus we would have predicted these firms to experience a significant decline in option pay To the extent that this
decline did not materialize because they minimized the impact of FAS123R by accelerating vesting the ability of
Accounting Impact to predict the reduction in option pay and thus its usefulness in examining changes in dividends
around FAS123R may be reduced The list of firms accelerating vesting was kindly provided by Jack Ciesielsky of
The Analystsrsquo Accounting Observer
27
had a similar payout ratio in 2003 and 2004 as a proxy for firms with a target net income-based
payout ratio in the Pre period27
As shown in Panel D even after excluding these subsets of firms we continue to find no
association between Accounting Impact or Treated and changes in dividends for dividend-paying
firms This is inconsistent with a causal influence of option compensation on dividend policy
Another concern is that by reducing net income and thus retained earnings FAS123R
may have pushed some firms closer to violating dividend covenants in debt contracts and
thus prevented them from increasing dividends This would bias our study against finding a
causal effect of option-based pay on dividends However this does not appear to be a
significant concern for three reasons First the recognition of an option expense does not
imply a decline in net income In fact more than 70 (75) of the full sample firms
(dividend payers) experienced an increase in net income before extraordinary items from
2004 to 2005 (the percentages are similar across the four quartiles of implied option
expense) Second dividend covenants are less common among dividend-paying firms
(Nikolaev 2010) Third most loan contracts in recent years give parties the option to
ldquofreezerdquo GAAP when facing a mandatory change in accounting principles (Christensen and
Nikolaev 2009) Firms expecting an adverse impact of FAS123R on their dividend covenants
would likely exercise this option (particularly given the non-cash nature of option-based
expense) Nonetheless to alleviate this concern we perform three additional analyses
(untabulated) (i) we repeat the tests in Panel C after excluding firms with a drop in net
income between 2004 and 2005 (ie firms that perhaps faced some covenant-related
27 We define a ldquosimilarrdquo payout to be an absolute change in payout ratio of less than 1 from 2003 to 2004 Among
these 66 firms only 39 continued to have a similar payout ratio in 2005 We also try an alternative definition where
a firm is classified as likely to be using a net income-based target payout ratio if the absolute percentage change in the
ratio from 2003 to 2004 is less than 10 (100 firms) Our inferences are unchanged
28
constrains to their payout policy as a result of FAS123R) (ii) we explicitly control for net
income and retained earnings in the regression (as in Skinner 2008) (iii) we repeat the tests
in Panel C for dividend payers with dividendsasset ratio above the sample median on the
basis that dividend covenants are less frequent among firms paying large dividends (Jung
Lee and Yang 2016) Our inferences are unchanged
332 Option-Based Pay and Dividend Payouts Dividend Initiations
In this section we examine whether the accounting-driven change in option pay affected
dividend initiations among non-payers We cannot employ the difference-in-difference approach
adopted so far by definition the same firm cannot initiate dividends in both periods However we
can provide suggestive evidence as follows First we take all firms that did not pay dividends in
2002 and group them into quartiles based on 2002 implied option expense For each quartile we
find the number of firms initiating dividends in 2003 and 2004 (the Pre period) Next we take all
firms that did not pay dividends in 2004 group them into quartiles based on 2002 implied option
expense and for each quartile find the number of firms initiating dividends in 2005 and 2006 (the
Post period) We do not include 2007 so as to have the same number of years in both periods and
make the cumulative initiation rates comparable
The left portion of Panel E reports the results of this exercise There is a general decrease in
the dividend initiation rate from the Pre to the Post period This holds both in the full sample of
non-payers (from 129 to 79) and across all quartiles This decrease may reflect a temporary
spike in 2003 and 2004 in response to the 2003 dividend tax cut documented in Chetty and Saez
(2005) It is noteworthy that initiation rates in both periods are lower among firms with higher
implied option expense This is consistent with option-heavy firms being mostly high-growth
firms less inclined to pay dividends More relevant to our research question if the lower use of
29
option compensation increased the propensity to pay dividends we would expect to see a relative
increase (ie a lower decrease) in dividend initiations among firms with the highest accounting
impact Instead the rate does not differ depending on the accounting impact There is
approximatley a 5 decline in initiation rate in each quartile In the right portion of Panel E we
examine similar data for dividend terminations While the results should be interpreted with
caution due to their rarity firms with higher accounting impact do not experience a greater decline
in termination rates Our inferences in Panel E are similar when we compared treated and control
firms following Bakke et al (2015) (untabulated)
Even after taking into account the different nature of decisions for dividend paying and non-
dividend-paying firms we fail to find evidence of a causal influence of option-based compensation
on dividend policy This finding is in contrast to the associations documented in earlier studies It
is even more remarkable as most firms replaced stock options with restricted stock which are
generally dividend-protected and should provide further incentive to increase dividends28
34 Option-Based Pay and Repurchases
In this section we examine the effect of an exogenous (accounting-induced) change in option
compensation on repurchases by estimating Equation (2)
Table 4 Panel A presents the results using the change in repurchases (scaled by total assets)
from Pre to Post as a dependent variable If the use of option-based pay had a positive effect on
firmsrsquo propensity to engage in repurchases as posited by the dividend-protection and dilution
hypotheses we should find a negative association between Accounting Impact or Treated and
repurchases Firms with a higher (accounting-driven) reduction in option-based pay should reduce
28 In a sample of SampP 500 firms between 2000 and 2009 Zhang (2013) reports that 80 of the firms granting
restricted stocks offer dividend protection In that sense the FAS123R-induced shift from stock options to restricted
stock may be characterized as a ldquoshockrdquo to dividend protection in unearned equity pay Accordingly our results cast
doubt on the causal interpretation of the positive association between dividend protection and dividend payouts
documented in prior studies (Zhang 2013 Burns et al 2015 Minnick and Rosenthal 2015)
30
the use of repurchases either because they are shifting toward a greater use of dividends andor
because they have a lower need to offset the dilutive effects of stock options However we find no
significant association between Accounting Impact (columns 1 and 2) and the change in
repurchases around the adoption of FAS123R When we use the Treated indicator (column 3) we
find a significant positive association rather than a negative one In Panel B we repeat the analysis
using net repurchases (ie repurchases after removing the effect of share issuances) following
Fama and French (2001) and Skinner (2008) Our inferences are unchanged29
This test is subject to two important caveats The first is we may not detect a decline in
repurchases because in the Post period firms need to offset the exercise of options that were
granted during the Pre period That is a post-FAS123R reduction in grants may not (yet) translate
into a reduction in exercises during the Post period which reduces our ability to test the dilution
hypothesis (ie that firms repurchase shares to offset exercises)30 However we can examine a
variation of this hypothesis where firms use repurchases to manage the effect of unexercised
options on diluted EPS (Bens et al 2003) To do so in Panel C we use a measure of adjusted
repurchases where we subtract our estimate of repurchases undertaken to offset the exercise of
ESO31 We effectively test whether firms experiencing an accounting-induced decrease in option
grants engage in less repurchases (net of exercise-driven repurchases) because their need to
manage the effect of unexercised options on diluted EPS is lower However the coefficient on
the variables of interest is either insignificant or positive inconsistent with the hypothesis
29 In the case of repurchases we do not examine separately ldquoinitiationsrdquo and ldquointensityrdquo as we do for dividends
because initiation is not clearly defined for repurchases Unlike dividends the occurrence of a repurchase in a given
year (or the lack thereof) cannot be used to infer a general policy due to the more discretionary nature of the timing of
repurchases 30 To capture the effect of lower option-based compensation on option exercises and thus on repurchases we would
ideally extend the Post period beyond 2007 However as noted by Floyd et al (2015) repurchases declined
dramatically after 2007 because of the financial crisis making it difficult to detect the effect of any other factor 31 As upper bound estimate of exercise-driven repurchases we multiply the number of ESO exercised during the year
times the average stock price during the year Since the number of ESO exercised is available in Compustat starting in
2004 Panel C is based on observations from 2004 to 2007
31
A second important caveat is that most firms replaced stock options with restricted stock
(Table 2 Panel C) Unvested restricted stock is excluded from the denominator in the computation
of basic EPS (once vested it is included) However it is included in the denominator of diluted
EPS using the treasury stock method similar to stock options Given the complexity of this
method without access to all details of restricted stock grants and option grants it is difficult to
determine whether the switch from stock options to restricted stock decreased the need for
dilution-driven repurchases as our test implicitly assumes Hence it is possible that we do not find
a decrease in repurchases because a reduced need to offset the dilutive effect of stock options was
neutralized by an increased need to offset the dilutive effect of restricted stock
Subject to the above caveats the evidence in Table 4 is not consistent with a positive causal
relation between the use of option-based pay and repurchases More precisely it suggests that
option-driven dilution concerns do not have a first-order effect on the magnitude of repurchases
even though they may play a role in the repurchase decision Hence our result is not necessarily
in conflict with the evidence in Brav et al (2005) where two-thirds of the surveyed financial
executives state that offsetting the dilutionary effect of stock option plans or other stock
programs is an important factor to their repurchase decisions
35 Option-Based Pay and Payout Composition
As an alternative to examining dividends and repurchases separately we also look at the
payout composition the change in the DividendsTotal Payout ratio from the Pre to the Post period
where Total Payout is the sum of dividends and repurchases As noted earlier we focus on the
subsample of firms with both dividends and repurchases in both Pre and Post periods so as to
capture the change in payout mix by firms routinely using both vehicles to return cash to
shareholders If the use of option-based pay causes firms to substitute repurchases for dividends
32
we should find a positive association between Accounting Impact or Treated and the payout mix
defined as DividendsTotal Payout ratio Firms with a higher accounting-driven reduction in
option-based pay should have an increase (decrease) in the relative weight of dividends
(repurchases) to the total payout However as reported in Table 5 Panel A we fail to find a
significant association between Accounting Impact (column 1 and 2) or Treated (column 3) and
the change in payout mix The results are similar when we use Net Payout (dividends plus net
repurchases) instead of Total Payout in computing the payout mix (Panel B)
Overall the combined evidence in Tables 3-5 does not support the hypothesis that option-
based compensation has negative (positive) effect on dividends (repurchases) or that it causes
firms to replace dividends with repurchases
4 Conclusion
Prior literature has documented robust associations between option-based compensation and
payout policy yet it remains unclear whether this association reflcts a causal influence We
investigate the causal effect of option-based compensation on payout policy using the adoption of
FAS123R which resulted in a significant decrease in option grants making it a plausible
exogenous shock to the use of option-based pay To overcome the challenge of no control group
we exploit the fact that firms responded differently depending on the firm-specific accounting
impact as measured by the implied option expense disclosed in the footnotes prior to FAS123R
Firms with larger expected accounting impact curtailed option-based compensation much more
aggressively than firms with lower impact Using a sample of SampP 1500 firms we find no
evidence that firms with a larger accounting-induced decline in option compensation increased
dividends reduced repurchases or changed their payout composition contrary to the widely held
belief that option-based pay has a causal influence on payout policy
33
Appendix Variable Definitions and Data Sources
Accounting Impact Variables
Accounting impact Implied option expense (Compustat XINTOPT) divided by total assets
(Compustat AT) This variable is measured at fiscal year 2002 and is time-invariant
Accounting impact rank The quartile rank of Accounting impact (1=lowest 4=highest)
Payout Variables
Regular dividendTotal assets The numerator is total regular cash dividends in the fiscal year
from the distribution dataset in CRSP Regular cash dividends are identified by the distribution
codes 1212 1222 1232 or 1242 The denominator is one-year lagged total assets (Compustat
AT)
DPS Dividend per share (Compustat DVPSX_F)
DPS pct change The percentage change of average DPS from Pre- to Post-FAS123R period
DPS pct change gtX indicator A dummy variable that equals one if DPC pct change is greater
than X and zero otherwise
RepurchaseTotal assets The numerator is the repurchase of common equity which equals total
repurchase (Compustat PRSTK) minus the change in preferred stock redemption value
(Compustat PSTKRV) The denominator is one-year lagged total assets (Compustat AT)
Net repurchaseTotal assets Net repurchase removes the effect of share issuances The
construction follows Fama and French (2001) and Skinner (2008) if the firm uses the treasury
stock method for repurchase net repurchase equals the increase in common treasury stock
(Compustat TSTKC) if the firm uses the retirement method (when common treasury stock is zero
in the current and prior year) net repurchase equals total repurchases minus stock issuance
(Compustat SSTK) and change in preferred stock redemption value (Compustat PSTKRV)
When the above measures give negative value net repurchase is set to zero
Adjusted repurchaseTotal assets Adjusted repurchase removes from total repurchase the potential
effect of repurchasing exercised options This variable equals total repurchase of common stocks
minus the product between the number of options exercised (Compustat OPTEXD) and average
stock price during the year When the above measure gives negative value adjusted repurchase is
set to zero Since the number of options exercised is not available before 2003 we drop
observations in 2003 when we use this variable
34
Total payoutTotal assets the sum of Regular dividendTotal assets and RepurchaseTotal assets
Regular dividendTotal payout regular cash dividend divided by the sum of regular cash dividend
and repurchase from common equity In the two-period analysis (Pre- vs Post-FAS123R) we
separately sum the numerator and the denominator for each firm-period and then calculate the ratio
Regular dividendNet payout regular dividend divided by the sum of regular dividend and net
repurchase In the two-period analysis (Pre- vs Post-FAS123R) we separately sum the numerator
and the denominator for each firm-period and then calculate the ratio
Compensation Variables
Salary_$ Average salary (Execucomp SALARY) of the top 5 highest paid executives in $1000
Salary_ Average salary (Execucomp SALARY) divided by average total pay (Execucomp
TDC1) of the top 5 highest paid executives
Bonus_$ Average bonus (Execucomp BONUS) of the top 5 highest paid executives in $1000
Due to a data format change we add non-equity plan-based awards (Execucomp
NON_EQ_TARG) to this measure after 2006
Bonus_ Bonus_$ divided by average total pay (Execucomp TDC1) of the top 5 highest paid
executives
Option grant_$ Average option grant value (Execucomp OPTION_AWARDS_BLK_VALUE or
OPTION_AWARDS_FV) of the top 5 highest paid executives in $1000 Due to a data format
change we use OPTION_AWARDS_FV for this measure after 2006
Option grant_ Option grant_$ divided by average total pay (Execucomp TDC1) of the top 5
highest paid executives
Restricted stock grant_$ Average restricted stock grant value (Execucomp RSTKGRNT or
STOCK_AWARDS_FV) of the top 5 highest paid executives in $1000 Due to data format
change we use STOCK_AWARDS_FV for this measure after 2006
Restricted stock grant_ Restricted stock grant_$ divided by average total pay (Execucomp
TDC1) of the top 5 highest paid executives
Total pay_$ Average total pay (Execucomp TDC1) of the top 5 highest paid executives in $1000
35
Other Characteristics
Size The book value of total assets (Compustat AT) minus the book value of common equity
(Compustat CEQ) plus the market value of common equity from CRSP in $M
Log(size) the natural logarithm of size
Book-to-market the book value of common equity dividend by its market value
Leverage long term debt plus short term debt (Compustat DLTT + DLC) divided by total assets
Asset tangibility tangible assets (Compustat AT - INTAN) divided by total assets
Free cash flow Operating cash flow (Compustat OANCF) minus capital expenditure (Compustat
CAPX) then divided by lagged total assets
Cash holding Cash and short-term investments (Compustat CHE) divided by total assets
ROA volatility the standard deviation of returns on assets (operating income before tax divided by
lagged total assets) in the past five fiscal years
Institutional ownership the number of shares held by institutional investors divided by the number
of shares outstanding from Thomson Reuters Institutional Holdings database
Sales growth the growth rate of sales (Compustat SALE) from the prior year
Past stock return annual stock return from the prior year
Loss indicator a dummy variable taking value of one if the current net income is negative and
zero otherwise
36
References
Aboody David 1996 Market Valuation of Employee Stock Options Journal of Accounting and
Economics 22 357-391
Aboody David Barth Mary E and Ron Kasznik 2004 Firms Voluntary Recognition of Stock-
Based Compensation Expense Journal of Accounting Research 42 123ndash150
Aboody David and Ron Kasznik 2008 Executive stock-based compensation and firmsrsquo cash
payout the role of shareholdersrsquo tax-related payout preferences Review of Accounting Studies
13 216ndash251
Anantharaman Divya and Yong Gyu Lee 2014 Managerial risk taking incentives and corporate
pension policy Journal of Financial Economics 111 328ndash351
Baker Malcolm and Jeffrey Wurgler 2004 A catering theory of dividends Journal of Finance
59 1125-1165
Baker Malcolm and Jeffrey Wurgler 2016 Dividends as reference points a behavioral signaling
approach Review of Financial Studies 29 697-738
Bakke Tor-Erik Hamed Mahmudi Chitru Fernando and Jesus Salas 2015 The causal effect of
option pay on corporate risk management Journal of Financial Economics forthcoming
Balsam Steven Austin Reitenga and Jennifer Yin 2008 Option acceleration in response to SFAS
No 123 (R) Accounting Horizons 22 23-45
Bens Daniel and Steven Monahan 2008 Altering Investment Decisions to Manage Financial
Reporting Outcomes Asset-Backed Commercial Paper Conduits and FIN 46 Journal of
Accounting Research 46 1017-1055
Bens Daniel A Venky Nagar Douglas J Skinner and MH Franco Wong 2003 Employee stock
options eps dilution and stock repurchases Journal of Accounting and Economics 36 51ndash90
Bertrand Marianne Esther Duflo and Sendhil Mullainathan 2004 How much should we trust
differences-in-differences estimates The Quarterly Journal of Economics 119 249ndash275
Blouin Jennifer L Jana S Raedy and Douglas A Shackelford 2011 Dividends Share
Repurchases and Tax Clienteles Evidence from the 2003 Reductions in Shareholder Taxes
The Accounting Review 86 887-914
Brav Alon John R Graham Campbell R Harvey and Roni Michaely 2005 Payout policy in the
21st century Journal of Financial Economics 77 483ndash527
Brown Lawrence D and Yen-Jung Lee 2011 Changes in Option-Based Compensation Around
the Issuance of SFAS123R Journal of Business Finance amp Accounting 38 1053ndash109
37
Brown Jeffrey R Nellie Liang and Scott Weisbenner 2007 Executive financial incentives and
payout policy Firm responses to the 2003 dividend tax cut Journal of Finance 62 1935ndash
1965
Burns Natasha Brian McTier and Kristina Minnick 2015 Equity-incentive compensation and
payout policy in Europe Journal of Corporate Finance 30 85-97
Carter Mary Ellen and Luann J Lynch 2003 The Consequences of the FASBrsquos 1998 Proposal on
Accounting for Stock Option Repricing Journal of Accounting and Economics 35 51-72
Carter Mary Ellen Luann J Lynch and Irem Tuna 2007 The role of accounting in the design of
CEO equity compensation The Accounting Review 82 327ndash357
Chava Sudheer and Amiyatosh Purnanandam 2010 CEOs versus CFOs Incentives and
corporate policies Journal of Financial Economics 97 263ndash278
Chetty Raj and Emmanuel Saez 2005 Dividend taxes and corporate behavior Evidence from the
2003 dividend tax cut The Quarterly Journal of Economics 120 791ndash833
Choudhary Preeti Shivaram Rajgopal and Mohan Venkatachalam 2009 Accelerated vesting of
employee stock options in anticipation of FAS123R Journal of Accounting Research 47 105ndash
146
Christensen Hans B and Valeri Nikolaev 2009 Contracting on Mandatory Changes to GAAP
New Practice and Its Determinants Working Paper University of Chicago
Chu Yongqiang and Tao Ma 2015 How does management compensation affect bank risk taking
evidence from FAS 123R University of South Carolina Working Paper
Cuny Charles J Gerald S Martin and John J Puthenpurackal 2009 Stock options and total
payout Journal of Financial and Quantitative Analysis 44 391ndash410
DeAngelo Harry Linda DeAngelo and Douglas J Skinner 2000 Special Dividends and the
Evolution of Dividend Signaling Journal of Financial Economics 57 309-354
Dechow Patricia M Amy P Hutton and Richard G Sloan 1996 Economic consequences of
accounting for stock-based compensation Journal of Accounting Research 34 1ndash20
Edgerton J 2013 Four facts about dividend payouts and the 2003 tax cut International Tax and
Public Finance 20 769-784
Edmans Alex and Xavier Gabaix 2015 Executive compensation a modern primer Journal of
Economic Literature forthcoming
38
Fama Eugene F and Kenneth R French 2001 Disappearing dividends changing firm
characteristics or lower propensity to pay Journal of Financial Economics 60 3ndash43
Farre-Mensa Joan Roni Michaely and Martin C Schmalz 2014 Payout policy Annual Review
of Financial Economics 6 75ndash134
Fenn George W and Nellie Liang 2001 Corporate payout policy and managerial stock
incentives Journal of Financial Economics 60 45ndash72
Ferri Fabrizio and Tatiana Sandino 2009 The impact of shareholder activism on financial
reporting and compensation the case of employee stock options expensing The Accounting
Review 84 433ndash466
Floyd Eric Nan Li and Douglas J Skinner 2015 Payout policy through the financial crisis the
growth of repurchases and the resilience of dividends Journal of Financial Economics 118
299-316
Frydman Carola and Dirk Jenter 2010 CEO compensation Annual Review of Financial
Economics 2 75-102
Gipper Brandon 2015 Assessing the Effects of Disclosing Management Compensation Working
Paper University of Chicago
Gormley Todd David Matsa and Todd Milbourn 2013 CEO compensation and corporate risk
evidence from a natural experiment Journal of Accounting and Economics 56 79-101
Graham John Michelle Hanlon and Terry Shevlin 2011 Real effects of accounting rules
evidence from multinational firmsrsquo investment locations and profit repatriation decisions
Journal of Accounting Research 49 137-185
Graham John Campbell Harvey and Shiva Rajgopal 2005 The Economic implications of
corporate financial reporting Journal of Accounting and Economics 40 3-73
Greenspan Alan 2002 Testimony of Alan Greenspan before the Committee on Banking
Housing and Urban Affairs US Senate July 16 Washington DC Government Printing
Office
Grullon Gustavo and Roni Michaely 2002 Dividends Share Repurchases and the Substitution
Hypothesis Journal of Finance 57 1649-1684
Hail Luzi Ahmed Tahoun and Clare Wang 2014 Dividend Payouts and Information Shocks
Journal of Accounting Research 52 403-456
Hall Brian J and Kevin J Murphy 2002 Stock options for undiversified executives Journal of
Accounting amp Economics 33 3-42
39
Hall Brian J and Kevin J Murphy 2003 The trouble with stock options Journal of Economic
Perspectives 17 49ndash70
Hanlon Michelle and Jeffrey L Hoopes 2014 What do firms do when dividend tax rates change
An examination of alternative payout responses Journal of Financial Economics 114 105-
124
Hayes Rachel M Michael Lemmon and Mingming Qiu 2012 Stock options and managerial
incentives for risk taking Evidence from FAS123R Journal of Financial Economics 105
174ndash190
Heron Randall A Erik Lie 2007 Does backdating explain the stock price pattern around
executive stock option grants Journal of Financial Economics 83 271-295
Hribar Paul Nicole Thorne Jenkins and W Bruce Johnson 2006 Stock repurchases as an
earnings management device Journal of Accounting and Economics 41 3ndash27
Jensen Michael C 1986 Agency cost of free cash flow corporate finance and takeovers
American Economic Review 76 323-329
Jolls Christine 1998 Stock repurchases and incentive compensation NBER Working Paper No
w6467
Jung Boochun Woo-Jong Lee and Yanhua Sunny Yang 2016 The Impact of Dividend
Covenants on Investment and Operating Performance Journal of Business Finance amp
Accounting 43 414ndash447
Kahle Kathleen M 2002 When a buyback isnrsquot a buyback open market repurchases and
employee options Journal of Financial Economics 63 235ndash261
Lambert Richard A William N Lanen and David F Larcker 1989 Executive stock option plans
and corporate dividend policy Journal of Financial and Quantitative Analysis 24 409ndash425
Lintner John 1956 Distribution of incomes of corporations among dividends retained earnings
and taxes The American Economic Review 46 97-113
Low Angie 2009 Managerial risk-taking behavior and equity-based compensation Journal of
Financial Economics 92 470-490
Miller Merton H and Franco Modigliani 1961 Dividend policy growth and the valuation of
shares The Journal of Business 34 411ndash433
Minnick Kristina and Leonard Rosenthal 2015 Stealth compensation Do CEOs increase their
pay by influencing dividend policy Journal of Corporate Finance 25 435-454
40
Murphy Kevin J 1999 Executive compensation In O Ashenfelter and D Card (eds) North
Holland Handbook of Labor Economics Amsterdam Elsevier Science BV
Murphy Kevin J 2013 Executive compensation Where we are and how we got there Handbook
of the Economics of Finance Elsevier Science North Holland 211-356
Nikolaev Valeri 2010 Debt Covenants and Accounting Conservatism Journal of Accounting
Research 48 143-176
Puri Manju Joumlrg Rocholl and Sascha Steffen 2011 Global retail lending in the aftermath of the
US financial crisis Distinguishing between supply and demand effects Journal of Financial
Economics 100 556-578
Shue Kelly and Richard R Townsend 2014 Swinging for the fences Executive reactions to
quasi-random option grants Working Paper University of Chicago
Skinner Douglas J 2008 The evolving relation between earnings dividends and stock
repurchases Journal of Financial Economics 87 582-609
Weisbenner Scott J 2000 Corporate share repurchases in the 1990s What role do stock options
play FEDS Working Paper No 2000-29
Zhang Dan 2013 CEO dividend protection Working Paper BI Norwegian Business School
41
Figure 1 Trends of dividends and repurchases from 2003 to 2007 Panel A plots the average
Regular DividendTotal Assets of firms in the highest and lowest quartiles of Accounting Impact
measured in 2002 Panel B shows the average Total RepurchaseTotal Assets of firms in the
highest and lowest quartiles of Accounting Impact measured in 2002
Panel A Trends of regular dividends
Panel B Trends of total repurchases
00
05
10
15
20
2003 2004 2005 2006 2007
Regular DividendTotal Assets
Lowest Acc Impact
Highest Acc Impact
Pre Post
00
20
40
60
80
100
2003 2004 2005 2006 2007
Total Repurchase Total Assets
Lowest Acc Impact
Highest Acc Impact
Pre Post
42
Table 1
Summary Statistics
Panel A Firm characteristics - full sample
N Mean Std dev 25 pctl Median 75 pctl
Accounting impact (2002) 1176 173 366 022 052 163
Payout variablesRegular dividendTotal assets 5653 093 148 000 000 142
RepurchaseTotal assets 5653 394 710 000 035 500
Total payoutTotal assets 5653 488 748 000 175 666
Regular dividendTotal payout 4091 3874 4057 000 2237 8833
Level of executive compensation (in $1000)
Salary_$ 5653 450 190 314 409 544
Bonus_$ 5653 476 616 122 295 586
Option grant_$ 5653 791 1137 62 384 1002
Restricted stock grant_$ 5653 458 866 0 58 518
Total pay_$ 5653 2481 2475 890 1647 3074
Percentage of executive compensation
Salary_ 5653 296 183 165 251 382
Bonus_ 5653 197 148 97 177 268
Option grant_ 5653 283 235 67 256 445
Restricted stock grant_ 5653 141 180 00 41 249
Control variables
Size ($M) 5653 11086 27294 1017 2459 8117
Log(size) 5653 7985 1565 6925 7808 9002
Book-to-market 5653 0445 0287 0251 0388 0578
Leverage 5653 0202 0172 0038 0187 0309
Asset tangibility 5653 0806 0184 0691 0853 0965
Free cash flow 5653 0059 0091 0013 0059 0108
Cash holding 5653 0166 0172 0034 0100 0247
ROA volatility 5653 0056 0056 0021 0038 0070
Institutional ownership 5653 0753 0202 0639 0795 0910
Sales growth 5653 0121 0189 0028 0096 0183
Past stock return 5653 0094 0183 -0012 0094 0199
Loss indicator 5653 0164 0370 0000 0000 0000
This table presents summary statistics Panel A shows the descriptive statistics of payout variables compensation
variables and other firm characteristics for the full sample Accounting impact is the implied option expense
measured at fiscal year 2002 All other variables are measured at firm-year level from fiscal year 2003 to 2007
resulting in 5653 firm-year observations (except for Regular dividendTotal Payout which can be measured only
for the 4901 firm-year observations with Total payout greater than zero) Panel B shows the pairwise correlations
between main variables at firm-year level Panel C compares payout variables compensation variables and other
firm characteristics before and after FAS123R The Pre-FAS123R period consists of fiscal year 2003 and 2004
the Post-FAS123R period covers fiscal year 2005-2007 Panel D compares the trends of payout and compensation
variables around FAS123R across four quartile groups ranked by 2002 accounting impact Panel E compares the
trends of payout and compensation variables around FAS123R between the treated and control group under the
alternative treatment definition in Bakke et al (2015) (see Section 22) All variables are defined in Appendix The
notation and in Panel C indicates statistically significant at 10 5 and 1 level in T-tests for equal
means respectively
43
Pa
nel
B
Pea
rso
n c
orr
ela
tio
ns
Reg div
Repurchase
Total payout
Salary_
Bonus_
Option_
RS_
Log(size)
BM
Leverage
Tangibility
FCF
Cash holdingROA vol
Inst own
Sales growth
Past ret
urn
Loss
Reg
div
10
0
Repurc
hase
01
610
0
Tota
l payout
03
509
810
0
Sala
ry_
-0
10
-01
8-0
19
10
0
Bonus_
00
700
100
3-0
01
10
0
Option_
-0
10
00
900
6-0
41
-03
510
0
RS
_
01
000
901
0-0
32
-01
1-0
40
10
0
Log(s
ize)
03
101
802
3-0
56
01
101
202
210
0
BM
-02
1-0
28
-03
103
0-0
03
-02
000
0-0
33
10
0
Levera
ge
-00
1-0
08
-00
8-0
05
00
6-0
11
00
801
9-0
03
10
0
Tangib
ility
00
200
100
101
200
1-0
05
-00
6-0
12
-00
4-0
18
10
0
FC
F02
203
703
9-0
20
00
901
1-0
01
02
4-0
32
-02
1-0
16
10
0
Cash
hold
ing
-01
301
000
700
2-0
14
02
2-0
10
-02
3-0
16
-03
502
901
210
0
RO
A v
ol
-01
5-0
04
-00
700
4-0
11
01
9-0
11
-02
3-0
08
-01
101
2-0
02
03
910
0
Inst
ow
n
-00
901
401
1-0
17
00
200
701
200
7-0
01
00
3-0
08
01
4-0
06
-01
110
0
Sale
s gro
wth
-00
8-0
04
-00
6-0
15
00
501
0-0
02
00
7-0
16
-00
3-0
08
01
300
201
400
410
0
Past
retu
rn00
901
301
4-0
18
01
5-0
01
00
301
6-0
29
-01
000
102
7-0
14
-01
001
602
710
0
Loss
-02
0-0
19
-02
201
8-0
18
00
4-0
05
-02
601
901
300
6-0
41
01
702
3-0
16
-01
8-0
40
10
0
44
Panel C Firm characteristics - before and after FAS123R
Pre FAS 123R Post FAS 123R Difference
Payout variables
Regular dividendTotal assets 083 099 016
RepurchaseTotal assets 245 490 245
Total payoutTotal assets 328 589 261
Regular dividendTotal payout 3914 2790 -1124
Level of executive compensation (in $1000)
Salary_$ 426 463 37
Bonus_$ 418 505 87
Option grant_$ 896 707 -191
Restricted stock grant_$ 269 574 305
Total pay_$ 2263 2584 321
Percentage of executive compensation
Salary_ 305 293 -12
Bonus_ 186 204 18
Option grant_ 343 240 -103
Restricted stock grant_ 87 176 89
Control variables
Size ($M) 9671 11631 1960
Log(size) 7860 8035 0175
Book-to-market 0437 0453 0016
Leverage 0201 0203 0002
Asset tangibility 0822 0793 -0029
Free cash flow 0061 0057 -0004
Cash holding 0175 0159 -0016
ROA volatility 0067 0048 -0019
Institutional ownership 0712 0781 0069
Sales growth 0137 0108 -0029
Past stock return 0080 0101 0021
Loss indicator 0173 0159 -0014
45
Pa
nel
D
Fir
m c
ha
racte
rist
ics
by q
ua
rtil
e o
f a
cco
un
tin
g i
mp
act
- b
efo
re a
nd
aft
er
FA
S1
23
R
Accounting im
pact
(2002)
Num
ber
of
Fir
ms
Pre
Post
Pre
Post
Pre
Post
Pre
Post
Payout
vari
able
s
Regula
r div
idendT
ota
l ass
ets
11
2
12
4
09
4
11
1
09
5
11
3
03
0
04
9
Repurc
hase
Tota
l ass
ets
11
3
26
8
19
2
37
3
32
7
63
1
35
1
68
7
Tota
l payout
Tota
l ass
ets
22
4
39
1
28
5
48
4
42
2
74
4
38
1
73
6
Regula
r div
idendT
ota
l payout
643
7
469
8
474
0
341
1
284
5
195
4
82
5
74
5
Perc
enta
ge o
f executive c
om
pensa
tion
Sala
ry_
337
295
313
287
296
289
276
300
Bonus_
223
226
214
228
172
192
134
169
Option g
rant_
201
167
290
210
373
260
507
325
Rest
ricte
d s
tock g
rant_
116
194
98
180
89
176
43
155
294
294
294
294
1st Q
uart
ile2
nd Q
uart
ile3
rd Q
uart
ile4
th Q
uart
ile
01
2
03
5
09
3
55
1
46
Accounting impact
Number of Firms
By accounting impact quartile
1
2
3
4
Pre Post Pre Post
Payout variables
Regular dividendTotal assets 09 11 08 10
RepurchaseTotal assets 18 31 26 52
Total payoutTotal assets 28 43 34 62
Regular dividendTotal payout 428 357 386 265
Percentage of executive compensation
Salary_ 435 364 282 280
Bonus_ 226 214 179 202
Option grant_ 92 125 387 261
Restricted stock grant_ 125 188 80 174
Percentage of CEO compensation
Salary_(CEO) 485 364 260 259
Bonus_(CEO) 249 228 185 219
Option grant_(CEO) 10 127 406 275
Restricted stock grant_(CEO) 128 182 82 183
Panel E Firm characteristics by alternative treatment definition - before and
after FAS123R
Treated
25
19
997
223
250
256
268
10
177
71
Control
44
37
47
Table 2
Differential effect of FAS123R on the use of option-based compensation
Panel A Two-period first-difference regression
Prediction Coeff t-stat Coeff t-stat Coeff t-stat
Accounting impact rank - -0044 -628
Accounting impact rank=2 - -0044 -327
Accounting impact rank=3 - -0075 -468
Accounting impact rank=4 - -0140 -613
Treated - -0132 -875
ΔLog(size) 0061 202 0061 200 0063 214
ΔBook-to-market 0032 091 0032 092 0051 143
ΔLeverage -0157 -213 -0160 -218 -0111 -153
ΔAsset tangibility -0012 -014 -0020 -023 -0023 -026
ΔFree cash flow -0106 -095 -0108 -097 -0128 -117
ΔCash holding -0197 -211 -0193 -206 -0180 -194
ΔFive-year ROA volatility -0065 -031 -0056 -026 -0098 -047
ΔInstitutional ownership -0044 -091 -0043 -088 -0044 -092
ΔSales growth -0064 -102 -0065 -104 -0090 -153
ΔPast one-year stock return 0051 078 0052 080 0091 138
ΔLoss frequency 0056 207 0057 207 0047 179
Log(size) -0009 -210 -0009 -207 -0002 -035
Book-to-market -0015 -056 -0013 -049 0018 072
Leverage 0022 046 0023 048 0068 150
Asset tangibility 0033 077 0033 078 0053 128
Free cash flow 0227 202 0220 195 0127 117
Cash holding -0002 -004 0012 019 -0078 -141
Five-year ROA volatility -0451 -240 -0430 -228 -0509 -283
Institutional ownership -0123 -360 -0122 -359 -0100 -292
Sales growth -0041 -056 -0040 -055 -0089 -125
Past one-year stock return -0009 -015 -0006 -010 0078 125
Loss frequency 0055 174 0056 178 0054 173
Fixed effect
Standard error
Adj R-squared
Observations
Model (3)
Dependent variable ΔAvg Option grantTotal pay
Huber-White
0156
This table investigates whether the effect of FAS123R on the use of option-based pay varies with its potential accounting impact Panel A
reports the results of estimating three two-period first-differencing models where for each firm we average its characteristics in Pre- and
Post-FAS123R period The Pre-FAS123R period consists of fiscal year 2003 and 2004 the Post-FAS123R period covers fiscal year 2005-
2007 In all three specifications the dependent variable is the change of average Option grantTotal pay from Pre- to Post-FAS123R period
The main independent variable varies by model in Model (1) the Accounting impact rank is the quartile rank of implied option expensetotal
assets measured in 2002 (1=lowest 4=highest) In Model (2) Accounting impact rank=2 (3 4) is an indicator that takes value of one if the
firmrsquos Accounting impact rank equals 2 (3 4) In Model (3) we use an alternative treatment construction following Bakke et al (2015)
where Treated is an indicator that takes value of zero if the firm granted zero option to its CEO in both 2003 and 2004 or the firm began to
voluntarily expense option-based pay at fair value in 2002 or earlier and one otherwise For each control variable we include both its level in
the Pre-FAS123R period and its change across the two periods Panel B shows the results of estimating fixed effect models with firm-year
observations The dependent variable is the firm-year level Option grantTotal pay The main independent variables are the interactions of
Post-FAS123R indicator (Post) with Accounting Impact rank Accounting impact rank indicators and Treated respectively All models in
Penal A have industry fixed effects and the standard errors are Huber-White heteroscedasticity-consistent standard errors All models in
Penal B have firm fixed effects and year fixed effects and the standard errors are clustered at firm level All variables are defined in
Appendix The notation and indicates statistically significant at 10 5 and 1 level respectively
Model (1) Model (2)
11711171 1171
Industry Industry
Huber-White
0124
Huber-White
0123
Industry
48
Panel B Panel fixed effects regression
Prediction Coeff t-stat Coeff t-stat Coeff t-stat
Acc impact rank x Post - -0044 -807
Acc impact rank 2 x Post - -0046 -333
Acc impact rank 3 x Post - -0077 -526
Acc impact rank 4 x Post - -0137 -776
Treated x Post - -0145 -970
Log(size) 0034 221 0034 217 0036 229
Book-to-market 0018 084 0017 083 0015 070
Leverage -0004 -009 -0006 -013 -0007 -015
Asset tangibility 0007 012 0004 006 0011 018
Free cash flow -0074 -151 -0072 -146 -0078 -158
Cash holding -0048 -086 -0050 -090 -0006 -011
Five-year ROA volatility 0250 231 0239 219 0437 414
Institutional ownership 0043 159 0044 161 0041 150
Sales growth -0033 -168 -0034 -171 -0031 -158
Past one-year stock return 0067 221 0068 224 0063 204
Loss indicator 0023 209 0022 207 0024 222
Fixed effects
Standard error
Adj R-squared
Observations
Dependent variable Option grantTotal pay
5653 5653 5653
Clustered by firm
Firm Year
Clustered by firm
Firm Year
Clustered by firm
0523 0523 0526
Model (1) Model (2) Model (3)
Firm Year
49
Table 3
Effect of option-based compensation on dividend policy
Panel A Two-period first-difference regression
Prediction Coeff t-stat Coeff t-stat Coeff t-stat
Accounting impact rank + 0000 077
Accounting impact rank=2 + 0001 091
Accounting impact rank=3 + 0000 044
Accounting impact rank=4 + 0001 092
Treated + 0000 -026
ΔLog(size) 0000 -030 0000 -030 0000 -026
ΔBook-to-market -0002 -190 -0002 -193 -0002 -195
ΔLeverage -0002 -059 -0002 -057 -0002 -059
ΔAsset tangibility 0016 431 0016 429 0016 430
ΔFree cash flow 0017 373 0017 373 0017 375
ΔCash holding -0011 -288 -0011 -285 -0010 -282
ΔFive-year ROA volatility 0003 034 0002 032 0003 035
ΔInstitutional ownership -0002 -073 -0002 -073 -0002 -070
ΔSales growth -0001 -040 -0001 -037 -0001 -038
ΔPast one-year stock return 0002 077 0002 076 0002 070
ΔLoss frequency 0000 -048 0000 -045 0000 -046
Log(size) 0000 183 0000 182 0000 182
Book-to-market -0002 -227 -0002 -225 -0002 -284
Leverage -0001 -037 -0001 -039 -0001 -048
Asset tangibility 0003 179 0003 180 0003 176
Free cash flow 0017 291 0017 291 0017 300
Cash holding 0002 080 0002 077 0002 098
Five-year ROA volatility 0003 035 0002 033 0003 044
Institutional ownership -0001 -068 -0001 -068 -0001 -058
Sales growth -0004 -177 -0004 -175 -0004 -172
Past one-year stock return 0004 169 0004 167 0004 165
Loss frequency -0001 -111 -0001 -109 -0001 -102
Fixed effect
Standard error
Adj R-squared
Observations
Dependent variable ΔAvg Regular dividendTotal assets
This table investigates the causal effect of option-based pay on dividend policy by examining whether changes in dividend policy around
FAS123R vary with its potential accounting impact Panel A reports the results of estimating three two-period first-differencing models
where for each firm we average its characteristics in Pre- and Post-FAS123R period In all three specifications the dependent variable is
the change of average Regular dividendTotal assets from Pre- to Post-FAS123R period The main independent variable varies by model in
Model (1) the Accounting impact rank is the quartile rank of implied option expensetotal assets measured in 2002 (1=lowest 4=highest) In
Model (2) Accounting impact rank=2 (3 4) is an indicator that takes value of one if the firmrsquos Accounting impact rank equals 2 (3 4) In
Model (3) we use an alternative treatment construction following Bakke et al (2015) where Treated is an indicator that takes value of zero
if the firm granted zero option to its CEO in both 2003 and 2004 or the firm began to voluntarily expense option-based pay at fair value in
2002 or earlier and one otherwise For each control variable we include both its level in the Pre-FAS123R period and its change across the
two periods Panel B shows the results of estimating fixed effect models with firm-year observations The dependent variable is the firm-
year level Regular dividendTotal assets The main independent variables are the interactions of Post-FAS123R indicator (Post) with
Accounting Impact rank Accounting impact rank indicators and Treated respectively Panel C examines the intensity of dividend changes
among firms with nonzero dividend per share in 2003 or 2004 In particular we estimates the same three models as in Panel A(with the
same independent variables) but for five dependent variables the change of average Regular dividendTotal assets from Pre- to Post-
FAS123R period (as in Panel A) the percentage change of DPS (dividend per share) from Pre- to Post-FAS123R period and three
indicators denoting respectively whether the percentage change of DPS was greater than 20 40 and 60 Panel D reports four
robustness tests of the dividend intensity regression In each of them a set of possible confounding observations is removed (see Section 33
for details) Panel E compares the trends of dividend initiation and termination around FAS123R across four quartile groups ranked by
accounting impact All models in Panel A C and D have industry fixed effects and the standard errors are Huber-White heteroscedasticity-
consistent standard errors All models in Penal B have firm fixed effects and year fixed effects and the standard errors are clustered at
firm level All variables are defined in Appendix The notation and indicates statistically significant at 10 5 and 1 level
Industry Industry Industry
Model (1) Model (2) Model (3)
1171 1171 1171
Huber-White Huber-White Huber-White
0105 0104 0105
50
Panel B Panel fixed effects regression
Prediction Coeff t-stat Coeff t-stat Coeff t-stat
Acc impact rank x Post + 0000 122
Acc impact rank 2 x Post + 0001 110
Acc impact rank 3 x Post + 0001 094
Acc impact rank 4 x Post + 0001 129
Treated x Post + 0000 -012
Log(size) 0001 179 0001 179 0001 181
Book-to-market 0000 025 0000 024 0000 031
Leverage 0001 062 0001 064 0001 069
Asset tangibility 0009 360 0009 358 0009 363
Free cash flow 0002 090 0002 093 0002 092
Cash holding -0007 -295 -0007 -298 -0007 -298
Five-year ROA volatility 0001 041 0001 038 0000 -006
Institutional ownership 0000 -027 0000 -026 0000 -027
Sales growth 0000 053 0000 051 0000 044
Past one-year stock return 0001 089 0001 088 0001 078
Loss indicator 0000 -060 0000 -057 0000 -076
Fixed effects
Standard error
Adj R-squared
Observations
Dependent variable Regular dividendTotal assets
Model (1) Model (2) Model (3)
Firm Year Firm Year Firm Year
5653 5653 5653
Clustered by firm Clustered by firm Clustered by firm
0877 0877 0877
51
Panel C Intensity of dividend changes around FAS123R
Prediction Coeff t-stat Coeff t-stat Coeff t-stat
Accounting impact rank + 0000 065
Accounting impact rank=2 + 0000 048
Accounting impact rank=3 + 0000 026
Accounting impact rank=4 + 0002 080
Treated + 0001 063
Dependent var DPS pct change
Accounting impact rank + -0145 -072
Accounting impact rank=2 + 0018 006
Accounting impact rank=3 + -0177 -045
Accounting impact rank=4 + -0746 -100
Treated + -0407 -119
Accounting impact rank + 0029 095
Accounting impact rank=2 + 0040 074
Accounting impact rank=3 + 0092 139
Accounting impact rank=4 + 0008 007
Treated + -0007 -012
Accounting impact rank + 0024 076
Accounting impact rank=2 + 0047 088
Accounting impact rank=3 + 0079 114
Accounting impact rank=4 + -0003 -002
Treated + 0030 052
Accounting impact rank + 0030 098
Accounting impact rank=2 + 0078 155
Accounting impact rank=3 + 0085 130
Accounting impact rank=4 + 0014 012
Treated + -0006 -011
Control variables
Fixed effect
Standard error
Observations 572 572 572
Yes Yes Yes
Huber-White Huber-White Huber-White
Industry Industry Industry
Dependent var DPS pct
change gt60 indicator
Model (1) Model (2) Model (3)
Dependent var ΔAvg Regular
dividendAssets
Dependent var DPS pct
change gt20 indicator
Dependent var DPS pct
change gt40 indicator
52
Panel D Robustness tests for intensity of dividend changes around FAS123R
Prediction Coeff t-stat Coeff t-stat Coeff t-stat
Accounting impact rank + 0006 017
Accounting impact rank=2 + 0067 118
Accounting impact rank=3 + 0041 057
Accounting impact rank=4 + -0061 -049
Treated + 0022 035Observations
Accounting impact rank + 0009 027
Accounting impact rank=2 + 0058 106
Accounting impact rank=3 + 0032 043
Accounting impact rank=4 + -0032 -024
Treated + 0018 028
Observations
Accounting impact rank + 0030 089
Accounting impact rank=2 + 0039 071
Accounting impact rank=3 + 0122 168
Accounting impact rank=4 + -0063 -052
Treated + 0075 132
Observations
Accounting impact rank + 0008 023
Accounting impact rank=2 + 0023 042
Accounting impact rank=3 + 0048 064
Accounting impact rank=4 + -0042 -033
Treated + -0010 -016
Observations
Control variables
Fixed effect
Standard error
Exclude firms with stable
payout ratio from 2003 to 2004
506 506 506
Dependent variable DPS pct change gt40 indicator
Model (1) Model (2) Model (3)
Exclude voluntary expensers
519 519
Exclude firms in the top decile
of option reduction (02-04)
Exclude firms that accelerated
option vesting
504 504 504
517 517 517
519
Huber-White Huber-White Huber-White
Yes Yes Yes
Industry Industry Industry
53
Panel E Dividend initiation and termination rates around FAS123R
Pre FAS 123R
1 280 75 7 6 13 173
2 284 135 18 9 27 200
3 286 181 11 14 25 138
4 282 260 9 10 19 73
Total 1132 651 45 39 84 129
Post FAS 123R
1 275 63 4 4 8 127
2 280 116 9 9 18 155
3 276 152 9 3 12 79
4 263 223 5 1 6 27
Total 1094 554 27 17 44 79
Pre FAS 123R
1 280 205 2 0 2 10
2 284 149 7 1 8 54
3 286 105 0 0 0 00
4 282 22 0 0 0 00
Total 1132 481 9 1 10 21
Post FAS 123R
1 275 212 3 6 9 42
2 280 164 1 2 3 18
3 276 124 1 1 2 16
4 263 40 0 3 3 75
Total 1094 540 5 12 17 31
termination
in 2004
03-04
cumulative
03-04
cumulative
Quartile firms
with
dividend in
2004
termination
in 2005
termination
in 2006
05-06
cumulative
05-06
cumulative
Termination
Quartile firms
with
dividend in
2002
termination
in 2003
without
dividend in
2004
initiation in
2003
initiation in
2004
03-04
cumulative
03-04
cumulative firmsQuartile
firmsQuartile initiation in
2005
initiation in
2006
05-06
cumulative
05-06
cumulative
Initiation
without
dividend in
2002
54
Table 4
Effect of option-based compensation on repurchases
Panel A Two-period first-difference regression with total repurchase
Prediction Coeff t-stat Coeff t-stat Coeff t-stat
Accounting impact rank - 0002 122
Accounting impact rank=2 - 0002 071
Accounting impact rank=3 - 0005 123
Accounting impact rank=4 - 0007 102
Treated - 0014 365
Control variables
Fixed effect
Standard error
Adj R-squared
Observations
Panel B Two-period first-difference regression with net repurchase
Prediction Coeff t-stat Coeff t-stat Coeff t-stat
Accounting impact rank - 0003 166
Accounting impact rank=2 - 0002 051
Accounting impact rank=3 - 0006 165
Accounting impact rank=4 - 0009 137
Treated - 0010 300
Control variables
Fixed effect
Standard error
Adj R-squared
Observations
Panel C Two-period first-difference regression with repurchase adjusted for exercised options
Prediction Coeff t-stat Coeff t-stat Coeff t-stat
Accounting impact rank - 0001 056
Accounting impact rank=2 - 0002 062
Accounting impact rank=3 - 0007 172
Accounting impact rank=4 - -0001 -008
Treated - 0006 197
Control variables
Fixed effect
Standard error
Adj R-squared
Observations
Dependent variable ΔAvg RepurchaseTotal assets
This table investigates the causal effect of option-based pay on payout policy by examining whether the changes of repurchase around
FAS123R vary with its potential accounting impact Panel A reports the results of estimating three two-period first-differencing models
where for each firm we average its characteristics in Pre- and Post-FAS123R period In all three specifications the dependent variable is
the change of average RepurchaseTotal assets from Pre- to Post-FAS123R period The main independent variable varies by model in
Model (1) the Accounting impact rank is the quartile rank of implied option expensetotal assets measured in 2002 (1=lowest 4=highest)
In Model (2) Accounting impact rank=2 (3 4) is an indicator that takes value of one if the firmrsquos Accounting impact rank equals 2 (3 4)
In Model (3) we use an alternative treatment construction following Bakke et al (2015) where Treated is an indicator that takes value of
zero if the firm granted zero option to its CEO in both 2003 and 2004 or the firm began to voluntarily expense option-based pay at fair
value in 2002 or earlier and one otherwise Panel B reports the regressions with the change of Net repurchaseTotal assets as the
dependent variable and the same independent variable as in Panel A Panel C reports the regressions with the change of Adjusted
repurchaseTotal assets as the dependent variable and the same independent variable as in Panel A All models in Panel A B and C have
industry fixed effects and the standard errors are Huber-White heteroscedasticity-consistent standard errors All variables are defined in
Appendix The notation and indicates statistically significant at 10 5 and 1 level respectively
Model (1) Model (2) Model (3)
Yes Yes Yes
Industry Industry Industry
Huber-White Huber-White Huber-White
Dependent variable ΔAvg Net repurchaseTotal assets
1171 1171 1171
0238 0237 0245
Model (1) Model (2) Model (3)
Yes Yes Yes
Industry Industry Industry
Huber-White Huber-White Huber-White
Dependent variable ΔAvg Adjusted repurchaseTotal assets
0229 0229 0233
1171 1171 1171
Model (1) Model (2) Model (3)
Yes Yes Yes
Industry Industry Industry
Huber-White Huber-White Huber-White
0111 0112 0114
1168 1168 1168
55
Table 5
Effect of option-based compensation on payout mix
Panel A Two-period first-difference regression with total payout mix
Prediction Coeff t-stat Coeff t-stat Coeff t-stat
Accounting impact rank + 0006 028
Accounting impact rank=2 + 0018 045
Accounting impact rank=3 + -0001 -001
Accounting impact rank=4 + 0043 052
Treated + -0035 -094
Control variables
Fixed effect
Standard error
Adj R-squared
Observations
Panel B Two-period first-difference regression with net payout mix
Prediction Coeff t-stat Coeff t-stat Coeff t-stat
Accounting impact rank + -0002 -008
Accounting impact rank=2 + 0008 016
Accounting impact rank=3 + 0018 034
Accounting impact rank=4 + -0059 -055
Treated + -0050 -101
Control variables
Fixed effect
Standard error
Adj R-squared
Observations
0049 0043 0054
257 257 257
Industry Industry Industry
Huber-White Huber-White Huber-White
Dependent variable ΔAvg Regular dividendNet payout
Model (1) Model (2) Model (3)
Yes Yes Yes
0154 0151 0156
362 362 362
Industry Industry Industry
Huber-White Huber-White Huber-White
This table investigates the causal effect of option-based pay on payout mix for firms using both dividend and repurchase by examining
whether the changes of payout mix around FAS123R vary with its potential accounting impact Panel A reports the results of estimating
three two-period first-differencing models where for each firm we average its characteristics in Pre- and Post-FAS123R period In all three
specifications the dependent variable is the change of average Regular dividendTotal payout from Pre- to Post-FAS123R period The main
independent variable varies by model in Model (1) the Accounting impact rank is the quartile rank of implied option expensetotal assets
measured in 2002 (1=lowest 4=highest) In Model (2) Accounting impact rank=2 (3 4) is an indicator that takes value of one if the firmrsquos
Accounting impact rank equals 2 (3 4) In Model (3) we use an alternative treatment construction following Bakke et al (2015) where
Treated is an indicator that takes value of zero if the firm granted zero option to its CEO in both 2003 and 2004 or the firm began to
voluntarily expense option-based pay at fair value in 2002 or earlier and one otherwise Panel B reports the regressions with the change of
Regular dividendNet payout as the dependent variable and the same independent variables as in Panel A Panel A (Panel B) is based on
observations with nonzero regular dividend and repurchase (net repurchase) in both Pre- and Post-FAS123R period All models in Panel A
and B have industry fixed effects and the standard errors are Huber-White heteroscedasticity-consistent standard errors All variables are
defined in Appendix The notation and indicates statistically significant at 10 5 and 1 level respectively
Yes Yes Yes
Dependent variable ΔAvg Regular dividendTotal payout
Model (1) Model (2) Model (3)

14
least one of the years of the Pre period) To provide insights into FAS123Rrsquos effect on dividend
policy for non-payers we examine the relation between our Accounting Impact variable and the
rate of dividend initations in the Pre and Post periods
Our main measure for repurchases is the change in RepurchaseAssetsmdashthat is the
aggregate amount of common stock repurchases made during the year scaled by total assets at the
beginning of the yearmdashfrom the Pre to the Post period In the empirical tests we examine
variations suggested in the literature
Finally as an alternative to examining dividends and repurchases separately we also look at a
measure of the payout composition the change in the DividendsTotal Payout ratio from the Pre to
the Post period (Total Payout is the sum of dividends and repurchases) effectively capturing any
substitution effect between dividends and repurchases 16 Examining the causal effect of the
change in option-based pay on payout composition is especially relevant if managers first target a
total payout and then choose the relative weight of dividends and repurchases In practice it is
unclear to what extent managers act this way (Brav et al 2005) Nonetheless for completeness we
also examine this variable We focus on the subsample of firms with both dividends and
repurchases in both Pre and Post period so as to capture changes in payout mix by firms routinely
using both vehicles to return cash to shareholders
As for the control variables in both Eqs (1) and (2) Controli is a vector of firm characteristics
identified in existent literature as determinants of payout policy (eg Fenn and Liang 2001 Brown
et al 2007 Skinner 2008 Cuny et al 2009) firm size book-to-market leverage asset tangibility
free cash flows cash holdings volatility in operating income institutional ownership sales
16 Fama and French (2001) suggest that repurchases are often complement to dividends while Grullon and Michaely
(2002) document that the increase in share repurchases over the past decades has come at the expense of a lower
increase in dividends consistent with a substitution hypothesis Brown et al (2007) also provide evidence of a
substitution effect in response to the 2003 dividend tax cut Survey evidence in Brav et al (2005) suggests an
asymmetric substitution effect with managers more willing to replace dividends with repurchases than the opposite
15
growth past stock returns and an indicator for loss firms For all of these variables we include
both changes from Pre to Post period and levels in the Pre period to allow for the possibility that
levels of these variables affect subsequent changes in payout policy 17 Finally we include
industry-fixed effects (Fama-French 48 industry indicators) to control for industry-level trends in
payout policies and option-based pay In unreported tests we replace free cash flows with two
separate variables operating profit and capital expenditures We also replace volatility in
operating income with volatility in stock returns Our results are unaffected More detailed
definitions of each variable are in the Appendix
24 Identification Assumption
The key identifying assumption underlying the difference-in-difference estimation
technique is that the parallel trends assumption is satisfied In the absence of treatment both
treated and control firms should experience parallel trends in the outcome variable Our approach
assumes that in the absence of FAS123R the change in dividends or repurchases would be the
same for high and low accounting impact firms Note that the well-documented contemporaneous
correlation between levels of option compensation (a key driver of the implied option expense and
thus the accounting impact) and levels of payout variables does not violate our identification
assumption This is because our assumption pertains to the relation between the level of option
compensation and future changes in payout variables
A specific concern is that options may be granted in anticipation of expected future
changes in payout policy (reverse causality problem) Relative to simple association tests this
concern is significantly reduced in our setting because the accounting impact is measured three
years prior to the arrival of treatment and is the result of option grants made over the prior four or
17 In untabulated analyses we run our tests after excluding changes in the control variables (ie including only their
pre-treatment levels) since in difference-in-difference studies controlling variables measured after the shock may
reintroduce selection bias Our inferences remain unchanged
16
five years depending on the vesting schedule18 For the reverse causality to be plausible the
implied option expense in 2002 (the result of option grants made approximately between 1998 and
2002) needs to reflect the anticipated change in payout policy in 2005-2007 This seems unlikely
While the parallel trend assumption is not directly testable similar to other studies (Bakke
et al 2015) we examine the trends in dividends and repurchases during the Pre period Figure 1
suggests that high and low accounting impact firms (respectively top and bottom quartile of
implied option expense) exhibit similar trends in payout variables in the Pre period ie from 2003
to 2004 More formally to examine the correlation between Accounting Impact and trends in the
payout variables during the Pre period we estimate the following regression only with
observations in 2003 and 2004
Payouti = γ0 + γ1 Accounting Impacti FY2004+ γ2 FY2004+ ΓControli +Firm FE +ui (3)
where Payouti is either DividendAssets or RepurchaseAssets FY2004 is an indicator of
fiscal year 2004 Firm FE indicates firm-fixed effects If firms with varying degrees of accounting
impact have different payout trends before the adoption of FAS123R γ1 should be different from
zero However for both payout variables we find that the estimated γ1 is close to zero and not
statistically significant at 10 level (untabulated tests) Overall the parallel trends assumption
seems reasonable in our setting
3 Empirical analyses
31 Sample Selection and Summary Statistics
Our sample is the SampP 1500 firms with available data on implied option expense (from
Compustat) and on executive compensation (from Execucomp) for at least one year in the Pre
18 The accounting treatment for stock options requires their fair value at the grant date to be recognized over the
service period (usually the vesting period) Hence the implied option expense in a given year includes a fraction of
the expense associated with past option grants
17
period and one year in the Post period to ensure consistency in the sample across periods Similar
to prior studies on payout policy (Fama and French 2001 Skinner 2008) we exclude financial
firms (SIC code between 6000 and 6999) and utilities (SIC between code 4900 and 4999) as well as
firms not incorporated in the US Our final sample includes 1176 firms19 We obtain dividend
and stock returns data from CRSP stock repurchases and dividend per share data from
COMPUSTAT and institutional ownership data from Thomson Reuters 13F database Other
control variables are from CRSP and COMPUSTAT To deal with outliers we winsorize all
continuous variables at 1 and 99 by fiscal year A detailed definition of all variables and their
sources is in Appendix
Table 1 Panel A presents summary statistics of the relevant variables for the pooled sample of
5653 firm-year observations Implied option expense in 2002 (our proxy for Accounting Impact)
is on average 173 of total assets with the median at 052 This suggests that the accounting
impact is very large for a small number of firms Over the entire sample period on average
dividends represent 093 of total assets while repurchases represent 394 Untabulated
analyses indicate that in 16 of the firm-year observations only dividends are paid out in 25
only repurchases in 32 both and in 27 neither Within the subset of firm-years with a payout
dividends represent 3874 of total payout This data confirms prior evidence that repurchases
have assumed the primary role as a vehicle to return cash to shareholders (eg Floyd et al 2015)
The mean (median) total executive pay (average across the top 5 executives) is $25 million ($16
million) On average option grants and restricted stock grants represent respectively 283 and
141 of total pay while salary and bonus comprise 296 and 197 respectively The
19 The results presented in the study are similar when (i) we restrict the sample to firms with available data for the
entire (2003-2007) sample period (1009 firms) and (ii) we exclude firms with CEO turnover in the Post period
(reducing the sample size to 780 firms) as a new CEO may have a different compensation package andor adopt a
different payout policy
18
composition of CEO pay (untabulated) is similar As for the control variables the figures are
generally consistent with other studies examining SampP 1500 firms over the same period
Panel B reports the pairwise Pearson correlations among the relevant variables The
correlations are in line with the associations documented in prior studies For example larger
firms and firms with higher profitability (free cash flows) have higher payouts loss firms have
lower payouts greater volatility in operating income is associated with lower dividends
More relevant to our analysis Panel C presents the mean of each variable in the Pre and Post
period for the full sample For each variable we first compute the firm-level mean over the Pre
and the Post Period and then compute the mean of the resulting figure across all firms There is a
striking increase in repurchases which double from 245 to 490 of total assets causing a
similar increase in total payout The increase in dividends is much smaller from 083 to 099
of total assets As a result for firms with positive payout dividends become a smaller fraction of
total payout in the Post period (2790 versus 3914 in the Pre period) This trend is consistent
with Floyd et al (2015) who document a dramatic increase in repurchases in the years leading to
the 2008 financial crisis Consistent with previous studies around FAS123R there is a significant
reduction in option grants as a fraction of total executive pay (from 343 to 240) and a
corresponding increase in the use of restricted stock (from 87 to 176) with little variation in
the weight of salary and bonus (note that restricted stock salary and bonus were expensed both
before and after FAS123R) Similar patterns hold for the composition of CEO pay (untabulated)
Compared to changes in the mix of executive pay changes in the levels of control variables are
generally less pronounced
Panel D reports the change in the key compensation and payout variables from the Pre to the
Post period by quartiles of implied option expense and yields a number of insights First
19
confirming the skewness suggested by Panel A the mean implied option expense is 551 for
firms in the top quartile versus only 093 035 and 012 for firms in the second third and
bottom quartile respectively Second as expected firms with higher implied option expense have
greater use of option-based pay For example in the Pre-period option pay represents 507 of
total executive pay at firms in the top quartile versus 201 in the bottom quartile Third and
more importantly for our research design the use of option pay changes significantly from the Pre
to the Post period as a function of the accounting impact For firms in the top quartile the
percentage of total pay represented by stock options drops by 182 (from 507 to 325)
versus 113 80 and 34 for firms in the second third and bottom quartile respectively The
decline in option usage across quartiles is accompanied by an increase in restricted stock grants
while the weight of salary and bonus shows little change It is important to emphasize the
substitution of stock options with restricted stocks because restricted stocks typically pay
dividends (Zhang 2013) thus providing further reason to expect a dividend increase in response to
the FAS123R-induced decline in option pay
As for the payout variables Panel D suggests that heavy option users (firms with higher
implied option expense) generally use repurchases more than dividends consistent with the
associations documented in earlier studies In the Pre period repurchases (dividends) represent
351 (030) of total assets for the top quartile versus 113 (112) for the bottom quartile
Panel D also indicates that the increase in repurchases documented in Panel C takes place across
all quartiles As for the (much smaller) change in dividends the absolute increase is similar across
the four quartiles though the relative increase (the percentage change) appears to be slightly
higher in the top quartile Overall these figures do not suggest a shift toward dividends and away
from repurchases by firms with a large (accounting-induced) decline in the use of option pay
20
Panel E presents the same data as Panel D but based on the definition of lsquotreatmentrsquo and
lsquocontrolrsquo in Bakke et al (2015) Under this definition 997 firms are classified as treatment group
and 177 as control (171 firms are classified as lsquocontrolrsquo because they did not grant options to the
CEO in the Pre period and 6 because they were voluntarily expensing options before 2003)
Interestingly lsquotreatedrsquo firms are equally distributed across the quartiles suggesting significant
variation in the degree of treatment As discussed earlier one benefit of our approach is that it
exploits cross-sectional variation among treatment firms in terms of the likely impact of FAS123R
Also 40 of the control firms (71 out of 177) are in the lowest quartile while 35 ((37+25)177)
are in the top two quartiles reflecting the different focus of the two approaches in terms of
identifying firms less affected by FAS123R20
As for payout and compensation variables Panel E shows that the treated group experiences a
larger increase in repurchases than the control group while the (less pronounced) increase in
dividends is similar across treated and control firms Treated firms experience a 126 decrease in
option pay (from 387 to 261) with a corresponding 94 increase in the weight of restricted
stock grants (from 80 to 174) The figures are similar at the CEO level (because the
classification is based on options grants to the CEO it is useful to report pay figures at both the top
5 executives and the CEO level) Interestingly the control group experiences a pronounced
increase in the weight of option grants in total CEO pay from 10 to 127 as almost half of the
control firms issued options to their CEOs in the Post period (for these firms options as percentage
of total CEO pay increased from 0 to 254 untabulated analysis) While this increased use of
stock options suggests (ex post) that these firms were not concerned with the impact of FAS123R
another possibility is that the lack of use of option compensation for CEOs in 2003 and 2004 was
20 In untabulated analysis we find that 55 of the 171 firms issuing no options to the CEO in the Pre period granted
options to the other top executives (and perhaps to other non-executive employees) thus explaining the relatively high
implied option expense for the control group (10 versus 19 for the treatment group ndash see Panel E)
21
temporary rather than the effect of a permanent policy If these firms were planning to issue
options to the CEO in the Post period the assumption that they were unaffected by FAS123R (and
thus their use as control sample) is questionable21
32 Differential Impact of FAS123R on the Use of Option-Based Compensation
An important building block of our approach is the presumed differential impact of FAS123R
on option-based pay as a function of pre-existing implied option expense22 While Table 1 Panel
D preliminarily supports the validity of this assumption we formally examine it by estimating Eq
(1)
As reported in Table 2 Panel A we find a significant negative association between Accounting
Impact and the change in option-based pay around the adoption of FAS123R In column (1)
where we use the quartile rank of implied option expense the -0044 coefficient implies that
around FAS123R option grants over total pay decline by 44 as we move from the highest
quartile to the next Thus the reduction in top quartile firms is 132 larger than in bottom
quartile firms In column 2 we replace the quartile rank with three indicators for the highest
quartiles (with the bottom quartile collapsed in the intercept) so as to be able to compare directly
top and bottom quartile without imposing the same effect across quartiles The negative and
significant coefficient on the top quartile indicator at -0140 suggests that the reduction in option
grants over total pay is 140 larger for top quartile firms relative to bottom quartile firms
Finally in column 3 we use the indicator for treated firms following Bakke et al (2015) The
21 Panel E also shows an increase in the use of restricted stock in CEO pay packages (from 128 to 182 almost
comparable to the increase among treated firms) The concurrent increase in options and restricted stock suggests
these firms would have increased option pay significantly more had it not been for FAS123R indicating further
caution in classifying them as control group of unaffected firms 22 This is akin to the relevance assumption of instrumental variable if we interpret the implied option expense as an
instrument to the change in option-based pay
22
negative and significant coefficient at -0132 suggests that treated firms experience a 132
larger drop in the weight of option pay relative to control firms
In Panel B we re-estimate Eq (1) using a panel regression with firm- and year-fixed effects
(5653 firm-year observations) where the dependent variable is the the ratio of option grants to
total executive pay The results are virtually identical in terms of significance and magnitude of
the coefficients of interest (the interaction terms between respectively Accounting impact and
Treated and an indicator for the Post period)
Overall Table 2 suggests that high implied option expense and the introduction of FAS123R
together strongly encouraged firms to cut back option-based compensation for executives It also
supports the general validity of the approach in Bakke et al (2015) in identifying firms most
affected by FAS123R notwithstanding the concerns outlined earlier
Our test of Eq (1) focuses on executive stock options For our dividend-protection hypothesis
it is important to establish that the level of implied option expense predicts a change in executive
stock options (rather than only a change in the use of non-executive employee stock options) as we
want to capture the effect of a change in executivesrsquo incentives on payout policy At the same
time our dilution channel hypothesis assumes a change in the use of all (executive and non-
executive employee) stock options Thus in untabulated analyses we repeat the test in Eq (1) by
replacing the dependent variable with the change in the number of options granted to all
employees (scaled by the total number of outstanding shares note for this analysis we can only
use data from 2004 to 2007 because Compustat began reporting data on ESO in 2004) The
coefficient on Accounting Impact and Treated continues to be negative and significant suggesting
that the differential reduction in the use of option compensation as a function of accounting impact
23
occurred for both executive and non-executive employee stock options Indeed Brown and Lee
(2011) report a similar decrease in executive and employee stock options around FAS123R
33 Option-Based Pay and Dividend Payouts
In this section we examine the effect of an exogenous (accounting-induced) change in option
compensation on dividend policy by estimating Equation (2)
Table 3 Panel A presents the results using the change in dividends from Pre to Post as
dependent variable We find no significant association between Accounting Impact (column 1 and
2) or Treated (column 3) and the change in dividends around the adoption of FAS123R This is in
stark contrast with the negative effect of option-based pay on dividends predicted in the literature
and documented in various association studies
One concern with this lack of effect is that perhaps our setting is not powerful enough to detect
it One way to examine this possibility is the following The coefficient on Accounting Impact
rank=4 in column 2 is 0001 and the standard error (SE) is 00009 Assuming the estimated
standard error is correct then for a two-tailed t test the coefficient needs to be greater than 00015
(=SE1645) or 015 to reach the 10 percent significant level In other words if moving from
the bottom to the top quartile (which predicts a 14 differential decline in option based pay as per
Table 2 Panel A) resulted in a 015 increase of the dividendasset ratio our test would be able to
detect a causal effect of option-based pay on dividends Given the unconditional mean of the
dividendasset ratio at 093 an increase of 015 from the Pre to the Post period seems
plausible In fact the average increase from the Pre to the Post period is 016 (Table 1 Panel C)
Thus if an effect was there our test should detect it
24
Panel B presents the results using a panel regression (5653 firm-year observations) with firm-
and year-fixed effects and interaction terms between Accounting Impact (or Treated) and an
indicator for the Post period Our inferences are unchanged
These analyses are based on our full sample which includes both dividend-paying and non-
dividend-paying firms Hence they implicity treat as equal two potentially different decisions to
initiate dividends and to increase dividends For example an increase in the dividend-to-asset
ratio from 05 to 06 will be treated the same as an increase from 00 to 01 even though
the latter represents a critical dividend initiation decision23 To address this following Chetty and
Saez (2005) we separately examine how FAS123R impacts the intensity of dividend changes (for
the subset of payers) and the likelihood of dividend initiations (for the subset of non-payers)
331 Option-Based Pay and Dividend Payouts Intensity of Dividend Changes
In the first row of Panel C we repeat the analysis in Panel A for the sub-sample of 572 payers
defined as firms with positive DPS in 2003 andor 2004 Note that we report only the coefficients
of interest for parsimony In the second row we replace the dependent variable with the
percentage change in DPS DPS is the choice variable for managers (Brav et al 2005 Baker and
Wurgler 2016) and thus our preferred measure to capture changes in dividend policy To account
for skewness in this variable (Khale 2002) in the third fourth and fifth rows we use indicator
variables to denote whether the change in DPS surpasses a threshold respectively 20 40 and
60 The proportion of firms that surpass these thresholds are 59 44 and 33 respectively24
23 Initiating dividends is a critical decision for boards given the pre-commitment value that investors attach to this
decision and the strong negative market reaction when firms eliminate or reduce dividends (Brav et al 2005) For
executives trying to maximize the value of their own stock options (dividend-protection argument) the ability to
influence a dividend initiation decision is likely lower than the ability to influence a dividend increase decision 24 Although in the third fourth and fifth rows our dependent variable is a binary variable we use a linear model (OLS)
instead of a probit or logit nonlinear model The reason is that estimating fixed effects in binary response models with
panel data can cause the incidental parameters problem The coefficient estimates can be biased when the panel data
25
Across all of these specifications we find no association between Accounting Impact or Treated
and the intensity of dividend changes Thus it does not appear that an exogenous reduction in
option-based pay caused dividend-paying firms to increase dividends
In Panel D we perform four robustness tests For parsimony we show only the coefficients of
interest and only the cases where the dependent variable is an indicator denoting a greater than
40 increase in DPS The results are similar for the other four ldquointensityrdquo dependent variables
reported in Panel C
In the first row we exclude firms that began to voluntarily expense options in 2003 or 2004
(84 firms of which 68 are dividend payers) FASB added accounting for stock-based
compensation to its agenda in March 2003 and issued an Exposure Draft proposing the expensing
of stock options at fair value in March 2004 In anticipation a number of firms began to
voluntarily expense stock options in 2003 and 2004 (Aboody et al 2004) If these firms reduced
option grants and as a result increased dividends during the Pre period then their inclusion may
reduce the power of our tests and thus our ability to detect the hypothesized relation25
In a similar spirit in the second row we exclude firms in the top decile in terms of reduction in
the ratio of option grants to total pay for the top 5 executives between 2002 (the year prior to the
Pre-period) and 2004 (the end of the Pre-period) This encompasses 113 firms of which 55 are
dividend payers If these firms reduced option grants in anticipation of FAS123R and as a result
increased dividends during the Pre period their inclusion may reduce our ability to detect the
hypothesized relation
has a large number of observations but a short time series Examples of studies making a similar choice are Puri
Rocholl and Steffen (2011) and Chu and Ma (2015) 25 This is unlikely to be a serious concern as previous studies suggest that voluntary expensers made limited use of
stock options (Aboody et al 2004) In fact in our sample 79 of these firms are in the bottom two quartiles of
implied option expense (untabulated) Nonetheless we present this test for robustness
26
In the third row we exclude firms that accelerated the vesting of options before FAS123R
became effective in order to avoid recognizing an expense for the unvested portion of these
options (Choudhary et al 2009 Balsam Reitenga and Yin 2008) This encompasses 196 firms of
which 54 are dividend payers If accelerating vesting was used to reduce the impact of FAS123R
the inclusion of these firms may reduce the power of our tests26
In the fourth row we deal with the concern that if firms target a fixed dividend to net income
ratio (Lintner 1956) and do so without adjusting for changes in accounting standards then by
decreasing net income (via option expense) the accounting change would mechanically cause a
reduction in dividends This would potentially offset and confound the increase predicted under
the dividend-protection and dilution hypotheses This seems unlikely for two reasons First firms
are notoriously reluctant to cut dividends (Brav et al 2005) Hence it seems unlikely that they
would reduce dividends in response to a decline in net income with no economic or cash flow
implications (ie re-classification of an expense from the footnotes to the income statement)
Second firms today set dividends in terms of dividend per share rather than by targeting a net
income-based payout ratio (Brav et al (2005)) As noted by Skinner (2008) over the last few
decades as earnings have become more variable the relation between earnings and dividends has
become weaker with dividend payments increasing smoothly and largely independent of the
variation in earnings Nevertheless in the fourth row we exclude the 66 dividend-paying firms that
26 These firms explicitly stated that they accelerated the vesting of stock options to avoid the accounting charge
(Choudhary et al 2009) In fact 72 are classified in the top two quartiles of implied option expense (untabulated)
Thus we would have predicted these firms to experience a significant decline in option pay To the extent that this
decline did not materialize because they minimized the impact of FAS123R by accelerating vesting the ability of
Accounting Impact to predict the reduction in option pay and thus its usefulness in examining changes in dividends
around FAS123R may be reduced The list of firms accelerating vesting was kindly provided by Jack Ciesielsky of
The Analystsrsquo Accounting Observer
27
had a similar payout ratio in 2003 and 2004 as a proxy for firms with a target net income-based
payout ratio in the Pre period27
As shown in Panel D even after excluding these subsets of firms we continue to find no
association between Accounting Impact or Treated and changes in dividends for dividend-paying
firms This is inconsistent with a causal influence of option compensation on dividend policy
Another concern is that by reducing net income and thus retained earnings FAS123R
may have pushed some firms closer to violating dividend covenants in debt contracts and
thus prevented them from increasing dividends This would bias our study against finding a
causal effect of option-based pay on dividends However this does not appear to be a
significant concern for three reasons First the recognition of an option expense does not
imply a decline in net income In fact more than 70 (75) of the full sample firms
(dividend payers) experienced an increase in net income before extraordinary items from
2004 to 2005 (the percentages are similar across the four quartiles of implied option
expense) Second dividend covenants are less common among dividend-paying firms
(Nikolaev 2010) Third most loan contracts in recent years give parties the option to
ldquofreezerdquo GAAP when facing a mandatory change in accounting principles (Christensen and
Nikolaev 2009) Firms expecting an adverse impact of FAS123R on their dividend covenants
would likely exercise this option (particularly given the non-cash nature of option-based
expense) Nonetheless to alleviate this concern we perform three additional analyses
(untabulated) (i) we repeat the tests in Panel C after excluding firms with a drop in net
income between 2004 and 2005 (ie firms that perhaps faced some covenant-related
27 We define a ldquosimilarrdquo payout to be an absolute change in payout ratio of less than 1 from 2003 to 2004 Among
these 66 firms only 39 continued to have a similar payout ratio in 2005 We also try an alternative definition where
a firm is classified as likely to be using a net income-based target payout ratio if the absolute percentage change in the
ratio from 2003 to 2004 is less than 10 (100 firms) Our inferences are unchanged
28
constrains to their payout policy as a result of FAS123R) (ii) we explicitly control for net
income and retained earnings in the regression (as in Skinner 2008) (iii) we repeat the tests
in Panel C for dividend payers with dividendsasset ratio above the sample median on the
basis that dividend covenants are less frequent among firms paying large dividends (Jung
Lee and Yang 2016) Our inferences are unchanged
332 Option-Based Pay and Dividend Payouts Dividend Initiations
In this section we examine whether the accounting-driven change in option pay affected
dividend initiations among non-payers We cannot employ the difference-in-difference approach
adopted so far by definition the same firm cannot initiate dividends in both periods However we
can provide suggestive evidence as follows First we take all firms that did not pay dividends in
2002 and group them into quartiles based on 2002 implied option expense For each quartile we
find the number of firms initiating dividends in 2003 and 2004 (the Pre period) Next we take all
firms that did not pay dividends in 2004 group them into quartiles based on 2002 implied option
expense and for each quartile find the number of firms initiating dividends in 2005 and 2006 (the
Post period) We do not include 2007 so as to have the same number of years in both periods and
make the cumulative initiation rates comparable
The left portion of Panel E reports the results of this exercise There is a general decrease in
the dividend initiation rate from the Pre to the Post period This holds both in the full sample of
non-payers (from 129 to 79) and across all quartiles This decrease may reflect a temporary
spike in 2003 and 2004 in response to the 2003 dividend tax cut documented in Chetty and Saez
(2005) It is noteworthy that initiation rates in both periods are lower among firms with higher
implied option expense This is consistent with option-heavy firms being mostly high-growth
firms less inclined to pay dividends More relevant to our research question if the lower use of
29
option compensation increased the propensity to pay dividends we would expect to see a relative
increase (ie a lower decrease) in dividend initiations among firms with the highest accounting
impact Instead the rate does not differ depending on the accounting impact There is
approximatley a 5 decline in initiation rate in each quartile In the right portion of Panel E we
examine similar data for dividend terminations While the results should be interpreted with
caution due to their rarity firms with higher accounting impact do not experience a greater decline
in termination rates Our inferences in Panel E are similar when we compared treated and control
firms following Bakke et al (2015) (untabulated)
Even after taking into account the different nature of decisions for dividend paying and non-
dividend-paying firms we fail to find evidence of a causal influence of option-based compensation
on dividend policy This finding is in contrast to the associations documented in earlier studies It
is even more remarkable as most firms replaced stock options with restricted stock which are
generally dividend-protected and should provide further incentive to increase dividends28
34 Option-Based Pay and Repurchases
In this section we examine the effect of an exogenous (accounting-induced) change in option
compensation on repurchases by estimating Equation (2)
Table 4 Panel A presents the results using the change in repurchases (scaled by total assets)
from Pre to Post as a dependent variable If the use of option-based pay had a positive effect on
firmsrsquo propensity to engage in repurchases as posited by the dividend-protection and dilution
hypotheses we should find a negative association between Accounting Impact or Treated and
repurchases Firms with a higher (accounting-driven) reduction in option-based pay should reduce
28 In a sample of SampP 500 firms between 2000 and 2009 Zhang (2013) reports that 80 of the firms granting
restricted stocks offer dividend protection In that sense the FAS123R-induced shift from stock options to restricted
stock may be characterized as a ldquoshockrdquo to dividend protection in unearned equity pay Accordingly our results cast
doubt on the causal interpretation of the positive association between dividend protection and dividend payouts
documented in prior studies (Zhang 2013 Burns et al 2015 Minnick and Rosenthal 2015)
30
the use of repurchases either because they are shifting toward a greater use of dividends andor
because they have a lower need to offset the dilutive effects of stock options However we find no
significant association between Accounting Impact (columns 1 and 2) and the change in
repurchases around the adoption of FAS123R When we use the Treated indicator (column 3) we
find a significant positive association rather than a negative one In Panel B we repeat the analysis
using net repurchases (ie repurchases after removing the effect of share issuances) following
Fama and French (2001) and Skinner (2008) Our inferences are unchanged29
This test is subject to two important caveats The first is we may not detect a decline in
repurchases because in the Post period firms need to offset the exercise of options that were
granted during the Pre period That is a post-FAS123R reduction in grants may not (yet) translate
into a reduction in exercises during the Post period which reduces our ability to test the dilution
hypothesis (ie that firms repurchase shares to offset exercises)30 However we can examine a
variation of this hypothesis where firms use repurchases to manage the effect of unexercised
options on diluted EPS (Bens et al 2003) To do so in Panel C we use a measure of adjusted
repurchases where we subtract our estimate of repurchases undertaken to offset the exercise of
ESO31 We effectively test whether firms experiencing an accounting-induced decrease in option
grants engage in less repurchases (net of exercise-driven repurchases) because their need to
manage the effect of unexercised options on diluted EPS is lower However the coefficient on
the variables of interest is either insignificant or positive inconsistent with the hypothesis
29 In the case of repurchases we do not examine separately ldquoinitiationsrdquo and ldquointensityrdquo as we do for dividends
because initiation is not clearly defined for repurchases Unlike dividends the occurrence of a repurchase in a given
year (or the lack thereof) cannot be used to infer a general policy due to the more discretionary nature of the timing of
repurchases 30 To capture the effect of lower option-based compensation on option exercises and thus on repurchases we would
ideally extend the Post period beyond 2007 However as noted by Floyd et al (2015) repurchases declined
dramatically after 2007 because of the financial crisis making it difficult to detect the effect of any other factor 31 As upper bound estimate of exercise-driven repurchases we multiply the number of ESO exercised during the year
times the average stock price during the year Since the number of ESO exercised is available in Compustat starting in
2004 Panel C is based on observations from 2004 to 2007
31
A second important caveat is that most firms replaced stock options with restricted stock
(Table 2 Panel C) Unvested restricted stock is excluded from the denominator in the computation
of basic EPS (once vested it is included) However it is included in the denominator of diluted
EPS using the treasury stock method similar to stock options Given the complexity of this
method without access to all details of restricted stock grants and option grants it is difficult to
determine whether the switch from stock options to restricted stock decreased the need for
dilution-driven repurchases as our test implicitly assumes Hence it is possible that we do not find
a decrease in repurchases because a reduced need to offset the dilutive effect of stock options was
neutralized by an increased need to offset the dilutive effect of restricted stock
Subject to the above caveats the evidence in Table 4 is not consistent with a positive causal
relation between the use of option-based pay and repurchases More precisely it suggests that
option-driven dilution concerns do not have a first-order effect on the magnitude of repurchases
even though they may play a role in the repurchase decision Hence our result is not necessarily
in conflict with the evidence in Brav et al (2005) where two-thirds of the surveyed financial
executives state that offsetting the dilutionary effect of stock option plans or other stock
programs is an important factor to their repurchase decisions
35 Option-Based Pay and Payout Composition
As an alternative to examining dividends and repurchases separately we also look at the
payout composition the change in the DividendsTotal Payout ratio from the Pre to the Post period
where Total Payout is the sum of dividends and repurchases As noted earlier we focus on the
subsample of firms with both dividends and repurchases in both Pre and Post periods so as to
capture the change in payout mix by firms routinely using both vehicles to return cash to
shareholders If the use of option-based pay causes firms to substitute repurchases for dividends
32
we should find a positive association between Accounting Impact or Treated and the payout mix
defined as DividendsTotal Payout ratio Firms with a higher accounting-driven reduction in
option-based pay should have an increase (decrease) in the relative weight of dividends
(repurchases) to the total payout However as reported in Table 5 Panel A we fail to find a
significant association between Accounting Impact (column 1 and 2) or Treated (column 3) and
the change in payout mix The results are similar when we use Net Payout (dividends plus net
repurchases) instead of Total Payout in computing the payout mix (Panel B)
Overall the combined evidence in Tables 3-5 does not support the hypothesis that option-
based compensation has negative (positive) effect on dividends (repurchases) or that it causes
firms to replace dividends with repurchases
4 Conclusion
Prior literature has documented robust associations between option-based compensation and
payout policy yet it remains unclear whether this association reflcts a causal influence We
investigate the causal effect of option-based compensation on payout policy using the adoption of
FAS123R which resulted in a significant decrease in option grants making it a plausible
exogenous shock to the use of option-based pay To overcome the challenge of no control group
we exploit the fact that firms responded differently depending on the firm-specific accounting
impact as measured by the implied option expense disclosed in the footnotes prior to FAS123R
Firms with larger expected accounting impact curtailed option-based compensation much more
aggressively than firms with lower impact Using a sample of SampP 1500 firms we find no
evidence that firms with a larger accounting-induced decline in option compensation increased
dividends reduced repurchases or changed their payout composition contrary to the widely held
belief that option-based pay has a causal influence on payout policy
33
Appendix Variable Definitions and Data Sources
Accounting Impact Variables
Accounting impact Implied option expense (Compustat XINTOPT) divided by total assets
(Compustat AT) This variable is measured at fiscal year 2002 and is time-invariant
Accounting impact rank The quartile rank of Accounting impact (1=lowest 4=highest)
Payout Variables
Regular dividendTotal assets The numerator is total regular cash dividends in the fiscal year
from the distribution dataset in CRSP Regular cash dividends are identified by the distribution
codes 1212 1222 1232 or 1242 The denominator is one-year lagged total assets (Compustat
AT)
DPS Dividend per share (Compustat DVPSX_F)
DPS pct change The percentage change of average DPS from Pre- to Post-FAS123R period
DPS pct change gtX indicator A dummy variable that equals one if DPC pct change is greater
than X and zero otherwise
RepurchaseTotal assets The numerator is the repurchase of common equity which equals total
repurchase (Compustat PRSTK) minus the change in preferred stock redemption value
(Compustat PSTKRV) The denominator is one-year lagged total assets (Compustat AT)
Net repurchaseTotal assets Net repurchase removes the effect of share issuances The
construction follows Fama and French (2001) and Skinner (2008) if the firm uses the treasury
stock method for repurchase net repurchase equals the increase in common treasury stock
(Compustat TSTKC) if the firm uses the retirement method (when common treasury stock is zero
in the current and prior year) net repurchase equals total repurchases minus stock issuance
(Compustat SSTK) and change in preferred stock redemption value (Compustat PSTKRV)
When the above measures give negative value net repurchase is set to zero
Adjusted repurchaseTotal assets Adjusted repurchase removes from total repurchase the potential
effect of repurchasing exercised options This variable equals total repurchase of common stocks
minus the product between the number of options exercised (Compustat OPTEXD) and average
stock price during the year When the above measure gives negative value adjusted repurchase is
set to zero Since the number of options exercised is not available before 2003 we drop
observations in 2003 when we use this variable
34
Total payoutTotal assets the sum of Regular dividendTotal assets and RepurchaseTotal assets
Regular dividendTotal payout regular cash dividend divided by the sum of regular cash dividend
and repurchase from common equity In the two-period analysis (Pre- vs Post-FAS123R) we
separately sum the numerator and the denominator for each firm-period and then calculate the ratio
Regular dividendNet payout regular dividend divided by the sum of regular dividend and net
repurchase In the two-period analysis (Pre- vs Post-FAS123R) we separately sum the numerator
and the denominator for each firm-period and then calculate the ratio
Compensation Variables
Salary_$ Average salary (Execucomp SALARY) of the top 5 highest paid executives in $1000
Salary_ Average salary (Execucomp SALARY) divided by average total pay (Execucomp
TDC1) of the top 5 highest paid executives
Bonus_$ Average bonus (Execucomp BONUS) of the top 5 highest paid executives in $1000
Due to a data format change we add non-equity plan-based awards (Execucomp
NON_EQ_TARG) to this measure after 2006
Bonus_ Bonus_$ divided by average total pay (Execucomp TDC1) of the top 5 highest paid
executives
Option grant_$ Average option grant value (Execucomp OPTION_AWARDS_BLK_VALUE or
OPTION_AWARDS_FV) of the top 5 highest paid executives in $1000 Due to a data format
change we use OPTION_AWARDS_FV for this measure after 2006
Option grant_ Option grant_$ divided by average total pay (Execucomp TDC1) of the top 5
highest paid executives
Restricted stock grant_$ Average restricted stock grant value (Execucomp RSTKGRNT or
STOCK_AWARDS_FV) of the top 5 highest paid executives in $1000 Due to data format
change we use STOCK_AWARDS_FV for this measure after 2006
Restricted stock grant_ Restricted stock grant_$ divided by average total pay (Execucomp
TDC1) of the top 5 highest paid executives
Total pay_$ Average total pay (Execucomp TDC1) of the top 5 highest paid executives in $1000
35
Other Characteristics
Size The book value of total assets (Compustat AT) minus the book value of common equity
(Compustat CEQ) plus the market value of common equity from CRSP in $M
Log(size) the natural logarithm of size
Book-to-market the book value of common equity dividend by its market value
Leverage long term debt plus short term debt (Compustat DLTT + DLC) divided by total assets
Asset tangibility tangible assets (Compustat AT - INTAN) divided by total assets
Free cash flow Operating cash flow (Compustat OANCF) minus capital expenditure (Compustat
CAPX) then divided by lagged total assets
Cash holding Cash and short-term investments (Compustat CHE) divided by total assets
ROA volatility the standard deviation of returns on assets (operating income before tax divided by
lagged total assets) in the past five fiscal years
Institutional ownership the number of shares held by institutional investors divided by the number
of shares outstanding from Thomson Reuters Institutional Holdings database
Sales growth the growth rate of sales (Compustat SALE) from the prior year
Past stock return annual stock return from the prior year
Loss indicator a dummy variable taking value of one if the current net income is negative and
zero otherwise
36
References
Aboody David 1996 Market Valuation of Employee Stock Options Journal of Accounting and
Economics 22 357-391
Aboody David Barth Mary E and Ron Kasznik 2004 Firms Voluntary Recognition of Stock-
Based Compensation Expense Journal of Accounting Research 42 123ndash150
Aboody David and Ron Kasznik 2008 Executive stock-based compensation and firmsrsquo cash
payout the role of shareholdersrsquo tax-related payout preferences Review of Accounting Studies
13 216ndash251
Anantharaman Divya and Yong Gyu Lee 2014 Managerial risk taking incentives and corporate
pension policy Journal of Financial Economics 111 328ndash351
Baker Malcolm and Jeffrey Wurgler 2004 A catering theory of dividends Journal of Finance
59 1125-1165
Baker Malcolm and Jeffrey Wurgler 2016 Dividends as reference points a behavioral signaling
approach Review of Financial Studies 29 697-738
Bakke Tor-Erik Hamed Mahmudi Chitru Fernando and Jesus Salas 2015 The causal effect of
option pay on corporate risk management Journal of Financial Economics forthcoming
Balsam Steven Austin Reitenga and Jennifer Yin 2008 Option acceleration in response to SFAS
No 123 (R) Accounting Horizons 22 23-45
Bens Daniel and Steven Monahan 2008 Altering Investment Decisions to Manage Financial
Reporting Outcomes Asset-Backed Commercial Paper Conduits and FIN 46 Journal of
Accounting Research 46 1017-1055
Bens Daniel A Venky Nagar Douglas J Skinner and MH Franco Wong 2003 Employee stock
options eps dilution and stock repurchases Journal of Accounting and Economics 36 51ndash90
Bertrand Marianne Esther Duflo and Sendhil Mullainathan 2004 How much should we trust
differences-in-differences estimates The Quarterly Journal of Economics 119 249ndash275
Blouin Jennifer L Jana S Raedy and Douglas A Shackelford 2011 Dividends Share
Repurchases and Tax Clienteles Evidence from the 2003 Reductions in Shareholder Taxes
The Accounting Review 86 887-914
Brav Alon John R Graham Campbell R Harvey and Roni Michaely 2005 Payout policy in the
21st century Journal of Financial Economics 77 483ndash527
Brown Lawrence D and Yen-Jung Lee 2011 Changes in Option-Based Compensation Around
the Issuance of SFAS123R Journal of Business Finance amp Accounting 38 1053ndash109
37
Brown Jeffrey R Nellie Liang and Scott Weisbenner 2007 Executive financial incentives and
payout policy Firm responses to the 2003 dividend tax cut Journal of Finance 62 1935ndash
1965
Burns Natasha Brian McTier and Kristina Minnick 2015 Equity-incentive compensation and
payout policy in Europe Journal of Corporate Finance 30 85-97
Carter Mary Ellen and Luann J Lynch 2003 The Consequences of the FASBrsquos 1998 Proposal on
Accounting for Stock Option Repricing Journal of Accounting and Economics 35 51-72
Carter Mary Ellen Luann J Lynch and Irem Tuna 2007 The role of accounting in the design of
CEO equity compensation The Accounting Review 82 327ndash357
Chava Sudheer and Amiyatosh Purnanandam 2010 CEOs versus CFOs Incentives and
corporate policies Journal of Financial Economics 97 263ndash278
Chetty Raj and Emmanuel Saez 2005 Dividend taxes and corporate behavior Evidence from the
2003 dividend tax cut The Quarterly Journal of Economics 120 791ndash833
Choudhary Preeti Shivaram Rajgopal and Mohan Venkatachalam 2009 Accelerated vesting of
employee stock options in anticipation of FAS123R Journal of Accounting Research 47 105ndash
146
Christensen Hans B and Valeri Nikolaev 2009 Contracting on Mandatory Changes to GAAP
New Practice and Its Determinants Working Paper University of Chicago
Chu Yongqiang and Tao Ma 2015 How does management compensation affect bank risk taking
evidence from FAS 123R University of South Carolina Working Paper
Cuny Charles J Gerald S Martin and John J Puthenpurackal 2009 Stock options and total
payout Journal of Financial and Quantitative Analysis 44 391ndash410
DeAngelo Harry Linda DeAngelo and Douglas J Skinner 2000 Special Dividends and the
Evolution of Dividend Signaling Journal of Financial Economics 57 309-354
Dechow Patricia M Amy P Hutton and Richard G Sloan 1996 Economic consequences of
accounting for stock-based compensation Journal of Accounting Research 34 1ndash20
Edgerton J 2013 Four facts about dividend payouts and the 2003 tax cut International Tax and
Public Finance 20 769-784
Edmans Alex and Xavier Gabaix 2015 Executive compensation a modern primer Journal of
Economic Literature forthcoming
38
Fama Eugene F and Kenneth R French 2001 Disappearing dividends changing firm
characteristics or lower propensity to pay Journal of Financial Economics 60 3ndash43
Farre-Mensa Joan Roni Michaely and Martin C Schmalz 2014 Payout policy Annual Review
of Financial Economics 6 75ndash134
Fenn George W and Nellie Liang 2001 Corporate payout policy and managerial stock
incentives Journal of Financial Economics 60 45ndash72
Ferri Fabrizio and Tatiana Sandino 2009 The impact of shareholder activism on financial
reporting and compensation the case of employee stock options expensing The Accounting
Review 84 433ndash466
Floyd Eric Nan Li and Douglas J Skinner 2015 Payout policy through the financial crisis the
growth of repurchases and the resilience of dividends Journal of Financial Economics 118
299-316
Frydman Carola and Dirk Jenter 2010 CEO compensation Annual Review of Financial
Economics 2 75-102
Gipper Brandon 2015 Assessing the Effects of Disclosing Management Compensation Working
Paper University of Chicago
Gormley Todd David Matsa and Todd Milbourn 2013 CEO compensation and corporate risk
evidence from a natural experiment Journal of Accounting and Economics 56 79-101
Graham John Michelle Hanlon and Terry Shevlin 2011 Real effects of accounting rules
evidence from multinational firmsrsquo investment locations and profit repatriation decisions
Journal of Accounting Research 49 137-185
Graham John Campbell Harvey and Shiva Rajgopal 2005 The Economic implications of
corporate financial reporting Journal of Accounting and Economics 40 3-73
Greenspan Alan 2002 Testimony of Alan Greenspan before the Committee on Banking
Housing and Urban Affairs US Senate July 16 Washington DC Government Printing
Office
Grullon Gustavo and Roni Michaely 2002 Dividends Share Repurchases and the Substitution
Hypothesis Journal of Finance 57 1649-1684
Hail Luzi Ahmed Tahoun and Clare Wang 2014 Dividend Payouts and Information Shocks
Journal of Accounting Research 52 403-456
Hall Brian J and Kevin J Murphy 2002 Stock options for undiversified executives Journal of
Accounting amp Economics 33 3-42
39
Hall Brian J and Kevin J Murphy 2003 The trouble with stock options Journal of Economic
Perspectives 17 49ndash70
Hanlon Michelle and Jeffrey L Hoopes 2014 What do firms do when dividend tax rates change
An examination of alternative payout responses Journal of Financial Economics 114 105-
124
Hayes Rachel M Michael Lemmon and Mingming Qiu 2012 Stock options and managerial
incentives for risk taking Evidence from FAS123R Journal of Financial Economics 105
174ndash190
Heron Randall A Erik Lie 2007 Does backdating explain the stock price pattern around
executive stock option grants Journal of Financial Economics 83 271-295
Hribar Paul Nicole Thorne Jenkins and W Bruce Johnson 2006 Stock repurchases as an
earnings management device Journal of Accounting and Economics 41 3ndash27
Jensen Michael C 1986 Agency cost of free cash flow corporate finance and takeovers
American Economic Review 76 323-329
Jolls Christine 1998 Stock repurchases and incentive compensation NBER Working Paper No
w6467
Jung Boochun Woo-Jong Lee and Yanhua Sunny Yang 2016 The Impact of Dividend
Covenants on Investment and Operating Performance Journal of Business Finance amp
Accounting 43 414ndash447
Kahle Kathleen M 2002 When a buyback isnrsquot a buyback open market repurchases and
employee options Journal of Financial Economics 63 235ndash261
Lambert Richard A William N Lanen and David F Larcker 1989 Executive stock option plans
and corporate dividend policy Journal of Financial and Quantitative Analysis 24 409ndash425
Lintner John 1956 Distribution of incomes of corporations among dividends retained earnings
and taxes The American Economic Review 46 97-113
Low Angie 2009 Managerial risk-taking behavior and equity-based compensation Journal of
Financial Economics 92 470-490
Miller Merton H and Franco Modigliani 1961 Dividend policy growth and the valuation of
shares The Journal of Business 34 411ndash433
Minnick Kristina and Leonard Rosenthal 2015 Stealth compensation Do CEOs increase their
pay by influencing dividend policy Journal of Corporate Finance 25 435-454
40
Murphy Kevin J 1999 Executive compensation In O Ashenfelter and D Card (eds) North
Holland Handbook of Labor Economics Amsterdam Elsevier Science BV
Murphy Kevin J 2013 Executive compensation Where we are and how we got there Handbook
of the Economics of Finance Elsevier Science North Holland 211-356
Nikolaev Valeri 2010 Debt Covenants and Accounting Conservatism Journal of Accounting
Research 48 143-176
Puri Manju Joumlrg Rocholl and Sascha Steffen 2011 Global retail lending in the aftermath of the
US financial crisis Distinguishing between supply and demand effects Journal of Financial
Economics 100 556-578
Shue Kelly and Richard R Townsend 2014 Swinging for the fences Executive reactions to
quasi-random option grants Working Paper University of Chicago
Skinner Douglas J 2008 The evolving relation between earnings dividends and stock
repurchases Journal of Financial Economics 87 582-609
Weisbenner Scott J 2000 Corporate share repurchases in the 1990s What role do stock options
play FEDS Working Paper No 2000-29
Zhang Dan 2013 CEO dividend protection Working Paper BI Norwegian Business School
41
Figure 1 Trends of dividends and repurchases from 2003 to 2007 Panel A plots the average
Regular DividendTotal Assets of firms in the highest and lowest quartiles of Accounting Impact
measured in 2002 Panel B shows the average Total RepurchaseTotal Assets of firms in the
highest and lowest quartiles of Accounting Impact measured in 2002
Panel A Trends of regular dividends
Panel B Trends of total repurchases
00
05
10
15
20
2003 2004 2005 2006 2007
Regular DividendTotal Assets
Lowest Acc Impact
Highest Acc Impact
Pre Post
00
20
40
60
80
100
2003 2004 2005 2006 2007
Total Repurchase Total Assets
Lowest Acc Impact
Highest Acc Impact
Pre Post
42
Table 1
Summary Statistics
Panel A Firm characteristics - full sample
N Mean Std dev 25 pctl Median 75 pctl
Accounting impact (2002) 1176 173 366 022 052 163
Payout variablesRegular dividendTotal assets 5653 093 148 000 000 142
RepurchaseTotal assets 5653 394 710 000 035 500
Total payoutTotal assets 5653 488 748 000 175 666
Regular dividendTotal payout 4091 3874 4057 000 2237 8833
Level of executive compensation (in $1000)
Salary_$ 5653 450 190 314 409 544
Bonus_$ 5653 476 616 122 295 586
Option grant_$ 5653 791 1137 62 384 1002
Restricted stock grant_$ 5653 458 866 0 58 518
Total pay_$ 5653 2481 2475 890 1647 3074
Percentage of executive compensation
Salary_ 5653 296 183 165 251 382
Bonus_ 5653 197 148 97 177 268
Option grant_ 5653 283 235 67 256 445
Restricted stock grant_ 5653 141 180 00 41 249
Control variables
Size ($M) 5653 11086 27294 1017 2459 8117
Log(size) 5653 7985 1565 6925 7808 9002
Book-to-market 5653 0445 0287 0251 0388 0578
Leverage 5653 0202 0172 0038 0187 0309
Asset tangibility 5653 0806 0184 0691 0853 0965
Free cash flow 5653 0059 0091 0013 0059 0108
Cash holding 5653 0166 0172 0034 0100 0247
ROA volatility 5653 0056 0056 0021 0038 0070
Institutional ownership 5653 0753 0202 0639 0795 0910
Sales growth 5653 0121 0189 0028 0096 0183
Past stock return 5653 0094 0183 -0012 0094 0199
Loss indicator 5653 0164 0370 0000 0000 0000
This table presents summary statistics Panel A shows the descriptive statistics of payout variables compensation
variables and other firm characteristics for the full sample Accounting impact is the implied option expense
measured at fiscal year 2002 All other variables are measured at firm-year level from fiscal year 2003 to 2007
resulting in 5653 firm-year observations (except for Regular dividendTotal Payout which can be measured only
for the 4901 firm-year observations with Total payout greater than zero) Panel B shows the pairwise correlations
between main variables at firm-year level Panel C compares payout variables compensation variables and other
firm characteristics before and after FAS123R The Pre-FAS123R period consists of fiscal year 2003 and 2004
the Post-FAS123R period covers fiscal year 2005-2007 Panel D compares the trends of payout and compensation
variables around FAS123R across four quartile groups ranked by 2002 accounting impact Panel E compares the
trends of payout and compensation variables around FAS123R between the treated and control group under the
alternative treatment definition in Bakke et al (2015) (see Section 22) All variables are defined in Appendix The
notation and in Panel C indicates statistically significant at 10 5 and 1 level in T-tests for equal
means respectively
43
Pa
nel
B
Pea
rso
n c
orr
ela
tio
ns
Reg div
Repurchase
Total payout
Salary_
Bonus_
Option_
RS_
Log(size)
BM
Leverage
Tangibility
FCF
Cash holdingROA vol
Inst own
Sales growth
Past ret
urn
Loss
Reg
div
10
0
Repurc
hase
01
610
0
Tota
l payout
03
509
810
0
Sala
ry_
-0
10
-01
8-0
19
10
0
Bonus_
00
700
100
3-0
01
10
0
Option_
-0
10
00
900
6-0
41
-03
510
0
RS
_
01
000
901
0-0
32
-01
1-0
40
10
0
Log(s
ize)
03
101
802
3-0
56
01
101
202
210
0
BM
-02
1-0
28
-03
103
0-0
03
-02
000
0-0
33
10
0
Levera
ge
-00
1-0
08
-00
8-0
05
00
6-0
11
00
801
9-0
03
10
0
Tangib
ility
00
200
100
101
200
1-0
05
-00
6-0
12
-00
4-0
18
10
0
FC
F02
203
703
9-0
20
00
901
1-0
01
02
4-0
32
-02
1-0
16
10
0
Cash
hold
ing
-01
301
000
700
2-0
14
02
2-0
10
-02
3-0
16
-03
502
901
210
0
RO
A v
ol
-01
5-0
04
-00
700
4-0
11
01
9-0
11
-02
3-0
08
-01
101
2-0
02
03
910
0
Inst
ow
n
-00
901
401
1-0
17
00
200
701
200
7-0
01
00
3-0
08
01
4-0
06
-01
110
0
Sale
s gro
wth
-00
8-0
04
-00
6-0
15
00
501
0-0
02
00
7-0
16
-00
3-0
08
01
300
201
400
410
0
Past
retu
rn00
901
301
4-0
18
01
5-0
01
00
301
6-0
29
-01
000
102
7-0
14
-01
001
602
710
0
Loss
-02
0-0
19
-02
201
8-0
18
00
4-0
05
-02
601
901
300
6-0
41
01
702
3-0
16
-01
8-0
40
10
0
44
Panel C Firm characteristics - before and after FAS123R
Pre FAS 123R Post FAS 123R Difference
Payout variables
Regular dividendTotal assets 083 099 016
RepurchaseTotal assets 245 490 245
Total payoutTotal assets 328 589 261
Regular dividendTotal payout 3914 2790 -1124
Level of executive compensation (in $1000)
Salary_$ 426 463 37
Bonus_$ 418 505 87
Option grant_$ 896 707 -191
Restricted stock grant_$ 269 574 305
Total pay_$ 2263 2584 321
Percentage of executive compensation
Salary_ 305 293 -12
Bonus_ 186 204 18
Option grant_ 343 240 -103
Restricted stock grant_ 87 176 89
Control variables
Size ($M) 9671 11631 1960
Log(size) 7860 8035 0175
Book-to-market 0437 0453 0016
Leverage 0201 0203 0002
Asset tangibility 0822 0793 -0029
Free cash flow 0061 0057 -0004
Cash holding 0175 0159 -0016
ROA volatility 0067 0048 -0019
Institutional ownership 0712 0781 0069
Sales growth 0137 0108 -0029
Past stock return 0080 0101 0021
Loss indicator 0173 0159 -0014
45
Pa
nel
D
Fir
m c
ha
racte
rist
ics
by q
ua
rtil
e o
f a
cco
un
tin
g i
mp
act
- b
efo
re a
nd
aft
er
FA
S1
23
R
Accounting im
pact
(2002)
Num
ber
of
Fir
ms
Pre
Post
Pre
Post
Pre
Post
Pre
Post
Payout
vari
able
s
Regula
r div
idendT
ota
l ass
ets
11
2
12
4
09
4
11
1
09
5
11
3
03
0
04
9
Repurc
hase
Tota
l ass
ets
11
3
26
8
19
2
37
3
32
7
63
1
35
1
68
7
Tota
l payout
Tota
l ass
ets
22
4
39
1
28
5
48
4
42
2
74
4
38
1
73
6
Regula
r div
idendT
ota
l payout
643
7
469
8
474
0
341
1
284
5
195
4
82
5
74
5
Perc
enta
ge o
f executive c
om
pensa
tion
Sala
ry_
337
295
313
287
296
289
276
300
Bonus_
223
226
214
228
172
192
134
169
Option g
rant_
201
167
290
210
373
260
507
325
Rest
ricte
d s
tock g
rant_
116
194
98
180
89
176
43
155
294
294
294
294
1st Q
uart
ile2
nd Q
uart
ile3
rd Q
uart
ile4
th Q
uart
ile
01
2
03
5
09
3
55
1
46
Accounting impact
Number of Firms
By accounting impact quartile
1
2
3
4
Pre Post Pre Post
Payout variables
Regular dividendTotal assets 09 11 08 10
RepurchaseTotal assets 18 31 26 52
Total payoutTotal assets 28 43 34 62
Regular dividendTotal payout 428 357 386 265
Percentage of executive compensation
Salary_ 435 364 282 280
Bonus_ 226 214 179 202
Option grant_ 92 125 387 261
Restricted stock grant_ 125 188 80 174
Percentage of CEO compensation
Salary_(CEO) 485 364 260 259
Bonus_(CEO) 249 228 185 219
Option grant_(CEO) 10 127 406 275
Restricted stock grant_(CEO) 128 182 82 183
Panel E Firm characteristics by alternative treatment definition - before and
after FAS123R
Treated
25
19
997
223
250
256
268
10
177
71
Control
44
37
47
Table 2
Differential effect of FAS123R on the use of option-based compensation
Panel A Two-period first-difference regression
Prediction Coeff t-stat Coeff t-stat Coeff t-stat
Accounting impact rank - -0044 -628
Accounting impact rank=2 - -0044 -327
Accounting impact rank=3 - -0075 -468
Accounting impact rank=4 - -0140 -613
Treated - -0132 -875
ΔLog(size) 0061 202 0061 200 0063 214
ΔBook-to-market 0032 091 0032 092 0051 143
ΔLeverage -0157 -213 -0160 -218 -0111 -153
ΔAsset tangibility -0012 -014 -0020 -023 -0023 -026
ΔFree cash flow -0106 -095 -0108 -097 -0128 -117
ΔCash holding -0197 -211 -0193 -206 -0180 -194
ΔFive-year ROA volatility -0065 -031 -0056 -026 -0098 -047
ΔInstitutional ownership -0044 -091 -0043 -088 -0044 -092
ΔSales growth -0064 -102 -0065 -104 -0090 -153
ΔPast one-year stock return 0051 078 0052 080 0091 138
ΔLoss frequency 0056 207 0057 207 0047 179
Log(size) -0009 -210 -0009 -207 -0002 -035
Book-to-market -0015 -056 -0013 -049 0018 072
Leverage 0022 046 0023 048 0068 150
Asset tangibility 0033 077 0033 078 0053 128
Free cash flow 0227 202 0220 195 0127 117
Cash holding -0002 -004 0012 019 -0078 -141
Five-year ROA volatility -0451 -240 -0430 -228 -0509 -283
Institutional ownership -0123 -360 -0122 -359 -0100 -292
Sales growth -0041 -056 -0040 -055 -0089 -125
Past one-year stock return -0009 -015 -0006 -010 0078 125
Loss frequency 0055 174 0056 178 0054 173
Fixed effect
Standard error
Adj R-squared
Observations
Model (3)
Dependent variable ΔAvg Option grantTotal pay
Huber-White
0156
This table investigates whether the effect of FAS123R on the use of option-based pay varies with its potential accounting impact Panel A
reports the results of estimating three two-period first-differencing models where for each firm we average its characteristics in Pre- and
Post-FAS123R period The Pre-FAS123R period consists of fiscal year 2003 and 2004 the Post-FAS123R period covers fiscal year 2005-
2007 In all three specifications the dependent variable is the change of average Option grantTotal pay from Pre- to Post-FAS123R period
The main independent variable varies by model in Model (1) the Accounting impact rank is the quartile rank of implied option expensetotal
assets measured in 2002 (1=lowest 4=highest) In Model (2) Accounting impact rank=2 (3 4) is an indicator that takes value of one if the
firmrsquos Accounting impact rank equals 2 (3 4) In Model (3) we use an alternative treatment construction following Bakke et al (2015)
where Treated is an indicator that takes value of zero if the firm granted zero option to its CEO in both 2003 and 2004 or the firm began to
voluntarily expense option-based pay at fair value in 2002 or earlier and one otherwise For each control variable we include both its level in
the Pre-FAS123R period and its change across the two periods Panel B shows the results of estimating fixed effect models with firm-year
observations The dependent variable is the firm-year level Option grantTotal pay The main independent variables are the interactions of
Post-FAS123R indicator (Post) with Accounting Impact rank Accounting impact rank indicators and Treated respectively All models in
Penal A have industry fixed effects and the standard errors are Huber-White heteroscedasticity-consistent standard errors All models in
Penal B have firm fixed effects and year fixed effects and the standard errors are clustered at firm level All variables are defined in
Appendix The notation and indicates statistically significant at 10 5 and 1 level respectively
Model (1) Model (2)
11711171 1171
Industry Industry
Huber-White
0124
Huber-White
0123
Industry
48
Panel B Panel fixed effects regression
Prediction Coeff t-stat Coeff t-stat Coeff t-stat
Acc impact rank x Post - -0044 -807
Acc impact rank 2 x Post - -0046 -333
Acc impact rank 3 x Post - -0077 -526
Acc impact rank 4 x Post - -0137 -776
Treated x Post - -0145 -970
Log(size) 0034 221 0034 217 0036 229
Book-to-market 0018 084 0017 083 0015 070
Leverage -0004 -009 -0006 -013 -0007 -015
Asset tangibility 0007 012 0004 006 0011 018
Free cash flow -0074 -151 -0072 -146 -0078 -158
Cash holding -0048 -086 -0050 -090 -0006 -011
Five-year ROA volatility 0250 231 0239 219 0437 414
Institutional ownership 0043 159 0044 161 0041 150
Sales growth -0033 -168 -0034 -171 -0031 -158
Past one-year stock return 0067 221 0068 224 0063 204
Loss indicator 0023 209 0022 207 0024 222
Fixed effects
Standard error
Adj R-squared
Observations
Dependent variable Option grantTotal pay
5653 5653 5653
Clustered by firm
Firm Year
Clustered by firm
Firm Year
Clustered by firm
0523 0523 0526
Model (1) Model (2) Model (3)
Firm Year
49
Table 3
Effect of option-based compensation on dividend policy
Panel A Two-period first-difference regression
Prediction Coeff t-stat Coeff t-stat Coeff t-stat
Accounting impact rank + 0000 077
Accounting impact rank=2 + 0001 091
Accounting impact rank=3 + 0000 044
Accounting impact rank=4 + 0001 092
Treated + 0000 -026
ΔLog(size) 0000 -030 0000 -030 0000 -026
ΔBook-to-market -0002 -190 -0002 -193 -0002 -195
ΔLeverage -0002 -059 -0002 -057 -0002 -059
ΔAsset tangibility 0016 431 0016 429 0016 430
ΔFree cash flow 0017 373 0017 373 0017 375
ΔCash holding -0011 -288 -0011 -285 -0010 -282
ΔFive-year ROA volatility 0003 034 0002 032 0003 035
ΔInstitutional ownership -0002 -073 -0002 -073 -0002 -070
ΔSales growth -0001 -040 -0001 -037 -0001 -038
ΔPast one-year stock return 0002 077 0002 076 0002 070
ΔLoss frequency 0000 -048 0000 -045 0000 -046
Log(size) 0000 183 0000 182 0000 182
Book-to-market -0002 -227 -0002 -225 -0002 -284
Leverage -0001 -037 -0001 -039 -0001 -048
Asset tangibility 0003 179 0003 180 0003 176
Free cash flow 0017 291 0017 291 0017 300
Cash holding 0002 080 0002 077 0002 098
Five-year ROA volatility 0003 035 0002 033 0003 044
Institutional ownership -0001 -068 -0001 -068 -0001 -058
Sales growth -0004 -177 -0004 -175 -0004 -172
Past one-year stock return 0004 169 0004 167 0004 165
Loss frequency -0001 -111 -0001 -109 -0001 -102
Fixed effect
Standard error
Adj R-squared
Observations
Dependent variable ΔAvg Regular dividendTotal assets
This table investigates the causal effect of option-based pay on dividend policy by examining whether changes in dividend policy around
FAS123R vary with its potential accounting impact Panel A reports the results of estimating three two-period first-differencing models
where for each firm we average its characteristics in Pre- and Post-FAS123R period In all three specifications the dependent variable is
the change of average Regular dividendTotal assets from Pre- to Post-FAS123R period The main independent variable varies by model in
Model (1) the Accounting impact rank is the quartile rank of implied option expensetotal assets measured in 2002 (1=lowest 4=highest) In
Model (2) Accounting impact rank=2 (3 4) is an indicator that takes value of one if the firmrsquos Accounting impact rank equals 2 (3 4) In
Model (3) we use an alternative treatment construction following Bakke et al (2015) where Treated is an indicator that takes value of zero
if the firm granted zero option to its CEO in both 2003 and 2004 or the firm began to voluntarily expense option-based pay at fair value in
2002 or earlier and one otherwise For each control variable we include both its level in the Pre-FAS123R period and its change across the
two periods Panel B shows the results of estimating fixed effect models with firm-year observations The dependent variable is the firm-
year level Regular dividendTotal assets The main independent variables are the interactions of Post-FAS123R indicator (Post) with
Accounting Impact rank Accounting impact rank indicators and Treated respectively Panel C examines the intensity of dividend changes
among firms with nonzero dividend per share in 2003 or 2004 In particular we estimates the same three models as in Panel A(with the
same independent variables) but for five dependent variables the change of average Regular dividendTotal assets from Pre- to Post-
FAS123R period (as in Panel A) the percentage change of DPS (dividend per share) from Pre- to Post-FAS123R period and three
indicators denoting respectively whether the percentage change of DPS was greater than 20 40 and 60 Panel D reports four
robustness tests of the dividend intensity regression In each of them a set of possible confounding observations is removed (see Section 33
for details) Panel E compares the trends of dividend initiation and termination around FAS123R across four quartile groups ranked by
accounting impact All models in Panel A C and D have industry fixed effects and the standard errors are Huber-White heteroscedasticity-
consistent standard errors All models in Penal B have firm fixed effects and year fixed effects and the standard errors are clustered at
firm level All variables are defined in Appendix The notation and indicates statistically significant at 10 5 and 1 level
Industry Industry Industry
Model (1) Model (2) Model (3)
1171 1171 1171
Huber-White Huber-White Huber-White
0105 0104 0105
50
Panel B Panel fixed effects regression
Prediction Coeff t-stat Coeff t-stat Coeff t-stat
Acc impact rank x Post + 0000 122
Acc impact rank 2 x Post + 0001 110
Acc impact rank 3 x Post + 0001 094
Acc impact rank 4 x Post + 0001 129
Treated x Post + 0000 -012
Log(size) 0001 179 0001 179 0001 181
Book-to-market 0000 025 0000 024 0000 031
Leverage 0001 062 0001 064 0001 069
Asset tangibility 0009 360 0009 358 0009 363
Free cash flow 0002 090 0002 093 0002 092
Cash holding -0007 -295 -0007 -298 -0007 -298
Five-year ROA volatility 0001 041 0001 038 0000 -006
Institutional ownership 0000 -027 0000 -026 0000 -027
Sales growth 0000 053 0000 051 0000 044
Past one-year stock return 0001 089 0001 088 0001 078
Loss indicator 0000 -060 0000 -057 0000 -076
Fixed effects
Standard error
Adj R-squared
Observations
Dependent variable Regular dividendTotal assets
Model (1) Model (2) Model (3)
Firm Year Firm Year Firm Year
5653 5653 5653
Clustered by firm Clustered by firm Clustered by firm
0877 0877 0877
51
Panel C Intensity of dividend changes around FAS123R
Prediction Coeff t-stat Coeff t-stat Coeff t-stat
Accounting impact rank + 0000 065
Accounting impact rank=2 + 0000 048
Accounting impact rank=3 + 0000 026
Accounting impact rank=4 + 0002 080
Treated + 0001 063
Dependent var DPS pct change
Accounting impact rank + -0145 -072
Accounting impact rank=2 + 0018 006
Accounting impact rank=3 + -0177 -045
Accounting impact rank=4 + -0746 -100
Treated + -0407 -119
Accounting impact rank + 0029 095
Accounting impact rank=2 + 0040 074
Accounting impact rank=3 + 0092 139
Accounting impact rank=4 + 0008 007
Treated + -0007 -012
Accounting impact rank + 0024 076
Accounting impact rank=2 + 0047 088
Accounting impact rank=3 + 0079 114
Accounting impact rank=4 + -0003 -002
Treated + 0030 052
Accounting impact rank + 0030 098
Accounting impact rank=2 + 0078 155
Accounting impact rank=3 + 0085 130
Accounting impact rank=4 + 0014 012
Treated + -0006 -011
Control variables
Fixed effect
Standard error
Observations 572 572 572
Yes Yes Yes
Huber-White Huber-White Huber-White
Industry Industry Industry
Dependent var DPS pct
change gt60 indicator
Model (1) Model (2) Model (3)
Dependent var ΔAvg Regular
dividendAssets
Dependent var DPS pct
change gt20 indicator
Dependent var DPS pct
change gt40 indicator
52
Panel D Robustness tests for intensity of dividend changes around FAS123R
Prediction Coeff t-stat Coeff t-stat Coeff t-stat
Accounting impact rank + 0006 017
Accounting impact rank=2 + 0067 118
Accounting impact rank=3 + 0041 057
Accounting impact rank=4 + -0061 -049
Treated + 0022 035Observations
Accounting impact rank + 0009 027
Accounting impact rank=2 + 0058 106
Accounting impact rank=3 + 0032 043
Accounting impact rank=4 + -0032 -024
Treated + 0018 028
Observations
Accounting impact rank + 0030 089
Accounting impact rank=2 + 0039 071
Accounting impact rank=3 + 0122 168
Accounting impact rank=4 + -0063 -052
Treated + 0075 132
Observations
Accounting impact rank + 0008 023
Accounting impact rank=2 + 0023 042
Accounting impact rank=3 + 0048 064
Accounting impact rank=4 + -0042 -033
Treated + -0010 -016
Observations
Control variables
Fixed effect
Standard error
Exclude firms with stable
payout ratio from 2003 to 2004
506 506 506
Dependent variable DPS pct change gt40 indicator
Model (1) Model (2) Model (3)
Exclude voluntary expensers
519 519
Exclude firms in the top decile
of option reduction (02-04)
Exclude firms that accelerated
option vesting
504 504 504
517 517 517
519
Huber-White Huber-White Huber-White
Yes Yes Yes
Industry Industry Industry
53
Panel E Dividend initiation and termination rates around FAS123R
Pre FAS 123R
1 280 75 7 6 13 173
2 284 135 18 9 27 200
3 286 181 11 14 25 138
4 282 260 9 10 19 73
Total 1132 651 45 39 84 129
Post FAS 123R
1 275 63 4 4 8 127
2 280 116 9 9 18 155
3 276 152 9 3 12 79
4 263 223 5 1 6 27
Total 1094 554 27 17 44 79
Pre FAS 123R
1 280 205 2 0 2 10
2 284 149 7 1 8 54
3 286 105 0 0 0 00
4 282 22 0 0 0 00
Total 1132 481 9 1 10 21
Post FAS 123R
1 275 212 3 6 9 42
2 280 164 1 2 3 18
3 276 124 1 1 2 16
4 263 40 0 3 3 75
Total 1094 540 5 12 17 31
termination
in 2004
03-04
cumulative
03-04
cumulative
Quartile firms
with
dividend in
2004
termination
in 2005
termination
in 2006
05-06
cumulative
05-06
cumulative
Termination
Quartile firms
with
dividend in
2002
termination
in 2003
without
dividend in
2004
initiation in
2003
initiation in
2004
03-04
cumulative
03-04
cumulative firmsQuartile
firmsQuartile initiation in
2005
initiation in
2006
05-06
cumulative
05-06
cumulative
Initiation
without
dividend in
2002
54
Table 4
Effect of option-based compensation on repurchases
Panel A Two-period first-difference regression with total repurchase
Prediction Coeff t-stat Coeff t-stat Coeff t-stat
Accounting impact rank - 0002 122
Accounting impact rank=2 - 0002 071
Accounting impact rank=3 - 0005 123
Accounting impact rank=4 - 0007 102
Treated - 0014 365
Control variables
Fixed effect
Standard error
Adj R-squared
Observations
Panel B Two-period first-difference regression with net repurchase
Prediction Coeff t-stat Coeff t-stat Coeff t-stat
Accounting impact rank - 0003 166
Accounting impact rank=2 - 0002 051
Accounting impact rank=3 - 0006 165
Accounting impact rank=4 - 0009 137
Treated - 0010 300
Control variables
Fixed effect
Standard error
Adj R-squared
Observations
Panel C Two-period first-difference regression with repurchase adjusted for exercised options
Prediction Coeff t-stat Coeff t-stat Coeff t-stat
Accounting impact rank - 0001 056
Accounting impact rank=2 - 0002 062
Accounting impact rank=3 - 0007 172
Accounting impact rank=4 - -0001 -008
Treated - 0006 197
Control variables
Fixed effect
Standard error
Adj R-squared
Observations
Dependent variable ΔAvg RepurchaseTotal assets
This table investigates the causal effect of option-based pay on payout policy by examining whether the changes of repurchase around
FAS123R vary with its potential accounting impact Panel A reports the results of estimating three two-period first-differencing models
where for each firm we average its characteristics in Pre- and Post-FAS123R period In all three specifications the dependent variable is
the change of average RepurchaseTotal assets from Pre- to Post-FAS123R period The main independent variable varies by model in
Model (1) the Accounting impact rank is the quartile rank of implied option expensetotal assets measured in 2002 (1=lowest 4=highest)
In Model (2) Accounting impact rank=2 (3 4) is an indicator that takes value of one if the firmrsquos Accounting impact rank equals 2 (3 4)
In Model (3) we use an alternative treatment construction following Bakke et al (2015) where Treated is an indicator that takes value of
zero if the firm granted zero option to its CEO in both 2003 and 2004 or the firm began to voluntarily expense option-based pay at fair
value in 2002 or earlier and one otherwise Panel B reports the regressions with the change of Net repurchaseTotal assets as the
dependent variable and the same independent variable as in Panel A Panel C reports the regressions with the change of Adjusted
repurchaseTotal assets as the dependent variable and the same independent variable as in Panel A All models in Panel A B and C have
industry fixed effects and the standard errors are Huber-White heteroscedasticity-consistent standard errors All variables are defined in
Appendix The notation and indicates statistically significant at 10 5 and 1 level respectively
Model (1) Model (2) Model (3)
Yes Yes Yes
Industry Industry Industry
Huber-White Huber-White Huber-White
Dependent variable ΔAvg Net repurchaseTotal assets
1171 1171 1171
0238 0237 0245
Model (1) Model (2) Model (3)
Yes Yes Yes
Industry Industry Industry
Huber-White Huber-White Huber-White
Dependent variable ΔAvg Adjusted repurchaseTotal assets
0229 0229 0233
1171 1171 1171
Model (1) Model (2) Model (3)
Yes Yes Yes
Industry Industry Industry
Huber-White Huber-White Huber-White
0111 0112 0114
1168 1168 1168
55
Table 5
Effect of option-based compensation on payout mix
Panel A Two-period first-difference regression with total payout mix
Prediction Coeff t-stat Coeff t-stat Coeff t-stat
Accounting impact rank + 0006 028
Accounting impact rank=2 + 0018 045
Accounting impact rank=3 + -0001 -001
Accounting impact rank=4 + 0043 052
Treated + -0035 -094
Control variables
Fixed effect
Standard error
Adj R-squared
Observations
Panel B Two-period first-difference regression with net payout mix
Prediction Coeff t-stat Coeff t-stat Coeff t-stat
Accounting impact rank + -0002 -008
Accounting impact rank=2 + 0008 016
Accounting impact rank=3 + 0018 034
Accounting impact rank=4 + -0059 -055
Treated + -0050 -101
Control variables
Fixed effect
Standard error
Adj R-squared
Observations
0049 0043 0054
257 257 257
Industry Industry Industry
Huber-White Huber-White Huber-White
Dependent variable ΔAvg Regular dividendNet payout
Model (1) Model (2) Model (3)
Yes Yes Yes
0154 0151 0156
362 362 362
Industry Industry Industry
Huber-White Huber-White Huber-White
This table investigates the causal effect of option-based pay on payout mix for firms using both dividend and repurchase by examining
whether the changes of payout mix around FAS123R vary with its potential accounting impact Panel A reports the results of estimating
three two-period first-differencing models where for each firm we average its characteristics in Pre- and Post-FAS123R period In all three
specifications the dependent variable is the change of average Regular dividendTotal payout from Pre- to Post-FAS123R period The main
independent variable varies by model in Model (1) the Accounting impact rank is the quartile rank of implied option expensetotal assets
measured in 2002 (1=lowest 4=highest) In Model (2) Accounting impact rank=2 (3 4) is an indicator that takes value of one if the firmrsquos
Accounting impact rank equals 2 (3 4) In Model (3) we use an alternative treatment construction following Bakke et al (2015) where
Treated is an indicator that takes value of zero if the firm granted zero option to its CEO in both 2003 and 2004 or the firm began to
voluntarily expense option-based pay at fair value in 2002 or earlier and one otherwise Panel B reports the regressions with the change of
Regular dividendNet payout as the dependent variable and the same independent variables as in Panel A Panel A (Panel B) is based on
observations with nonzero regular dividend and repurchase (net repurchase) in both Pre- and Post-FAS123R period All models in Panel A
and B have industry fixed effects and the standard errors are Huber-White heteroscedasticity-consistent standard errors All variables are
defined in Appendix The notation and indicates statistically significant at 10 5 and 1 level respectively
Yes Yes Yes
Dependent variable ΔAvg Regular dividendTotal payout
Model (1) Model (2) Model (3)

15
growth past stock returns and an indicator for loss firms For all of these variables we include
both changes from Pre to Post period and levels in the Pre period to allow for the possibility that
levels of these variables affect subsequent changes in payout policy 17 Finally we include
industry-fixed effects (Fama-French 48 industry indicators) to control for industry-level trends in
payout policies and option-based pay In unreported tests we replace free cash flows with two
separate variables operating profit and capital expenditures We also replace volatility in
operating income with volatility in stock returns Our results are unaffected More detailed
definitions of each variable are in the Appendix
24 Identification Assumption
The key identifying assumption underlying the difference-in-difference estimation
technique is that the parallel trends assumption is satisfied In the absence of treatment both
treated and control firms should experience parallel trends in the outcome variable Our approach
assumes that in the absence of FAS123R the change in dividends or repurchases would be the
same for high and low accounting impact firms Note that the well-documented contemporaneous
correlation between levels of option compensation (a key driver of the implied option expense and
thus the accounting impact) and levels of payout variables does not violate our identification
assumption This is because our assumption pertains to the relation between the level of option
compensation and future changes in payout variables
A specific concern is that options may be granted in anticipation of expected future
changes in payout policy (reverse causality problem) Relative to simple association tests this
concern is significantly reduced in our setting because the accounting impact is measured three
years prior to the arrival of treatment and is the result of option grants made over the prior four or
17 In untabulated analyses we run our tests after excluding changes in the control variables (ie including only their
pre-treatment levels) since in difference-in-difference studies controlling variables measured after the shock may
reintroduce selection bias Our inferences remain unchanged
16
five years depending on the vesting schedule18 For the reverse causality to be plausible the
implied option expense in 2002 (the result of option grants made approximately between 1998 and
2002) needs to reflect the anticipated change in payout policy in 2005-2007 This seems unlikely
While the parallel trend assumption is not directly testable similar to other studies (Bakke
et al 2015) we examine the trends in dividends and repurchases during the Pre period Figure 1
suggests that high and low accounting impact firms (respectively top and bottom quartile of
implied option expense) exhibit similar trends in payout variables in the Pre period ie from 2003
to 2004 More formally to examine the correlation between Accounting Impact and trends in the
payout variables during the Pre period we estimate the following regression only with
observations in 2003 and 2004
Payouti = γ0 + γ1 Accounting Impacti FY2004+ γ2 FY2004+ ΓControli +Firm FE +ui (3)
where Payouti is either DividendAssets or RepurchaseAssets FY2004 is an indicator of
fiscal year 2004 Firm FE indicates firm-fixed effects If firms with varying degrees of accounting
impact have different payout trends before the adoption of FAS123R γ1 should be different from
zero However for both payout variables we find that the estimated γ1 is close to zero and not
statistically significant at 10 level (untabulated tests) Overall the parallel trends assumption
seems reasonable in our setting
3 Empirical analyses
31 Sample Selection and Summary Statistics
Our sample is the SampP 1500 firms with available data on implied option expense (from
Compustat) and on executive compensation (from Execucomp) for at least one year in the Pre
18 The accounting treatment for stock options requires their fair value at the grant date to be recognized over the
service period (usually the vesting period) Hence the implied option expense in a given year includes a fraction of
the expense associated with past option grants
17
period and one year in the Post period to ensure consistency in the sample across periods Similar
to prior studies on payout policy (Fama and French 2001 Skinner 2008) we exclude financial
firms (SIC code between 6000 and 6999) and utilities (SIC between code 4900 and 4999) as well as
firms not incorporated in the US Our final sample includes 1176 firms19 We obtain dividend
and stock returns data from CRSP stock repurchases and dividend per share data from
COMPUSTAT and institutional ownership data from Thomson Reuters 13F database Other
control variables are from CRSP and COMPUSTAT To deal with outliers we winsorize all
continuous variables at 1 and 99 by fiscal year A detailed definition of all variables and their
sources is in Appendix
Table 1 Panel A presents summary statistics of the relevant variables for the pooled sample of
5653 firm-year observations Implied option expense in 2002 (our proxy for Accounting Impact)
is on average 173 of total assets with the median at 052 This suggests that the accounting
impact is very large for a small number of firms Over the entire sample period on average
dividends represent 093 of total assets while repurchases represent 394 Untabulated
analyses indicate that in 16 of the firm-year observations only dividends are paid out in 25
only repurchases in 32 both and in 27 neither Within the subset of firm-years with a payout
dividends represent 3874 of total payout This data confirms prior evidence that repurchases
have assumed the primary role as a vehicle to return cash to shareholders (eg Floyd et al 2015)
The mean (median) total executive pay (average across the top 5 executives) is $25 million ($16
million) On average option grants and restricted stock grants represent respectively 283 and
141 of total pay while salary and bonus comprise 296 and 197 respectively The
19 The results presented in the study are similar when (i) we restrict the sample to firms with available data for the
entire (2003-2007) sample period (1009 firms) and (ii) we exclude firms with CEO turnover in the Post period
(reducing the sample size to 780 firms) as a new CEO may have a different compensation package andor adopt a
different payout policy
18
composition of CEO pay (untabulated) is similar As for the control variables the figures are
generally consistent with other studies examining SampP 1500 firms over the same period
Panel B reports the pairwise Pearson correlations among the relevant variables The
correlations are in line with the associations documented in prior studies For example larger
firms and firms with higher profitability (free cash flows) have higher payouts loss firms have
lower payouts greater volatility in operating income is associated with lower dividends
More relevant to our analysis Panel C presents the mean of each variable in the Pre and Post
period for the full sample For each variable we first compute the firm-level mean over the Pre
and the Post Period and then compute the mean of the resulting figure across all firms There is a
striking increase in repurchases which double from 245 to 490 of total assets causing a
similar increase in total payout The increase in dividends is much smaller from 083 to 099
of total assets As a result for firms with positive payout dividends become a smaller fraction of
total payout in the Post period (2790 versus 3914 in the Pre period) This trend is consistent
with Floyd et al (2015) who document a dramatic increase in repurchases in the years leading to
the 2008 financial crisis Consistent with previous studies around FAS123R there is a significant
reduction in option grants as a fraction of total executive pay (from 343 to 240) and a
corresponding increase in the use of restricted stock (from 87 to 176) with little variation in
the weight of salary and bonus (note that restricted stock salary and bonus were expensed both
before and after FAS123R) Similar patterns hold for the composition of CEO pay (untabulated)
Compared to changes in the mix of executive pay changes in the levels of control variables are
generally less pronounced
Panel D reports the change in the key compensation and payout variables from the Pre to the
Post period by quartiles of implied option expense and yields a number of insights First
19
confirming the skewness suggested by Panel A the mean implied option expense is 551 for
firms in the top quartile versus only 093 035 and 012 for firms in the second third and
bottom quartile respectively Second as expected firms with higher implied option expense have
greater use of option-based pay For example in the Pre-period option pay represents 507 of
total executive pay at firms in the top quartile versus 201 in the bottom quartile Third and
more importantly for our research design the use of option pay changes significantly from the Pre
to the Post period as a function of the accounting impact For firms in the top quartile the
percentage of total pay represented by stock options drops by 182 (from 507 to 325)
versus 113 80 and 34 for firms in the second third and bottom quartile respectively The
decline in option usage across quartiles is accompanied by an increase in restricted stock grants
while the weight of salary and bonus shows little change It is important to emphasize the
substitution of stock options with restricted stocks because restricted stocks typically pay
dividends (Zhang 2013) thus providing further reason to expect a dividend increase in response to
the FAS123R-induced decline in option pay
As for the payout variables Panel D suggests that heavy option users (firms with higher
implied option expense) generally use repurchases more than dividends consistent with the
associations documented in earlier studies In the Pre period repurchases (dividends) represent
351 (030) of total assets for the top quartile versus 113 (112) for the bottom quartile
Panel D also indicates that the increase in repurchases documented in Panel C takes place across
all quartiles As for the (much smaller) change in dividends the absolute increase is similar across
the four quartiles though the relative increase (the percentage change) appears to be slightly
higher in the top quartile Overall these figures do not suggest a shift toward dividends and away
from repurchases by firms with a large (accounting-induced) decline in the use of option pay
20
Panel E presents the same data as Panel D but based on the definition of lsquotreatmentrsquo and
lsquocontrolrsquo in Bakke et al (2015) Under this definition 997 firms are classified as treatment group
and 177 as control (171 firms are classified as lsquocontrolrsquo because they did not grant options to the
CEO in the Pre period and 6 because they were voluntarily expensing options before 2003)
Interestingly lsquotreatedrsquo firms are equally distributed across the quartiles suggesting significant
variation in the degree of treatment As discussed earlier one benefit of our approach is that it
exploits cross-sectional variation among treatment firms in terms of the likely impact of FAS123R
Also 40 of the control firms (71 out of 177) are in the lowest quartile while 35 ((37+25)177)
are in the top two quartiles reflecting the different focus of the two approaches in terms of
identifying firms less affected by FAS123R20
As for payout and compensation variables Panel E shows that the treated group experiences a
larger increase in repurchases than the control group while the (less pronounced) increase in
dividends is similar across treated and control firms Treated firms experience a 126 decrease in
option pay (from 387 to 261) with a corresponding 94 increase in the weight of restricted
stock grants (from 80 to 174) The figures are similar at the CEO level (because the
classification is based on options grants to the CEO it is useful to report pay figures at both the top
5 executives and the CEO level) Interestingly the control group experiences a pronounced
increase in the weight of option grants in total CEO pay from 10 to 127 as almost half of the
control firms issued options to their CEOs in the Post period (for these firms options as percentage
of total CEO pay increased from 0 to 254 untabulated analysis) While this increased use of
stock options suggests (ex post) that these firms were not concerned with the impact of FAS123R
another possibility is that the lack of use of option compensation for CEOs in 2003 and 2004 was
20 In untabulated analysis we find that 55 of the 171 firms issuing no options to the CEO in the Pre period granted
options to the other top executives (and perhaps to other non-executive employees) thus explaining the relatively high
implied option expense for the control group (10 versus 19 for the treatment group ndash see Panel E)
21
temporary rather than the effect of a permanent policy If these firms were planning to issue
options to the CEO in the Post period the assumption that they were unaffected by FAS123R (and
thus their use as control sample) is questionable21
32 Differential Impact of FAS123R on the Use of Option-Based Compensation
An important building block of our approach is the presumed differential impact of FAS123R
on option-based pay as a function of pre-existing implied option expense22 While Table 1 Panel
D preliminarily supports the validity of this assumption we formally examine it by estimating Eq
(1)
As reported in Table 2 Panel A we find a significant negative association between Accounting
Impact and the change in option-based pay around the adoption of FAS123R In column (1)
where we use the quartile rank of implied option expense the -0044 coefficient implies that
around FAS123R option grants over total pay decline by 44 as we move from the highest
quartile to the next Thus the reduction in top quartile firms is 132 larger than in bottom
quartile firms In column 2 we replace the quartile rank with three indicators for the highest
quartiles (with the bottom quartile collapsed in the intercept) so as to be able to compare directly
top and bottom quartile without imposing the same effect across quartiles The negative and
significant coefficient on the top quartile indicator at -0140 suggests that the reduction in option
grants over total pay is 140 larger for top quartile firms relative to bottom quartile firms
Finally in column 3 we use the indicator for treated firms following Bakke et al (2015) The
21 Panel E also shows an increase in the use of restricted stock in CEO pay packages (from 128 to 182 almost
comparable to the increase among treated firms) The concurrent increase in options and restricted stock suggests
these firms would have increased option pay significantly more had it not been for FAS123R indicating further
caution in classifying them as control group of unaffected firms 22 This is akin to the relevance assumption of instrumental variable if we interpret the implied option expense as an
instrument to the change in option-based pay
22
negative and significant coefficient at -0132 suggests that treated firms experience a 132
larger drop in the weight of option pay relative to control firms
In Panel B we re-estimate Eq (1) using a panel regression with firm- and year-fixed effects
(5653 firm-year observations) where the dependent variable is the the ratio of option grants to
total executive pay The results are virtually identical in terms of significance and magnitude of
the coefficients of interest (the interaction terms between respectively Accounting impact and
Treated and an indicator for the Post period)
Overall Table 2 suggests that high implied option expense and the introduction of FAS123R
together strongly encouraged firms to cut back option-based compensation for executives It also
supports the general validity of the approach in Bakke et al (2015) in identifying firms most
affected by FAS123R notwithstanding the concerns outlined earlier
Our test of Eq (1) focuses on executive stock options For our dividend-protection hypothesis
it is important to establish that the level of implied option expense predicts a change in executive
stock options (rather than only a change in the use of non-executive employee stock options) as we
want to capture the effect of a change in executivesrsquo incentives on payout policy At the same
time our dilution channel hypothesis assumes a change in the use of all (executive and non-
executive employee) stock options Thus in untabulated analyses we repeat the test in Eq (1) by
replacing the dependent variable with the change in the number of options granted to all
employees (scaled by the total number of outstanding shares note for this analysis we can only
use data from 2004 to 2007 because Compustat began reporting data on ESO in 2004) The
coefficient on Accounting Impact and Treated continues to be negative and significant suggesting
that the differential reduction in the use of option compensation as a function of accounting impact
23
occurred for both executive and non-executive employee stock options Indeed Brown and Lee
(2011) report a similar decrease in executive and employee stock options around FAS123R
33 Option-Based Pay and Dividend Payouts
In this section we examine the effect of an exogenous (accounting-induced) change in option
compensation on dividend policy by estimating Equation (2)
Table 3 Panel A presents the results using the change in dividends from Pre to Post as
dependent variable We find no significant association between Accounting Impact (column 1 and
2) or Treated (column 3) and the change in dividends around the adoption of FAS123R This is in
stark contrast with the negative effect of option-based pay on dividends predicted in the literature
and documented in various association studies
One concern with this lack of effect is that perhaps our setting is not powerful enough to detect
it One way to examine this possibility is the following The coefficient on Accounting Impact
rank=4 in column 2 is 0001 and the standard error (SE) is 00009 Assuming the estimated
standard error is correct then for a two-tailed t test the coefficient needs to be greater than 00015
(=SE1645) or 015 to reach the 10 percent significant level In other words if moving from
the bottom to the top quartile (which predicts a 14 differential decline in option based pay as per
Table 2 Panel A) resulted in a 015 increase of the dividendasset ratio our test would be able to
detect a causal effect of option-based pay on dividends Given the unconditional mean of the
dividendasset ratio at 093 an increase of 015 from the Pre to the Post period seems
plausible In fact the average increase from the Pre to the Post period is 016 (Table 1 Panel C)
Thus if an effect was there our test should detect it
24
Panel B presents the results using a panel regression (5653 firm-year observations) with firm-
and year-fixed effects and interaction terms between Accounting Impact (or Treated) and an
indicator for the Post period Our inferences are unchanged
These analyses are based on our full sample which includes both dividend-paying and non-
dividend-paying firms Hence they implicity treat as equal two potentially different decisions to
initiate dividends and to increase dividends For example an increase in the dividend-to-asset
ratio from 05 to 06 will be treated the same as an increase from 00 to 01 even though
the latter represents a critical dividend initiation decision23 To address this following Chetty and
Saez (2005) we separately examine how FAS123R impacts the intensity of dividend changes (for
the subset of payers) and the likelihood of dividend initiations (for the subset of non-payers)
331 Option-Based Pay and Dividend Payouts Intensity of Dividend Changes
In the first row of Panel C we repeat the analysis in Panel A for the sub-sample of 572 payers
defined as firms with positive DPS in 2003 andor 2004 Note that we report only the coefficients
of interest for parsimony In the second row we replace the dependent variable with the
percentage change in DPS DPS is the choice variable for managers (Brav et al 2005 Baker and
Wurgler 2016) and thus our preferred measure to capture changes in dividend policy To account
for skewness in this variable (Khale 2002) in the third fourth and fifth rows we use indicator
variables to denote whether the change in DPS surpasses a threshold respectively 20 40 and
60 The proportion of firms that surpass these thresholds are 59 44 and 33 respectively24
23 Initiating dividends is a critical decision for boards given the pre-commitment value that investors attach to this
decision and the strong negative market reaction when firms eliminate or reduce dividends (Brav et al 2005) For
executives trying to maximize the value of their own stock options (dividend-protection argument) the ability to
influence a dividend initiation decision is likely lower than the ability to influence a dividend increase decision 24 Although in the third fourth and fifth rows our dependent variable is a binary variable we use a linear model (OLS)
instead of a probit or logit nonlinear model The reason is that estimating fixed effects in binary response models with
panel data can cause the incidental parameters problem The coefficient estimates can be biased when the panel data
25
Across all of these specifications we find no association between Accounting Impact or Treated
and the intensity of dividend changes Thus it does not appear that an exogenous reduction in
option-based pay caused dividend-paying firms to increase dividends
In Panel D we perform four robustness tests For parsimony we show only the coefficients of
interest and only the cases where the dependent variable is an indicator denoting a greater than
40 increase in DPS The results are similar for the other four ldquointensityrdquo dependent variables
reported in Panel C
In the first row we exclude firms that began to voluntarily expense options in 2003 or 2004
(84 firms of which 68 are dividend payers) FASB added accounting for stock-based
compensation to its agenda in March 2003 and issued an Exposure Draft proposing the expensing
of stock options at fair value in March 2004 In anticipation a number of firms began to
voluntarily expense stock options in 2003 and 2004 (Aboody et al 2004) If these firms reduced
option grants and as a result increased dividends during the Pre period then their inclusion may
reduce the power of our tests and thus our ability to detect the hypothesized relation25
In a similar spirit in the second row we exclude firms in the top decile in terms of reduction in
the ratio of option grants to total pay for the top 5 executives between 2002 (the year prior to the
Pre-period) and 2004 (the end of the Pre-period) This encompasses 113 firms of which 55 are
dividend payers If these firms reduced option grants in anticipation of FAS123R and as a result
increased dividends during the Pre period their inclusion may reduce our ability to detect the
hypothesized relation
has a large number of observations but a short time series Examples of studies making a similar choice are Puri
Rocholl and Steffen (2011) and Chu and Ma (2015) 25 This is unlikely to be a serious concern as previous studies suggest that voluntary expensers made limited use of
stock options (Aboody et al 2004) In fact in our sample 79 of these firms are in the bottom two quartiles of
implied option expense (untabulated) Nonetheless we present this test for robustness
26
In the third row we exclude firms that accelerated the vesting of options before FAS123R
became effective in order to avoid recognizing an expense for the unvested portion of these
options (Choudhary et al 2009 Balsam Reitenga and Yin 2008) This encompasses 196 firms of
which 54 are dividend payers If accelerating vesting was used to reduce the impact of FAS123R
the inclusion of these firms may reduce the power of our tests26
In the fourth row we deal with the concern that if firms target a fixed dividend to net income
ratio (Lintner 1956) and do so without adjusting for changes in accounting standards then by
decreasing net income (via option expense) the accounting change would mechanically cause a
reduction in dividends This would potentially offset and confound the increase predicted under
the dividend-protection and dilution hypotheses This seems unlikely for two reasons First firms
are notoriously reluctant to cut dividends (Brav et al 2005) Hence it seems unlikely that they
would reduce dividends in response to a decline in net income with no economic or cash flow
implications (ie re-classification of an expense from the footnotes to the income statement)
Second firms today set dividends in terms of dividend per share rather than by targeting a net
income-based payout ratio (Brav et al (2005)) As noted by Skinner (2008) over the last few
decades as earnings have become more variable the relation between earnings and dividends has
become weaker with dividend payments increasing smoothly and largely independent of the
variation in earnings Nevertheless in the fourth row we exclude the 66 dividend-paying firms that
26 These firms explicitly stated that they accelerated the vesting of stock options to avoid the accounting charge
(Choudhary et al 2009) In fact 72 are classified in the top two quartiles of implied option expense (untabulated)
Thus we would have predicted these firms to experience a significant decline in option pay To the extent that this
decline did not materialize because they minimized the impact of FAS123R by accelerating vesting the ability of
Accounting Impact to predict the reduction in option pay and thus its usefulness in examining changes in dividends
around FAS123R may be reduced The list of firms accelerating vesting was kindly provided by Jack Ciesielsky of
The Analystsrsquo Accounting Observer
27
had a similar payout ratio in 2003 and 2004 as a proxy for firms with a target net income-based
payout ratio in the Pre period27
As shown in Panel D even after excluding these subsets of firms we continue to find no
association between Accounting Impact or Treated and changes in dividends for dividend-paying
firms This is inconsistent with a causal influence of option compensation on dividend policy
Another concern is that by reducing net income and thus retained earnings FAS123R
may have pushed some firms closer to violating dividend covenants in debt contracts and
thus prevented them from increasing dividends This would bias our study against finding a
causal effect of option-based pay on dividends However this does not appear to be a
significant concern for three reasons First the recognition of an option expense does not
imply a decline in net income In fact more than 70 (75) of the full sample firms
(dividend payers) experienced an increase in net income before extraordinary items from
2004 to 2005 (the percentages are similar across the four quartiles of implied option
expense) Second dividend covenants are less common among dividend-paying firms
(Nikolaev 2010) Third most loan contracts in recent years give parties the option to
ldquofreezerdquo GAAP when facing a mandatory change in accounting principles (Christensen and
Nikolaev 2009) Firms expecting an adverse impact of FAS123R on their dividend covenants
would likely exercise this option (particularly given the non-cash nature of option-based
expense) Nonetheless to alleviate this concern we perform three additional analyses
(untabulated) (i) we repeat the tests in Panel C after excluding firms with a drop in net
income between 2004 and 2005 (ie firms that perhaps faced some covenant-related
27 We define a ldquosimilarrdquo payout to be an absolute change in payout ratio of less than 1 from 2003 to 2004 Among
these 66 firms only 39 continued to have a similar payout ratio in 2005 We also try an alternative definition where
a firm is classified as likely to be using a net income-based target payout ratio if the absolute percentage change in the
ratio from 2003 to 2004 is less than 10 (100 firms) Our inferences are unchanged
28
constrains to their payout policy as a result of FAS123R) (ii) we explicitly control for net
income and retained earnings in the regression (as in Skinner 2008) (iii) we repeat the tests
in Panel C for dividend payers with dividendsasset ratio above the sample median on the
basis that dividend covenants are less frequent among firms paying large dividends (Jung
Lee and Yang 2016) Our inferences are unchanged
332 Option-Based Pay and Dividend Payouts Dividend Initiations
In this section we examine whether the accounting-driven change in option pay affected
dividend initiations among non-payers We cannot employ the difference-in-difference approach
adopted so far by definition the same firm cannot initiate dividends in both periods However we
can provide suggestive evidence as follows First we take all firms that did not pay dividends in
2002 and group them into quartiles based on 2002 implied option expense For each quartile we
find the number of firms initiating dividends in 2003 and 2004 (the Pre period) Next we take all
firms that did not pay dividends in 2004 group them into quartiles based on 2002 implied option
expense and for each quartile find the number of firms initiating dividends in 2005 and 2006 (the
Post period) We do not include 2007 so as to have the same number of years in both periods and
make the cumulative initiation rates comparable
The left portion of Panel E reports the results of this exercise There is a general decrease in
the dividend initiation rate from the Pre to the Post period This holds both in the full sample of
non-payers (from 129 to 79) and across all quartiles This decrease may reflect a temporary
spike in 2003 and 2004 in response to the 2003 dividend tax cut documented in Chetty and Saez
(2005) It is noteworthy that initiation rates in both periods are lower among firms with higher
implied option expense This is consistent with option-heavy firms being mostly high-growth
firms less inclined to pay dividends More relevant to our research question if the lower use of
29
option compensation increased the propensity to pay dividends we would expect to see a relative
increase (ie a lower decrease) in dividend initiations among firms with the highest accounting
impact Instead the rate does not differ depending on the accounting impact There is
approximatley a 5 decline in initiation rate in each quartile In the right portion of Panel E we
examine similar data for dividend terminations While the results should be interpreted with
caution due to their rarity firms with higher accounting impact do not experience a greater decline
in termination rates Our inferences in Panel E are similar when we compared treated and control
firms following Bakke et al (2015) (untabulated)
Even after taking into account the different nature of decisions for dividend paying and non-
dividend-paying firms we fail to find evidence of a causal influence of option-based compensation
on dividend policy This finding is in contrast to the associations documented in earlier studies It
is even more remarkable as most firms replaced stock options with restricted stock which are
generally dividend-protected and should provide further incentive to increase dividends28
34 Option-Based Pay and Repurchases
In this section we examine the effect of an exogenous (accounting-induced) change in option
compensation on repurchases by estimating Equation (2)
Table 4 Panel A presents the results using the change in repurchases (scaled by total assets)
from Pre to Post as a dependent variable If the use of option-based pay had a positive effect on
firmsrsquo propensity to engage in repurchases as posited by the dividend-protection and dilution
hypotheses we should find a negative association between Accounting Impact or Treated and
repurchases Firms with a higher (accounting-driven) reduction in option-based pay should reduce
28 In a sample of SampP 500 firms between 2000 and 2009 Zhang (2013) reports that 80 of the firms granting
restricted stocks offer dividend protection In that sense the FAS123R-induced shift from stock options to restricted
stock may be characterized as a ldquoshockrdquo to dividend protection in unearned equity pay Accordingly our results cast
doubt on the causal interpretation of the positive association between dividend protection and dividend payouts
documented in prior studies (Zhang 2013 Burns et al 2015 Minnick and Rosenthal 2015)
30
the use of repurchases either because they are shifting toward a greater use of dividends andor
because they have a lower need to offset the dilutive effects of stock options However we find no
significant association between Accounting Impact (columns 1 and 2) and the change in
repurchases around the adoption of FAS123R When we use the Treated indicator (column 3) we
find a significant positive association rather than a negative one In Panel B we repeat the analysis
using net repurchases (ie repurchases after removing the effect of share issuances) following
Fama and French (2001) and Skinner (2008) Our inferences are unchanged29
This test is subject to two important caveats The first is we may not detect a decline in
repurchases because in the Post period firms need to offset the exercise of options that were
granted during the Pre period That is a post-FAS123R reduction in grants may not (yet) translate
into a reduction in exercises during the Post period which reduces our ability to test the dilution
hypothesis (ie that firms repurchase shares to offset exercises)30 However we can examine a
variation of this hypothesis where firms use repurchases to manage the effect of unexercised
options on diluted EPS (Bens et al 2003) To do so in Panel C we use a measure of adjusted
repurchases where we subtract our estimate of repurchases undertaken to offset the exercise of
ESO31 We effectively test whether firms experiencing an accounting-induced decrease in option
grants engage in less repurchases (net of exercise-driven repurchases) because their need to
manage the effect of unexercised options on diluted EPS is lower However the coefficient on
the variables of interest is either insignificant or positive inconsistent with the hypothesis
29 In the case of repurchases we do not examine separately ldquoinitiationsrdquo and ldquointensityrdquo as we do for dividends
because initiation is not clearly defined for repurchases Unlike dividends the occurrence of a repurchase in a given
year (or the lack thereof) cannot be used to infer a general policy due to the more discretionary nature of the timing of
repurchases 30 To capture the effect of lower option-based compensation on option exercises and thus on repurchases we would
ideally extend the Post period beyond 2007 However as noted by Floyd et al (2015) repurchases declined
dramatically after 2007 because of the financial crisis making it difficult to detect the effect of any other factor 31 As upper bound estimate of exercise-driven repurchases we multiply the number of ESO exercised during the year
times the average stock price during the year Since the number of ESO exercised is available in Compustat starting in
2004 Panel C is based on observations from 2004 to 2007
31
A second important caveat is that most firms replaced stock options with restricted stock
(Table 2 Panel C) Unvested restricted stock is excluded from the denominator in the computation
of basic EPS (once vested it is included) However it is included in the denominator of diluted
EPS using the treasury stock method similar to stock options Given the complexity of this
method without access to all details of restricted stock grants and option grants it is difficult to
determine whether the switch from stock options to restricted stock decreased the need for
dilution-driven repurchases as our test implicitly assumes Hence it is possible that we do not find
a decrease in repurchases because a reduced need to offset the dilutive effect of stock options was
neutralized by an increased need to offset the dilutive effect of restricted stock
Subject to the above caveats the evidence in Table 4 is not consistent with a positive causal
relation between the use of option-based pay and repurchases More precisely it suggests that
option-driven dilution concerns do not have a first-order effect on the magnitude of repurchases
even though they may play a role in the repurchase decision Hence our result is not necessarily
in conflict with the evidence in Brav et al (2005) where two-thirds of the surveyed financial
executives state that offsetting the dilutionary effect of stock option plans or other stock
programs is an important factor to their repurchase decisions
35 Option-Based Pay and Payout Composition
As an alternative to examining dividends and repurchases separately we also look at the
payout composition the change in the DividendsTotal Payout ratio from the Pre to the Post period
where Total Payout is the sum of dividends and repurchases As noted earlier we focus on the
subsample of firms with both dividends and repurchases in both Pre and Post periods so as to
capture the change in payout mix by firms routinely using both vehicles to return cash to
shareholders If the use of option-based pay causes firms to substitute repurchases for dividends
32
we should find a positive association between Accounting Impact or Treated and the payout mix
defined as DividendsTotal Payout ratio Firms with a higher accounting-driven reduction in
option-based pay should have an increase (decrease) in the relative weight of dividends
(repurchases) to the total payout However as reported in Table 5 Panel A we fail to find a
significant association between Accounting Impact (column 1 and 2) or Treated (column 3) and
the change in payout mix The results are similar when we use Net Payout (dividends plus net
repurchases) instead of Total Payout in computing the payout mix (Panel B)
Overall the combined evidence in Tables 3-5 does not support the hypothesis that option-
based compensation has negative (positive) effect on dividends (repurchases) or that it causes
firms to replace dividends with repurchases
4 Conclusion
Prior literature has documented robust associations between option-based compensation and
payout policy yet it remains unclear whether this association reflcts a causal influence We
investigate the causal effect of option-based compensation on payout policy using the adoption of
FAS123R which resulted in a significant decrease in option grants making it a plausible
exogenous shock to the use of option-based pay To overcome the challenge of no control group
we exploit the fact that firms responded differently depending on the firm-specific accounting
impact as measured by the implied option expense disclosed in the footnotes prior to FAS123R
Firms with larger expected accounting impact curtailed option-based compensation much more
aggressively than firms with lower impact Using a sample of SampP 1500 firms we find no
evidence that firms with a larger accounting-induced decline in option compensation increased
dividends reduced repurchases or changed their payout composition contrary to the widely held
belief that option-based pay has a causal influence on payout policy
33
Appendix Variable Definitions and Data Sources
Accounting Impact Variables
Accounting impact Implied option expense (Compustat XINTOPT) divided by total assets
(Compustat AT) This variable is measured at fiscal year 2002 and is time-invariant
Accounting impact rank The quartile rank of Accounting impact (1=lowest 4=highest)
Payout Variables
Regular dividendTotal assets The numerator is total regular cash dividends in the fiscal year
from the distribution dataset in CRSP Regular cash dividends are identified by the distribution
codes 1212 1222 1232 or 1242 The denominator is one-year lagged total assets (Compustat
AT)
DPS Dividend per share (Compustat DVPSX_F)
DPS pct change The percentage change of average DPS from Pre- to Post-FAS123R period
DPS pct change gtX indicator A dummy variable that equals one if DPC pct change is greater
than X and zero otherwise
RepurchaseTotal assets The numerator is the repurchase of common equity which equals total
repurchase (Compustat PRSTK) minus the change in preferred stock redemption value
(Compustat PSTKRV) The denominator is one-year lagged total assets (Compustat AT)
Net repurchaseTotal assets Net repurchase removes the effect of share issuances The
construction follows Fama and French (2001) and Skinner (2008) if the firm uses the treasury
stock method for repurchase net repurchase equals the increase in common treasury stock
(Compustat TSTKC) if the firm uses the retirement method (when common treasury stock is zero
in the current and prior year) net repurchase equals total repurchases minus stock issuance
(Compustat SSTK) and change in preferred stock redemption value (Compustat PSTKRV)
When the above measures give negative value net repurchase is set to zero
Adjusted repurchaseTotal assets Adjusted repurchase removes from total repurchase the potential
effect of repurchasing exercised options This variable equals total repurchase of common stocks
minus the product between the number of options exercised (Compustat OPTEXD) and average
stock price during the year When the above measure gives negative value adjusted repurchase is
set to zero Since the number of options exercised is not available before 2003 we drop
observations in 2003 when we use this variable
34
Total payoutTotal assets the sum of Regular dividendTotal assets and RepurchaseTotal assets
Regular dividendTotal payout regular cash dividend divided by the sum of regular cash dividend
and repurchase from common equity In the two-period analysis (Pre- vs Post-FAS123R) we
separately sum the numerator and the denominator for each firm-period and then calculate the ratio
Regular dividendNet payout regular dividend divided by the sum of regular dividend and net
repurchase In the two-period analysis (Pre- vs Post-FAS123R) we separately sum the numerator
and the denominator for each firm-period and then calculate the ratio
Compensation Variables
Salary_$ Average salary (Execucomp SALARY) of the top 5 highest paid executives in $1000
Salary_ Average salary (Execucomp SALARY) divided by average total pay (Execucomp
TDC1) of the top 5 highest paid executives
Bonus_$ Average bonus (Execucomp BONUS) of the top 5 highest paid executives in $1000
Due to a data format change we add non-equity plan-based awards (Execucomp
NON_EQ_TARG) to this measure after 2006
Bonus_ Bonus_$ divided by average total pay (Execucomp TDC1) of the top 5 highest paid
executives
Option grant_$ Average option grant value (Execucomp OPTION_AWARDS_BLK_VALUE or
OPTION_AWARDS_FV) of the top 5 highest paid executives in $1000 Due to a data format
change we use OPTION_AWARDS_FV for this measure after 2006
Option grant_ Option grant_$ divided by average total pay (Execucomp TDC1) of the top 5
highest paid executives
Restricted stock grant_$ Average restricted stock grant value (Execucomp RSTKGRNT or
STOCK_AWARDS_FV) of the top 5 highest paid executives in $1000 Due to data format
change we use STOCK_AWARDS_FV for this measure after 2006
Restricted stock grant_ Restricted stock grant_$ divided by average total pay (Execucomp
TDC1) of the top 5 highest paid executives
Total pay_$ Average total pay (Execucomp TDC1) of the top 5 highest paid executives in $1000
35
Other Characteristics
Size The book value of total assets (Compustat AT) minus the book value of common equity
(Compustat CEQ) plus the market value of common equity from CRSP in $M
Log(size) the natural logarithm of size
Book-to-market the book value of common equity dividend by its market value
Leverage long term debt plus short term debt (Compustat DLTT + DLC) divided by total assets
Asset tangibility tangible assets (Compustat AT - INTAN) divided by total assets
Free cash flow Operating cash flow (Compustat OANCF) minus capital expenditure (Compustat
CAPX) then divided by lagged total assets
Cash holding Cash and short-term investments (Compustat CHE) divided by total assets
ROA volatility the standard deviation of returns on assets (operating income before tax divided by
lagged total assets) in the past five fiscal years
Institutional ownership the number of shares held by institutional investors divided by the number
of shares outstanding from Thomson Reuters Institutional Holdings database
Sales growth the growth rate of sales (Compustat SALE) from the prior year
Past stock return annual stock return from the prior year
Loss indicator a dummy variable taking value of one if the current net income is negative and
zero otherwise
36
References
Aboody David 1996 Market Valuation of Employee Stock Options Journal of Accounting and
Economics 22 357-391
Aboody David Barth Mary E and Ron Kasznik 2004 Firms Voluntary Recognition of Stock-
Based Compensation Expense Journal of Accounting Research 42 123ndash150
Aboody David and Ron Kasznik 2008 Executive stock-based compensation and firmsrsquo cash
payout the role of shareholdersrsquo tax-related payout preferences Review of Accounting Studies
13 216ndash251
Anantharaman Divya and Yong Gyu Lee 2014 Managerial risk taking incentives and corporate
pension policy Journal of Financial Economics 111 328ndash351
Baker Malcolm and Jeffrey Wurgler 2004 A catering theory of dividends Journal of Finance
59 1125-1165
Baker Malcolm and Jeffrey Wurgler 2016 Dividends as reference points a behavioral signaling
approach Review of Financial Studies 29 697-738
Bakke Tor-Erik Hamed Mahmudi Chitru Fernando and Jesus Salas 2015 The causal effect of
option pay on corporate risk management Journal of Financial Economics forthcoming
Balsam Steven Austin Reitenga and Jennifer Yin 2008 Option acceleration in response to SFAS
No 123 (R) Accounting Horizons 22 23-45
Bens Daniel and Steven Monahan 2008 Altering Investment Decisions to Manage Financial
Reporting Outcomes Asset-Backed Commercial Paper Conduits and FIN 46 Journal of
Accounting Research 46 1017-1055
Bens Daniel A Venky Nagar Douglas J Skinner and MH Franco Wong 2003 Employee stock
options eps dilution and stock repurchases Journal of Accounting and Economics 36 51ndash90
Bertrand Marianne Esther Duflo and Sendhil Mullainathan 2004 How much should we trust
differences-in-differences estimates The Quarterly Journal of Economics 119 249ndash275
Blouin Jennifer L Jana S Raedy and Douglas A Shackelford 2011 Dividends Share
Repurchases and Tax Clienteles Evidence from the 2003 Reductions in Shareholder Taxes
The Accounting Review 86 887-914
Brav Alon John R Graham Campbell R Harvey and Roni Michaely 2005 Payout policy in the
21st century Journal of Financial Economics 77 483ndash527
Brown Lawrence D and Yen-Jung Lee 2011 Changes in Option-Based Compensation Around
the Issuance of SFAS123R Journal of Business Finance amp Accounting 38 1053ndash109
37
Brown Jeffrey R Nellie Liang and Scott Weisbenner 2007 Executive financial incentives and
payout policy Firm responses to the 2003 dividend tax cut Journal of Finance 62 1935ndash
1965
Burns Natasha Brian McTier and Kristina Minnick 2015 Equity-incentive compensation and
payout policy in Europe Journal of Corporate Finance 30 85-97
Carter Mary Ellen and Luann J Lynch 2003 The Consequences of the FASBrsquos 1998 Proposal on
Accounting for Stock Option Repricing Journal of Accounting and Economics 35 51-72
Carter Mary Ellen Luann J Lynch and Irem Tuna 2007 The role of accounting in the design of
CEO equity compensation The Accounting Review 82 327ndash357
Chava Sudheer and Amiyatosh Purnanandam 2010 CEOs versus CFOs Incentives and
corporate policies Journal of Financial Economics 97 263ndash278
Chetty Raj and Emmanuel Saez 2005 Dividend taxes and corporate behavior Evidence from the
2003 dividend tax cut The Quarterly Journal of Economics 120 791ndash833
Choudhary Preeti Shivaram Rajgopal and Mohan Venkatachalam 2009 Accelerated vesting of
employee stock options in anticipation of FAS123R Journal of Accounting Research 47 105ndash
146
Christensen Hans B and Valeri Nikolaev 2009 Contracting on Mandatory Changes to GAAP
New Practice and Its Determinants Working Paper University of Chicago
Chu Yongqiang and Tao Ma 2015 How does management compensation affect bank risk taking
evidence from FAS 123R University of South Carolina Working Paper
Cuny Charles J Gerald S Martin and John J Puthenpurackal 2009 Stock options and total
payout Journal of Financial and Quantitative Analysis 44 391ndash410
DeAngelo Harry Linda DeAngelo and Douglas J Skinner 2000 Special Dividends and the
Evolution of Dividend Signaling Journal of Financial Economics 57 309-354
Dechow Patricia M Amy P Hutton and Richard G Sloan 1996 Economic consequences of
accounting for stock-based compensation Journal of Accounting Research 34 1ndash20
Edgerton J 2013 Four facts about dividend payouts and the 2003 tax cut International Tax and
Public Finance 20 769-784
Edmans Alex and Xavier Gabaix 2015 Executive compensation a modern primer Journal of
Economic Literature forthcoming
38
Fama Eugene F and Kenneth R French 2001 Disappearing dividends changing firm
characteristics or lower propensity to pay Journal of Financial Economics 60 3ndash43
Farre-Mensa Joan Roni Michaely and Martin C Schmalz 2014 Payout policy Annual Review
of Financial Economics 6 75ndash134
Fenn George W and Nellie Liang 2001 Corporate payout policy and managerial stock
incentives Journal of Financial Economics 60 45ndash72
Ferri Fabrizio and Tatiana Sandino 2009 The impact of shareholder activism on financial
reporting and compensation the case of employee stock options expensing The Accounting
Review 84 433ndash466
Floyd Eric Nan Li and Douglas J Skinner 2015 Payout policy through the financial crisis the
growth of repurchases and the resilience of dividends Journal of Financial Economics 118
299-316
Frydman Carola and Dirk Jenter 2010 CEO compensation Annual Review of Financial
Economics 2 75-102
Gipper Brandon 2015 Assessing the Effects of Disclosing Management Compensation Working
Paper University of Chicago
Gormley Todd David Matsa and Todd Milbourn 2013 CEO compensation and corporate risk
evidence from a natural experiment Journal of Accounting and Economics 56 79-101
Graham John Michelle Hanlon and Terry Shevlin 2011 Real effects of accounting rules
evidence from multinational firmsrsquo investment locations and profit repatriation decisions
Journal of Accounting Research 49 137-185
Graham John Campbell Harvey and Shiva Rajgopal 2005 The Economic implications of
corporate financial reporting Journal of Accounting and Economics 40 3-73
Greenspan Alan 2002 Testimony of Alan Greenspan before the Committee on Banking
Housing and Urban Affairs US Senate July 16 Washington DC Government Printing
Office
Grullon Gustavo and Roni Michaely 2002 Dividends Share Repurchases and the Substitution
Hypothesis Journal of Finance 57 1649-1684
Hail Luzi Ahmed Tahoun and Clare Wang 2014 Dividend Payouts and Information Shocks
Journal of Accounting Research 52 403-456
Hall Brian J and Kevin J Murphy 2002 Stock options for undiversified executives Journal of
Accounting amp Economics 33 3-42
39
Hall Brian J and Kevin J Murphy 2003 The trouble with stock options Journal of Economic
Perspectives 17 49ndash70
Hanlon Michelle and Jeffrey L Hoopes 2014 What do firms do when dividend tax rates change
An examination of alternative payout responses Journal of Financial Economics 114 105-
124
Hayes Rachel M Michael Lemmon and Mingming Qiu 2012 Stock options and managerial
incentives for risk taking Evidence from FAS123R Journal of Financial Economics 105
174ndash190
Heron Randall A Erik Lie 2007 Does backdating explain the stock price pattern around
executive stock option grants Journal of Financial Economics 83 271-295
Hribar Paul Nicole Thorne Jenkins and W Bruce Johnson 2006 Stock repurchases as an
earnings management device Journal of Accounting and Economics 41 3ndash27
Jensen Michael C 1986 Agency cost of free cash flow corporate finance and takeovers
American Economic Review 76 323-329
Jolls Christine 1998 Stock repurchases and incentive compensation NBER Working Paper No
w6467
Jung Boochun Woo-Jong Lee and Yanhua Sunny Yang 2016 The Impact of Dividend
Covenants on Investment and Operating Performance Journal of Business Finance amp
Accounting 43 414ndash447
Kahle Kathleen M 2002 When a buyback isnrsquot a buyback open market repurchases and
employee options Journal of Financial Economics 63 235ndash261
Lambert Richard A William N Lanen and David F Larcker 1989 Executive stock option plans
and corporate dividend policy Journal of Financial and Quantitative Analysis 24 409ndash425
Lintner John 1956 Distribution of incomes of corporations among dividends retained earnings
and taxes The American Economic Review 46 97-113
Low Angie 2009 Managerial risk-taking behavior and equity-based compensation Journal of
Financial Economics 92 470-490
Miller Merton H and Franco Modigliani 1961 Dividend policy growth and the valuation of
shares The Journal of Business 34 411ndash433
Minnick Kristina and Leonard Rosenthal 2015 Stealth compensation Do CEOs increase their
pay by influencing dividend policy Journal of Corporate Finance 25 435-454
40
Murphy Kevin J 1999 Executive compensation In O Ashenfelter and D Card (eds) North
Holland Handbook of Labor Economics Amsterdam Elsevier Science BV
Murphy Kevin J 2013 Executive compensation Where we are and how we got there Handbook
of the Economics of Finance Elsevier Science North Holland 211-356
Nikolaev Valeri 2010 Debt Covenants and Accounting Conservatism Journal of Accounting
Research 48 143-176
Puri Manju Joumlrg Rocholl and Sascha Steffen 2011 Global retail lending in the aftermath of the
US financial crisis Distinguishing between supply and demand effects Journal of Financial
Economics 100 556-578
Shue Kelly and Richard R Townsend 2014 Swinging for the fences Executive reactions to
quasi-random option grants Working Paper University of Chicago
Skinner Douglas J 2008 The evolving relation between earnings dividends and stock
repurchases Journal of Financial Economics 87 582-609
Weisbenner Scott J 2000 Corporate share repurchases in the 1990s What role do stock options
play FEDS Working Paper No 2000-29
Zhang Dan 2013 CEO dividend protection Working Paper BI Norwegian Business School
41
Figure 1 Trends of dividends and repurchases from 2003 to 2007 Panel A plots the average
Regular DividendTotal Assets of firms in the highest and lowest quartiles of Accounting Impact
measured in 2002 Panel B shows the average Total RepurchaseTotal Assets of firms in the
highest and lowest quartiles of Accounting Impact measured in 2002
Panel A Trends of regular dividends
Panel B Trends of total repurchases
00
05
10
15
20
2003 2004 2005 2006 2007
Regular DividendTotal Assets
Lowest Acc Impact
Highest Acc Impact
Pre Post
00
20
40
60
80
100
2003 2004 2005 2006 2007
Total Repurchase Total Assets
Lowest Acc Impact
Highest Acc Impact
Pre Post
42
Table 1
Summary Statistics
Panel A Firm characteristics - full sample
N Mean Std dev 25 pctl Median 75 pctl
Accounting impact (2002) 1176 173 366 022 052 163
Payout variablesRegular dividendTotal assets 5653 093 148 000 000 142
RepurchaseTotal assets 5653 394 710 000 035 500
Total payoutTotal assets 5653 488 748 000 175 666
Regular dividendTotal payout 4091 3874 4057 000 2237 8833
Level of executive compensation (in $1000)
Salary_$ 5653 450 190 314 409 544
Bonus_$ 5653 476 616 122 295 586
Option grant_$ 5653 791 1137 62 384 1002
Restricted stock grant_$ 5653 458 866 0 58 518
Total pay_$ 5653 2481 2475 890 1647 3074
Percentage of executive compensation
Salary_ 5653 296 183 165 251 382
Bonus_ 5653 197 148 97 177 268
Option grant_ 5653 283 235 67 256 445
Restricted stock grant_ 5653 141 180 00 41 249
Control variables
Size ($M) 5653 11086 27294 1017 2459 8117
Log(size) 5653 7985 1565 6925 7808 9002
Book-to-market 5653 0445 0287 0251 0388 0578
Leverage 5653 0202 0172 0038 0187 0309
Asset tangibility 5653 0806 0184 0691 0853 0965
Free cash flow 5653 0059 0091 0013 0059 0108
Cash holding 5653 0166 0172 0034 0100 0247
ROA volatility 5653 0056 0056 0021 0038 0070
Institutional ownership 5653 0753 0202 0639 0795 0910
Sales growth 5653 0121 0189 0028 0096 0183
Past stock return 5653 0094 0183 -0012 0094 0199
Loss indicator 5653 0164 0370 0000 0000 0000
This table presents summary statistics Panel A shows the descriptive statistics of payout variables compensation
variables and other firm characteristics for the full sample Accounting impact is the implied option expense
measured at fiscal year 2002 All other variables are measured at firm-year level from fiscal year 2003 to 2007
resulting in 5653 firm-year observations (except for Regular dividendTotal Payout which can be measured only
for the 4901 firm-year observations with Total payout greater than zero) Panel B shows the pairwise correlations
between main variables at firm-year level Panel C compares payout variables compensation variables and other
firm characteristics before and after FAS123R The Pre-FAS123R period consists of fiscal year 2003 and 2004
the Post-FAS123R period covers fiscal year 2005-2007 Panel D compares the trends of payout and compensation
variables around FAS123R across four quartile groups ranked by 2002 accounting impact Panel E compares the
trends of payout and compensation variables around FAS123R between the treated and control group under the
alternative treatment definition in Bakke et al (2015) (see Section 22) All variables are defined in Appendix The
notation and in Panel C indicates statistically significant at 10 5 and 1 level in T-tests for equal
means respectively
43
Pa
nel
B
Pea
rso
n c
orr
ela
tio
ns
Reg div
Repurchase
Total payout
Salary_
Bonus_
Option_
RS_
Log(size)
BM
Leverage
Tangibility
FCF
Cash holdingROA vol
Inst own
Sales growth
Past ret
urn
Loss
Reg
div
10
0
Repurc
hase
01
610
0
Tota
l payout
03
509
810
0
Sala
ry_
-0
10
-01
8-0
19
10
0
Bonus_
00
700
100
3-0
01
10
0
Option_
-0
10
00
900
6-0
41
-03
510
0
RS
_
01
000
901
0-0
32
-01
1-0
40
10
0
Log(s
ize)
03
101
802
3-0
56
01
101
202
210
0
BM
-02
1-0
28
-03
103
0-0
03
-02
000
0-0
33
10
0
Levera
ge
-00
1-0
08
-00
8-0
05
00
6-0
11
00
801
9-0
03
10
0
Tangib
ility
00
200
100
101
200
1-0
05
-00
6-0
12
-00
4-0
18
10
0
FC
F02
203
703
9-0
20
00
901
1-0
01
02
4-0
32
-02
1-0
16
10
0
Cash
hold
ing
-01
301
000
700
2-0
14
02
2-0
10
-02
3-0
16
-03
502
901
210
0
RO
A v
ol
-01
5-0
04
-00
700
4-0
11
01
9-0
11
-02
3-0
08
-01
101
2-0
02
03
910
0
Inst
ow
n
-00
901
401
1-0
17
00
200
701
200
7-0
01
00
3-0
08
01
4-0
06
-01
110
0
Sale
s gro
wth
-00
8-0
04
-00
6-0
15
00
501
0-0
02
00
7-0
16
-00
3-0
08
01
300
201
400
410
0
Past
retu
rn00
901
301
4-0
18
01
5-0
01
00
301
6-0
29
-01
000
102
7-0
14
-01
001
602
710
0
Loss
-02
0-0
19
-02
201
8-0
18
00
4-0
05
-02
601
901
300
6-0
41
01
702
3-0
16
-01
8-0
40
10
0
44
Panel C Firm characteristics - before and after FAS123R
Pre FAS 123R Post FAS 123R Difference
Payout variables
Regular dividendTotal assets 083 099 016
RepurchaseTotal assets 245 490 245
Total payoutTotal assets 328 589 261
Regular dividendTotal payout 3914 2790 -1124
Level of executive compensation (in $1000)
Salary_$ 426 463 37
Bonus_$ 418 505 87
Option grant_$ 896 707 -191
Restricted stock grant_$ 269 574 305
Total pay_$ 2263 2584 321
Percentage of executive compensation
Salary_ 305 293 -12
Bonus_ 186 204 18
Option grant_ 343 240 -103
Restricted stock grant_ 87 176 89
Control variables
Size ($M) 9671 11631 1960
Log(size) 7860 8035 0175
Book-to-market 0437 0453 0016
Leverage 0201 0203 0002
Asset tangibility 0822 0793 -0029
Free cash flow 0061 0057 -0004
Cash holding 0175 0159 -0016
ROA volatility 0067 0048 -0019
Institutional ownership 0712 0781 0069
Sales growth 0137 0108 -0029
Past stock return 0080 0101 0021
Loss indicator 0173 0159 -0014
45
Pa
nel
D
Fir
m c
ha
racte
rist
ics
by q
ua
rtil
e o
f a
cco
un
tin
g i
mp
act
- b
efo
re a
nd
aft
er
FA
S1
23
R
Accounting im
pact
(2002)
Num
ber
of
Fir
ms
Pre
Post
Pre
Post
Pre
Post
Pre
Post
Payout
vari
able
s
Regula
r div
idendT
ota
l ass
ets
11
2
12
4
09
4
11
1
09
5
11
3
03
0
04
9
Repurc
hase
Tota
l ass
ets
11
3
26
8
19
2
37
3
32
7
63
1
35
1
68
7
Tota
l payout
Tota
l ass
ets
22
4
39
1
28
5
48
4
42
2
74
4
38
1
73
6
Regula
r div
idendT
ota
l payout
643
7
469
8
474
0
341
1
284
5
195
4
82
5
74
5
Perc
enta
ge o
f executive c
om
pensa
tion
Sala
ry_
337
295
313
287
296
289
276
300
Bonus_
223
226
214
228
172
192
134
169
Option g
rant_
201
167
290
210
373
260
507
325
Rest
ricte
d s
tock g
rant_
116
194
98
180
89
176
43
155
294
294
294
294
1st Q
uart
ile2
nd Q
uart
ile3
rd Q
uart
ile4
th Q
uart
ile
01
2
03
5
09
3
55
1
46
Accounting impact
Number of Firms
By accounting impact quartile
1
2
3
4
Pre Post Pre Post
Payout variables
Regular dividendTotal assets 09 11 08 10
RepurchaseTotal assets 18 31 26 52
Total payoutTotal assets 28 43 34 62
Regular dividendTotal payout 428 357 386 265
Percentage of executive compensation
Salary_ 435 364 282 280
Bonus_ 226 214 179 202
Option grant_ 92 125 387 261
Restricted stock grant_ 125 188 80 174
Percentage of CEO compensation
Salary_(CEO) 485 364 260 259
Bonus_(CEO) 249 228 185 219
Option grant_(CEO) 10 127 406 275
Restricted stock grant_(CEO) 128 182 82 183
Panel E Firm characteristics by alternative treatment definition - before and
after FAS123R
Treated
25
19
997
223
250
256
268
10
177
71
Control
44
37
47
Table 2
Differential effect of FAS123R on the use of option-based compensation
Panel A Two-period first-difference regression
Prediction Coeff t-stat Coeff t-stat Coeff t-stat
Accounting impact rank - -0044 -628
Accounting impact rank=2 - -0044 -327
Accounting impact rank=3 - -0075 -468
Accounting impact rank=4 - -0140 -613
Treated - -0132 -875
ΔLog(size) 0061 202 0061 200 0063 214
ΔBook-to-market 0032 091 0032 092 0051 143
ΔLeverage -0157 -213 -0160 -218 -0111 -153
ΔAsset tangibility -0012 -014 -0020 -023 -0023 -026
ΔFree cash flow -0106 -095 -0108 -097 -0128 -117
ΔCash holding -0197 -211 -0193 -206 -0180 -194
ΔFive-year ROA volatility -0065 -031 -0056 -026 -0098 -047
ΔInstitutional ownership -0044 -091 -0043 -088 -0044 -092
ΔSales growth -0064 -102 -0065 -104 -0090 -153
ΔPast one-year stock return 0051 078 0052 080 0091 138
ΔLoss frequency 0056 207 0057 207 0047 179
Log(size) -0009 -210 -0009 -207 -0002 -035
Book-to-market -0015 -056 -0013 -049 0018 072
Leverage 0022 046 0023 048 0068 150
Asset tangibility 0033 077 0033 078 0053 128
Free cash flow 0227 202 0220 195 0127 117
Cash holding -0002 -004 0012 019 -0078 -141
Five-year ROA volatility -0451 -240 -0430 -228 -0509 -283
Institutional ownership -0123 -360 -0122 -359 -0100 -292
Sales growth -0041 -056 -0040 -055 -0089 -125
Past one-year stock return -0009 -015 -0006 -010 0078 125
Loss frequency 0055 174 0056 178 0054 173
Fixed effect
Standard error
Adj R-squared
Observations
Model (3)
Dependent variable ΔAvg Option grantTotal pay
Huber-White
0156
This table investigates whether the effect of FAS123R on the use of option-based pay varies with its potential accounting impact Panel A
reports the results of estimating three two-period first-differencing models where for each firm we average its characteristics in Pre- and
Post-FAS123R period The Pre-FAS123R period consists of fiscal year 2003 and 2004 the Post-FAS123R period covers fiscal year 2005-
2007 In all three specifications the dependent variable is the change of average Option grantTotal pay from Pre- to Post-FAS123R period
The main independent variable varies by model in Model (1) the Accounting impact rank is the quartile rank of implied option expensetotal
assets measured in 2002 (1=lowest 4=highest) In Model (2) Accounting impact rank=2 (3 4) is an indicator that takes value of one if the
firmrsquos Accounting impact rank equals 2 (3 4) In Model (3) we use an alternative treatment construction following Bakke et al (2015)
where Treated is an indicator that takes value of zero if the firm granted zero option to its CEO in both 2003 and 2004 or the firm began to
voluntarily expense option-based pay at fair value in 2002 or earlier and one otherwise For each control variable we include both its level in
the Pre-FAS123R period and its change across the two periods Panel B shows the results of estimating fixed effect models with firm-year
observations The dependent variable is the firm-year level Option grantTotal pay The main independent variables are the interactions of
Post-FAS123R indicator (Post) with Accounting Impact rank Accounting impact rank indicators and Treated respectively All models in
Penal A have industry fixed effects and the standard errors are Huber-White heteroscedasticity-consistent standard errors All models in
Penal B have firm fixed effects and year fixed effects and the standard errors are clustered at firm level All variables are defined in
Appendix The notation and indicates statistically significant at 10 5 and 1 level respectively
Model (1) Model (2)
11711171 1171
Industry Industry
Huber-White
0124
Huber-White
0123
Industry
48
Panel B Panel fixed effects regression
Prediction Coeff t-stat Coeff t-stat Coeff t-stat
Acc impact rank x Post - -0044 -807
Acc impact rank 2 x Post - -0046 -333
Acc impact rank 3 x Post - -0077 -526
Acc impact rank 4 x Post - -0137 -776
Treated x Post - -0145 -970
Log(size) 0034 221 0034 217 0036 229
Book-to-market 0018 084 0017 083 0015 070
Leverage -0004 -009 -0006 -013 -0007 -015
Asset tangibility 0007 012 0004 006 0011 018
Free cash flow -0074 -151 -0072 -146 -0078 -158
Cash holding -0048 -086 -0050 -090 -0006 -011
Five-year ROA volatility 0250 231 0239 219 0437 414
Institutional ownership 0043 159 0044 161 0041 150
Sales growth -0033 -168 -0034 -171 -0031 -158
Past one-year stock return 0067 221 0068 224 0063 204
Loss indicator 0023 209 0022 207 0024 222
Fixed effects
Standard error
Adj R-squared
Observations
Dependent variable Option grantTotal pay
5653 5653 5653
Clustered by firm
Firm Year
Clustered by firm
Firm Year
Clustered by firm
0523 0523 0526
Model (1) Model (2) Model (3)
Firm Year
49
Table 3
Effect of option-based compensation on dividend policy
Panel A Two-period first-difference regression
Prediction Coeff t-stat Coeff t-stat Coeff t-stat
Accounting impact rank + 0000 077
Accounting impact rank=2 + 0001 091
Accounting impact rank=3 + 0000 044
Accounting impact rank=4 + 0001 092
Treated + 0000 -026
ΔLog(size) 0000 -030 0000 -030 0000 -026
ΔBook-to-market -0002 -190 -0002 -193 -0002 -195
ΔLeverage -0002 -059 -0002 -057 -0002 -059
ΔAsset tangibility 0016 431 0016 429 0016 430
ΔFree cash flow 0017 373 0017 373 0017 375
ΔCash holding -0011 -288 -0011 -285 -0010 -282
ΔFive-year ROA volatility 0003 034 0002 032 0003 035
ΔInstitutional ownership -0002 -073 -0002 -073 -0002 -070
ΔSales growth -0001 -040 -0001 -037 -0001 -038
ΔPast one-year stock return 0002 077 0002 076 0002 070
ΔLoss frequency 0000 -048 0000 -045 0000 -046
Log(size) 0000 183 0000 182 0000 182
Book-to-market -0002 -227 -0002 -225 -0002 -284
Leverage -0001 -037 -0001 -039 -0001 -048
Asset tangibility 0003 179 0003 180 0003 176
Free cash flow 0017 291 0017 291 0017 300
Cash holding 0002 080 0002 077 0002 098
Five-year ROA volatility 0003 035 0002 033 0003 044
Institutional ownership -0001 -068 -0001 -068 -0001 -058
Sales growth -0004 -177 -0004 -175 -0004 -172
Past one-year stock return 0004 169 0004 167 0004 165
Loss frequency -0001 -111 -0001 -109 -0001 -102
Fixed effect
Standard error
Adj R-squared
Observations
Dependent variable ΔAvg Regular dividendTotal assets
This table investigates the causal effect of option-based pay on dividend policy by examining whether changes in dividend policy around
FAS123R vary with its potential accounting impact Panel A reports the results of estimating three two-period first-differencing models
where for each firm we average its characteristics in Pre- and Post-FAS123R period In all three specifications the dependent variable is
the change of average Regular dividendTotal assets from Pre- to Post-FAS123R period The main independent variable varies by model in
Model (1) the Accounting impact rank is the quartile rank of implied option expensetotal assets measured in 2002 (1=lowest 4=highest) In
Model (2) Accounting impact rank=2 (3 4) is an indicator that takes value of one if the firmrsquos Accounting impact rank equals 2 (3 4) In
Model (3) we use an alternative treatment construction following Bakke et al (2015) where Treated is an indicator that takes value of zero
if the firm granted zero option to its CEO in both 2003 and 2004 or the firm began to voluntarily expense option-based pay at fair value in
2002 or earlier and one otherwise For each control variable we include both its level in the Pre-FAS123R period and its change across the
two periods Panel B shows the results of estimating fixed effect models with firm-year observations The dependent variable is the firm-
year level Regular dividendTotal assets The main independent variables are the interactions of Post-FAS123R indicator (Post) with
Accounting Impact rank Accounting impact rank indicators and Treated respectively Panel C examines the intensity of dividend changes
among firms with nonzero dividend per share in 2003 or 2004 In particular we estimates the same three models as in Panel A(with the
same independent variables) but for five dependent variables the change of average Regular dividendTotal assets from Pre- to Post-
FAS123R period (as in Panel A) the percentage change of DPS (dividend per share) from Pre- to Post-FAS123R period and three
indicators denoting respectively whether the percentage change of DPS was greater than 20 40 and 60 Panel D reports four
robustness tests of the dividend intensity regression In each of them a set of possible confounding observations is removed (see Section 33
for details) Panel E compares the trends of dividend initiation and termination around FAS123R across four quartile groups ranked by
accounting impact All models in Panel A C and D have industry fixed effects and the standard errors are Huber-White heteroscedasticity-
consistent standard errors All models in Penal B have firm fixed effects and year fixed effects and the standard errors are clustered at
firm level All variables are defined in Appendix The notation and indicates statistically significant at 10 5 and 1 level
Industry Industry Industry
Model (1) Model (2) Model (3)
1171 1171 1171
Huber-White Huber-White Huber-White
0105 0104 0105
50
Panel B Panel fixed effects regression
Prediction Coeff t-stat Coeff t-stat Coeff t-stat
Acc impact rank x Post + 0000 122
Acc impact rank 2 x Post + 0001 110
Acc impact rank 3 x Post + 0001 094
Acc impact rank 4 x Post + 0001 129
Treated x Post + 0000 -012
Log(size) 0001 179 0001 179 0001 181
Book-to-market 0000 025 0000 024 0000 031
Leverage 0001 062 0001 064 0001 069
Asset tangibility 0009 360 0009 358 0009 363
Free cash flow 0002 090 0002 093 0002 092
Cash holding -0007 -295 -0007 -298 -0007 -298
Five-year ROA volatility 0001 041 0001 038 0000 -006
Institutional ownership 0000 -027 0000 -026 0000 -027
Sales growth 0000 053 0000 051 0000 044
Past one-year stock return 0001 089 0001 088 0001 078
Loss indicator 0000 -060 0000 -057 0000 -076
Fixed effects
Standard error
Adj R-squared
Observations
Dependent variable Regular dividendTotal assets
Model (1) Model (2) Model (3)
Firm Year Firm Year Firm Year
5653 5653 5653
Clustered by firm Clustered by firm Clustered by firm
0877 0877 0877
51
Panel C Intensity of dividend changes around FAS123R
Prediction Coeff t-stat Coeff t-stat Coeff t-stat
Accounting impact rank + 0000 065
Accounting impact rank=2 + 0000 048
Accounting impact rank=3 + 0000 026
Accounting impact rank=4 + 0002 080
Treated + 0001 063
Dependent var DPS pct change
Accounting impact rank + -0145 -072
Accounting impact rank=2 + 0018 006
Accounting impact rank=3 + -0177 -045
Accounting impact rank=4 + -0746 -100
Treated + -0407 -119
Accounting impact rank + 0029 095
Accounting impact rank=2 + 0040 074
Accounting impact rank=3 + 0092 139
Accounting impact rank=4 + 0008 007
Treated + -0007 -012
Accounting impact rank + 0024 076
Accounting impact rank=2 + 0047 088
Accounting impact rank=3 + 0079 114
Accounting impact rank=4 + -0003 -002
Treated + 0030 052
Accounting impact rank + 0030 098
Accounting impact rank=2 + 0078 155
Accounting impact rank=3 + 0085 130
Accounting impact rank=4 + 0014 012
Treated + -0006 -011
Control variables
Fixed effect
Standard error
Observations 572 572 572
Yes Yes Yes
Huber-White Huber-White Huber-White
Industry Industry Industry
Dependent var DPS pct
change gt60 indicator
Model (1) Model (2) Model (3)
Dependent var ΔAvg Regular
dividendAssets
Dependent var DPS pct
change gt20 indicator
Dependent var DPS pct
change gt40 indicator
52
Panel D Robustness tests for intensity of dividend changes around FAS123R
Prediction Coeff t-stat Coeff t-stat Coeff t-stat
Accounting impact rank + 0006 017
Accounting impact rank=2 + 0067 118
Accounting impact rank=3 + 0041 057
Accounting impact rank=4 + -0061 -049
Treated + 0022 035Observations
Accounting impact rank + 0009 027
Accounting impact rank=2 + 0058 106
Accounting impact rank=3 + 0032 043
Accounting impact rank=4 + -0032 -024
Treated + 0018 028
Observations
Accounting impact rank + 0030 089
Accounting impact rank=2 + 0039 071
Accounting impact rank=3 + 0122 168
Accounting impact rank=4 + -0063 -052
Treated + 0075 132
Observations
Accounting impact rank + 0008 023
Accounting impact rank=2 + 0023 042
Accounting impact rank=3 + 0048 064
Accounting impact rank=4 + -0042 -033
Treated + -0010 -016
Observations
Control variables
Fixed effect
Standard error
Exclude firms with stable
payout ratio from 2003 to 2004
506 506 506
Dependent variable DPS pct change gt40 indicator
Model (1) Model (2) Model (3)
Exclude voluntary expensers
519 519
Exclude firms in the top decile
of option reduction (02-04)
Exclude firms that accelerated
option vesting
504 504 504
517 517 517
519
Huber-White Huber-White Huber-White
Yes Yes Yes
Industry Industry Industry
53
Panel E Dividend initiation and termination rates around FAS123R
Pre FAS 123R
1 280 75 7 6 13 173
2 284 135 18 9 27 200
3 286 181 11 14 25 138
4 282 260 9 10 19 73
Total 1132 651 45 39 84 129
Post FAS 123R
1 275 63 4 4 8 127
2 280 116 9 9 18 155
3 276 152 9 3 12 79
4 263 223 5 1 6 27
Total 1094 554 27 17 44 79
Pre FAS 123R
1 280 205 2 0 2 10
2 284 149 7 1 8 54
3 286 105 0 0 0 00
4 282 22 0 0 0 00
Total 1132 481 9 1 10 21
Post FAS 123R
1 275 212 3 6 9 42
2 280 164 1 2 3 18
3 276 124 1 1 2 16
4 263 40 0 3 3 75
Total 1094 540 5 12 17 31
termination
in 2004
03-04
cumulative
03-04
cumulative
Quartile firms
with
dividend in
2004
termination
in 2005
termination
in 2006
05-06
cumulative
05-06
cumulative
Termination
Quartile firms
with
dividend in
2002
termination
in 2003
without
dividend in
2004
initiation in
2003
initiation in
2004
03-04
cumulative
03-04
cumulative firmsQuartile
firmsQuartile initiation in
2005
initiation in
2006
05-06
cumulative
05-06
cumulative
Initiation
without
dividend in
2002
54
Table 4
Effect of option-based compensation on repurchases
Panel A Two-period first-difference regression with total repurchase
Prediction Coeff t-stat Coeff t-stat Coeff t-stat
Accounting impact rank - 0002 122
Accounting impact rank=2 - 0002 071
Accounting impact rank=3 - 0005 123
Accounting impact rank=4 - 0007 102
Treated - 0014 365
Control variables
Fixed effect
Standard error
Adj R-squared
Observations
Panel B Two-period first-difference regression with net repurchase
Prediction Coeff t-stat Coeff t-stat Coeff t-stat
Accounting impact rank - 0003 166
Accounting impact rank=2 - 0002 051
Accounting impact rank=3 - 0006 165
Accounting impact rank=4 - 0009 137
Treated - 0010 300
Control variables
Fixed effect
Standard error
Adj R-squared
Observations
Panel C Two-period first-difference regression with repurchase adjusted for exercised options
Prediction Coeff t-stat Coeff t-stat Coeff t-stat
Accounting impact rank - 0001 056
Accounting impact rank=2 - 0002 062
Accounting impact rank=3 - 0007 172
Accounting impact rank=4 - -0001 -008
Treated - 0006 197
Control variables
Fixed effect
Standard error
Adj R-squared
Observations
Dependent variable ΔAvg RepurchaseTotal assets
This table investigates the causal effect of option-based pay on payout policy by examining whether the changes of repurchase around
FAS123R vary with its potential accounting impact Panel A reports the results of estimating three two-period first-differencing models
where for each firm we average its characteristics in Pre- and Post-FAS123R period In all three specifications the dependent variable is
the change of average RepurchaseTotal assets from Pre- to Post-FAS123R period The main independent variable varies by model in
Model (1) the Accounting impact rank is the quartile rank of implied option expensetotal assets measured in 2002 (1=lowest 4=highest)
In Model (2) Accounting impact rank=2 (3 4) is an indicator that takes value of one if the firmrsquos Accounting impact rank equals 2 (3 4)
In Model (3) we use an alternative treatment construction following Bakke et al (2015) where Treated is an indicator that takes value of
zero if the firm granted zero option to its CEO in both 2003 and 2004 or the firm began to voluntarily expense option-based pay at fair
value in 2002 or earlier and one otherwise Panel B reports the regressions with the change of Net repurchaseTotal assets as the
dependent variable and the same independent variable as in Panel A Panel C reports the regressions with the change of Adjusted
repurchaseTotal assets as the dependent variable and the same independent variable as in Panel A All models in Panel A B and C have
industry fixed effects and the standard errors are Huber-White heteroscedasticity-consistent standard errors All variables are defined in
Appendix The notation and indicates statistically significant at 10 5 and 1 level respectively
Model (1) Model (2) Model (3)
Yes Yes Yes
Industry Industry Industry
Huber-White Huber-White Huber-White
Dependent variable ΔAvg Net repurchaseTotal assets
1171 1171 1171
0238 0237 0245
Model (1) Model (2) Model (3)
Yes Yes Yes
Industry Industry Industry
Huber-White Huber-White Huber-White
Dependent variable ΔAvg Adjusted repurchaseTotal assets
0229 0229 0233
1171 1171 1171
Model (1) Model (2) Model (3)
Yes Yes Yes
Industry Industry Industry
Huber-White Huber-White Huber-White
0111 0112 0114
1168 1168 1168
55
Table 5
Effect of option-based compensation on payout mix
Panel A Two-period first-difference regression with total payout mix
Prediction Coeff t-stat Coeff t-stat Coeff t-stat
Accounting impact rank + 0006 028
Accounting impact rank=2 + 0018 045
Accounting impact rank=3 + -0001 -001
Accounting impact rank=4 + 0043 052
Treated + -0035 -094
Control variables
Fixed effect
Standard error
Adj R-squared
Observations
Panel B Two-period first-difference regression with net payout mix
Prediction Coeff t-stat Coeff t-stat Coeff t-stat
Accounting impact rank + -0002 -008
Accounting impact rank=2 + 0008 016
Accounting impact rank=3 + 0018 034
Accounting impact rank=4 + -0059 -055
Treated + -0050 -101
Control variables
Fixed effect
Standard error
Adj R-squared
Observations
0049 0043 0054
257 257 257
Industry Industry Industry
Huber-White Huber-White Huber-White
Dependent variable ΔAvg Regular dividendNet payout
Model (1) Model (2) Model (3)
Yes Yes Yes
0154 0151 0156
362 362 362
Industry Industry Industry
Huber-White Huber-White Huber-White
This table investigates the causal effect of option-based pay on payout mix for firms using both dividend and repurchase by examining
whether the changes of payout mix around FAS123R vary with its potential accounting impact Panel A reports the results of estimating
three two-period first-differencing models where for each firm we average its characteristics in Pre- and Post-FAS123R period In all three
specifications the dependent variable is the change of average Regular dividendTotal payout from Pre- to Post-FAS123R period The main
independent variable varies by model in Model (1) the Accounting impact rank is the quartile rank of implied option expensetotal assets
measured in 2002 (1=lowest 4=highest) In Model (2) Accounting impact rank=2 (3 4) is an indicator that takes value of one if the firmrsquos
Accounting impact rank equals 2 (3 4) In Model (3) we use an alternative treatment construction following Bakke et al (2015) where
Treated is an indicator that takes value of zero if the firm granted zero option to its CEO in both 2003 and 2004 or the firm began to
voluntarily expense option-based pay at fair value in 2002 or earlier and one otherwise Panel B reports the regressions with the change of
Regular dividendNet payout as the dependent variable and the same independent variables as in Panel A Panel A (Panel B) is based on
observations with nonzero regular dividend and repurchase (net repurchase) in both Pre- and Post-FAS123R period All models in Panel A
and B have industry fixed effects and the standard errors are Huber-White heteroscedasticity-consistent standard errors All variables are
defined in Appendix The notation and indicates statistically significant at 10 5 and 1 level respectively
Yes Yes Yes
Dependent variable ΔAvg Regular dividendTotal payout
Model (1) Model (2) Model (3)

16
five years depending on the vesting schedule18 For the reverse causality to be plausible the
implied option expense in 2002 (the result of option grants made approximately between 1998 and
2002) needs to reflect the anticipated change in payout policy in 2005-2007 This seems unlikely
While the parallel trend assumption is not directly testable similar to other studies (Bakke
et al 2015) we examine the trends in dividends and repurchases during the Pre period Figure 1
suggests that high and low accounting impact firms (respectively top and bottom quartile of
implied option expense) exhibit similar trends in payout variables in the Pre period ie from 2003
to 2004 More formally to examine the correlation between Accounting Impact and trends in the
payout variables during the Pre period we estimate the following regression only with
observations in 2003 and 2004
Payouti = γ0 + γ1 Accounting Impacti FY2004+ γ2 FY2004+ ΓControli +Firm FE +ui (3)
where Payouti is either DividendAssets or RepurchaseAssets FY2004 is an indicator of
fiscal year 2004 Firm FE indicates firm-fixed effects If firms with varying degrees of accounting
impact have different payout trends before the adoption of FAS123R γ1 should be different from
zero However for both payout variables we find that the estimated γ1 is close to zero and not
statistically significant at 10 level (untabulated tests) Overall the parallel trends assumption
seems reasonable in our setting
3 Empirical analyses
31 Sample Selection and Summary Statistics
Our sample is the SampP 1500 firms with available data on implied option expense (from
Compustat) and on executive compensation (from Execucomp) for at least one year in the Pre
18 The accounting treatment for stock options requires their fair value at the grant date to be recognized over the
service period (usually the vesting period) Hence the implied option expense in a given year includes a fraction of
the expense associated with past option grants
17
period and one year in the Post period to ensure consistency in the sample across periods Similar
to prior studies on payout policy (Fama and French 2001 Skinner 2008) we exclude financial
firms (SIC code between 6000 and 6999) and utilities (SIC between code 4900 and 4999) as well as
firms not incorporated in the US Our final sample includes 1176 firms19 We obtain dividend
and stock returns data from CRSP stock repurchases and dividend per share data from
COMPUSTAT and institutional ownership data from Thomson Reuters 13F database Other
control variables are from CRSP and COMPUSTAT To deal with outliers we winsorize all
continuous variables at 1 and 99 by fiscal year A detailed definition of all variables and their
sources is in Appendix
Table 1 Panel A presents summary statistics of the relevant variables for the pooled sample of
5653 firm-year observations Implied option expense in 2002 (our proxy for Accounting Impact)
is on average 173 of total assets with the median at 052 This suggests that the accounting
impact is very large for a small number of firms Over the entire sample period on average
dividends represent 093 of total assets while repurchases represent 394 Untabulated
analyses indicate that in 16 of the firm-year observations only dividends are paid out in 25
only repurchases in 32 both and in 27 neither Within the subset of firm-years with a payout
dividends represent 3874 of total payout This data confirms prior evidence that repurchases
have assumed the primary role as a vehicle to return cash to shareholders (eg Floyd et al 2015)
The mean (median) total executive pay (average across the top 5 executives) is $25 million ($16
million) On average option grants and restricted stock grants represent respectively 283 and
141 of total pay while salary and bonus comprise 296 and 197 respectively The
19 The results presented in the study are similar when (i) we restrict the sample to firms with available data for the
entire (2003-2007) sample period (1009 firms) and (ii) we exclude firms with CEO turnover in the Post period
(reducing the sample size to 780 firms) as a new CEO may have a different compensation package andor adopt a
different payout policy
18
composition of CEO pay (untabulated) is similar As for the control variables the figures are
generally consistent with other studies examining SampP 1500 firms over the same period
Panel B reports the pairwise Pearson correlations among the relevant variables The
correlations are in line with the associations documented in prior studies For example larger
firms and firms with higher profitability (free cash flows) have higher payouts loss firms have
lower payouts greater volatility in operating income is associated with lower dividends
More relevant to our analysis Panel C presents the mean of each variable in the Pre and Post
period for the full sample For each variable we first compute the firm-level mean over the Pre
and the Post Period and then compute the mean of the resulting figure across all firms There is a
striking increase in repurchases which double from 245 to 490 of total assets causing a
similar increase in total payout The increase in dividends is much smaller from 083 to 099
of total assets As a result for firms with positive payout dividends become a smaller fraction of
total payout in the Post period (2790 versus 3914 in the Pre period) This trend is consistent
with Floyd et al (2015) who document a dramatic increase in repurchases in the years leading to
the 2008 financial crisis Consistent with previous studies around FAS123R there is a significant
reduction in option grants as a fraction of total executive pay (from 343 to 240) and a
corresponding increase in the use of restricted stock (from 87 to 176) with little variation in
the weight of salary and bonus (note that restricted stock salary and bonus were expensed both
before and after FAS123R) Similar patterns hold for the composition of CEO pay (untabulated)
Compared to changes in the mix of executive pay changes in the levels of control variables are
generally less pronounced
Panel D reports the change in the key compensation and payout variables from the Pre to the
Post period by quartiles of implied option expense and yields a number of insights First
19
confirming the skewness suggested by Panel A the mean implied option expense is 551 for
firms in the top quartile versus only 093 035 and 012 for firms in the second third and
bottom quartile respectively Second as expected firms with higher implied option expense have
greater use of option-based pay For example in the Pre-period option pay represents 507 of
total executive pay at firms in the top quartile versus 201 in the bottom quartile Third and
more importantly for our research design the use of option pay changes significantly from the Pre
to the Post period as a function of the accounting impact For firms in the top quartile the
percentage of total pay represented by stock options drops by 182 (from 507 to 325)
versus 113 80 and 34 for firms in the second third and bottom quartile respectively The
decline in option usage across quartiles is accompanied by an increase in restricted stock grants
while the weight of salary and bonus shows little change It is important to emphasize the
substitution of stock options with restricted stocks because restricted stocks typically pay
dividends (Zhang 2013) thus providing further reason to expect a dividend increase in response to
the FAS123R-induced decline in option pay
As for the payout variables Panel D suggests that heavy option users (firms with higher
implied option expense) generally use repurchases more than dividends consistent with the
associations documented in earlier studies In the Pre period repurchases (dividends) represent
351 (030) of total assets for the top quartile versus 113 (112) for the bottom quartile
Panel D also indicates that the increase in repurchases documented in Panel C takes place across
all quartiles As for the (much smaller) change in dividends the absolute increase is similar across
the four quartiles though the relative increase (the percentage change) appears to be slightly
higher in the top quartile Overall these figures do not suggest a shift toward dividends and away
from repurchases by firms with a large (accounting-induced) decline in the use of option pay
20
Panel E presents the same data as Panel D but based on the definition of lsquotreatmentrsquo and
lsquocontrolrsquo in Bakke et al (2015) Under this definition 997 firms are classified as treatment group
and 177 as control (171 firms are classified as lsquocontrolrsquo because they did not grant options to the
CEO in the Pre period and 6 because they were voluntarily expensing options before 2003)
Interestingly lsquotreatedrsquo firms are equally distributed across the quartiles suggesting significant
variation in the degree of treatment As discussed earlier one benefit of our approach is that it
exploits cross-sectional variation among treatment firms in terms of the likely impact of FAS123R
Also 40 of the control firms (71 out of 177) are in the lowest quartile while 35 ((37+25)177)
are in the top two quartiles reflecting the different focus of the two approaches in terms of
identifying firms less affected by FAS123R20
As for payout and compensation variables Panel E shows that the treated group experiences a
larger increase in repurchases than the control group while the (less pronounced) increase in
dividends is similar across treated and control firms Treated firms experience a 126 decrease in
option pay (from 387 to 261) with a corresponding 94 increase in the weight of restricted
stock grants (from 80 to 174) The figures are similar at the CEO level (because the
classification is based on options grants to the CEO it is useful to report pay figures at both the top
5 executives and the CEO level) Interestingly the control group experiences a pronounced
increase in the weight of option grants in total CEO pay from 10 to 127 as almost half of the
control firms issued options to their CEOs in the Post period (for these firms options as percentage
of total CEO pay increased from 0 to 254 untabulated analysis) While this increased use of
stock options suggests (ex post) that these firms were not concerned with the impact of FAS123R
another possibility is that the lack of use of option compensation for CEOs in 2003 and 2004 was
20 In untabulated analysis we find that 55 of the 171 firms issuing no options to the CEO in the Pre period granted
options to the other top executives (and perhaps to other non-executive employees) thus explaining the relatively high
implied option expense for the control group (10 versus 19 for the treatment group ndash see Panel E)
21
temporary rather than the effect of a permanent policy If these firms were planning to issue
options to the CEO in the Post period the assumption that they were unaffected by FAS123R (and
thus their use as control sample) is questionable21
32 Differential Impact of FAS123R on the Use of Option-Based Compensation
An important building block of our approach is the presumed differential impact of FAS123R
on option-based pay as a function of pre-existing implied option expense22 While Table 1 Panel
D preliminarily supports the validity of this assumption we formally examine it by estimating Eq
(1)
As reported in Table 2 Panel A we find a significant negative association between Accounting
Impact and the change in option-based pay around the adoption of FAS123R In column (1)
where we use the quartile rank of implied option expense the -0044 coefficient implies that
around FAS123R option grants over total pay decline by 44 as we move from the highest
quartile to the next Thus the reduction in top quartile firms is 132 larger than in bottom
quartile firms In column 2 we replace the quartile rank with three indicators for the highest
quartiles (with the bottom quartile collapsed in the intercept) so as to be able to compare directly
top and bottom quartile without imposing the same effect across quartiles The negative and
significant coefficient on the top quartile indicator at -0140 suggests that the reduction in option
grants over total pay is 140 larger for top quartile firms relative to bottom quartile firms
Finally in column 3 we use the indicator for treated firms following Bakke et al (2015) The
21 Panel E also shows an increase in the use of restricted stock in CEO pay packages (from 128 to 182 almost
comparable to the increase among treated firms) The concurrent increase in options and restricted stock suggests
these firms would have increased option pay significantly more had it not been for FAS123R indicating further
caution in classifying them as control group of unaffected firms 22 This is akin to the relevance assumption of instrumental variable if we interpret the implied option expense as an
instrument to the change in option-based pay
22
negative and significant coefficient at -0132 suggests that treated firms experience a 132
larger drop in the weight of option pay relative to control firms
In Panel B we re-estimate Eq (1) using a panel regression with firm- and year-fixed effects
(5653 firm-year observations) where the dependent variable is the the ratio of option grants to
total executive pay The results are virtually identical in terms of significance and magnitude of
the coefficients of interest (the interaction terms between respectively Accounting impact and
Treated and an indicator for the Post period)
Overall Table 2 suggests that high implied option expense and the introduction of FAS123R
together strongly encouraged firms to cut back option-based compensation for executives It also
supports the general validity of the approach in Bakke et al (2015) in identifying firms most
affected by FAS123R notwithstanding the concerns outlined earlier
Our test of Eq (1) focuses on executive stock options For our dividend-protection hypothesis
it is important to establish that the level of implied option expense predicts a change in executive
stock options (rather than only a change in the use of non-executive employee stock options) as we
want to capture the effect of a change in executivesrsquo incentives on payout policy At the same
time our dilution channel hypothesis assumes a change in the use of all (executive and non-
executive employee) stock options Thus in untabulated analyses we repeat the test in Eq (1) by
replacing the dependent variable with the change in the number of options granted to all
employees (scaled by the total number of outstanding shares note for this analysis we can only
use data from 2004 to 2007 because Compustat began reporting data on ESO in 2004) The
coefficient on Accounting Impact and Treated continues to be negative and significant suggesting
that the differential reduction in the use of option compensation as a function of accounting impact
23
occurred for both executive and non-executive employee stock options Indeed Brown and Lee
(2011) report a similar decrease in executive and employee stock options around FAS123R
33 Option-Based Pay and Dividend Payouts
In this section we examine the effect of an exogenous (accounting-induced) change in option
compensation on dividend policy by estimating Equation (2)
Table 3 Panel A presents the results using the change in dividends from Pre to Post as
dependent variable We find no significant association between Accounting Impact (column 1 and
2) or Treated (column 3) and the change in dividends around the adoption of FAS123R This is in
stark contrast with the negative effect of option-based pay on dividends predicted in the literature
and documented in various association studies
One concern with this lack of effect is that perhaps our setting is not powerful enough to detect
it One way to examine this possibility is the following The coefficient on Accounting Impact
rank=4 in column 2 is 0001 and the standard error (SE) is 00009 Assuming the estimated
standard error is correct then for a two-tailed t test the coefficient needs to be greater than 00015
(=SE1645) or 015 to reach the 10 percent significant level In other words if moving from
the bottom to the top quartile (which predicts a 14 differential decline in option based pay as per
Table 2 Panel A) resulted in a 015 increase of the dividendasset ratio our test would be able to
detect a causal effect of option-based pay on dividends Given the unconditional mean of the
dividendasset ratio at 093 an increase of 015 from the Pre to the Post period seems
plausible In fact the average increase from the Pre to the Post period is 016 (Table 1 Panel C)
Thus if an effect was there our test should detect it
24
Panel B presents the results using a panel regression (5653 firm-year observations) with firm-
and year-fixed effects and interaction terms between Accounting Impact (or Treated) and an
indicator for the Post period Our inferences are unchanged
These analyses are based on our full sample which includes both dividend-paying and non-
dividend-paying firms Hence they implicity treat as equal two potentially different decisions to
initiate dividends and to increase dividends For example an increase in the dividend-to-asset
ratio from 05 to 06 will be treated the same as an increase from 00 to 01 even though
the latter represents a critical dividend initiation decision23 To address this following Chetty and
Saez (2005) we separately examine how FAS123R impacts the intensity of dividend changes (for
the subset of payers) and the likelihood of dividend initiations (for the subset of non-payers)
331 Option-Based Pay and Dividend Payouts Intensity of Dividend Changes
In the first row of Panel C we repeat the analysis in Panel A for the sub-sample of 572 payers
defined as firms with positive DPS in 2003 andor 2004 Note that we report only the coefficients
of interest for parsimony In the second row we replace the dependent variable with the
percentage change in DPS DPS is the choice variable for managers (Brav et al 2005 Baker and
Wurgler 2016) and thus our preferred measure to capture changes in dividend policy To account
for skewness in this variable (Khale 2002) in the third fourth and fifth rows we use indicator
variables to denote whether the change in DPS surpasses a threshold respectively 20 40 and
60 The proportion of firms that surpass these thresholds are 59 44 and 33 respectively24
23 Initiating dividends is a critical decision for boards given the pre-commitment value that investors attach to this
decision and the strong negative market reaction when firms eliminate or reduce dividends (Brav et al 2005) For
executives trying to maximize the value of their own stock options (dividend-protection argument) the ability to
influence a dividend initiation decision is likely lower than the ability to influence a dividend increase decision 24 Although in the third fourth and fifth rows our dependent variable is a binary variable we use a linear model (OLS)
instead of a probit or logit nonlinear model The reason is that estimating fixed effects in binary response models with
panel data can cause the incidental parameters problem The coefficient estimates can be biased when the panel data
25
Across all of these specifications we find no association between Accounting Impact or Treated
and the intensity of dividend changes Thus it does not appear that an exogenous reduction in
option-based pay caused dividend-paying firms to increase dividends
In Panel D we perform four robustness tests For parsimony we show only the coefficients of
interest and only the cases where the dependent variable is an indicator denoting a greater than
40 increase in DPS The results are similar for the other four ldquointensityrdquo dependent variables
reported in Panel C
In the first row we exclude firms that began to voluntarily expense options in 2003 or 2004
(84 firms of which 68 are dividend payers) FASB added accounting for stock-based
compensation to its agenda in March 2003 and issued an Exposure Draft proposing the expensing
of stock options at fair value in March 2004 In anticipation a number of firms began to
voluntarily expense stock options in 2003 and 2004 (Aboody et al 2004) If these firms reduced
option grants and as a result increased dividends during the Pre period then their inclusion may
reduce the power of our tests and thus our ability to detect the hypothesized relation25
In a similar spirit in the second row we exclude firms in the top decile in terms of reduction in
the ratio of option grants to total pay for the top 5 executives between 2002 (the year prior to the
Pre-period) and 2004 (the end of the Pre-period) This encompasses 113 firms of which 55 are
dividend payers If these firms reduced option grants in anticipation of FAS123R and as a result
increased dividends during the Pre period their inclusion may reduce our ability to detect the
hypothesized relation
has a large number of observations but a short time series Examples of studies making a similar choice are Puri
Rocholl and Steffen (2011) and Chu and Ma (2015) 25 This is unlikely to be a serious concern as previous studies suggest that voluntary expensers made limited use of
stock options (Aboody et al 2004) In fact in our sample 79 of these firms are in the bottom two quartiles of
implied option expense (untabulated) Nonetheless we present this test for robustness
26
In the third row we exclude firms that accelerated the vesting of options before FAS123R
became effective in order to avoid recognizing an expense for the unvested portion of these
options (Choudhary et al 2009 Balsam Reitenga and Yin 2008) This encompasses 196 firms of
which 54 are dividend payers If accelerating vesting was used to reduce the impact of FAS123R
the inclusion of these firms may reduce the power of our tests26
In the fourth row we deal with the concern that if firms target a fixed dividend to net income
ratio (Lintner 1956) and do so without adjusting for changes in accounting standards then by
decreasing net income (via option expense) the accounting change would mechanically cause a
reduction in dividends This would potentially offset and confound the increase predicted under
the dividend-protection and dilution hypotheses This seems unlikely for two reasons First firms
are notoriously reluctant to cut dividends (Brav et al 2005) Hence it seems unlikely that they
would reduce dividends in response to a decline in net income with no economic or cash flow
implications (ie re-classification of an expense from the footnotes to the income statement)
Second firms today set dividends in terms of dividend per share rather than by targeting a net
income-based payout ratio (Brav et al (2005)) As noted by Skinner (2008) over the last few
decades as earnings have become more variable the relation between earnings and dividends has
become weaker with dividend payments increasing smoothly and largely independent of the
variation in earnings Nevertheless in the fourth row we exclude the 66 dividend-paying firms that
26 These firms explicitly stated that they accelerated the vesting of stock options to avoid the accounting charge
(Choudhary et al 2009) In fact 72 are classified in the top two quartiles of implied option expense (untabulated)
Thus we would have predicted these firms to experience a significant decline in option pay To the extent that this
decline did not materialize because they minimized the impact of FAS123R by accelerating vesting the ability of
Accounting Impact to predict the reduction in option pay and thus its usefulness in examining changes in dividends
around FAS123R may be reduced The list of firms accelerating vesting was kindly provided by Jack Ciesielsky of
The Analystsrsquo Accounting Observer
27
had a similar payout ratio in 2003 and 2004 as a proxy for firms with a target net income-based
payout ratio in the Pre period27
As shown in Panel D even after excluding these subsets of firms we continue to find no
association between Accounting Impact or Treated and changes in dividends for dividend-paying
firms This is inconsistent with a causal influence of option compensation on dividend policy
Another concern is that by reducing net income and thus retained earnings FAS123R
may have pushed some firms closer to violating dividend covenants in debt contracts and
thus prevented them from increasing dividends This would bias our study against finding a
causal effect of option-based pay on dividends However this does not appear to be a
significant concern for three reasons First the recognition of an option expense does not
imply a decline in net income In fact more than 70 (75) of the full sample firms
(dividend payers) experienced an increase in net income before extraordinary items from
2004 to 2005 (the percentages are similar across the four quartiles of implied option
expense) Second dividend covenants are less common among dividend-paying firms
(Nikolaev 2010) Third most loan contracts in recent years give parties the option to
ldquofreezerdquo GAAP when facing a mandatory change in accounting principles (Christensen and
Nikolaev 2009) Firms expecting an adverse impact of FAS123R on their dividend covenants
would likely exercise this option (particularly given the non-cash nature of option-based
expense) Nonetheless to alleviate this concern we perform three additional analyses
(untabulated) (i) we repeat the tests in Panel C after excluding firms with a drop in net
income between 2004 and 2005 (ie firms that perhaps faced some covenant-related
27 We define a ldquosimilarrdquo payout to be an absolute change in payout ratio of less than 1 from 2003 to 2004 Among
these 66 firms only 39 continued to have a similar payout ratio in 2005 We also try an alternative definition where
a firm is classified as likely to be using a net income-based target payout ratio if the absolute percentage change in the
ratio from 2003 to 2004 is less than 10 (100 firms) Our inferences are unchanged
28
constrains to their payout policy as a result of FAS123R) (ii) we explicitly control for net
income and retained earnings in the regression (as in Skinner 2008) (iii) we repeat the tests
in Panel C for dividend payers with dividendsasset ratio above the sample median on the
basis that dividend covenants are less frequent among firms paying large dividends (Jung
Lee and Yang 2016) Our inferences are unchanged
332 Option-Based Pay and Dividend Payouts Dividend Initiations
In this section we examine whether the accounting-driven change in option pay affected
dividend initiations among non-payers We cannot employ the difference-in-difference approach
adopted so far by definition the same firm cannot initiate dividends in both periods However we
can provide suggestive evidence as follows First we take all firms that did not pay dividends in
2002 and group them into quartiles based on 2002 implied option expense For each quartile we
find the number of firms initiating dividends in 2003 and 2004 (the Pre period) Next we take all
firms that did not pay dividends in 2004 group them into quartiles based on 2002 implied option
expense and for each quartile find the number of firms initiating dividends in 2005 and 2006 (the
Post period) We do not include 2007 so as to have the same number of years in both periods and
make the cumulative initiation rates comparable
The left portion of Panel E reports the results of this exercise There is a general decrease in
the dividend initiation rate from the Pre to the Post period This holds both in the full sample of
non-payers (from 129 to 79) and across all quartiles This decrease may reflect a temporary
spike in 2003 and 2004 in response to the 2003 dividend tax cut documented in Chetty and Saez
(2005) It is noteworthy that initiation rates in both periods are lower among firms with higher
implied option expense This is consistent with option-heavy firms being mostly high-growth
firms less inclined to pay dividends More relevant to our research question if the lower use of
29
option compensation increased the propensity to pay dividends we would expect to see a relative
increase (ie a lower decrease) in dividend initiations among firms with the highest accounting
impact Instead the rate does not differ depending on the accounting impact There is
approximatley a 5 decline in initiation rate in each quartile In the right portion of Panel E we
examine similar data for dividend terminations While the results should be interpreted with
caution due to their rarity firms with higher accounting impact do not experience a greater decline
in termination rates Our inferences in Panel E are similar when we compared treated and control
firms following Bakke et al (2015) (untabulated)
Even after taking into account the different nature of decisions for dividend paying and non-
dividend-paying firms we fail to find evidence of a causal influence of option-based compensation
on dividend policy This finding is in contrast to the associations documented in earlier studies It
is even more remarkable as most firms replaced stock options with restricted stock which are
generally dividend-protected and should provide further incentive to increase dividends28
34 Option-Based Pay and Repurchases
In this section we examine the effect of an exogenous (accounting-induced) change in option
compensation on repurchases by estimating Equation (2)
Table 4 Panel A presents the results using the change in repurchases (scaled by total assets)
from Pre to Post as a dependent variable If the use of option-based pay had a positive effect on
firmsrsquo propensity to engage in repurchases as posited by the dividend-protection and dilution
hypotheses we should find a negative association between Accounting Impact or Treated and
repurchases Firms with a higher (accounting-driven) reduction in option-based pay should reduce
28 In a sample of SampP 500 firms between 2000 and 2009 Zhang (2013) reports that 80 of the firms granting
restricted stocks offer dividend protection In that sense the FAS123R-induced shift from stock options to restricted
stock may be characterized as a ldquoshockrdquo to dividend protection in unearned equity pay Accordingly our results cast
doubt on the causal interpretation of the positive association between dividend protection and dividend payouts
documented in prior studies (Zhang 2013 Burns et al 2015 Minnick and Rosenthal 2015)
30
the use of repurchases either because they are shifting toward a greater use of dividends andor
because they have a lower need to offset the dilutive effects of stock options However we find no
significant association between Accounting Impact (columns 1 and 2) and the change in
repurchases around the adoption of FAS123R When we use the Treated indicator (column 3) we
find a significant positive association rather than a negative one In Panel B we repeat the analysis
using net repurchases (ie repurchases after removing the effect of share issuances) following
Fama and French (2001) and Skinner (2008) Our inferences are unchanged29
This test is subject to two important caveats The first is we may not detect a decline in
repurchases because in the Post period firms need to offset the exercise of options that were
granted during the Pre period That is a post-FAS123R reduction in grants may not (yet) translate
into a reduction in exercises during the Post period which reduces our ability to test the dilution
hypothesis (ie that firms repurchase shares to offset exercises)30 However we can examine a
variation of this hypothesis where firms use repurchases to manage the effect of unexercised
options on diluted EPS (Bens et al 2003) To do so in Panel C we use a measure of adjusted
repurchases where we subtract our estimate of repurchases undertaken to offset the exercise of
ESO31 We effectively test whether firms experiencing an accounting-induced decrease in option
grants engage in less repurchases (net of exercise-driven repurchases) because their need to
manage the effect of unexercised options on diluted EPS is lower However the coefficient on
the variables of interest is either insignificant or positive inconsistent with the hypothesis
29 In the case of repurchases we do not examine separately ldquoinitiationsrdquo and ldquointensityrdquo as we do for dividends
because initiation is not clearly defined for repurchases Unlike dividends the occurrence of a repurchase in a given
year (or the lack thereof) cannot be used to infer a general policy due to the more discretionary nature of the timing of
repurchases 30 To capture the effect of lower option-based compensation on option exercises and thus on repurchases we would
ideally extend the Post period beyond 2007 However as noted by Floyd et al (2015) repurchases declined
dramatically after 2007 because of the financial crisis making it difficult to detect the effect of any other factor 31 As upper bound estimate of exercise-driven repurchases we multiply the number of ESO exercised during the year
times the average stock price during the year Since the number of ESO exercised is available in Compustat starting in
2004 Panel C is based on observations from 2004 to 2007
31
A second important caveat is that most firms replaced stock options with restricted stock
(Table 2 Panel C) Unvested restricted stock is excluded from the denominator in the computation
of basic EPS (once vested it is included) However it is included in the denominator of diluted
EPS using the treasury stock method similar to stock options Given the complexity of this
method without access to all details of restricted stock grants and option grants it is difficult to
determine whether the switch from stock options to restricted stock decreased the need for
dilution-driven repurchases as our test implicitly assumes Hence it is possible that we do not find
a decrease in repurchases because a reduced need to offset the dilutive effect of stock options was
neutralized by an increased need to offset the dilutive effect of restricted stock
Subject to the above caveats the evidence in Table 4 is not consistent with a positive causal
relation between the use of option-based pay and repurchases More precisely it suggests that
option-driven dilution concerns do not have a first-order effect on the magnitude of repurchases
even though they may play a role in the repurchase decision Hence our result is not necessarily
in conflict with the evidence in Brav et al (2005) where two-thirds of the surveyed financial
executives state that offsetting the dilutionary effect of stock option plans or other stock
programs is an important factor to their repurchase decisions
35 Option-Based Pay and Payout Composition
As an alternative to examining dividends and repurchases separately we also look at the
payout composition the change in the DividendsTotal Payout ratio from the Pre to the Post period
where Total Payout is the sum of dividends and repurchases As noted earlier we focus on the
subsample of firms with both dividends and repurchases in both Pre and Post periods so as to
capture the change in payout mix by firms routinely using both vehicles to return cash to
shareholders If the use of option-based pay causes firms to substitute repurchases for dividends
32
we should find a positive association between Accounting Impact or Treated and the payout mix
defined as DividendsTotal Payout ratio Firms with a higher accounting-driven reduction in
option-based pay should have an increase (decrease) in the relative weight of dividends
(repurchases) to the total payout However as reported in Table 5 Panel A we fail to find a
significant association between Accounting Impact (column 1 and 2) or Treated (column 3) and
the change in payout mix The results are similar when we use Net Payout (dividends plus net
repurchases) instead of Total Payout in computing the payout mix (Panel B)
Overall the combined evidence in Tables 3-5 does not support the hypothesis that option-
based compensation has negative (positive) effect on dividends (repurchases) or that it causes
firms to replace dividends with repurchases
4 Conclusion
Prior literature has documented robust associations between option-based compensation and
payout policy yet it remains unclear whether this association reflcts a causal influence We
investigate the causal effect of option-based compensation on payout policy using the adoption of
FAS123R which resulted in a significant decrease in option grants making it a plausible
exogenous shock to the use of option-based pay To overcome the challenge of no control group
we exploit the fact that firms responded differently depending on the firm-specific accounting
impact as measured by the implied option expense disclosed in the footnotes prior to FAS123R
Firms with larger expected accounting impact curtailed option-based compensation much more
aggressively than firms with lower impact Using a sample of SampP 1500 firms we find no
evidence that firms with a larger accounting-induced decline in option compensation increased
dividends reduced repurchases or changed their payout composition contrary to the widely held
belief that option-based pay has a causal influence on payout policy
33
Appendix Variable Definitions and Data Sources
Accounting Impact Variables
Accounting impact Implied option expense (Compustat XINTOPT) divided by total assets
(Compustat AT) This variable is measured at fiscal year 2002 and is time-invariant
Accounting impact rank The quartile rank of Accounting impact (1=lowest 4=highest)
Payout Variables
Regular dividendTotal assets The numerator is total regular cash dividends in the fiscal year
from the distribution dataset in CRSP Regular cash dividends are identified by the distribution
codes 1212 1222 1232 or 1242 The denominator is one-year lagged total assets (Compustat
AT)
DPS Dividend per share (Compustat DVPSX_F)
DPS pct change The percentage change of average DPS from Pre- to Post-FAS123R period
DPS pct change gtX indicator A dummy variable that equals one if DPC pct change is greater
than X and zero otherwise
RepurchaseTotal assets The numerator is the repurchase of common equity which equals total
repurchase (Compustat PRSTK) minus the change in preferred stock redemption value
(Compustat PSTKRV) The denominator is one-year lagged total assets (Compustat AT)
Net repurchaseTotal assets Net repurchase removes the effect of share issuances The
construction follows Fama and French (2001) and Skinner (2008) if the firm uses the treasury
stock method for repurchase net repurchase equals the increase in common treasury stock
(Compustat TSTKC) if the firm uses the retirement method (when common treasury stock is zero
in the current and prior year) net repurchase equals total repurchases minus stock issuance
(Compustat SSTK) and change in preferred stock redemption value (Compustat PSTKRV)
When the above measures give negative value net repurchase is set to zero
Adjusted repurchaseTotal assets Adjusted repurchase removes from total repurchase the potential
effect of repurchasing exercised options This variable equals total repurchase of common stocks
minus the product between the number of options exercised (Compustat OPTEXD) and average
stock price during the year When the above measure gives negative value adjusted repurchase is
set to zero Since the number of options exercised is not available before 2003 we drop
observations in 2003 when we use this variable
34
Total payoutTotal assets the sum of Regular dividendTotal assets and RepurchaseTotal assets
Regular dividendTotal payout regular cash dividend divided by the sum of regular cash dividend
and repurchase from common equity In the two-period analysis (Pre- vs Post-FAS123R) we
separately sum the numerator and the denominator for each firm-period and then calculate the ratio
Regular dividendNet payout regular dividend divided by the sum of regular dividend and net
repurchase In the two-period analysis (Pre- vs Post-FAS123R) we separately sum the numerator
and the denominator for each firm-period and then calculate the ratio
Compensation Variables
Salary_$ Average salary (Execucomp SALARY) of the top 5 highest paid executives in $1000
Salary_ Average salary (Execucomp SALARY) divided by average total pay (Execucomp
TDC1) of the top 5 highest paid executives
Bonus_$ Average bonus (Execucomp BONUS) of the top 5 highest paid executives in $1000
Due to a data format change we add non-equity plan-based awards (Execucomp
NON_EQ_TARG) to this measure after 2006
Bonus_ Bonus_$ divided by average total pay (Execucomp TDC1) of the top 5 highest paid
executives
Option grant_$ Average option grant value (Execucomp OPTION_AWARDS_BLK_VALUE or
OPTION_AWARDS_FV) of the top 5 highest paid executives in $1000 Due to a data format
change we use OPTION_AWARDS_FV for this measure after 2006
Option grant_ Option grant_$ divided by average total pay (Execucomp TDC1) of the top 5
highest paid executives
Restricted stock grant_$ Average restricted stock grant value (Execucomp RSTKGRNT or
STOCK_AWARDS_FV) of the top 5 highest paid executives in $1000 Due to data format
change we use STOCK_AWARDS_FV for this measure after 2006
Restricted stock grant_ Restricted stock grant_$ divided by average total pay (Execucomp
TDC1) of the top 5 highest paid executives
Total pay_$ Average total pay (Execucomp TDC1) of the top 5 highest paid executives in $1000
35
Other Characteristics
Size The book value of total assets (Compustat AT) minus the book value of common equity
(Compustat CEQ) plus the market value of common equity from CRSP in $M
Log(size) the natural logarithm of size
Book-to-market the book value of common equity dividend by its market value
Leverage long term debt plus short term debt (Compustat DLTT + DLC) divided by total assets
Asset tangibility tangible assets (Compustat AT - INTAN) divided by total assets
Free cash flow Operating cash flow (Compustat OANCF) minus capital expenditure (Compustat
CAPX) then divided by lagged total assets
Cash holding Cash and short-term investments (Compustat CHE) divided by total assets
ROA volatility the standard deviation of returns on assets (operating income before tax divided by
lagged total assets) in the past five fiscal years
Institutional ownership the number of shares held by institutional investors divided by the number
of shares outstanding from Thomson Reuters Institutional Holdings database
Sales growth the growth rate of sales (Compustat SALE) from the prior year
Past stock return annual stock return from the prior year
Loss indicator a dummy variable taking value of one if the current net income is negative and
zero otherwise
36
References
Aboody David 1996 Market Valuation of Employee Stock Options Journal of Accounting and
Economics 22 357-391
Aboody David Barth Mary E and Ron Kasznik 2004 Firms Voluntary Recognition of Stock-
Based Compensation Expense Journal of Accounting Research 42 123ndash150
Aboody David and Ron Kasznik 2008 Executive stock-based compensation and firmsrsquo cash
payout the role of shareholdersrsquo tax-related payout preferences Review of Accounting Studies
13 216ndash251
Anantharaman Divya and Yong Gyu Lee 2014 Managerial risk taking incentives and corporate
pension policy Journal of Financial Economics 111 328ndash351
Baker Malcolm and Jeffrey Wurgler 2004 A catering theory of dividends Journal of Finance
59 1125-1165
Baker Malcolm and Jeffrey Wurgler 2016 Dividends as reference points a behavioral signaling
approach Review of Financial Studies 29 697-738
Bakke Tor-Erik Hamed Mahmudi Chitru Fernando and Jesus Salas 2015 The causal effect of
option pay on corporate risk management Journal of Financial Economics forthcoming
Balsam Steven Austin Reitenga and Jennifer Yin 2008 Option acceleration in response to SFAS
No 123 (R) Accounting Horizons 22 23-45
Bens Daniel and Steven Monahan 2008 Altering Investment Decisions to Manage Financial
Reporting Outcomes Asset-Backed Commercial Paper Conduits and FIN 46 Journal of
Accounting Research 46 1017-1055
Bens Daniel A Venky Nagar Douglas J Skinner and MH Franco Wong 2003 Employee stock
options eps dilution and stock repurchases Journal of Accounting and Economics 36 51ndash90
Bertrand Marianne Esther Duflo and Sendhil Mullainathan 2004 How much should we trust
differences-in-differences estimates The Quarterly Journal of Economics 119 249ndash275
Blouin Jennifer L Jana S Raedy and Douglas A Shackelford 2011 Dividends Share
Repurchases and Tax Clienteles Evidence from the 2003 Reductions in Shareholder Taxes
The Accounting Review 86 887-914
Brav Alon John R Graham Campbell R Harvey and Roni Michaely 2005 Payout policy in the
21st century Journal of Financial Economics 77 483ndash527
Brown Lawrence D and Yen-Jung Lee 2011 Changes in Option-Based Compensation Around
the Issuance of SFAS123R Journal of Business Finance amp Accounting 38 1053ndash109
37
Brown Jeffrey R Nellie Liang and Scott Weisbenner 2007 Executive financial incentives and
payout policy Firm responses to the 2003 dividend tax cut Journal of Finance 62 1935ndash
1965
Burns Natasha Brian McTier and Kristina Minnick 2015 Equity-incentive compensation and
payout policy in Europe Journal of Corporate Finance 30 85-97
Carter Mary Ellen and Luann J Lynch 2003 The Consequences of the FASBrsquos 1998 Proposal on
Accounting for Stock Option Repricing Journal of Accounting and Economics 35 51-72
Carter Mary Ellen Luann J Lynch and Irem Tuna 2007 The role of accounting in the design of
CEO equity compensation The Accounting Review 82 327ndash357
Chava Sudheer and Amiyatosh Purnanandam 2010 CEOs versus CFOs Incentives and
corporate policies Journal of Financial Economics 97 263ndash278
Chetty Raj and Emmanuel Saez 2005 Dividend taxes and corporate behavior Evidence from the
2003 dividend tax cut The Quarterly Journal of Economics 120 791ndash833
Choudhary Preeti Shivaram Rajgopal and Mohan Venkatachalam 2009 Accelerated vesting of
employee stock options in anticipation of FAS123R Journal of Accounting Research 47 105ndash
146
Christensen Hans B and Valeri Nikolaev 2009 Contracting on Mandatory Changes to GAAP
New Practice and Its Determinants Working Paper University of Chicago
Chu Yongqiang and Tao Ma 2015 How does management compensation affect bank risk taking
evidence from FAS 123R University of South Carolina Working Paper
Cuny Charles J Gerald S Martin and John J Puthenpurackal 2009 Stock options and total
payout Journal of Financial and Quantitative Analysis 44 391ndash410
DeAngelo Harry Linda DeAngelo and Douglas J Skinner 2000 Special Dividends and the
Evolution of Dividend Signaling Journal of Financial Economics 57 309-354
Dechow Patricia M Amy P Hutton and Richard G Sloan 1996 Economic consequences of
accounting for stock-based compensation Journal of Accounting Research 34 1ndash20
Edgerton J 2013 Four facts about dividend payouts and the 2003 tax cut International Tax and
Public Finance 20 769-784
Edmans Alex and Xavier Gabaix 2015 Executive compensation a modern primer Journal of
Economic Literature forthcoming
38
Fama Eugene F and Kenneth R French 2001 Disappearing dividends changing firm
characteristics or lower propensity to pay Journal of Financial Economics 60 3ndash43
Farre-Mensa Joan Roni Michaely and Martin C Schmalz 2014 Payout policy Annual Review
of Financial Economics 6 75ndash134
Fenn George W and Nellie Liang 2001 Corporate payout policy and managerial stock
incentives Journal of Financial Economics 60 45ndash72
Ferri Fabrizio and Tatiana Sandino 2009 The impact of shareholder activism on financial
reporting and compensation the case of employee stock options expensing The Accounting
Review 84 433ndash466
Floyd Eric Nan Li and Douglas J Skinner 2015 Payout policy through the financial crisis the
growth of repurchases and the resilience of dividends Journal of Financial Economics 118
299-316
Frydman Carola and Dirk Jenter 2010 CEO compensation Annual Review of Financial
Economics 2 75-102
Gipper Brandon 2015 Assessing the Effects of Disclosing Management Compensation Working
Paper University of Chicago
Gormley Todd David Matsa and Todd Milbourn 2013 CEO compensation and corporate risk
evidence from a natural experiment Journal of Accounting and Economics 56 79-101
Graham John Michelle Hanlon and Terry Shevlin 2011 Real effects of accounting rules
evidence from multinational firmsrsquo investment locations and profit repatriation decisions
Journal of Accounting Research 49 137-185
Graham John Campbell Harvey and Shiva Rajgopal 2005 The Economic implications of
corporate financial reporting Journal of Accounting and Economics 40 3-73
Greenspan Alan 2002 Testimony of Alan Greenspan before the Committee on Banking
Housing and Urban Affairs US Senate July 16 Washington DC Government Printing
Office
Grullon Gustavo and Roni Michaely 2002 Dividends Share Repurchases and the Substitution
Hypothesis Journal of Finance 57 1649-1684
Hail Luzi Ahmed Tahoun and Clare Wang 2014 Dividend Payouts and Information Shocks
Journal of Accounting Research 52 403-456
Hall Brian J and Kevin J Murphy 2002 Stock options for undiversified executives Journal of
Accounting amp Economics 33 3-42
39
Hall Brian J and Kevin J Murphy 2003 The trouble with stock options Journal of Economic
Perspectives 17 49ndash70
Hanlon Michelle and Jeffrey L Hoopes 2014 What do firms do when dividend tax rates change
An examination of alternative payout responses Journal of Financial Economics 114 105-
124
Hayes Rachel M Michael Lemmon and Mingming Qiu 2012 Stock options and managerial
incentives for risk taking Evidence from FAS123R Journal of Financial Economics 105
174ndash190
Heron Randall A Erik Lie 2007 Does backdating explain the stock price pattern around
executive stock option grants Journal of Financial Economics 83 271-295
Hribar Paul Nicole Thorne Jenkins and W Bruce Johnson 2006 Stock repurchases as an
earnings management device Journal of Accounting and Economics 41 3ndash27
Jensen Michael C 1986 Agency cost of free cash flow corporate finance and takeovers
American Economic Review 76 323-329
Jolls Christine 1998 Stock repurchases and incentive compensation NBER Working Paper No
w6467
Jung Boochun Woo-Jong Lee and Yanhua Sunny Yang 2016 The Impact of Dividend
Covenants on Investment and Operating Performance Journal of Business Finance amp
Accounting 43 414ndash447
Kahle Kathleen M 2002 When a buyback isnrsquot a buyback open market repurchases and
employee options Journal of Financial Economics 63 235ndash261
Lambert Richard A William N Lanen and David F Larcker 1989 Executive stock option plans
and corporate dividend policy Journal of Financial and Quantitative Analysis 24 409ndash425
Lintner John 1956 Distribution of incomes of corporations among dividends retained earnings
and taxes The American Economic Review 46 97-113
Low Angie 2009 Managerial risk-taking behavior and equity-based compensation Journal of
Financial Economics 92 470-490
Miller Merton H and Franco Modigliani 1961 Dividend policy growth and the valuation of
shares The Journal of Business 34 411ndash433
Minnick Kristina and Leonard Rosenthal 2015 Stealth compensation Do CEOs increase their
pay by influencing dividend policy Journal of Corporate Finance 25 435-454
40
Murphy Kevin J 1999 Executive compensation In O Ashenfelter and D Card (eds) North
Holland Handbook of Labor Economics Amsterdam Elsevier Science BV
Murphy Kevin J 2013 Executive compensation Where we are and how we got there Handbook
of the Economics of Finance Elsevier Science North Holland 211-356
Nikolaev Valeri 2010 Debt Covenants and Accounting Conservatism Journal of Accounting
Research 48 143-176
Puri Manju Joumlrg Rocholl and Sascha Steffen 2011 Global retail lending in the aftermath of the
US financial crisis Distinguishing between supply and demand effects Journal of Financial
Economics 100 556-578
Shue Kelly and Richard R Townsend 2014 Swinging for the fences Executive reactions to
quasi-random option grants Working Paper University of Chicago
Skinner Douglas J 2008 The evolving relation between earnings dividends and stock
repurchases Journal of Financial Economics 87 582-609
Weisbenner Scott J 2000 Corporate share repurchases in the 1990s What role do stock options
play FEDS Working Paper No 2000-29
Zhang Dan 2013 CEO dividend protection Working Paper BI Norwegian Business School
41
Figure 1 Trends of dividends and repurchases from 2003 to 2007 Panel A plots the average
Regular DividendTotal Assets of firms in the highest and lowest quartiles of Accounting Impact
measured in 2002 Panel B shows the average Total RepurchaseTotal Assets of firms in the
highest and lowest quartiles of Accounting Impact measured in 2002
Panel A Trends of regular dividends
Panel B Trends of total repurchases
00
05
10
15
20
2003 2004 2005 2006 2007
Regular DividendTotal Assets
Lowest Acc Impact
Highest Acc Impact
Pre Post
00
20
40
60
80
100
2003 2004 2005 2006 2007
Total Repurchase Total Assets
Lowest Acc Impact
Highest Acc Impact
Pre Post
42
Table 1
Summary Statistics
Panel A Firm characteristics - full sample
N Mean Std dev 25 pctl Median 75 pctl
Accounting impact (2002) 1176 173 366 022 052 163
Payout variablesRegular dividendTotal assets 5653 093 148 000 000 142
RepurchaseTotal assets 5653 394 710 000 035 500
Total payoutTotal assets 5653 488 748 000 175 666
Regular dividendTotal payout 4091 3874 4057 000 2237 8833
Level of executive compensation (in $1000)
Salary_$ 5653 450 190 314 409 544
Bonus_$ 5653 476 616 122 295 586
Option grant_$ 5653 791 1137 62 384 1002
Restricted stock grant_$ 5653 458 866 0 58 518
Total pay_$ 5653 2481 2475 890 1647 3074
Percentage of executive compensation
Salary_ 5653 296 183 165 251 382
Bonus_ 5653 197 148 97 177 268
Option grant_ 5653 283 235 67 256 445
Restricted stock grant_ 5653 141 180 00 41 249
Control variables
Size ($M) 5653 11086 27294 1017 2459 8117
Log(size) 5653 7985 1565 6925 7808 9002
Book-to-market 5653 0445 0287 0251 0388 0578
Leverage 5653 0202 0172 0038 0187 0309
Asset tangibility 5653 0806 0184 0691 0853 0965
Free cash flow 5653 0059 0091 0013 0059 0108
Cash holding 5653 0166 0172 0034 0100 0247
ROA volatility 5653 0056 0056 0021 0038 0070
Institutional ownership 5653 0753 0202 0639 0795 0910
Sales growth 5653 0121 0189 0028 0096 0183
Past stock return 5653 0094 0183 -0012 0094 0199
Loss indicator 5653 0164 0370 0000 0000 0000
This table presents summary statistics Panel A shows the descriptive statistics of payout variables compensation
variables and other firm characteristics for the full sample Accounting impact is the implied option expense
measured at fiscal year 2002 All other variables are measured at firm-year level from fiscal year 2003 to 2007
resulting in 5653 firm-year observations (except for Regular dividendTotal Payout which can be measured only
for the 4901 firm-year observations with Total payout greater than zero) Panel B shows the pairwise correlations
between main variables at firm-year level Panel C compares payout variables compensation variables and other
firm characteristics before and after FAS123R The Pre-FAS123R period consists of fiscal year 2003 and 2004
the Post-FAS123R period covers fiscal year 2005-2007 Panel D compares the trends of payout and compensation
variables around FAS123R across four quartile groups ranked by 2002 accounting impact Panel E compares the
trends of payout and compensation variables around FAS123R between the treated and control group under the
alternative treatment definition in Bakke et al (2015) (see Section 22) All variables are defined in Appendix The
notation and in Panel C indicates statistically significant at 10 5 and 1 level in T-tests for equal
means respectively
43
Pa
nel
B
Pea
rso
n c
orr
ela
tio
ns
Reg div
Repurchase
Total payout
Salary_
Bonus_
Option_
RS_
Log(size)
BM
Leverage
Tangibility
FCF
Cash holdingROA vol
Inst own
Sales growth
Past ret
urn
Loss
Reg
div
10
0
Repurc
hase
01
610
0
Tota
l payout
03
509
810
0
Sala
ry_
-0
10
-01
8-0
19
10
0
Bonus_
00
700
100
3-0
01
10
0
Option_
-0
10
00
900
6-0
41
-03
510
0
RS
_
01
000
901
0-0
32
-01
1-0
40
10
0
Log(s
ize)
03
101
802
3-0
56
01
101
202
210
0
BM
-02
1-0
28
-03
103
0-0
03
-02
000
0-0
33
10
0
Levera
ge
-00
1-0
08
-00
8-0
05
00
6-0
11
00
801
9-0
03
10
0
Tangib
ility
00
200
100
101
200
1-0
05
-00
6-0
12
-00
4-0
18
10
0
FC
F02
203
703
9-0
20
00
901
1-0
01
02
4-0
32
-02
1-0
16
10
0
Cash
hold
ing
-01
301
000
700
2-0
14
02
2-0
10
-02
3-0
16
-03
502
901
210
0
RO
A v
ol
-01
5-0
04
-00
700
4-0
11
01
9-0
11
-02
3-0
08
-01
101
2-0
02
03
910
0
Inst
ow
n
-00
901
401
1-0
17
00
200
701
200
7-0
01
00
3-0
08
01
4-0
06
-01
110
0
Sale
s gro
wth
-00
8-0
04
-00
6-0
15
00
501
0-0
02
00
7-0
16
-00
3-0
08
01
300
201
400
410
0
Past
retu
rn00
901
301
4-0
18
01
5-0
01
00
301
6-0
29
-01
000
102
7-0
14
-01
001
602
710
0
Loss
-02
0-0
19
-02
201
8-0
18
00
4-0
05
-02
601
901
300
6-0
41
01
702
3-0
16
-01
8-0
40
10
0
44
Panel C Firm characteristics - before and after FAS123R
Pre FAS 123R Post FAS 123R Difference
Payout variables
Regular dividendTotal assets 083 099 016
RepurchaseTotal assets 245 490 245
Total payoutTotal assets 328 589 261
Regular dividendTotal payout 3914 2790 -1124
Level of executive compensation (in $1000)
Salary_$ 426 463 37
Bonus_$ 418 505 87
Option grant_$ 896 707 -191
Restricted stock grant_$ 269 574 305
Total pay_$ 2263 2584 321
Percentage of executive compensation
Salary_ 305 293 -12
Bonus_ 186 204 18
Option grant_ 343 240 -103
Restricted stock grant_ 87 176 89
Control variables
Size ($M) 9671 11631 1960
Log(size) 7860 8035 0175
Book-to-market 0437 0453 0016
Leverage 0201 0203 0002
Asset tangibility 0822 0793 -0029
Free cash flow 0061 0057 -0004
Cash holding 0175 0159 -0016
ROA volatility 0067 0048 -0019
Institutional ownership 0712 0781 0069
Sales growth 0137 0108 -0029
Past stock return 0080 0101 0021
Loss indicator 0173 0159 -0014
45
Pa
nel
D
Fir
m c
ha
racte
rist
ics
by q
ua
rtil
e o
f a
cco
un
tin
g i
mp
act
- b
efo
re a
nd
aft
er
FA
S1
23
R
Accounting im
pact
(2002)
Num
ber
of
Fir
ms
Pre
Post
Pre
Post
Pre
Post
Pre
Post
Payout
vari
able
s
Regula
r div
idendT
ota
l ass
ets
11
2
12
4
09
4
11
1
09
5
11
3
03
0
04
9
Repurc
hase
Tota
l ass
ets
11
3
26
8
19
2
37
3
32
7
63
1
35
1
68
7
Tota
l payout
Tota
l ass
ets
22
4
39
1
28
5
48
4
42
2
74
4
38
1
73
6
Regula
r div
idendT
ota
l payout
643
7
469
8
474
0
341
1
284
5
195
4
82
5
74
5
Perc
enta
ge o
f executive c
om
pensa
tion
Sala
ry_
337
295
313
287
296
289
276
300
Bonus_
223
226
214
228
172
192
134
169
Option g
rant_
201
167
290
210
373
260
507
325
Rest
ricte
d s
tock g
rant_
116
194
98
180
89
176
43
155
294
294
294
294
1st Q
uart
ile2
nd Q
uart
ile3
rd Q
uart
ile4
th Q
uart
ile
01
2
03
5
09
3
55
1
46
Accounting impact
Number of Firms
By accounting impact quartile
1
2
3
4
Pre Post Pre Post
Payout variables
Regular dividendTotal assets 09 11 08 10
RepurchaseTotal assets 18 31 26 52
Total payoutTotal assets 28 43 34 62
Regular dividendTotal payout 428 357 386 265
Percentage of executive compensation
Salary_ 435 364 282 280
Bonus_ 226 214 179 202
Option grant_ 92 125 387 261
Restricted stock grant_ 125 188 80 174
Percentage of CEO compensation
Salary_(CEO) 485 364 260 259
Bonus_(CEO) 249 228 185 219
Option grant_(CEO) 10 127 406 275
Restricted stock grant_(CEO) 128 182 82 183
Panel E Firm characteristics by alternative treatment definition - before and
after FAS123R
Treated
25
19
997
223
250
256
268
10
177
71
Control
44
37
47
Table 2
Differential effect of FAS123R on the use of option-based compensation
Panel A Two-period first-difference regression
Prediction Coeff t-stat Coeff t-stat Coeff t-stat
Accounting impact rank - -0044 -628
Accounting impact rank=2 - -0044 -327
Accounting impact rank=3 - -0075 -468
Accounting impact rank=4 - -0140 -613
Treated - -0132 -875
ΔLog(size) 0061 202 0061 200 0063 214
ΔBook-to-market 0032 091 0032 092 0051 143
ΔLeverage -0157 -213 -0160 -218 -0111 -153
ΔAsset tangibility -0012 -014 -0020 -023 -0023 -026
ΔFree cash flow -0106 -095 -0108 -097 -0128 -117
ΔCash holding -0197 -211 -0193 -206 -0180 -194
ΔFive-year ROA volatility -0065 -031 -0056 -026 -0098 -047
ΔInstitutional ownership -0044 -091 -0043 -088 -0044 -092
ΔSales growth -0064 -102 -0065 -104 -0090 -153
ΔPast one-year stock return 0051 078 0052 080 0091 138
ΔLoss frequency 0056 207 0057 207 0047 179
Log(size) -0009 -210 -0009 -207 -0002 -035
Book-to-market -0015 -056 -0013 -049 0018 072
Leverage 0022 046 0023 048 0068 150
Asset tangibility 0033 077 0033 078 0053 128
Free cash flow 0227 202 0220 195 0127 117
Cash holding -0002 -004 0012 019 -0078 -141
Five-year ROA volatility -0451 -240 -0430 -228 -0509 -283
Institutional ownership -0123 -360 -0122 -359 -0100 -292
Sales growth -0041 -056 -0040 -055 -0089 -125
Past one-year stock return -0009 -015 -0006 -010 0078 125
Loss frequency 0055 174 0056 178 0054 173
Fixed effect
Standard error
Adj R-squared
Observations
Model (3)
Dependent variable ΔAvg Option grantTotal pay
Huber-White
0156
This table investigates whether the effect of FAS123R on the use of option-based pay varies with its potential accounting impact Panel A
reports the results of estimating three two-period first-differencing models where for each firm we average its characteristics in Pre- and
Post-FAS123R period The Pre-FAS123R period consists of fiscal year 2003 and 2004 the Post-FAS123R period covers fiscal year 2005-
2007 In all three specifications the dependent variable is the change of average Option grantTotal pay from Pre- to Post-FAS123R period
The main independent variable varies by model in Model (1) the Accounting impact rank is the quartile rank of implied option expensetotal
assets measured in 2002 (1=lowest 4=highest) In Model (2) Accounting impact rank=2 (3 4) is an indicator that takes value of one if the
firmrsquos Accounting impact rank equals 2 (3 4) In Model (3) we use an alternative treatment construction following Bakke et al (2015)
where Treated is an indicator that takes value of zero if the firm granted zero option to its CEO in both 2003 and 2004 or the firm began to
voluntarily expense option-based pay at fair value in 2002 or earlier and one otherwise For each control variable we include both its level in
the Pre-FAS123R period and its change across the two periods Panel B shows the results of estimating fixed effect models with firm-year
observations The dependent variable is the firm-year level Option grantTotal pay The main independent variables are the interactions of
Post-FAS123R indicator (Post) with Accounting Impact rank Accounting impact rank indicators and Treated respectively All models in
Penal A have industry fixed effects and the standard errors are Huber-White heteroscedasticity-consistent standard errors All models in
Penal B have firm fixed effects and year fixed effects and the standard errors are clustered at firm level All variables are defined in
Appendix The notation and indicates statistically significant at 10 5 and 1 level respectively
Model (1) Model (2)
11711171 1171
Industry Industry
Huber-White
0124
Huber-White
0123
Industry
48
Panel B Panel fixed effects regression
Prediction Coeff t-stat Coeff t-stat Coeff t-stat
Acc impact rank x Post - -0044 -807
Acc impact rank 2 x Post - -0046 -333
Acc impact rank 3 x Post - -0077 -526
Acc impact rank 4 x Post - -0137 -776
Treated x Post - -0145 -970
Log(size) 0034 221 0034 217 0036 229
Book-to-market 0018 084 0017 083 0015 070
Leverage -0004 -009 -0006 -013 -0007 -015
Asset tangibility 0007 012 0004 006 0011 018
Free cash flow -0074 -151 -0072 -146 -0078 -158
Cash holding -0048 -086 -0050 -090 -0006 -011
Five-year ROA volatility 0250 231 0239 219 0437 414
Institutional ownership 0043 159 0044 161 0041 150
Sales growth -0033 -168 -0034 -171 -0031 -158
Past one-year stock return 0067 221 0068 224 0063 204
Loss indicator 0023 209 0022 207 0024 222
Fixed effects
Standard error
Adj R-squared
Observations
Dependent variable Option grantTotal pay
5653 5653 5653
Clustered by firm
Firm Year
Clustered by firm
Firm Year
Clustered by firm
0523 0523 0526
Model (1) Model (2) Model (3)
Firm Year
49
Table 3
Effect of option-based compensation on dividend policy
Panel A Two-period first-difference regression
Prediction Coeff t-stat Coeff t-stat Coeff t-stat
Accounting impact rank + 0000 077
Accounting impact rank=2 + 0001 091
Accounting impact rank=3 + 0000 044
Accounting impact rank=4 + 0001 092
Treated + 0000 -026
ΔLog(size) 0000 -030 0000 -030 0000 -026
ΔBook-to-market -0002 -190 -0002 -193 -0002 -195
ΔLeverage -0002 -059 -0002 -057 -0002 -059
ΔAsset tangibility 0016 431 0016 429 0016 430
ΔFree cash flow 0017 373 0017 373 0017 375
ΔCash holding -0011 -288 -0011 -285 -0010 -282
ΔFive-year ROA volatility 0003 034 0002 032 0003 035
ΔInstitutional ownership -0002 -073 -0002 -073 -0002 -070
ΔSales growth -0001 -040 -0001 -037 -0001 -038
ΔPast one-year stock return 0002 077 0002 076 0002 070
ΔLoss frequency 0000 -048 0000 -045 0000 -046
Log(size) 0000 183 0000 182 0000 182
Book-to-market -0002 -227 -0002 -225 -0002 -284
Leverage -0001 -037 -0001 -039 -0001 -048
Asset tangibility 0003 179 0003 180 0003 176
Free cash flow 0017 291 0017 291 0017 300
Cash holding 0002 080 0002 077 0002 098
Five-year ROA volatility 0003 035 0002 033 0003 044
Institutional ownership -0001 -068 -0001 -068 -0001 -058
Sales growth -0004 -177 -0004 -175 -0004 -172
Past one-year stock return 0004 169 0004 167 0004 165
Loss frequency -0001 -111 -0001 -109 -0001 -102
Fixed effect
Standard error
Adj R-squared
Observations
Dependent variable ΔAvg Regular dividendTotal assets
This table investigates the causal effect of option-based pay on dividend policy by examining whether changes in dividend policy around
FAS123R vary with its potential accounting impact Panel A reports the results of estimating three two-period first-differencing models
where for each firm we average its characteristics in Pre- and Post-FAS123R period In all three specifications the dependent variable is
the change of average Regular dividendTotal assets from Pre- to Post-FAS123R period The main independent variable varies by model in
Model (1) the Accounting impact rank is the quartile rank of implied option expensetotal assets measured in 2002 (1=lowest 4=highest) In
Model (2) Accounting impact rank=2 (3 4) is an indicator that takes value of one if the firmrsquos Accounting impact rank equals 2 (3 4) In
Model (3) we use an alternative treatment construction following Bakke et al (2015) where Treated is an indicator that takes value of zero
if the firm granted zero option to its CEO in both 2003 and 2004 or the firm began to voluntarily expense option-based pay at fair value in
2002 or earlier and one otherwise For each control variable we include both its level in the Pre-FAS123R period and its change across the
two periods Panel B shows the results of estimating fixed effect models with firm-year observations The dependent variable is the firm-
year level Regular dividendTotal assets The main independent variables are the interactions of Post-FAS123R indicator (Post) with
Accounting Impact rank Accounting impact rank indicators and Treated respectively Panel C examines the intensity of dividend changes
among firms with nonzero dividend per share in 2003 or 2004 In particular we estimates the same three models as in Panel A(with the
same independent variables) but for five dependent variables the change of average Regular dividendTotal assets from Pre- to Post-
FAS123R period (as in Panel A) the percentage change of DPS (dividend per share) from Pre- to Post-FAS123R period and three
indicators denoting respectively whether the percentage change of DPS was greater than 20 40 and 60 Panel D reports four
robustness tests of the dividend intensity regression In each of them a set of possible confounding observations is removed (see Section 33
for details) Panel E compares the trends of dividend initiation and termination around FAS123R across four quartile groups ranked by
accounting impact All models in Panel A C and D have industry fixed effects and the standard errors are Huber-White heteroscedasticity-
consistent standard errors All models in Penal B have firm fixed effects and year fixed effects and the standard errors are clustered at
firm level All variables are defined in Appendix The notation and indicates statistically significant at 10 5 and 1 level
Industry Industry Industry
Model (1) Model (2) Model (3)
1171 1171 1171
Huber-White Huber-White Huber-White
0105 0104 0105
50
Panel B Panel fixed effects regression
Prediction Coeff t-stat Coeff t-stat Coeff t-stat
Acc impact rank x Post + 0000 122
Acc impact rank 2 x Post + 0001 110
Acc impact rank 3 x Post + 0001 094
Acc impact rank 4 x Post + 0001 129
Treated x Post + 0000 -012
Log(size) 0001 179 0001 179 0001 181
Book-to-market 0000 025 0000 024 0000 031
Leverage 0001 062 0001 064 0001 069
Asset tangibility 0009 360 0009 358 0009 363
Free cash flow 0002 090 0002 093 0002 092
Cash holding -0007 -295 -0007 -298 -0007 -298
Five-year ROA volatility 0001 041 0001 038 0000 -006
Institutional ownership 0000 -027 0000 -026 0000 -027
Sales growth 0000 053 0000 051 0000 044
Past one-year stock return 0001 089 0001 088 0001 078
Loss indicator 0000 -060 0000 -057 0000 -076
Fixed effects
Standard error
Adj R-squared
Observations
Dependent variable Regular dividendTotal assets
Model (1) Model (2) Model (3)
Firm Year Firm Year Firm Year
5653 5653 5653
Clustered by firm Clustered by firm Clustered by firm
0877 0877 0877
51
Panel C Intensity of dividend changes around FAS123R
Prediction Coeff t-stat Coeff t-stat Coeff t-stat
Accounting impact rank + 0000 065
Accounting impact rank=2 + 0000 048
Accounting impact rank=3 + 0000 026
Accounting impact rank=4 + 0002 080
Treated + 0001 063
Dependent var DPS pct change
Accounting impact rank + -0145 -072
Accounting impact rank=2 + 0018 006
Accounting impact rank=3 + -0177 -045
Accounting impact rank=4 + -0746 -100
Treated + -0407 -119
Accounting impact rank + 0029 095
Accounting impact rank=2 + 0040 074
Accounting impact rank=3 + 0092 139
Accounting impact rank=4 + 0008 007
Treated + -0007 -012
Accounting impact rank + 0024 076
Accounting impact rank=2 + 0047 088
Accounting impact rank=3 + 0079 114
Accounting impact rank=4 + -0003 -002
Treated + 0030 052
Accounting impact rank + 0030 098
Accounting impact rank=2 + 0078 155
Accounting impact rank=3 + 0085 130
Accounting impact rank=4 + 0014 012
Treated + -0006 -011
Control variables
Fixed effect
Standard error
Observations 572 572 572
Yes Yes Yes
Huber-White Huber-White Huber-White
Industry Industry Industry
Dependent var DPS pct
change gt60 indicator
Model (1) Model (2) Model (3)
Dependent var ΔAvg Regular
dividendAssets
Dependent var DPS pct
change gt20 indicator
Dependent var DPS pct
change gt40 indicator
52
Panel D Robustness tests for intensity of dividend changes around FAS123R
Prediction Coeff t-stat Coeff t-stat Coeff t-stat
Accounting impact rank + 0006 017
Accounting impact rank=2 + 0067 118
Accounting impact rank=3 + 0041 057
Accounting impact rank=4 + -0061 -049
Treated + 0022 035Observations
Accounting impact rank + 0009 027
Accounting impact rank=2 + 0058 106
Accounting impact rank=3 + 0032 043
Accounting impact rank=4 + -0032 -024
Treated + 0018 028
Observations
Accounting impact rank + 0030 089
Accounting impact rank=2 + 0039 071
Accounting impact rank=3 + 0122 168
Accounting impact rank=4 + -0063 -052
Treated + 0075 132
Observations
Accounting impact rank + 0008 023
Accounting impact rank=2 + 0023 042
Accounting impact rank=3 + 0048 064
Accounting impact rank=4 + -0042 -033
Treated + -0010 -016
Observations
Control variables
Fixed effect
Standard error
Exclude firms with stable
payout ratio from 2003 to 2004
506 506 506
Dependent variable DPS pct change gt40 indicator
Model (1) Model (2) Model (3)
Exclude voluntary expensers
519 519
Exclude firms in the top decile
of option reduction (02-04)
Exclude firms that accelerated
option vesting
504 504 504
517 517 517
519
Huber-White Huber-White Huber-White
Yes Yes Yes
Industry Industry Industry
53
Panel E Dividend initiation and termination rates around FAS123R
Pre FAS 123R
1 280 75 7 6 13 173
2 284 135 18 9 27 200
3 286 181 11 14 25 138
4 282 260 9 10 19 73
Total 1132 651 45 39 84 129
Post FAS 123R
1 275 63 4 4 8 127
2 280 116 9 9 18 155
3 276 152 9 3 12 79
4 263 223 5 1 6 27
Total 1094 554 27 17 44 79
Pre FAS 123R
1 280 205 2 0 2 10
2 284 149 7 1 8 54
3 286 105 0 0 0 00
4 282 22 0 0 0 00
Total 1132 481 9 1 10 21
Post FAS 123R
1 275 212 3 6 9 42
2 280 164 1 2 3 18
3 276 124 1 1 2 16
4 263 40 0 3 3 75
Total 1094 540 5 12 17 31
termination
in 2004
03-04
cumulative
03-04
cumulative
Quartile firms
with
dividend in
2004
termination
in 2005
termination
in 2006
05-06
cumulative
05-06
cumulative
Termination
Quartile firms
with
dividend in
2002
termination
in 2003
without
dividend in
2004
initiation in
2003
initiation in
2004
03-04
cumulative
03-04
cumulative firmsQuartile
firmsQuartile initiation in
2005
initiation in
2006
05-06
cumulative
05-06
cumulative
Initiation
without
dividend in
2002
54
Table 4
Effect of option-based compensation on repurchases
Panel A Two-period first-difference regression with total repurchase
Prediction Coeff t-stat Coeff t-stat Coeff t-stat
Accounting impact rank - 0002 122
Accounting impact rank=2 - 0002 071
Accounting impact rank=3 - 0005 123
Accounting impact rank=4 - 0007 102
Treated - 0014 365
Control variables
Fixed effect
Standard error
Adj R-squared
Observations
Panel B Two-period first-difference regression with net repurchase
Prediction Coeff t-stat Coeff t-stat Coeff t-stat
Accounting impact rank - 0003 166
Accounting impact rank=2 - 0002 051
Accounting impact rank=3 - 0006 165
Accounting impact rank=4 - 0009 137
Treated - 0010 300
Control variables
Fixed effect
Standard error
Adj R-squared
Observations
Panel C Two-period first-difference regression with repurchase adjusted for exercised options
Prediction Coeff t-stat Coeff t-stat Coeff t-stat
Accounting impact rank - 0001 056
Accounting impact rank=2 - 0002 062
Accounting impact rank=3 - 0007 172
Accounting impact rank=4 - -0001 -008
Treated - 0006 197
Control variables
Fixed effect
Standard error
Adj R-squared
Observations
Dependent variable ΔAvg RepurchaseTotal assets
This table investigates the causal effect of option-based pay on payout policy by examining whether the changes of repurchase around
FAS123R vary with its potential accounting impact Panel A reports the results of estimating three two-period first-differencing models
where for each firm we average its characteristics in Pre- and Post-FAS123R period In all three specifications the dependent variable is
the change of average RepurchaseTotal assets from Pre- to Post-FAS123R period The main independent variable varies by model in
Model (1) the Accounting impact rank is the quartile rank of implied option expensetotal assets measured in 2002 (1=lowest 4=highest)
In Model (2) Accounting impact rank=2 (3 4) is an indicator that takes value of one if the firmrsquos Accounting impact rank equals 2 (3 4)
In Model (3) we use an alternative treatment construction following Bakke et al (2015) where Treated is an indicator that takes value of
zero if the firm granted zero option to its CEO in both 2003 and 2004 or the firm began to voluntarily expense option-based pay at fair
value in 2002 or earlier and one otherwise Panel B reports the regressions with the change of Net repurchaseTotal assets as the
dependent variable and the same independent variable as in Panel A Panel C reports the regressions with the change of Adjusted
repurchaseTotal assets as the dependent variable and the same independent variable as in Panel A All models in Panel A B and C have
industry fixed effects and the standard errors are Huber-White heteroscedasticity-consistent standard errors All variables are defined in
Appendix The notation and indicates statistically significant at 10 5 and 1 level respectively
Model (1) Model (2) Model (3)
Yes Yes Yes
Industry Industry Industry
Huber-White Huber-White Huber-White
Dependent variable ΔAvg Net repurchaseTotal assets
1171 1171 1171
0238 0237 0245
Model (1) Model (2) Model (3)
Yes Yes Yes
Industry Industry Industry
Huber-White Huber-White Huber-White
Dependent variable ΔAvg Adjusted repurchaseTotal assets
0229 0229 0233
1171 1171 1171
Model (1) Model (2) Model (3)
Yes Yes Yes
Industry Industry Industry
Huber-White Huber-White Huber-White
0111 0112 0114
1168 1168 1168
55
Table 5
Effect of option-based compensation on payout mix
Panel A Two-period first-difference regression with total payout mix
Prediction Coeff t-stat Coeff t-stat Coeff t-stat
Accounting impact rank + 0006 028
Accounting impact rank=2 + 0018 045
Accounting impact rank=3 + -0001 -001
Accounting impact rank=4 + 0043 052
Treated + -0035 -094
Control variables
Fixed effect
Standard error
Adj R-squared
Observations
Panel B Two-period first-difference regression with net payout mix
Prediction Coeff t-stat Coeff t-stat Coeff t-stat
Accounting impact rank + -0002 -008
Accounting impact rank=2 + 0008 016
Accounting impact rank=3 + 0018 034
Accounting impact rank=4 + -0059 -055
Treated + -0050 -101
Control variables
Fixed effect
Standard error
Adj R-squared
Observations
0049 0043 0054
257 257 257
Industry Industry Industry
Huber-White Huber-White Huber-White
Dependent variable ΔAvg Regular dividendNet payout
Model (1) Model (2) Model (3)
Yes Yes Yes
0154 0151 0156
362 362 362
Industry Industry Industry
Huber-White Huber-White Huber-White
This table investigates the causal effect of option-based pay on payout mix for firms using both dividend and repurchase by examining
whether the changes of payout mix around FAS123R vary with its potential accounting impact Panel A reports the results of estimating
three two-period first-differencing models where for each firm we average its characteristics in Pre- and Post-FAS123R period In all three
specifications the dependent variable is the change of average Regular dividendTotal payout from Pre- to Post-FAS123R period The main
independent variable varies by model in Model (1) the Accounting impact rank is the quartile rank of implied option expensetotal assets
measured in 2002 (1=lowest 4=highest) In Model (2) Accounting impact rank=2 (3 4) is an indicator that takes value of one if the firmrsquos
Accounting impact rank equals 2 (3 4) In Model (3) we use an alternative treatment construction following Bakke et al (2015) where
Treated is an indicator that takes value of zero if the firm granted zero option to its CEO in both 2003 and 2004 or the firm began to
voluntarily expense option-based pay at fair value in 2002 or earlier and one otherwise Panel B reports the regressions with the change of
Regular dividendNet payout as the dependent variable and the same independent variables as in Panel A Panel A (Panel B) is based on
observations with nonzero regular dividend and repurchase (net repurchase) in both Pre- and Post-FAS123R period All models in Panel A
and B have industry fixed effects and the standard errors are Huber-White heteroscedasticity-consistent standard errors All variables are
defined in Appendix The notation and indicates statistically significant at 10 5 and 1 level respectively
Yes Yes Yes
Dependent variable ΔAvg Regular dividendTotal payout
Model (1) Model (2) Model (3)
17
period and one year in the Post period to ensure consistency in the sample across periods Similar
to prior studies on payout policy (Fama and French 2001 Skinner 2008) we exclude financial
firms (SIC code between 6000 and 6999) and utilities (SIC between code 4900 and 4999) as well as
firms not incorporated in the US Our final sample includes 1176 firms19 We obtain dividend
and stock returns data from CRSP stock repurchases and dividend per share data from
COMPUSTAT and institutional ownership data from Thomson Reuters 13F database Other
control variables are from CRSP and COMPUSTAT To deal with outliers we winsorize all
continuous variables at 1 and 99 by fiscal year A detailed definition of all variables and their
sources is in Appendix
Table 1 Panel A presents summary statistics of the relevant variables for the pooled sample of
5653 firm-year observations Implied option expense in 2002 (our proxy for Accounting Impact)
is on average 173 of total assets with the median at 052 This suggests that the accounting
impact is very large for a small number of firms Over the entire sample period on average
dividends represent 093 of total assets while repurchases represent 394 Untabulated
analyses indicate that in 16 of the firm-year observations only dividends are paid out in 25
only repurchases in 32 both and in 27 neither Within the subset of firm-years with a payout
dividends represent 3874 of total payout This data confirms prior evidence that repurchases
have assumed the primary role as a vehicle to return cash to shareholders (eg Floyd et al 2015)
The mean (median) total executive pay (average across the top 5 executives) is $25 million ($16
million) On average option grants and restricted stock grants represent respectively 283 and
141 of total pay while salary and bonus comprise 296 and 197 respectively The
19 The results presented in the study are similar when (i) we restrict the sample to firms with available data for the
entire (2003-2007) sample period (1009 firms) and (ii) we exclude firms with CEO turnover in the Post period
(reducing the sample size to 780 firms) as a new CEO may have a different compensation package andor adopt a
different payout policy
18
composition of CEO pay (untabulated) is similar As for the control variables the figures are
generally consistent with other studies examining SampP 1500 firms over the same period
Panel B reports the pairwise Pearson correlations among the relevant variables The
correlations are in line with the associations documented in prior studies For example larger
firms and firms with higher profitability (free cash flows) have higher payouts loss firms have
lower payouts greater volatility in operating income is associated with lower dividends
More relevant to our analysis Panel C presents the mean of each variable in the Pre and Post
period for the full sample For each variable we first compute the firm-level mean over the Pre
and the Post Period and then compute the mean of the resulting figure across all firms There is a
striking increase in repurchases which double from 245 to 490 of total assets causing a
similar increase in total payout The increase in dividends is much smaller from 083 to 099
of total assets As a result for firms with positive payout dividends become a smaller fraction of
total payout in the Post period (2790 versus 3914 in the Pre period) This trend is consistent
with Floyd et al (2015) who document a dramatic increase in repurchases in the years leading to
the 2008 financial crisis Consistent with previous studies around FAS123R there is a significant
reduction in option grants as a fraction of total executive pay (from 343 to 240) and a
corresponding increase in the use of restricted stock (from 87 to 176) with little variation in
the weight of salary and bonus (note that restricted stock salary and bonus were expensed both
before and after FAS123R) Similar patterns hold for the composition of CEO pay (untabulated)
Compared to changes in the mix of executive pay changes in the levels of control variables are
generally less pronounced
Panel D reports the change in the key compensation and payout variables from the Pre to the
Post period by quartiles of implied option expense and yields a number of insights First
19
confirming the skewness suggested by Panel A the mean implied option expense is 551 for
firms in the top quartile versus only 093 035 and 012 for firms in the second third and
bottom quartile respectively Second as expected firms with higher implied option expense have
greater use of option-based pay For example in the Pre-period option pay represents 507 of
total executive pay at firms in the top quartile versus 201 in the bottom quartile Third and
more importantly for our research design the use of option pay changes significantly from the Pre
to the Post period as a function of the accounting impact For firms in the top quartile the
percentage of total pay represented by stock options drops by 182 (from 507 to 325)
versus 113 80 and 34 for firms in the second third and bottom quartile respectively The
decline in option usage across quartiles is accompanied by an increase in restricted stock grants
while the weight of salary and bonus shows little change It is important to emphasize the
substitution of stock options with restricted stocks because restricted stocks typically pay
dividends (Zhang 2013) thus providing further reason to expect a dividend increase in response to
the FAS123R-induced decline in option pay
As for the payout variables Panel D suggests that heavy option users (firms with higher
implied option expense) generally use repurchases more than dividends consistent with the
associations documented in earlier studies In the Pre period repurchases (dividends) represent
351 (030) of total assets for the top quartile versus 113 (112) for the bottom quartile
Panel D also indicates that the increase in repurchases documented in Panel C takes place across
all quartiles As for the (much smaller) change in dividends the absolute increase is similar across
the four quartiles though the relative increase (the percentage change) appears to be slightly
higher in the top quartile Overall these figures do not suggest a shift toward dividends and away
from repurchases by firms with a large (accounting-induced) decline in the use of option pay
20
Panel E presents the same data as Panel D but based on the definition of lsquotreatmentrsquo and
lsquocontrolrsquo in Bakke et al (2015) Under this definition 997 firms are classified as treatment group
and 177 as control (171 firms are classified as lsquocontrolrsquo because they did not grant options to the
CEO in the Pre period and 6 because they were voluntarily expensing options before 2003)
Interestingly lsquotreatedrsquo firms are equally distributed across the quartiles suggesting significant
variation in the degree of treatment As discussed earlier one benefit of our approach is that it
exploits cross-sectional variation among treatment firms in terms of the likely impact of FAS123R
Also 40 of the control firms (71 out of 177) are in the lowest quartile while 35 ((37+25)177)
are in the top two quartiles reflecting the different focus of the two approaches in terms of
identifying firms less affected by FAS123R20
As for payout and compensation variables Panel E shows that the treated group experiences a
larger increase in repurchases than the control group while the (less pronounced) increase in
dividends is similar across treated and control firms Treated firms experience a 126 decrease in
option pay (from 387 to 261) with a corresponding 94 increase in the weight of restricted
stock grants (from 80 to 174) The figures are similar at the CEO level (because the
classification is based on options grants to the CEO it is useful to report pay figures at both the top
5 executives and the CEO level) Interestingly the control group experiences a pronounced
increase in the weight of option grants in total CEO pay from 10 to 127 as almost half of the
control firms issued options to their CEOs in the Post period (for these firms options as percentage
of total CEO pay increased from 0 to 254 untabulated analysis) While this increased use of
stock options suggests (ex post) that these firms were not concerned with the impact of FAS123R
another possibility is that the lack of use of option compensation for CEOs in 2003 and 2004 was
20 In untabulated analysis we find that 55 of the 171 firms issuing no options to the CEO in the Pre period granted
options to the other top executives (and perhaps to other non-executive employees) thus explaining the relatively high
implied option expense for the control group (10 versus 19 for the treatment group ndash see Panel E)
21
temporary rather than the effect of a permanent policy If these firms were planning to issue
options to the CEO in the Post period the assumption that they were unaffected by FAS123R (and
thus their use as control sample) is questionable21
32 Differential Impact of FAS123R on the Use of Option-Based Compensation
An important building block of our approach is the presumed differential impact of FAS123R
on option-based pay as a function of pre-existing implied option expense22 While Table 1 Panel
D preliminarily supports the validity of this assumption we formally examine it by estimating Eq
(1)
As reported in Table 2 Panel A we find a significant negative association between Accounting
Impact and the change in option-based pay around the adoption of FAS123R In column (1)
where we use the quartile rank of implied option expense the -0044 coefficient implies that
around FAS123R option grants over total pay decline by 44 as we move from the highest
quartile to the next Thus the reduction in top quartile firms is 132 larger than in bottom
quartile firms In column 2 we replace the quartile rank with three indicators for the highest
quartiles (with the bottom quartile collapsed in the intercept) so as to be able to compare directly
top and bottom quartile without imposing the same effect across quartiles The negative and
significant coefficient on the top quartile indicator at -0140 suggests that the reduction in option
grants over total pay is 140 larger for top quartile firms relative to bottom quartile firms
Finally in column 3 we use the indicator for treated firms following Bakke et al (2015) The
21 Panel E also shows an increase in the use of restricted stock in CEO pay packages (from 128 to 182 almost
comparable to the increase among treated firms) The concurrent increase in options and restricted stock suggests
these firms would have increased option pay significantly more had it not been for FAS123R indicating further
caution in classifying them as control group of unaffected firms 22 This is akin to the relevance assumption of instrumental variable if we interpret the implied option expense as an
instrument to the change in option-based pay
22
negative and significant coefficient at -0132 suggests that treated firms experience a 132
larger drop in the weight of option pay relative to control firms
In Panel B we re-estimate Eq (1) using a panel regression with firm- and year-fixed effects
(5653 firm-year observations) where the dependent variable is the the ratio of option grants to
total executive pay The results are virtually identical in terms of significance and magnitude of
the coefficients of interest (the interaction terms between respectively Accounting impact and
Treated and an indicator for the Post period)
Overall Table 2 suggests that high implied option expense and the introduction of FAS123R
together strongly encouraged firms to cut back option-based compensation for executives It also
supports the general validity of the approach in Bakke et al (2015) in identifying firms most
affected by FAS123R notwithstanding the concerns outlined earlier
Our test of Eq (1) focuses on executive stock options For our dividend-protection hypothesis
it is important to establish that the level of implied option expense predicts a change in executive
stock options (rather than only a change in the use of non-executive employee stock options) as we
want to capture the effect of a change in executivesrsquo incentives on payout policy At the same
time our dilution channel hypothesis assumes a change in the use of all (executive and non-
executive employee) stock options Thus in untabulated analyses we repeat the test in Eq (1) by
replacing the dependent variable with the change in the number of options granted to all
employees (scaled by the total number of outstanding shares note for this analysis we can only
use data from 2004 to 2007 because Compustat began reporting data on ESO in 2004) The
coefficient on Accounting Impact and Treated continues to be negative and significant suggesting
that the differential reduction in the use of option compensation as a function of accounting impact
23
occurred for both executive and non-executive employee stock options Indeed Brown and Lee
(2011) report a similar decrease in executive and employee stock options around FAS123R
33 Option-Based Pay and Dividend Payouts
In this section we examine the effect of an exogenous (accounting-induced) change in option
compensation on dividend policy by estimating Equation (2)
Table 3 Panel A presents the results using the change in dividends from Pre to Post as
dependent variable We find no significant association between Accounting Impact (column 1 and
2) or Treated (column 3) and the change in dividends around the adoption of FAS123R This is in
stark contrast with the negative effect of option-based pay on dividends predicted in the literature
and documented in various association studies
One concern with this lack of effect is that perhaps our setting is not powerful enough to detect
it One way to examine this possibility is the following The coefficient on Accounting Impact
rank=4 in column 2 is 0001 and the standard error (SE) is 00009 Assuming the estimated
standard error is correct then for a two-tailed t test the coefficient needs to be greater than 00015
(=SE1645) or 015 to reach the 10 percent significant level In other words if moving from
the bottom to the top quartile (which predicts a 14 differential decline in option based pay as per
Table 2 Panel A) resulted in a 015 increase of the dividendasset ratio our test would be able to
detect a causal effect of option-based pay on dividends Given the unconditional mean of the
dividendasset ratio at 093 an increase of 015 from the Pre to the Post period seems
plausible In fact the average increase from the Pre to the Post period is 016 (Table 1 Panel C)
Thus if an effect was there our test should detect it
24
Panel B presents the results using a panel regression (5653 firm-year observations) with firm-
and year-fixed effects and interaction terms between Accounting Impact (or Treated) and an
indicator for the Post period Our inferences are unchanged
These analyses are based on our full sample which includes both dividend-paying and non-
dividend-paying firms Hence they implicity treat as equal two potentially different decisions to
initiate dividends and to increase dividends For example an increase in the dividend-to-asset
ratio from 05 to 06 will be treated the same as an increase from 00 to 01 even though
the latter represents a critical dividend initiation decision23 To address this following Chetty and
Saez (2005) we separately examine how FAS123R impacts the intensity of dividend changes (for
the subset of payers) and the likelihood of dividend initiations (for the subset of non-payers)
331 Option-Based Pay and Dividend Payouts Intensity of Dividend Changes
In the first row of Panel C we repeat the analysis in Panel A for the sub-sample of 572 payers
defined as firms with positive DPS in 2003 andor 2004 Note that we report only the coefficients
of interest for parsimony In the second row we replace the dependent variable with the
percentage change in DPS DPS is the choice variable for managers (Brav et al 2005 Baker and
Wurgler 2016) and thus our preferred measure to capture changes in dividend policy To account
for skewness in this variable (Khale 2002) in the third fourth and fifth rows we use indicator
variables to denote whether the change in DPS surpasses a threshold respectively 20 40 and
60 The proportion of firms that surpass these thresholds are 59 44 and 33 respectively24
23 Initiating dividends is a critical decision for boards given the pre-commitment value that investors attach to this
decision and the strong negative market reaction when firms eliminate or reduce dividends (Brav et al 2005) For
executives trying to maximize the value of their own stock options (dividend-protection argument) the ability to
influence a dividend initiation decision is likely lower than the ability to influence a dividend increase decision 24 Although in the third fourth and fifth rows our dependent variable is a binary variable we use a linear model (OLS)
instead of a probit or logit nonlinear model The reason is that estimating fixed effects in binary response models with
panel data can cause the incidental parameters problem The coefficient estimates can be biased when the panel data
25
Across all of these specifications we find no association between Accounting Impact or Treated
and the intensity of dividend changes Thus it does not appear that an exogenous reduction in
option-based pay caused dividend-paying firms to increase dividends
In Panel D we perform four robustness tests For parsimony we show only the coefficients of
interest and only the cases where the dependent variable is an indicator denoting a greater than
40 increase in DPS The results are similar for the other four ldquointensityrdquo dependent variables
reported in Panel C
In the first row we exclude firms that began to voluntarily expense options in 2003 or 2004
(84 firms of which 68 are dividend payers) FASB added accounting for stock-based
compensation to its agenda in March 2003 and issued an Exposure Draft proposing the expensing
of stock options at fair value in March 2004 In anticipation a number of firms began to
voluntarily expense stock options in 2003 and 2004 (Aboody et al 2004) If these firms reduced
option grants and as a result increased dividends during the Pre period then their inclusion may
reduce the power of our tests and thus our ability to detect the hypothesized relation25
In a similar spirit in the second row we exclude firms in the top decile in terms of reduction in
the ratio of option grants to total pay for the top 5 executives between 2002 (the year prior to the
Pre-period) and 2004 (the end of the Pre-period) This encompasses 113 firms of which 55 are
dividend payers If these firms reduced option grants in anticipation of FAS123R and as a result
increased dividends during the Pre period their inclusion may reduce our ability to detect the
hypothesized relation
has a large number of observations but a short time series Examples of studies making a similar choice are Puri
Rocholl and Steffen (2011) and Chu and Ma (2015) 25 This is unlikely to be a serious concern as previous studies suggest that voluntary expensers made limited use of
stock options (Aboody et al 2004) In fact in our sample 79 of these firms are in the bottom two quartiles of
implied option expense (untabulated) Nonetheless we present this test for robustness
26
In the third row we exclude firms that accelerated the vesting of options before FAS123R
became effective in order to avoid recognizing an expense for the unvested portion of these
options (Choudhary et al 2009 Balsam Reitenga and Yin 2008) This encompasses 196 firms of
which 54 are dividend payers If accelerating vesting was used to reduce the impact of FAS123R
the inclusion of these firms may reduce the power of our tests26
In the fourth row we deal with the concern that if firms target a fixed dividend to net income
ratio (Lintner 1956) and do so without adjusting for changes in accounting standards then by
decreasing net income (via option expense) the accounting change would mechanically cause a
reduction in dividends This would potentially offset and confound the increase predicted under
the dividend-protection and dilution hypotheses This seems unlikely for two reasons First firms
are notoriously reluctant to cut dividends (Brav et al 2005) Hence it seems unlikely that they
would reduce dividends in response to a decline in net income with no economic or cash flow
implications (ie re-classification of an expense from the footnotes to the income statement)
Second firms today set dividends in terms of dividend per share rather than by targeting a net
income-based payout ratio (Brav et al (2005)) As noted by Skinner (2008) over the last few
decades as earnings have become more variable the relation between earnings and dividends has
become weaker with dividend payments increasing smoothly and largely independent of the
variation in earnings Nevertheless in the fourth row we exclude the 66 dividend-paying firms that
26 These firms explicitly stated that they accelerated the vesting of stock options to avoid the accounting charge
(Choudhary et al 2009) In fact 72 are classified in the top two quartiles of implied option expense (untabulated)
Thus we would have predicted these firms to experience a significant decline in option pay To the extent that this
decline did not materialize because they minimized the impact of FAS123R by accelerating vesting the ability of
Accounting Impact to predict the reduction in option pay and thus its usefulness in examining changes in dividends
around FAS123R may be reduced The list of firms accelerating vesting was kindly provided by Jack Ciesielsky of
The Analystsrsquo Accounting Observer
27
had a similar payout ratio in 2003 and 2004 as a proxy for firms with a target net income-based
payout ratio in the Pre period27
As shown in Panel D even after excluding these subsets of firms we continue to find no
association between Accounting Impact or Treated and changes in dividends for dividend-paying
firms This is inconsistent with a causal influence of option compensation on dividend policy
Another concern is that by reducing net income and thus retained earnings FAS123R
may have pushed some firms closer to violating dividend covenants in debt contracts and
thus prevented them from increasing dividends This would bias our study against finding a
causal effect of option-based pay on dividends However this does not appear to be a
significant concern for three reasons First the recognition of an option expense does not
imply a decline in net income In fact more than 70 (75) of the full sample firms
(dividend payers) experienced an increase in net income before extraordinary items from
2004 to 2005 (the percentages are similar across the four quartiles of implied option
expense) Second dividend covenants are less common among dividend-paying firms
(Nikolaev 2010) Third most loan contracts in recent years give parties the option to
ldquofreezerdquo GAAP when facing a mandatory change in accounting principles (Christensen and
Nikolaev 2009) Firms expecting an adverse impact of FAS123R on their dividend covenants
would likely exercise this option (particularly given the non-cash nature of option-based
expense) Nonetheless to alleviate this concern we perform three additional analyses
(untabulated) (i) we repeat the tests in Panel C after excluding firms with a drop in net
income between 2004 and 2005 (ie firms that perhaps faced some covenant-related
27 We define a ldquosimilarrdquo payout to be an absolute change in payout ratio of less than 1 from 2003 to 2004 Among
these 66 firms only 39 continued to have a similar payout ratio in 2005 We also try an alternative definition where
a firm is classified as likely to be using a net income-based target payout ratio if the absolute percentage change in the
ratio from 2003 to 2004 is less than 10 (100 firms) Our inferences are unchanged
28
constrains to their payout policy as a result of FAS123R) (ii) we explicitly control for net
income and retained earnings in the regression (as in Skinner 2008) (iii) we repeat the tests
in Panel C for dividend payers with dividendsasset ratio above the sample median on the
basis that dividend covenants are less frequent among firms paying large dividends (Jung
Lee and Yang 2016) Our inferences are unchanged
332 Option-Based Pay and Dividend Payouts Dividend Initiations
In this section we examine whether the accounting-driven change in option pay affected
dividend initiations among non-payers We cannot employ the difference-in-difference approach
adopted so far by definition the same firm cannot initiate dividends in both periods However we
can provide suggestive evidence as follows First we take all firms that did not pay dividends in
2002 and group them into quartiles based on 2002 implied option expense For each quartile we
find the number of firms initiating dividends in 2003 and 2004 (the Pre period) Next we take all
firms that did not pay dividends in 2004 group them into quartiles based on 2002 implied option
expense and for each quartile find the number of firms initiating dividends in 2005 and 2006 (the
Post period) We do not include 2007 so as to have the same number of years in both periods and
make the cumulative initiation rates comparable
The left portion of Panel E reports the results of this exercise There is a general decrease in
the dividend initiation rate from the Pre to the Post period This holds both in the full sample of
non-payers (from 129 to 79) and across all quartiles This decrease may reflect a temporary
spike in 2003 and 2004 in response to the 2003 dividend tax cut documented in Chetty and Saez
(2005) It is noteworthy that initiation rates in both periods are lower among firms with higher
implied option expense This is consistent with option-heavy firms being mostly high-growth
firms less inclined to pay dividends More relevant to our research question if the lower use of
29
option compensation increased the propensity to pay dividends we would expect to see a relative
increase (ie a lower decrease) in dividend initiations among firms with the highest accounting
impact Instead the rate does not differ depending on the accounting impact There is
approximatley a 5 decline in initiation rate in each quartile In the right portion of Panel E we
examine similar data for dividend terminations While the results should be interpreted with
caution due to their rarity firms with higher accounting impact do not experience a greater decline
in termination rates Our inferences in Panel E are similar when we compared treated and control
firms following Bakke et al (2015) (untabulated)
Even after taking into account the different nature of decisions for dividend paying and non-
dividend-paying firms we fail to find evidence of a causal influence of option-based compensation
on dividend policy This finding is in contrast to the associations documented in earlier studies It
is even more remarkable as most firms replaced stock options with restricted stock which are
generally dividend-protected and should provide further incentive to increase dividends28
34 Option-Based Pay and Repurchases
In this section we examine the effect of an exogenous (accounting-induced) change in option
compensation on repurchases by estimating Equation (2)
Table 4 Panel A presents the results using the change in repurchases (scaled by total assets)
from Pre to Post as a dependent variable If the use of option-based pay had a positive effect on
firmsrsquo propensity to engage in repurchases as posited by the dividend-protection and dilution
hypotheses we should find a negative association between Accounting Impact or Treated and
repurchases Firms with a higher (accounting-driven) reduction in option-based pay should reduce
28 In a sample of SampP 500 firms between 2000 and 2009 Zhang (2013) reports that 80 of the firms granting
restricted stocks offer dividend protection In that sense the FAS123R-induced shift from stock options to restricted
stock may be characterized as a ldquoshockrdquo to dividend protection in unearned equity pay Accordingly our results cast
doubt on the causal interpretation of the positive association between dividend protection and dividend payouts
documented in prior studies (Zhang 2013 Burns et al 2015 Minnick and Rosenthal 2015)
30
the use of repurchases either because they are shifting toward a greater use of dividends andor
because they have a lower need to offset the dilutive effects of stock options However we find no
significant association between Accounting Impact (columns 1 and 2) and the change in
repurchases around the adoption of FAS123R When we use the Treated indicator (column 3) we
find a significant positive association rather than a negative one In Panel B we repeat the analysis
using net repurchases (ie repurchases after removing the effect of share issuances) following
Fama and French (2001) and Skinner (2008) Our inferences are unchanged29
This test is subject to two important caveats The first is we may not detect a decline in
repurchases because in the Post period firms need to offset the exercise of options that were
granted during the Pre period That is a post-FAS123R reduction in grants may not (yet) translate
into a reduction in exercises during the Post period which reduces our ability to test the dilution
hypothesis (ie that firms repurchase shares to offset exercises)30 However we can examine a
variation of this hypothesis where firms use repurchases to manage the effect of unexercised
options on diluted EPS (Bens et al 2003) To do so in Panel C we use a measure of adjusted
repurchases where we subtract our estimate of repurchases undertaken to offset the exercise of
ESO31 We effectively test whether firms experiencing an accounting-induced decrease in option
grants engage in less repurchases (net of exercise-driven repurchases) because their need to
manage the effect of unexercised options on diluted EPS is lower However the coefficient on
the variables of interest is either insignificant or positive inconsistent with the hypothesis
29 In the case of repurchases we do not examine separately ldquoinitiationsrdquo and ldquointensityrdquo as we do for dividends
because initiation is not clearly defined for repurchases Unlike dividends the occurrence of a repurchase in a given
year (or the lack thereof) cannot be used to infer a general policy due to the more discretionary nature of the timing of
repurchases 30 To capture the effect of lower option-based compensation on option exercises and thus on repurchases we would
ideally extend the Post period beyond 2007 However as noted by Floyd et al (2015) repurchases declined
dramatically after 2007 because of the financial crisis making it difficult to detect the effect of any other factor 31 As upper bound estimate of exercise-driven repurchases we multiply the number of ESO exercised during the year
times the average stock price during the year Since the number of ESO exercised is available in Compustat starting in
2004 Panel C is based on observations from 2004 to 2007
31
A second important caveat is that most firms replaced stock options with restricted stock
(Table 2 Panel C) Unvested restricted stock is excluded from the denominator in the computation
of basic EPS (once vested it is included) However it is included in the denominator of diluted
EPS using the treasury stock method similar to stock options Given the complexity of this
method without access to all details of restricted stock grants and option grants it is difficult to
determine whether the switch from stock options to restricted stock decreased the need for
dilution-driven repurchases as our test implicitly assumes Hence it is possible that we do not find
a decrease in repurchases because a reduced need to offset the dilutive effect of stock options was
neutralized by an increased need to offset the dilutive effect of restricted stock
Subject to the above caveats the evidence in Table 4 is not consistent with a positive causal
relation between the use of option-based pay and repurchases More precisely it suggests that
option-driven dilution concerns do not have a first-order effect on the magnitude of repurchases
even though they may play a role in the repurchase decision Hence our result is not necessarily
in conflict with the evidence in Brav et al (2005) where two-thirds of the surveyed financial
executives state that offsetting the dilutionary effect of stock option plans or other stock
programs is an important factor to their repurchase decisions
35 Option-Based Pay and Payout Composition
As an alternative to examining dividends and repurchases separately we also look at the
payout composition the change in the DividendsTotal Payout ratio from the Pre to the Post period
where Total Payout is the sum of dividends and repurchases As noted earlier we focus on the
subsample of firms with both dividends and repurchases in both Pre and Post periods so as to
capture the change in payout mix by firms routinely using both vehicles to return cash to
shareholders If the use of option-based pay causes firms to substitute repurchases for dividends
32
we should find a positive association between Accounting Impact or Treated and the payout mix
defined as DividendsTotal Payout ratio Firms with a higher accounting-driven reduction in
option-based pay should have an increase (decrease) in the relative weight of dividends
(repurchases) to the total payout However as reported in Table 5 Panel A we fail to find a
significant association between Accounting Impact (column 1 and 2) or Treated (column 3) and
the change in payout mix The results are similar when we use Net Payout (dividends plus net
repurchases) instead of Total Payout in computing the payout mix (Panel B)
Overall the combined evidence in Tables 3-5 does not support the hypothesis that option-
based compensation has negative (positive) effect on dividends (repurchases) or that it causes
firms to replace dividends with repurchases
4 Conclusion
Prior literature has documented robust associations between option-based compensation and
payout policy yet it remains unclear whether this association reflcts a causal influence We
investigate the causal effect of option-based compensation on payout policy using the adoption of
FAS123R which resulted in a significant decrease in option grants making it a plausible
exogenous shock to the use of option-based pay To overcome the challenge of no control group
we exploit the fact that firms responded differently depending on the firm-specific accounting
impact as measured by the implied option expense disclosed in the footnotes prior to FAS123R
Firms with larger expected accounting impact curtailed option-based compensation much more
aggressively than firms with lower impact Using a sample of SampP 1500 firms we find no
evidence that firms with a larger accounting-induced decline in option compensation increased
dividends reduced repurchases or changed their payout composition contrary to the widely held
belief that option-based pay has a causal influence on payout policy
33
Appendix Variable Definitions and Data Sources
Accounting Impact Variables
Accounting impact Implied option expense (Compustat XINTOPT) divided by total assets
(Compustat AT) This variable is measured at fiscal year 2002 and is time-invariant
Accounting impact rank The quartile rank of Accounting impact (1=lowest 4=highest)
Payout Variables
Regular dividendTotal assets The numerator is total regular cash dividends in the fiscal year
from the distribution dataset in CRSP Regular cash dividends are identified by the distribution
codes 1212 1222 1232 or 1242 The denominator is one-year lagged total assets (Compustat
AT)
DPS Dividend per share (Compustat DVPSX_F)
DPS pct change The percentage change of average DPS from Pre- to Post-FAS123R period
DPS pct change gtX indicator A dummy variable that equals one if DPC pct change is greater
than X and zero otherwise
RepurchaseTotal assets The numerator is the repurchase of common equity which equals total
repurchase (Compustat PRSTK) minus the change in preferred stock redemption value
(Compustat PSTKRV) The denominator is one-year lagged total assets (Compustat AT)
Net repurchaseTotal assets Net repurchase removes the effect of share issuances The
construction follows Fama and French (2001) and Skinner (2008) if the firm uses the treasury
stock method for repurchase net repurchase equals the increase in common treasury stock
(Compustat TSTKC) if the firm uses the retirement method (when common treasury stock is zero
in the current and prior year) net repurchase equals total repurchases minus stock issuance
(Compustat SSTK) and change in preferred stock redemption value (Compustat PSTKRV)
When the above measures give negative value net repurchase is set to zero
Adjusted repurchaseTotal assets Adjusted repurchase removes from total repurchase the potential
effect of repurchasing exercised options This variable equals total repurchase of common stocks
minus the product between the number of options exercised (Compustat OPTEXD) and average
stock price during the year When the above measure gives negative value adjusted repurchase is
set to zero Since the number of options exercised is not available before 2003 we drop
observations in 2003 when we use this variable
34
Total payoutTotal assets the sum of Regular dividendTotal assets and RepurchaseTotal assets
Regular dividendTotal payout regular cash dividend divided by the sum of regular cash dividend
and repurchase from common equity In the two-period analysis (Pre- vs Post-FAS123R) we
separately sum the numerator and the denominator for each firm-period and then calculate the ratio
Regular dividendNet payout regular dividend divided by the sum of regular dividend and net
repurchase In the two-period analysis (Pre- vs Post-FAS123R) we separately sum the numerator
and the denominator for each firm-period and then calculate the ratio
Compensation Variables
Salary_$ Average salary (Execucomp SALARY) of the top 5 highest paid executives in $1000
Salary_ Average salary (Execucomp SALARY) divided by average total pay (Execucomp
TDC1) of the top 5 highest paid executives
Bonus_$ Average bonus (Execucomp BONUS) of the top 5 highest paid executives in $1000
Due to a data format change we add non-equity plan-based awards (Execucomp
NON_EQ_TARG) to this measure after 2006
Bonus_ Bonus_$ divided by average total pay (Execucomp TDC1) of the top 5 highest paid
executives
Option grant_$ Average option grant value (Execucomp OPTION_AWARDS_BLK_VALUE or
OPTION_AWARDS_FV) of the top 5 highest paid executives in $1000 Due to a data format
change we use OPTION_AWARDS_FV for this measure after 2006
Option grant_ Option grant_$ divided by average total pay (Execucomp TDC1) of the top 5
highest paid executives
Restricted stock grant_$ Average restricted stock grant value (Execucomp RSTKGRNT or
STOCK_AWARDS_FV) of the top 5 highest paid executives in $1000 Due to data format
change we use STOCK_AWARDS_FV for this measure after 2006
Restricted stock grant_ Restricted stock grant_$ divided by average total pay (Execucomp
TDC1) of the top 5 highest paid executives
Total pay_$ Average total pay (Execucomp TDC1) of the top 5 highest paid executives in $1000
35
Other Characteristics
Size The book value of total assets (Compustat AT) minus the book value of common equity
(Compustat CEQ) plus the market value of common equity from CRSP in $M
Log(size) the natural logarithm of size
Book-to-market the book value of common equity dividend by its market value
Leverage long term debt plus short term debt (Compustat DLTT + DLC) divided by total assets
Asset tangibility tangible assets (Compustat AT - INTAN) divided by total assets
Free cash flow Operating cash flow (Compustat OANCF) minus capital expenditure (Compustat
CAPX) then divided by lagged total assets
Cash holding Cash and short-term investments (Compustat CHE) divided by total assets
ROA volatility the standard deviation of returns on assets (operating income before tax divided by
lagged total assets) in the past five fiscal years
Institutional ownership the number of shares held by institutional investors divided by the number
of shares outstanding from Thomson Reuters Institutional Holdings database
Sales growth the growth rate of sales (Compustat SALE) from the prior year
Past stock return annual stock return from the prior year
Loss indicator a dummy variable taking value of one if the current net income is negative and
zero otherwise
36
References
Aboody David 1996 Market Valuation of Employee Stock Options Journal of Accounting and
Economics 22 357-391
Aboody David Barth Mary E and Ron Kasznik 2004 Firms Voluntary Recognition of Stock-
Based Compensation Expense Journal of Accounting Research 42 123ndash150
Aboody David and Ron Kasznik 2008 Executive stock-based compensation and firmsrsquo cash
payout the role of shareholdersrsquo tax-related payout preferences Review of Accounting Studies
13 216ndash251
Anantharaman Divya and Yong Gyu Lee 2014 Managerial risk taking incentives and corporate
pension policy Journal of Financial Economics 111 328ndash351
Baker Malcolm and Jeffrey Wurgler 2004 A catering theory of dividends Journal of Finance
59 1125-1165
Baker Malcolm and Jeffrey Wurgler 2016 Dividends as reference points a behavioral signaling
approach Review of Financial Studies 29 697-738
Bakke Tor-Erik Hamed Mahmudi Chitru Fernando and Jesus Salas 2015 The causal effect of
option pay on corporate risk management Journal of Financial Economics forthcoming
Balsam Steven Austin Reitenga and Jennifer Yin 2008 Option acceleration in response to SFAS
No 123 (R) Accounting Horizons 22 23-45
Bens Daniel and Steven Monahan 2008 Altering Investment Decisions to Manage Financial
Reporting Outcomes Asset-Backed Commercial Paper Conduits and FIN 46 Journal of
Accounting Research 46 1017-1055
Bens Daniel A Venky Nagar Douglas J Skinner and MH Franco Wong 2003 Employee stock
options eps dilution and stock repurchases Journal of Accounting and Economics 36 51ndash90
Bertrand Marianne Esther Duflo and Sendhil Mullainathan 2004 How much should we trust
differences-in-differences estimates The Quarterly Journal of Economics 119 249ndash275
Blouin Jennifer L Jana S Raedy and Douglas A Shackelford 2011 Dividends Share
Repurchases and Tax Clienteles Evidence from the 2003 Reductions in Shareholder Taxes
The Accounting Review 86 887-914
Brav Alon John R Graham Campbell R Harvey and Roni Michaely 2005 Payout policy in the
21st century Journal of Financial Economics 77 483ndash527
Brown Lawrence D and Yen-Jung Lee 2011 Changes in Option-Based Compensation Around
the Issuance of SFAS123R Journal of Business Finance amp Accounting 38 1053ndash109
37
Brown Jeffrey R Nellie Liang and Scott Weisbenner 2007 Executive financial incentives and
payout policy Firm responses to the 2003 dividend tax cut Journal of Finance 62 1935ndash
1965
Burns Natasha Brian McTier and Kristina Minnick 2015 Equity-incentive compensation and
payout policy in Europe Journal of Corporate Finance 30 85-97
Carter Mary Ellen and Luann J Lynch 2003 The Consequences of the FASBrsquos 1998 Proposal on
Accounting for Stock Option Repricing Journal of Accounting and Economics 35 51-72
Carter Mary Ellen Luann J Lynch and Irem Tuna 2007 The role of accounting in the design of
CEO equity compensation The Accounting Review 82 327ndash357
Chava Sudheer and Amiyatosh Purnanandam 2010 CEOs versus CFOs Incentives and
corporate policies Journal of Financial Economics 97 263ndash278
Chetty Raj and Emmanuel Saez 2005 Dividend taxes and corporate behavior Evidence from the
2003 dividend tax cut The Quarterly Journal of Economics 120 791ndash833
Choudhary Preeti Shivaram Rajgopal and Mohan Venkatachalam 2009 Accelerated vesting of
employee stock options in anticipation of FAS123R Journal of Accounting Research 47 105ndash
146
Christensen Hans B and Valeri Nikolaev 2009 Contracting on Mandatory Changes to GAAP
New Practice and Its Determinants Working Paper University of Chicago
Chu Yongqiang and Tao Ma 2015 How does management compensation affect bank risk taking
evidence from FAS 123R University of South Carolina Working Paper
Cuny Charles J Gerald S Martin and John J Puthenpurackal 2009 Stock options and total
payout Journal of Financial and Quantitative Analysis 44 391ndash410
DeAngelo Harry Linda DeAngelo and Douglas J Skinner 2000 Special Dividends and the
Evolution of Dividend Signaling Journal of Financial Economics 57 309-354
Dechow Patricia M Amy P Hutton and Richard G Sloan 1996 Economic consequences of
accounting for stock-based compensation Journal of Accounting Research 34 1ndash20
Edgerton J 2013 Four facts about dividend payouts and the 2003 tax cut International Tax and
Public Finance 20 769-784
Edmans Alex and Xavier Gabaix 2015 Executive compensation a modern primer Journal of
Economic Literature forthcoming
38
Fama Eugene F and Kenneth R French 2001 Disappearing dividends changing firm
characteristics or lower propensity to pay Journal of Financial Economics 60 3ndash43
Farre-Mensa Joan Roni Michaely and Martin C Schmalz 2014 Payout policy Annual Review
of Financial Economics 6 75ndash134
Fenn George W and Nellie Liang 2001 Corporate payout policy and managerial stock
incentives Journal of Financial Economics 60 45ndash72
Ferri Fabrizio and Tatiana Sandino 2009 The impact of shareholder activism on financial
reporting and compensation the case of employee stock options expensing The Accounting
Review 84 433ndash466
Floyd Eric Nan Li and Douglas J Skinner 2015 Payout policy through the financial crisis the
growth of repurchases and the resilience of dividends Journal of Financial Economics 118
299-316
Frydman Carola and Dirk Jenter 2010 CEO compensation Annual Review of Financial
Economics 2 75-102
Gipper Brandon 2015 Assessing the Effects of Disclosing Management Compensation Working
Paper University of Chicago
Gormley Todd David Matsa and Todd Milbourn 2013 CEO compensation and corporate risk
evidence from a natural experiment Journal of Accounting and Economics 56 79-101
Graham John Michelle Hanlon and Terry Shevlin 2011 Real effects of accounting rules
evidence from multinational firmsrsquo investment locations and profit repatriation decisions
Journal of Accounting Research 49 137-185
Graham John Campbell Harvey and Shiva Rajgopal 2005 The Economic implications of
corporate financial reporting Journal of Accounting and Economics 40 3-73
Greenspan Alan 2002 Testimony of Alan Greenspan before the Committee on Banking
Housing and Urban Affairs US Senate July 16 Washington DC Government Printing
Office
Grullon Gustavo and Roni Michaely 2002 Dividends Share Repurchases and the Substitution
Hypothesis Journal of Finance 57 1649-1684
Hail Luzi Ahmed Tahoun and Clare Wang 2014 Dividend Payouts and Information Shocks
Journal of Accounting Research 52 403-456
Hall Brian J and Kevin J Murphy 2002 Stock options for undiversified executives Journal of
Accounting amp Economics 33 3-42
39
Hall Brian J and Kevin J Murphy 2003 The trouble with stock options Journal of Economic
Perspectives 17 49ndash70
Hanlon Michelle and Jeffrey L Hoopes 2014 What do firms do when dividend tax rates change
An examination of alternative payout responses Journal of Financial Economics 114 105-
124
Hayes Rachel M Michael Lemmon and Mingming Qiu 2012 Stock options and managerial
incentives for risk taking Evidence from FAS123R Journal of Financial Economics 105
174ndash190
Heron Randall A Erik Lie 2007 Does backdating explain the stock price pattern around
executive stock option grants Journal of Financial Economics 83 271-295
Hribar Paul Nicole Thorne Jenkins and W Bruce Johnson 2006 Stock repurchases as an
earnings management device Journal of Accounting and Economics 41 3ndash27
Jensen Michael C 1986 Agency cost of free cash flow corporate finance and takeovers
American Economic Review 76 323-329
Jolls Christine 1998 Stock repurchases and incentive compensation NBER Working Paper No
w6467
Jung Boochun Woo-Jong Lee and Yanhua Sunny Yang 2016 The Impact of Dividend
Covenants on Investment and Operating Performance Journal of Business Finance amp
Accounting 43 414ndash447
Kahle Kathleen M 2002 When a buyback isnrsquot a buyback open market repurchases and
employee options Journal of Financial Economics 63 235ndash261
Lambert Richard A William N Lanen and David F Larcker 1989 Executive stock option plans
and corporate dividend policy Journal of Financial and Quantitative Analysis 24 409ndash425
Lintner John 1956 Distribution of incomes of corporations among dividends retained earnings
and taxes The American Economic Review 46 97-113
Low Angie 2009 Managerial risk-taking behavior and equity-based compensation Journal of
Financial Economics 92 470-490
Miller Merton H and Franco Modigliani 1961 Dividend policy growth and the valuation of
shares The Journal of Business 34 411ndash433
Minnick Kristina and Leonard Rosenthal 2015 Stealth compensation Do CEOs increase their
pay by influencing dividend policy Journal of Corporate Finance 25 435-454
40
Murphy Kevin J 1999 Executive compensation In O Ashenfelter and D Card (eds) North
Holland Handbook of Labor Economics Amsterdam Elsevier Science BV
Murphy Kevin J 2013 Executive compensation Where we are and how we got there Handbook
of the Economics of Finance Elsevier Science North Holland 211-356
Nikolaev Valeri 2010 Debt Covenants and Accounting Conservatism Journal of Accounting
Research 48 143-176
Puri Manju Joumlrg Rocholl and Sascha Steffen 2011 Global retail lending in the aftermath of the
US financial crisis Distinguishing between supply and demand effects Journal of Financial
Economics 100 556-578
Shue Kelly and Richard R Townsend 2014 Swinging for the fences Executive reactions to
quasi-random option grants Working Paper University of Chicago
Skinner Douglas J 2008 The evolving relation between earnings dividends and stock
repurchases Journal of Financial Economics 87 582-609
Weisbenner Scott J 2000 Corporate share repurchases in the 1990s What role do stock options
play FEDS Working Paper No 2000-29
Zhang Dan 2013 CEO dividend protection Working Paper BI Norwegian Business School
41
Figure 1 Trends of dividends and repurchases from 2003 to 2007 Panel A plots the average
Regular DividendTotal Assets of firms in the highest and lowest quartiles of Accounting Impact
measured in 2002 Panel B shows the average Total RepurchaseTotal Assets of firms in the
highest and lowest quartiles of Accounting Impact measured in 2002
Panel A Trends of regular dividends
Panel B Trends of total repurchases
00
05
10
15
20
2003 2004 2005 2006 2007
Regular DividendTotal Assets
Lowest Acc Impact
Highest Acc Impact
Pre Post
00
20
40
60
80
100
2003 2004 2005 2006 2007
Total Repurchase Total Assets
Lowest Acc Impact
Highest Acc Impact
Pre Post
42
Table 1
Summary Statistics
Panel A Firm characteristics - full sample
N Mean Std dev 25 pctl Median 75 pctl
Accounting impact (2002) 1176 173 366 022 052 163
Payout variablesRegular dividendTotal assets 5653 093 148 000 000 142
RepurchaseTotal assets 5653 394 710 000 035 500
Total payoutTotal assets 5653 488 748 000 175 666
Regular dividendTotal payout 4091 3874 4057 000 2237 8833
Level of executive compensation (in $1000)
Salary_$ 5653 450 190 314 409 544
Bonus_$ 5653 476 616 122 295 586
Option grant_$ 5653 791 1137 62 384 1002
Restricted stock grant_$ 5653 458 866 0 58 518
Total pay_$ 5653 2481 2475 890 1647 3074
Percentage of executive compensation
Salary_ 5653 296 183 165 251 382
Bonus_ 5653 197 148 97 177 268
Option grant_ 5653 283 235 67 256 445
Restricted stock grant_ 5653 141 180 00 41 249
Control variables
Size ($M) 5653 11086 27294 1017 2459 8117
Log(size) 5653 7985 1565 6925 7808 9002
Book-to-market 5653 0445 0287 0251 0388 0578
Leverage 5653 0202 0172 0038 0187 0309
Asset tangibility 5653 0806 0184 0691 0853 0965
Free cash flow 5653 0059 0091 0013 0059 0108
Cash holding 5653 0166 0172 0034 0100 0247
ROA volatility 5653 0056 0056 0021 0038 0070
Institutional ownership 5653 0753 0202 0639 0795 0910
Sales growth 5653 0121 0189 0028 0096 0183
Past stock return 5653 0094 0183 -0012 0094 0199
Loss indicator 5653 0164 0370 0000 0000 0000
This table presents summary statistics Panel A shows the descriptive statistics of payout variables compensation
variables and other firm characteristics for the full sample Accounting impact is the implied option expense
measured at fiscal year 2002 All other variables are measured at firm-year level from fiscal year 2003 to 2007
resulting in 5653 firm-year observations (except for Regular dividendTotal Payout which can be measured only
for the 4901 firm-year observations with Total payout greater than zero) Panel B shows the pairwise correlations
between main variables at firm-year level Panel C compares payout variables compensation variables and other
firm characteristics before and after FAS123R The Pre-FAS123R period consists of fiscal year 2003 and 2004
the Post-FAS123R period covers fiscal year 2005-2007 Panel D compares the trends of payout and compensation
variables around FAS123R across four quartile groups ranked by 2002 accounting impact Panel E compares the
trends of payout and compensation variables around FAS123R between the treated and control group under the
alternative treatment definition in Bakke et al (2015) (see Section 22) All variables are defined in Appendix The
notation and in Panel C indicates statistically significant at 10 5 and 1 level in T-tests for equal
means respectively
43
Pa
nel
B
Pea
rso
n c
orr
ela
tio
ns
Reg div
Repurchase
Total payout
Salary_
Bonus_
Option_
RS_
Log(size)
BM
Leverage
Tangibility
FCF
Cash holdingROA vol
Inst own
Sales growth
Past ret
urn
Loss
Reg
div
10
0
Repurc
hase
01
610
0
Tota
l payout
03
509
810
0
Sala
ry_
-0
10
-01
8-0
19
10
0
Bonus_
00
700
100
3-0
01
10
0
Option_
-0
10
00
900
6-0
41
-03
510
0
RS
_
01
000
901
0-0
32
-01
1-0
40
10
0
Log(s
ize)
03
101
802
3-0
56
01
101
202
210
0
BM
-02
1-0
28
-03
103
0-0
03
-02
000
0-0
33
10
0
Levera
ge
-00
1-0
08
-00
8-0
05
00
6-0
11
00
801
9-0
03
10
0
Tangib
ility
00
200
100
101
200
1-0
05
-00
6-0
12
-00
4-0
18
10
0
FC
F02
203
703
9-0
20
00
901
1-0
01
02
4-0
32
-02
1-0
16
10
0
Cash
hold
ing
-01
301
000
700
2-0
14
02
2-0
10
-02
3-0
16
-03
502
901
210
0
RO
A v
ol
-01
5-0
04
-00
700
4-0
11
01
9-0
11
-02
3-0
08
-01
101
2-0
02
03
910
0
Inst
ow
n
-00
901
401
1-0
17
00
200
701
200
7-0
01
00
3-0
08
01
4-0
06
-01
110
0
Sale
s gro
wth
-00
8-0
04
-00
6-0
15
00
501
0-0
02
00
7-0
16
-00
3-0
08
01
300
201
400
410
0
Past
retu
rn00
901
301
4-0
18
01
5-0
01
00
301
6-0
29
-01
000
102
7-0
14
-01
001
602
710
0
Loss
-02
0-0
19
-02
201
8-0
18
00
4-0
05
-02
601
901
300
6-0
41
01
702
3-0
16
-01
8-0
40
10
0
44
Panel C Firm characteristics - before and after FAS123R
Pre FAS 123R Post FAS 123R Difference
Payout variables
Regular dividendTotal assets 083 099 016
RepurchaseTotal assets 245 490 245
Total payoutTotal assets 328 589 261
Regular dividendTotal payout 3914 2790 -1124
Level of executive compensation (in $1000)
Salary_$ 426 463 37
Bonus_$ 418 505 87
Option grant_$ 896 707 -191
Restricted stock grant_$ 269 574 305
Total pay_$ 2263 2584 321
Percentage of executive compensation
Salary_ 305 293 -12
Bonus_ 186 204 18
Option grant_ 343 240 -103
Restricted stock grant_ 87 176 89
Control variables
Size ($M) 9671 11631 1960
Log(size) 7860 8035 0175
Book-to-market 0437 0453 0016
Leverage 0201 0203 0002
Asset tangibility 0822 0793 -0029
Free cash flow 0061 0057 -0004
Cash holding 0175 0159 -0016
ROA volatility 0067 0048 -0019
Institutional ownership 0712 0781 0069
Sales growth 0137 0108 -0029
Past stock return 0080 0101 0021
Loss indicator 0173 0159 -0014
45
Pa
nel
D
Fir
m c
ha
racte
rist
ics
by q
ua
rtil
e o
f a
cco
un
tin
g i
mp
act
- b
efo
re a
nd
aft
er
FA
S1
23
R
Accounting im
pact
(2002)
Num
ber
of
Fir
ms
Pre
Post
Pre
Post
Pre
Post
Pre
Post
Payout
vari
able
s
Regula
r div
idendT
ota
l ass
ets
11
2
12
4
09
4
11
1
09
5
11
3
03
0
04
9
Repurc
hase
Tota
l ass
ets
11
3
26
8
19
2
37
3
32
7
63
1
35
1
68
7
Tota
l payout
Tota
l ass
ets
22
4
39
1
28
5
48
4
42
2
74
4
38
1
73
6
Regula
r div
idendT
ota
l payout
643
7
469
8
474
0
341
1
284
5
195
4
82
5
74
5
Perc
enta
ge o
f executive c
om
pensa
tion
Sala
ry_
337
295
313
287
296
289
276
300
Bonus_
223
226
214
228
172
192
134
169
Option g
rant_
201
167
290
210
373
260
507
325
Rest
ricte
d s
tock g
rant_
116
194
98
180
89
176
43
155
294
294
294
294
1st Q
uart
ile2
nd Q
uart
ile3
rd Q
uart
ile4
th Q
uart
ile
01
2
03
5
09
3
55
1
46
Accounting impact
Number of Firms
By accounting impact quartile
1
2
3
4
Pre Post Pre Post
Payout variables
Regular dividendTotal assets 09 11 08 10
RepurchaseTotal assets 18 31 26 52
Total payoutTotal assets 28 43 34 62
Regular dividendTotal payout 428 357 386 265
Percentage of executive compensation
Salary_ 435 364 282 280
Bonus_ 226 214 179 202
Option grant_ 92 125 387 261
Restricted stock grant_ 125 188 80 174
Percentage of CEO compensation
Salary_(CEO) 485 364 260 259
Bonus_(CEO) 249 228 185 219
Option grant_(CEO) 10 127 406 275
Restricted stock grant_(CEO) 128 182 82 183
Panel E Firm characteristics by alternative treatment definition - before and
after FAS123R
Treated
25
19
997
223
250
256
268
10
177
71
Control
44
37
47
Table 2
Differential effect of FAS123R on the use of option-based compensation
Panel A Two-period first-difference regression
Prediction Coeff t-stat Coeff t-stat Coeff t-stat
Accounting impact rank - -0044 -628
Accounting impact rank=2 - -0044 -327
Accounting impact rank=3 - -0075 -468
Accounting impact rank=4 - -0140 -613
Treated - -0132 -875
ΔLog(size) 0061 202 0061 200 0063 214
ΔBook-to-market 0032 091 0032 092 0051 143
ΔLeverage -0157 -213 -0160 -218 -0111 -153
ΔAsset tangibility -0012 -014 -0020 -023 -0023 -026
ΔFree cash flow -0106 -095 -0108 -097 -0128 -117
ΔCash holding -0197 -211 -0193 -206 -0180 -194
ΔFive-year ROA volatility -0065 -031 -0056 -026 -0098 -047
ΔInstitutional ownership -0044 -091 -0043 -088 -0044 -092
ΔSales growth -0064 -102 -0065 -104 -0090 -153
ΔPast one-year stock return 0051 078 0052 080 0091 138
ΔLoss frequency 0056 207 0057 207 0047 179
Log(size) -0009 -210 -0009 -207 -0002 -035
Book-to-market -0015 -056 -0013 -049 0018 072
Leverage 0022 046 0023 048 0068 150
Asset tangibility 0033 077 0033 078 0053 128
Free cash flow 0227 202 0220 195 0127 117
Cash holding -0002 -004 0012 019 -0078 -141
Five-year ROA volatility -0451 -240 -0430 -228 -0509 -283
Institutional ownership -0123 -360 -0122 -359 -0100 -292
Sales growth -0041 -056 -0040 -055 -0089 -125
Past one-year stock return -0009 -015 -0006 -010 0078 125
Loss frequency 0055 174 0056 178 0054 173
Fixed effect
Standard error
Adj R-squared
Observations
Model (3)
Dependent variable ΔAvg Option grantTotal pay
Huber-White
0156
This table investigates whether the effect of FAS123R on the use of option-based pay varies with its potential accounting impact Panel A
reports the results of estimating three two-period first-differencing models where for each firm we average its characteristics in Pre- and
Post-FAS123R period The Pre-FAS123R period consists of fiscal year 2003 and 2004 the Post-FAS123R period covers fiscal year 2005-
2007 In all three specifications the dependent variable is the change of average Option grantTotal pay from Pre- to Post-FAS123R period
The main independent variable varies by model in Model (1) the Accounting impact rank is the quartile rank of implied option expensetotal
assets measured in 2002 (1=lowest 4=highest) In Model (2) Accounting impact rank=2 (3 4) is an indicator that takes value of one if the
firmrsquos Accounting impact rank equals 2 (3 4) In Model (3) we use an alternative treatment construction following Bakke et al (2015)
where Treated is an indicator that takes value of zero if the firm granted zero option to its CEO in both 2003 and 2004 or the firm began to
voluntarily expense option-based pay at fair value in 2002 or earlier and one otherwise For each control variable we include both its level in
the Pre-FAS123R period and its change across the two periods Panel B shows the results of estimating fixed effect models with firm-year
observations The dependent variable is the firm-year level Option grantTotal pay The main independent variables are the interactions of
Post-FAS123R indicator (Post) with Accounting Impact rank Accounting impact rank indicators and Treated respectively All models in
Penal A have industry fixed effects and the standard errors are Huber-White heteroscedasticity-consistent standard errors All models in
Penal B have firm fixed effects and year fixed effects and the standard errors are clustered at firm level All variables are defined in
Appendix The notation and indicates statistically significant at 10 5 and 1 level respectively
Model (1) Model (2)
11711171 1171
Industry Industry
Huber-White
0124
Huber-White
0123
Industry
48
Panel B Panel fixed effects regression
Prediction Coeff t-stat Coeff t-stat Coeff t-stat
Acc impact rank x Post - -0044 -807
Acc impact rank 2 x Post - -0046 -333
Acc impact rank 3 x Post - -0077 -526
Acc impact rank 4 x Post - -0137 -776
Treated x Post - -0145 -970
Log(size) 0034 221 0034 217 0036 229
Book-to-market 0018 084 0017 083 0015 070
Leverage -0004 -009 -0006 -013 -0007 -015
Asset tangibility 0007 012 0004 006 0011 018
Free cash flow -0074 -151 -0072 -146 -0078 -158
Cash holding -0048 -086 -0050 -090 -0006 -011
Five-year ROA volatility 0250 231 0239 219 0437 414
Institutional ownership 0043 159 0044 161 0041 150
Sales growth -0033 -168 -0034 -171 -0031 -158
Past one-year stock return 0067 221 0068 224 0063 204
Loss indicator 0023 209 0022 207 0024 222
Fixed effects
Standard error
Adj R-squared
Observations
Dependent variable Option grantTotal pay
5653 5653 5653
Clustered by firm
Firm Year
Clustered by firm
Firm Year
Clustered by firm
0523 0523 0526
Model (1) Model (2) Model (3)
Firm Year
49
Table 3
Effect of option-based compensation on dividend policy
Panel A Two-period first-difference regression
Prediction Coeff t-stat Coeff t-stat Coeff t-stat
Accounting impact rank + 0000 077
Accounting impact rank=2 + 0001 091
Accounting impact rank=3 + 0000 044
Accounting impact rank=4 + 0001 092
Treated + 0000 -026
ΔLog(size) 0000 -030 0000 -030 0000 -026
ΔBook-to-market -0002 -190 -0002 -193 -0002 -195
ΔLeverage -0002 -059 -0002 -057 -0002 -059
ΔAsset tangibility 0016 431 0016 429 0016 430
ΔFree cash flow 0017 373 0017 373 0017 375
ΔCash holding -0011 -288 -0011 -285 -0010 -282
ΔFive-year ROA volatility 0003 034 0002 032 0003 035
ΔInstitutional ownership -0002 -073 -0002 -073 -0002 -070
ΔSales growth -0001 -040 -0001 -037 -0001 -038
ΔPast one-year stock return 0002 077 0002 076 0002 070
ΔLoss frequency 0000 -048 0000 -045 0000 -046
Log(size) 0000 183 0000 182 0000 182
Book-to-market -0002 -227 -0002 -225 -0002 -284
Leverage -0001 -037 -0001 -039 -0001 -048
Asset tangibility 0003 179 0003 180 0003 176
Free cash flow 0017 291 0017 291 0017 300
Cash holding 0002 080 0002 077 0002 098
Five-year ROA volatility 0003 035 0002 033 0003 044
Institutional ownership -0001 -068 -0001 -068 -0001 -058
Sales growth -0004 -177 -0004 -175 -0004 -172
Past one-year stock return 0004 169 0004 167 0004 165
Loss frequency -0001 -111 -0001 -109 -0001 -102
Fixed effect
Standard error
Adj R-squared
Observations
Dependent variable ΔAvg Regular dividendTotal assets
This table investigates the causal effect of option-based pay on dividend policy by examining whether changes in dividend policy around
FAS123R vary with its potential accounting impact Panel A reports the results of estimating three two-period first-differencing models
where for each firm we average its characteristics in Pre- and Post-FAS123R period In all three specifications the dependent variable is
the change of average Regular dividendTotal assets from Pre- to Post-FAS123R period The main independent variable varies by model in
Model (1) the Accounting impact rank is the quartile rank of implied option expensetotal assets measured in 2002 (1=lowest 4=highest) In
Model (2) Accounting impact rank=2 (3 4) is an indicator that takes value of one if the firmrsquos Accounting impact rank equals 2 (3 4) In
Model (3) we use an alternative treatment construction following Bakke et al (2015) where Treated is an indicator that takes value of zero
if the firm granted zero option to its CEO in both 2003 and 2004 or the firm began to voluntarily expense option-based pay at fair value in
2002 or earlier and one otherwise For each control variable we include both its level in the Pre-FAS123R period and its change across the
two periods Panel B shows the results of estimating fixed effect models with firm-year observations The dependent variable is the firm-
year level Regular dividendTotal assets The main independent variables are the interactions of Post-FAS123R indicator (Post) with
Accounting Impact rank Accounting impact rank indicators and Treated respectively Panel C examines the intensity of dividend changes
among firms with nonzero dividend per share in 2003 or 2004 In particular we estimates the same three models as in Panel A(with the
same independent variables) but for five dependent variables the change of average Regular dividendTotal assets from Pre- to Post-
FAS123R period (as in Panel A) the percentage change of DPS (dividend per share) from Pre- to Post-FAS123R period and three
indicators denoting respectively whether the percentage change of DPS was greater than 20 40 and 60 Panel D reports four
robustness tests of the dividend intensity regression In each of them a set of possible confounding observations is removed (see Section 33
for details) Panel E compares the trends of dividend initiation and termination around FAS123R across four quartile groups ranked by
accounting impact All models in Panel A C and D have industry fixed effects and the standard errors are Huber-White heteroscedasticity-
consistent standard errors All models in Penal B have firm fixed effects and year fixed effects and the standard errors are clustered at
firm level All variables are defined in Appendix The notation and indicates statistically significant at 10 5 and 1 level
Industry Industry Industry
Model (1) Model (2) Model (3)
1171 1171 1171
Huber-White Huber-White Huber-White
0105 0104 0105
50
Panel B Panel fixed effects regression
Prediction Coeff t-stat Coeff t-stat Coeff t-stat
Acc impact rank x Post + 0000 122
Acc impact rank 2 x Post + 0001 110
Acc impact rank 3 x Post + 0001 094
Acc impact rank 4 x Post + 0001 129
Treated x Post + 0000 -012
Log(size) 0001 179 0001 179 0001 181
Book-to-market 0000 025 0000 024 0000 031
Leverage 0001 062 0001 064 0001 069
Asset tangibility 0009 360 0009 358 0009 363
Free cash flow 0002 090 0002 093 0002 092
Cash holding -0007 -295 -0007 -298 -0007 -298
Five-year ROA volatility 0001 041 0001 038 0000 -006
Institutional ownership 0000 -027 0000 -026 0000 -027
Sales growth 0000 053 0000 051 0000 044
Past one-year stock return 0001 089 0001 088 0001 078
Loss indicator 0000 -060 0000 -057 0000 -076
Fixed effects
Standard error
Adj R-squared
Observations
Dependent variable Regular dividendTotal assets
Model (1) Model (2) Model (3)
Firm Year Firm Year Firm Year
5653 5653 5653
Clustered by firm Clustered by firm Clustered by firm
0877 0877 0877
51
Panel C Intensity of dividend changes around FAS123R
Prediction Coeff t-stat Coeff t-stat Coeff t-stat
Accounting impact rank + 0000 065
Accounting impact rank=2 + 0000 048
Accounting impact rank=3 + 0000 026
Accounting impact rank=4 + 0002 080
Treated + 0001 063
Dependent var DPS pct change
Accounting impact rank + -0145 -072
Accounting impact rank=2 + 0018 006
Accounting impact rank=3 + -0177 -045
Accounting impact rank=4 + -0746 -100
Treated + -0407 -119
Accounting impact rank + 0029 095
Accounting impact rank=2 + 0040 074
Accounting impact rank=3 + 0092 139
Accounting impact rank=4 + 0008 007
Treated + -0007 -012
Accounting impact rank + 0024 076
Accounting impact rank=2 + 0047 088
Accounting impact rank=3 + 0079 114
Accounting impact rank=4 + -0003 -002
Treated + 0030 052
Accounting impact rank + 0030 098
Accounting impact rank=2 + 0078 155
Accounting impact rank=3 + 0085 130
Accounting impact rank=4 + 0014 012
Treated + -0006 -011
Control variables
Fixed effect
Standard error
Observations 572 572 572
Yes Yes Yes
Huber-White Huber-White Huber-White
Industry Industry Industry
Dependent var DPS pct
change gt60 indicator
Model (1) Model (2) Model (3)
Dependent var ΔAvg Regular
dividendAssets
Dependent var DPS pct
change gt20 indicator
Dependent var DPS pct
change gt40 indicator
52
Panel D Robustness tests for intensity of dividend changes around FAS123R
Prediction Coeff t-stat Coeff t-stat Coeff t-stat
Accounting impact rank + 0006 017
Accounting impact rank=2 + 0067 118
Accounting impact rank=3 + 0041 057
Accounting impact rank=4 + -0061 -049
Treated + 0022 035Observations
Accounting impact rank + 0009 027
Accounting impact rank=2 + 0058 106
Accounting impact rank=3 + 0032 043
Accounting impact rank=4 + -0032 -024
Treated + 0018 028
Observations
Accounting impact rank + 0030 089
Accounting impact rank=2 + 0039 071
Accounting impact rank=3 + 0122 168
Accounting impact rank=4 + -0063 -052
Treated + 0075 132
Observations
Accounting impact rank + 0008 023
Accounting impact rank=2 + 0023 042
Accounting impact rank=3 + 0048 064
Accounting impact rank=4 + -0042 -033
Treated + -0010 -016
Observations
Control variables
Fixed effect
Standard error
Exclude firms with stable
payout ratio from 2003 to 2004
506 506 506
Dependent variable DPS pct change gt40 indicator
Model (1) Model (2) Model (3)
Exclude voluntary expensers
519 519
Exclude firms in the top decile
of option reduction (02-04)
Exclude firms that accelerated
option vesting
504 504 504
517 517 517
519
Huber-White Huber-White Huber-White
Yes Yes Yes
Industry Industry Industry
53
Panel E Dividend initiation and termination rates around FAS123R
Pre FAS 123R
1 280 75 7 6 13 173
2 284 135 18 9 27 200
3 286 181 11 14 25 138
4 282 260 9 10 19 73
Total 1132 651 45 39 84 129
Post FAS 123R
1 275 63 4 4 8 127
2 280 116 9 9 18 155
3 276 152 9 3 12 79
4 263 223 5 1 6 27
Total 1094 554 27 17 44 79
Pre FAS 123R
1 280 205 2 0 2 10
2 284 149 7 1 8 54
3 286 105 0 0 0 00
4 282 22 0 0 0 00
Total 1132 481 9 1 10 21
Post FAS 123R
1 275 212 3 6 9 42
2 280 164 1 2 3 18
3 276 124 1 1 2 16
4 263 40 0 3 3 75
Total 1094 540 5 12 17 31
termination
in 2004
03-04
cumulative
03-04
cumulative
Quartile firms
with
dividend in
2004
termination
in 2005
termination
in 2006
05-06
cumulative
05-06
cumulative
Termination
Quartile firms
with
dividend in
2002
termination
in 2003
without
dividend in
2004
initiation in
2003
initiation in
2004
03-04
cumulative
03-04
cumulative firmsQuartile
firmsQuartile initiation in
2005
initiation in
2006
05-06
cumulative
05-06
cumulative
Initiation
without
dividend in
2002
54
Table 4
Effect of option-based compensation on repurchases
Panel A Two-period first-difference regression with total repurchase
Prediction Coeff t-stat Coeff t-stat Coeff t-stat
Accounting impact rank - 0002 122
Accounting impact rank=2 - 0002 071
Accounting impact rank=3 - 0005 123
Accounting impact rank=4 - 0007 102
Treated - 0014 365
Control variables
Fixed effect
Standard error
Adj R-squared
Observations
Panel B Two-period first-difference regression with net repurchase
Prediction Coeff t-stat Coeff t-stat Coeff t-stat
Accounting impact rank - 0003 166
Accounting impact rank=2 - 0002 051
Accounting impact rank=3 - 0006 165
Accounting impact rank=4 - 0009 137
Treated - 0010 300
Control variables
Fixed effect
Standard error
Adj R-squared
Observations
Panel C Two-period first-difference regression with repurchase adjusted for exercised options
Prediction Coeff t-stat Coeff t-stat Coeff t-stat
Accounting impact rank - 0001 056
Accounting impact rank=2 - 0002 062
Accounting impact rank=3 - 0007 172
Accounting impact rank=4 - -0001 -008
Treated - 0006 197
Control variables
Fixed effect
Standard error
Adj R-squared
Observations
Dependent variable ΔAvg RepurchaseTotal assets
This table investigates the causal effect of option-based pay on payout policy by examining whether the changes of repurchase around
FAS123R vary with its potential accounting impact Panel A reports the results of estimating three two-period first-differencing models
where for each firm we average its characteristics in Pre- and Post-FAS123R period In all three specifications the dependent variable is
the change of average RepurchaseTotal assets from Pre- to Post-FAS123R period The main independent variable varies by model in
Model (1) the Accounting impact rank is the quartile rank of implied option expensetotal assets measured in 2002 (1=lowest 4=highest)
In Model (2) Accounting impact rank=2 (3 4) is an indicator that takes value of one if the firmrsquos Accounting impact rank equals 2 (3 4)
In Model (3) we use an alternative treatment construction following Bakke et al (2015) where Treated is an indicator that takes value of
zero if the firm granted zero option to its CEO in both 2003 and 2004 or the firm began to voluntarily expense option-based pay at fair
value in 2002 or earlier and one otherwise Panel B reports the regressions with the change of Net repurchaseTotal assets as the
dependent variable and the same independent variable as in Panel A Panel C reports the regressions with the change of Adjusted
repurchaseTotal assets as the dependent variable and the same independent variable as in Panel A All models in Panel A B and C have
industry fixed effects and the standard errors are Huber-White heteroscedasticity-consistent standard errors All variables are defined in
Appendix The notation and indicates statistically significant at 10 5 and 1 level respectively
Model (1) Model (2) Model (3)
Yes Yes Yes
Industry Industry Industry
Huber-White Huber-White Huber-White
Dependent variable ΔAvg Net repurchaseTotal assets
1171 1171 1171
0238 0237 0245
Model (1) Model (2) Model (3)
Yes Yes Yes
Industry Industry Industry
Huber-White Huber-White Huber-White
Dependent variable ΔAvg Adjusted repurchaseTotal assets
0229 0229 0233
1171 1171 1171
Model (1) Model (2) Model (3)
Yes Yes Yes
Industry Industry Industry
Huber-White Huber-White Huber-White
0111 0112 0114
1168 1168 1168
55
Table 5
Effect of option-based compensation on payout mix
Panel A Two-period first-difference regression with total payout mix
Prediction Coeff t-stat Coeff t-stat Coeff t-stat
Accounting impact rank + 0006 028
Accounting impact rank=2 + 0018 045
Accounting impact rank=3 + -0001 -001
Accounting impact rank=4 + 0043 052
Treated + -0035 -094
Control variables
Fixed effect
Standard error
Adj R-squared
Observations
Panel B Two-period first-difference regression with net payout mix
Prediction Coeff t-stat Coeff t-stat Coeff t-stat
Accounting impact rank + -0002 -008
Accounting impact rank=2 + 0008 016
Accounting impact rank=3 + 0018 034
Accounting impact rank=4 + -0059 -055
Treated + -0050 -101
Control variables
Fixed effect
Standard error
Adj R-squared
Observations
0049 0043 0054
257 257 257
Industry Industry Industry
Huber-White Huber-White Huber-White
Dependent variable ΔAvg Regular dividendNet payout
Model (1) Model (2) Model (3)
Yes Yes Yes
0154 0151 0156
362 362 362
Industry Industry Industry
Huber-White Huber-White Huber-White
This table investigates the causal effect of option-based pay on payout mix for firms using both dividend and repurchase by examining
whether the changes of payout mix around FAS123R vary with its potential accounting impact Panel A reports the results of estimating
three two-period first-differencing models where for each firm we average its characteristics in Pre- and Post-FAS123R period In all three
specifications the dependent variable is the change of average Regular dividendTotal payout from Pre- to Post-FAS123R period The main
independent variable varies by model in Model (1) the Accounting impact rank is the quartile rank of implied option expensetotal assets
measured in 2002 (1=lowest 4=highest) In Model (2) Accounting impact rank=2 (3 4) is an indicator that takes value of one if the firmrsquos
Accounting impact rank equals 2 (3 4) In Model (3) we use an alternative treatment construction following Bakke et al (2015) where
Treated is an indicator that takes value of zero if the firm granted zero option to its CEO in both 2003 and 2004 or the firm began to
voluntarily expense option-based pay at fair value in 2002 or earlier and one otherwise Panel B reports the regressions with the change of
Regular dividendNet payout as the dependent variable and the same independent variables as in Panel A Panel A (Panel B) is based on
observations with nonzero regular dividend and repurchase (net repurchase) in both Pre- and Post-FAS123R period All models in Panel A
and B have industry fixed effects and the standard errors are Huber-White heteroscedasticity-consistent standard errors All variables are
defined in Appendix The notation and indicates statistically significant at 10 5 and 1 level respectively
Yes Yes Yes
Dependent variable ΔAvg Regular dividendTotal payout
Model (1) Model (2) Model (3)

18
composition of CEO pay (untabulated) is similar As for the control variables the figures are
generally consistent with other studies examining SampP 1500 firms over the same period
Panel B reports the pairwise Pearson correlations among the relevant variables The
correlations are in line with the associations documented in prior studies For example larger
firms and firms with higher profitability (free cash flows) have higher payouts loss firms have
lower payouts greater volatility in operating income is associated with lower dividends
More relevant to our analysis Panel C presents the mean of each variable in the Pre and Post
period for the full sample For each variable we first compute the firm-level mean over the Pre
and the Post Period and then compute the mean of the resulting figure across all firms There is a
striking increase in repurchases which double from 245 to 490 of total assets causing a
similar increase in total payout The increase in dividends is much smaller from 083 to 099
of total assets As a result for firms with positive payout dividends become a smaller fraction of
total payout in the Post period (2790 versus 3914 in the Pre period) This trend is consistent
with Floyd et al (2015) who document a dramatic increase in repurchases in the years leading to
the 2008 financial crisis Consistent with previous studies around FAS123R there is a significant
reduction in option grants as a fraction of total executive pay (from 343 to 240) and a
corresponding increase in the use of restricted stock (from 87 to 176) with little variation in
the weight of salary and bonus (note that restricted stock salary and bonus were expensed both
before and after FAS123R) Similar patterns hold for the composition of CEO pay (untabulated)
Compared to changes in the mix of executive pay changes in the levels of control variables are
generally less pronounced
Panel D reports the change in the key compensation and payout variables from the Pre to the
Post period by quartiles of implied option expense and yields a number of insights First
19
confirming the skewness suggested by Panel A the mean implied option expense is 551 for
firms in the top quartile versus only 093 035 and 012 for firms in the second third and
bottom quartile respectively Second as expected firms with higher implied option expense have
greater use of option-based pay For example in the Pre-period option pay represents 507 of
total executive pay at firms in the top quartile versus 201 in the bottom quartile Third and
more importantly for our research design the use of option pay changes significantly from the Pre
to the Post period as a function of the accounting impact For firms in the top quartile the
percentage of total pay represented by stock options drops by 182 (from 507 to 325)
versus 113 80 and 34 for firms in the second third and bottom quartile respectively The
decline in option usage across quartiles is accompanied by an increase in restricted stock grants
while the weight of salary and bonus shows little change It is important to emphasize the
substitution of stock options with restricted stocks because restricted stocks typically pay
dividends (Zhang 2013) thus providing further reason to expect a dividend increase in response to
the FAS123R-induced decline in option pay
As for the payout variables Panel D suggests that heavy option users (firms with higher
implied option expense) generally use repurchases more than dividends consistent with the
associations documented in earlier studies In the Pre period repurchases (dividends) represent
351 (030) of total assets for the top quartile versus 113 (112) for the bottom quartile
Panel D also indicates that the increase in repurchases documented in Panel C takes place across
all quartiles As for the (much smaller) change in dividends the absolute increase is similar across
the four quartiles though the relative increase (the percentage change) appears to be slightly
higher in the top quartile Overall these figures do not suggest a shift toward dividends and away
from repurchases by firms with a large (accounting-induced) decline in the use of option pay
20
Panel E presents the same data as Panel D but based on the definition of lsquotreatmentrsquo and
lsquocontrolrsquo in Bakke et al (2015) Under this definition 997 firms are classified as treatment group
and 177 as control (171 firms are classified as lsquocontrolrsquo because they did not grant options to the
CEO in the Pre period and 6 because they were voluntarily expensing options before 2003)
Interestingly lsquotreatedrsquo firms are equally distributed across the quartiles suggesting significant
variation in the degree of treatment As discussed earlier one benefit of our approach is that it
exploits cross-sectional variation among treatment firms in terms of the likely impact of FAS123R
Also 40 of the control firms (71 out of 177) are in the lowest quartile while 35 ((37+25)177)
are in the top two quartiles reflecting the different focus of the two approaches in terms of
identifying firms less affected by FAS123R20
As for payout and compensation variables Panel E shows that the treated group experiences a
larger increase in repurchases than the control group while the (less pronounced) increase in
dividends is similar across treated and control firms Treated firms experience a 126 decrease in
option pay (from 387 to 261) with a corresponding 94 increase in the weight of restricted
stock grants (from 80 to 174) The figures are similar at the CEO level (because the
classification is based on options grants to the CEO it is useful to report pay figures at both the top
5 executives and the CEO level) Interestingly the control group experiences a pronounced
increase in the weight of option grants in total CEO pay from 10 to 127 as almost half of the
control firms issued options to their CEOs in the Post period (for these firms options as percentage
of total CEO pay increased from 0 to 254 untabulated analysis) While this increased use of
stock options suggests (ex post) that these firms were not concerned with the impact of FAS123R
another possibility is that the lack of use of option compensation for CEOs in 2003 and 2004 was
20 In untabulated analysis we find that 55 of the 171 firms issuing no options to the CEO in the Pre period granted
options to the other top executives (and perhaps to other non-executive employees) thus explaining the relatively high
implied option expense for the control group (10 versus 19 for the treatment group ndash see Panel E)
21
temporary rather than the effect of a permanent policy If these firms were planning to issue
options to the CEO in the Post period the assumption that they were unaffected by FAS123R (and
thus their use as control sample) is questionable21
32 Differential Impact of FAS123R on the Use of Option-Based Compensation
An important building block of our approach is the presumed differential impact of FAS123R
on option-based pay as a function of pre-existing implied option expense22 While Table 1 Panel
D preliminarily supports the validity of this assumption we formally examine it by estimating Eq
(1)
As reported in Table 2 Panel A we find a significant negative association between Accounting
Impact and the change in option-based pay around the adoption of FAS123R In column (1)
where we use the quartile rank of implied option expense the -0044 coefficient implies that
around FAS123R option grants over total pay decline by 44 as we move from the highest
quartile to the next Thus the reduction in top quartile firms is 132 larger than in bottom
quartile firms In column 2 we replace the quartile rank with three indicators for the highest
quartiles (with the bottom quartile collapsed in the intercept) so as to be able to compare directly
top and bottom quartile without imposing the same effect across quartiles The negative and
significant coefficient on the top quartile indicator at -0140 suggests that the reduction in option
grants over total pay is 140 larger for top quartile firms relative to bottom quartile firms
Finally in column 3 we use the indicator for treated firms following Bakke et al (2015) The
21 Panel E also shows an increase in the use of restricted stock in CEO pay packages (from 128 to 182 almost
comparable to the increase among treated firms) The concurrent increase in options and restricted stock suggests
these firms would have increased option pay significantly more had it not been for FAS123R indicating further
caution in classifying them as control group of unaffected firms 22 This is akin to the relevance assumption of instrumental variable if we interpret the implied option expense as an
instrument to the change in option-based pay
22
negative and significant coefficient at -0132 suggests that treated firms experience a 132
larger drop in the weight of option pay relative to control firms
In Panel B we re-estimate Eq (1) using a panel regression with firm- and year-fixed effects
(5653 firm-year observations) where the dependent variable is the the ratio of option grants to
total executive pay The results are virtually identical in terms of significance and magnitude of
the coefficients of interest (the interaction terms between respectively Accounting impact and
Treated and an indicator for the Post period)
Overall Table 2 suggests that high implied option expense and the introduction of FAS123R
together strongly encouraged firms to cut back option-based compensation for executives It also
supports the general validity of the approach in Bakke et al (2015) in identifying firms most
affected by FAS123R notwithstanding the concerns outlined earlier
Our test of Eq (1) focuses on executive stock options For our dividend-protection hypothesis
it is important to establish that the level of implied option expense predicts a change in executive
stock options (rather than only a change in the use of non-executive employee stock options) as we
want to capture the effect of a change in executivesrsquo incentives on payout policy At the same
time our dilution channel hypothesis assumes a change in the use of all (executive and non-
executive employee) stock options Thus in untabulated analyses we repeat the test in Eq (1) by
replacing the dependent variable with the change in the number of options granted to all
employees (scaled by the total number of outstanding shares note for this analysis we can only
use data from 2004 to 2007 because Compustat began reporting data on ESO in 2004) The
coefficient on Accounting Impact and Treated continues to be negative and significant suggesting
that the differential reduction in the use of option compensation as a function of accounting impact
23
occurred for both executive and non-executive employee stock options Indeed Brown and Lee
(2011) report a similar decrease in executive and employee stock options around FAS123R
33 Option-Based Pay and Dividend Payouts
In this section we examine the effect of an exogenous (accounting-induced) change in option
compensation on dividend policy by estimating Equation (2)
Table 3 Panel A presents the results using the change in dividends from Pre to Post as
dependent variable We find no significant association between Accounting Impact (column 1 and
2) or Treated (column 3) and the change in dividends around the adoption of FAS123R This is in
stark contrast with the negative effect of option-based pay on dividends predicted in the literature
and documented in various association studies
One concern with this lack of effect is that perhaps our setting is not powerful enough to detect
it One way to examine this possibility is the following The coefficient on Accounting Impact
rank=4 in column 2 is 0001 and the standard error (SE) is 00009 Assuming the estimated
standard error is correct then for a two-tailed t test the coefficient needs to be greater than 00015
(=SE1645) or 015 to reach the 10 percent significant level In other words if moving from
the bottom to the top quartile (which predicts a 14 differential decline in option based pay as per
Table 2 Panel A) resulted in a 015 increase of the dividendasset ratio our test would be able to
detect a causal effect of option-based pay on dividends Given the unconditional mean of the
dividendasset ratio at 093 an increase of 015 from the Pre to the Post period seems
plausible In fact the average increase from the Pre to the Post period is 016 (Table 1 Panel C)
Thus if an effect was there our test should detect it
24
Panel B presents the results using a panel regression (5653 firm-year observations) with firm-
and year-fixed effects and interaction terms between Accounting Impact (or Treated) and an
indicator for the Post period Our inferences are unchanged
These analyses are based on our full sample which includes both dividend-paying and non-
dividend-paying firms Hence they implicity treat as equal two potentially different decisions to
initiate dividends and to increase dividends For example an increase in the dividend-to-asset
ratio from 05 to 06 will be treated the same as an increase from 00 to 01 even though
the latter represents a critical dividend initiation decision23 To address this following Chetty and
Saez (2005) we separately examine how FAS123R impacts the intensity of dividend changes (for
the subset of payers) and the likelihood of dividend initiations (for the subset of non-payers)
331 Option-Based Pay and Dividend Payouts Intensity of Dividend Changes
In the first row of Panel C we repeat the analysis in Panel A for the sub-sample of 572 payers
defined as firms with positive DPS in 2003 andor 2004 Note that we report only the coefficients
of interest for parsimony In the second row we replace the dependent variable with the
percentage change in DPS DPS is the choice variable for managers (Brav et al 2005 Baker and
Wurgler 2016) and thus our preferred measure to capture changes in dividend policy To account
for skewness in this variable (Khale 2002) in the third fourth and fifth rows we use indicator
variables to denote whether the change in DPS surpasses a threshold respectively 20 40 and
60 The proportion of firms that surpass these thresholds are 59 44 and 33 respectively24
23 Initiating dividends is a critical decision for boards given the pre-commitment value that investors attach to this
decision and the strong negative market reaction when firms eliminate or reduce dividends (Brav et al 2005) For
executives trying to maximize the value of their own stock options (dividend-protection argument) the ability to
influence a dividend initiation decision is likely lower than the ability to influence a dividend increase decision 24 Although in the third fourth and fifth rows our dependent variable is a binary variable we use a linear model (OLS)
instead of a probit or logit nonlinear model The reason is that estimating fixed effects in binary response models with
panel data can cause the incidental parameters problem The coefficient estimates can be biased when the panel data
25
Across all of these specifications we find no association between Accounting Impact or Treated
and the intensity of dividend changes Thus it does not appear that an exogenous reduction in
option-based pay caused dividend-paying firms to increase dividends
In Panel D we perform four robustness tests For parsimony we show only the coefficients of
interest and only the cases where the dependent variable is an indicator denoting a greater than
40 increase in DPS The results are similar for the other four ldquointensityrdquo dependent variables
reported in Panel C
In the first row we exclude firms that began to voluntarily expense options in 2003 or 2004
(84 firms of which 68 are dividend payers) FASB added accounting for stock-based
compensation to its agenda in March 2003 and issued an Exposure Draft proposing the expensing
of stock options at fair value in March 2004 In anticipation a number of firms began to
voluntarily expense stock options in 2003 and 2004 (Aboody et al 2004) If these firms reduced
option grants and as a result increased dividends during the Pre period then their inclusion may
reduce the power of our tests and thus our ability to detect the hypothesized relation25
In a similar spirit in the second row we exclude firms in the top decile in terms of reduction in
the ratio of option grants to total pay for the top 5 executives between 2002 (the year prior to the
Pre-period) and 2004 (the end of the Pre-period) This encompasses 113 firms of which 55 are
dividend payers If these firms reduced option grants in anticipation of FAS123R and as a result
increased dividends during the Pre period their inclusion may reduce our ability to detect the
hypothesized relation
has a large number of observations but a short time series Examples of studies making a similar choice are Puri
Rocholl and Steffen (2011) and Chu and Ma (2015) 25 This is unlikely to be a serious concern as previous studies suggest that voluntary expensers made limited use of
stock options (Aboody et al 2004) In fact in our sample 79 of these firms are in the bottom two quartiles of
implied option expense (untabulated) Nonetheless we present this test for robustness
26
In the third row we exclude firms that accelerated the vesting of options before FAS123R
became effective in order to avoid recognizing an expense for the unvested portion of these
options (Choudhary et al 2009 Balsam Reitenga and Yin 2008) This encompasses 196 firms of
which 54 are dividend payers If accelerating vesting was used to reduce the impact of FAS123R
the inclusion of these firms may reduce the power of our tests26
In the fourth row we deal with the concern that if firms target a fixed dividend to net income
ratio (Lintner 1956) and do so without adjusting for changes in accounting standards then by
decreasing net income (via option expense) the accounting change would mechanically cause a
reduction in dividends This would potentially offset and confound the increase predicted under
the dividend-protection and dilution hypotheses This seems unlikely for two reasons First firms
are notoriously reluctant to cut dividends (Brav et al 2005) Hence it seems unlikely that they
would reduce dividends in response to a decline in net income with no economic or cash flow
implications (ie re-classification of an expense from the footnotes to the income statement)
Second firms today set dividends in terms of dividend per share rather than by targeting a net
income-based payout ratio (Brav et al (2005)) As noted by Skinner (2008) over the last few
decades as earnings have become more variable the relation between earnings and dividends has
become weaker with dividend payments increasing smoothly and largely independent of the
variation in earnings Nevertheless in the fourth row we exclude the 66 dividend-paying firms that
26 These firms explicitly stated that they accelerated the vesting of stock options to avoid the accounting charge
(Choudhary et al 2009) In fact 72 are classified in the top two quartiles of implied option expense (untabulated)
Thus we would have predicted these firms to experience a significant decline in option pay To the extent that this
decline did not materialize because they minimized the impact of FAS123R by accelerating vesting the ability of
Accounting Impact to predict the reduction in option pay and thus its usefulness in examining changes in dividends
around FAS123R may be reduced The list of firms accelerating vesting was kindly provided by Jack Ciesielsky of
The Analystsrsquo Accounting Observer
27
had a similar payout ratio in 2003 and 2004 as a proxy for firms with a target net income-based
payout ratio in the Pre period27
As shown in Panel D even after excluding these subsets of firms we continue to find no
association between Accounting Impact or Treated and changes in dividends for dividend-paying
firms This is inconsistent with a causal influence of option compensation on dividend policy
Another concern is that by reducing net income and thus retained earnings FAS123R
may have pushed some firms closer to violating dividend covenants in debt contracts and
thus prevented them from increasing dividends This would bias our study against finding a
causal effect of option-based pay on dividends However this does not appear to be a
significant concern for three reasons First the recognition of an option expense does not
imply a decline in net income In fact more than 70 (75) of the full sample firms
(dividend payers) experienced an increase in net income before extraordinary items from
2004 to 2005 (the percentages are similar across the four quartiles of implied option
expense) Second dividend covenants are less common among dividend-paying firms
(Nikolaev 2010) Third most loan contracts in recent years give parties the option to
ldquofreezerdquo GAAP when facing a mandatory change in accounting principles (Christensen and
Nikolaev 2009) Firms expecting an adverse impact of FAS123R on their dividend covenants
would likely exercise this option (particularly given the non-cash nature of option-based
expense) Nonetheless to alleviate this concern we perform three additional analyses
(untabulated) (i) we repeat the tests in Panel C after excluding firms with a drop in net
income between 2004 and 2005 (ie firms that perhaps faced some covenant-related
27 We define a ldquosimilarrdquo payout to be an absolute change in payout ratio of less than 1 from 2003 to 2004 Among
these 66 firms only 39 continued to have a similar payout ratio in 2005 We also try an alternative definition where
a firm is classified as likely to be using a net income-based target payout ratio if the absolute percentage change in the
ratio from 2003 to 2004 is less than 10 (100 firms) Our inferences are unchanged
28
constrains to their payout policy as a result of FAS123R) (ii) we explicitly control for net
income and retained earnings in the regression (as in Skinner 2008) (iii) we repeat the tests
in Panel C for dividend payers with dividendsasset ratio above the sample median on the
basis that dividend covenants are less frequent among firms paying large dividends (Jung
Lee and Yang 2016) Our inferences are unchanged
332 Option-Based Pay and Dividend Payouts Dividend Initiations
In this section we examine whether the accounting-driven change in option pay affected
dividend initiations among non-payers We cannot employ the difference-in-difference approach
adopted so far by definition the same firm cannot initiate dividends in both periods However we
can provide suggestive evidence as follows First we take all firms that did not pay dividends in
2002 and group them into quartiles based on 2002 implied option expense For each quartile we
find the number of firms initiating dividends in 2003 and 2004 (the Pre period) Next we take all
firms that did not pay dividends in 2004 group them into quartiles based on 2002 implied option
expense and for each quartile find the number of firms initiating dividends in 2005 and 2006 (the
Post period) We do not include 2007 so as to have the same number of years in both periods and
make the cumulative initiation rates comparable
The left portion of Panel E reports the results of this exercise There is a general decrease in
the dividend initiation rate from the Pre to the Post period This holds both in the full sample of
non-payers (from 129 to 79) and across all quartiles This decrease may reflect a temporary
spike in 2003 and 2004 in response to the 2003 dividend tax cut documented in Chetty and Saez
(2005) It is noteworthy that initiation rates in both periods are lower among firms with higher
implied option expense This is consistent with option-heavy firms being mostly high-growth
firms less inclined to pay dividends More relevant to our research question if the lower use of
29
option compensation increased the propensity to pay dividends we would expect to see a relative
increase (ie a lower decrease) in dividend initiations among firms with the highest accounting
impact Instead the rate does not differ depending on the accounting impact There is
approximatley a 5 decline in initiation rate in each quartile In the right portion of Panel E we
examine similar data for dividend terminations While the results should be interpreted with
caution due to their rarity firms with higher accounting impact do not experience a greater decline
in termination rates Our inferences in Panel E are similar when we compared treated and control
firms following Bakke et al (2015) (untabulated)
Even after taking into account the different nature of decisions for dividend paying and non-
dividend-paying firms we fail to find evidence of a causal influence of option-based compensation
on dividend policy This finding is in contrast to the associations documented in earlier studies It
is even more remarkable as most firms replaced stock options with restricted stock which are
generally dividend-protected and should provide further incentive to increase dividends28
34 Option-Based Pay and Repurchases
In this section we examine the effect of an exogenous (accounting-induced) change in option
compensation on repurchases by estimating Equation (2)
Table 4 Panel A presents the results using the change in repurchases (scaled by total assets)
from Pre to Post as a dependent variable If the use of option-based pay had a positive effect on
firmsrsquo propensity to engage in repurchases as posited by the dividend-protection and dilution
hypotheses we should find a negative association between Accounting Impact or Treated and
repurchases Firms with a higher (accounting-driven) reduction in option-based pay should reduce
28 In a sample of SampP 500 firms between 2000 and 2009 Zhang (2013) reports that 80 of the firms granting
restricted stocks offer dividend protection In that sense the FAS123R-induced shift from stock options to restricted
stock may be characterized as a ldquoshockrdquo to dividend protection in unearned equity pay Accordingly our results cast
doubt on the causal interpretation of the positive association between dividend protection and dividend payouts
documented in prior studies (Zhang 2013 Burns et al 2015 Minnick and Rosenthal 2015)
30
the use of repurchases either because they are shifting toward a greater use of dividends andor
because they have a lower need to offset the dilutive effects of stock options However we find no
significant association between Accounting Impact (columns 1 and 2) and the change in
repurchases around the adoption of FAS123R When we use the Treated indicator (column 3) we
find a significant positive association rather than a negative one In Panel B we repeat the analysis
using net repurchases (ie repurchases after removing the effect of share issuances) following
Fama and French (2001) and Skinner (2008) Our inferences are unchanged29
This test is subject to two important caveats The first is we may not detect a decline in
repurchases because in the Post period firms need to offset the exercise of options that were
granted during the Pre period That is a post-FAS123R reduction in grants may not (yet) translate
into a reduction in exercises during the Post period which reduces our ability to test the dilution
hypothesis (ie that firms repurchase shares to offset exercises)30 However we can examine a
variation of this hypothesis where firms use repurchases to manage the effect of unexercised
options on diluted EPS (Bens et al 2003) To do so in Panel C we use a measure of adjusted
repurchases where we subtract our estimate of repurchases undertaken to offset the exercise of
ESO31 We effectively test whether firms experiencing an accounting-induced decrease in option
grants engage in less repurchases (net of exercise-driven repurchases) because their need to
manage the effect of unexercised options on diluted EPS is lower However the coefficient on
the variables of interest is either insignificant or positive inconsistent with the hypothesis
29 In the case of repurchases we do not examine separately ldquoinitiationsrdquo and ldquointensityrdquo as we do for dividends
because initiation is not clearly defined for repurchases Unlike dividends the occurrence of a repurchase in a given
year (or the lack thereof) cannot be used to infer a general policy due to the more discretionary nature of the timing of
repurchases 30 To capture the effect of lower option-based compensation on option exercises and thus on repurchases we would
ideally extend the Post period beyond 2007 However as noted by Floyd et al (2015) repurchases declined
dramatically after 2007 because of the financial crisis making it difficult to detect the effect of any other factor 31 As upper bound estimate of exercise-driven repurchases we multiply the number of ESO exercised during the year
times the average stock price during the year Since the number of ESO exercised is available in Compustat starting in
2004 Panel C is based on observations from 2004 to 2007
31
A second important caveat is that most firms replaced stock options with restricted stock
(Table 2 Panel C) Unvested restricted stock is excluded from the denominator in the computation
of basic EPS (once vested it is included) However it is included in the denominator of diluted
EPS using the treasury stock method similar to stock options Given the complexity of this
method without access to all details of restricted stock grants and option grants it is difficult to
determine whether the switch from stock options to restricted stock decreased the need for
dilution-driven repurchases as our test implicitly assumes Hence it is possible that we do not find
a decrease in repurchases because a reduced need to offset the dilutive effect of stock options was
neutralized by an increased need to offset the dilutive effect of restricted stock
Subject to the above caveats the evidence in Table 4 is not consistent with a positive causal
relation between the use of option-based pay and repurchases More precisely it suggests that
option-driven dilution concerns do not have a first-order effect on the magnitude of repurchases
even though they may play a role in the repurchase decision Hence our result is not necessarily
in conflict with the evidence in Brav et al (2005) where two-thirds of the surveyed financial
executives state that offsetting the dilutionary effect of stock option plans or other stock
programs is an important factor to their repurchase decisions
35 Option-Based Pay and Payout Composition
As an alternative to examining dividends and repurchases separately we also look at the
payout composition the change in the DividendsTotal Payout ratio from the Pre to the Post period
where Total Payout is the sum of dividends and repurchases As noted earlier we focus on the
subsample of firms with both dividends and repurchases in both Pre and Post periods so as to
capture the change in payout mix by firms routinely using both vehicles to return cash to
shareholders If the use of option-based pay causes firms to substitute repurchases for dividends
32
we should find a positive association between Accounting Impact or Treated and the payout mix
defined as DividendsTotal Payout ratio Firms with a higher accounting-driven reduction in
option-based pay should have an increase (decrease) in the relative weight of dividends
(repurchases) to the total payout However as reported in Table 5 Panel A we fail to find a
significant association between Accounting Impact (column 1 and 2) or Treated (column 3) and
the change in payout mix The results are similar when we use Net Payout (dividends plus net
repurchases) instead of Total Payout in computing the payout mix (Panel B)
Overall the combined evidence in Tables 3-5 does not support the hypothesis that option-
based compensation has negative (positive) effect on dividends (repurchases) or that it causes
firms to replace dividends with repurchases
4 Conclusion
Prior literature has documented robust associations between option-based compensation and
payout policy yet it remains unclear whether this association reflcts a causal influence We
investigate the causal effect of option-based compensation on payout policy using the adoption of
FAS123R which resulted in a significant decrease in option grants making it a plausible
exogenous shock to the use of option-based pay To overcome the challenge of no control group
we exploit the fact that firms responded differently depending on the firm-specific accounting
impact as measured by the implied option expense disclosed in the footnotes prior to FAS123R
Firms with larger expected accounting impact curtailed option-based compensation much more
aggressively than firms with lower impact Using a sample of SampP 1500 firms we find no
evidence that firms with a larger accounting-induced decline in option compensation increased
dividends reduced repurchases or changed their payout composition contrary to the widely held
belief that option-based pay has a causal influence on payout policy
33
Appendix Variable Definitions and Data Sources
Accounting Impact Variables
Accounting impact Implied option expense (Compustat XINTOPT) divided by total assets
(Compustat AT) This variable is measured at fiscal year 2002 and is time-invariant
Accounting impact rank The quartile rank of Accounting impact (1=lowest 4=highest)
Payout Variables
Regular dividendTotal assets The numerator is total regular cash dividends in the fiscal year
from the distribution dataset in CRSP Regular cash dividends are identified by the distribution
codes 1212 1222 1232 or 1242 The denominator is one-year lagged total assets (Compustat
AT)
DPS Dividend per share (Compustat DVPSX_F)
DPS pct change The percentage change of average DPS from Pre- to Post-FAS123R period
DPS pct change gtX indicator A dummy variable that equals one if DPC pct change is greater
than X and zero otherwise
RepurchaseTotal assets The numerator is the repurchase of common equity which equals total
repurchase (Compustat PRSTK) minus the change in preferred stock redemption value
(Compustat PSTKRV) The denominator is one-year lagged total assets (Compustat AT)
Net repurchaseTotal assets Net repurchase removes the effect of share issuances The
construction follows Fama and French (2001) and Skinner (2008) if the firm uses the treasury
stock method for repurchase net repurchase equals the increase in common treasury stock
(Compustat TSTKC) if the firm uses the retirement method (when common treasury stock is zero
in the current and prior year) net repurchase equals total repurchases minus stock issuance
(Compustat SSTK) and change in preferred stock redemption value (Compustat PSTKRV)
When the above measures give negative value net repurchase is set to zero
Adjusted repurchaseTotal assets Adjusted repurchase removes from total repurchase the potential
effect of repurchasing exercised options This variable equals total repurchase of common stocks
minus the product between the number of options exercised (Compustat OPTEXD) and average
stock price during the year When the above measure gives negative value adjusted repurchase is
set to zero Since the number of options exercised is not available before 2003 we drop
observations in 2003 when we use this variable
34
Total payoutTotal assets the sum of Regular dividendTotal assets and RepurchaseTotal assets
Regular dividendTotal payout regular cash dividend divided by the sum of regular cash dividend
and repurchase from common equity In the two-period analysis (Pre- vs Post-FAS123R) we
separately sum the numerator and the denominator for each firm-period and then calculate the ratio
Regular dividendNet payout regular dividend divided by the sum of regular dividend and net
repurchase In the two-period analysis (Pre- vs Post-FAS123R) we separately sum the numerator
and the denominator for each firm-period and then calculate the ratio
Compensation Variables
Salary_$ Average salary (Execucomp SALARY) of the top 5 highest paid executives in $1000
Salary_ Average salary (Execucomp SALARY) divided by average total pay (Execucomp
TDC1) of the top 5 highest paid executives
Bonus_$ Average bonus (Execucomp BONUS) of the top 5 highest paid executives in $1000
Due to a data format change we add non-equity plan-based awards (Execucomp
NON_EQ_TARG) to this measure after 2006
Bonus_ Bonus_$ divided by average total pay (Execucomp TDC1) of the top 5 highest paid
executives
Option grant_$ Average option grant value (Execucomp OPTION_AWARDS_BLK_VALUE or
OPTION_AWARDS_FV) of the top 5 highest paid executives in $1000 Due to a data format
change we use OPTION_AWARDS_FV for this measure after 2006
Option grant_ Option grant_$ divided by average total pay (Execucomp TDC1) of the top 5
highest paid executives
Restricted stock grant_$ Average restricted stock grant value (Execucomp RSTKGRNT or
STOCK_AWARDS_FV) of the top 5 highest paid executives in $1000 Due to data format
change we use STOCK_AWARDS_FV for this measure after 2006
Restricted stock grant_ Restricted stock grant_$ divided by average total pay (Execucomp
TDC1) of the top 5 highest paid executives
Total pay_$ Average total pay (Execucomp TDC1) of the top 5 highest paid executives in $1000
35
Other Characteristics
Size The book value of total assets (Compustat AT) minus the book value of common equity
(Compustat CEQ) plus the market value of common equity from CRSP in $M
Log(size) the natural logarithm of size
Book-to-market the book value of common equity dividend by its market value
Leverage long term debt plus short term debt (Compustat DLTT + DLC) divided by total assets
Asset tangibility tangible assets (Compustat AT - INTAN) divided by total assets
Free cash flow Operating cash flow (Compustat OANCF) minus capital expenditure (Compustat
CAPX) then divided by lagged total assets
Cash holding Cash and short-term investments (Compustat CHE) divided by total assets
ROA volatility the standard deviation of returns on assets (operating income before tax divided by
lagged total assets) in the past five fiscal years
Institutional ownership the number of shares held by institutional investors divided by the number
of shares outstanding from Thomson Reuters Institutional Holdings database
Sales growth the growth rate of sales (Compustat SALE) from the prior year
Past stock return annual stock return from the prior year
Loss indicator a dummy variable taking value of one if the current net income is negative and
zero otherwise
36
References
Aboody David 1996 Market Valuation of Employee Stock Options Journal of Accounting and
Economics 22 357-391
Aboody David Barth Mary E and Ron Kasznik 2004 Firms Voluntary Recognition of Stock-
Based Compensation Expense Journal of Accounting Research 42 123ndash150
Aboody David and Ron Kasznik 2008 Executive stock-based compensation and firmsrsquo cash
payout the role of shareholdersrsquo tax-related payout preferences Review of Accounting Studies
13 216ndash251
Anantharaman Divya and Yong Gyu Lee 2014 Managerial risk taking incentives and corporate
pension policy Journal of Financial Economics 111 328ndash351
Baker Malcolm and Jeffrey Wurgler 2004 A catering theory of dividends Journal of Finance
59 1125-1165
Baker Malcolm and Jeffrey Wurgler 2016 Dividends as reference points a behavioral signaling
approach Review of Financial Studies 29 697-738
Bakke Tor-Erik Hamed Mahmudi Chitru Fernando and Jesus Salas 2015 The causal effect of
option pay on corporate risk management Journal of Financial Economics forthcoming
Balsam Steven Austin Reitenga and Jennifer Yin 2008 Option acceleration in response to SFAS
No 123 (R) Accounting Horizons 22 23-45
Bens Daniel and Steven Monahan 2008 Altering Investment Decisions to Manage Financial
Reporting Outcomes Asset-Backed Commercial Paper Conduits and FIN 46 Journal of
Accounting Research 46 1017-1055
Bens Daniel A Venky Nagar Douglas J Skinner and MH Franco Wong 2003 Employee stock
options eps dilution and stock repurchases Journal of Accounting and Economics 36 51ndash90
Bertrand Marianne Esther Duflo and Sendhil Mullainathan 2004 How much should we trust
differences-in-differences estimates The Quarterly Journal of Economics 119 249ndash275
Blouin Jennifer L Jana S Raedy and Douglas A Shackelford 2011 Dividends Share
Repurchases and Tax Clienteles Evidence from the 2003 Reductions in Shareholder Taxes
The Accounting Review 86 887-914
Brav Alon John R Graham Campbell R Harvey and Roni Michaely 2005 Payout policy in the
21st century Journal of Financial Economics 77 483ndash527
Brown Lawrence D and Yen-Jung Lee 2011 Changes in Option-Based Compensation Around
the Issuance of SFAS123R Journal of Business Finance amp Accounting 38 1053ndash109
37
Brown Jeffrey R Nellie Liang and Scott Weisbenner 2007 Executive financial incentives and
payout policy Firm responses to the 2003 dividend tax cut Journal of Finance 62 1935ndash
1965
Burns Natasha Brian McTier and Kristina Minnick 2015 Equity-incentive compensation and
payout policy in Europe Journal of Corporate Finance 30 85-97
Carter Mary Ellen and Luann J Lynch 2003 The Consequences of the FASBrsquos 1998 Proposal on
Accounting for Stock Option Repricing Journal of Accounting and Economics 35 51-72
Carter Mary Ellen Luann J Lynch and Irem Tuna 2007 The role of accounting in the design of
CEO equity compensation The Accounting Review 82 327ndash357
Chava Sudheer and Amiyatosh Purnanandam 2010 CEOs versus CFOs Incentives and
corporate policies Journal of Financial Economics 97 263ndash278
Chetty Raj and Emmanuel Saez 2005 Dividend taxes and corporate behavior Evidence from the
2003 dividend tax cut The Quarterly Journal of Economics 120 791ndash833
Choudhary Preeti Shivaram Rajgopal and Mohan Venkatachalam 2009 Accelerated vesting of
employee stock options in anticipation of FAS123R Journal of Accounting Research 47 105ndash
146
Christensen Hans B and Valeri Nikolaev 2009 Contracting on Mandatory Changes to GAAP
New Practice and Its Determinants Working Paper University of Chicago
Chu Yongqiang and Tao Ma 2015 How does management compensation affect bank risk taking
evidence from FAS 123R University of South Carolina Working Paper
Cuny Charles J Gerald S Martin and John J Puthenpurackal 2009 Stock options and total
payout Journal of Financial and Quantitative Analysis 44 391ndash410
DeAngelo Harry Linda DeAngelo and Douglas J Skinner 2000 Special Dividends and the
Evolution of Dividend Signaling Journal of Financial Economics 57 309-354
Dechow Patricia M Amy P Hutton and Richard G Sloan 1996 Economic consequences of
accounting for stock-based compensation Journal of Accounting Research 34 1ndash20
Edgerton J 2013 Four facts about dividend payouts and the 2003 tax cut International Tax and
Public Finance 20 769-784
Edmans Alex and Xavier Gabaix 2015 Executive compensation a modern primer Journal of
Economic Literature forthcoming
38
Fama Eugene F and Kenneth R French 2001 Disappearing dividends changing firm
characteristics or lower propensity to pay Journal of Financial Economics 60 3ndash43
Farre-Mensa Joan Roni Michaely and Martin C Schmalz 2014 Payout policy Annual Review
of Financial Economics 6 75ndash134
Fenn George W and Nellie Liang 2001 Corporate payout policy and managerial stock
incentives Journal of Financial Economics 60 45ndash72
Ferri Fabrizio and Tatiana Sandino 2009 The impact of shareholder activism on financial
reporting and compensation the case of employee stock options expensing The Accounting
Review 84 433ndash466
Floyd Eric Nan Li and Douglas J Skinner 2015 Payout policy through the financial crisis the
growth of repurchases and the resilience of dividends Journal of Financial Economics 118
299-316
Frydman Carola and Dirk Jenter 2010 CEO compensation Annual Review of Financial
Economics 2 75-102
Gipper Brandon 2015 Assessing the Effects of Disclosing Management Compensation Working
Paper University of Chicago
Gormley Todd David Matsa and Todd Milbourn 2013 CEO compensation and corporate risk
evidence from a natural experiment Journal of Accounting and Economics 56 79-101
Graham John Michelle Hanlon and Terry Shevlin 2011 Real effects of accounting rules
evidence from multinational firmsrsquo investment locations and profit repatriation decisions
Journal of Accounting Research 49 137-185
Graham John Campbell Harvey and Shiva Rajgopal 2005 The Economic implications of
corporate financial reporting Journal of Accounting and Economics 40 3-73
Greenspan Alan 2002 Testimony of Alan Greenspan before the Committee on Banking
Housing and Urban Affairs US Senate July 16 Washington DC Government Printing
Office
Grullon Gustavo and Roni Michaely 2002 Dividends Share Repurchases and the Substitution
Hypothesis Journal of Finance 57 1649-1684
Hail Luzi Ahmed Tahoun and Clare Wang 2014 Dividend Payouts and Information Shocks
Journal of Accounting Research 52 403-456
Hall Brian J and Kevin J Murphy 2002 Stock options for undiversified executives Journal of
Accounting amp Economics 33 3-42
39
Hall Brian J and Kevin J Murphy 2003 The trouble with stock options Journal of Economic
Perspectives 17 49ndash70
Hanlon Michelle and Jeffrey L Hoopes 2014 What do firms do when dividend tax rates change
An examination of alternative payout responses Journal of Financial Economics 114 105-
124
Hayes Rachel M Michael Lemmon and Mingming Qiu 2012 Stock options and managerial
incentives for risk taking Evidence from FAS123R Journal of Financial Economics 105
174ndash190
Heron Randall A Erik Lie 2007 Does backdating explain the stock price pattern around
executive stock option grants Journal of Financial Economics 83 271-295
Hribar Paul Nicole Thorne Jenkins and W Bruce Johnson 2006 Stock repurchases as an
earnings management device Journal of Accounting and Economics 41 3ndash27
Jensen Michael C 1986 Agency cost of free cash flow corporate finance and takeovers
American Economic Review 76 323-329
Jolls Christine 1998 Stock repurchases and incentive compensation NBER Working Paper No
w6467
Jung Boochun Woo-Jong Lee and Yanhua Sunny Yang 2016 The Impact of Dividend
Covenants on Investment and Operating Performance Journal of Business Finance amp
Accounting 43 414ndash447
Kahle Kathleen M 2002 When a buyback isnrsquot a buyback open market repurchases and
employee options Journal of Financial Economics 63 235ndash261
Lambert Richard A William N Lanen and David F Larcker 1989 Executive stock option plans
and corporate dividend policy Journal of Financial and Quantitative Analysis 24 409ndash425
Lintner John 1956 Distribution of incomes of corporations among dividends retained earnings
and taxes The American Economic Review 46 97-113
Low Angie 2009 Managerial risk-taking behavior and equity-based compensation Journal of
Financial Economics 92 470-490
Miller Merton H and Franco Modigliani 1961 Dividend policy growth and the valuation of
shares The Journal of Business 34 411ndash433
Minnick Kristina and Leonard Rosenthal 2015 Stealth compensation Do CEOs increase their
pay by influencing dividend policy Journal of Corporate Finance 25 435-454
40
Murphy Kevin J 1999 Executive compensation In O Ashenfelter and D Card (eds) North
Holland Handbook of Labor Economics Amsterdam Elsevier Science BV
Murphy Kevin J 2013 Executive compensation Where we are and how we got there Handbook
of the Economics of Finance Elsevier Science North Holland 211-356
Nikolaev Valeri 2010 Debt Covenants and Accounting Conservatism Journal of Accounting
Research 48 143-176
Puri Manju Joumlrg Rocholl and Sascha Steffen 2011 Global retail lending in the aftermath of the
US financial crisis Distinguishing between supply and demand effects Journal of Financial
Economics 100 556-578
Shue Kelly and Richard R Townsend 2014 Swinging for the fences Executive reactions to
quasi-random option grants Working Paper University of Chicago
Skinner Douglas J 2008 The evolving relation between earnings dividends and stock
repurchases Journal of Financial Economics 87 582-609
Weisbenner Scott J 2000 Corporate share repurchases in the 1990s What role do stock options
play FEDS Working Paper No 2000-29
Zhang Dan 2013 CEO dividend protection Working Paper BI Norwegian Business School
41
Figure 1 Trends of dividends and repurchases from 2003 to 2007 Panel A plots the average
Regular DividendTotal Assets of firms in the highest and lowest quartiles of Accounting Impact
measured in 2002 Panel B shows the average Total RepurchaseTotal Assets of firms in the
highest and lowest quartiles of Accounting Impact measured in 2002
Panel A Trends of regular dividends
Panel B Trends of total repurchases
00
05
10
15
20
2003 2004 2005 2006 2007
Regular DividendTotal Assets
Lowest Acc Impact
Highest Acc Impact
Pre Post
00
20
40
60
80
100
2003 2004 2005 2006 2007
Total Repurchase Total Assets
Lowest Acc Impact
Highest Acc Impact
Pre Post
42
Table 1
Summary Statistics
Panel A Firm characteristics - full sample
N Mean Std dev 25 pctl Median 75 pctl
Accounting impact (2002) 1176 173 366 022 052 163
Payout variablesRegular dividendTotal assets 5653 093 148 000 000 142
RepurchaseTotal assets 5653 394 710 000 035 500
Total payoutTotal assets 5653 488 748 000 175 666
Regular dividendTotal payout 4091 3874 4057 000 2237 8833
Level of executive compensation (in $1000)
Salary_$ 5653 450 190 314 409 544
Bonus_$ 5653 476 616 122 295 586
Option grant_$ 5653 791 1137 62 384 1002
Restricted stock grant_$ 5653 458 866 0 58 518
Total pay_$ 5653 2481 2475 890 1647 3074
Percentage of executive compensation
Salary_ 5653 296 183 165 251 382
Bonus_ 5653 197 148 97 177 268
Option grant_ 5653 283 235 67 256 445
Restricted stock grant_ 5653 141 180 00 41 249
Control variables
Size ($M) 5653 11086 27294 1017 2459 8117
Log(size) 5653 7985 1565 6925 7808 9002
Book-to-market 5653 0445 0287 0251 0388 0578
Leverage 5653 0202 0172 0038 0187 0309
Asset tangibility 5653 0806 0184 0691 0853 0965
Free cash flow 5653 0059 0091 0013 0059 0108
Cash holding 5653 0166 0172 0034 0100 0247
ROA volatility 5653 0056 0056 0021 0038 0070
Institutional ownership 5653 0753 0202 0639 0795 0910
Sales growth 5653 0121 0189 0028 0096 0183
Past stock return 5653 0094 0183 -0012 0094 0199
Loss indicator 5653 0164 0370 0000 0000 0000
This table presents summary statistics Panel A shows the descriptive statistics of payout variables compensation
variables and other firm characteristics for the full sample Accounting impact is the implied option expense
measured at fiscal year 2002 All other variables are measured at firm-year level from fiscal year 2003 to 2007
resulting in 5653 firm-year observations (except for Regular dividendTotal Payout which can be measured only
for the 4901 firm-year observations with Total payout greater than zero) Panel B shows the pairwise correlations
between main variables at firm-year level Panel C compares payout variables compensation variables and other
firm characteristics before and after FAS123R The Pre-FAS123R period consists of fiscal year 2003 and 2004
the Post-FAS123R period covers fiscal year 2005-2007 Panel D compares the trends of payout and compensation
variables around FAS123R across four quartile groups ranked by 2002 accounting impact Panel E compares the
trends of payout and compensation variables around FAS123R between the treated and control group under the
alternative treatment definition in Bakke et al (2015) (see Section 22) All variables are defined in Appendix The
notation and in Panel C indicates statistically significant at 10 5 and 1 level in T-tests for equal
means respectively
43
Pa
nel
B
Pea
rso
n c
orr
ela
tio
ns
Reg div
Repurchase
Total payout
Salary_
Bonus_
Option_
RS_
Log(size)
BM
Leverage
Tangibility
FCF
Cash holdingROA vol
Inst own
Sales growth
Past ret
urn
Loss
Reg
div
10
0
Repurc
hase
01
610
0
Tota
l payout
03
509
810
0
Sala
ry_
-0
10
-01
8-0
19
10
0
Bonus_
00
700
100
3-0
01
10
0
Option_
-0
10
00
900
6-0
41
-03
510
0
RS
_
01
000
901
0-0
32
-01
1-0
40
10
0
Log(s
ize)
03
101
802
3-0
56
01
101
202
210
0
BM
-02
1-0
28
-03
103
0-0
03
-02
000
0-0
33
10
0
Levera
ge
-00
1-0
08
-00
8-0
05
00
6-0
11
00
801
9-0
03
10
0
Tangib
ility
00
200
100
101
200
1-0
05
-00
6-0
12
-00
4-0
18
10
0
FC
F02
203
703
9-0
20
00
901
1-0
01
02
4-0
32
-02
1-0
16
10
0
Cash
hold
ing
-01
301
000
700
2-0
14
02
2-0
10
-02
3-0
16
-03
502
901
210
0
RO
A v
ol
-01
5-0
04
-00
700
4-0
11
01
9-0
11
-02
3-0
08
-01
101
2-0
02
03
910
0
Inst
ow
n
-00
901
401
1-0
17
00
200
701
200
7-0
01
00
3-0
08
01
4-0
06
-01
110
0
Sale
s gro
wth
-00
8-0
04
-00
6-0
15
00
501
0-0
02
00
7-0
16
-00
3-0
08
01
300
201
400
410
0
Past
retu
rn00
901
301
4-0
18
01
5-0
01
00
301
6-0
29
-01
000
102
7-0
14
-01
001
602
710
0
Loss
-02
0-0
19
-02
201
8-0
18
00
4-0
05
-02
601
901
300
6-0
41
01
702
3-0
16
-01
8-0
40
10
0
44
Panel C Firm characteristics - before and after FAS123R
Pre FAS 123R Post FAS 123R Difference
Payout variables
Regular dividendTotal assets 083 099 016
RepurchaseTotal assets 245 490 245
Total payoutTotal assets 328 589 261
Regular dividendTotal payout 3914 2790 -1124
Level of executive compensation (in $1000)
Salary_$ 426 463 37
Bonus_$ 418 505 87
Option grant_$ 896 707 -191
Restricted stock grant_$ 269 574 305
Total pay_$ 2263 2584 321
Percentage of executive compensation
Salary_ 305 293 -12
Bonus_ 186 204 18
Option grant_ 343 240 -103
Restricted stock grant_ 87 176 89
Control variables
Size ($M) 9671 11631 1960
Log(size) 7860 8035 0175
Book-to-market 0437 0453 0016
Leverage 0201 0203 0002
Asset tangibility 0822 0793 -0029
Free cash flow 0061 0057 -0004
Cash holding 0175 0159 -0016
ROA volatility 0067 0048 -0019
Institutional ownership 0712 0781 0069
Sales growth 0137 0108 -0029
Past stock return 0080 0101 0021
Loss indicator 0173 0159 -0014
45
Pa
nel
D
Fir
m c
ha
racte
rist
ics
by q
ua
rtil
e o
f a
cco
un
tin
g i
mp
act
- b
efo
re a
nd
aft
er
FA
S1
23
R
Accounting im
pact
(2002)
Num
ber
of
Fir
ms
Pre
Post
Pre
Post
Pre
Post
Pre
Post
Payout
vari
able
s
Regula
r div
idendT
ota
l ass
ets
11
2
12
4
09
4
11
1
09
5
11
3
03
0
04
9
Repurc
hase
Tota
l ass
ets
11
3
26
8
19
2
37
3
32
7
63
1
35
1
68
7
Tota
l payout
Tota
l ass
ets
22
4
39
1
28
5
48
4
42
2
74
4
38
1
73
6
Regula
r div
idendT
ota
l payout
643
7
469
8
474
0
341
1
284
5
195
4
82
5
74
5
Perc
enta
ge o
f executive c
om
pensa
tion
Sala
ry_
337
295
313
287
296
289
276
300
Bonus_
223
226
214
228
172
192
134
169
Option g
rant_
201
167
290
210
373
260
507
325
Rest
ricte
d s
tock g
rant_
116
194
98
180
89
176
43
155
294
294
294
294
1st Q
uart
ile2
nd Q
uart
ile3
rd Q
uart
ile4
th Q
uart
ile
01
2
03
5
09
3
55
1
46
Accounting impact
Number of Firms
By accounting impact quartile
1
2
3
4
Pre Post Pre Post
Payout variables
Regular dividendTotal assets 09 11 08 10
RepurchaseTotal assets 18 31 26 52
Total payoutTotal assets 28 43 34 62
Regular dividendTotal payout 428 357 386 265
Percentage of executive compensation
Salary_ 435 364 282 280
Bonus_ 226 214 179 202
Option grant_ 92 125 387 261
Restricted stock grant_ 125 188 80 174
Percentage of CEO compensation
Salary_(CEO) 485 364 260 259
Bonus_(CEO) 249 228 185 219
Option grant_(CEO) 10 127 406 275
Restricted stock grant_(CEO) 128 182 82 183
Panel E Firm characteristics by alternative treatment definition - before and
after FAS123R
Treated
25
19
997
223
250
256
268
10
177
71
Control
44
37
47
Table 2
Differential effect of FAS123R on the use of option-based compensation
Panel A Two-period first-difference regression
Prediction Coeff t-stat Coeff t-stat Coeff t-stat
Accounting impact rank - -0044 -628
Accounting impact rank=2 - -0044 -327
Accounting impact rank=3 - -0075 -468
Accounting impact rank=4 - -0140 -613
Treated - -0132 -875
ΔLog(size) 0061 202 0061 200 0063 214
ΔBook-to-market 0032 091 0032 092 0051 143
ΔLeverage -0157 -213 -0160 -218 -0111 -153
ΔAsset tangibility -0012 -014 -0020 -023 -0023 -026
ΔFree cash flow -0106 -095 -0108 -097 -0128 -117
ΔCash holding -0197 -211 -0193 -206 -0180 -194
ΔFive-year ROA volatility -0065 -031 -0056 -026 -0098 -047
ΔInstitutional ownership -0044 -091 -0043 -088 -0044 -092
ΔSales growth -0064 -102 -0065 -104 -0090 -153
ΔPast one-year stock return 0051 078 0052 080 0091 138
ΔLoss frequency 0056 207 0057 207 0047 179
Log(size) -0009 -210 -0009 -207 -0002 -035
Book-to-market -0015 -056 -0013 -049 0018 072
Leverage 0022 046 0023 048 0068 150
Asset tangibility 0033 077 0033 078 0053 128
Free cash flow 0227 202 0220 195 0127 117
Cash holding -0002 -004 0012 019 -0078 -141
Five-year ROA volatility -0451 -240 -0430 -228 -0509 -283
Institutional ownership -0123 -360 -0122 -359 -0100 -292
Sales growth -0041 -056 -0040 -055 -0089 -125
Past one-year stock return -0009 -015 -0006 -010 0078 125
Loss frequency 0055 174 0056 178 0054 173
Fixed effect
Standard error
Adj R-squared
Observations
Model (3)
Dependent variable ΔAvg Option grantTotal pay
Huber-White
0156
This table investigates whether the effect of FAS123R on the use of option-based pay varies with its potential accounting impact Panel A
reports the results of estimating three two-period first-differencing models where for each firm we average its characteristics in Pre- and
Post-FAS123R period The Pre-FAS123R period consists of fiscal year 2003 and 2004 the Post-FAS123R period covers fiscal year 2005-
2007 In all three specifications the dependent variable is the change of average Option grantTotal pay from Pre- to Post-FAS123R period
The main independent variable varies by model in Model (1) the Accounting impact rank is the quartile rank of implied option expensetotal
assets measured in 2002 (1=lowest 4=highest) In Model (2) Accounting impact rank=2 (3 4) is an indicator that takes value of one if the
firmrsquos Accounting impact rank equals 2 (3 4) In Model (3) we use an alternative treatment construction following Bakke et al (2015)
where Treated is an indicator that takes value of zero if the firm granted zero option to its CEO in both 2003 and 2004 or the firm began to
voluntarily expense option-based pay at fair value in 2002 or earlier and one otherwise For each control variable we include both its level in
the Pre-FAS123R period and its change across the two periods Panel B shows the results of estimating fixed effect models with firm-year
observations The dependent variable is the firm-year level Option grantTotal pay The main independent variables are the interactions of
Post-FAS123R indicator (Post) with Accounting Impact rank Accounting impact rank indicators and Treated respectively All models in
Penal A have industry fixed effects and the standard errors are Huber-White heteroscedasticity-consistent standard errors All models in
Penal B have firm fixed effects and year fixed effects and the standard errors are clustered at firm level All variables are defined in
Appendix The notation and indicates statistically significant at 10 5 and 1 level respectively
Model (1) Model (2)
11711171 1171
Industry Industry
Huber-White
0124
Huber-White
0123
Industry
48
Panel B Panel fixed effects regression
Prediction Coeff t-stat Coeff t-stat Coeff t-stat
Acc impact rank x Post - -0044 -807
Acc impact rank 2 x Post - -0046 -333
Acc impact rank 3 x Post - -0077 -526
Acc impact rank 4 x Post - -0137 -776
Treated x Post - -0145 -970
Log(size) 0034 221 0034 217 0036 229
Book-to-market 0018 084 0017 083 0015 070
Leverage -0004 -009 -0006 -013 -0007 -015
Asset tangibility 0007 012 0004 006 0011 018
Free cash flow -0074 -151 -0072 -146 -0078 -158
Cash holding -0048 -086 -0050 -090 -0006 -011
Five-year ROA volatility 0250 231 0239 219 0437 414
Institutional ownership 0043 159 0044 161 0041 150
Sales growth -0033 -168 -0034 -171 -0031 -158
Past one-year stock return 0067 221 0068 224 0063 204
Loss indicator 0023 209 0022 207 0024 222
Fixed effects
Standard error
Adj R-squared
Observations
Dependent variable Option grantTotal pay
5653 5653 5653
Clustered by firm
Firm Year
Clustered by firm
Firm Year
Clustered by firm
0523 0523 0526
Model (1) Model (2) Model (3)
Firm Year
49
Table 3
Effect of option-based compensation on dividend policy
Panel A Two-period first-difference regression
Prediction Coeff t-stat Coeff t-stat Coeff t-stat
Accounting impact rank + 0000 077
Accounting impact rank=2 + 0001 091
Accounting impact rank=3 + 0000 044
Accounting impact rank=4 + 0001 092
Treated + 0000 -026
ΔLog(size) 0000 -030 0000 -030 0000 -026
ΔBook-to-market -0002 -190 -0002 -193 -0002 -195
ΔLeverage -0002 -059 -0002 -057 -0002 -059
ΔAsset tangibility 0016 431 0016 429 0016 430
ΔFree cash flow 0017 373 0017 373 0017 375
ΔCash holding -0011 -288 -0011 -285 -0010 -282
ΔFive-year ROA volatility 0003 034 0002 032 0003 035
ΔInstitutional ownership -0002 -073 -0002 -073 -0002 -070
ΔSales growth -0001 -040 -0001 -037 -0001 -038
ΔPast one-year stock return 0002 077 0002 076 0002 070
ΔLoss frequency 0000 -048 0000 -045 0000 -046
Log(size) 0000 183 0000 182 0000 182
Book-to-market -0002 -227 -0002 -225 -0002 -284
Leverage -0001 -037 -0001 -039 -0001 -048
Asset tangibility 0003 179 0003 180 0003 176
Free cash flow 0017 291 0017 291 0017 300
Cash holding 0002 080 0002 077 0002 098
Five-year ROA volatility 0003 035 0002 033 0003 044
Institutional ownership -0001 -068 -0001 -068 -0001 -058
Sales growth -0004 -177 -0004 -175 -0004 -172
Past one-year stock return 0004 169 0004 167 0004 165
Loss frequency -0001 -111 -0001 -109 -0001 -102
Fixed effect
Standard error
Adj R-squared
Observations
Dependent variable ΔAvg Regular dividendTotal assets
This table investigates the causal effect of option-based pay on dividend policy by examining whether changes in dividend policy around
FAS123R vary with its potential accounting impact Panel A reports the results of estimating three two-period first-differencing models
where for each firm we average its characteristics in Pre- and Post-FAS123R period In all three specifications the dependent variable is
the change of average Regular dividendTotal assets from Pre- to Post-FAS123R period The main independent variable varies by model in
Model (1) the Accounting impact rank is the quartile rank of implied option expensetotal assets measured in 2002 (1=lowest 4=highest) In
Model (2) Accounting impact rank=2 (3 4) is an indicator that takes value of one if the firmrsquos Accounting impact rank equals 2 (3 4) In
Model (3) we use an alternative treatment construction following Bakke et al (2015) where Treated is an indicator that takes value of zero
if the firm granted zero option to its CEO in both 2003 and 2004 or the firm began to voluntarily expense option-based pay at fair value in
2002 or earlier and one otherwise For each control variable we include both its level in the Pre-FAS123R period and its change across the
two periods Panel B shows the results of estimating fixed effect models with firm-year observations The dependent variable is the firm-
year level Regular dividendTotal assets The main independent variables are the interactions of Post-FAS123R indicator (Post) with
Accounting Impact rank Accounting impact rank indicators and Treated respectively Panel C examines the intensity of dividend changes
among firms with nonzero dividend per share in 2003 or 2004 In particular we estimates the same three models as in Panel A(with the
same independent variables) but for five dependent variables the change of average Regular dividendTotal assets from Pre- to Post-
FAS123R period (as in Panel A) the percentage change of DPS (dividend per share) from Pre- to Post-FAS123R period and three
indicators denoting respectively whether the percentage change of DPS was greater than 20 40 and 60 Panel D reports four
robustness tests of the dividend intensity regression In each of them a set of possible confounding observations is removed (see Section 33
for details) Panel E compares the trends of dividend initiation and termination around FAS123R across four quartile groups ranked by
accounting impact All models in Panel A C and D have industry fixed effects and the standard errors are Huber-White heteroscedasticity-
consistent standard errors All models in Penal B have firm fixed effects and year fixed effects and the standard errors are clustered at
firm level All variables are defined in Appendix The notation and indicates statistically significant at 10 5 and 1 level
Industry Industry Industry
Model (1) Model (2) Model (3)
1171 1171 1171
Huber-White Huber-White Huber-White
0105 0104 0105
50
Panel B Panel fixed effects regression
Prediction Coeff t-stat Coeff t-stat Coeff t-stat
Acc impact rank x Post + 0000 122
Acc impact rank 2 x Post + 0001 110
Acc impact rank 3 x Post + 0001 094
Acc impact rank 4 x Post + 0001 129
Treated x Post + 0000 -012
Log(size) 0001 179 0001 179 0001 181
Book-to-market 0000 025 0000 024 0000 031
Leverage 0001 062 0001 064 0001 069
Asset tangibility 0009 360 0009 358 0009 363
Free cash flow 0002 090 0002 093 0002 092
Cash holding -0007 -295 -0007 -298 -0007 -298
Five-year ROA volatility 0001 041 0001 038 0000 -006
Institutional ownership 0000 -027 0000 -026 0000 -027
Sales growth 0000 053 0000 051 0000 044
Past one-year stock return 0001 089 0001 088 0001 078
Loss indicator 0000 -060 0000 -057 0000 -076
Fixed effects
Standard error
Adj R-squared
Observations
Dependent variable Regular dividendTotal assets
Model (1) Model (2) Model (3)
Firm Year Firm Year Firm Year
5653 5653 5653
Clustered by firm Clustered by firm Clustered by firm
0877 0877 0877
51
Panel C Intensity of dividend changes around FAS123R
Prediction Coeff t-stat Coeff t-stat Coeff t-stat
Accounting impact rank + 0000 065
Accounting impact rank=2 + 0000 048
Accounting impact rank=3 + 0000 026
Accounting impact rank=4 + 0002 080
Treated + 0001 063
Dependent var DPS pct change
Accounting impact rank + -0145 -072
Accounting impact rank=2 + 0018 006
Accounting impact rank=3 + -0177 -045
Accounting impact rank=4 + -0746 -100
Treated + -0407 -119
Accounting impact rank + 0029 095
Accounting impact rank=2 + 0040 074
Accounting impact rank=3 + 0092 139
Accounting impact rank=4 + 0008 007
Treated + -0007 -012
Accounting impact rank + 0024 076
Accounting impact rank=2 + 0047 088
Accounting impact rank=3 + 0079 114
Accounting impact rank=4 + -0003 -002
Treated + 0030 052
Accounting impact rank + 0030 098
Accounting impact rank=2 + 0078 155
Accounting impact rank=3 + 0085 130
Accounting impact rank=4 + 0014 012
Treated + -0006 -011
Control variables
Fixed effect
Standard error
Observations 572 572 572
Yes Yes Yes
Huber-White Huber-White Huber-White
Industry Industry Industry
Dependent var DPS pct
change gt60 indicator
Model (1) Model (2) Model (3)
Dependent var ΔAvg Regular
dividendAssets
Dependent var DPS pct
change gt20 indicator
Dependent var DPS pct
change gt40 indicator
52
Panel D Robustness tests for intensity of dividend changes around FAS123R
Prediction Coeff t-stat Coeff t-stat Coeff t-stat
Accounting impact rank + 0006 017
Accounting impact rank=2 + 0067 118
Accounting impact rank=3 + 0041 057
Accounting impact rank=4 + -0061 -049
Treated + 0022 035Observations
Accounting impact rank + 0009 027
Accounting impact rank=2 + 0058 106
Accounting impact rank=3 + 0032 043
Accounting impact rank=4 + -0032 -024
Treated + 0018 028
Observations
Accounting impact rank + 0030 089
Accounting impact rank=2 + 0039 071
Accounting impact rank=3 + 0122 168
Accounting impact rank=4 + -0063 -052
Treated + 0075 132
Observations
Accounting impact rank + 0008 023
Accounting impact rank=2 + 0023 042
Accounting impact rank=3 + 0048 064
Accounting impact rank=4 + -0042 -033
Treated + -0010 -016
Observations
Control variables
Fixed effect
Standard error
Exclude firms with stable
payout ratio from 2003 to 2004
506 506 506
Dependent variable DPS pct change gt40 indicator
Model (1) Model (2) Model (3)
Exclude voluntary expensers
519 519
Exclude firms in the top decile
of option reduction (02-04)
Exclude firms that accelerated
option vesting
504 504 504
517 517 517
519
Huber-White Huber-White Huber-White
Yes Yes Yes
Industry Industry Industry
53
Panel E Dividend initiation and termination rates around FAS123R
Pre FAS 123R
1 280 75 7 6 13 173
2 284 135 18 9 27 200
3 286 181 11 14 25 138
4 282 260 9 10 19 73
Total 1132 651 45 39 84 129
Post FAS 123R
1 275 63 4 4 8 127
2 280 116 9 9 18 155
3 276 152 9 3 12 79
4 263 223 5 1 6 27
Total 1094 554 27 17 44 79
Pre FAS 123R
1 280 205 2 0 2 10
2 284 149 7 1 8 54
3 286 105 0 0 0 00
4 282 22 0 0 0 00
Total 1132 481 9 1 10 21
Post FAS 123R
1 275 212 3 6 9 42
2 280 164 1 2 3 18
3 276 124 1 1 2 16
4 263 40 0 3 3 75
Total 1094 540 5 12 17 31
termination
in 2004
03-04
cumulative
03-04
cumulative
Quartile firms
with
dividend in
2004
termination
in 2005
termination
in 2006
05-06
cumulative
05-06
cumulative
Termination
Quartile firms
with
dividend in
2002
termination
in 2003
without
dividend in
2004
initiation in
2003
initiation in
2004
03-04
cumulative
03-04
cumulative firmsQuartile
firmsQuartile initiation in
2005
initiation in
2006
05-06
cumulative
05-06
cumulative
Initiation
without
dividend in
2002
54
Table 4
Effect of option-based compensation on repurchases
Panel A Two-period first-difference regression with total repurchase
Prediction Coeff t-stat Coeff t-stat Coeff t-stat
Accounting impact rank - 0002 122
Accounting impact rank=2 - 0002 071
Accounting impact rank=3 - 0005 123
Accounting impact rank=4 - 0007 102
Treated - 0014 365
Control variables
Fixed effect
Standard error
Adj R-squared
Observations
Panel B Two-period first-difference regression with net repurchase
Prediction Coeff t-stat Coeff t-stat Coeff t-stat
Accounting impact rank - 0003 166
Accounting impact rank=2 - 0002 051
Accounting impact rank=3 - 0006 165
Accounting impact rank=4 - 0009 137
Treated - 0010 300
Control variables
Fixed effect
Standard error
Adj R-squared
Observations
Panel C Two-period first-difference regression with repurchase adjusted for exercised options
Prediction Coeff t-stat Coeff t-stat Coeff t-stat
Accounting impact rank - 0001 056
Accounting impact rank=2 - 0002 062
Accounting impact rank=3 - 0007 172
Accounting impact rank=4 - -0001 -008
Treated - 0006 197
Control variables
Fixed effect
Standard error
Adj R-squared
Observations
Dependent variable ΔAvg RepurchaseTotal assets
This table investigates the causal effect of option-based pay on payout policy by examining whether the changes of repurchase around
FAS123R vary with its potential accounting impact Panel A reports the results of estimating three two-period first-differencing models
where for each firm we average its characteristics in Pre- and Post-FAS123R period In all three specifications the dependent variable is
the change of average RepurchaseTotal assets from Pre- to Post-FAS123R period The main independent variable varies by model in
Model (1) the Accounting impact rank is the quartile rank of implied option expensetotal assets measured in 2002 (1=lowest 4=highest)
In Model (2) Accounting impact rank=2 (3 4) is an indicator that takes value of one if the firmrsquos Accounting impact rank equals 2 (3 4)
In Model (3) we use an alternative treatment construction following Bakke et al (2015) where Treated is an indicator that takes value of
zero if the firm granted zero option to its CEO in both 2003 and 2004 or the firm began to voluntarily expense option-based pay at fair
value in 2002 or earlier and one otherwise Panel B reports the regressions with the change of Net repurchaseTotal assets as the
dependent variable and the same independent variable as in Panel A Panel C reports the regressions with the change of Adjusted
repurchaseTotal assets as the dependent variable and the same independent variable as in Panel A All models in Panel A B and C have
industry fixed effects and the standard errors are Huber-White heteroscedasticity-consistent standard errors All variables are defined in
Appendix The notation and indicates statistically significant at 10 5 and 1 level respectively
Model (1) Model (2) Model (3)
Yes Yes Yes
Industry Industry Industry
Huber-White Huber-White Huber-White
Dependent variable ΔAvg Net repurchaseTotal assets
1171 1171 1171
0238 0237 0245
Model (1) Model (2) Model (3)
Yes Yes Yes
Industry Industry Industry
Huber-White Huber-White Huber-White
Dependent variable ΔAvg Adjusted repurchaseTotal assets
0229 0229 0233
1171 1171 1171
Model (1) Model (2) Model (3)
Yes Yes Yes
Industry Industry Industry
Huber-White Huber-White Huber-White
0111 0112 0114
1168 1168 1168
55
Table 5
Effect of option-based compensation on payout mix
Panel A Two-period first-difference regression with total payout mix
Prediction Coeff t-stat Coeff t-stat Coeff t-stat
Accounting impact rank + 0006 028
Accounting impact rank=2 + 0018 045
Accounting impact rank=3 + -0001 -001
Accounting impact rank=4 + 0043 052
Treated + -0035 -094
Control variables
Fixed effect
Standard error
Adj R-squared
Observations
Panel B Two-period first-difference regression with net payout mix
Prediction Coeff t-stat Coeff t-stat Coeff t-stat
Accounting impact rank + -0002 -008
Accounting impact rank=2 + 0008 016
Accounting impact rank=3 + 0018 034
Accounting impact rank=4 + -0059 -055
Treated + -0050 -101
Control variables
Fixed effect
Standard error
Adj R-squared
Observations
0049 0043 0054
257 257 257
Industry Industry Industry
Huber-White Huber-White Huber-White
Dependent variable ΔAvg Regular dividendNet payout
Model (1) Model (2) Model (3)
Yes Yes Yes
0154 0151 0156
362 362 362
Industry Industry Industry
Huber-White Huber-White Huber-White
This table investigates the causal effect of option-based pay on payout mix for firms using both dividend and repurchase by examining
whether the changes of payout mix around FAS123R vary with its potential accounting impact Panel A reports the results of estimating
three two-period first-differencing models where for each firm we average its characteristics in Pre- and Post-FAS123R period In all three
specifications the dependent variable is the change of average Regular dividendTotal payout from Pre- to Post-FAS123R period The main
independent variable varies by model in Model (1) the Accounting impact rank is the quartile rank of implied option expensetotal assets
measured in 2002 (1=lowest 4=highest) In Model (2) Accounting impact rank=2 (3 4) is an indicator that takes value of one if the firmrsquos
Accounting impact rank equals 2 (3 4) In Model (3) we use an alternative treatment construction following Bakke et al (2015) where
Treated is an indicator that takes value of zero if the firm granted zero option to its CEO in both 2003 and 2004 or the firm began to
voluntarily expense option-based pay at fair value in 2002 or earlier and one otherwise Panel B reports the regressions with the change of
Regular dividendNet payout as the dependent variable and the same independent variables as in Panel A Panel A (Panel B) is based on
observations with nonzero regular dividend and repurchase (net repurchase) in both Pre- and Post-FAS123R period All models in Panel A
and B have industry fixed effects and the standard errors are Huber-White heteroscedasticity-consistent standard errors All variables are
defined in Appendix The notation and indicates statistically significant at 10 5 and 1 level respectively
Yes Yes Yes
Dependent variable ΔAvg Regular dividendTotal payout
Model (1) Model (2) Model (3)

19
confirming the skewness suggested by Panel A the mean implied option expense is 551 for
firms in the top quartile versus only 093 035 and 012 for firms in the second third and
bottom quartile respectively Second as expected firms with higher implied option expense have
greater use of option-based pay For example in the Pre-period option pay represents 507 of
total executive pay at firms in the top quartile versus 201 in the bottom quartile Third and
more importantly for our research design the use of option pay changes significantly from the Pre
to the Post period as a function of the accounting impact For firms in the top quartile the
percentage of total pay represented by stock options drops by 182 (from 507 to 325)
versus 113 80 and 34 for firms in the second third and bottom quartile respectively The
decline in option usage across quartiles is accompanied by an increase in restricted stock grants
while the weight of salary and bonus shows little change It is important to emphasize the
substitution of stock options with restricted stocks because restricted stocks typically pay
dividends (Zhang 2013) thus providing further reason to expect a dividend increase in response to
the FAS123R-induced decline in option pay
As for the payout variables Panel D suggests that heavy option users (firms with higher
implied option expense) generally use repurchases more than dividends consistent with the
associations documented in earlier studies In the Pre period repurchases (dividends) represent
351 (030) of total assets for the top quartile versus 113 (112) for the bottom quartile
Panel D also indicates that the increase in repurchases documented in Panel C takes place across
all quartiles As for the (much smaller) change in dividends the absolute increase is similar across
the four quartiles though the relative increase (the percentage change) appears to be slightly
higher in the top quartile Overall these figures do not suggest a shift toward dividends and away
from repurchases by firms with a large (accounting-induced) decline in the use of option pay
20
Panel E presents the same data as Panel D but based on the definition of lsquotreatmentrsquo and
lsquocontrolrsquo in Bakke et al (2015) Under this definition 997 firms are classified as treatment group
and 177 as control (171 firms are classified as lsquocontrolrsquo because they did not grant options to the
CEO in the Pre period and 6 because they were voluntarily expensing options before 2003)
Interestingly lsquotreatedrsquo firms are equally distributed across the quartiles suggesting significant
variation in the degree of treatment As discussed earlier one benefit of our approach is that it
exploits cross-sectional variation among treatment firms in terms of the likely impact of FAS123R
Also 40 of the control firms (71 out of 177) are in the lowest quartile while 35 ((37+25)177)
are in the top two quartiles reflecting the different focus of the two approaches in terms of
identifying firms less affected by FAS123R20
As for payout and compensation variables Panel E shows that the treated group experiences a
larger increase in repurchases than the control group while the (less pronounced) increase in
dividends is similar across treated and control firms Treated firms experience a 126 decrease in
option pay (from 387 to 261) with a corresponding 94 increase in the weight of restricted
stock grants (from 80 to 174) The figures are similar at the CEO level (because the
classification is based on options grants to the CEO it is useful to report pay figures at both the top
5 executives and the CEO level) Interestingly the control group experiences a pronounced
increase in the weight of option grants in total CEO pay from 10 to 127 as almost half of the
control firms issued options to their CEOs in the Post period (for these firms options as percentage
of total CEO pay increased from 0 to 254 untabulated analysis) While this increased use of
stock options suggests (ex post) that these firms were not concerned with the impact of FAS123R
another possibility is that the lack of use of option compensation for CEOs in 2003 and 2004 was
20 In untabulated analysis we find that 55 of the 171 firms issuing no options to the CEO in the Pre period granted
options to the other top executives (and perhaps to other non-executive employees) thus explaining the relatively high
implied option expense for the control group (10 versus 19 for the treatment group ndash see Panel E)
21
temporary rather than the effect of a permanent policy If these firms were planning to issue
options to the CEO in the Post period the assumption that they were unaffected by FAS123R (and
thus their use as control sample) is questionable21
32 Differential Impact of FAS123R on the Use of Option-Based Compensation
An important building block of our approach is the presumed differential impact of FAS123R
on option-based pay as a function of pre-existing implied option expense22 While Table 1 Panel
D preliminarily supports the validity of this assumption we formally examine it by estimating Eq
(1)
As reported in Table 2 Panel A we find a significant negative association between Accounting
Impact and the change in option-based pay around the adoption of FAS123R In column (1)
where we use the quartile rank of implied option expense the -0044 coefficient implies that
around FAS123R option grants over total pay decline by 44 as we move from the highest
quartile to the next Thus the reduction in top quartile firms is 132 larger than in bottom
quartile firms In column 2 we replace the quartile rank with three indicators for the highest
quartiles (with the bottom quartile collapsed in the intercept) so as to be able to compare directly
top and bottom quartile without imposing the same effect across quartiles The negative and
significant coefficient on the top quartile indicator at -0140 suggests that the reduction in option
grants over total pay is 140 larger for top quartile firms relative to bottom quartile firms
Finally in column 3 we use the indicator for treated firms following Bakke et al (2015) The
21 Panel E also shows an increase in the use of restricted stock in CEO pay packages (from 128 to 182 almost
comparable to the increase among treated firms) The concurrent increase in options and restricted stock suggests
these firms would have increased option pay significantly more had it not been for FAS123R indicating further
caution in classifying them as control group of unaffected firms 22 This is akin to the relevance assumption of instrumental variable if we interpret the implied option expense as an
instrument to the change in option-based pay
22
negative and significant coefficient at -0132 suggests that treated firms experience a 132
larger drop in the weight of option pay relative to control firms
In Panel B we re-estimate Eq (1) using a panel regression with firm- and year-fixed effects
(5653 firm-year observations) where the dependent variable is the the ratio of option grants to
total executive pay The results are virtually identical in terms of significance and magnitude of
the coefficients of interest (the interaction terms between respectively Accounting impact and
Treated and an indicator for the Post period)
Overall Table 2 suggests that high implied option expense and the introduction of FAS123R
together strongly encouraged firms to cut back option-based compensation for executives It also
supports the general validity of the approach in Bakke et al (2015) in identifying firms most
affected by FAS123R notwithstanding the concerns outlined earlier
Our test of Eq (1) focuses on executive stock options For our dividend-protection hypothesis
it is important to establish that the level of implied option expense predicts a change in executive
stock options (rather than only a change in the use of non-executive employee stock options) as we
want to capture the effect of a change in executivesrsquo incentives on payout policy At the same
time our dilution channel hypothesis assumes a change in the use of all (executive and non-
executive employee) stock options Thus in untabulated analyses we repeat the test in Eq (1) by
replacing the dependent variable with the change in the number of options granted to all
employees (scaled by the total number of outstanding shares note for this analysis we can only
use data from 2004 to 2007 because Compustat began reporting data on ESO in 2004) The
coefficient on Accounting Impact and Treated continues to be negative and significant suggesting
that the differential reduction in the use of option compensation as a function of accounting impact
23
occurred for both executive and non-executive employee stock options Indeed Brown and Lee
(2011) report a similar decrease in executive and employee stock options around FAS123R
33 Option-Based Pay and Dividend Payouts
In this section we examine the effect of an exogenous (accounting-induced) change in option
compensation on dividend policy by estimating Equation (2)
Table 3 Panel A presents the results using the change in dividends from Pre to Post as
dependent variable We find no significant association between Accounting Impact (column 1 and
2) or Treated (column 3) and the change in dividends around the adoption of FAS123R This is in
stark contrast with the negative effect of option-based pay on dividends predicted in the literature
and documented in various association studies
One concern with this lack of effect is that perhaps our setting is not powerful enough to detect
it One way to examine this possibility is the following The coefficient on Accounting Impact
rank=4 in column 2 is 0001 and the standard error (SE) is 00009 Assuming the estimated
standard error is correct then for a two-tailed t test the coefficient needs to be greater than 00015
(=SE1645) or 015 to reach the 10 percent significant level In other words if moving from
the bottom to the top quartile (which predicts a 14 differential decline in option based pay as per
Table 2 Panel A) resulted in a 015 increase of the dividendasset ratio our test would be able to
detect a causal effect of option-based pay on dividends Given the unconditional mean of the
dividendasset ratio at 093 an increase of 015 from the Pre to the Post period seems
plausible In fact the average increase from the Pre to the Post period is 016 (Table 1 Panel C)
Thus if an effect was there our test should detect it
24
Panel B presents the results using a panel regression (5653 firm-year observations) with firm-
and year-fixed effects and interaction terms between Accounting Impact (or Treated) and an
indicator for the Post period Our inferences are unchanged
These analyses are based on our full sample which includes both dividend-paying and non-
dividend-paying firms Hence they implicity treat as equal two potentially different decisions to
initiate dividends and to increase dividends For example an increase in the dividend-to-asset
ratio from 05 to 06 will be treated the same as an increase from 00 to 01 even though
the latter represents a critical dividend initiation decision23 To address this following Chetty and
Saez (2005) we separately examine how FAS123R impacts the intensity of dividend changes (for
the subset of payers) and the likelihood of dividend initiations (for the subset of non-payers)
331 Option-Based Pay and Dividend Payouts Intensity of Dividend Changes
In the first row of Panel C we repeat the analysis in Panel A for the sub-sample of 572 payers
defined as firms with positive DPS in 2003 andor 2004 Note that we report only the coefficients
of interest for parsimony In the second row we replace the dependent variable with the
percentage change in DPS DPS is the choice variable for managers (Brav et al 2005 Baker and
Wurgler 2016) and thus our preferred measure to capture changes in dividend policy To account
for skewness in this variable (Khale 2002) in the third fourth and fifth rows we use indicator
variables to denote whether the change in DPS surpasses a threshold respectively 20 40 and
60 The proportion of firms that surpass these thresholds are 59 44 and 33 respectively24
23 Initiating dividends is a critical decision for boards given the pre-commitment value that investors attach to this
decision and the strong negative market reaction when firms eliminate or reduce dividends (Brav et al 2005) For
executives trying to maximize the value of their own stock options (dividend-protection argument) the ability to
influence a dividend initiation decision is likely lower than the ability to influence a dividend increase decision 24 Although in the third fourth and fifth rows our dependent variable is a binary variable we use a linear model (OLS)
instead of a probit or logit nonlinear model The reason is that estimating fixed effects in binary response models with
panel data can cause the incidental parameters problem The coefficient estimates can be biased when the panel data
25
Across all of these specifications we find no association between Accounting Impact or Treated
and the intensity of dividend changes Thus it does not appear that an exogenous reduction in
option-based pay caused dividend-paying firms to increase dividends
In Panel D we perform four robustness tests For parsimony we show only the coefficients of
interest and only the cases where the dependent variable is an indicator denoting a greater than
40 increase in DPS The results are similar for the other four ldquointensityrdquo dependent variables
reported in Panel C
In the first row we exclude firms that began to voluntarily expense options in 2003 or 2004
(84 firms of which 68 are dividend payers) FASB added accounting for stock-based
compensation to its agenda in March 2003 and issued an Exposure Draft proposing the expensing
of stock options at fair value in March 2004 In anticipation a number of firms began to
voluntarily expense stock options in 2003 and 2004 (Aboody et al 2004) If these firms reduced
option grants and as a result increased dividends during the Pre period then their inclusion may
reduce the power of our tests and thus our ability to detect the hypothesized relation25
In a similar spirit in the second row we exclude firms in the top decile in terms of reduction in
the ratio of option grants to total pay for the top 5 executives between 2002 (the year prior to the
Pre-period) and 2004 (the end of the Pre-period) This encompasses 113 firms of which 55 are
dividend payers If these firms reduced option grants in anticipation of FAS123R and as a result
increased dividends during the Pre period their inclusion may reduce our ability to detect the
hypothesized relation
has a large number of observations but a short time series Examples of studies making a similar choice are Puri
Rocholl and Steffen (2011) and Chu and Ma (2015) 25 This is unlikely to be a serious concern as previous studies suggest that voluntary expensers made limited use of
stock options (Aboody et al 2004) In fact in our sample 79 of these firms are in the bottom two quartiles of
implied option expense (untabulated) Nonetheless we present this test for robustness
26
In the third row we exclude firms that accelerated the vesting of options before FAS123R
became effective in order to avoid recognizing an expense for the unvested portion of these
options (Choudhary et al 2009 Balsam Reitenga and Yin 2008) This encompasses 196 firms of
which 54 are dividend payers If accelerating vesting was used to reduce the impact of FAS123R
the inclusion of these firms may reduce the power of our tests26
In the fourth row we deal with the concern that if firms target a fixed dividend to net income
ratio (Lintner 1956) and do so without adjusting for changes in accounting standards then by
decreasing net income (via option expense) the accounting change would mechanically cause a
reduction in dividends This would potentially offset and confound the increase predicted under
the dividend-protection and dilution hypotheses This seems unlikely for two reasons First firms
are notoriously reluctant to cut dividends (Brav et al 2005) Hence it seems unlikely that they
would reduce dividends in response to a decline in net income with no economic or cash flow
implications (ie re-classification of an expense from the footnotes to the income statement)
Second firms today set dividends in terms of dividend per share rather than by targeting a net
income-based payout ratio (Brav et al (2005)) As noted by Skinner (2008) over the last few
decades as earnings have become more variable the relation between earnings and dividends has
become weaker with dividend payments increasing smoothly and largely independent of the
variation in earnings Nevertheless in the fourth row we exclude the 66 dividend-paying firms that
26 These firms explicitly stated that they accelerated the vesting of stock options to avoid the accounting charge
(Choudhary et al 2009) In fact 72 are classified in the top two quartiles of implied option expense (untabulated)
Thus we would have predicted these firms to experience a significant decline in option pay To the extent that this
decline did not materialize because they minimized the impact of FAS123R by accelerating vesting the ability of
Accounting Impact to predict the reduction in option pay and thus its usefulness in examining changes in dividends
around FAS123R may be reduced The list of firms accelerating vesting was kindly provided by Jack Ciesielsky of
The Analystsrsquo Accounting Observer
27
had a similar payout ratio in 2003 and 2004 as a proxy for firms with a target net income-based
payout ratio in the Pre period27
As shown in Panel D even after excluding these subsets of firms we continue to find no
association between Accounting Impact or Treated and changes in dividends for dividend-paying
firms This is inconsistent with a causal influence of option compensation on dividend policy
Another concern is that by reducing net income and thus retained earnings FAS123R
may have pushed some firms closer to violating dividend covenants in debt contracts and
thus prevented them from increasing dividends This would bias our study against finding a
causal effect of option-based pay on dividends However this does not appear to be a
significant concern for three reasons First the recognition of an option expense does not
imply a decline in net income In fact more than 70 (75) of the full sample firms
(dividend payers) experienced an increase in net income before extraordinary items from
2004 to 2005 (the percentages are similar across the four quartiles of implied option
expense) Second dividend covenants are less common among dividend-paying firms
(Nikolaev 2010) Third most loan contracts in recent years give parties the option to
ldquofreezerdquo GAAP when facing a mandatory change in accounting principles (Christensen and
Nikolaev 2009) Firms expecting an adverse impact of FAS123R on their dividend covenants
would likely exercise this option (particularly given the non-cash nature of option-based
expense) Nonetheless to alleviate this concern we perform three additional analyses
(untabulated) (i) we repeat the tests in Panel C after excluding firms with a drop in net
income between 2004 and 2005 (ie firms that perhaps faced some covenant-related
27 We define a ldquosimilarrdquo payout to be an absolute change in payout ratio of less than 1 from 2003 to 2004 Among
these 66 firms only 39 continued to have a similar payout ratio in 2005 We also try an alternative definition where
a firm is classified as likely to be using a net income-based target payout ratio if the absolute percentage change in the
ratio from 2003 to 2004 is less than 10 (100 firms) Our inferences are unchanged
28
constrains to their payout policy as a result of FAS123R) (ii) we explicitly control for net
income and retained earnings in the regression (as in Skinner 2008) (iii) we repeat the tests
in Panel C for dividend payers with dividendsasset ratio above the sample median on the
basis that dividend covenants are less frequent among firms paying large dividends (Jung
Lee and Yang 2016) Our inferences are unchanged
332 Option-Based Pay and Dividend Payouts Dividend Initiations
In this section we examine whether the accounting-driven change in option pay affected
dividend initiations among non-payers We cannot employ the difference-in-difference approach
adopted so far by definition the same firm cannot initiate dividends in both periods However we
can provide suggestive evidence as follows First we take all firms that did not pay dividends in
2002 and group them into quartiles based on 2002 implied option expense For each quartile we
find the number of firms initiating dividends in 2003 and 2004 (the Pre period) Next we take all
firms that did not pay dividends in 2004 group them into quartiles based on 2002 implied option
expense and for each quartile find the number of firms initiating dividends in 2005 and 2006 (the
Post period) We do not include 2007 so as to have the same number of years in both periods and
make the cumulative initiation rates comparable
The left portion of Panel E reports the results of this exercise There is a general decrease in
the dividend initiation rate from the Pre to the Post period This holds both in the full sample of
non-payers (from 129 to 79) and across all quartiles This decrease may reflect a temporary
spike in 2003 and 2004 in response to the 2003 dividend tax cut documented in Chetty and Saez
(2005) It is noteworthy that initiation rates in both periods are lower among firms with higher
implied option expense This is consistent with option-heavy firms being mostly high-growth
firms less inclined to pay dividends More relevant to our research question if the lower use of
29
option compensation increased the propensity to pay dividends we would expect to see a relative
increase (ie a lower decrease) in dividend initiations among firms with the highest accounting
impact Instead the rate does not differ depending on the accounting impact There is
approximatley a 5 decline in initiation rate in each quartile In the right portion of Panel E we
examine similar data for dividend terminations While the results should be interpreted with
caution due to their rarity firms with higher accounting impact do not experience a greater decline
in termination rates Our inferences in Panel E are similar when we compared treated and control
firms following Bakke et al (2015) (untabulated)
Even after taking into account the different nature of decisions for dividend paying and non-
dividend-paying firms we fail to find evidence of a causal influence of option-based compensation
on dividend policy This finding is in contrast to the associations documented in earlier studies It
is even more remarkable as most firms replaced stock options with restricted stock which are
generally dividend-protected and should provide further incentive to increase dividends28
34 Option-Based Pay and Repurchases
In this section we examine the effect of an exogenous (accounting-induced) change in option
compensation on repurchases by estimating Equation (2)
Table 4 Panel A presents the results using the change in repurchases (scaled by total assets)
from Pre to Post as a dependent variable If the use of option-based pay had a positive effect on
firmsrsquo propensity to engage in repurchases as posited by the dividend-protection and dilution
hypotheses we should find a negative association between Accounting Impact or Treated and
repurchases Firms with a higher (accounting-driven) reduction in option-based pay should reduce
28 In a sample of SampP 500 firms between 2000 and 2009 Zhang (2013) reports that 80 of the firms granting
restricted stocks offer dividend protection In that sense the FAS123R-induced shift from stock options to restricted
stock may be characterized as a ldquoshockrdquo to dividend protection in unearned equity pay Accordingly our results cast
doubt on the causal interpretation of the positive association between dividend protection and dividend payouts
documented in prior studies (Zhang 2013 Burns et al 2015 Minnick and Rosenthal 2015)
30
the use of repurchases either because they are shifting toward a greater use of dividends andor
because they have a lower need to offset the dilutive effects of stock options However we find no
significant association between Accounting Impact (columns 1 and 2) and the change in
repurchases around the adoption of FAS123R When we use the Treated indicator (column 3) we
find a significant positive association rather than a negative one In Panel B we repeat the analysis
using net repurchases (ie repurchases after removing the effect of share issuances) following
Fama and French (2001) and Skinner (2008) Our inferences are unchanged29
This test is subject to two important caveats The first is we may not detect a decline in
repurchases because in the Post period firms need to offset the exercise of options that were
granted during the Pre period That is a post-FAS123R reduction in grants may not (yet) translate
into a reduction in exercises during the Post period which reduces our ability to test the dilution
hypothesis (ie that firms repurchase shares to offset exercises)30 However we can examine a
variation of this hypothesis where firms use repurchases to manage the effect of unexercised
options on diluted EPS (Bens et al 2003) To do so in Panel C we use a measure of adjusted
repurchases where we subtract our estimate of repurchases undertaken to offset the exercise of
ESO31 We effectively test whether firms experiencing an accounting-induced decrease in option
grants engage in less repurchases (net of exercise-driven repurchases) because their need to
manage the effect of unexercised options on diluted EPS is lower However the coefficient on
the variables of interest is either insignificant or positive inconsistent with the hypothesis
29 In the case of repurchases we do not examine separately ldquoinitiationsrdquo and ldquointensityrdquo as we do for dividends
because initiation is not clearly defined for repurchases Unlike dividends the occurrence of a repurchase in a given
year (or the lack thereof) cannot be used to infer a general policy due to the more discretionary nature of the timing of
repurchases 30 To capture the effect of lower option-based compensation on option exercises and thus on repurchases we would
ideally extend the Post period beyond 2007 However as noted by Floyd et al (2015) repurchases declined
dramatically after 2007 because of the financial crisis making it difficult to detect the effect of any other factor 31 As upper bound estimate of exercise-driven repurchases we multiply the number of ESO exercised during the year
times the average stock price during the year Since the number of ESO exercised is available in Compustat starting in
2004 Panel C is based on observations from 2004 to 2007
31
A second important caveat is that most firms replaced stock options with restricted stock
(Table 2 Panel C) Unvested restricted stock is excluded from the denominator in the computation
of basic EPS (once vested it is included) However it is included in the denominator of diluted
EPS using the treasury stock method similar to stock options Given the complexity of this
method without access to all details of restricted stock grants and option grants it is difficult to
determine whether the switch from stock options to restricted stock decreased the need for
dilution-driven repurchases as our test implicitly assumes Hence it is possible that we do not find
a decrease in repurchases because a reduced need to offset the dilutive effect of stock options was
neutralized by an increased need to offset the dilutive effect of restricted stock
Subject to the above caveats the evidence in Table 4 is not consistent with a positive causal
relation between the use of option-based pay and repurchases More precisely it suggests that
option-driven dilution concerns do not have a first-order effect on the magnitude of repurchases
even though they may play a role in the repurchase decision Hence our result is not necessarily
in conflict with the evidence in Brav et al (2005) where two-thirds of the surveyed financial
executives state that offsetting the dilutionary effect of stock option plans or other stock
programs is an important factor to their repurchase decisions
35 Option-Based Pay and Payout Composition
As an alternative to examining dividends and repurchases separately we also look at the
payout composition the change in the DividendsTotal Payout ratio from the Pre to the Post period
where Total Payout is the sum of dividends and repurchases As noted earlier we focus on the
subsample of firms with both dividends and repurchases in both Pre and Post periods so as to
capture the change in payout mix by firms routinely using both vehicles to return cash to
shareholders If the use of option-based pay causes firms to substitute repurchases for dividends
32
we should find a positive association between Accounting Impact or Treated and the payout mix
defined as DividendsTotal Payout ratio Firms with a higher accounting-driven reduction in
option-based pay should have an increase (decrease) in the relative weight of dividends
(repurchases) to the total payout However as reported in Table 5 Panel A we fail to find a
significant association between Accounting Impact (column 1 and 2) or Treated (column 3) and
the change in payout mix The results are similar when we use Net Payout (dividends plus net
repurchases) instead of Total Payout in computing the payout mix (Panel B)
Overall the combined evidence in Tables 3-5 does not support the hypothesis that option-
based compensation has negative (positive) effect on dividends (repurchases) or that it causes
firms to replace dividends with repurchases
4 Conclusion
Prior literature has documented robust associations between option-based compensation and
payout policy yet it remains unclear whether this association reflcts a causal influence We
investigate the causal effect of option-based compensation on payout policy using the adoption of
FAS123R which resulted in a significant decrease in option grants making it a plausible
exogenous shock to the use of option-based pay To overcome the challenge of no control group
we exploit the fact that firms responded differently depending on the firm-specific accounting
impact as measured by the implied option expense disclosed in the footnotes prior to FAS123R
Firms with larger expected accounting impact curtailed option-based compensation much more
aggressively than firms with lower impact Using a sample of SampP 1500 firms we find no
evidence that firms with a larger accounting-induced decline in option compensation increased
dividends reduced repurchases or changed their payout composition contrary to the widely held
belief that option-based pay has a causal influence on payout policy
33
Appendix Variable Definitions and Data Sources
Accounting Impact Variables
Accounting impact Implied option expense (Compustat XINTOPT) divided by total assets
(Compustat AT) This variable is measured at fiscal year 2002 and is time-invariant
Accounting impact rank The quartile rank of Accounting impact (1=lowest 4=highest)
Payout Variables
Regular dividendTotal assets The numerator is total regular cash dividends in the fiscal year
from the distribution dataset in CRSP Regular cash dividends are identified by the distribution
codes 1212 1222 1232 or 1242 The denominator is one-year lagged total assets (Compustat
AT)
DPS Dividend per share (Compustat DVPSX_F)
DPS pct change The percentage change of average DPS from Pre- to Post-FAS123R period
DPS pct change gtX indicator A dummy variable that equals one if DPC pct change is greater
than X and zero otherwise
RepurchaseTotal assets The numerator is the repurchase of common equity which equals total
repurchase (Compustat PRSTK) minus the change in preferred stock redemption value
(Compustat PSTKRV) The denominator is one-year lagged total assets (Compustat AT)
Net repurchaseTotal assets Net repurchase removes the effect of share issuances The
construction follows Fama and French (2001) and Skinner (2008) if the firm uses the treasury
stock method for repurchase net repurchase equals the increase in common treasury stock
(Compustat TSTKC) if the firm uses the retirement method (when common treasury stock is zero
in the current and prior year) net repurchase equals total repurchases minus stock issuance
(Compustat SSTK) and change in preferred stock redemption value (Compustat PSTKRV)
When the above measures give negative value net repurchase is set to zero
Adjusted repurchaseTotal assets Adjusted repurchase removes from total repurchase the potential
effect of repurchasing exercised options This variable equals total repurchase of common stocks
minus the product between the number of options exercised (Compustat OPTEXD) and average
stock price during the year When the above measure gives negative value adjusted repurchase is
set to zero Since the number of options exercised is not available before 2003 we drop
observations in 2003 when we use this variable
34
Total payoutTotal assets the sum of Regular dividendTotal assets and RepurchaseTotal assets
Regular dividendTotal payout regular cash dividend divided by the sum of regular cash dividend
and repurchase from common equity In the two-period analysis (Pre- vs Post-FAS123R) we
separately sum the numerator and the denominator for each firm-period and then calculate the ratio
Regular dividendNet payout regular dividend divided by the sum of regular dividend and net
repurchase In the two-period analysis (Pre- vs Post-FAS123R) we separately sum the numerator
and the denominator for each firm-period and then calculate the ratio
Compensation Variables
Salary_$ Average salary (Execucomp SALARY) of the top 5 highest paid executives in $1000
Salary_ Average salary (Execucomp SALARY) divided by average total pay (Execucomp
TDC1) of the top 5 highest paid executives
Bonus_$ Average bonus (Execucomp BONUS) of the top 5 highest paid executives in $1000
Due to a data format change we add non-equity plan-based awards (Execucomp
NON_EQ_TARG) to this measure after 2006
Bonus_ Bonus_$ divided by average total pay (Execucomp TDC1) of the top 5 highest paid
executives
Option grant_$ Average option grant value (Execucomp OPTION_AWARDS_BLK_VALUE or
OPTION_AWARDS_FV) of the top 5 highest paid executives in $1000 Due to a data format
change we use OPTION_AWARDS_FV for this measure after 2006
Option grant_ Option grant_$ divided by average total pay (Execucomp TDC1) of the top 5
highest paid executives
Restricted stock grant_$ Average restricted stock grant value (Execucomp RSTKGRNT or
STOCK_AWARDS_FV) of the top 5 highest paid executives in $1000 Due to data format
change we use STOCK_AWARDS_FV for this measure after 2006
Restricted stock grant_ Restricted stock grant_$ divided by average total pay (Execucomp
TDC1) of the top 5 highest paid executives
Total pay_$ Average total pay (Execucomp TDC1) of the top 5 highest paid executives in $1000
35
Other Characteristics
Size The book value of total assets (Compustat AT) minus the book value of common equity
(Compustat CEQ) plus the market value of common equity from CRSP in $M
Log(size) the natural logarithm of size
Book-to-market the book value of common equity dividend by its market value
Leverage long term debt plus short term debt (Compustat DLTT + DLC) divided by total assets
Asset tangibility tangible assets (Compustat AT - INTAN) divided by total assets
Free cash flow Operating cash flow (Compustat OANCF) minus capital expenditure (Compustat
CAPX) then divided by lagged total assets
Cash holding Cash and short-term investments (Compustat CHE) divided by total assets
ROA volatility the standard deviation of returns on assets (operating income before tax divided by
lagged total assets) in the past five fiscal years
Institutional ownership the number of shares held by institutional investors divided by the number
of shares outstanding from Thomson Reuters Institutional Holdings database
Sales growth the growth rate of sales (Compustat SALE) from the prior year
Past stock return annual stock return from the prior year
Loss indicator a dummy variable taking value of one if the current net income is negative and
zero otherwise
36
References
Aboody David 1996 Market Valuation of Employee Stock Options Journal of Accounting and
Economics 22 357-391
Aboody David Barth Mary E and Ron Kasznik 2004 Firms Voluntary Recognition of Stock-
Based Compensation Expense Journal of Accounting Research 42 123ndash150
Aboody David and Ron Kasznik 2008 Executive stock-based compensation and firmsrsquo cash
payout the role of shareholdersrsquo tax-related payout preferences Review of Accounting Studies
13 216ndash251
Anantharaman Divya and Yong Gyu Lee 2014 Managerial risk taking incentives and corporate
pension policy Journal of Financial Economics 111 328ndash351
Baker Malcolm and Jeffrey Wurgler 2004 A catering theory of dividends Journal of Finance
59 1125-1165
Baker Malcolm and Jeffrey Wurgler 2016 Dividends as reference points a behavioral signaling
approach Review of Financial Studies 29 697-738
Bakke Tor-Erik Hamed Mahmudi Chitru Fernando and Jesus Salas 2015 The causal effect of
option pay on corporate risk management Journal of Financial Economics forthcoming
Balsam Steven Austin Reitenga and Jennifer Yin 2008 Option acceleration in response to SFAS
No 123 (R) Accounting Horizons 22 23-45
Bens Daniel and Steven Monahan 2008 Altering Investment Decisions to Manage Financial
Reporting Outcomes Asset-Backed Commercial Paper Conduits and FIN 46 Journal of
Accounting Research 46 1017-1055
Bens Daniel A Venky Nagar Douglas J Skinner and MH Franco Wong 2003 Employee stock
options eps dilution and stock repurchases Journal of Accounting and Economics 36 51ndash90
Bertrand Marianne Esther Duflo and Sendhil Mullainathan 2004 How much should we trust
differences-in-differences estimates The Quarterly Journal of Economics 119 249ndash275
Blouin Jennifer L Jana S Raedy and Douglas A Shackelford 2011 Dividends Share
Repurchases and Tax Clienteles Evidence from the 2003 Reductions in Shareholder Taxes
The Accounting Review 86 887-914
Brav Alon John R Graham Campbell R Harvey and Roni Michaely 2005 Payout policy in the
21st century Journal of Financial Economics 77 483ndash527
Brown Lawrence D and Yen-Jung Lee 2011 Changes in Option-Based Compensation Around
the Issuance of SFAS123R Journal of Business Finance amp Accounting 38 1053ndash109
37
Brown Jeffrey R Nellie Liang and Scott Weisbenner 2007 Executive financial incentives and
payout policy Firm responses to the 2003 dividend tax cut Journal of Finance 62 1935ndash
1965
Burns Natasha Brian McTier and Kristina Minnick 2015 Equity-incentive compensation and
payout policy in Europe Journal of Corporate Finance 30 85-97
Carter Mary Ellen and Luann J Lynch 2003 The Consequences of the FASBrsquos 1998 Proposal on
Accounting for Stock Option Repricing Journal of Accounting and Economics 35 51-72
Carter Mary Ellen Luann J Lynch and Irem Tuna 2007 The role of accounting in the design of
CEO equity compensation The Accounting Review 82 327ndash357
Chava Sudheer and Amiyatosh Purnanandam 2010 CEOs versus CFOs Incentives and
corporate policies Journal of Financial Economics 97 263ndash278
Chetty Raj and Emmanuel Saez 2005 Dividend taxes and corporate behavior Evidence from the
2003 dividend tax cut The Quarterly Journal of Economics 120 791ndash833
Choudhary Preeti Shivaram Rajgopal and Mohan Venkatachalam 2009 Accelerated vesting of
employee stock options in anticipation of FAS123R Journal of Accounting Research 47 105ndash
146
Christensen Hans B and Valeri Nikolaev 2009 Contracting on Mandatory Changes to GAAP
New Practice and Its Determinants Working Paper University of Chicago
Chu Yongqiang and Tao Ma 2015 How does management compensation affect bank risk taking
evidence from FAS 123R University of South Carolina Working Paper
Cuny Charles J Gerald S Martin and John J Puthenpurackal 2009 Stock options and total
payout Journal of Financial and Quantitative Analysis 44 391ndash410
DeAngelo Harry Linda DeAngelo and Douglas J Skinner 2000 Special Dividends and the
Evolution of Dividend Signaling Journal of Financial Economics 57 309-354
Dechow Patricia M Amy P Hutton and Richard G Sloan 1996 Economic consequences of
accounting for stock-based compensation Journal of Accounting Research 34 1ndash20
Edgerton J 2013 Four facts about dividend payouts and the 2003 tax cut International Tax and
Public Finance 20 769-784
Edmans Alex and Xavier Gabaix 2015 Executive compensation a modern primer Journal of
Economic Literature forthcoming
38
Fama Eugene F and Kenneth R French 2001 Disappearing dividends changing firm
characteristics or lower propensity to pay Journal of Financial Economics 60 3ndash43
Farre-Mensa Joan Roni Michaely and Martin C Schmalz 2014 Payout policy Annual Review
of Financial Economics 6 75ndash134
Fenn George W and Nellie Liang 2001 Corporate payout policy and managerial stock
incentives Journal of Financial Economics 60 45ndash72
Ferri Fabrizio and Tatiana Sandino 2009 The impact of shareholder activism on financial
reporting and compensation the case of employee stock options expensing The Accounting
Review 84 433ndash466
Floyd Eric Nan Li and Douglas J Skinner 2015 Payout policy through the financial crisis the
growth of repurchases and the resilience of dividends Journal of Financial Economics 118
299-316
Frydman Carola and Dirk Jenter 2010 CEO compensation Annual Review of Financial
Economics 2 75-102
Gipper Brandon 2015 Assessing the Effects of Disclosing Management Compensation Working
Paper University of Chicago
Gormley Todd David Matsa and Todd Milbourn 2013 CEO compensation and corporate risk
evidence from a natural experiment Journal of Accounting and Economics 56 79-101
Graham John Michelle Hanlon and Terry Shevlin 2011 Real effects of accounting rules
evidence from multinational firmsrsquo investment locations and profit repatriation decisions
Journal of Accounting Research 49 137-185
Graham John Campbell Harvey and Shiva Rajgopal 2005 The Economic implications of
corporate financial reporting Journal of Accounting and Economics 40 3-73
Greenspan Alan 2002 Testimony of Alan Greenspan before the Committee on Banking
Housing and Urban Affairs US Senate July 16 Washington DC Government Printing
Office
Grullon Gustavo and Roni Michaely 2002 Dividends Share Repurchases and the Substitution
Hypothesis Journal of Finance 57 1649-1684
Hail Luzi Ahmed Tahoun and Clare Wang 2014 Dividend Payouts and Information Shocks
Journal of Accounting Research 52 403-456
Hall Brian J and Kevin J Murphy 2002 Stock options for undiversified executives Journal of
Accounting amp Economics 33 3-42
39
Hall Brian J and Kevin J Murphy 2003 The trouble with stock options Journal of Economic
Perspectives 17 49ndash70
Hanlon Michelle and Jeffrey L Hoopes 2014 What do firms do when dividend tax rates change
An examination of alternative payout responses Journal of Financial Economics 114 105-
124
Hayes Rachel M Michael Lemmon and Mingming Qiu 2012 Stock options and managerial
incentives for risk taking Evidence from FAS123R Journal of Financial Economics 105
174ndash190
Heron Randall A Erik Lie 2007 Does backdating explain the stock price pattern around
executive stock option grants Journal of Financial Economics 83 271-295
Hribar Paul Nicole Thorne Jenkins and W Bruce Johnson 2006 Stock repurchases as an
earnings management device Journal of Accounting and Economics 41 3ndash27
Jensen Michael C 1986 Agency cost of free cash flow corporate finance and takeovers
American Economic Review 76 323-329
Jolls Christine 1998 Stock repurchases and incentive compensation NBER Working Paper No
w6467
Jung Boochun Woo-Jong Lee and Yanhua Sunny Yang 2016 The Impact of Dividend
Covenants on Investment and Operating Performance Journal of Business Finance amp
Accounting 43 414ndash447
Kahle Kathleen M 2002 When a buyback isnrsquot a buyback open market repurchases and
employee options Journal of Financial Economics 63 235ndash261
Lambert Richard A William N Lanen and David F Larcker 1989 Executive stock option plans
and corporate dividend policy Journal of Financial and Quantitative Analysis 24 409ndash425
Lintner John 1956 Distribution of incomes of corporations among dividends retained earnings
and taxes The American Economic Review 46 97-113
Low Angie 2009 Managerial risk-taking behavior and equity-based compensation Journal of
Financial Economics 92 470-490
Miller Merton H and Franco Modigliani 1961 Dividend policy growth and the valuation of
shares The Journal of Business 34 411ndash433
Minnick Kristina and Leonard Rosenthal 2015 Stealth compensation Do CEOs increase their
pay by influencing dividend policy Journal of Corporate Finance 25 435-454
40
Murphy Kevin J 1999 Executive compensation In O Ashenfelter and D Card (eds) North
Holland Handbook of Labor Economics Amsterdam Elsevier Science BV
Murphy Kevin J 2013 Executive compensation Where we are and how we got there Handbook
of the Economics of Finance Elsevier Science North Holland 211-356
Nikolaev Valeri 2010 Debt Covenants and Accounting Conservatism Journal of Accounting
Research 48 143-176
Puri Manju Joumlrg Rocholl and Sascha Steffen 2011 Global retail lending in the aftermath of the
US financial crisis Distinguishing between supply and demand effects Journal of Financial
Economics 100 556-578
Shue Kelly and Richard R Townsend 2014 Swinging for the fences Executive reactions to
quasi-random option grants Working Paper University of Chicago
Skinner Douglas J 2008 The evolving relation between earnings dividends and stock
repurchases Journal of Financial Economics 87 582-609
Weisbenner Scott J 2000 Corporate share repurchases in the 1990s What role do stock options
play FEDS Working Paper No 2000-29
Zhang Dan 2013 CEO dividend protection Working Paper BI Norwegian Business School
41
Figure 1 Trends of dividends and repurchases from 2003 to 2007 Panel A plots the average
Regular DividendTotal Assets of firms in the highest and lowest quartiles of Accounting Impact
measured in 2002 Panel B shows the average Total RepurchaseTotal Assets of firms in the
highest and lowest quartiles of Accounting Impact measured in 2002
Panel A Trends of regular dividends
Panel B Trends of total repurchases
00
05
10
15
20
2003 2004 2005 2006 2007
Regular DividendTotal Assets
Lowest Acc Impact
Highest Acc Impact
Pre Post
00
20
40
60
80
100
2003 2004 2005 2006 2007
Total Repurchase Total Assets
Lowest Acc Impact
Highest Acc Impact
Pre Post
42
Table 1
Summary Statistics
Panel A Firm characteristics - full sample
N Mean Std dev 25 pctl Median 75 pctl
Accounting impact (2002) 1176 173 366 022 052 163
Payout variablesRegular dividendTotal assets 5653 093 148 000 000 142
RepurchaseTotal assets 5653 394 710 000 035 500
Total payoutTotal assets 5653 488 748 000 175 666
Regular dividendTotal payout 4091 3874 4057 000 2237 8833
Level of executive compensation (in $1000)
Salary_$ 5653 450 190 314 409 544
Bonus_$ 5653 476 616 122 295 586
Option grant_$ 5653 791 1137 62 384 1002
Restricted stock grant_$ 5653 458 866 0 58 518
Total pay_$ 5653 2481 2475 890 1647 3074
Percentage of executive compensation
Salary_ 5653 296 183 165 251 382
Bonus_ 5653 197 148 97 177 268
Option grant_ 5653 283 235 67 256 445
Restricted stock grant_ 5653 141 180 00 41 249
Control variables
Size ($M) 5653 11086 27294 1017 2459 8117
Log(size) 5653 7985 1565 6925 7808 9002
Book-to-market 5653 0445 0287 0251 0388 0578
Leverage 5653 0202 0172 0038 0187 0309
Asset tangibility 5653 0806 0184 0691 0853 0965
Free cash flow 5653 0059 0091 0013 0059 0108
Cash holding 5653 0166 0172 0034 0100 0247
ROA volatility 5653 0056 0056 0021 0038 0070
Institutional ownership 5653 0753 0202 0639 0795 0910
Sales growth 5653 0121 0189 0028 0096 0183
Past stock return 5653 0094 0183 -0012 0094 0199
Loss indicator 5653 0164 0370 0000 0000 0000
This table presents summary statistics Panel A shows the descriptive statistics of payout variables compensation
variables and other firm characteristics for the full sample Accounting impact is the implied option expense
measured at fiscal year 2002 All other variables are measured at firm-year level from fiscal year 2003 to 2007
resulting in 5653 firm-year observations (except for Regular dividendTotal Payout which can be measured only
for the 4901 firm-year observations with Total payout greater than zero) Panel B shows the pairwise correlations
between main variables at firm-year level Panel C compares payout variables compensation variables and other
firm characteristics before and after FAS123R The Pre-FAS123R period consists of fiscal year 2003 and 2004
the Post-FAS123R period covers fiscal year 2005-2007 Panel D compares the trends of payout and compensation
variables around FAS123R across four quartile groups ranked by 2002 accounting impact Panel E compares the
trends of payout and compensation variables around FAS123R between the treated and control group under the
alternative treatment definition in Bakke et al (2015) (see Section 22) All variables are defined in Appendix The
notation and in Panel C indicates statistically significant at 10 5 and 1 level in T-tests for equal
means respectively
43
Pa
nel
B
Pea
rso
n c
orr
ela
tio
ns
Reg div
Repurchase
Total payout
Salary_
Bonus_
Option_
RS_
Log(size)
BM
Leverage
Tangibility
FCF
Cash holdingROA vol
Inst own
Sales growth
Past ret
urn
Loss
Reg
div
10
0
Repurc
hase
01
610
0
Tota
l payout
03
509
810
0
Sala
ry_
-0
10
-01
8-0
19
10
0
Bonus_
00
700
100
3-0
01
10
0
Option_
-0
10
00
900
6-0
41
-03
510
0
RS
_
01
000
901
0-0
32
-01
1-0
40
10
0
Log(s
ize)
03
101
802
3-0
56
01
101
202
210
0
BM
-02
1-0
28
-03
103
0-0
03
-02
000
0-0
33
10
0
Levera
ge
-00
1-0
08
-00
8-0
05
00
6-0
11
00
801
9-0
03
10
0
Tangib
ility
00
200
100
101
200
1-0
05
-00
6-0
12
-00
4-0
18
10
0
FC
F02
203
703
9-0
20
00
901
1-0
01
02
4-0
32
-02
1-0
16
10
0
Cash
hold
ing
-01
301
000
700
2-0
14
02
2-0
10
-02
3-0
16
-03
502
901
210
0
RO
A v
ol
-01
5-0
04
-00
700
4-0
11
01
9-0
11
-02
3-0
08
-01
101
2-0
02
03
910
0
Inst
ow
n
-00
901
401
1-0
17
00
200
701
200
7-0
01
00
3-0
08
01
4-0
06
-01
110
0
Sale
s gro
wth
-00
8-0
04
-00
6-0
15
00
501
0-0
02
00
7-0
16
-00
3-0
08
01
300
201
400
410
0
Past
retu
rn00
901
301
4-0
18
01
5-0
01
00
301
6-0
29
-01
000
102
7-0
14
-01
001
602
710
0
Loss
-02
0-0
19
-02
201
8-0
18
00
4-0
05
-02
601
901
300
6-0
41
01
702
3-0
16
-01
8-0
40
10
0
44
Panel C Firm characteristics - before and after FAS123R
Pre FAS 123R Post FAS 123R Difference
Payout variables
Regular dividendTotal assets 083 099 016
RepurchaseTotal assets 245 490 245
Total payoutTotal assets 328 589 261
Regular dividendTotal payout 3914 2790 -1124
Level of executive compensation (in $1000)
Salary_$ 426 463 37
Bonus_$ 418 505 87
Option grant_$ 896 707 -191
Restricted stock grant_$ 269 574 305
Total pay_$ 2263 2584 321
Percentage of executive compensation
Salary_ 305 293 -12
Bonus_ 186 204 18
Option grant_ 343 240 -103
Restricted stock grant_ 87 176 89
Control variables
Size ($M) 9671 11631 1960
Log(size) 7860 8035 0175
Book-to-market 0437 0453 0016
Leverage 0201 0203 0002
Asset tangibility 0822 0793 -0029
Free cash flow 0061 0057 -0004
Cash holding 0175 0159 -0016
ROA volatility 0067 0048 -0019
Institutional ownership 0712 0781 0069
Sales growth 0137 0108 -0029
Past stock return 0080 0101 0021
Loss indicator 0173 0159 -0014
45
Pa
nel
D
Fir
m c
ha
racte
rist
ics
by q
ua
rtil
e o
f a
cco
un
tin
g i
mp
act
- b
efo
re a
nd
aft
er
FA
S1
23
R
Accounting im
pact
(2002)
Num
ber
of
Fir
ms
Pre
Post
Pre
Post
Pre
Post
Pre
Post
Payout
vari
able
s
Regula
r div
idendT
ota
l ass
ets
11
2
12
4
09
4
11
1
09
5
11
3
03
0
04
9
Repurc
hase
Tota
l ass
ets
11
3
26
8
19
2
37
3
32
7
63
1
35
1
68
7
Tota
l payout
Tota
l ass
ets
22
4
39
1
28
5
48
4
42
2
74
4
38
1
73
6
Regula
r div
idendT
ota
l payout
643
7
469
8
474
0
341
1
284
5
195
4
82
5
74
5
Perc
enta
ge o
f executive c
om
pensa
tion
Sala
ry_
337
295
313
287
296
289
276
300
Bonus_
223
226
214
228
172
192
134
169
Option g
rant_
201
167
290
210
373
260
507
325
Rest
ricte
d s
tock g
rant_
116
194
98
180
89
176
43
155
294
294
294
294
1st Q
uart
ile2
nd Q
uart
ile3
rd Q
uart
ile4
th Q
uart
ile
01
2
03
5
09
3
55
1
46
Accounting impact
Number of Firms
By accounting impact quartile
1
2
3
4
Pre Post Pre Post
Payout variables
Regular dividendTotal assets 09 11 08 10
RepurchaseTotal assets 18 31 26 52
Total payoutTotal assets 28 43 34 62
Regular dividendTotal payout 428 357 386 265
Percentage of executive compensation
Salary_ 435 364 282 280
Bonus_ 226 214 179 202
Option grant_ 92 125 387 261
Restricted stock grant_ 125 188 80 174
Percentage of CEO compensation
Salary_(CEO) 485 364 260 259
Bonus_(CEO) 249 228 185 219
Option grant_(CEO) 10 127 406 275
Restricted stock grant_(CEO) 128 182 82 183
Panel E Firm characteristics by alternative treatment definition - before and
after FAS123R
Treated
25
19
997
223
250
256
268
10
177
71
Control
44
37
47
Table 2
Differential effect of FAS123R on the use of option-based compensation
Panel A Two-period first-difference regression
Prediction Coeff t-stat Coeff t-stat Coeff t-stat
Accounting impact rank - -0044 -628
Accounting impact rank=2 - -0044 -327
Accounting impact rank=3 - -0075 -468
Accounting impact rank=4 - -0140 -613
Treated - -0132 -875
ΔLog(size) 0061 202 0061 200 0063 214
ΔBook-to-market 0032 091 0032 092 0051 143
ΔLeverage -0157 -213 -0160 -218 -0111 -153
ΔAsset tangibility -0012 -014 -0020 -023 -0023 -026
ΔFree cash flow -0106 -095 -0108 -097 -0128 -117
ΔCash holding -0197 -211 -0193 -206 -0180 -194
ΔFive-year ROA volatility -0065 -031 -0056 -026 -0098 -047
ΔInstitutional ownership -0044 -091 -0043 -088 -0044 -092
ΔSales growth -0064 -102 -0065 -104 -0090 -153
ΔPast one-year stock return 0051 078 0052 080 0091 138
ΔLoss frequency 0056 207 0057 207 0047 179
Log(size) -0009 -210 -0009 -207 -0002 -035
Book-to-market -0015 -056 -0013 -049 0018 072
Leverage 0022 046 0023 048 0068 150
Asset tangibility 0033 077 0033 078 0053 128
Free cash flow 0227 202 0220 195 0127 117
Cash holding -0002 -004 0012 019 -0078 -141
Five-year ROA volatility -0451 -240 -0430 -228 -0509 -283
Institutional ownership -0123 -360 -0122 -359 -0100 -292
Sales growth -0041 -056 -0040 -055 -0089 -125
Past one-year stock return -0009 -015 -0006 -010 0078 125
Loss frequency 0055 174 0056 178 0054 173
Fixed effect
Standard error
Adj R-squared
Observations
Model (3)
Dependent variable ΔAvg Option grantTotal pay
Huber-White
0156
This table investigates whether the effect of FAS123R on the use of option-based pay varies with its potential accounting impact Panel A
reports the results of estimating three two-period first-differencing models where for each firm we average its characteristics in Pre- and
Post-FAS123R period The Pre-FAS123R period consists of fiscal year 2003 and 2004 the Post-FAS123R period covers fiscal year 2005-
2007 In all three specifications the dependent variable is the change of average Option grantTotal pay from Pre- to Post-FAS123R period
The main independent variable varies by model in Model (1) the Accounting impact rank is the quartile rank of implied option expensetotal
assets measured in 2002 (1=lowest 4=highest) In Model (2) Accounting impact rank=2 (3 4) is an indicator that takes value of one if the
firmrsquos Accounting impact rank equals 2 (3 4) In Model (3) we use an alternative treatment construction following Bakke et al (2015)
where Treated is an indicator that takes value of zero if the firm granted zero option to its CEO in both 2003 and 2004 or the firm began to
voluntarily expense option-based pay at fair value in 2002 or earlier and one otherwise For each control variable we include both its level in
the Pre-FAS123R period and its change across the two periods Panel B shows the results of estimating fixed effect models with firm-year
observations The dependent variable is the firm-year level Option grantTotal pay The main independent variables are the interactions of
Post-FAS123R indicator (Post) with Accounting Impact rank Accounting impact rank indicators and Treated respectively All models in
Penal A have industry fixed effects and the standard errors are Huber-White heteroscedasticity-consistent standard errors All models in
Penal B have firm fixed effects and year fixed effects and the standard errors are clustered at firm level All variables are defined in
Appendix The notation and indicates statistically significant at 10 5 and 1 level respectively
Model (1) Model (2)
11711171 1171
Industry Industry
Huber-White
0124
Huber-White
0123
Industry
48
Panel B Panel fixed effects regression
Prediction Coeff t-stat Coeff t-stat Coeff t-stat
Acc impact rank x Post - -0044 -807
Acc impact rank 2 x Post - -0046 -333
Acc impact rank 3 x Post - -0077 -526
Acc impact rank 4 x Post - -0137 -776
Treated x Post - -0145 -970
Log(size) 0034 221 0034 217 0036 229
Book-to-market 0018 084 0017 083 0015 070
Leverage -0004 -009 -0006 -013 -0007 -015
Asset tangibility 0007 012 0004 006 0011 018
Free cash flow -0074 -151 -0072 -146 -0078 -158
Cash holding -0048 -086 -0050 -090 -0006 -011
Five-year ROA volatility 0250 231 0239 219 0437 414
Institutional ownership 0043 159 0044 161 0041 150
Sales growth -0033 -168 -0034 -171 -0031 -158
Past one-year stock return 0067 221 0068 224 0063 204
Loss indicator 0023 209 0022 207 0024 222
Fixed effects
Standard error
Adj R-squared
Observations
Dependent variable Option grantTotal pay
5653 5653 5653
Clustered by firm
Firm Year
Clustered by firm
Firm Year
Clustered by firm
0523 0523 0526
Model (1) Model (2) Model (3)
Firm Year
49
Table 3
Effect of option-based compensation on dividend policy
Panel A Two-period first-difference regression
Prediction Coeff t-stat Coeff t-stat Coeff t-stat
Accounting impact rank + 0000 077
Accounting impact rank=2 + 0001 091
Accounting impact rank=3 + 0000 044
Accounting impact rank=4 + 0001 092
Treated + 0000 -026
ΔLog(size) 0000 -030 0000 -030 0000 -026
ΔBook-to-market -0002 -190 -0002 -193 -0002 -195
ΔLeverage -0002 -059 -0002 -057 -0002 -059
ΔAsset tangibility 0016 431 0016 429 0016 430
ΔFree cash flow 0017 373 0017 373 0017 375
ΔCash holding -0011 -288 -0011 -285 -0010 -282
ΔFive-year ROA volatility 0003 034 0002 032 0003 035
ΔInstitutional ownership -0002 -073 -0002 -073 -0002 -070
ΔSales growth -0001 -040 -0001 -037 -0001 -038
ΔPast one-year stock return 0002 077 0002 076 0002 070
ΔLoss frequency 0000 -048 0000 -045 0000 -046
Log(size) 0000 183 0000 182 0000 182
Book-to-market -0002 -227 -0002 -225 -0002 -284
Leverage -0001 -037 -0001 -039 -0001 -048
Asset tangibility 0003 179 0003 180 0003 176
Free cash flow 0017 291 0017 291 0017 300
Cash holding 0002 080 0002 077 0002 098
Five-year ROA volatility 0003 035 0002 033 0003 044
Institutional ownership -0001 -068 -0001 -068 -0001 -058
Sales growth -0004 -177 -0004 -175 -0004 -172
Past one-year stock return 0004 169 0004 167 0004 165
Loss frequency -0001 -111 -0001 -109 -0001 -102
Fixed effect
Standard error
Adj R-squared
Observations
Dependent variable ΔAvg Regular dividendTotal assets
This table investigates the causal effect of option-based pay on dividend policy by examining whether changes in dividend policy around
FAS123R vary with its potential accounting impact Panel A reports the results of estimating three two-period first-differencing models
where for each firm we average its characteristics in Pre- and Post-FAS123R period In all three specifications the dependent variable is
the change of average Regular dividendTotal assets from Pre- to Post-FAS123R period The main independent variable varies by model in
Model (1) the Accounting impact rank is the quartile rank of implied option expensetotal assets measured in 2002 (1=lowest 4=highest) In
Model (2) Accounting impact rank=2 (3 4) is an indicator that takes value of one if the firmrsquos Accounting impact rank equals 2 (3 4) In
Model (3) we use an alternative treatment construction following Bakke et al (2015) where Treated is an indicator that takes value of zero
if the firm granted zero option to its CEO in both 2003 and 2004 or the firm began to voluntarily expense option-based pay at fair value in
2002 or earlier and one otherwise For each control variable we include both its level in the Pre-FAS123R period and its change across the
two periods Panel B shows the results of estimating fixed effect models with firm-year observations The dependent variable is the firm-
year level Regular dividendTotal assets The main independent variables are the interactions of Post-FAS123R indicator (Post) with
Accounting Impact rank Accounting impact rank indicators and Treated respectively Panel C examines the intensity of dividend changes
among firms with nonzero dividend per share in 2003 or 2004 In particular we estimates the same three models as in Panel A(with the
same independent variables) but for five dependent variables the change of average Regular dividendTotal assets from Pre- to Post-
FAS123R period (as in Panel A) the percentage change of DPS (dividend per share) from Pre- to Post-FAS123R period and three
indicators denoting respectively whether the percentage change of DPS was greater than 20 40 and 60 Panel D reports four
robustness tests of the dividend intensity regression In each of them a set of possible confounding observations is removed (see Section 33
for details) Panel E compares the trends of dividend initiation and termination around FAS123R across four quartile groups ranked by
accounting impact All models in Panel A C and D have industry fixed effects and the standard errors are Huber-White heteroscedasticity-
consistent standard errors All models in Penal B have firm fixed effects and year fixed effects and the standard errors are clustered at
firm level All variables are defined in Appendix The notation and indicates statistically significant at 10 5 and 1 level
Industry Industry Industry
Model (1) Model (2) Model (3)
1171 1171 1171
Huber-White Huber-White Huber-White
0105 0104 0105
50
Panel B Panel fixed effects regression
Prediction Coeff t-stat Coeff t-stat Coeff t-stat
Acc impact rank x Post + 0000 122
Acc impact rank 2 x Post + 0001 110
Acc impact rank 3 x Post + 0001 094
Acc impact rank 4 x Post + 0001 129
Treated x Post + 0000 -012
Log(size) 0001 179 0001 179 0001 181
Book-to-market 0000 025 0000 024 0000 031
Leverage 0001 062 0001 064 0001 069
Asset tangibility 0009 360 0009 358 0009 363
Free cash flow 0002 090 0002 093 0002 092
Cash holding -0007 -295 -0007 -298 -0007 -298
Five-year ROA volatility 0001 041 0001 038 0000 -006
Institutional ownership 0000 -027 0000 -026 0000 -027
Sales growth 0000 053 0000 051 0000 044
Past one-year stock return 0001 089 0001 088 0001 078
Loss indicator 0000 -060 0000 -057 0000 -076
Fixed effects
Standard error
Adj R-squared
Observations
Dependent variable Regular dividendTotal assets
Model (1) Model (2) Model (3)
Firm Year Firm Year Firm Year
5653 5653 5653
Clustered by firm Clustered by firm Clustered by firm
0877 0877 0877
51
Panel C Intensity of dividend changes around FAS123R
Prediction Coeff t-stat Coeff t-stat Coeff t-stat
Accounting impact rank + 0000 065
Accounting impact rank=2 + 0000 048
Accounting impact rank=3 + 0000 026
Accounting impact rank=4 + 0002 080
Treated + 0001 063
Dependent var DPS pct change
Accounting impact rank + -0145 -072
Accounting impact rank=2 + 0018 006
Accounting impact rank=3 + -0177 -045
Accounting impact rank=4 + -0746 -100
Treated + -0407 -119
Accounting impact rank + 0029 095
Accounting impact rank=2 + 0040 074
Accounting impact rank=3 + 0092 139
Accounting impact rank=4 + 0008 007
Treated + -0007 -012
Accounting impact rank + 0024 076
Accounting impact rank=2 + 0047 088
Accounting impact rank=3 + 0079 114
Accounting impact rank=4 + -0003 -002
Treated + 0030 052
Accounting impact rank + 0030 098
Accounting impact rank=2 + 0078 155
Accounting impact rank=3 + 0085 130
Accounting impact rank=4 + 0014 012
Treated + -0006 -011
Control variables
Fixed effect
Standard error
Observations 572 572 572
Yes Yes Yes
Huber-White Huber-White Huber-White
Industry Industry Industry
Dependent var DPS pct
change gt60 indicator
Model (1) Model (2) Model (3)
Dependent var ΔAvg Regular
dividendAssets
Dependent var DPS pct
change gt20 indicator
Dependent var DPS pct
change gt40 indicator
52
Panel D Robustness tests for intensity of dividend changes around FAS123R
Prediction Coeff t-stat Coeff t-stat Coeff t-stat
Accounting impact rank + 0006 017
Accounting impact rank=2 + 0067 118
Accounting impact rank=3 + 0041 057
Accounting impact rank=4 + -0061 -049
Treated + 0022 035Observations
Accounting impact rank + 0009 027
Accounting impact rank=2 + 0058 106
Accounting impact rank=3 + 0032 043
Accounting impact rank=4 + -0032 -024
Treated + 0018 028
Observations
Accounting impact rank + 0030 089
Accounting impact rank=2 + 0039 071
Accounting impact rank=3 + 0122 168
Accounting impact rank=4 + -0063 -052
Treated + 0075 132
Observations
Accounting impact rank + 0008 023
Accounting impact rank=2 + 0023 042
Accounting impact rank=3 + 0048 064
Accounting impact rank=4 + -0042 -033
Treated + -0010 -016
Observations
Control variables
Fixed effect
Standard error
Exclude firms with stable
payout ratio from 2003 to 2004
506 506 506
Dependent variable DPS pct change gt40 indicator
Model (1) Model (2) Model (3)
Exclude voluntary expensers
519 519
Exclude firms in the top decile
of option reduction (02-04)
Exclude firms that accelerated
option vesting
504 504 504
517 517 517
519
Huber-White Huber-White Huber-White
Yes Yes Yes
Industry Industry Industry
53
Panel E Dividend initiation and termination rates around FAS123R
Pre FAS 123R
1 280 75 7 6 13 173
2 284 135 18 9 27 200
3 286 181 11 14 25 138
4 282 260 9 10 19 73
Total 1132 651 45 39 84 129
Post FAS 123R
1 275 63 4 4 8 127
2 280 116 9 9 18 155
3 276 152 9 3 12 79
4 263 223 5 1 6 27
Total 1094 554 27 17 44 79
Pre FAS 123R
1 280 205 2 0 2 10
2 284 149 7 1 8 54
3 286 105 0 0 0 00
4 282 22 0 0 0 00
Total 1132 481 9 1 10 21
Post FAS 123R
1 275 212 3 6 9 42
2 280 164 1 2 3 18
3 276 124 1 1 2 16
4 263 40 0 3 3 75
Total 1094 540 5 12 17 31
termination
in 2004
03-04
cumulative
03-04
cumulative
Quartile firms
with
dividend in
2004
termination
in 2005
termination
in 2006
05-06
cumulative
05-06
cumulative
Termination
Quartile firms
with
dividend in
2002
termination
in 2003
without
dividend in
2004
initiation in
2003
initiation in
2004
03-04
cumulative
03-04
cumulative firmsQuartile
firmsQuartile initiation in
2005
initiation in
2006
05-06
cumulative
05-06
cumulative
Initiation
without
dividend in
2002
54
Table 4
Effect of option-based compensation on repurchases
Panel A Two-period first-difference regression with total repurchase
Prediction Coeff t-stat Coeff t-stat Coeff t-stat
Accounting impact rank - 0002 122
Accounting impact rank=2 - 0002 071
Accounting impact rank=3 - 0005 123
Accounting impact rank=4 - 0007 102
Treated - 0014 365
Control variables
Fixed effect
Standard error
Adj R-squared
Observations
Panel B Two-period first-difference regression with net repurchase
Prediction Coeff t-stat Coeff t-stat Coeff t-stat
Accounting impact rank - 0003 166
Accounting impact rank=2 - 0002 051
Accounting impact rank=3 - 0006 165
Accounting impact rank=4 - 0009 137
Treated - 0010 300
Control variables
Fixed effect
Standard error
Adj R-squared
Observations
Panel C Two-period first-difference regression with repurchase adjusted for exercised options
Prediction Coeff t-stat Coeff t-stat Coeff t-stat
Accounting impact rank - 0001 056
Accounting impact rank=2 - 0002 062
Accounting impact rank=3 - 0007 172
Accounting impact rank=4 - -0001 -008
Treated - 0006 197
Control variables
Fixed effect
Standard error
Adj R-squared
Observations
Dependent variable ΔAvg RepurchaseTotal assets
This table investigates the causal effect of option-based pay on payout policy by examining whether the changes of repurchase around
FAS123R vary with its potential accounting impact Panel A reports the results of estimating three two-period first-differencing models
where for each firm we average its characteristics in Pre- and Post-FAS123R period In all three specifications the dependent variable is
the change of average RepurchaseTotal assets from Pre- to Post-FAS123R period The main independent variable varies by model in
Model (1) the Accounting impact rank is the quartile rank of implied option expensetotal assets measured in 2002 (1=lowest 4=highest)
In Model (2) Accounting impact rank=2 (3 4) is an indicator that takes value of one if the firmrsquos Accounting impact rank equals 2 (3 4)
In Model (3) we use an alternative treatment construction following Bakke et al (2015) where Treated is an indicator that takes value of
zero if the firm granted zero option to its CEO in both 2003 and 2004 or the firm began to voluntarily expense option-based pay at fair
value in 2002 or earlier and one otherwise Panel B reports the regressions with the change of Net repurchaseTotal assets as the
dependent variable and the same independent variable as in Panel A Panel C reports the regressions with the change of Adjusted
repurchaseTotal assets as the dependent variable and the same independent variable as in Panel A All models in Panel A B and C have
industry fixed effects and the standard errors are Huber-White heteroscedasticity-consistent standard errors All variables are defined in
Appendix The notation and indicates statistically significant at 10 5 and 1 level respectively
Model (1) Model (2) Model (3)
Yes Yes Yes
Industry Industry Industry
Huber-White Huber-White Huber-White
Dependent variable ΔAvg Net repurchaseTotal assets
1171 1171 1171
0238 0237 0245
Model (1) Model (2) Model (3)
Yes Yes Yes
Industry Industry Industry
Huber-White Huber-White Huber-White
Dependent variable ΔAvg Adjusted repurchaseTotal assets
0229 0229 0233
1171 1171 1171
Model (1) Model (2) Model (3)
Yes Yes Yes
Industry Industry Industry
Huber-White Huber-White Huber-White
0111 0112 0114
1168 1168 1168
55
Table 5
Effect of option-based compensation on payout mix
Panel A Two-period first-difference regression with total payout mix
Prediction Coeff t-stat Coeff t-stat Coeff t-stat
Accounting impact rank + 0006 028
Accounting impact rank=2 + 0018 045
Accounting impact rank=3 + -0001 -001
Accounting impact rank=4 + 0043 052
Treated + -0035 -094
Control variables
Fixed effect
Standard error
Adj R-squared
Observations
Panel B Two-period first-difference regression with net payout mix
Prediction Coeff t-stat Coeff t-stat Coeff t-stat
Accounting impact rank + -0002 -008
Accounting impact rank=2 + 0008 016
Accounting impact rank=3 + 0018 034
Accounting impact rank=4 + -0059 -055
Treated + -0050 -101
Control variables
Fixed effect
Standard error
Adj R-squared
Observations
0049 0043 0054
257 257 257
Industry Industry Industry
Huber-White Huber-White Huber-White
Dependent variable ΔAvg Regular dividendNet payout
Model (1) Model (2) Model (3)
Yes Yes Yes
0154 0151 0156
362 362 362
Industry Industry Industry
Huber-White Huber-White Huber-White
This table investigates the causal effect of option-based pay on payout mix for firms using both dividend and repurchase by examining
whether the changes of payout mix around FAS123R vary with its potential accounting impact Panel A reports the results of estimating
three two-period first-differencing models where for each firm we average its characteristics in Pre- and Post-FAS123R period In all three
specifications the dependent variable is the change of average Regular dividendTotal payout from Pre- to Post-FAS123R period The main
independent variable varies by model in Model (1) the Accounting impact rank is the quartile rank of implied option expensetotal assets
measured in 2002 (1=lowest 4=highest) In Model (2) Accounting impact rank=2 (3 4) is an indicator that takes value of one if the firmrsquos
Accounting impact rank equals 2 (3 4) In Model (3) we use an alternative treatment construction following Bakke et al (2015) where
Treated is an indicator that takes value of zero if the firm granted zero option to its CEO in both 2003 and 2004 or the firm began to
voluntarily expense option-based pay at fair value in 2002 or earlier and one otherwise Panel B reports the regressions with the change of
Regular dividendNet payout as the dependent variable and the same independent variables as in Panel A Panel A (Panel B) is based on
observations with nonzero regular dividend and repurchase (net repurchase) in both Pre- and Post-FAS123R period All models in Panel A
and B have industry fixed effects and the standard errors are Huber-White heteroscedasticity-consistent standard errors All variables are
defined in Appendix The notation and indicates statistically significant at 10 5 and 1 level respectively
Yes Yes Yes
Dependent variable ΔAvg Regular dividendTotal payout
Model (1) Model (2) Model (3)

20
Panel E presents the same data as Panel D but based on the definition of lsquotreatmentrsquo and
lsquocontrolrsquo in Bakke et al (2015) Under this definition 997 firms are classified as treatment group
and 177 as control (171 firms are classified as lsquocontrolrsquo because they did not grant options to the
CEO in the Pre period and 6 because they were voluntarily expensing options before 2003)
Interestingly lsquotreatedrsquo firms are equally distributed across the quartiles suggesting significant
variation in the degree of treatment As discussed earlier one benefit of our approach is that it
exploits cross-sectional variation among treatment firms in terms of the likely impact of FAS123R
Also 40 of the control firms (71 out of 177) are in the lowest quartile while 35 ((37+25)177)
are in the top two quartiles reflecting the different focus of the two approaches in terms of
identifying firms less affected by FAS123R20
As for payout and compensation variables Panel E shows that the treated group experiences a
larger increase in repurchases than the control group while the (less pronounced) increase in
dividends is similar across treated and control firms Treated firms experience a 126 decrease in
option pay (from 387 to 261) with a corresponding 94 increase in the weight of restricted
stock grants (from 80 to 174) The figures are similar at the CEO level (because the
classification is based on options grants to the CEO it is useful to report pay figures at both the top
5 executives and the CEO level) Interestingly the control group experiences a pronounced
increase in the weight of option grants in total CEO pay from 10 to 127 as almost half of the
control firms issued options to their CEOs in the Post period (for these firms options as percentage
of total CEO pay increased from 0 to 254 untabulated analysis) While this increased use of
stock options suggests (ex post) that these firms were not concerned with the impact of FAS123R
another possibility is that the lack of use of option compensation for CEOs in 2003 and 2004 was
20 In untabulated analysis we find that 55 of the 171 firms issuing no options to the CEO in the Pre period granted
options to the other top executives (and perhaps to other non-executive employees) thus explaining the relatively high
implied option expense for the control group (10 versus 19 for the treatment group ndash see Panel E)
21
temporary rather than the effect of a permanent policy If these firms were planning to issue
options to the CEO in the Post period the assumption that they were unaffected by FAS123R (and
thus their use as control sample) is questionable21
32 Differential Impact of FAS123R on the Use of Option-Based Compensation
An important building block of our approach is the presumed differential impact of FAS123R
on option-based pay as a function of pre-existing implied option expense22 While Table 1 Panel
D preliminarily supports the validity of this assumption we formally examine it by estimating Eq
(1)
As reported in Table 2 Panel A we find a significant negative association between Accounting
Impact and the change in option-based pay around the adoption of FAS123R In column (1)
where we use the quartile rank of implied option expense the -0044 coefficient implies that
around FAS123R option grants over total pay decline by 44 as we move from the highest
quartile to the next Thus the reduction in top quartile firms is 132 larger than in bottom
quartile firms In column 2 we replace the quartile rank with three indicators for the highest
quartiles (with the bottom quartile collapsed in the intercept) so as to be able to compare directly
top and bottom quartile without imposing the same effect across quartiles The negative and
significant coefficient on the top quartile indicator at -0140 suggests that the reduction in option
grants over total pay is 140 larger for top quartile firms relative to bottom quartile firms
Finally in column 3 we use the indicator for treated firms following Bakke et al (2015) The
21 Panel E also shows an increase in the use of restricted stock in CEO pay packages (from 128 to 182 almost
comparable to the increase among treated firms) The concurrent increase in options and restricted stock suggests
these firms would have increased option pay significantly more had it not been for FAS123R indicating further
caution in classifying them as control group of unaffected firms 22 This is akin to the relevance assumption of instrumental variable if we interpret the implied option expense as an
instrument to the change in option-based pay
22
negative and significant coefficient at -0132 suggests that treated firms experience a 132
larger drop in the weight of option pay relative to control firms
In Panel B we re-estimate Eq (1) using a panel regression with firm- and year-fixed effects
(5653 firm-year observations) where the dependent variable is the the ratio of option grants to
total executive pay The results are virtually identical in terms of significance and magnitude of
the coefficients of interest (the interaction terms between respectively Accounting impact and
Treated and an indicator for the Post period)
Overall Table 2 suggests that high implied option expense and the introduction of FAS123R
together strongly encouraged firms to cut back option-based compensation for executives It also
supports the general validity of the approach in Bakke et al (2015) in identifying firms most
affected by FAS123R notwithstanding the concerns outlined earlier
Our test of Eq (1) focuses on executive stock options For our dividend-protection hypothesis
it is important to establish that the level of implied option expense predicts a change in executive
stock options (rather than only a change in the use of non-executive employee stock options) as we
want to capture the effect of a change in executivesrsquo incentives on payout policy At the same
time our dilution channel hypothesis assumes a change in the use of all (executive and non-
executive employee) stock options Thus in untabulated analyses we repeat the test in Eq (1) by
replacing the dependent variable with the change in the number of options granted to all
employees (scaled by the total number of outstanding shares note for this analysis we can only
use data from 2004 to 2007 because Compustat began reporting data on ESO in 2004) The
coefficient on Accounting Impact and Treated continues to be negative and significant suggesting
that the differential reduction in the use of option compensation as a function of accounting impact
23
occurred for both executive and non-executive employee stock options Indeed Brown and Lee
(2011) report a similar decrease in executive and employee stock options around FAS123R
33 Option-Based Pay and Dividend Payouts
In this section we examine the effect of an exogenous (accounting-induced) change in option
compensation on dividend policy by estimating Equation (2)
Table 3 Panel A presents the results using the change in dividends from Pre to Post as
dependent variable We find no significant association between Accounting Impact (column 1 and
2) or Treated (column 3) and the change in dividends around the adoption of FAS123R This is in
stark contrast with the negative effect of option-based pay on dividends predicted in the literature
and documented in various association studies
One concern with this lack of effect is that perhaps our setting is not powerful enough to detect
it One way to examine this possibility is the following The coefficient on Accounting Impact
rank=4 in column 2 is 0001 and the standard error (SE) is 00009 Assuming the estimated
standard error is correct then for a two-tailed t test the coefficient needs to be greater than 00015
(=SE1645) or 015 to reach the 10 percent significant level In other words if moving from
the bottom to the top quartile (which predicts a 14 differential decline in option based pay as per
Table 2 Panel A) resulted in a 015 increase of the dividendasset ratio our test would be able to
detect a causal effect of option-based pay on dividends Given the unconditional mean of the
dividendasset ratio at 093 an increase of 015 from the Pre to the Post period seems
plausible In fact the average increase from the Pre to the Post period is 016 (Table 1 Panel C)
Thus if an effect was there our test should detect it
24
Panel B presents the results using a panel regression (5653 firm-year observations) with firm-
and year-fixed effects and interaction terms between Accounting Impact (or Treated) and an
indicator for the Post period Our inferences are unchanged
These analyses are based on our full sample which includes both dividend-paying and non-
dividend-paying firms Hence they implicity treat as equal two potentially different decisions to
initiate dividends and to increase dividends For example an increase in the dividend-to-asset
ratio from 05 to 06 will be treated the same as an increase from 00 to 01 even though
the latter represents a critical dividend initiation decision23 To address this following Chetty and
Saez (2005) we separately examine how FAS123R impacts the intensity of dividend changes (for
the subset of payers) and the likelihood of dividend initiations (for the subset of non-payers)
331 Option-Based Pay and Dividend Payouts Intensity of Dividend Changes
In the first row of Panel C we repeat the analysis in Panel A for the sub-sample of 572 payers
defined as firms with positive DPS in 2003 andor 2004 Note that we report only the coefficients
of interest for parsimony In the second row we replace the dependent variable with the
percentage change in DPS DPS is the choice variable for managers (Brav et al 2005 Baker and
Wurgler 2016) and thus our preferred measure to capture changes in dividend policy To account
for skewness in this variable (Khale 2002) in the third fourth and fifth rows we use indicator
variables to denote whether the change in DPS surpasses a threshold respectively 20 40 and
60 The proportion of firms that surpass these thresholds are 59 44 and 33 respectively24
23 Initiating dividends is a critical decision for boards given the pre-commitment value that investors attach to this
decision and the strong negative market reaction when firms eliminate or reduce dividends (Brav et al 2005) For
executives trying to maximize the value of their own stock options (dividend-protection argument) the ability to
influence a dividend initiation decision is likely lower than the ability to influence a dividend increase decision 24 Although in the third fourth and fifth rows our dependent variable is a binary variable we use a linear model (OLS)
instead of a probit or logit nonlinear model The reason is that estimating fixed effects in binary response models with
panel data can cause the incidental parameters problem The coefficient estimates can be biased when the panel data
25
Across all of these specifications we find no association between Accounting Impact or Treated
and the intensity of dividend changes Thus it does not appear that an exogenous reduction in
option-based pay caused dividend-paying firms to increase dividends
In Panel D we perform four robustness tests For parsimony we show only the coefficients of
interest and only the cases where the dependent variable is an indicator denoting a greater than
40 increase in DPS The results are similar for the other four ldquointensityrdquo dependent variables
reported in Panel C
In the first row we exclude firms that began to voluntarily expense options in 2003 or 2004
(84 firms of which 68 are dividend payers) FASB added accounting for stock-based
compensation to its agenda in March 2003 and issued an Exposure Draft proposing the expensing
of stock options at fair value in March 2004 In anticipation a number of firms began to
voluntarily expense stock options in 2003 and 2004 (Aboody et al 2004) If these firms reduced
option grants and as a result increased dividends during the Pre period then their inclusion may
reduce the power of our tests and thus our ability to detect the hypothesized relation25
In a similar spirit in the second row we exclude firms in the top decile in terms of reduction in
the ratio of option grants to total pay for the top 5 executives between 2002 (the year prior to the
Pre-period) and 2004 (the end of the Pre-period) This encompasses 113 firms of which 55 are
dividend payers If these firms reduced option grants in anticipation of FAS123R and as a result
increased dividends during the Pre period their inclusion may reduce our ability to detect the
hypothesized relation
has a large number of observations but a short time series Examples of studies making a similar choice are Puri
Rocholl and Steffen (2011) and Chu and Ma (2015) 25 This is unlikely to be a serious concern as previous studies suggest that voluntary expensers made limited use of
stock options (Aboody et al 2004) In fact in our sample 79 of these firms are in the bottom two quartiles of
implied option expense (untabulated) Nonetheless we present this test for robustness
26
In the third row we exclude firms that accelerated the vesting of options before FAS123R
became effective in order to avoid recognizing an expense for the unvested portion of these
options (Choudhary et al 2009 Balsam Reitenga and Yin 2008) This encompasses 196 firms of
which 54 are dividend payers If accelerating vesting was used to reduce the impact of FAS123R
the inclusion of these firms may reduce the power of our tests26
In the fourth row we deal with the concern that if firms target a fixed dividend to net income
ratio (Lintner 1956) and do so without adjusting for changes in accounting standards then by
decreasing net income (via option expense) the accounting change would mechanically cause a
reduction in dividends This would potentially offset and confound the increase predicted under
the dividend-protection and dilution hypotheses This seems unlikely for two reasons First firms
are notoriously reluctant to cut dividends (Brav et al 2005) Hence it seems unlikely that they
would reduce dividends in response to a decline in net income with no economic or cash flow
implications (ie re-classification of an expense from the footnotes to the income statement)
Second firms today set dividends in terms of dividend per share rather than by targeting a net
income-based payout ratio (Brav et al (2005)) As noted by Skinner (2008) over the last few
decades as earnings have become more variable the relation between earnings and dividends has
become weaker with dividend payments increasing smoothly and largely independent of the
variation in earnings Nevertheless in the fourth row we exclude the 66 dividend-paying firms that
26 These firms explicitly stated that they accelerated the vesting of stock options to avoid the accounting charge
(Choudhary et al 2009) In fact 72 are classified in the top two quartiles of implied option expense (untabulated)
Thus we would have predicted these firms to experience a significant decline in option pay To the extent that this
decline did not materialize because they minimized the impact of FAS123R by accelerating vesting the ability of
Accounting Impact to predict the reduction in option pay and thus its usefulness in examining changes in dividends
around FAS123R may be reduced The list of firms accelerating vesting was kindly provided by Jack Ciesielsky of
The Analystsrsquo Accounting Observer
27
had a similar payout ratio in 2003 and 2004 as a proxy for firms with a target net income-based
payout ratio in the Pre period27
As shown in Panel D even after excluding these subsets of firms we continue to find no
association between Accounting Impact or Treated and changes in dividends for dividend-paying
firms This is inconsistent with a causal influence of option compensation on dividend policy
Another concern is that by reducing net income and thus retained earnings FAS123R
may have pushed some firms closer to violating dividend covenants in debt contracts and
thus prevented them from increasing dividends This would bias our study against finding a
causal effect of option-based pay on dividends However this does not appear to be a
significant concern for three reasons First the recognition of an option expense does not
imply a decline in net income In fact more than 70 (75) of the full sample firms
(dividend payers) experienced an increase in net income before extraordinary items from
2004 to 2005 (the percentages are similar across the four quartiles of implied option
expense) Second dividend covenants are less common among dividend-paying firms
(Nikolaev 2010) Third most loan contracts in recent years give parties the option to
ldquofreezerdquo GAAP when facing a mandatory change in accounting principles (Christensen and
Nikolaev 2009) Firms expecting an adverse impact of FAS123R on their dividend covenants
would likely exercise this option (particularly given the non-cash nature of option-based
expense) Nonetheless to alleviate this concern we perform three additional analyses
(untabulated) (i) we repeat the tests in Panel C after excluding firms with a drop in net
income between 2004 and 2005 (ie firms that perhaps faced some covenant-related
27 We define a ldquosimilarrdquo payout to be an absolute change in payout ratio of less than 1 from 2003 to 2004 Among
these 66 firms only 39 continued to have a similar payout ratio in 2005 We also try an alternative definition where
a firm is classified as likely to be using a net income-based target payout ratio if the absolute percentage change in the
ratio from 2003 to 2004 is less than 10 (100 firms) Our inferences are unchanged
28
constrains to their payout policy as a result of FAS123R) (ii) we explicitly control for net
income and retained earnings in the regression (as in Skinner 2008) (iii) we repeat the tests
in Panel C for dividend payers with dividendsasset ratio above the sample median on the
basis that dividend covenants are less frequent among firms paying large dividends (Jung
Lee and Yang 2016) Our inferences are unchanged
332 Option-Based Pay and Dividend Payouts Dividend Initiations
In this section we examine whether the accounting-driven change in option pay affected
dividend initiations among non-payers We cannot employ the difference-in-difference approach
adopted so far by definition the same firm cannot initiate dividends in both periods However we
can provide suggestive evidence as follows First we take all firms that did not pay dividends in
2002 and group them into quartiles based on 2002 implied option expense For each quartile we
find the number of firms initiating dividends in 2003 and 2004 (the Pre period) Next we take all
firms that did not pay dividends in 2004 group them into quartiles based on 2002 implied option
expense and for each quartile find the number of firms initiating dividends in 2005 and 2006 (the
Post period) We do not include 2007 so as to have the same number of years in both periods and
make the cumulative initiation rates comparable
The left portion of Panel E reports the results of this exercise There is a general decrease in
the dividend initiation rate from the Pre to the Post period This holds both in the full sample of
non-payers (from 129 to 79) and across all quartiles This decrease may reflect a temporary
spike in 2003 and 2004 in response to the 2003 dividend tax cut documented in Chetty and Saez
(2005) It is noteworthy that initiation rates in both periods are lower among firms with higher
implied option expense This is consistent with option-heavy firms being mostly high-growth
firms less inclined to pay dividends More relevant to our research question if the lower use of
29
option compensation increased the propensity to pay dividends we would expect to see a relative
increase (ie a lower decrease) in dividend initiations among firms with the highest accounting
impact Instead the rate does not differ depending on the accounting impact There is
approximatley a 5 decline in initiation rate in each quartile In the right portion of Panel E we
examine similar data for dividend terminations While the results should be interpreted with
caution due to their rarity firms with higher accounting impact do not experience a greater decline
in termination rates Our inferences in Panel E are similar when we compared treated and control
firms following Bakke et al (2015) (untabulated)
Even after taking into account the different nature of decisions for dividend paying and non-
dividend-paying firms we fail to find evidence of a causal influence of option-based compensation
on dividend policy This finding is in contrast to the associations documented in earlier studies It
is even more remarkable as most firms replaced stock options with restricted stock which are
generally dividend-protected and should provide further incentive to increase dividends28
34 Option-Based Pay and Repurchases
In this section we examine the effect of an exogenous (accounting-induced) change in option
compensation on repurchases by estimating Equation (2)
Table 4 Panel A presents the results using the change in repurchases (scaled by total assets)
from Pre to Post as a dependent variable If the use of option-based pay had a positive effect on
firmsrsquo propensity to engage in repurchases as posited by the dividend-protection and dilution
hypotheses we should find a negative association between Accounting Impact or Treated and
repurchases Firms with a higher (accounting-driven) reduction in option-based pay should reduce
28 In a sample of SampP 500 firms between 2000 and 2009 Zhang (2013) reports that 80 of the firms granting
restricted stocks offer dividend protection In that sense the FAS123R-induced shift from stock options to restricted
stock may be characterized as a ldquoshockrdquo to dividend protection in unearned equity pay Accordingly our results cast
doubt on the causal interpretation of the positive association between dividend protection and dividend payouts
documented in prior studies (Zhang 2013 Burns et al 2015 Minnick and Rosenthal 2015)
30
the use of repurchases either because they are shifting toward a greater use of dividends andor
because they have a lower need to offset the dilutive effects of stock options However we find no
significant association between Accounting Impact (columns 1 and 2) and the change in
repurchases around the adoption of FAS123R When we use the Treated indicator (column 3) we
find a significant positive association rather than a negative one In Panel B we repeat the analysis
using net repurchases (ie repurchases after removing the effect of share issuances) following
Fama and French (2001) and Skinner (2008) Our inferences are unchanged29
This test is subject to two important caveats The first is we may not detect a decline in
repurchases because in the Post period firms need to offset the exercise of options that were
granted during the Pre period That is a post-FAS123R reduction in grants may not (yet) translate
into a reduction in exercises during the Post period which reduces our ability to test the dilution
hypothesis (ie that firms repurchase shares to offset exercises)30 However we can examine a
variation of this hypothesis where firms use repurchases to manage the effect of unexercised
options on diluted EPS (Bens et al 2003) To do so in Panel C we use a measure of adjusted
repurchases where we subtract our estimate of repurchases undertaken to offset the exercise of
ESO31 We effectively test whether firms experiencing an accounting-induced decrease in option
grants engage in less repurchases (net of exercise-driven repurchases) because their need to
manage the effect of unexercised options on diluted EPS is lower However the coefficient on
the variables of interest is either insignificant or positive inconsistent with the hypothesis
29 In the case of repurchases we do not examine separately ldquoinitiationsrdquo and ldquointensityrdquo as we do for dividends
because initiation is not clearly defined for repurchases Unlike dividends the occurrence of a repurchase in a given
year (or the lack thereof) cannot be used to infer a general policy due to the more discretionary nature of the timing of
repurchases 30 To capture the effect of lower option-based compensation on option exercises and thus on repurchases we would
ideally extend the Post period beyond 2007 However as noted by Floyd et al (2015) repurchases declined
dramatically after 2007 because of the financial crisis making it difficult to detect the effect of any other factor 31 As upper bound estimate of exercise-driven repurchases we multiply the number of ESO exercised during the year
times the average stock price during the year Since the number of ESO exercised is available in Compustat starting in
2004 Panel C is based on observations from 2004 to 2007
31
A second important caveat is that most firms replaced stock options with restricted stock
(Table 2 Panel C) Unvested restricted stock is excluded from the denominator in the computation
of basic EPS (once vested it is included) However it is included in the denominator of diluted
EPS using the treasury stock method similar to stock options Given the complexity of this
method without access to all details of restricted stock grants and option grants it is difficult to
determine whether the switch from stock options to restricted stock decreased the need for
dilution-driven repurchases as our test implicitly assumes Hence it is possible that we do not find
a decrease in repurchases because a reduced need to offset the dilutive effect of stock options was
neutralized by an increased need to offset the dilutive effect of restricted stock
Subject to the above caveats the evidence in Table 4 is not consistent with a positive causal
relation between the use of option-based pay and repurchases More precisely it suggests that
option-driven dilution concerns do not have a first-order effect on the magnitude of repurchases
even though they may play a role in the repurchase decision Hence our result is not necessarily
in conflict with the evidence in Brav et al (2005) where two-thirds of the surveyed financial
executives state that offsetting the dilutionary effect of stock option plans or other stock
programs is an important factor to their repurchase decisions
35 Option-Based Pay and Payout Composition
As an alternative to examining dividends and repurchases separately we also look at the
payout composition the change in the DividendsTotal Payout ratio from the Pre to the Post period
where Total Payout is the sum of dividends and repurchases As noted earlier we focus on the
subsample of firms with both dividends and repurchases in both Pre and Post periods so as to
capture the change in payout mix by firms routinely using both vehicles to return cash to
shareholders If the use of option-based pay causes firms to substitute repurchases for dividends
32
we should find a positive association between Accounting Impact or Treated and the payout mix
defined as DividendsTotal Payout ratio Firms with a higher accounting-driven reduction in
option-based pay should have an increase (decrease) in the relative weight of dividends
(repurchases) to the total payout However as reported in Table 5 Panel A we fail to find a
significant association between Accounting Impact (column 1 and 2) or Treated (column 3) and
the change in payout mix The results are similar when we use Net Payout (dividends plus net
repurchases) instead of Total Payout in computing the payout mix (Panel B)
Overall the combined evidence in Tables 3-5 does not support the hypothesis that option-
based compensation has negative (positive) effect on dividends (repurchases) or that it causes
firms to replace dividends with repurchases
4 Conclusion
Prior literature has documented robust associations between option-based compensation and
payout policy yet it remains unclear whether this association reflcts a causal influence We
investigate the causal effect of option-based compensation on payout policy using the adoption of
FAS123R which resulted in a significant decrease in option grants making it a plausible
exogenous shock to the use of option-based pay To overcome the challenge of no control group
we exploit the fact that firms responded differently depending on the firm-specific accounting
impact as measured by the implied option expense disclosed in the footnotes prior to FAS123R
Firms with larger expected accounting impact curtailed option-based compensation much more
aggressively than firms with lower impact Using a sample of SampP 1500 firms we find no
evidence that firms with a larger accounting-induced decline in option compensation increased
dividends reduced repurchases or changed their payout composition contrary to the widely held
belief that option-based pay has a causal influence on payout policy
33
Appendix Variable Definitions and Data Sources
Accounting Impact Variables
Accounting impact Implied option expense (Compustat XINTOPT) divided by total assets
(Compustat AT) This variable is measured at fiscal year 2002 and is time-invariant
Accounting impact rank The quartile rank of Accounting impact (1=lowest 4=highest)
Payout Variables
Regular dividendTotal assets The numerator is total regular cash dividends in the fiscal year
from the distribution dataset in CRSP Regular cash dividends are identified by the distribution
codes 1212 1222 1232 or 1242 The denominator is one-year lagged total assets (Compustat
AT)
DPS Dividend per share (Compustat DVPSX_F)
DPS pct change The percentage change of average DPS from Pre- to Post-FAS123R period
DPS pct change gtX indicator A dummy variable that equals one if DPC pct change is greater
than X and zero otherwise
RepurchaseTotal assets The numerator is the repurchase of common equity which equals total
repurchase (Compustat PRSTK) minus the change in preferred stock redemption value
(Compustat PSTKRV) The denominator is one-year lagged total assets (Compustat AT)
Net repurchaseTotal assets Net repurchase removes the effect of share issuances The
construction follows Fama and French (2001) and Skinner (2008) if the firm uses the treasury
stock method for repurchase net repurchase equals the increase in common treasury stock
(Compustat TSTKC) if the firm uses the retirement method (when common treasury stock is zero
in the current and prior year) net repurchase equals total repurchases minus stock issuance
(Compustat SSTK) and change in preferred stock redemption value (Compustat PSTKRV)
When the above measures give negative value net repurchase is set to zero
Adjusted repurchaseTotal assets Adjusted repurchase removes from total repurchase the potential
effect of repurchasing exercised options This variable equals total repurchase of common stocks
minus the product between the number of options exercised (Compustat OPTEXD) and average
stock price during the year When the above measure gives negative value adjusted repurchase is
set to zero Since the number of options exercised is not available before 2003 we drop
observations in 2003 when we use this variable
34
Total payoutTotal assets the sum of Regular dividendTotal assets and RepurchaseTotal assets
Regular dividendTotal payout regular cash dividend divided by the sum of regular cash dividend
and repurchase from common equity In the two-period analysis (Pre- vs Post-FAS123R) we
separately sum the numerator and the denominator for each firm-period and then calculate the ratio
Regular dividendNet payout regular dividend divided by the sum of regular dividend and net
repurchase In the two-period analysis (Pre- vs Post-FAS123R) we separately sum the numerator
and the denominator for each firm-period and then calculate the ratio
Compensation Variables
Salary_$ Average salary (Execucomp SALARY) of the top 5 highest paid executives in $1000
Salary_ Average salary (Execucomp SALARY) divided by average total pay (Execucomp
TDC1) of the top 5 highest paid executives
Bonus_$ Average bonus (Execucomp BONUS) of the top 5 highest paid executives in $1000
Due to a data format change we add non-equity plan-based awards (Execucomp
NON_EQ_TARG) to this measure after 2006
Bonus_ Bonus_$ divided by average total pay (Execucomp TDC1) of the top 5 highest paid
executives
Option grant_$ Average option grant value (Execucomp OPTION_AWARDS_BLK_VALUE or
OPTION_AWARDS_FV) of the top 5 highest paid executives in $1000 Due to a data format
change we use OPTION_AWARDS_FV for this measure after 2006
Option grant_ Option grant_$ divided by average total pay (Execucomp TDC1) of the top 5
highest paid executives
Restricted stock grant_$ Average restricted stock grant value (Execucomp RSTKGRNT or
STOCK_AWARDS_FV) of the top 5 highest paid executives in $1000 Due to data format
change we use STOCK_AWARDS_FV for this measure after 2006
Restricted stock grant_ Restricted stock grant_$ divided by average total pay (Execucomp
TDC1) of the top 5 highest paid executives
Total pay_$ Average total pay (Execucomp TDC1) of the top 5 highest paid executives in $1000
35
Other Characteristics
Size The book value of total assets (Compustat AT) minus the book value of common equity
(Compustat CEQ) plus the market value of common equity from CRSP in $M
Log(size) the natural logarithm of size
Book-to-market the book value of common equity dividend by its market value
Leverage long term debt plus short term debt (Compustat DLTT + DLC) divided by total assets
Asset tangibility tangible assets (Compustat AT - INTAN) divided by total assets
Free cash flow Operating cash flow (Compustat OANCF) minus capital expenditure (Compustat
CAPX) then divided by lagged total assets
Cash holding Cash and short-term investments (Compustat CHE) divided by total assets
ROA volatility the standard deviation of returns on assets (operating income before tax divided by
lagged total assets) in the past five fiscal years
Institutional ownership the number of shares held by institutional investors divided by the number
of shares outstanding from Thomson Reuters Institutional Holdings database
Sales growth the growth rate of sales (Compustat SALE) from the prior year
Past stock return annual stock return from the prior year
Loss indicator a dummy variable taking value of one if the current net income is negative and
zero otherwise
36
References
Aboody David 1996 Market Valuation of Employee Stock Options Journal of Accounting and
Economics 22 357-391
Aboody David Barth Mary E and Ron Kasznik 2004 Firms Voluntary Recognition of Stock-
Based Compensation Expense Journal of Accounting Research 42 123ndash150
Aboody David and Ron Kasznik 2008 Executive stock-based compensation and firmsrsquo cash
payout the role of shareholdersrsquo tax-related payout preferences Review of Accounting Studies
13 216ndash251
Anantharaman Divya and Yong Gyu Lee 2014 Managerial risk taking incentives and corporate
pension policy Journal of Financial Economics 111 328ndash351
Baker Malcolm and Jeffrey Wurgler 2004 A catering theory of dividends Journal of Finance
59 1125-1165
Baker Malcolm and Jeffrey Wurgler 2016 Dividends as reference points a behavioral signaling
approach Review of Financial Studies 29 697-738
Bakke Tor-Erik Hamed Mahmudi Chitru Fernando and Jesus Salas 2015 The causal effect of
option pay on corporate risk management Journal of Financial Economics forthcoming
Balsam Steven Austin Reitenga and Jennifer Yin 2008 Option acceleration in response to SFAS
No 123 (R) Accounting Horizons 22 23-45
Bens Daniel and Steven Monahan 2008 Altering Investment Decisions to Manage Financial
Reporting Outcomes Asset-Backed Commercial Paper Conduits and FIN 46 Journal of
Accounting Research 46 1017-1055
Bens Daniel A Venky Nagar Douglas J Skinner and MH Franco Wong 2003 Employee stock
options eps dilution and stock repurchases Journal of Accounting and Economics 36 51ndash90
Bertrand Marianne Esther Duflo and Sendhil Mullainathan 2004 How much should we trust
differences-in-differences estimates The Quarterly Journal of Economics 119 249ndash275
Blouin Jennifer L Jana S Raedy and Douglas A Shackelford 2011 Dividends Share
Repurchases and Tax Clienteles Evidence from the 2003 Reductions in Shareholder Taxes
The Accounting Review 86 887-914
Brav Alon John R Graham Campbell R Harvey and Roni Michaely 2005 Payout policy in the
21st century Journal of Financial Economics 77 483ndash527
Brown Lawrence D and Yen-Jung Lee 2011 Changes in Option-Based Compensation Around
the Issuance of SFAS123R Journal of Business Finance amp Accounting 38 1053ndash109
37
Brown Jeffrey R Nellie Liang and Scott Weisbenner 2007 Executive financial incentives and
payout policy Firm responses to the 2003 dividend tax cut Journal of Finance 62 1935ndash
1965
Burns Natasha Brian McTier and Kristina Minnick 2015 Equity-incentive compensation and
payout policy in Europe Journal of Corporate Finance 30 85-97
Carter Mary Ellen and Luann J Lynch 2003 The Consequences of the FASBrsquos 1998 Proposal on
Accounting for Stock Option Repricing Journal of Accounting and Economics 35 51-72
Carter Mary Ellen Luann J Lynch and Irem Tuna 2007 The role of accounting in the design of
CEO equity compensation The Accounting Review 82 327ndash357
Chava Sudheer and Amiyatosh Purnanandam 2010 CEOs versus CFOs Incentives and
corporate policies Journal of Financial Economics 97 263ndash278
Chetty Raj and Emmanuel Saez 2005 Dividend taxes and corporate behavior Evidence from the
2003 dividend tax cut The Quarterly Journal of Economics 120 791ndash833
Choudhary Preeti Shivaram Rajgopal and Mohan Venkatachalam 2009 Accelerated vesting of
employee stock options in anticipation of FAS123R Journal of Accounting Research 47 105ndash
146
Christensen Hans B and Valeri Nikolaev 2009 Contracting on Mandatory Changes to GAAP
New Practice and Its Determinants Working Paper University of Chicago
Chu Yongqiang and Tao Ma 2015 How does management compensation affect bank risk taking
evidence from FAS 123R University of South Carolina Working Paper
Cuny Charles J Gerald S Martin and John J Puthenpurackal 2009 Stock options and total
payout Journal of Financial and Quantitative Analysis 44 391ndash410
DeAngelo Harry Linda DeAngelo and Douglas J Skinner 2000 Special Dividends and the
Evolution of Dividend Signaling Journal of Financial Economics 57 309-354
Dechow Patricia M Amy P Hutton and Richard G Sloan 1996 Economic consequences of
accounting for stock-based compensation Journal of Accounting Research 34 1ndash20
Edgerton J 2013 Four facts about dividend payouts and the 2003 tax cut International Tax and
Public Finance 20 769-784
Edmans Alex and Xavier Gabaix 2015 Executive compensation a modern primer Journal of
Economic Literature forthcoming
38
Fama Eugene F and Kenneth R French 2001 Disappearing dividends changing firm
characteristics or lower propensity to pay Journal of Financial Economics 60 3ndash43
Farre-Mensa Joan Roni Michaely and Martin C Schmalz 2014 Payout policy Annual Review
of Financial Economics 6 75ndash134
Fenn George W and Nellie Liang 2001 Corporate payout policy and managerial stock
incentives Journal of Financial Economics 60 45ndash72
Ferri Fabrizio and Tatiana Sandino 2009 The impact of shareholder activism on financial
reporting and compensation the case of employee stock options expensing The Accounting
Review 84 433ndash466
Floyd Eric Nan Li and Douglas J Skinner 2015 Payout policy through the financial crisis the
growth of repurchases and the resilience of dividends Journal of Financial Economics 118
299-316
Frydman Carola and Dirk Jenter 2010 CEO compensation Annual Review of Financial
Economics 2 75-102
Gipper Brandon 2015 Assessing the Effects of Disclosing Management Compensation Working
Paper University of Chicago
Gormley Todd David Matsa and Todd Milbourn 2013 CEO compensation and corporate risk
evidence from a natural experiment Journal of Accounting and Economics 56 79-101
Graham John Michelle Hanlon and Terry Shevlin 2011 Real effects of accounting rules
evidence from multinational firmsrsquo investment locations and profit repatriation decisions
Journal of Accounting Research 49 137-185
Graham John Campbell Harvey and Shiva Rajgopal 2005 The Economic implications of
corporate financial reporting Journal of Accounting and Economics 40 3-73
Greenspan Alan 2002 Testimony of Alan Greenspan before the Committee on Banking
Housing and Urban Affairs US Senate July 16 Washington DC Government Printing
Office
Grullon Gustavo and Roni Michaely 2002 Dividends Share Repurchases and the Substitution
Hypothesis Journal of Finance 57 1649-1684
Hail Luzi Ahmed Tahoun and Clare Wang 2014 Dividend Payouts and Information Shocks
Journal of Accounting Research 52 403-456
Hall Brian J and Kevin J Murphy 2002 Stock options for undiversified executives Journal of
Accounting amp Economics 33 3-42
39
Hall Brian J and Kevin J Murphy 2003 The trouble with stock options Journal of Economic
Perspectives 17 49ndash70
Hanlon Michelle and Jeffrey L Hoopes 2014 What do firms do when dividend tax rates change
An examination of alternative payout responses Journal of Financial Economics 114 105-
124
Hayes Rachel M Michael Lemmon and Mingming Qiu 2012 Stock options and managerial
incentives for risk taking Evidence from FAS123R Journal of Financial Economics 105
174ndash190
Heron Randall A Erik Lie 2007 Does backdating explain the stock price pattern around
executive stock option grants Journal of Financial Economics 83 271-295
Hribar Paul Nicole Thorne Jenkins and W Bruce Johnson 2006 Stock repurchases as an
earnings management device Journal of Accounting and Economics 41 3ndash27
Jensen Michael C 1986 Agency cost of free cash flow corporate finance and takeovers
American Economic Review 76 323-329
Jolls Christine 1998 Stock repurchases and incentive compensation NBER Working Paper No
w6467
Jung Boochun Woo-Jong Lee and Yanhua Sunny Yang 2016 The Impact of Dividend
Covenants on Investment and Operating Performance Journal of Business Finance amp
Accounting 43 414ndash447
Kahle Kathleen M 2002 When a buyback isnrsquot a buyback open market repurchases and
employee options Journal of Financial Economics 63 235ndash261
Lambert Richard A William N Lanen and David F Larcker 1989 Executive stock option plans
and corporate dividend policy Journal of Financial and Quantitative Analysis 24 409ndash425
Lintner John 1956 Distribution of incomes of corporations among dividends retained earnings
and taxes The American Economic Review 46 97-113
Low Angie 2009 Managerial risk-taking behavior and equity-based compensation Journal of
Financial Economics 92 470-490
Miller Merton H and Franco Modigliani 1961 Dividend policy growth and the valuation of
shares The Journal of Business 34 411ndash433
Minnick Kristina and Leonard Rosenthal 2015 Stealth compensation Do CEOs increase their
pay by influencing dividend policy Journal of Corporate Finance 25 435-454
40
Murphy Kevin J 1999 Executive compensation In O Ashenfelter and D Card (eds) North
Holland Handbook of Labor Economics Amsterdam Elsevier Science BV
Murphy Kevin J 2013 Executive compensation Where we are and how we got there Handbook
of the Economics of Finance Elsevier Science North Holland 211-356
Nikolaev Valeri 2010 Debt Covenants and Accounting Conservatism Journal of Accounting
Research 48 143-176
Puri Manju Joumlrg Rocholl and Sascha Steffen 2011 Global retail lending in the aftermath of the
US financial crisis Distinguishing between supply and demand effects Journal of Financial
Economics 100 556-578
Shue Kelly and Richard R Townsend 2014 Swinging for the fences Executive reactions to
quasi-random option grants Working Paper University of Chicago
Skinner Douglas J 2008 The evolving relation between earnings dividends and stock
repurchases Journal of Financial Economics 87 582-609
Weisbenner Scott J 2000 Corporate share repurchases in the 1990s What role do stock options
play FEDS Working Paper No 2000-29
Zhang Dan 2013 CEO dividend protection Working Paper BI Norwegian Business School
41
Figure 1 Trends of dividends and repurchases from 2003 to 2007 Panel A plots the average
Regular DividendTotal Assets of firms in the highest and lowest quartiles of Accounting Impact
measured in 2002 Panel B shows the average Total RepurchaseTotal Assets of firms in the
highest and lowest quartiles of Accounting Impact measured in 2002
Panel A Trends of regular dividends
Panel B Trends of total repurchases
00
05
10
15
20
2003 2004 2005 2006 2007
Regular DividendTotal Assets
Lowest Acc Impact
Highest Acc Impact
Pre Post
00
20
40
60
80
100
2003 2004 2005 2006 2007
Total Repurchase Total Assets
Lowest Acc Impact
Highest Acc Impact
Pre Post
42
Table 1
Summary Statistics
Panel A Firm characteristics - full sample
N Mean Std dev 25 pctl Median 75 pctl
Accounting impact (2002) 1176 173 366 022 052 163
Payout variablesRegular dividendTotal assets 5653 093 148 000 000 142
RepurchaseTotal assets 5653 394 710 000 035 500
Total payoutTotal assets 5653 488 748 000 175 666
Regular dividendTotal payout 4091 3874 4057 000 2237 8833
Level of executive compensation (in $1000)
Salary_$ 5653 450 190 314 409 544
Bonus_$ 5653 476 616 122 295 586
Option grant_$ 5653 791 1137 62 384 1002
Restricted stock grant_$ 5653 458 866 0 58 518
Total pay_$ 5653 2481 2475 890 1647 3074
Percentage of executive compensation
Salary_ 5653 296 183 165 251 382
Bonus_ 5653 197 148 97 177 268
Option grant_ 5653 283 235 67 256 445
Restricted stock grant_ 5653 141 180 00 41 249
Control variables
Size ($M) 5653 11086 27294 1017 2459 8117
Log(size) 5653 7985 1565 6925 7808 9002
Book-to-market 5653 0445 0287 0251 0388 0578
Leverage 5653 0202 0172 0038 0187 0309
Asset tangibility 5653 0806 0184 0691 0853 0965
Free cash flow 5653 0059 0091 0013 0059 0108
Cash holding 5653 0166 0172 0034 0100 0247
ROA volatility 5653 0056 0056 0021 0038 0070
Institutional ownership 5653 0753 0202 0639 0795 0910
Sales growth 5653 0121 0189 0028 0096 0183
Past stock return 5653 0094 0183 -0012 0094 0199
Loss indicator 5653 0164 0370 0000 0000 0000
This table presents summary statistics Panel A shows the descriptive statistics of payout variables compensation
variables and other firm characteristics for the full sample Accounting impact is the implied option expense
measured at fiscal year 2002 All other variables are measured at firm-year level from fiscal year 2003 to 2007
resulting in 5653 firm-year observations (except for Regular dividendTotal Payout which can be measured only
for the 4901 firm-year observations with Total payout greater than zero) Panel B shows the pairwise correlations
between main variables at firm-year level Panel C compares payout variables compensation variables and other
firm characteristics before and after FAS123R The Pre-FAS123R period consists of fiscal year 2003 and 2004
the Post-FAS123R period covers fiscal year 2005-2007 Panel D compares the trends of payout and compensation
variables around FAS123R across four quartile groups ranked by 2002 accounting impact Panel E compares the
trends of payout and compensation variables around FAS123R between the treated and control group under the
alternative treatment definition in Bakke et al (2015) (see Section 22) All variables are defined in Appendix The
notation and in Panel C indicates statistically significant at 10 5 and 1 level in T-tests for equal
means respectively
43
Pa
nel
B
Pea
rso
n c
orr
ela
tio
ns
Reg div
Repurchase
Total payout
Salary_
Bonus_
Option_
RS_
Log(size)
BM
Leverage
Tangibility
FCF
Cash holdingROA vol
Inst own
Sales growth
Past ret
urn
Loss
Reg
div
10
0
Repurc
hase
01
610
0
Tota
l payout
03
509
810
0
Sala
ry_
-0
10
-01
8-0
19
10
0
Bonus_
00
700
100
3-0
01
10
0
Option_
-0
10
00
900
6-0
41
-03
510
0
RS
_
01
000
901
0-0
32
-01
1-0
40
10
0
Log(s
ize)
03
101
802
3-0
56
01
101
202
210
0
BM
-02
1-0
28
-03
103
0-0
03
-02
000
0-0
33
10
0
Levera
ge
-00
1-0
08
-00
8-0
05
00
6-0
11
00
801
9-0
03
10
0
Tangib
ility
00
200
100
101
200
1-0
05
-00
6-0
12
-00
4-0
18
10
0
FC
F02
203
703
9-0
20
00
901
1-0
01
02
4-0
32
-02
1-0
16
10
0
Cash
hold
ing
-01
301
000
700
2-0
14
02
2-0
10
-02
3-0
16
-03
502
901
210
0
RO
A v
ol
-01
5-0
04
-00
700
4-0
11
01
9-0
11
-02
3-0
08
-01
101
2-0
02
03
910
0
Inst
ow
n
-00
901
401
1-0
17
00
200
701
200
7-0
01
00
3-0
08
01
4-0
06
-01
110
0
Sale
s gro
wth
-00
8-0
04
-00
6-0
15
00
501
0-0
02
00
7-0
16
-00
3-0
08
01
300
201
400
410
0
Past
retu
rn00
901
301
4-0
18
01
5-0
01
00
301
6-0
29
-01
000
102
7-0
14
-01
001
602
710
0
Loss
-02
0-0
19
-02
201
8-0
18
00
4-0
05
-02
601
901
300
6-0
41
01
702
3-0
16
-01
8-0
40
10
0
44
Panel C Firm characteristics - before and after FAS123R
Pre FAS 123R Post FAS 123R Difference
Payout variables
Regular dividendTotal assets 083 099 016
RepurchaseTotal assets 245 490 245
Total payoutTotal assets 328 589 261
Regular dividendTotal payout 3914 2790 -1124
Level of executive compensation (in $1000)
Salary_$ 426 463 37
Bonus_$ 418 505 87
Option grant_$ 896 707 -191
Restricted stock grant_$ 269 574 305
Total pay_$ 2263 2584 321
Percentage of executive compensation
Salary_ 305 293 -12
Bonus_ 186 204 18
Option grant_ 343 240 -103
Restricted stock grant_ 87 176 89
Control variables
Size ($M) 9671 11631 1960
Log(size) 7860 8035 0175
Book-to-market 0437 0453 0016
Leverage 0201 0203 0002
Asset tangibility 0822 0793 -0029
Free cash flow 0061 0057 -0004
Cash holding 0175 0159 -0016
ROA volatility 0067 0048 -0019
Institutional ownership 0712 0781 0069
Sales growth 0137 0108 -0029
Past stock return 0080 0101 0021
Loss indicator 0173 0159 -0014
45
Pa
nel
D
Fir
m c
ha
racte
rist
ics
by q
ua
rtil
e o
f a
cco
un
tin
g i
mp
act
- b
efo
re a
nd
aft
er
FA
S1
23
R
Accounting im
pact
(2002)
Num
ber
of
Fir
ms
Pre
Post
Pre
Post
Pre
Post
Pre
Post
Payout
vari
able
s
Regula
r div
idendT
ota
l ass
ets
11
2
12
4
09
4
11
1
09
5
11
3
03
0
04
9
Repurc
hase
Tota
l ass
ets
11
3
26
8
19
2
37
3
32
7
63
1
35
1
68
7
Tota
l payout
Tota
l ass
ets
22
4
39
1
28
5
48
4
42
2
74
4
38
1
73
6
Regula
r div
idendT
ota
l payout
643
7
469
8
474
0
341
1
284
5
195
4
82
5
74
5
Perc
enta
ge o
f executive c
om
pensa
tion
Sala
ry_
337
295
313
287
296
289
276
300
Bonus_
223
226
214
228
172
192
134
169
Option g
rant_
201
167
290
210
373
260
507
325
Rest
ricte
d s
tock g
rant_
116
194
98
180
89
176
43
155
294
294
294
294
1st Q
uart
ile2
nd Q
uart
ile3
rd Q
uart
ile4
th Q
uart
ile
01
2
03
5
09
3
55
1
46
Accounting impact
Number of Firms
By accounting impact quartile
1
2
3
4
Pre Post Pre Post
Payout variables
Regular dividendTotal assets 09 11 08 10
RepurchaseTotal assets 18 31 26 52
Total payoutTotal assets 28 43 34 62
Regular dividendTotal payout 428 357 386 265
Percentage of executive compensation
Salary_ 435 364 282 280
Bonus_ 226 214 179 202
Option grant_ 92 125 387 261
Restricted stock grant_ 125 188 80 174
Percentage of CEO compensation
Salary_(CEO) 485 364 260 259
Bonus_(CEO) 249 228 185 219
Option grant_(CEO) 10 127 406 275
Restricted stock grant_(CEO) 128 182 82 183
Panel E Firm characteristics by alternative treatment definition - before and
after FAS123R
Treated
25
19
997
223
250
256
268
10
177
71
Control
44
37
47
Table 2
Differential effect of FAS123R on the use of option-based compensation
Panel A Two-period first-difference regression
Prediction Coeff t-stat Coeff t-stat Coeff t-stat
Accounting impact rank - -0044 -628
Accounting impact rank=2 - -0044 -327
Accounting impact rank=3 - -0075 -468
Accounting impact rank=4 - -0140 -613
Treated - -0132 -875
ΔLog(size) 0061 202 0061 200 0063 214
ΔBook-to-market 0032 091 0032 092 0051 143
ΔLeverage -0157 -213 -0160 -218 -0111 -153
ΔAsset tangibility -0012 -014 -0020 -023 -0023 -026
ΔFree cash flow -0106 -095 -0108 -097 -0128 -117
ΔCash holding -0197 -211 -0193 -206 -0180 -194
ΔFive-year ROA volatility -0065 -031 -0056 -026 -0098 -047
ΔInstitutional ownership -0044 -091 -0043 -088 -0044 -092
ΔSales growth -0064 -102 -0065 -104 -0090 -153
ΔPast one-year stock return 0051 078 0052 080 0091 138
ΔLoss frequency 0056 207 0057 207 0047 179
Log(size) -0009 -210 -0009 -207 -0002 -035
Book-to-market -0015 -056 -0013 -049 0018 072
Leverage 0022 046 0023 048 0068 150
Asset tangibility 0033 077 0033 078 0053 128
Free cash flow 0227 202 0220 195 0127 117
Cash holding -0002 -004 0012 019 -0078 -141
Five-year ROA volatility -0451 -240 -0430 -228 -0509 -283
Institutional ownership -0123 -360 -0122 -359 -0100 -292
Sales growth -0041 -056 -0040 -055 -0089 -125
Past one-year stock return -0009 -015 -0006 -010 0078 125
Loss frequency 0055 174 0056 178 0054 173
Fixed effect
Standard error
Adj R-squared
Observations
Model (3)
Dependent variable ΔAvg Option grantTotal pay
Huber-White
0156
This table investigates whether the effect of FAS123R on the use of option-based pay varies with its potential accounting impact Panel A
reports the results of estimating three two-period first-differencing models where for each firm we average its characteristics in Pre- and
Post-FAS123R period The Pre-FAS123R period consists of fiscal year 2003 and 2004 the Post-FAS123R period covers fiscal year 2005-
2007 In all three specifications the dependent variable is the change of average Option grantTotal pay from Pre- to Post-FAS123R period
The main independent variable varies by model in Model (1) the Accounting impact rank is the quartile rank of implied option expensetotal
assets measured in 2002 (1=lowest 4=highest) In Model (2) Accounting impact rank=2 (3 4) is an indicator that takes value of one if the
firmrsquos Accounting impact rank equals 2 (3 4) In Model (3) we use an alternative treatment construction following Bakke et al (2015)
where Treated is an indicator that takes value of zero if the firm granted zero option to its CEO in both 2003 and 2004 or the firm began to
voluntarily expense option-based pay at fair value in 2002 or earlier and one otherwise For each control variable we include both its level in
the Pre-FAS123R period and its change across the two periods Panel B shows the results of estimating fixed effect models with firm-year
observations The dependent variable is the firm-year level Option grantTotal pay The main independent variables are the interactions of
Post-FAS123R indicator (Post) with Accounting Impact rank Accounting impact rank indicators and Treated respectively All models in
Penal A have industry fixed effects and the standard errors are Huber-White heteroscedasticity-consistent standard errors All models in
Penal B have firm fixed effects and year fixed effects and the standard errors are clustered at firm level All variables are defined in
Appendix The notation and indicates statistically significant at 10 5 and 1 level respectively
Model (1) Model (2)
11711171 1171
Industry Industry
Huber-White
0124
Huber-White
0123
Industry
48
Panel B Panel fixed effects regression
Prediction Coeff t-stat Coeff t-stat Coeff t-stat
Acc impact rank x Post - -0044 -807
Acc impact rank 2 x Post - -0046 -333
Acc impact rank 3 x Post - -0077 -526
Acc impact rank 4 x Post - -0137 -776
Treated x Post - -0145 -970
Log(size) 0034 221 0034 217 0036 229
Book-to-market 0018 084 0017 083 0015 070
Leverage -0004 -009 -0006 -013 -0007 -015
Asset tangibility 0007 012 0004 006 0011 018
Free cash flow -0074 -151 -0072 -146 -0078 -158
Cash holding -0048 -086 -0050 -090 -0006 -011
Five-year ROA volatility 0250 231 0239 219 0437 414
Institutional ownership 0043 159 0044 161 0041 150
Sales growth -0033 -168 -0034 -171 -0031 -158
Past one-year stock return 0067 221 0068 224 0063 204
Loss indicator 0023 209 0022 207 0024 222
Fixed effects
Standard error
Adj R-squared
Observations
Dependent variable Option grantTotal pay
5653 5653 5653
Clustered by firm
Firm Year
Clustered by firm
Firm Year
Clustered by firm
0523 0523 0526
Model (1) Model (2) Model (3)
Firm Year
49
Table 3
Effect of option-based compensation on dividend policy
Panel A Two-period first-difference regression
Prediction Coeff t-stat Coeff t-stat Coeff t-stat
Accounting impact rank + 0000 077
Accounting impact rank=2 + 0001 091
Accounting impact rank=3 + 0000 044
Accounting impact rank=4 + 0001 092
Treated + 0000 -026
ΔLog(size) 0000 -030 0000 -030 0000 -026
ΔBook-to-market -0002 -190 -0002 -193 -0002 -195
ΔLeverage -0002 -059 -0002 -057 -0002 -059
ΔAsset tangibility 0016 431 0016 429 0016 430
ΔFree cash flow 0017 373 0017 373 0017 375
ΔCash holding -0011 -288 -0011 -285 -0010 -282
ΔFive-year ROA volatility 0003 034 0002 032 0003 035
ΔInstitutional ownership -0002 -073 -0002 -073 -0002 -070
ΔSales growth -0001 -040 -0001 -037 -0001 -038
ΔPast one-year stock return 0002 077 0002 076 0002 070
ΔLoss frequency 0000 -048 0000 -045 0000 -046
Log(size) 0000 183 0000 182 0000 182
Book-to-market -0002 -227 -0002 -225 -0002 -284
Leverage -0001 -037 -0001 -039 -0001 -048
Asset tangibility 0003 179 0003 180 0003 176
Free cash flow 0017 291 0017 291 0017 300
Cash holding 0002 080 0002 077 0002 098
Five-year ROA volatility 0003 035 0002 033 0003 044
Institutional ownership -0001 -068 -0001 -068 -0001 -058
Sales growth -0004 -177 -0004 -175 -0004 -172
Past one-year stock return 0004 169 0004 167 0004 165
Loss frequency -0001 -111 -0001 -109 -0001 -102
Fixed effect
Standard error
Adj R-squared
Observations
Dependent variable ΔAvg Regular dividendTotal assets
This table investigates the causal effect of option-based pay on dividend policy by examining whether changes in dividend policy around
FAS123R vary with its potential accounting impact Panel A reports the results of estimating three two-period first-differencing models
where for each firm we average its characteristics in Pre- and Post-FAS123R period In all three specifications the dependent variable is
the change of average Regular dividendTotal assets from Pre- to Post-FAS123R period The main independent variable varies by model in
Model (1) the Accounting impact rank is the quartile rank of implied option expensetotal assets measured in 2002 (1=lowest 4=highest) In
Model (2) Accounting impact rank=2 (3 4) is an indicator that takes value of one if the firmrsquos Accounting impact rank equals 2 (3 4) In
Model (3) we use an alternative treatment construction following Bakke et al (2015) where Treated is an indicator that takes value of zero
if the firm granted zero option to its CEO in both 2003 and 2004 or the firm began to voluntarily expense option-based pay at fair value in
2002 or earlier and one otherwise For each control variable we include both its level in the Pre-FAS123R period and its change across the
two periods Panel B shows the results of estimating fixed effect models with firm-year observations The dependent variable is the firm-
year level Regular dividendTotal assets The main independent variables are the interactions of Post-FAS123R indicator (Post) with
Accounting Impact rank Accounting impact rank indicators and Treated respectively Panel C examines the intensity of dividend changes
among firms with nonzero dividend per share in 2003 or 2004 In particular we estimates the same three models as in Panel A(with the
same independent variables) but for five dependent variables the change of average Regular dividendTotal assets from Pre- to Post-
FAS123R period (as in Panel A) the percentage change of DPS (dividend per share) from Pre- to Post-FAS123R period and three
indicators denoting respectively whether the percentage change of DPS was greater than 20 40 and 60 Panel D reports four
robustness tests of the dividend intensity regression In each of them a set of possible confounding observations is removed (see Section 33
for details) Panel E compares the trends of dividend initiation and termination around FAS123R across four quartile groups ranked by
accounting impact All models in Panel A C and D have industry fixed effects and the standard errors are Huber-White heteroscedasticity-
consistent standard errors All models in Penal B have firm fixed effects and year fixed effects and the standard errors are clustered at
firm level All variables are defined in Appendix The notation and indicates statistically significant at 10 5 and 1 level
Industry Industry Industry
Model (1) Model (2) Model (3)
1171 1171 1171
Huber-White Huber-White Huber-White
0105 0104 0105
50
Panel B Panel fixed effects regression
Prediction Coeff t-stat Coeff t-stat Coeff t-stat
Acc impact rank x Post + 0000 122
Acc impact rank 2 x Post + 0001 110
Acc impact rank 3 x Post + 0001 094
Acc impact rank 4 x Post + 0001 129
Treated x Post + 0000 -012
Log(size) 0001 179 0001 179 0001 181
Book-to-market 0000 025 0000 024 0000 031
Leverage 0001 062 0001 064 0001 069
Asset tangibility 0009 360 0009 358 0009 363
Free cash flow 0002 090 0002 093 0002 092
Cash holding -0007 -295 -0007 -298 -0007 -298
Five-year ROA volatility 0001 041 0001 038 0000 -006
Institutional ownership 0000 -027 0000 -026 0000 -027
Sales growth 0000 053 0000 051 0000 044
Past one-year stock return 0001 089 0001 088 0001 078
Loss indicator 0000 -060 0000 -057 0000 -076
Fixed effects
Standard error
Adj R-squared
Observations
Dependent variable Regular dividendTotal assets
Model (1) Model (2) Model (3)
Firm Year Firm Year Firm Year
5653 5653 5653
Clustered by firm Clustered by firm Clustered by firm
0877 0877 0877
51
Panel C Intensity of dividend changes around FAS123R
Prediction Coeff t-stat Coeff t-stat Coeff t-stat
Accounting impact rank + 0000 065
Accounting impact rank=2 + 0000 048
Accounting impact rank=3 + 0000 026
Accounting impact rank=4 + 0002 080
Treated + 0001 063
Dependent var DPS pct change
Accounting impact rank + -0145 -072
Accounting impact rank=2 + 0018 006
Accounting impact rank=3 + -0177 -045
Accounting impact rank=4 + -0746 -100
Treated + -0407 -119
Accounting impact rank + 0029 095
Accounting impact rank=2 + 0040 074
Accounting impact rank=3 + 0092 139
Accounting impact rank=4 + 0008 007
Treated + -0007 -012
Accounting impact rank + 0024 076
Accounting impact rank=2 + 0047 088
Accounting impact rank=3 + 0079 114
Accounting impact rank=4 + -0003 -002
Treated + 0030 052
Accounting impact rank + 0030 098
Accounting impact rank=2 + 0078 155
Accounting impact rank=3 + 0085 130
Accounting impact rank=4 + 0014 012
Treated + -0006 -011
Control variables
Fixed effect
Standard error
Observations 572 572 572
Yes Yes Yes
Huber-White Huber-White Huber-White
Industry Industry Industry
Dependent var DPS pct
change gt60 indicator
Model (1) Model (2) Model (3)
Dependent var ΔAvg Regular
dividendAssets
Dependent var DPS pct
change gt20 indicator
Dependent var DPS pct
change gt40 indicator
52
Panel D Robustness tests for intensity of dividend changes around FAS123R
Prediction Coeff t-stat Coeff t-stat Coeff t-stat
Accounting impact rank + 0006 017
Accounting impact rank=2 + 0067 118
Accounting impact rank=3 + 0041 057
Accounting impact rank=4 + -0061 -049
Treated + 0022 035Observations
Accounting impact rank + 0009 027
Accounting impact rank=2 + 0058 106
Accounting impact rank=3 + 0032 043
Accounting impact rank=4 + -0032 -024
Treated + 0018 028
Observations
Accounting impact rank + 0030 089
Accounting impact rank=2 + 0039 071
Accounting impact rank=3 + 0122 168
Accounting impact rank=4 + -0063 -052
Treated + 0075 132
Observations
Accounting impact rank + 0008 023
Accounting impact rank=2 + 0023 042
Accounting impact rank=3 + 0048 064
Accounting impact rank=4 + -0042 -033
Treated + -0010 -016
Observations
Control variables
Fixed effect
Standard error
Exclude firms with stable
payout ratio from 2003 to 2004
506 506 506
Dependent variable DPS pct change gt40 indicator
Model (1) Model (2) Model (3)
Exclude voluntary expensers
519 519
Exclude firms in the top decile
of option reduction (02-04)
Exclude firms that accelerated
option vesting
504 504 504
517 517 517
519
Huber-White Huber-White Huber-White
Yes Yes Yes
Industry Industry Industry
53
Panel E Dividend initiation and termination rates around FAS123R
Pre FAS 123R
1 280 75 7 6 13 173
2 284 135 18 9 27 200
3 286 181 11 14 25 138
4 282 260 9 10 19 73
Total 1132 651 45 39 84 129
Post FAS 123R
1 275 63 4 4 8 127
2 280 116 9 9 18 155
3 276 152 9 3 12 79
4 263 223 5 1 6 27
Total 1094 554 27 17 44 79
Pre FAS 123R
1 280 205 2 0 2 10
2 284 149 7 1 8 54
3 286 105 0 0 0 00
4 282 22 0 0 0 00
Total 1132 481 9 1 10 21
Post FAS 123R
1 275 212 3 6 9 42
2 280 164 1 2 3 18
3 276 124 1 1 2 16
4 263 40 0 3 3 75
Total 1094 540 5 12 17 31
termination
in 2004
03-04
cumulative
03-04
cumulative
Quartile firms
with
dividend in
2004
termination
in 2005
termination
in 2006
05-06
cumulative
05-06
cumulative
Termination
Quartile firms
with
dividend in
2002
termination
in 2003
without
dividend in
2004
initiation in
2003
initiation in
2004
03-04
cumulative
03-04
cumulative firmsQuartile
firmsQuartile initiation in
2005
initiation in
2006
05-06
cumulative
05-06
cumulative
Initiation
without
dividend in
2002
54
Table 4
Effect of option-based compensation on repurchases
Panel A Two-period first-difference regression with total repurchase
Prediction Coeff t-stat Coeff t-stat Coeff t-stat
Accounting impact rank - 0002 122
Accounting impact rank=2 - 0002 071
Accounting impact rank=3 - 0005 123
Accounting impact rank=4 - 0007 102
Treated - 0014 365
Control variables
Fixed effect
Standard error
Adj R-squared
Observations
Panel B Two-period first-difference regression with net repurchase
Prediction Coeff t-stat Coeff t-stat Coeff t-stat
Accounting impact rank - 0003 166
Accounting impact rank=2 - 0002 051
Accounting impact rank=3 - 0006 165
Accounting impact rank=4 - 0009 137
Treated - 0010 300
Control variables
Fixed effect
Standard error
Adj R-squared
Observations
Panel C Two-period first-difference regression with repurchase adjusted for exercised options
Prediction Coeff t-stat Coeff t-stat Coeff t-stat
Accounting impact rank - 0001 056
Accounting impact rank=2 - 0002 062
Accounting impact rank=3 - 0007 172
Accounting impact rank=4 - -0001 -008
Treated - 0006 197
Control variables
Fixed effect
Standard error
Adj R-squared
Observations
Dependent variable ΔAvg RepurchaseTotal assets
This table investigates the causal effect of option-based pay on payout policy by examining whether the changes of repurchase around
FAS123R vary with its potential accounting impact Panel A reports the results of estimating three two-period first-differencing models
where for each firm we average its characteristics in Pre- and Post-FAS123R period In all three specifications the dependent variable is
the change of average RepurchaseTotal assets from Pre- to Post-FAS123R period The main independent variable varies by model in
Model (1) the Accounting impact rank is the quartile rank of implied option expensetotal assets measured in 2002 (1=lowest 4=highest)
In Model (2) Accounting impact rank=2 (3 4) is an indicator that takes value of one if the firmrsquos Accounting impact rank equals 2 (3 4)
In Model (3) we use an alternative treatment construction following Bakke et al (2015) where Treated is an indicator that takes value of
zero if the firm granted zero option to its CEO in both 2003 and 2004 or the firm began to voluntarily expense option-based pay at fair
value in 2002 or earlier and one otherwise Panel B reports the regressions with the change of Net repurchaseTotal assets as the
dependent variable and the same independent variable as in Panel A Panel C reports the regressions with the change of Adjusted
repurchaseTotal assets as the dependent variable and the same independent variable as in Panel A All models in Panel A B and C have
industry fixed effects and the standard errors are Huber-White heteroscedasticity-consistent standard errors All variables are defined in
Appendix The notation and indicates statistically significant at 10 5 and 1 level respectively
Model (1) Model (2) Model (3)
Yes Yes Yes
Industry Industry Industry
Huber-White Huber-White Huber-White
Dependent variable ΔAvg Net repurchaseTotal assets
1171 1171 1171
0238 0237 0245
Model (1) Model (2) Model (3)
Yes Yes Yes
Industry Industry Industry
Huber-White Huber-White Huber-White
Dependent variable ΔAvg Adjusted repurchaseTotal assets
0229 0229 0233
1171 1171 1171
Model (1) Model (2) Model (3)
Yes Yes Yes
Industry Industry Industry
Huber-White Huber-White Huber-White
0111 0112 0114
1168 1168 1168
55
Table 5
Effect of option-based compensation on payout mix
Panel A Two-period first-difference regression with total payout mix
Prediction Coeff t-stat Coeff t-stat Coeff t-stat
Accounting impact rank + 0006 028
Accounting impact rank=2 + 0018 045
Accounting impact rank=3 + -0001 -001
Accounting impact rank=4 + 0043 052
Treated + -0035 -094
Control variables
Fixed effect
Standard error
Adj R-squared
Observations
Panel B Two-period first-difference regression with net payout mix
Prediction Coeff t-stat Coeff t-stat Coeff t-stat
Accounting impact rank + -0002 -008
Accounting impact rank=2 + 0008 016
Accounting impact rank=3 + 0018 034
Accounting impact rank=4 + -0059 -055
Treated + -0050 -101
Control variables
Fixed effect
Standard error
Adj R-squared
Observations
0049 0043 0054
257 257 257
Industry Industry Industry
Huber-White Huber-White Huber-White
Dependent variable ΔAvg Regular dividendNet payout
Model (1) Model (2) Model (3)
Yes Yes Yes
0154 0151 0156
362 362 362
Industry Industry Industry
Huber-White Huber-White Huber-White
This table investigates the causal effect of option-based pay on payout mix for firms using both dividend and repurchase by examining
whether the changes of payout mix around FAS123R vary with its potential accounting impact Panel A reports the results of estimating
three two-period first-differencing models where for each firm we average its characteristics in Pre- and Post-FAS123R period In all three
specifications the dependent variable is the change of average Regular dividendTotal payout from Pre- to Post-FAS123R period The main
independent variable varies by model in Model (1) the Accounting impact rank is the quartile rank of implied option expensetotal assets
measured in 2002 (1=lowest 4=highest) In Model (2) Accounting impact rank=2 (3 4) is an indicator that takes value of one if the firmrsquos
Accounting impact rank equals 2 (3 4) In Model (3) we use an alternative treatment construction following Bakke et al (2015) where
Treated is an indicator that takes value of zero if the firm granted zero option to its CEO in both 2003 and 2004 or the firm began to
voluntarily expense option-based pay at fair value in 2002 or earlier and one otherwise Panel B reports the regressions with the change of
Regular dividendNet payout as the dependent variable and the same independent variables as in Panel A Panel A (Panel B) is based on
observations with nonzero regular dividend and repurchase (net repurchase) in both Pre- and Post-FAS123R period All models in Panel A
and B have industry fixed effects and the standard errors are Huber-White heteroscedasticity-consistent standard errors All variables are
defined in Appendix The notation and indicates statistically significant at 10 5 and 1 level respectively
Yes Yes Yes
Dependent variable ΔAvg Regular dividendTotal payout
Model (1) Model (2) Model (3)

22
negative and significant coefficient at -0132 suggests that treated firms experience a 132
larger drop in the weight of option pay relative to control firms
In Panel B we re-estimate Eq (1) using a panel regression with firm- and year-fixed effects
(5653 firm-year observations) where the dependent variable is the the ratio of option grants to
total executive pay The results are virtually identical in terms of significance and magnitude of
the coefficients of interest (the interaction terms between respectively Accounting impact and
Treated and an indicator for the Post period)
Overall Table 2 suggests that high implied option expense and the introduction of FAS123R
together strongly encouraged firms to cut back option-based compensation for executives It also
supports the general validity of the approach in Bakke et al (2015) in identifying firms most
affected by FAS123R notwithstanding the concerns outlined earlier
Our test of Eq (1) focuses on executive stock options For our dividend-protection hypothesis
it is important to establish that the level of implied option expense predicts a change in executive
stock options (rather than only a change in the use of non-executive employee stock options) as we
want to capture the effect of a change in executivesrsquo incentives on payout policy At the same
time our dilution channel hypothesis assumes a change in the use of all (executive and non-
executive employee) stock options Thus in untabulated analyses we repeat the test in Eq (1) by
replacing the dependent variable with the change in the number of options granted to all
employees (scaled by the total number of outstanding shares note for this analysis we can only
use data from 2004 to 2007 because Compustat began reporting data on ESO in 2004) The
coefficient on Accounting Impact and Treated continues to be negative and significant suggesting
that the differential reduction in the use of option compensation as a function of accounting impact
23
occurred for both executive and non-executive employee stock options Indeed Brown and Lee
(2011) report a similar decrease in executive and employee stock options around FAS123R
33 Option-Based Pay and Dividend Payouts
In this section we examine the effect of an exogenous (accounting-induced) change in option
compensation on dividend policy by estimating Equation (2)
Table 3 Panel A presents the results using the change in dividends from Pre to Post as
dependent variable We find no significant association between Accounting Impact (column 1 and
2) or Treated (column 3) and the change in dividends around the adoption of FAS123R This is in
stark contrast with the negative effect of option-based pay on dividends predicted in the literature
and documented in various association studies
One concern with this lack of effect is that perhaps our setting is not powerful enough to detect
it One way to examine this possibility is the following The coefficient on Accounting Impact
rank=4 in column 2 is 0001 and the standard error (SE) is 00009 Assuming the estimated
standard error is correct then for a two-tailed t test the coefficient needs to be greater than 00015
(=SE1645) or 015 to reach the 10 percent significant level In other words if moving from
the bottom to the top quartile (which predicts a 14 differential decline in option based pay as per
Table 2 Panel A) resulted in a 015 increase of the dividendasset ratio our test would be able to
detect a causal effect of option-based pay on dividends Given the unconditional mean of the
dividendasset ratio at 093 an increase of 015 from the Pre to the Post period seems
plausible In fact the average increase from the Pre to the Post period is 016 (Table 1 Panel C)
Thus if an effect was there our test should detect it
24
Panel B presents the results using a panel regression (5653 firm-year observations) with firm-
and year-fixed effects and interaction terms between Accounting Impact (or Treated) and an
indicator for the Post period Our inferences are unchanged
These analyses are based on our full sample which includes both dividend-paying and non-
dividend-paying firms Hence they implicity treat as equal two potentially different decisions to
initiate dividends and to increase dividends For example an increase in the dividend-to-asset
ratio from 05 to 06 will be treated the same as an increase from 00 to 01 even though
the latter represents a critical dividend initiation decision23 To address this following Chetty and
Saez (2005) we separately examine how FAS123R impacts the intensity of dividend changes (for
the subset of payers) and the likelihood of dividend initiations (for the subset of non-payers)
331 Option-Based Pay and Dividend Payouts Intensity of Dividend Changes
In the first row of Panel C we repeat the analysis in Panel A for the sub-sample of 572 payers
defined as firms with positive DPS in 2003 andor 2004 Note that we report only the coefficients
of interest for parsimony In the second row we replace the dependent variable with the
percentage change in DPS DPS is the choice variable for managers (Brav et al 2005 Baker and
Wurgler 2016) and thus our preferred measure to capture changes in dividend policy To account
for skewness in this variable (Khale 2002) in the third fourth and fifth rows we use indicator
variables to denote whether the change in DPS surpasses a threshold respectively 20 40 and
60 The proportion of firms that surpass these thresholds are 59 44 and 33 respectively24
23 Initiating dividends is a critical decision for boards given the pre-commitment value that investors attach to this
decision and the strong negative market reaction when firms eliminate or reduce dividends (Brav et al 2005) For
executives trying to maximize the value of their own stock options (dividend-protection argument) the ability to
influence a dividend initiation decision is likely lower than the ability to influence a dividend increase decision 24 Although in the third fourth and fifth rows our dependent variable is a binary variable we use a linear model (OLS)
instead of a probit or logit nonlinear model The reason is that estimating fixed effects in binary response models with
panel data can cause the incidental parameters problem The coefficient estimates can be biased when the panel data
25
Across all of these specifications we find no association between Accounting Impact or Treated
and the intensity of dividend changes Thus it does not appear that an exogenous reduction in
option-based pay caused dividend-paying firms to increase dividends
In Panel D we perform four robustness tests For parsimony we show only the coefficients of
interest and only the cases where the dependent variable is an indicator denoting a greater than
40 increase in DPS The results are similar for the other four ldquointensityrdquo dependent variables
reported in Panel C
In the first row we exclude firms that began to voluntarily expense options in 2003 or 2004
(84 firms of which 68 are dividend payers) FASB added accounting for stock-based
compensation to its agenda in March 2003 and issued an Exposure Draft proposing the expensing
of stock options at fair value in March 2004 In anticipation a number of firms began to
voluntarily expense stock options in 2003 and 2004 (Aboody et al 2004) If these firms reduced
option grants and as a result increased dividends during the Pre period then their inclusion may
reduce the power of our tests and thus our ability to detect the hypothesized relation25
In a similar spirit in the second row we exclude firms in the top decile in terms of reduction in
the ratio of option grants to total pay for the top 5 executives between 2002 (the year prior to the
Pre-period) and 2004 (the end of the Pre-period) This encompasses 113 firms of which 55 are
dividend payers If these firms reduced option grants in anticipation of FAS123R and as a result
increased dividends during the Pre period their inclusion may reduce our ability to detect the
hypothesized relation
has a large number of observations but a short time series Examples of studies making a similar choice are Puri
Rocholl and Steffen (2011) and Chu and Ma (2015) 25 This is unlikely to be a serious concern as previous studies suggest that voluntary expensers made limited use of
stock options (Aboody et al 2004) In fact in our sample 79 of these firms are in the bottom two quartiles of
implied option expense (untabulated) Nonetheless we present this test for robustness
26
In the third row we exclude firms that accelerated the vesting of options before FAS123R
became effective in order to avoid recognizing an expense for the unvested portion of these
options (Choudhary et al 2009 Balsam Reitenga and Yin 2008) This encompasses 196 firms of
which 54 are dividend payers If accelerating vesting was used to reduce the impact of FAS123R
the inclusion of these firms may reduce the power of our tests26
In the fourth row we deal with the concern that if firms target a fixed dividend to net income
ratio (Lintner 1956) and do so without adjusting for changes in accounting standards then by
decreasing net income (via option expense) the accounting change would mechanically cause a
reduction in dividends This would potentially offset and confound the increase predicted under
the dividend-protection and dilution hypotheses This seems unlikely for two reasons First firms
are notoriously reluctant to cut dividends (Brav et al 2005) Hence it seems unlikely that they
would reduce dividends in response to a decline in net income with no economic or cash flow
implications (ie re-classification of an expense from the footnotes to the income statement)
Second firms today set dividends in terms of dividend per share rather than by targeting a net
income-based payout ratio (Brav et al (2005)) As noted by Skinner (2008) over the last few
decades as earnings have become more variable the relation between earnings and dividends has
become weaker with dividend payments increasing smoothly and largely independent of the
variation in earnings Nevertheless in the fourth row we exclude the 66 dividend-paying firms that
26 These firms explicitly stated that they accelerated the vesting of stock options to avoid the accounting charge
(Choudhary et al 2009) In fact 72 are classified in the top two quartiles of implied option expense (untabulated)
Thus we would have predicted these firms to experience a significant decline in option pay To the extent that this
decline did not materialize because they minimized the impact of FAS123R by accelerating vesting the ability of
Accounting Impact to predict the reduction in option pay and thus its usefulness in examining changes in dividends
around FAS123R may be reduced The list of firms accelerating vesting was kindly provided by Jack Ciesielsky of
The Analystsrsquo Accounting Observer
27
had a similar payout ratio in 2003 and 2004 as a proxy for firms with a target net income-based
payout ratio in the Pre period27
As shown in Panel D even after excluding these subsets of firms we continue to find no
association between Accounting Impact or Treated and changes in dividends for dividend-paying
firms This is inconsistent with a causal influence of option compensation on dividend policy
Another concern is that by reducing net income and thus retained earnings FAS123R
may have pushed some firms closer to violating dividend covenants in debt contracts and
thus prevented them from increasing dividends This would bias our study against finding a
causal effect of option-based pay on dividends However this does not appear to be a
significant concern for three reasons First the recognition of an option expense does not
imply a decline in net income In fact more than 70 (75) of the full sample firms
(dividend payers) experienced an increase in net income before extraordinary items from
2004 to 2005 (the percentages are similar across the four quartiles of implied option
expense) Second dividend covenants are less common among dividend-paying firms
(Nikolaev 2010) Third most loan contracts in recent years give parties the option to
ldquofreezerdquo GAAP when facing a mandatory change in accounting principles (Christensen and
Nikolaev 2009) Firms expecting an adverse impact of FAS123R on their dividend covenants
would likely exercise this option (particularly given the non-cash nature of option-based
expense) Nonetheless to alleviate this concern we perform three additional analyses
(untabulated) (i) we repeat the tests in Panel C after excluding firms with a drop in net
income between 2004 and 2005 (ie firms that perhaps faced some covenant-related
27 We define a ldquosimilarrdquo payout to be an absolute change in payout ratio of less than 1 from 2003 to 2004 Among
these 66 firms only 39 continued to have a similar payout ratio in 2005 We also try an alternative definition where
a firm is classified as likely to be using a net income-based target payout ratio if the absolute percentage change in the
ratio from 2003 to 2004 is less than 10 (100 firms) Our inferences are unchanged
28
constrains to their payout policy as a result of FAS123R) (ii) we explicitly control for net
income and retained earnings in the regression (as in Skinner 2008) (iii) we repeat the tests
in Panel C for dividend payers with dividendsasset ratio above the sample median on the
basis that dividend covenants are less frequent among firms paying large dividends (Jung
Lee and Yang 2016) Our inferences are unchanged
332 Option-Based Pay and Dividend Payouts Dividend Initiations
In this section we examine whether the accounting-driven change in option pay affected
dividend initiations among non-payers We cannot employ the difference-in-difference approach
adopted so far by definition the same firm cannot initiate dividends in both periods However we
can provide suggestive evidence as follows First we take all firms that did not pay dividends in
2002 and group them into quartiles based on 2002 implied option expense For each quartile we
find the number of firms initiating dividends in 2003 and 2004 (the Pre period) Next we take all
firms that did not pay dividends in 2004 group them into quartiles based on 2002 implied option
expense and for each quartile find the number of firms initiating dividends in 2005 and 2006 (the
Post period) We do not include 2007 so as to have the same number of years in both periods and
make the cumulative initiation rates comparable
The left portion of Panel E reports the results of this exercise There is a general decrease in
the dividend initiation rate from the Pre to the Post period This holds both in the full sample of
non-payers (from 129 to 79) and across all quartiles This decrease may reflect a temporary
spike in 2003 and 2004 in response to the 2003 dividend tax cut documented in Chetty and Saez
(2005) It is noteworthy that initiation rates in both periods are lower among firms with higher
implied option expense This is consistent with option-heavy firms being mostly high-growth
firms less inclined to pay dividends More relevant to our research question if the lower use of
29
option compensation increased the propensity to pay dividends we would expect to see a relative
increase (ie a lower decrease) in dividend initiations among firms with the highest accounting
impact Instead the rate does not differ depending on the accounting impact There is
approximatley a 5 decline in initiation rate in each quartile In the right portion of Panel E we
examine similar data for dividend terminations While the results should be interpreted with
caution due to their rarity firms with higher accounting impact do not experience a greater decline
in termination rates Our inferences in Panel E are similar when we compared treated and control
firms following Bakke et al (2015) (untabulated)
Even after taking into account the different nature of decisions for dividend paying and non-
dividend-paying firms we fail to find evidence of a causal influence of option-based compensation
on dividend policy This finding is in contrast to the associations documented in earlier studies It
is even more remarkable as most firms replaced stock options with restricted stock which are
generally dividend-protected and should provide further incentive to increase dividends28
34 Option-Based Pay and Repurchases
In this section we examine the effect of an exogenous (accounting-induced) change in option
compensation on repurchases by estimating Equation (2)
Table 4 Panel A presents the results using the change in repurchases (scaled by total assets)
from Pre to Post as a dependent variable If the use of option-based pay had a positive effect on
firmsrsquo propensity to engage in repurchases as posited by the dividend-protection and dilution
hypotheses we should find a negative association between Accounting Impact or Treated and
repurchases Firms with a higher (accounting-driven) reduction in option-based pay should reduce
28 In a sample of SampP 500 firms between 2000 and 2009 Zhang (2013) reports that 80 of the firms granting
restricted stocks offer dividend protection In that sense the FAS123R-induced shift from stock options to restricted
stock may be characterized as a ldquoshockrdquo to dividend protection in unearned equity pay Accordingly our results cast
doubt on the causal interpretation of the positive association between dividend protection and dividend payouts
documented in prior studies (Zhang 2013 Burns et al 2015 Minnick and Rosenthal 2015)
30
the use of repurchases either because they are shifting toward a greater use of dividends andor
because they have a lower need to offset the dilutive effects of stock options However we find no
significant association between Accounting Impact (columns 1 and 2) and the change in
repurchases around the adoption of FAS123R When we use the Treated indicator (column 3) we
find a significant positive association rather than a negative one In Panel B we repeat the analysis
using net repurchases (ie repurchases after removing the effect of share issuances) following
Fama and French (2001) and Skinner (2008) Our inferences are unchanged29
This test is subject to two important caveats The first is we may not detect a decline in
repurchases because in the Post period firms need to offset the exercise of options that were
granted during the Pre period That is a post-FAS123R reduction in grants may not (yet) translate
into a reduction in exercises during the Post period which reduces our ability to test the dilution
hypothesis (ie that firms repurchase shares to offset exercises)30 However we can examine a
variation of this hypothesis where firms use repurchases to manage the effect of unexercised
options on diluted EPS (Bens et al 2003) To do so in Panel C we use a measure of adjusted
repurchases where we subtract our estimate of repurchases undertaken to offset the exercise of
ESO31 We effectively test whether firms experiencing an accounting-induced decrease in option
grants engage in less repurchases (net of exercise-driven repurchases) because their need to
manage the effect of unexercised options on diluted EPS is lower However the coefficient on
the variables of interest is either insignificant or positive inconsistent with the hypothesis
29 In the case of repurchases we do not examine separately ldquoinitiationsrdquo and ldquointensityrdquo as we do for dividends
because initiation is not clearly defined for repurchases Unlike dividends the occurrence of a repurchase in a given
year (or the lack thereof) cannot be used to infer a general policy due to the more discretionary nature of the timing of
repurchases 30 To capture the effect of lower option-based compensation on option exercises and thus on repurchases we would
ideally extend the Post period beyond 2007 However as noted by Floyd et al (2015) repurchases declined
dramatically after 2007 because of the financial crisis making it difficult to detect the effect of any other factor 31 As upper bound estimate of exercise-driven repurchases we multiply the number of ESO exercised during the year
times the average stock price during the year Since the number of ESO exercised is available in Compustat starting in
2004 Panel C is based on observations from 2004 to 2007
31
A second important caveat is that most firms replaced stock options with restricted stock
(Table 2 Panel C) Unvested restricted stock is excluded from the denominator in the computation
of basic EPS (once vested it is included) However it is included in the denominator of diluted
EPS using the treasury stock method similar to stock options Given the complexity of this
method without access to all details of restricted stock grants and option grants it is difficult to
determine whether the switch from stock options to restricted stock decreased the need for
dilution-driven repurchases as our test implicitly assumes Hence it is possible that we do not find
a decrease in repurchases because a reduced need to offset the dilutive effect of stock options was
neutralized by an increased need to offset the dilutive effect of restricted stock
Subject to the above caveats the evidence in Table 4 is not consistent with a positive causal
relation between the use of option-based pay and repurchases More precisely it suggests that
option-driven dilution concerns do not have a first-order effect on the magnitude of repurchases
even though they may play a role in the repurchase decision Hence our result is not necessarily
in conflict with the evidence in Brav et al (2005) where two-thirds of the surveyed financial
executives state that offsetting the dilutionary effect of stock option plans or other stock
programs is an important factor to their repurchase decisions
35 Option-Based Pay and Payout Composition
As an alternative to examining dividends and repurchases separately we also look at the
payout composition the change in the DividendsTotal Payout ratio from the Pre to the Post period
where Total Payout is the sum of dividends and repurchases As noted earlier we focus on the
subsample of firms with both dividends and repurchases in both Pre and Post periods so as to
capture the change in payout mix by firms routinely using both vehicles to return cash to
shareholders If the use of option-based pay causes firms to substitute repurchases for dividends
32
we should find a positive association between Accounting Impact or Treated and the payout mix
defined as DividendsTotal Payout ratio Firms with a higher accounting-driven reduction in
option-based pay should have an increase (decrease) in the relative weight of dividends
(repurchases) to the total payout However as reported in Table 5 Panel A we fail to find a
significant association between Accounting Impact (column 1 and 2) or Treated (column 3) and
the change in payout mix The results are similar when we use Net Payout (dividends plus net
repurchases) instead of Total Payout in computing the payout mix (Panel B)
Overall the combined evidence in Tables 3-5 does not support the hypothesis that option-
based compensation has negative (positive) effect on dividends (repurchases) or that it causes
firms to replace dividends with repurchases
4 Conclusion
Prior literature has documented robust associations between option-based compensation and
payout policy yet it remains unclear whether this association reflcts a causal influence We
investigate the causal effect of option-based compensation on payout policy using the adoption of
FAS123R which resulted in a significant decrease in option grants making it a plausible
exogenous shock to the use of option-based pay To overcome the challenge of no control group
we exploit the fact that firms responded differently depending on the firm-specific accounting
impact as measured by the implied option expense disclosed in the footnotes prior to FAS123R
Firms with larger expected accounting impact curtailed option-based compensation much more
aggressively than firms with lower impact Using a sample of SampP 1500 firms we find no
evidence that firms with a larger accounting-induced decline in option compensation increased
dividends reduced repurchases or changed their payout composition contrary to the widely held
belief that option-based pay has a causal influence on payout policy
33
Appendix Variable Definitions and Data Sources
Accounting Impact Variables
Accounting impact Implied option expense (Compustat XINTOPT) divided by total assets
(Compustat AT) This variable is measured at fiscal year 2002 and is time-invariant
Accounting impact rank The quartile rank of Accounting impact (1=lowest 4=highest)
Payout Variables
Regular dividendTotal assets The numerator is total regular cash dividends in the fiscal year
from the distribution dataset in CRSP Regular cash dividends are identified by the distribution
codes 1212 1222 1232 or 1242 The denominator is one-year lagged total assets (Compustat
AT)
DPS Dividend per share (Compustat DVPSX_F)
DPS pct change The percentage change of average DPS from Pre- to Post-FAS123R period
DPS pct change gtX indicator A dummy variable that equals one if DPC pct change is greater
than X and zero otherwise
RepurchaseTotal assets The numerator is the repurchase of common equity which equals total
repurchase (Compustat PRSTK) minus the change in preferred stock redemption value
(Compustat PSTKRV) The denominator is one-year lagged total assets (Compustat AT)
Net repurchaseTotal assets Net repurchase removes the effect of share issuances The
construction follows Fama and French (2001) and Skinner (2008) if the firm uses the treasury
stock method for repurchase net repurchase equals the increase in common treasury stock
(Compustat TSTKC) if the firm uses the retirement method (when common treasury stock is zero
in the current and prior year) net repurchase equals total repurchases minus stock issuance
(Compustat SSTK) and change in preferred stock redemption value (Compustat PSTKRV)
When the above measures give negative value net repurchase is set to zero
Adjusted repurchaseTotal assets Adjusted repurchase removes from total repurchase the potential
effect of repurchasing exercised options This variable equals total repurchase of common stocks
minus the product between the number of options exercised (Compustat OPTEXD) and average
stock price during the year When the above measure gives negative value adjusted repurchase is
set to zero Since the number of options exercised is not available before 2003 we drop
observations in 2003 when we use this variable
34
Total payoutTotal assets the sum of Regular dividendTotal assets and RepurchaseTotal assets
Regular dividendTotal payout regular cash dividend divided by the sum of regular cash dividend
and repurchase from common equity In the two-period analysis (Pre- vs Post-FAS123R) we
separately sum the numerator and the denominator for each firm-period and then calculate the ratio
Regular dividendNet payout regular dividend divided by the sum of regular dividend and net
repurchase In the two-period analysis (Pre- vs Post-FAS123R) we separately sum the numerator
and the denominator for each firm-period and then calculate the ratio
Compensation Variables
Salary_$ Average salary (Execucomp SALARY) of the top 5 highest paid executives in $1000
Salary_ Average salary (Execucomp SALARY) divided by average total pay (Execucomp
TDC1) of the top 5 highest paid executives
Bonus_$ Average bonus (Execucomp BONUS) of the top 5 highest paid executives in $1000
Due to a data format change we add non-equity plan-based awards (Execucomp
NON_EQ_TARG) to this measure after 2006
Bonus_ Bonus_$ divided by average total pay (Execucomp TDC1) of the top 5 highest paid
executives
Option grant_$ Average option grant value (Execucomp OPTION_AWARDS_BLK_VALUE or
OPTION_AWARDS_FV) of the top 5 highest paid executives in $1000 Due to a data format
change we use OPTION_AWARDS_FV for this measure after 2006
Option grant_ Option grant_$ divided by average total pay (Execucomp TDC1) of the top 5
highest paid executives
Restricted stock grant_$ Average restricted stock grant value (Execucomp RSTKGRNT or
STOCK_AWARDS_FV) of the top 5 highest paid executives in $1000 Due to data format
change we use STOCK_AWARDS_FV for this measure after 2006
Restricted stock grant_ Restricted stock grant_$ divided by average total pay (Execucomp
TDC1) of the top 5 highest paid executives
Total pay_$ Average total pay (Execucomp TDC1) of the top 5 highest paid executives in $1000
35
Other Characteristics
Size The book value of total assets (Compustat AT) minus the book value of common equity
(Compustat CEQ) plus the market value of common equity from CRSP in $M
Log(size) the natural logarithm of size
Book-to-market the book value of common equity dividend by its market value
Leverage long term debt plus short term debt (Compustat DLTT + DLC) divided by total assets
Asset tangibility tangible assets (Compustat AT - INTAN) divided by total assets
Free cash flow Operating cash flow (Compustat OANCF) minus capital expenditure (Compustat
CAPX) then divided by lagged total assets
Cash holding Cash and short-term investments (Compustat CHE) divided by total assets
ROA volatility the standard deviation of returns on assets (operating income before tax divided by
lagged total assets) in the past five fiscal years
Institutional ownership the number of shares held by institutional investors divided by the number
of shares outstanding from Thomson Reuters Institutional Holdings database
Sales growth the growth rate of sales (Compustat SALE) from the prior year
Past stock return annual stock return from the prior year
Loss indicator a dummy variable taking value of one if the current net income is negative and
zero otherwise
36
References
Aboody David 1996 Market Valuation of Employee Stock Options Journal of Accounting and
Economics 22 357-391
Aboody David Barth Mary E and Ron Kasznik 2004 Firms Voluntary Recognition of Stock-
Based Compensation Expense Journal of Accounting Research 42 123ndash150
Aboody David and Ron Kasznik 2008 Executive stock-based compensation and firmsrsquo cash
payout the role of shareholdersrsquo tax-related payout preferences Review of Accounting Studies
13 216ndash251
Anantharaman Divya and Yong Gyu Lee 2014 Managerial risk taking incentives and corporate
pension policy Journal of Financial Economics 111 328ndash351
Baker Malcolm and Jeffrey Wurgler 2004 A catering theory of dividends Journal of Finance
59 1125-1165
Baker Malcolm and Jeffrey Wurgler 2016 Dividends as reference points a behavioral signaling
approach Review of Financial Studies 29 697-738
Bakke Tor-Erik Hamed Mahmudi Chitru Fernando and Jesus Salas 2015 The causal effect of
option pay on corporate risk management Journal of Financial Economics forthcoming
Balsam Steven Austin Reitenga and Jennifer Yin 2008 Option acceleration in response to SFAS
No 123 (R) Accounting Horizons 22 23-45
Bens Daniel and Steven Monahan 2008 Altering Investment Decisions to Manage Financial
Reporting Outcomes Asset-Backed Commercial Paper Conduits and FIN 46 Journal of
Accounting Research 46 1017-1055
Bens Daniel A Venky Nagar Douglas J Skinner and MH Franco Wong 2003 Employee stock
options eps dilution and stock repurchases Journal of Accounting and Economics 36 51ndash90
Bertrand Marianne Esther Duflo and Sendhil Mullainathan 2004 How much should we trust
differences-in-differences estimates The Quarterly Journal of Economics 119 249ndash275
Blouin Jennifer L Jana S Raedy and Douglas A Shackelford 2011 Dividends Share
Repurchases and Tax Clienteles Evidence from the 2003 Reductions in Shareholder Taxes
The Accounting Review 86 887-914
Brav Alon John R Graham Campbell R Harvey and Roni Michaely 2005 Payout policy in the
21st century Journal of Financial Economics 77 483ndash527
Brown Lawrence D and Yen-Jung Lee 2011 Changes in Option-Based Compensation Around
the Issuance of SFAS123R Journal of Business Finance amp Accounting 38 1053ndash109
37
Brown Jeffrey R Nellie Liang and Scott Weisbenner 2007 Executive financial incentives and
payout policy Firm responses to the 2003 dividend tax cut Journal of Finance 62 1935ndash
1965
Burns Natasha Brian McTier and Kristina Minnick 2015 Equity-incentive compensation and
payout policy in Europe Journal of Corporate Finance 30 85-97
Carter Mary Ellen and Luann J Lynch 2003 The Consequences of the FASBrsquos 1998 Proposal on
Accounting for Stock Option Repricing Journal of Accounting and Economics 35 51-72
Carter Mary Ellen Luann J Lynch and Irem Tuna 2007 The role of accounting in the design of
CEO equity compensation The Accounting Review 82 327ndash357
Chava Sudheer and Amiyatosh Purnanandam 2010 CEOs versus CFOs Incentives and
corporate policies Journal of Financial Economics 97 263ndash278
Chetty Raj and Emmanuel Saez 2005 Dividend taxes and corporate behavior Evidence from the
2003 dividend tax cut The Quarterly Journal of Economics 120 791ndash833
Choudhary Preeti Shivaram Rajgopal and Mohan Venkatachalam 2009 Accelerated vesting of
employee stock options in anticipation of FAS123R Journal of Accounting Research 47 105ndash
146
Christensen Hans B and Valeri Nikolaev 2009 Contracting on Mandatory Changes to GAAP
New Practice and Its Determinants Working Paper University of Chicago
Chu Yongqiang and Tao Ma 2015 How does management compensation affect bank risk taking
evidence from FAS 123R University of South Carolina Working Paper
Cuny Charles J Gerald S Martin and John J Puthenpurackal 2009 Stock options and total
payout Journal of Financial and Quantitative Analysis 44 391ndash410
DeAngelo Harry Linda DeAngelo and Douglas J Skinner 2000 Special Dividends and the
Evolution of Dividend Signaling Journal of Financial Economics 57 309-354
Dechow Patricia M Amy P Hutton and Richard G Sloan 1996 Economic consequences of
accounting for stock-based compensation Journal of Accounting Research 34 1ndash20
Edgerton J 2013 Four facts about dividend payouts and the 2003 tax cut International Tax and
Public Finance 20 769-784
Edmans Alex and Xavier Gabaix 2015 Executive compensation a modern primer Journal of
Economic Literature forthcoming
38
Fama Eugene F and Kenneth R French 2001 Disappearing dividends changing firm
characteristics or lower propensity to pay Journal of Financial Economics 60 3ndash43
Farre-Mensa Joan Roni Michaely and Martin C Schmalz 2014 Payout policy Annual Review
of Financial Economics 6 75ndash134
Fenn George W and Nellie Liang 2001 Corporate payout policy and managerial stock
incentives Journal of Financial Economics 60 45ndash72
Ferri Fabrizio and Tatiana Sandino 2009 The impact of shareholder activism on financial
reporting and compensation the case of employee stock options expensing The Accounting
Review 84 433ndash466
Floyd Eric Nan Li and Douglas J Skinner 2015 Payout policy through the financial crisis the
growth of repurchases and the resilience of dividends Journal of Financial Economics 118
299-316
Frydman Carola and Dirk Jenter 2010 CEO compensation Annual Review of Financial
Economics 2 75-102
Gipper Brandon 2015 Assessing the Effects of Disclosing Management Compensation Working
Paper University of Chicago
Gormley Todd David Matsa and Todd Milbourn 2013 CEO compensation and corporate risk
evidence from a natural experiment Journal of Accounting and Economics 56 79-101
Graham John Michelle Hanlon and Terry Shevlin 2011 Real effects of accounting rules
evidence from multinational firmsrsquo investment locations and profit repatriation decisions
Journal of Accounting Research 49 137-185
Graham John Campbell Harvey and Shiva Rajgopal 2005 The Economic implications of
corporate financial reporting Journal of Accounting and Economics 40 3-73
Greenspan Alan 2002 Testimony of Alan Greenspan before the Committee on Banking
Housing and Urban Affairs US Senate July 16 Washington DC Government Printing
Office
Grullon Gustavo and Roni Michaely 2002 Dividends Share Repurchases and the Substitution
Hypothesis Journal of Finance 57 1649-1684
Hail Luzi Ahmed Tahoun and Clare Wang 2014 Dividend Payouts and Information Shocks
Journal of Accounting Research 52 403-456
Hall Brian J and Kevin J Murphy 2002 Stock options for undiversified executives Journal of
Accounting amp Economics 33 3-42
39
Hall Brian J and Kevin J Murphy 2003 The trouble with stock options Journal of Economic
Perspectives 17 49ndash70
Hanlon Michelle and Jeffrey L Hoopes 2014 What do firms do when dividend tax rates change
An examination of alternative payout responses Journal of Financial Economics 114 105-
124
Hayes Rachel M Michael Lemmon and Mingming Qiu 2012 Stock options and managerial
incentives for risk taking Evidence from FAS123R Journal of Financial Economics 105
174ndash190
Heron Randall A Erik Lie 2007 Does backdating explain the stock price pattern around
executive stock option grants Journal of Financial Economics 83 271-295
Hribar Paul Nicole Thorne Jenkins and W Bruce Johnson 2006 Stock repurchases as an
earnings management device Journal of Accounting and Economics 41 3ndash27
Jensen Michael C 1986 Agency cost of free cash flow corporate finance and takeovers
American Economic Review 76 323-329
Jolls Christine 1998 Stock repurchases and incentive compensation NBER Working Paper No
w6467
Jung Boochun Woo-Jong Lee and Yanhua Sunny Yang 2016 The Impact of Dividend
Covenants on Investment and Operating Performance Journal of Business Finance amp
Accounting 43 414ndash447
Kahle Kathleen M 2002 When a buyback isnrsquot a buyback open market repurchases and
employee options Journal of Financial Economics 63 235ndash261
Lambert Richard A William N Lanen and David F Larcker 1989 Executive stock option plans
and corporate dividend policy Journal of Financial and Quantitative Analysis 24 409ndash425
Lintner John 1956 Distribution of incomes of corporations among dividends retained earnings
and taxes The American Economic Review 46 97-113
Low Angie 2009 Managerial risk-taking behavior and equity-based compensation Journal of
Financial Economics 92 470-490
Miller Merton H and Franco Modigliani 1961 Dividend policy growth and the valuation of
shares The Journal of Business 34 411ndash433
Minnick Kristina and Leonard Rosenthal 2015 Stealth compensation Do CEOs increase their
pay by influencing dividend policy Journal of Corporate Finance 25 435-454
40
Murphy Kevin J 1999 Executive compensation In O Ashenfelter and D Card (eds) North
Holland Handbook of Labor Economics Amsterdam Elsevier Science BV
Murphy Kevin J 2013 Executive compensation Where we are and how we got there Handbook
of the Economics of Finance Elsevier Science North Holland 211-356
Nikolaev Valeri 2010 Debt Covenants and Accounting Conservatism Journal of Accounting
Research 48 143-176
Puri Manju Joumlrg Rocholl and Sascha Steffen 2011 Global retail lending in the aftermath of the
US financial crisis Distinguishing between supply and demand effects Journal of Financial
Economics 100 556-578
Shue Kelly and Richard R Townsend 2014 Swinging for the fences Executive reactions to
quasi-random option grants Working Paper University of Chicago
Skinner Douglas J 2008 The evolving relation between earnings dividends and stock
repurchases Journal of Financial Economics 87 582-609
Weisbenner Scott J 2000 Corporate share repurchases in the 1990s What role do stock options
play FEDS Working Paper No 2000-29
Zhang Dan 2013 CEO dividend protection Working Paper BI Norwegian Business School
41
Figure 1 Trends of dividends and repurchases from 2003 to 2007 Panel A plots the average
Regular DividendTotal Assets of firms in the highest and lowest quartiles of Accounting Impact
measured in 2002 Panel B shows the average Total RepurchaseTotal Assets of firms in the
highest and lowest quartiles of Accounting Impact measured in 2002
Panel A Trends of regular dividends
Panel B Trends of total repurchases
00
05
10
15
20
2003 2004 2005 2006 2007
Regular DividendTotal Assets
Lowest Acc Impact
Highest Acc Impact
Pre Post
00
20
40
60
80
100
2003 2004 2005 2006 2007
Total Repurchase Total Assets
Lowest Acc Impact
Highest Acc Impact
Pre Post
42
Table 1
Summary Statistics
Panel A Firm characteristics - full sample
N Mean Std dev 25 pctl Median 75 pctl
Accounting impact (2002) 1176 173 366 022 052 163
Payout variablesRegular dividendTotal assets 5653 093 148 000 000 142
RepurchaseTotal assets 5653 394 710 000 035 500
Total payoutTotal assets 5653 488 748 000 175 666
Regular dividendTotal payout 4091 3874 4057 000 2237 8833
Level of executive compensation (in $1000)
Salary_$ 5653 450 190 314 409 544
Bonus_$ 5653 476 616 122 295 586
Option grant_$ 5653 791 1137 62 384 1002
Restricted stock grant_$ 5653 458 866 0 58 518
Total pay_$ 5653 2481 2475 890 1647 3074
Percentage of executive compensation
Salary_ 5653 296 183 165 251 382
Bonus_ 5653 197 148 97 177 268
Option grant_ 5653 283 235 67 256 445
Restricted stock grant_ 5653 141 180 00 41 249
Control variables
Size ($M) 5653 11086 27294 1017 2459 8117
Log(size) 5653 7985 1565 6925 7808 9002
Book-to-market 5653 0445 0287 0251 0388 0578
Leverage 5653 0202 0172 0038 0187 0309
Asset tangibility 5653 0806 0184 0691 0853 0965
Free cash flow 5653 0059 0091 0013 0059 0108
Cash holding 5653 0166 0172 0034 0100 0247
ROA volatility 5653 0056 0056 0021 0038 0070
Institutional ownership 5653 0753 0202 0639 0795 0910
Sales growth 5653 0121 0189 0028 0096 0183
Past stock return 5653 0094 0183 -0012 0094 0199
Loss indicator 5653 0164 0370 0000 0000 0000
This table presents summary statistics Panel A shows the descriptive statistics of payout variables compensation
variables and other firm characteristics for the full sample Accounting impact is the implied option expense
measured at fiscal year 2002 All other variables are measured at firm-year level from fiscal year 2003 to 2007
resulting in 5653 firm-year observations (except for Regular dividendTotal Payout which can be measured only
for the 4901 firm-year observations with Total payout greater than zero) Panel B shows the pairwise correlations
between main variables at firm-year level Panel C compares payout variables compensation variables and other
firm characteristics before and after FAS123R The Pre-FAS123R period consists of fiscal year 2003 and 2004
the Post-FAS123R period covers fiscal year 2005-2007 Panel D compares the trends of payout and compensation
variables around FAS123R across four quartile groups ranked by 2002 accounting impact Panel E compares the
trends of payout and compensation variables around FAS123R between the treated and control group under the
alternative treatment definition in Bakke et al (2015) (see Section 22) All variables are defined in Appendix The
notation and in Panel C indicates statistically significant at 10 5 and 1 level in T-tests for equal
means respectively
43
Pa
nel
B
Pea
rso
n c
orr
ela
tio
ns
Reg div
Repurchase
Total payout
Salary_
Bonus_
Option_
RS_
Log(size)
BM
Leverage
Tangibility
FCF
Cash holdingROA vol
Inst own
Sales growth
Past ret
urn
Loss
Reg
div
10
0
Repurc
hase
01
610
0
Tota
l payout
03
509
810
0
Sala
ry_
-0
10
-01
8-0
19
10
0
Bonus_
00
700
100
3-0
01
10
0
Option_
-0
10
00
900
6-0
41
-03
510
0
RS
_
01
000
901
0-0
32
-01
1-0
40
10
0
Log(s
ize)
03
101
802
3-0
56
01
101
202
210
0
BM
-02
1-0
28
-03
103
0-0
03
-02
000
0-0
33
10
0
Levera
ge
-00
1-0
08
-00
8-0
05
00
6-0
11
00
801
9-0
03
10
0
Tangib
ility
00
200
100
101
200
1-0
05
-00
6-0
12
-00
4-0
18
10
0
FC
F02
203
703
9-0
20
00
901
1-0
01
02
4-0
32
-02
1-0
16
10
0
Cash
hold
ing
-01
301
000
700
2-0
14
02
2-0
10
-02
3-0
16
-03
502
901
210
0
RO
A v
ol
-01
5-0
04
-00
700
4-0
11
01
9-0
11
-02
3-0
08
-01
101
2-0
02
03
910
0
Inst
ow
n
-00
901
401
1-0
17
00
200
701
200
7-0
01
00
3-0
08
01
4-0
06
-01
110
0
Sale
s gro
wth
-00
8-0
04
-00
6-0
15
00
501
0-0
02
00
7-0
16
-00
3-0
08
01
300
201
400
410
0
Past
retu
rn00
901
301
4-0
18
01
5-0
01
00
301
6-0
29
-01
000
102
7-0
14
-01
001
602
710
0
Loss
-02
0-0
19
-02
201
8-0
18
00
4-0
05
-02
601
901
300
6-0
41
01
702
3-0
16
-01
8-0
40
10
0
44
Panel C Firm characteristics - before and after FAS123R
Pre FAS 123R Post FAS 123R Difference
Payout variables
Regular dividendTotal assets 083 099 016
RepurchaseTotal assets 245 490 245
Total payoutTotal assets 328 589 261
Regular dividendTotal payout 3914 2790 -1124
Level of executive compensation (in $1000)
Salary_$ 426 463 37
Bonus_$ 418 505 87
Option grant_$ 896 707 -191
Restricted stock grant_$ 269 574 305
Total pay_$ 2263 2584 321
Percentage of executive compensation
Salary_ 305 293 -12
Bonus_ 186 204 18
Option grant_ 343 240 -103
Restricted stock grant_ 87 176 89
Control variables
Size ($M) 9671 11631 1960
Log(size) 7860 8035 0175
Book-to-market 0437 0453 0016
Leverage 0201 0203 0002
Asset tangibility 0822 0793 -0029
Free cash flow 0061 0057 -0004
Cash holding 0175 0159 -0016
ROA volatility 0067 0048 -0019
Institutional ownership 0712 0781 0069
Sales growth 0137 0108 -0029
Past stock return 0080 0101 0021
Loss indicator 0173 0159 -0014
45
Pa
nel
D
Fir
m c
ha
racte
rist
ics
by q
ua
rtil
e o
f a
cco
un
tin
g i
mp
act
- b
efo
re a
nd
aft
er
FA
S1
23
R
Accounting im
pact
(2002)
Num
ber
of
Fir
ms
Pre
Post
Pre
Post
Pre
Post
Pre
Post
Payout
vari
able
s
Regula
r div
idendT
ota
l ass
ets
11
2
12
4
09
4
11
1
09
5
11
3
03
0
04
9
Repurc
hase
Tota
l ass
ets
11
3
26
8
19
2
37
3
32
7
63
1
35
1
68
7
Tota
l payout
Tota
l ass
ets
22
4
39
1
28
5
48
4
42
2
74
4
38
1
73
6
Regula
r div
idendT
ota
l payout
643
7
469
8
474
0
341
1
284
5
195
4
82
5
74
5
Perc
enta
ge o
f executive c
om
pensa
tion
Sala
ry_
337
295
313
287
296
289
276
300
Bonus_
223
226
214
228
172
192
134
169
Option g
rant_
201
167
290
210
373
260
507
325
Rest
ricte
d s
tock g
rant_
116
194
98
180
89
176
43
155
294
294
294
294
1st Q
uart
ile2
nd Q
uart
ile3
rd Q
uart
ile4
th Q
uart
ile
01
2
03
5
09
3
55
1
46
Accounting impact
Number of Firms
By accounting impact quartile
1
2
3
4
Pre Post Pre Post
Payout variables
Regular dividendTotal assets 09 11 08 10
RepurchaseTotal assets 18 31 26 52
Total payoutTotal assets 28 43 34 62
Regular dividendTotal payout 428 357 386 265
Percentage of executive compensation
Salary_ 435 364 282 280
Bonus_ 226 214 179 202
Option grant_ 92 125 387 261
Restricted stock grant_ 125 188 80 174
Percentage of CEO compensation
Salary_(CEO) 485 364 260 259
Bonus_(CEO) 249 228 185 219
Option grant_(CEO) 10 127 406 275
Restricted stock grant_(CEO) 128 182 82 183
Panel E Firm characteristics by alternative treatment definition - before and
after FAS123R
Treated
25
19
997
223
250
256
268
10
177
71
Control
44
37
47
Table 2
Differential effect of FAS123R on the use of option-based compensation
Panel A Two-period first-difference regression
Prediction Coeff t-stat Coeff t-stat Coeff t-stat
Accounting impact rank - -0044 -628
Accounting impact rank=2 - -0044 -327
Accounting impact rank=3 - -0075 -468
Accounting impact rank=4 - -0140 -613
Treated - -0132 -875
ΔLog(size) 0061 202 0061 200 0063 214
ΔBook-to-market 0032 091 0032 092 0051 143
ΔLeverage -0157 -213 -0160 -218 -0111 -153
ΔAsset tangibility -0012 -014 -0020 -023 -0023 -026
ΔFree cash flow -0106 -095 -0108 -097 -0128 -117
ΔCash holding -0197 -211 -0193 -206 -0180 -194
ΔFive-year ROA volatility -0065 -031 -0056 -026 -0098 -047
ΔInstitutional ownership -0044 -091 -0043 -088 -0044 -092
ΔSales growth -0064 -102 -0065 -104 -0090 -153
ΔPast one-year stock return 0051 078 0052 080 0091 138
ΔLoss frequency 0056 207 0057 207 0047 179
Log(size) -0009 -210 -0009 -207 -0002 -035
Book-to-market -0015 -056 -0013 -049 0018 072
Leverage 0022 046 0023 048 0068 150
Asset tangibility 0033 077 0033 078 0053 128
Free cash flow 0227 202 0220 195 0127 117
Cash holding -0002 -004 0012 019 -0078 -141
Five-year ROA volatility -0451 -240 -0430 -228 -0509 -283
Institutional ownership -0123 -360 -0122 -359 -0100 -292
Sales growth -0041 -056 -0040 -055 -0089 -125
Past one-year stock return -0009 -015 -0006 -010 0078 125
Loss frequency 0055 174 0056 178 0054 173
Fixed effect
Standard error
Adj R-squared
Observations
Model (3)
Dependent variable ΔAvg Option grantTotal pay
Huber-White
0156
This table investigates whether the effect of FAS123R on the use of option-based pay varies with its potential accounting impact Panel A
reports the results of estimating three two-period first-differencing models where for each firm we average its characteristics in Pre- and
Post-FAS123R period The Pre-FAS123R period consists of fiscal year 2003 and 2004 the Post-FAS123R period covers fiscal year 2005-
2007 In all three specifications the dependent variable is the change of average Option grantTotal pay from Pre- to Post-FAS123R period
The main independent variable varies by model in Model (1) the Accounting impact rank is the quartile rank of implied option expensetotal
assets measured in 2002 (1=lowest 4=highest) In Model (2) Accounting impact rank=2 (3 4) is an indicator that takes value of one if the
firmrsquos Accounting impact rank equals 2 (3 4) In Model (3) we use an alternative treatment construction following Bakke et al (2015)
where Treated is an indicator that takes value of zero if the firm granted zero option to its CEO in both 2003 and 2004 or the firm began to
voluntarily expense option-based pay at fair value in 2002 or earlier and one otherwise For each control variable we include both its level in
the Pre-FAS123R period and its change across the two periods Panel B shows the results of estimating fixed effect models with firm-year
observations The dependent variable is the firm-year level Option grantTotal pay The main independent variables are the interactions of
Post-FAS123R indicator (Post) with Accounting Impact rank Accounting impact rank indicators and Treated respectively All models in
Penal A have industry fixed effects and the standard errors are Huber-White heteroscedasticity-consistent standard errors All models in
Penal B have firm fixed effects and year fixed effects and the standard errors are clustered at firm level All variables are defined in
Appendix The notation and indicates statistically significant at 10 5 and 1 level respectively
Model (1) Model (2)
11711171 1171
Industry Industry
Huber-White
0124
Huber-White
0123
Industry
48
Panel B Panel fixed effects regression
Prediction Coeff t-stat Coeff t-stat Coeff t-stat
Acc impact rank x Post - -0044 -807
Acc impact rank 2 x Post - -0046 -333
Acc impact rank 3 x Post - -0077 -526
Acc impact rank 4 x Post - -0137 -776
Treated x Post - -0145 -970
Log(size) 0034 221 0034 217 0036 229
Book-to-market 0018 084 0017 083 0015 070
Leverage -0004 -009 -0006 -013 -0007 -015
Asset tangibility 0007 012 0004 006 0011 018
Free cash flow -0074 -151 -0072 -146 -0078 -158
Cash holding -0048 -086 -0050 -090 -0006 -011
Five-year ROA volatility 0250 231 0239 219 0437 414
Institutional ownership 0043 159 0044 161 0041 150
Sales growth -0033 -168 -0034 -171 -0031 -158
Past one-year stock return 0067 221 0068 224 0063 204
Loss indicator 0023 209 0022 207 0024 222
Fixed effects
Standard error
Adj R-squared
Observations
Dependent variable Option grantTotal pay
5653 5653 5653
Clustered by firm
Firm Year
Clustered by firm
Firm Year
Clustered by firm
0523 0523 0526
Model (1) Model (2) Model (3)
Firm Year
49
Table 3
Effect of option-based compensation on dividend policy
Panel A Two-period first-difference regression
Prediction Coeff t-stat Coeff t-stat Coeff t-stat
Accounting impact rank + 0000 077
Accounting impact rank=2 + 0001 091
Accounting impact rank=3 + 0000 044
Accounting impact rank=4 + 0001 092
Treated + 0000 -026
ΔLog(size) 0000 -030 0000 -030 0000 -026
ΔBook-to-market -0002 -190 -0002 -193 -0002 -195
ΔLeverage -0002 -059 -0002 -057 -0002 -059
ΔAsset tangibility 0016 431 0016 429 0016 430
ΔFree cash flow 0017 373 0017 373 0017 375
ΔCash holding -0011 -288 -0011 -285 -0010 -282
ΔFive-year ROA volatility 0003 034 0002 032 0003 035
ΔInstitutional ownership -0002 -073 -0002 -073 -0002 -070
ΔSales growth -0001 -040 -0001 -037 -0001 -038
ΔPast one-year stock return 0002 077 0002 076 0002 070
ΔLoss frequency 0000 -048 0000 -045 0000 -046
Log(size) 0000 183 0000 182 0000 182
Book-to-market -0002 -227 -0002 -225 -0002 -284
Leverage -0001 -037 -0001 -039 -0001 -048
Asset tangibility 0003 179 0003 180 0003 176
Free cash flow 0017 291 0017 291 0017 300
Cash holding 0002 080 0002 077 0002 098
Five-year ROA volatility 0003 035 0002 033 0003 044
Institutional ownership -0001 -068 -0001 -068 -0001 -058
Sales growth -0004 -177 -0004 -175 -0004 -172
Past one-year stock return 0004 169 0004 167 0004 165
Loss frequency -0001 -111 -0001 -109 -0001 -102
Fixed effect
Standard error
Adj R-squared
Observations
Dependent variable ΔAvg Regular dividendTotal assets
This table investigates the causal effect of option-based pay on dividend policy by examining whether changes in dividend policy around
FAS123R vary with its potential accounting impact Panel A reports the results of estimating three two-period first-differencing models
where for each firm we average its characteristics in Pre- and Post-FAS123R period In all three specifications the dependent variable is
the change of average Regular dividendTotal assets from Pre- to Post-FAS123R period The main independent variable varies by model in
Model (1) the Accounting impact rank is the quartile rank of implied option expensetotal assets measured in 2002 (1=lowest 4=highest) In
Model (2) Accounting impact rank=2 (3 4) is an indicator that takes value of one if the firmrsquos Accounting impact rank equals 2 (3 4) In
Model (3) we use an alternative treatment construction following Bakke et al (2015) where Treated is an indicator that takes value of zero
if the firm granted zero option to its CEO in both 2003 and 2004 or the firm began to voluntarily expense option-based pay at fair value in
2002 or earlier and one otherwise For each control variable we include both its level in the Pre-FAS123R period and its change across the
two periods Panel B shows the results of estimating fixed effect models with firm-year observations The dependent variable is the firm-
year level Regular dividendTotal assets The main independent variables are the interactions of Post-FAS123R indicator (Post) with
Accounting Impact rank Accounting impact rank indicators and Treated respectively Panel C examines the intensity of dividend changes
among firms with nonzero dividend per share in 2003 or 2004 In particular we estimates the same three models as in Panel A(with the
same independent variables) but for five dependent variables the change of average Regular dividendTotal assets from Pre- to Post-
FAS123R period (as in Panel A) the percentage change of DPS (dividend per share) from Pre- to Post-FAS123R period and three
indicators denoting respectively whether the percentage change of DPS was greater than 20 40 and 60 Panel D reports four
robustness tests of the dividend intensity regression In each of them a set of possible confounding observations is removed (see Section 33
for details) Panel E compares the trends of dividend initiation and termination around FAS123R across four quartile groups ranked by
accounting impact All models in Panel A C and D have industry fixed effects and the standard errors are Huber-White heteroscedasticity-
consistent standard errors All models in Penal B have firm fixed effects and year fixed effects and the standard errors are clustered at
firm level All variables are defined in Appendix The notation and indicates statistically significant at 10 5 and 1 level
Industry Industry Industry
Model (1) Model (2) Model (3)
1171 1171 1171
Huber-White Huber-White Huber-White
0105 0104 0105
50
Panel B Panel fixed effects regression
Prediction Coeff t-stat Coeff t-stat Coeff t-stat
Acc impact rank x Post + 0000 122
Acc impact rank 2 x Post + 0001 110
Acc impact rank 3 x Post + 0001 094
Acc impact rank 4 x Post + 0001 129
Treated x Post + 0000 -012
Log(size) 0001 179 0001 179 0001 181
Book-to-market 0000 025 0000 024 0000 031
Leverage 0001 062 0001 064 0001 069
Asset tangibility 0009 360 0009 358 0009 363
Free cash flow 0002 090 0002 093 0002 092
Cash holding -0007 -295 -0007 -298 -0007 -298
Five-year ROA volatility 0001 041 0001 038 0000 -006
Institutional ownership 0000 -027 0000 -026 0000 -027
Sales growth 0000 053 0000 051 0000 044
Past one-year stock return 0001 089 0001 088 0001 078
Loss indicator 0000 -060 0000 -057 0000 -076
Fixed effects
Standard error
Adj R-squared
Observations
Dependent variable Regular dividendTotal assets
Model (1) Model (2) Model (3)
Firm Year Firm Year Firm Year
5653 5653 5653
Clustered by firm Clustered by firm Clustered by firm
0877 0877 0877
51
Panel C Intensity of dividend changes around FAS123R
Prediction Coeff t-stat Coeff t-stat Coeff t-stat
Accounting impact rank + 0000 065
Accounting impact rank=2 + 0000 048
Accounting impact rank=3 + 0000 026
Accounting impact rank=4 + 0002 080
Treated + 0001 063
Dependent var DPS pct change
Accounting impact rank + -0145 -072
Accounting impact rank=2 + 0018 006
Accounting impact rank=3 + -0177 -045
Accounting impact rank=4 + -0746 -100
Treated + -0407 -119
Accounting impact rank + 0029 095
Accounting impact rank=2 + 0040 074
Accounting impact rank=3 + 0092 139
Accounting impact rank=4 + 0008 007
Treated + -0007 -012
Accounting impact rank + 0024 076
Accounting impact rank=2 + 0047 088
Accounting impact rank=3 + 0079 114
Accounting impact rank=4 + -0003 -002
Treated + 0030 052
Accounting impact rank + 0030 098
Accounting impact rank=2 + 0078 155
Accounting impact rank=3 + 0085 130
Accounting impact rank=4 + 0014 012
Treated + -0006 -011
Control variables
Fixed effect
Standard error
Observations 572 572 572
Yes Yes Yes
Huber-White Huber-White Huber-White
Industry Industry Industry
Dependent var DPS pct
change gt60 indicator
Model (1) Model (2) Model (3)
Dependent var ΔAvg Regular
dividendAssets
Dependent var DPS pct
change gt20 indicator
Dependent var DPS pct
change gt40 indicator
52
Panel D Robustness tests for intensity of dividend changes around FAS123R
Prediction Coeff t-stat Coeff t-stat Coeff t-stat
Accounting impact rank + 0006 017
Accounting impact rank=2 + 0067 118
Accounting impact rank=3 + 0041 057
Accounting impact rank=4 + -0061 -049
Treated + 0022 035Observations
Accounting impact rank + 0009 027
Accounting impact rank=2 + 0058 106
Accounting impact rank=3 + 0032 043
Accounting impact rank=4 + -0032 -024
Treated + 0018 028
Observations
Accounting impact rank + 0030 089
Accounting impact rank=2 + 0039 071
Accounting impact rank=3 + 0122 168
Accounting impact rank=4 + -0063 -052
Treated + 0075 132
Observations
Accounting impact rank + 0008 023
Accounting impact rank=2 + 0023 042
Accounting impact rank=3 + 0048 064
Accounting impact rank=4 + -0042 -033
Treated + -0010 -016
Observations
Control variables
Fixed effect
Standard error
Exclude firms with stable
payout ratio from 2003 to 2004
506 506 506
Dependent variable DPS pct change gt40 indicator
Model (1) Model (2) Model (3)
Exclude voluntary expensers
519 519
Exclude firms in the top decile
of option reduction (02-04)
Exclude firms that accelerated
option vesting
504 504 504
517 517 517
519
Huber-White Huber-White Huber-White
Yes Yes Yes
Industry Industry Industry
53
Panel E Dividend initiation and termination rates around FAS123R
Pre FAS 123R
1 280 75 7 6 13 173
2 284 135 18 9 27 200
3 286 181 11 14 25 138
4 282 260 9 10 19 73
Total 1132 651 45 39 84 129
Post FAS 123R
1 275 63 4 4 8 127
2 280 116 9 9 18 155
3 276 152 9 3 12 79
4 263 223 5 1 6 27
Total 1094 554 27 17 44 79
Pre FAS 123R
1 280 205 2 0 2 10
2 284 149 7 1 8 54
3 286 105 0 0 0 00
4 282 22 0 0 0 00
Total 1132 481 9 1 10 21
Post FAS 123R
1 275 212 3 6 9 42
2 280 164 1 2 3 18
3 276 124 1 1 2 16
4 263 40 0 3 3 75
Total 1094 540 5 12 17 31
termination
in 2004
03-04
cumulative
03-04
cumulative
Quartile firms
with
dividend in
2004
termination
in 2005
termination
in 2006
05-06
cumulative
05-06
cumulative
Termination
Quartile firms
with
dividend in
2002
termination
in 2003
without
dividend in
2004
initiation in
2003
initiation in
2004
03-04
cumulative
03-04
cumulative firmsQuartile
firmsQuartile initiation in
2005
initiation in
2006
05-06
cumulative
05-06
cumulative
Initiation
without
dividend in
2002
54
Table 4
Effect of option-based compensation on repurchases
Panel A Two-period first-difference regression with total repurchase
Prediction Coeff t-stat Coeff t-stat Coeff t-stat
Accounting impact rank - 0002 122
Accounting impact rank=2 - 0002 071
Accounting impact rank=3 - 0005 123
Accounting impact rank=4 - 0007 102
Treated - 0014 365
Control variables
Fixed effect
Standard error
Adj R-squared
Observations
Panel B Two-period first-difference regression with net repurchase
Prediction Coeff t-stat Coeff t-stat Coeff t-stat
Accounting impact rank - 0003 166
Accounting impact rank=2 - 0002 051
Accounting impact rank=3 - 0006 165
Accounting impact rank=4 - 0009 137
Treated - 0010 300
Control variables
Fixed effect
Standard error
Adj R-squared
Observations
Panel C Two-period first-difference regression with repurchase adjusted for exercised options
Prediction Coeff t-stat Coeff t-stat Coeff t-stat
Accounting impact rank - 0001 056
Accounting impact rank=2 - 0002 062
Accounting impact rank=3 - 0007 172
Accounting impact rank=4 - -0001 -008
Treated - 0006 197
Control variables
Fixed effect
Standard error
Adj R-squared
Observations
Dependent variable ΔAvg RepurchaseTotal assets
This table investigates the causal effect of option-based pay on payout policy by examining whether the changes of repurchase around
FAS123R vary with its potential accounting impact Panel A reports the results of estimating three two-period first-differencing models
where for each firm we average its characteristics in Pre- and Post-FAS123R period In all three specifications the dependent variable is
the change of average RepurchaseTotal assets from Pre- to Post-FAS123R period The main independent variable varies by model in
Model (1) the Accounting impact rank is the quartile rank of implied option expensetotal assets measured in 2002 (1=lowest 4=highest)
In Model (2) Accounting impact rank=2 (3 4) is an indicator that takes value of one if the firmrsquos Accounting impact rank equals 2 (3 4)
In Model (3) we use an alternative treatment construction following Bakke et al (2015) where Treated is an indicator that takes value of
zero if the firm granted zero option to its CEO in both 2003 and 2004 or the firm began to voluntarily expense option-based pay at fair
value in 2002 or earlier and one otherwise Panel B reports the regressions with the change of Net repurchaseTotal assets as the
dependent variable and the same independent variable as in Panel A Panel C reports the regressions with the change of Adjusted
repurchaseTotal assets as the dependent variable and the same independent variable as in Panel A All models in Panel A B and C have
industry fixed effects and the standard errors are Huber-White heteroscedasticity-consistent standard errors All variables are defined in
Appendix The notation and indicates statistically significant at 10 5 and 1 level respectively
Model (1) Model (2) Model (3)
Yes Yes Yes
Industry Industry Industry
Huber-White Huber-White Huber-White
Dependent variable ΔAvg Net repurchaseTotal assets
1171 1171 1171
0238 0237 0245
Model (1) Model (2) Model (3)
Yes Yes Yes
Industry Industry Industry
Huber-White Huber-White Huber-White
Dependent variable ΔAvg Adjusted repurchaseTotal assets
0229 0229 0233
1171 1171 1171
Model (1) Model (2) Model (3)
Yes Yes Yes
Industry Industry Industry
Huber-White Huber-White Huber-White
0111 0112 0114
1168 1168 1168
55
Table 5
Effect of option-based compensation on payout mix
Panel A Two-period first-difference regression with total payout mix
Prediction Coeff t-stat Coeff t-stat Coeff t-stat
Accounting impact rank + 0006 028
Accounting impact rank=2 + 0018 045
Accounting impact rank=3 + -0001 -001
Accounting impact rank=4 + 0043 052
Treated + -0035 -094
Control variables
Fixed effect
Standard error
Adj R-squared
Observations
Panel B Two-period first-difference regression with net payout mix
Prediction Coeff t-stat Coeff t-stat Coeff t-stat
Accounting impact rank + -0002 -008
Accounting impact rank=2 + 0008 016
Accounting impact rank=3 + 0018 034
Accounting impact rank=4 + -0059 -055
Treated + -0050 -101
Control variables
Fixed effect
Standard error
Adj R-squared
Observations
0049 0043 0054
257 257 257
Industry Industry Industry
Huber-White Huber-White Huber-White
Dependent variable ΔAvg Regular dividendNet payout
Model (1) Model (2) Model (3)
Yes Yes Yes
0154 0151 0156
362 362 362
Industry Industry Industry
Huber-White Huber-White Huber-White
This table investigates the causal effect of option-based pay on payout mix for firms using both dividend and repurchase by examining
whether the changes of payout mix around FAS123R vary with its potential accounting impact Panel A reports the results of estimating
three two-period first-differencing models where for each firm we average its characteristics in Pre- and Post-FAS123R period In all three
specifications the dependent variable is the change of average Regular dividendTotal payout from Pre- to Post-FAS123R period The main
independent variable varies by model in Model (1) the Accounting impact rank is the quartile rank of implied option expensetotal assets
measured in 2002 (1=lowest 4=highest) In Model (2) Accounting impact rank=2 (3 4) is an indicator that takes value of one if the firmrsquos
Accounting impact rank equals 2 (3 4) In Model (3) we use an alternative treatment construction following Bakke et al (2015) where
Treated is an indicator that takes value of zero if the firm granted zero option to its CEO in both 2003 and 2004 or the firm began to
voluntarily expense option-based pay at fair value in 2002 or earlier and one otherwise Panel B reports the regressions with the change of
Regular dividendNet payout as the dependent variable and the same independent variables as in Panel A Panel A (Panel B) is based on
observations with nonzero regular dividend and repurchase (net repurchase) in both Pre- and Post-FAS123R period All models in Panel A
and B have industry fixed effects and the standard errors are Huber-White heteroscedasticity-consistent standard errors All variables are
defined in Appendix The notation and indicates statistically significant at 10 5 and 1 level respectively
Yes Yes Yes
Dependent variable ΔAvg Regular dividendTotal payout
Model (1) Model (2) Model (3)

23
occurred for both executive and non-executive employee stock options Indeed Brown and Lee
(2011) report a similar decrease in executive and employee stock options around FAS123R
33 Option-Based Pay and Dividend Payouts
In this section we examine the effect of an exogenous (accounting-induced) change in option
compensation on dividend policy by estimating Equation (2)
Table 3 Panel A presents the results using the change in dividends from Pre to Post as
dependent variable We find no significant association between Accounting Impact (column 1 and
2) or Treated (column 3) and the change in dividends around the adoption of FAS123R This is in
stark contrast with the negative effect of option-based pay on dividends predicted in the literature
and documented in various association studies
One concern with this lack of effect is that perhaps our setting is not powerful enough to detect
it One way to examine this possibility is the following The coefficient on Accounting Impact
rank=4 in column 2 is 0001 and the standard error (SE) is 00009 Assuming the estimated
standard error is correct then for a two-tailed t test the coefficient needs to be greater than 00015
(=SE1645) or 015 to reach the 10 percent significant level In other words if moving from
the bottom to the top quartile (which predicts a 14 differential decline in option based pay as per
Table 2 Panel A) resulted in a 015 increase of the dividendasset ratio our test would be able to
detect a causal effect of option-based pay on dividends Given the unconditional mean of the
dividendasset ratio at 093 an increase of 015 from the Pre to the Post period seems
plausible In fact the average increase from the Pre to the Post period is 016 (Table 1 Panel C)
Thus if an effect was there our test should detect it
24
Panel B presents the results using a panel regression (5653 firm-year observations) with firm-
and year-fixed effects and interaction terms between Accounting Impact (or Treated) and an
indicator for the Post period Our inferences are unchanged
These analyses are based on our full sample which includes both dividend-paying and non-
dividend-paying firms Hence they implicity treat as equal two potentially different decisions to
initiate dividends and to increase dividends For example an increase in the dividend-to-asset
ratio from 05 to 06 will be treated the same as an increase from 00 to 01 even though
the latter represents a critical dividend initiation decision23 To address this following Chetty and
Saez (2005) we separately examine how FAS123R impacts the intensity of dividend changes (for
the subset of payers) and the likelihood of dividend initiations (for the subset of non-payers)
331 Option-Based Pay and Dividend Payouts Intensity of Dividend Changes
In the first row of Panel C we repeat the analysis in Panel A for the sub-sample of 572 payers
defined as firms with positive DPS in 2003 andor 2004 Note that we report only the coefficients
of interest for parsimony In the second row we replace the dependent variable with the
percentage change in DPS DPS is the choice variable for managers (Brav et al 2005 Baker and
Wurgler 2016) and thus our preferred measure to capture changes in dividend policy To account
for skewness in this variable (Khale 2002) in the third fourth and fifth rows we use indicator
variables to denote whether the change in DPS surpasses a threshold respectively 20 40 and
60 The proportion of firms that surpass these thresholds are 59 44 and 33 respectively24
23 Initiating dividends is a critical decision for boards given the pre-commitment value that investors attach to this
decision and the strong negative market reaction when firms eliminate or reduce dividends (Brav et al 2005) For
executives trying to maximize the value of their own stock options (dividend-protection argument) the ability to
influence a dividend initiation decision is likely lower than the ability to influence a dividend increase decision 24 Although in the third fourth and fifth rows our dependent variable is a binary variable we use a linear model (OLS)
instead of a probit or logit nonlinear model The reason is that estimating fixed effects in binary response models with
panel data can cause the incidental parameters problem The coefficient estimates can be biased when the panel data
25
Across all of these specifications we find no association between Accounting Impact or Treated
and the intensity of dividend changes Thus it does not appear that an exogenous reduction in
option-based pay caused dividend-paying firms to increase dividends
In Panel D we perform four robustness tests For parsimony we show only the coefficients of
interest and only the cases where the dependent variable is an indicator denoting a greater than
40 increase in DPS The results are similar for the other four ldquointensityrdquo dependent variables
reported in Panel C
In the first row we exclude firms that began to voluntarily expense options in 2003 or 2004
(84 firms of which 68 are dividend payers) FASB added accounting for stock-based
compensation to its agenda in March 2003 and issued an Exposure Draft proposing the expensing
of stock options at fair value in March 2004 In anticipation a number of firms began to
voluntarily expense stock options in 2003 and 2004 (Aboody et al 2004) If these firms reduced
option grants and as a result increased dividends during the Pre period then their inclusion may
reduce the power of our tests and thus our ability to detect the hypothesized relation25
In a similar spirit in the second row we exclude firms in the top decile in terms of reduction in
the ratio of option grants to total pay for the top 5 executives between 2002 (the year prior to the
Pre-period) and 2004 (the end of the Pre-period) This encompasses 113 firms of which 55 are
dividend payers If these firms reduced option grants in anticipation of FAS123R and as a result
increased dividends during the Pre period their inclusion may reduce our ability to detect the
hypothesized relation
has a large number of observations but a short time series Examples of studies making a similar choice are Puri
Rocholl and Steffen (2011) and Chu and Ma (2015) 25 This is unlikely to be a serious concern as previous studies suggest that voluntary expensers made limited use of
stock options (Aboody et al 2004) In fact in our sample 79 of these firms are in the bottom two quartiles of
implied option expense (untabulated) Nonetheless we present this test for robustness
26
In the third row we exclude firms that accelerated the vesting of options before FAS123R
became effective in order to avoid recognizing an expense for the unvested portion of these
options (Choudhary et al 2009 Balsam Reitenga and Yin 2008) This encompasses 196 firms of
which 54 are dividend payers If accelerating vesting was used to reduce the impact of FAS123R
the inclusion of these firms may reduce the power of our tests26
In the fourth row we deal with the concern that if firms target a fixed dividend to net income
ratio (Lintner 1956) and do so without adjusting for changes in accounting standards then by
decreasing net income (via option expense) the accounting change would mechanically cause a
reduction in dividends This would potentially offset and confound the increase predicted under
the dividend-protection and dilution hypotheses This seems unlikely for two reasons First firms
are notoriously reluctant to cut dividends (Brav et al 2005) Hence it seems unlikely that they
would reduce dividends in response to a decline in net income with no economic or cash flow
implications (ie re-classification of an expense from the footnotes to the income statement)
Second firms today set dividends in terms of dividend per share rather than by targeting a net
income-based payout ratio (Brav et al (2005)) As noted by Skinner (2008) over the last few
decades as earnings have become more variable the relation between earnings and dividends has
become weaker with dividend payments increasing smoothly and largely independent of the
variation in earnings Nevertheless in the fourth row we exclude the 66 dividend-paying firms that
26 These firms explicitly stated that they accelerated the vesting of stock options to avoid the accounting charge
(Choudhary et al 2009) In fact 72 are classified in the top two quartiles of implied option expense (untabulated)
Thus we would have predicted these firms to experience a significant decline in option pay To the extent that this
decline did not materialize because they minimized the impact of FAS123R by accelerating vesting the ability of
Accounting Impact to predict the reduction in option pay and thus its usefulness in examining changes in dividends
around FAS123R may be reduced The list of firms accelerating vesting was kindly provided by Jack Ciesielsky of
The Analystsrsquo Accounting Observer
27
had a similar payout ratio in 2003 and 2004 as a proxy for firms with a target net income-based
payout ratio in the Pre period27
As shown in Panel D even after excluding these subsets of firms we continue to find no
association between Accounting Impact or Treated and changes in dividends for dividend-paying
firms This is inconsistent with a causal influence of option compensation on dividend policy
Another concern is that by reducing net income and thus retained earnings FAS123R
may have pushed some firms closer to violating dividend covenants in debt contracts and
thus prevented them from increasing dividends This would bias our study against finding a
causal effect of option-based pay on dividends However this does not appear to be a
significant concern for three reasons First the recognition of an option expense does not
imply a decline in net income In fact more than 70 (75) of the full sample firms
(dividend payers) experienced an increase in net income before extraordinary items from
2004 to 2005 (the percentages are similar across the four quartiles of implied option
expense) Second dividend covenants are less common among dividend-paying firms
(Nikolaev 2010) Third most loan contracts in recent years give parties the option to
ldquofreezerdquo GAAP when facing a mandatory change in accounting principles (Christensen and
Nikolaev 2009) Firms expecting an adverse impact of FAS123R on their dividend covenants
would likely exercise this option (particularly given the non-cash nature of option-based
expense) Nonetheless to alleviate this concern we perform three additional analyses
(untabulated) (i) we repeat the tests in Panel C after excluding firms with a drop in net
income between 2004 and 2005 (ie firms that perhaps faced some covenant-related
27 We define a ldquosimilarrdquo payout to be an absolute change in payout ratio of less than 1 from 2003 to 2004 Among
these 66 firms only 39 continued to have a similar payout ratio in 2005 We also try an alternative definition where
a firm is classified as likely to be using a net income-based target payout ratio if the absolute percentage change in the
ratio from 2003 to 2004 is less than 10 (100 firms) Our inferences are unchanged
28
constrains to their payout policy as a result of FAS123R) (ii) we explicitly control for net
income and retained earnings in the regression (as in Skinner 2008) (iii) we repeat the tests
in Panel C for dividend payers with dividendsasset ratio above the sample median on the
basis that dividend covenants are less frequent among firms paying large dividends (Jung
Lee and Yang 2016) Our inferences are unchanged
332 Option-Based Pay and Dividend Payouts Dividend Initiations
In this section we examine whether the accounting-driven change in option pay affected
dividend initiations among non-payers We cannot employ the difference-in-difference approach
adopted so far by definition the same firm cannot initiate dividends in both periods However we
can provide suggestive evidence as follows First we take all firms that did not pay dividends in
2002 and group them into quartiles based on 2002 implied option expense For each quartile we
find the number of firms initiating dividends in 2003 and 2004 (the Pre period) Next we take all
firms that did not pay dividends in 2004 group them into quartiles based on 2002 implied option
expense and for each quartile find the number of firms initiating dividends in 2005 and 2006 (the
Post period) We do not include 2007 so as to have the same number of years in both periods and
make the cumulative initiation rates comparable
The left portion of Panel E reports the results of this exercise There is a general decrease in
the dividend initiation rate from the Pre to the Post period This holds both in the full sample of
non-payers (from 129 to 79) and across all quartiles This decrease may reflect a temporary
spike in 2003 and 2004 in response to the 2003 dividend tax cut documented in Chetty and Saez
(2005) It is noteworthy that initiation rates in both periods are lower among firms with higher
implied option expense This is consistent with option-heavy firms being mostly high-growth
firms less inclined to pay dividends More relevant to our research question if the lower use of
29
option compensation increased the propensity to pay dividends we would expect to see a relative
increase (ie a lower decrease) in dividend initiations among firms with the highest accounting
impact Instead the rate does not differ depending on the accounting impact There is
approximatley a 5 decline in initiation rate in each quartile In the right portion of Panel E we
examine similar data for dividend terminations While the results should be interpreted with
caution due to their rarity firms with higher accounting impact do not experience a greater decline
in termination rates Our inferences in Panel E are similar when we compared treated and control
firms following Bakke et al (2015) (untabulated)
Even after taking into account the different nature of decisions for dividend paying and non-
dividend-paying firms we fail to find evidence of a causal influence of option-based compensation
on dividend policy This finding is in contrast to the associations documented in earlier studies It
is even more remarkable as most firms replaced stock options with restricted stock which are
generally dividend-protected and should provide further incentive to increase dividends28
34 Option-Based Pay and Repurchases
In this section we examine the effect of an exogenous (accounting-induced) change in option
compensation on repurchases by estimating Equation (2)
Table 4 Panel A presents the results using the change in repurchases (scaled by total assets)
from Pre to Post as a dependent variable If the use of option-based pay had a positive effect on
firmsrsquo propensity to engage in repurchases as posited by the dividend-protection and dilution
hypotheses we should find a negative association between Accounting Impact or Treated and
repurchases Firms with a higher (accounting-driven) reduction in option-based pay should reduce
28 In a sample of SampP 500 firms between 2000 and 2009 Zhang (2013) reports that 80 of the firms granting
restricted stocks offer dividend protection In that sense the FAS123R-induced shift from stock options to restricted
stock may be characterized as a ldquoshockrdquo to dividend protection in unearned equity pay Accordingly our results cast
doubt on the causal interpretation of the positive association between dividend protection and dividend payouts
documented in prior studies (Zhang 2013 Burns et al 2015 Minnick and Rosenthal 2015)
30
the use of repurchases either because they are shifting toward a greater use of dividends andor
because they have a lower need to offset the dilutive effects of stock options However we find no
significant association between Accounting Impact (columns 1 and 2) and the change in
repurchases around the adoption of FAS123R When we use the Treated indicator (column 3) we
find a significant positive association rather than a negative one In Panel B we repeat the analysis
using net repurchases (ie repurchases after removing the effect of share issuances) following
Fama and French (2001) and Skinner (2008) Our inferences are unchanged29
This test is subject to two important caveats The first is we may not detect a decline in
repurchases because in the Post period firms need to offset the exercise of options that were
granted during the Pre period That is a post-FAS123R reduction in grants may not (yet) translate
into a reduction in exercises during the Post period which reduces our ability to test the dilution
hypothesis (ie that firms repurchase shares to offset exercises)30 However we can examine a
variation of this hypothesis where firms use repurchases to manage the effect of unexercised
options on diluted EPS (Bens et al 2003) To do so in Panel C we use a measure of adjusted
repurchases where we subtract our estimate of repurchases undertaken to offset the exercise of
ESO31 We effectively test whether firms experiencing an accounting-induced decrease in option
grants engage in less repurchases (net of exercise-driven repurchases) because their need to
manage the effect of unexercised options on diluted EPS is lower However the coefficient on
the variables of interest is either insignificant or positive inconsistent with the hypothesis
29 In the case of repurchases we do not examine separately ldquoinitiationsrdquo and ldquointensityrdquo as we do for dividends
because initiation is not clearly defined for repurchases Unlike dividends the occurrence of a repurchase in a given
year (or the lack thereof) cannot be used to infer a general policy due to the more discretionary nature of the timing of
repurchases 30 To capture the effect of lower option-based compensation on option exercises and thus on repurchases we would
ideally extend the Post period beyond 2007 However as noted by Floyd et al (2015) repurchases declined
dramatically after 2007 because of the financial crisis making it difficult to detect the effect of any other factor 31 As upper bound estimate of exercise-driven repurchases we multiply the number of ESO exercised during the year
times the average stock price during the year Since the number of ESO exercised is available in Compustat starting in
2004 Panel C is based on observations from 2004 to 2007
31
A second important caveat is that most firms replaced stock options with restricted stock
(Table 2 Panel C) Unvested restricted stock is excluded from the denominator in the computation
of basic EPS (once vested it is included) However it is included in the denominator of diluted
EPS using the treasury stock method similar to stock options Given the complexity of this
method without access to all details of restricted stock grants and option grants it is difficult to
determine whether the switch from stock options to restricted stock decreased the need for
dilution-driven repurchases as our test implicitly assumes Hence it is possible that we do not find
a decrease in repurchases because a reduced need to offset the dilutive effect of stock options was
neutralized by an increased need to offset the dilutive effect of restricted stock
Subject to the above caveats the evidence in Table 4 is not consistent with a positive causal
relation between the use of option-based pay and repurchases More precisely it suggests that
option-driven dilution concerns do not have a first-order effect on the magnitude of repurchases
even though they may play a role in the repurchase decision Hence our result is not necessarily
in conflict with the evidence in Brav et al (2005) where two-thirds of the surveyed financial
executives state that offsetting the dilutionary effect of stock option plans or other stock
programs is an important factor to their repurchase decisions
35 Option-Based Pay and Payout Composition
As an alternative to examining dividends and repurchases separately we also look at the
payout composition the change in the DividendsTotal Payout ratio from the Pre to the Post period
where Total Payout is the sum of dividends and repurchases As noted earlier we focus on the
subsample of firms with both dividends and repurchases in both Pre and Post periods so as to
capture the change in payout mix by firms routinely using both vehicles to return cash to
shareholders If the use of option-based pay causes firms to substitute repurchases for dividends
32
we should find a positive association between Accounting Impact or Treated and the payout mix
defined as DividendsTotal Payout ratio Firms with a higher accounting-driven reduction in
option-based pay should have an increase (decrease) in the relative weight of dividends
(repurchases) to the total payout However as reported in Table 5 Panel A we fail to find a
significant association between Accounting Impact (column 1 and 2) or Treated (column 3) and
the change in payout mix The results are similar when we use Net Payout (dividends plus net
repurchases) instead of Total Payout in computing the payout mix (Panel B)
Overall the combined evidence in Tables 3-5 does not support the hypothesis that option-
based compensation has negative (positive) effect on dividends (repurchases) or that it causes
firms to replace dividends with repurchases
4 Conclusion
Prior literature has documented robust associations between option-based compensation and
payout policy yet it remains unclear whether this association reflcts a causal influence We
investigate the causal effect of option-based compensation on payout policy using the adoption of
FAS123R which resulted in a significant decrease in option grants making it a plausible
exogenous shock to the use of option-based pay To overcome the challenge of no control group
we exploit the fact that firms responded differently depending on the firm-specific accounting
impact as measured by the implied option expense disclosed in the footnotes prior to FAS123R
Firms with larger expected accounting impact curtailed option-based compensation much more
aggressively than firms with lower impact Using a sample of SampP 1500 firms we find no
evidence that firms with a larger accounting-induced decline in option compensation increased
dividends reduced repurchases or changed their payout composition contrary to the widely held
belief that option-based pay has a causal influence on payout policy
33
Appendix Variable Definitions and Data Sources
Accounting Impact Variables
Accounting impact Implied option expense (Compustat XINTOPT) divided by total assets
(Compustat AT) This variable is measured at fiscal year 2002 and is time-invariant
Accounting impact rank The quartile rank of Accounting impact (1=lowest 4=highest)
Payout Variables
Regular dividendTotal assets The numerator is total regular cash dividends in the fiscal year
from the distribution dataset in CRSP Regular cash dividends are identified by the distribution
codes 1212 1222 1232 or 1242 The denominator is one-year lagged total assets (Compustat
AT)
DPS Dividend per share (Compustat DVPSX_F)
DPS pct change The percentage change of average DPS from Pre- to Post-FAS123R period
DPS pct change gtX indicator A dummy variable that equals one if DPC pct change is greater
than X and zero otherwise
RepurchaseTotal assets The numerator is the repurchase of common equity which equals total
repurchase (Compustat PRSTK) minus the change in preferred stock redemption value
(Compustat PSTKRV) The denominator is one-year lagged total assets (Compustat AT)
Net repurchaseTotal assets Net repurchase removes the effect of share issuances The
construction follows Fama and French (2001) and Skinner (2008) if the firm uses the treasury
stock method for repurchase net repurchase equals the increase in common treasury stock
(Compustat TSTKC) if the firm uses the retirement method (when common treasury stock is zero
in the current and prior year) net repurchase equals total repurchases minus stock issuance
(Compustat SSTK) and change in preferred stock redemption value (Compustat PSTKRV)
When the above measures give negative value net repurchase is set to zero
Adjusted repurchaseTotal assets Adjusted repurchase removes from total repurchase the potential
effect of repurchasing exercised options This variable equals total repurchase of common stocks
minus the product between the number of options exercised (Compustat OPTEXD) and average
stock price during the year When the above measure gives negative value adjusted repurchase is
set to zero Since the number of options exercised is not available before 2003 we drop
observations in 2003 when we use this variable
34
Total payoutTotal assets the sum of Regular dividendTotal assets and RepurchaseTotal assets
Regular dividendTotal payout regular cash dividend divided by the sum of regular cash dividend
and repurchase from common equity In the two-period analysis (Pre- vs Post-FAS123R) we
separately sum the numerator and the denominator for each firm-period and then calculate the ratio
Regular dividendNet payout regular dividend divided by the sum of regular dividend and net
repurchase In the two-period analysis (Pre- vs Post-FAS123R) we separately sum the numerator
and the denominator for each firm-period and then calculate the ratio
Compensation Variables
Salary_$ Average salary (Execucomp SALARY) of the top 5 highest paid executives in $1000
Salary_ Average salary (Execucomp SALARY) divided by average total pay (Execucomp
TDC1) of the top 5 highest paid executives
Bonus_$ Average bonus (Execucomp BONUS) of the top 5 highest paid executives in $1000
Due to a data format change we add non-equity plan-based awards (Execucomp
NON_EQ_TARG) to this measure after 2006
Bonus_ Bonus_$ divided by average total pay (Execucomp TDC1) of the top 5 highest paid
executives
Option grant_$ Average option grant value (Execucomp OPTION_AWARDS_BLK_VALUE or
OPTION_AWARDS_FV) of the top 5 highest paid executives in $1000 Due to a data format
change we use OPTION_AWARDS_FV for this measure after 2006
Option grant_ Option grant_$ divided by average total pay (Execucomp TDC1) of the top 5
highest paid executives
Restricted stock grant_$ Average restricted stock grant value (Execucomp RSTKGRNT or
STOCK_AWARDS_FV) of the top 5 highest paid executives in $1000 Due to data format
change we use STOCK_AWARDS_FV for this measure after 2006
Restricted stock grant_ Restricted stock grant_$ divided by average total pay (Execucomp
TDC1) of the top 5 highest paid executives
Total pay_$ Average total pay (Execucomp TDC1) of the top 5 highest paid executives in $1000
35
Other Characteristics
Size The book value of total assets (Compustat AT) minus the book value of common equity
(Compustat CEQ) plus the market value of common equity from CRSP in $M
Log(size) the natural logarithm of size
Book-to-market the book value of common equity dividend by its market value
Leverage long term debt plus short term debt (Compustat DLTT + DLC) divided by total assets
Asset tangibility tangible assets (Compustat AT - INTAN) divided by total assets
Free cash flow Operating cash flow (Compustat OANCF) minus capital expenditure (Compustat
CAPX) then divided by lagged total assets
Cash holding Cash and short-term investments (Compustat CHE) divided by total assets
ROA volatility the standard deviation of returns on assets (operating income before tax divided by
lagged total assets) in the past five fiscal years
Institutional ownership the number of shares held by institutional investors divided by the number
of shares outstanding from Thomson Reuters Institutional Holdings database
Sales growth the growth rate of sales (Compustat SALE) from the prior year
Past stock return annual stock return from the prior year
Loss indicator a dummy variable taking value of one if the current net income is negative and
zero otherwise
36
References
Aboody David 1996 Market Valuation of Employee Stock Options Journal of Accounting and
Economics 22 357-391
Aboody David Barth Mary E and Ron Kasznik 2004 Firms Voluntary Recognition of Stock-
Based Compensation Expense Journal of Accounting Research 42 123ndash150
Aboody David and Ron Kasznik 2008 Executive stock-based compensation and firmsrsquo cash
payout the role of shareholdersrsquo tax-related payout preferences Review of Accounting Studies
13 216ndash251
Anantharaman Divya and Yong Gyu Lee 2014 Managerial risk taking incentives and corporate
pension policy Journal of Financial Economics 111 328ndash351
Baker Malcolm and Jeffrey Wurgler 2004 A catering theory of dividends Journal of Finance
59 1125-1165
Baker Malcolm and Jeffrey Wurgler 2016 Dividends as reference points a behavioral signaling
approach Review of Financial Studies 29 697-738
Bakke Tor-Erik Hamed Mahmudi Chitru Fernando and Jesus Salas 2015 The causal effect of
option pay on corporate risk management Journal of Financial Economics forthcoming
Balsam Steven Austin Reitenga and Jennifer Yin 2008 Option acceleration in response to SFAS
No 123 (R) Accounting Horizons 22 23-45
Bens Daniel and Steven Monahan 2008 Altering Investment Decisions to Manage Financial
Reporting Outcomes Asset-Backed Commercial Paper Conduits and FIN 46 Journal of
Accounting Research 46 1017-1055
Bens Daniel A Venky Nagar Douglas J Skinner and MH Franco Wong 2003 Employee stock
options eps dilution and stock repurchases Journal of Accounting and Economics 36 51ndash90
Bertrand Marianne Esther Duflo and Sendhil Mullainathan 2004 How much should we trust
differences-in-differences estimates The Quarterly Journal of Economics 119 249ndash275
Blouin Jennifer L Jana S Raedy and Douglas A Shackelford 2011 Dividends Share
Repurchases and Tax Clienteles Evidence from the 2003 Reductions in Shareholder Taxes
The Accounting Review 86 887-914
Brav Alon John R Graham Campbell R Harvey and Roni Michaely 2005 Payout policy in the
21st century Journal of Financial Economics 77 483ndash527
Brown Lawrence D and Yen-Jung Lee 2011 Changes in Option-Based Compensation Around
the Issuance of SFAS123R Journal of Business Finance amp Accounting 38 1053ndash109
37
Brown Jeffrey R Nellie Liang and Scott Weisbenner 2007 Executive financial incentives and
payout policy Firm responses to the 2003 dividend tax cut Journal of Finance 62 1935ndash
1965
Burns Natasha Brian McTier and Kristina Minnick 2015 Equity-incentive compensation and
payout policy in Europe Journal of Corporate Finance 30 85-97
Carter Mary Ellen and Luann J Lynch 2003 The Consequences of the FASBrsquos 1998 Proposal on
Accounting for Stock Option Repricing Journal of Accounting and Economics 35 51-72
Carter Mary Ellen Luann J Lynch and Irem Tuna 2007 The role of accounting in the design of
CEO equity compensation The Accounting Review 82 327ndash357
Chava Sudheer and Amiyatosh Purnanandam 2010 CEOs versus CFOs Incentives and
corporate policies Journal of Financial Economics 97 263ndash278
Chetty Raj and Emmanuel Saez 2005 Dividend taxes and corporate behavior Evidence from the
2003 dividend tax cut The Quarterly Journal of Economics 120 791ndash833
Choudhary Preeti Shivaram Rajgopal and Mohan Venkatachalam 2009 Accelerated vesting of
employee stock options in anticipation of FAS123R Journal of Accounting Research 47 105ndash
146
Christensen Hans B and Valeri Nikolaev 2009 Contracting on Mandatory Changes to GAAP
New Practice and Its Determinants Working Paper University of Chicago
Chu Yongqiang and Tao Ma 2015 How does management compensation affect bank risk taking
evidence from FAS 123R University of South Carolina Working Paper
Cuny Charles J Gerald S Martin and John J Puthenpurackal 2009 Stock options and total
payout Journal of Financial and Quantitative Analysis 44 391ndash410
DeAngelo Harry Linda DeAngelo and Douglas J Skinner 2000 Special Dividends and the
Evolution of Dividend Signaling Journal of Financial Economics 57 309-354
Dechow Patricia M Amy P Hutton and Richard G Sloan 1996 Economic consequences of
accounting for stock-based compensation Journal of Accounting Research 34 1ndash20
Edgerton J 2013 Four facts about dividend payouts and the 2003 tax cut International Tax and
Public Finance 20 769-784
Edmans Alex and Xavier Gabaix 2015 Executive compensation a modern primer Journal of
Economic Literature forthcoming
38
Fama Eugene F and Kenneth R French 2001 Disappearing dividends changing firm
characteristics or lower propensity to pay Journal of Financial Economics 60 3ndash43
Farre-Mensa Joan Roni Michaely and Martin C Schmalz 2014 Payout policy Annual Review
of Financial Economics 6 75ndash134
Fenn George W and Nellie Liang 2001 Corporate payout policy and managerial stock
incentives Journal of Financial Economics 60 45ndash72
Ferri Fabrizio and Tatiana Sandino 2009 The impact of shareholder activism on financial
reporting and compensation the case of employee stock options expensing The Accounting
Review 84 433ndash466
Floyd Eric Nan Li and Douglas J Skinner 2015 Payout policy through the financial crisis the
growth of repurchases and the resilience of dividends Journal of Financial Economics 118
299-316
Frydman Carola and Dirk Jenter 2010 CEO compensation Annual Review of Financial
Economics 2 75-102
Gipper Brandon 2015 Assessing the Effects of Disclosing Management Compensation Working
Paper University of Chicago
Gormley Todd David Matsa and Todd Milbourn 2013 CEO compensation and corporate risk
evidence from a natural experiment Journal of Accounting and Economics 56 79-101
Graham John Michelle Hanlon and Terry Shevlin 2011 Real effects of accounting rules
evidence from multinational firmsrsquo investment locations and profit repatriation decisions
Journal of Accounting Research 49 137-185
Graham John Campbell Harvey and Shiva Rajgopal 2005 The Economic implications of
corporate financial reporting Journal of Accounting and Economics 40 3-73
Greenspan Alan 2002 Testimony of Alan Greenspan before the Committee on Banking
Housing and Urban Affairs US Senate July 16 Washington DC Government Printing
Office
Grullon Gustavo and Roni Michaely 2002 Dividends Share Repurchases and the Substitution
Hypothesis Journal of Finance 57 1649-1684
Hail Luzi Ahmed Tahoun and Clare Wang 2014 Dividend Payouts and Information Shocks
Journal of Accounting Research 52 403-456
Hall Brian J and Kevin J Murphy 2002 Stock options for undiversified executives Journal of
Accounting amp Economics 33 3-42
39
Hall Brian J and Kevin J Murphy 2003 The trouble with stock options Journal of Economic
Perspectives 17 49ndash70
Hanlon Michelle and Jeffrey L Hoopes 2014 What do firms do when dividend tax rates change
An examination of alternative payout responses Journal of Financial Economics 114 105-
124
Hayes Rachel M Michael Lemmon and Mingming Qiu 2012 Stock options and managerial
incentives for risk taking Evidence from FAS123R Journal of Financial Economics 105
174ndash190
Heron Randall A Erik Lie 2007 Does backdating explain the stock price pattern around
executive stock option grants Journal of Financial Economics 83 271-295
Hribar Paul Nicole Thorne Jenkins and W Bruce Johnson 2006 Stock repurchases as an
earnings management device Journal of Accounting and Economics 41 3ndash27
Jensen Michael C 1986 Agency cost of free cash flow corporate finance and takeovers
American Economic Review 76 323-329
Jolls Christine 1998 Stock repurchases and incentive compensation NBER Working Paper No
w6467
Jung Boochun Woo-Jong Lee and Yanhua Sunny Yang 2016 The Impact of Dividend
Covenants on Investment and Operating Performance Journal of Business Finance amp
Accounting 43 414ndash447
Kahle Kathleen M 2002 When a buyback isnrsquot a buyback open market repurchases and
employee options Journal of Financial Economics 63 235ndash261
Lambert Richard A William N Lanen and David F Larcker 1989 Executive stock option plans
and corporate dividend policy Journal of Financial and Quantitative Analysis 24 409ndash425
Lintner John 1956 Distribution of incomes of corporations among dividends retained earnings
and taxes The American Economic Review 46 97-113
Low Angie 2009 Managerial risk-taking behavior and equity-based compensation Journal of
Financial Economics 92 470-490
Miller Merton H and Franco Modigliani 1961 Dividend policy growth and the valuation of
shares The Journal of Business 34 411ndash433
Minnick Kristina and Leonard Rosenthal 2015 Stealth compensation Do CEOs increase their
pay by influencing dividend policy Journal of Corporate Finance 25 435-454
40
Murphy Kevin J 1999 Executive compensation In O Ashenfelter and D Card (eds) North
Holland Handbook of Labor Economics Amsterdam Elsevier Science BV
Murphy Kevin J 2013 Executive compensation Where we are and how we got there Handbook
of the Economics of Finance Elsevier Science North Holland 211-356
Nikolaev Valeri 2010 Debt Covenants and Accounting Conservatism Journal of Accounting
Research 48 143-176
Puri Manju Joumlrg Rocholl and Sascha Steffen 2011 Global retail lending in the aftermath of the
US financial crisis Distinguishing between supply and demand effects Journal of Financial
Economics 100 556-578
Shue Kelly and Richard R Townsend 2014 Swinging for the fences Executive reactions to
quasi-random option grants Working Paper University of Chicago
Skinner Douglas J 2008 The evolving relation between earnings dividends and stock
repurchases Journal of Financial Economics 87 582-609
Weisbenner Scott J 2000 Corporate share repurchases in the 1990s What role do stock options
play FEDS Working Paper No 2000-29
Zhang Dan 2013 CEO dividend protection Working Paper BI Norwegian Business School
41
Figure 1 Trends of dividends and repurchases from 2003 to 2007 Panel A plots the average
Regular DividendTotal Assets of firms in the highest and lowest quartiles of Accounting Impact
measured in 2002 Panel B shows the average Total RepurchaseTotal Assets of firms in the
highest and lowest quartiles of Accounting Impact measured in 2002
Panel A Trends of regular dividends
Panel B Trends of total repurchases
00
05
10
15
20
2003 2004 2005 2006 2007
Regular DividendTotal Assets
Lowest Acc Impact
Highest Acc Impact
Pre Post
00
20
40
60
80
100
2003 2004 2005 2006 2007
Total Repurchase Total Assets
Lowest Acc Impact
Highest Acc Impact
Pre Post
42
Table 1
Summary Statistics
Panel A Firm characteristics - full sample
N Mean Std dev 25 pctl Median 75 pctl
Accounting impact (2002) 1176 173 366 022 052 163
Payout variablesRegular dividendTotal assets 5653 093 148 000 000 142
RepurchaseTotal assets 5653 394 710 000 035 500
Total payoutTotal assets 5653 488 748 000 175 666
Regular dividendTotal payout 4091 3874 4057 000 2237 8833
Level of executive compensation (in $1000)
Salary_$ 5653 450 190 314 409 544
Bonus_$ 5653 476 616 122 295 586
Option grant_$ 5653 791 1137 62 384 1002
Restricted stock grant_$ 5653 458 866 0 58 518
Total pay_$ 5653 2481 2475 890 1647 3074
Percentage of executive compensation
Salary_ 5653 296 183 165 251 382
Bonus_ 5653 197 148 97 177 268
Option grant_ 5653 283 235 67 256 445
Restricted stock grant_ 5653 141 180 00 41 249
Control variables
Size ($M) 5653 11086 27294 1017 2459 8117
Log(size) 5653 7985 1565 6925 7808 9002
Book-to-market 5653 0445 0287 0251 0388 0578
Leverage 5653 0202 0172 0038 0187 0309
Asset tangibility 5653 0806 0184 0691 0853 0965
Free cash flow 5653 0059 0091 0013 0059 0108
Cash holding 5653 0166 0172 0034 0100 0247
ROA volatility 5653 0056 0056 0021 0038 0070
Institutional ownership 5653 0753 0202 0639 0795 0910
Sales growth 5653 0121 0189 0028 0096 0183
Past stock return 5653 0094 0183 -0012 0094 0199
Loss indicator 5653 0164 0370 0000 0000 0000
This table presents summary statistics Panel A shows the descriptive statistics of payout variables compensation
variables and other firm characteristics for the full sample Accounting impact is the implied option expense
measured at fiscal year 2002 All other variables are measured at firm-year level from fiscal year 2003 to 2007
resulting in 5653 firm-year observations (except for Regular dividendTotal Payout which can be measured only
for the 4901 firm-year observations with Total payout greater than zero) Panel B shows the pairwise correlations
between main variables at firm-year level Panel C compares payout variables compensation variables and other
firm characteristics before and after FAS123R The Pre-FAS123R period consists of fiscal year 2003 and 2004
the Post-FAS123R period covers fiscal year 2005-2007 Panel D compares the trends of payout and compensation
variables around FAS123R across four quartile groups ranked by 2002 accounting impact Panel E compares the
trends of payout and compensation variables around FAS123R between the treated and control group under the
alternative treatment definition in Bakke et al (2015) (see Section 22) All variables are defined in Appendix The
notation and in Panel C indicates statistically significant at 10 5 and 1 level in T-tests for equal
means respectively
43
Pa
nel
B
Pea
rso
n c
orr
ela
tio
ns
Reg div
Repurchase
Total payout
Salary_
Bonus_
Option_
RS_
Log(size)
BM
Leverage
Tangibility
FCF
Cash holdingROA vol
Inst own
Sales growth
Past ret
urn
Loss
Reg
div
10
0
Repurc
hase
01
610
0
Tota
l payout
03
509
810
0
Sala
ry_
-0
10
-01
8-0
19
10
0
Bonus_
00
700
100
3-0
01
10
0
Option_
-0
10
00
900
6-0
41
-03
510
0
RS
_
01
000
901
0-0
32
-01
1-0
40
10
0
Log(s
ize)
03
101
802
3-0
56
01
101
202
210
0
BM
-02
1-0
28
-03
103
0-0
03
-02
000
0-0
33
10
0
Levera
ge
-00
1-0
08
-00
8-0
05
00
6-0
11
00
801
9-0
03
10
0
Tangib
ility
00
200
100
101
200
1-0
05
-00
6-0
12
-00
4-0
18
10
0
FC
F02
203
703
9-0
20
00
901
1-0
01
02
4-0
32
-02
1-0
16
10
0
Cash
hold
ing
-01
301
000
700
2-0
14
02
2-0
10
-02
3-0
16
-03
502
901
210
0
RO
A v
ol
-01
5-0
04
-00
700
4-0
11
01
9-0
11
-02
3-0
08
-01
101
2-0
02
03
910
0
Inst
ow
n
-00
901
401
1-0
17
00
200
701
200
7-0
01
00
3-0
08
01
4-0
06
-01
110
0
Sale
s gro
wth
-00
8-0
04
-00
6-0
15
00
501
0-0
02
00
7-0
16
-00
3-0
08
01
300
201
400
410
0
Past
retu
rn00
901
301
4-0
18
01
5-0
01
00
301
6-0
29
-01
000
102
7-0
14
-01
001
602
710
0
Loss
-02
0-0
19
-02
201
8-0
18
00
4-0
05
-02
601
901
300
6-0
41
01
702
3-0
16
-01
8-0
40
10
0
44
Panel C Firm characteristics - before and after FAS123R
Pre FAS 123R Post FAS 123R Difference
Payout variables
Regular dividendTotal assets 083 099 016
RepurchaseTotal assets 245 490 245
Total payoutTotal assets 328 589 261
Regular dividendTotal payout 3914 2790 -1124
Level of executive compensation (in $1000)
Salary_$ 426 463 37
Bonus_$ 418 505 87
Option grant_$ 896 707 -191
Restricted stock grant_$ 269 574 305
Total pay_$ 2263 2584 321
Percentage of executive compensation
Salary_ 305 293 -12
Bonus_ 186 204 18
Option grant_ 343 240 -103
Restricted stock grant_ 87 176 89
Control variables
Size ($M) 9671 11631 1960
Log(size) 7860 8035 0175
Book-to-market 0437 0453 0016
Leverage 0201 0203 0002
Asset tangibility 0822 0793 -0029
Free cash flow 0061 0057 -0004
Cash holding 0175 0159 -0016
ROA volatility 0067 0048 -0019
Institutional ownership 0712 0781 0069
Sales growth 0137 0108 -0029
Past stock return 0080 0101 0021
Loss indicator 0173 0159 -0014
45
Pa
nel
D
Fir
m c
ha
racte
rist
ics
by q
ua
rtil
e o
f a
cco
un
tin
g i
mp
act
- b
efo
re a
nd
aft
er
FA
S1
23
R
Accounting im
pact
(2002)
Num
ber
of
Fir
ms
Pre
Post
Pre
Post
Pre
Post
Pre
Post
Payout
vari
able
s
Regula
r div
idendT
ota
l ass
ets
11
2
12
4
09
4
11
1
09
5
11
3
03
0
04
9
Repurc
hase
Tota
l ass
ets
11
3
26
8
19
2
37
3
32
7
63
1
35
1
68
7
Tota
l payout
Tota
l ass
ets
22
4
39
1
28
5
48
4
42
2
74
4
38
1
73
6
Regula
r div
idendT
ota
l payout
643
7
469
8
474
0
341
1
284
5
195
4
82
5
74
5
Perc
enta
ge o
f executive c
om
pensa
tion
Sala
ry_
337
295
313
287
296
289
276
300
Bonus_
223
226
214
228
172
192
134
169
Option g
rant_
201
167
290
210
373
260
507
325
Rest
ricte
d s
tock g
rant_
116
194
98
180
89
176
43
155
294
294
294
294
1st Q
uart
ile2
nd Q
uart
ile3
rd Q
uart
ile4
th Q
uart
ile
01
2
03
5
09
3
55
1
46
Accounting impact
Number of Firms
By accounting impact quartile
1
2
3
4
Pre Post Pre Post
Payout variables
Regular dividendTotal assets 09 11 08 10
RepurchaseTotal assets 18 31 26 52
Total payoutTotal assets 28 43 34 62
Regular dividendTotal payout 428 357 386 265
Percentage of executive compensation
Salary_ 435 364 282 280
Bonus_ 226 214 179 202
Option grant_ 92 125 387 261
Restricted stock grant_ 125 188 80 174
Percentage of CEO compensation
Salary_(CEO) 485 364 260 259
Bonus_(CEO) 249 228 185 219
Option grant_(CEO) 10 127 406 275
Restricted stock grant_(CEO) 128 182 82 183
Panel E Firm characteristics by alternative treatment definition - before and
after FAS123R
Treated
25
19
997
223
250
256
268
10
177
71
Control
44
37
47
Table 2
Differential effect of FAS123R on the use of option-based compensation
Panel A Two-period first-difference regression
Prediction Coeff t-stat Coeff t-stat Coeff t-stat
Accounting impact rank - -0044 -628
Accounting impact rank=2 - -0044 -327
Accounting impact rank=3 - -0075 -468
Accounting impact rank=4 - -0140 -613
Treated - -0132 -875
ΔLog(size) 0061 202 0061 200 0063 214
ΔBook-to-market 0032 091 0032 092 0051 143
ΔLeverage -0157 -213 -0160 -218 -0111 -153
ΔAsset tangibility -0012 -014 -0020 -023 -0023 -026
ΔFree cash flow -0106 -095 -0108 -097 -0128 -117
ΔCash holding -0197 -211 -0193 -206 -0180 -194
ΔFive-year ROA volatility -0065 -031 -0056 -026 -0098 -047
ΔInstitutional ownership -0044 -091 -0043 -088 -0044 -092
ΔSales growth -0064 -102 -0065 -104 -0090 -153
ΔPast one-year stock return 0051 078 0052 080 0091 138
ΔLoss frequency 0056 207 0057 207 0047 179
Log(size) -0009 -210 -0009 -207 -0002 -035
Book-to-market -0015 -056 -0013 -049 0018 072
Leverage 0022 046 0023 048 0068 150
Asset tangibility 0033 077 0033 078 0053 128
Free cash flow 0227 202 0220 195 0127 117
Cash holding -0002 -004 0012 019 -0078 -141
Five-year ROA volatility -0451 -240 -0430 -228 -0509 -283
Institutional ownership -0123 -360 -0122 -359 -0100 -292
Sales growth -0041 -056 -0040 -055 -0089 -125
Past one-year stock return -0009 -015 -0006 -010 0078 125
Loss frequency 0055 174 0056 178 0054 173
Fixed effect
Standard error
Adj R-squared
Observations
Model (3)
Dependent variable ΔAvg Option grantTotal pay
Huber-White
0156
This table investigates whether the effect of FAS123R on the use of option-based pay varies with its potential accounting impact Panel A
reports the results of estimating three two-period first-differencing models where for each firm we average its characteristics in Pre- and
Post-FAS123R period The Pre-FAS123R period consists of fiscal year 2003 and 2004 the Post-FAS123R period covers fiscal year 2005-
2007 In all three specifications the dependent variable is the change of average Option grantTotal pay from Pre- to Post-FAS123R period
The main independent variable varies by model in Model (1) the Accounting impact rank is the quartile rank of implied option expensetotal
assets measured in 2002 (1=lowest 4=highest) In Model (2) Accounting impact rank=2 (3 4) is an indicator that takes value of one if the
firmrsquos Accounting impact rank equals 2 (3 4) In Model (3) we use an alternative treatment construction following Bakke et al (2015)
where Treated is an indicator that takes value of zero if the firm granted zero option to its CEO in both 2003 and 2004 or the firm began to
voluntarily expense option-based pay at fair value in 2002 or earlier and one otherwise For each control variable we include both its level in
the Pre-FAS123R period and its change across the two periods Panel B shows the results of estimating fixed effect models with firm-year
observations The dependent variable is the firm-year level Option grantTotal pay The main independent variables are the interactions of
Post-FAS123R indicator (Post) with Accounting Impact rank Accounting impact rank indicators and Treated respectively All models in
Penal A have industry fixed effects and the standard errors are Huber-White heteroscedasticity-consistent standard errors All models in
Penal B have firm fixed effects and year fixed effects and the standard errors are clustered at firm level All variables are defined in
Appendix The notation and indicates statistically significant at 10 5 and 1 level respectively
Model (1) Model (2)
11711171 1171
Industry Industry
Huber-White
0124
Huber-White
0123
Industry
48
Panel B Panel fixed effects regression
Prediction Coeff t-stat Coeff t-stat Coeff t-stat
Acc impact rank x Post - -0044 -807
Acc impact rank 2 x Post - -0046 -333
Acc impact rank 3 x Post - -0077 -526
Acc impact rank 4 x Post - -0137 -776
Treated x Post - -0145 -970
Log(size) 0034 221 0034 217 0036 229
Book-to-market 0018 084 0017 083 0015 070
Leverage -0004 -009 -0006 -013 -0007 -015
Asset tangibility 0007 012 0004 006 0011 018
Free cash flow -0074 -151 -0072 -146 -0078 -158
Cash holding -0048 -086 -0050 -090 -0006 -011
Five-year ROA volatility 0250 231 0239 219 0437 414
Institutional ownership 0043 159 0044 161 0041 150
Sales growth -0033 -168 -0034 -171 -0031 -158
Past one-year stock return 0067 221 0068 224 0063 204
Loss indicator 0023 209 0022 207 0024 222
Fixed effects
Standard error
Adj R-squared
Observations
Dependent variable Option grantTotal pay
5653 5653 5653
Clustered by firm
Firm Year
Clustered by firm
Firm Year
Clustered by firm
0523 0523 0526
Model (1) Model (2) Model (3)
Firm Year
49
Table 3
Effect of option-based compensation on dividend policy
Panel A Two-period first-difference regression
Prediction Coeff t-stat Coeff t-stat Coeff t-stat
Accounting impact rank + 0000 077
Accounting impact rank=2 + 0001 091
Accounting impact rank=3 + 0000 044
Accounting impact rank=4 + 0001 092
Treated + 0000 -026
ΔLog(size) 0000 -030 0000 -030 0000 -026
ΔBook-to-market -0002 -190 -0002 -193 -0002 -195
ΔLeverage -0002 -059 -0002 -057 -0002 -059
ΔAsset tangibility 0016 431 0016 429 0016 430
ΔFree cash flow 0017 373 0017 373 0017 375
ΔCash holding -0011 -288 -0011 -285 -0010 -282
ΔFive-year ROA volatility 0003 034 0002 032 0003 035
ΔInstitutional ownership -0002 -073 -0002 -073 -0002 -070
ΔSales growth -0001 -040 -0001 -037 -0001 -038
ΔPast one-year stock return 0002 077 0002 076 0002 070
ΔLoss frequency 0000 -048 0000 -045 0000 -046
Log(size) 0000 183 0000 182 0000 182
Book-to-market -0002 -227 -0002 -225 -0002 -284
Leverage -0001 -037 -0001 -039 -0001 -048
Asset tangibility 0003 179 0003 180 0003 176
Free cash flow 0017 291 0017 291 0017 300
Cash holding 0002 080 0002 077 0002 098
Five-year ROA volatility 0003 035 0002 033 0003 044
Institutional ownership -0001 -068 -0001 -068 -0001 -058
Sales growth -0004 -177 -0004 -175 -0004 -172
Past one-year stock return 0004 169 0004 167 0004 165
Loss frequency -0001 -111 -0001 -109 -0001 -102
Fixed effect
Standard error
Adj R-squared
Observations
Dependent variable ΔAvg Regular dividendTotal assets
This table investigates the causal effect of option-based pay on dividend policy by examining whether changes in dividend policy around
FAS123R vary with its potential accounting impact Panel A reports the results of estimating three two-period first-differencing models
where for each firm we average its characteristics in Pre- and Post-FAS123R period In all three specifications the dependent variable is
the change of average Regular dividendTotal assets from Pre- to Post-FAS123R period The main independent variable varies by model in
Model (1) the Accounting impact rank is the quartile rank of implied option expensetotal assets measured in 2002 (1=lowest 4=highest) In
Model (2) Accounting impact rank=2 (3 4) is an indicator that takes value of one if the firmrsquos Accounting impact rank equals 2 (3 4) In
Model (3) we use an alternative treatment construction following Bakke et al (2015) where Treated is an indicator that takes value of zero
if the firm granted zero option to its CEO in both 2003 and 2004 or the firm began to voluntarily expense option-based pay at fair value in
2002 or earlier and one otherwise For each control variable we include both its level in the Pre-FAS123R period and its change across the
two periods Panel B shows the results of estimating fixed effect models with firm-year observations The dependent variable is the firm-
year level Regular dividendTotal assets The main independent variables are the interactions of Post-FAS123R indicator (Post) with
Accounting Impact rank Accounting impact rank indicators and Treated respectively Panel C examines the intensity of dividend changes
among firms with nonzero dividend per share in 2003 or 2004 In particular we estimates the same three models as in Panel A(with the
same independent variables) but for five dependent variables the change of average Regular dividendTotal assets from Pre- to Post-
FAS123R period (as in Panel A) the percentage change of DPS (dividend per share) from Pre- to Post-FAS123R period and three
indicators denoting respectively whether the percentage change of DPS was greater than 20 40 and 60 Panel D reports four
robustness tests of the dividend intensity regression In each of them a set of possible confounding observations is removed (see Section 33
for details) Panel E compares the trends of dividend initiation and termination around FAS123R across four quartile groups ranked by
accounting impact All models in Panel A C and D have industry fixed effects and the standard errors are Huber-White heteroscedasticity-
consistent standard errors All models in Penal B have firm fixed effects and year fixed effects and the standard errors are clustered at
firm level All variables are defined in Appendix The notation and indicates statistically significant at 10 5 and 1 level
Industry Industry Industry
Model (1) Model (2) Model (3)
1171 1171 1171
Huber-White Huber-White Huber-White
0105 0104 0105
50
Panel B Panel fixed effects regression
Prediction Coeff t-stat Coeff t-stat Coeff t-stat
Acc impact rank x Post + 0000 122
Acc impact rank 2 x Post + 0001 110
Acc impact rank 3 x Post + 0001 094
Acc impact rank 4 x Post + 0001 129
Treated x Post + 0000 -012
Log(size) 0001 179 0001 179 0001 181
Book-to-market 0000 025 0000 024 0000 031
Leverage 0001 062 0001 064 0001 069
Asset tangibility 0009 360 0009 358 0009 363
Free cash flow 0002 090 0002 093 0002 092
Cash holding -0007 -295 -0007 -298 -0007 -298
Five-year ROA volatility 0001 041 0001 038 0000 -006
Institutional ownership 0000 -027 0000 -026 0000 -027
Sales growth 0000 053 0000 051 0000 044
Past one-year stock return 0001 089 0001 088 0001 078
Loss indicator 0000 -060 0000 -057 0000 -076
Fixed effects
Standard error
Adj R-squared
Observations
Dependent variable Regular dividendTotal assets
Model (1) Model (2) Model (3)
Firm Year Firm Year Firm Year
5653 5653 5653
Clustered by firm Clustered by firm Clustered by firm
0877 0877 0877
51
Panel C Intensity of dividend changes around FAS123R
Prediction Coeff t-stat Coeff t-stat Coeff t-stat
Accounting impact rank + 0000 065
Accounting impact rank=2 + 0000 048
Accounting impact rank=3 + 0000 026
Accounting impact rank=4 + 0002 080
Treated + 0001 063
Dependent var DPS pct change
Accounting impact rank + -0145 -072
Accounting impact rank=2 + 0018 006
Accounting impact rank=3 + -0177 -045
Accounting impact rank=4 + -0746 -100
Treated + -0407 -119
Accounting impact rank + 0029 095
Accounting impact rank=2 + 0040 074
Accounting impact rank=3 + 0092 139
Accounting impact rank=4 + 0008 007
Treated + -0007 -012
Accounting impact rank + 0024 076
Accounting impact rank=2 + 0047 088
Accounting impact rank=3 + 0079 114
Accounting impact rank=4 + -0003 -002
Treated + 0030 052
Accounting impact rank + 0030 098
Accounting impact rank=2 + 0078 155
Accounting impact rank=3 + 0085 130
Accounting impact rank=4 + 0014 012
Treated + -0006 -011
Control variables
Fixed effect
Standard error
Observations 572 572 572
Yes Yes Yes
Huber-White Huber-White Huber-White
Industry Industry Industry
Dependent var DPS pct
change gt60 indicator
Model (1) Model (2) Model (3)
Dependent var ΔAvg Regular
dividendAssets
Dependent var DPS pct
change gt20 indicator
Dependent var DPS pct
change gt40 indicator
52
Panel D Robustness tests for intensity of dividend changes around FAS123R
Prediction Coeff t-stat Coeff t-stat Coeff t-stat
Accounting impact rank + 0006 017
Accounting impact rank=2 + 0067 118
Accounting impact rank=3 + 0041 057
Accounting impact rank=4 + -0061 -049
Treated + 0022 035Observations
Accounting impact rank + 0009 027
Accounting impact rank=2 + 0058 106
Accounting impact rank=3 + 0032 043
Accounting impact rank=4 + -0032 -024
Treated + 0018 028
Observations
Accounting impact rank + 0030 089
Accounting impact rank=2 + 0039 071
Accounting impact rank=3 + 0122 168
Accounting impact rank=4 + -0063 -052
Treated + 0075 132
Observations
Accounting impact rank + 0008 023
Accounting impact rank=2 + 0023 042
Accounting impact rank=3 + 0048 064
Accounting impact rank=4 + -0042 -033
Treated + -0010 -016
Observations
Control variables
Fixed effect
Standard error
Exclude firms with stable
payout ratio from 2003 to 2004
506 506 506
Dependent variable DPS pct change gt40 indicator
Model (1) Model (2) Model (3)
Exclude voluntary expensers
519 519
Exclude firms in the top decile
of option reduction (02-04)
Exclude firms that accelerated
option vesting
504 504 504
517 517 517
519
Huber-White Huber-White Huber-White
Yes Yes Yes
Industry Industry Industry
53
Panel E Dividend initiation and termination rates around FAS123R
Pre FAS 123R
1 280 75 7 6 13 173
2 284 135 18 9 27 200
3 286 181 11 14 25 138
4 282 260 9 10 19 73
Total 1132 651 45 39 84 129
Post FAS 123R
1 275 63 4 4 8 127
2 280 116 9 9 18 155
3 276 152 9 3 12 79
4 263 223 5 1 6 27
Total 1094 554 27 17 44 79
Pre FAS 123R
1 280 205 2 0 2 10
2 284 149 7 1 8 54
3 286 105 0 0 0 00
4 282 22 0 0 0 00
Total 1132 481 9 1 10 21
Post FAS 123R
1 275 212 3 6 9 42
2 280 164 1 2 3 18
3 276 124 1 1 2 16
4 263 40 0 3 3 75
Total 1094 540 5 12 17 31
termination
in 2004
03-04
cumulative
03-04
cumulative
Quartile firms
with
dividend in
2004
termination
in 2005
termination
in 2006
05-06
cumulative
05-06
cumulative
Termination
Quartile firms
with
dividend in
2002
termination
in 2003
without
dividend in
2004
initiation in
2003
initiation in
2004
03-04
cumulative
03-04
cumulative firmsQuartile
firmsQuartile initiation in
2005
initiation in
2006
05-06
cumulative
05-06
cumulative
Initiation
without
dividend in
2002
54
Table 4
Effect of option-based compensation on repurchases
Panel A Two-period first-difference regression with total repurchase
Prediction Coeff t-stat Coeff t-stat Coeff t-stat
Accounting impact rank - 0002 122
Accounting impact rank=2 - 0002 071
Accounting impact rank=3 - 0005 123
Accounting impact rank=4 - 0007 102
Treated - 0014 365
Control variables
Fixed effect
Standard error
Adj R-squared
Observations
Panel B Two-period first-difference regression with net repurchase
Prediction Coeff t-stat Coeff t-stat Coeff t-stat
Accounting impact rank - 0003 166
Accounting impact rank=2 - 0002 051
Accounting impact rank=3 - 0006 165
Accounting impact rank=4 - 0009 137
Treated - 0010 300
Control variables
Fixed effect
Standard error
Adj R-squared
Observations
Panel C Two-period first-difference regression with repurchase adjusted for exercised options
Prediction Coeff t-stat Coeff t-stat Coeff t-stat
Accounting impact rank - 0001 056
Accounting impact rank=2 - 0002 062
Accounting impact rank=3 - 0007 172
Accounting impact rank=4 - -0001 -008
Treated - 0006 197
Control variables
Fixed effect
Standard error
Adj R-squared
Observations
Dependent variable ΔAvg RepurchaseTotal assets
This table investigates the causal effect of option-based pay on payout policy by examining whether the changes of repurchase around
FAS123R vary with its potential accounting impact Panel A reports the results of estimating three two-period first-differencing models
where for each firm we average its characteristics in Pre- and Post-FAS123R period In all three specifications the dependent variable is
the change of average RepurchaseTotal assets from Pre- to Post-FAS123R period The main independent variable varies by model in
Model (1) the Accounting impact rank is the quartile rank of implied option expensetotal assets measured in 2002 (1=lowest 4=highest)
In Model (2) Accounting impact rank=2 (3 4) is an indicator that takes value of one if the firmrsquos Accounting impact rank equals 2 (3 4)
In Model (3) we use an alternative treatment construction following Bakke et al (2015) where Treated is an indicator that takes value of
zero if the firm granted zero option to its CEO in both 2003 and 2004 or the firm began to voluntarily expense option-based pay at fair
value in 2002 or earlier and one otherwise Panel B reports the regressions with the change of Net repurchaseTotal assets as the
dependent variable and the same independent variable as in Panel A Panel C reports the regressions with the change of Adjusted
repurchaseTotal assets as the dependent variable and the same independent variable as in Panel A All models in Panel A B and C have
industry fixed effects and the standard errors are Huber-White heteroscedasticity-consistent standard errors All variables are defined in
Appendix The notation and indicates statistically significant at 10 5 and 1 level respectively
Model (1) Model (2) Model (3)
Yes Yes Yes
Industry Industry Industry
Huber-White Huber-White Huber-White
Dependent variable ΔAvg Net repurchaseTotal assets
1171 1171 1171
0238 0237 0245
Model (1) Model (2) Model (3)
Yes Yes Yes
Industry Industry Industry
Huber-White Huber-White Huber-White
Dependent variable ΔAvg Adjusted repurchaseTotal assets
0229 0229 0233
1171 1171 1171
Model (1) Model (2) Model (3)
Yes Yes Yes
Industry Industry Industry
Huber-White Huber-White Huber-White
0111 0112 0114
1168 1168 1168
55
Table 5
Effect of option-based compensation on payout mix
Panel A Two-period first-difference regression with total payout mix
Prediction Coeff t-stat Coeff t-stat Coeff t-stat
Accounting impact rank + 0006 028
Accounting impact rank=2 + 0018 045
Accounting impact rank=3 + -0001 -001
Accounting impact rank=4 + 0043 052
Treated + -0035 -094
Control variables
Fixed effect
Standard error
Adj R-squared
Observations
Panel B Two-period first-difference regression with net payout mix
Prediction Coeff t-stat Coeff t-stat Coeff t-stat
Accounting impact rank + -0002 -008
Accounting impact rank=2 + 0008 016
Accounting impact rank=3 + 0018 034
Accounting impact rank=4 + -0059 -055
Treated + -0050 -101
Control variables
Fixed effect
Standard error
Adj R-squared
Observations
0049 0043 0054
257 257 257
Industry Industry Industry
Huber-White Huber-White Huber-White
Dependent variable ΔAvg Regular dividendNet payout
Model (1) Model (2) Model (3)
Yes Yes Yes
0154 0151 0156
362 362 362
Industry Industry Industry
Huber-White Huber-White Huber-White
This table investigates the causal effect of option-based pay on payout mix for firms using both dividend and repurchase by examining
whether the changes of payout mix around FAS123R vary with its potential accounting impact Panel A reports the results of estimating
three two-period first-differencing models where for each firm we average its characteristics in Pre- and Post-FAS123R period In all three
specifications the dependent variable is the change of average Regular dividendTotal payout from Pre- to Post-FAS123R period The main
independent variable varies by model in Model (1) the Accounting impact rank is the quartile rank of implied option expensetotal assets
measured in 2002 (1=lowest 4=highest) In Model (2) Accounting impact rank=2 (3 4) is an indicator that takes value of one if the firmrsquos
Accounting impact rank equals 2 (3 4) In Model (3) we use an alternative treatment construction following Bakke et al (2015) where
Treated is an indicator that takes value of zero if the firm granted zero option to its CEO in both 2003 and 2004 or the firm began to
voluntarily expense option-based pay at fair value in 2002 or earlier and one otherwise Panel B reports the regressions with the change of
Regular dividendNet payout as the dependent variable and the same independent variables as in Panel A Panel A (Panel B) is based on
observations with nonzero regular dividend and repurchase (net repurchase) in both Pre- and Post-FAS123R period All models in Panel A
and B have industry fixed effects and the standard errors are Huber-White heteroscedasticity-consistent standard errors All variables are
defined in Appendix The notation and indicates statistically significant at 10 5 and 1 level respectively
Yes Yes Yes
Dependent variable ΔAvg Regular dividendTotal payout
Model (1) Model (2) Model (3)

25
Across all of these specifications we find no association between Accounting Impact or Treated
and the intensity of dividend changes Thus it does not appear that an exogenous reduction in
option-based pay caused dividend-paying firms to increase dividends
In Panel D we perform four robustness tests For parsimony we show only the coefficients of
interest and only the cases where the dependent variable is an indicator denoting a greater than
40 increase in DPS The results are similar for the other four ldquointensityrdquo dependent variables
reported in Panel C
In the first row we exclude firms that began to voluntarily expense options in 2003 or 2004
(84 firms of which 68 are dividend payers) FASB added accounting for stock-based
compensation to its agenda in March 2003 and issued an Exposure Draft proposing the expensing
of stock options at fair value in March 2004 In anticipation a number of firms began to
voluntarily expense stock options in 2003 and 2004 (Aboody et al 2004) If these firms reduced
option grants and as a result increased dividends during the Pre period then their inclusion may
reduce the power of our tests and thus our ability to detect the hypothesized relation25
In a similar spirit in the second row we exclude firms in the top decile in terms of reduction in
the ratio of option grants to total pay for the top 5 executives between 2002 (the year prior to the
Pre-period) and 2004 (the end of the Pre-period) This encompasses 113 firms of which 55 are
dividend payers If these firms reduced option grants in anticipation of FAS123R and as a result
increased dividends during the Pre period their inclusion may reduce our ability to detect the
hypothesized relation
has a large number of observations but a short time series Examples of studies making a similar choice are Puri
Rocholl and Steffen (2011) and Chu and Ma (2015) 25 This is unlikely to be a serious concern as previous studies suggest that voluntary expensers made limited use of
stock options (Aboody et al 2004) In fact in our sample 79 of these firms are in the bottom two quartiles of
implied option expense (untabulated) Nonetheless we present this test for robustness
26
In the third row we exclude firms that accelerated the vesting of options before FAS123R
became effective in order to avoid recognizing an expense for the unvested portion of these
options (Choudhary et al 2009 Balsam Reitenga and Yin 2008) This encompasses 196 firms of
which 54 are dividend payers If accelerating vesting was used to reduce the impact of FAS123R
the inclusion of these firms may reduce the power of our tests26
In the fourth row we deal with the concern that if firms target a fixed dividend to net income
ratio (Lintner 1956) and do so without adjusting for changes in accounting standards then by
decreasing net income (via option expense) the accounting change would mechanically cause a
reduction in dividends This would potentially offset and confound the increase predicted under
the dividend-protection and dilution hypotheses This seems unlikely for two reasons First firms
are notoriously reluctant to cut dividends (Brav et al 2005) Hence it seems unlikely that they
would reduce dividends in response to a decline in net income with no economic or cash flow
implications (ie re-classification of an expense from the footnotes to the income statement)
Second firms today set dividends in terms of dividend per share rather than by targeting a net
income-based payout ratio (Brav et al (2005)) As noted by Skinner (2008) over the last few
decades as earnings have become more variable the relation between earnings and dividends has
become weaker with dividend payments increasing smoothly and largely independent of the
variation in earnings Nevertheless in the fourth row we exclude the 66 dividend-paying firms that
26 These firms explicitly stated that they accelerated the vesting of stock options to avoid the accounting charge
(Choudhary et al 2009) In fact 72 are classified in the top two quartiles of implied option expense (untabulated)
Thus we would have predicted these firms to experience a significant decline in option pay To the extent that this
decline did not materialize because they minimized the impact of FAS123R by accelerating vesting the ability of
Accounting Impact to predict the reduction in option pay and thus its usefulness in examining changes in dividends
around FAS123R may be reduced The list of firms accelerating vesting was kindly provided by Jack Ciesielsky of
The Analystsrsquo Accounting Observer
27
had a similar payout ratio in 2003 and 2004 as a proxy for firms with a target net income-based
payout ratio in the Pre period27
As shown in Panel D even after excluding these subsets of firms we continue to find no
association between Accounting Impact or Treated and changes in dividends for dividend-paying
firms This is inconsistent with a causal influence of option compensation on dividend policy
Another concern is that by reducing net income and thus retained earnings FAS123R
may have pushed some firms closer to violating dividend covenants in debt contracts and
thus prevented them from increasing dividends This would bias our study against finding a
causal effect of option-based pay on dividends However this does not appear to be a
significant concern for three reasons First the recognition of an option expense does not
imply a decline in net income In fact more than 70 (75) of the full sample firms
(dividend payers) experienced an increase in net income before extraordinary items from
2004 to 2005 (the percentages are similar across the four quartiles of implied option
expense) Second dividend covenants are less common among dividend-paying firms
(Nikolaev 2010) Third most loan contracts in recent years give parties the option to
ldquofreezerdquo GAAP when facing a mandatory change in accounting principles (Christensen and
Nikolaev 2009) Firms expecting an adverse impact of FAS123R on their dividend covenants
would likely exercise this option (particularly given the non-cash nature of option-based
expense) Nonetheless to alleviate this concern we perform three additional analyses
(untabulated) (i) we repeat the tests in Panel C after excluding firms with a drop in net
income between 2004 and 2005 (ie firms that perhaps faced some covenant-related
27 We define a ldquosimilarrdquo payout to be an absolute change in payout ratio of less than 1 from 2003 to 2004 Among
these 66 firms only 39 continued to have a similar payout ratio in 2005 We also try an alternative definition where
a firm is classified as likely to be using a net income-based target payout ratio if the absolute percentage change in the
ratio from 2003 to 2004 is less than 10 (100 firms) Our inferences are unchanged
28
constrains to their payout policy as a result of FAS123R) (ii) we explicitly control for net
income and retained earnings in the regression (as in Skinner 2008) (iii) we repeat the tests
in Panel C for dividend payers with dividendsasset ratio above the sample median on the
basis that dividend covenants are less frequent among firms paying large dividends (Jung
Lee and Yang 2016) Our inferences are unchanged
332 Option-Based Pay and Dividend Payouts Dividend Initiations
In this section we examine whether the accounting-driven change in option pay affected
dividend initiations among non-payers We cannot employ the difference-in-difference approach
adopted so far by definition the same firm cannot initiate dividends in both periods However we
can provide suggestive evidence as follows First we take all firms that did not pay dividends in
2002 and group them into quartiles based on 2002 implied option expense For each quartile we
find the number of firms initiating dividends in 2003 and 2004 (the Pre period) Next we take all
firms that did not pay dividends in 2004 group them into quartiles based on 2002 implied option
expense and for each quartile find the number of firms initiating dividends in 2005 and 2006 (the
Post period) We do not include 2007 so as to have the same number of years in both periods and
make the cumulative initiation rates comparable
The left portion of Panel E reports the results of this exercise There is a general decrease in
the dividend initiation rate from the Pre to the Post period This holds both in the full sample of
non-payers (from 129 to 79) and across all quartiles This decrease may reflect a temporary
spike in 2003 and 2004 in response to the 2003 dividend tax cut documented in Chetty and Saez
(2005) It is noteworthy that initiation rates in both periods are lower among firms with higher
implied option expense This is consistent with option-heavy firms being mostly high-growth
firms less inclined to pay dividends More relevant to our research question if the lower use of
29
option compensation increased the propensity to pay dividends we would expect to see a relative
increase (ie a lower decrease) in dividend initiations among firms with the highest accounting
impact Instead the rate does not differ depending on the accounting impact There is
approximatley a 5 decline in initiation rate in each quartile In the right portion of Panel E we
examine similar data for dividend terminations While the results should be interpreted with
caution due to their rarity firms with higher accounting impact do not experience a greater decline
in termination rates Our inferences in Panel E are similar when we compared treated and control
firms following Bakke et al (2015) (untabulated)
Even after taking into account the different nature of decisions for dividend paying and non-
dividend-paying firms we fail to find evidence of a causal influence of option-based compensation
on dividend policy This finding is in contrast to the associations documented in earlier studies It
is even more remarkable as most firms replaced stock options with restricted stock which are
generally dividend-protected and should provide further incentive to increase dividends28
34 Option-Based Pay and Repurchases
In this section we examine the effect of an exogenous (accounting-induced) change in option
compensation on repurchases by estimating Equation (2)
Table 4 Panel A presents the results using the change in repurchases (scaled by total assets)
from Pre to Post as a dependent variable If the use of option-based pay had a positive effect on
firmsrsquo propensity to engage in repurchases as posited by the dividend-protection and dilution
hypotheses we should find a negative association between Accounting Impact or Treated and
repurchases Firms with a higher (accounting-driven) reduction in option-based pay should reduce
28 In a sample of SampP 500 firms between 2000 and 2009 Zhang (2013) reports that 80 of the firms granting
restricted stocks offer dividend protection In that sense the FAS123R-induced shift from stock options to restricted
stock may be characterized as a ldquoshockrdquo to dividend protection in unearned equity pay Accordingly our results cast
doubt on the causal interpretation of the positive association between dividend protection and dividend payouts
documented in prior studies (Zhang 2013 Burns et al 2015 Minnick and Rosenthal 2015)
30
the use of repurchases either because they are shifting toward a greater use of dividends andor
because they have a lower need to offset the dilutive effects of stock options However we find no
significant association between Accounting Impact (columns 1 and 2) and the change in
repurchases around the adoption of FAS123R When we use the Treated indicator (column 3) we
find a significant positive association rather than a negative one In Panel B we repeat the analysis
using net repurchases (ie repurchases after removing the effect of share issuances) following
Fama and French (2001) and Skinner (2008) Our inferences are unchanged29
This test is subject to two important caveats The first is we may not detect a decline in
repurchases because in the Post period firms need to offset the exercise of options that were
granted during the Pre period That is a post-FAS123R reduction in grants may not (yet) translate
into a reduction in exercises during the Post period which reduces our ability to test the dilution
hypothesis (ie that firms repurchase shares to offset exercises)30 However we can examine a
variation of this hypothesis where firms use repurchases to manage the effect of unexercised
options on diluted EPS (Bens et al 2003) To do so in Panel C we use a measure of adjusted
repurchases where we subtract our estimate of repurchases undertaken to offset the exercise of
ESO31 We effectively test whether firms experiencing an accounting-induced decrease in option
grants engage in less repurchases (net of exercise-driven repurchases) because their need to
manage the effect of unexercised options on diluted EPS is lower However the coefficient on
the variables of interest is either insignificant or positive inconsistent with the hypothesis
29 In the case of repurchases we do not examine separately ldquoinitiationsrdquo and ldquointensityrdquo as we do for dividends
because initiation is not clearly defined for repurchases Unlike dividends the occurrence of a repurchase in a given
year (or the lack thereof) cannot be used to infer a general policy due to the more discretionary nature of the timing of
repurchases 30 To capture the effect of lower option-based compensation on option exercises and thus on repurchases we would
ideally extend the Post period beyond 2007 However as noted by Floyd et al (2015) repurchases declined
dramatically after 2007 because of the financial crisis making it difficult to detect the effect of any other factor 31 As upper bound estimate of exercise-driven repurchases we multiply the number of ESO exercised during the year
times the average stock price during the year Since the number of ESO exercised is available in Compustat starting in
2004 Panel C is based on observations from 2004 to 2007
31
A second important caveat is that most firms replaced stock options with restricted stock
(Table 2 Panel C) Unvested restricted stock is excluded from the denominator in the computation
of basic EPS (once vested it is included) However it is included in the denominator of diluted
EPS using the treasury stock method similar to stock options Given the complexity of this
method without access to all details of restricted stock grants and option grants it is difficult to
determine whether the switch from stock options to restricted stock decreased the need for
dilution-driven repurchases as our test implicitly assumes Hence it is possible that we do not find
a decrease in repurchases because a reduced need to offset the dilutive effect of stock options was
neutralized by an increased need to offset the dilutive effect of restricted stock
Subject to the above caveats the evidence in Table 4 is not consistent with a positive causal
relation between the use of option-based pay and repurchases More precisely it suggests that
option-driven dilution concerns do not have a first-order effect on the magnitude of repurchases
even though they may play a role in the repurchase decision Hence our result is not necessarily
in conflict with the evidence in Brav et al (2005) where two-thirds of the surveyed financial
executives state that offsetting the dilutionary effect of stock option plans or other stock
programs is an important factor to their repurchase decisions
35 Option-Based Pay and Payout Composition
As an alternative to examining dividends and repurchases separately we also look at the
payout composition the change in the DividendsTotal Payout ratio from the Pre to the Post period
where Total Payout is the sum of dividends and repurchases As noted earlier we focus on the
subsample of firms with both dividends and repurchases in both Pre and Post periods so as to
capture the change in payout mix by firms routinely using both vehicles to return cash to
shareholders If the use of option-based pay causes firms to substitute repurchases for dividends
32
we should find a positive association between Accounting Impact or Treated and the payout mix
defined as DividendsTotal Payout ratio Firms with a higher accounting-driven reduction in
option-based pay should have an increase (decrease) in the relative weight of dividends
(repurchases) to the total payout However as reported in Table 5 Panel A we fail to find a
significant association between Accounting Impact (column 1 and 2) or Treated (column 3) and
the change in payout mix The results are similar when we use Net Payout (dividends plus net
repurchases) instead of Total Payout in computing the payout mix (Panel B)
Overall the combined evidence in Tables 3-5 does not support the hypothesis that option-
based compensation has negative (positive) effect on dividends (repurchases) or that it causes
firms to replace dividends with repurchases
4 Conclusion
Prior literature has documented robust associations between option-based compensation and
payout policy yet it remains unclear whether this association reflcts a causal influence We
investigate the causal effect of option-based compensation on payout policy using the adoption of
FAS123R which resulted in a significant decrease in option grants making it a plausible
exogenous shock to the use of option-based pay To overcome the challenge of no control group
we exploit the fact that firms responded differently depending on the firm-specific accounting
impact as measured by the implied option expense disclosed in the footnotes prior to FAS123R
Firms with larger expected accounting impact curtailed option-based compensation much more
aggressively than firms with lower impact Using a sample of SampP 1500 firms we find no
evidence that firms with a larger accounting-induced decline in option compensation increased
dividends reduced repurchases or changed their payout composition contrary to the widely held
belief that option-based pay has a causal influence on payout policy
33
Appendix Variable Definitions and Data Sources
Accounting Impact Variables
Accounting impact Implied option expense (Compustat XINTOPT) divided by total assets
(Compustat AT) This variable is measured at fiscal year 2002 and is time-invariant
Accounting impact rank The quartile rank of Accounting impact (1=lowest 4=highest)
Payout Variables
Regular dividendTotal assets The numerator is total regular cash dividends in the fiscal year
from the distribution dataset in CRSP Regular cash dividends are identified by the distribution
codes 1212 1222 1232 or 1242 The denominator is one-year lagged total assets (Compustat
AT)
DPS Dividend per share (Compustat DVPSX_F)
DPS pct change The percentage change of average DPS from Pre- to Post-FAS123R period
DPS pct change gtX indicator A dummy variable that equals one if DPC pct change is greater
than X and zero otherwise
RepurchaseTotal assets The numerator is the repurchase of common equity which equals total
repurchase (Compustat PRSTK) minus the change in preferred stock redemption value
(Compustat PSTKRV) The denominator is one-year lagged total assets (Compustat AT)
Net repurchaseTotal assets Net repurchase removes the effect of share issuances The
construction follows Fama and French (2001) and Skinner (2008) if the firm uses the treasury
stock method for repurchase net repurchase equals the increase in common treasury stock
(Compustat TSTKC) if the firm uses the retirement method (when common treasury stock is zero
in the current and prior year) net repurchase equals total repurchases minus stock issuance
(Compustat SSTK) and change in preferred stock redemption value (Compustat PSTKRV)
When the above measures give negative value net repurchase is set to zero
Adjusted repurchaseTotal assets Adjusted repurchase removes from total repurchase the potential
effect of repurchasing exercised options This variable equals total repurchase of common stocks
minus the product between the number of options exercised (Compustat OPTEXD) and average
stock price during the year When the above measure gives negative value adjusted repurchase is
set to zero Since the number of options exercised is not available before 2003 we drop
observations in 2003 when we use this variable
34
Total payoutTotal assets the sum of Regular dividendTotal assets and RepurchaseTotal assets
Regular dividendTotal payout regular cash dividend divided by the sum of regular cash dividend
and repurchase from common equity In the two-period analysis (Pre- vs Post-FAS123R) we
separately sum the numerator and the denominator for each firm-period and then calculate the ratio
Regular dividendNet payout regular dividend divided by the sum of regular dividend and net
repurchase In the two-period analysis (Pre- vs Post-FAS123R) we separately sum the numerator
and the denominator for each firm-period and then calculate the ratio
Compensation Variables
Salary_$ Average salary (Execucomp SALARY) of the top 5 highest paid executives in $1000
Salary_ Average salary (Execucomp SALARY) divided by average total pay (Execucomp
TDC1) of the top 5 highest paid executives
Bonus_$ Average bonus (Execucomp BONUS) of the top 5 highest paid executives in $1000
Due to a data format change we add non-equity plan-based awards (Execucomp
NON_EQ_TARG) to this measure after 2006
Bonus_ Bonus_$ divided by average total pay (Execucomp TDC1) of the top 5 highest paid
executives
Option grant_$ Average option grant value (Execucomp OPTION_AWARDS_BLK_VALUE or
OPTION_AWARDS_FV) of the top 5 highest paid executives in $1000 Due to a data format
change we use OPTION_AWARDS_FV for this measure after 2006
Option grant_ Option grant_$ divided by average total pay (Execucomp TDC1) of the top 5
highest paid executives
Restricted stock grant_$ Average restricted stock grant value (Execucomp RSTKGRNT or
STOCK_AWARDS_FV) of the top 5 highest paid executives in $1000 Due to data format
change we use STOCK_AWARDS_FV for this measure after 2006
Restricted stock grant_ Restricted stock grant_$ divided by average total pay (Execucomp
TDC1) of the top 5 highest paid executives
Total pay_$ Average total pay (Execucomp TDC1) of the top 5 highest paid executives in $1000
35
Other Characteristics
Size The book value of total assets (Compustat AT) minus the book value of common equity
(Compustat CEQ) plus the market value of common equity from CRSP in $M
Log(size) the natural logarithm of size
Book-to-market the book value of common equity dividend by its market value
Leverage long term debt plus short term debt (Compustat DLTT + DLC) divided by total assets
Asset tangibility tangible assets (Compustat AT - INTAN) divided by total assets
Free cash flow Operating cash flow (Compustat OANCF) minus capital expenditure (Compustat
CAPX) then divided by lagged total assets
Cash holding Cash and short-term investments (Compustat CHE) divided by total assets
ROA volatility the standard deviation of returns on assets (operating income before tax divided by
lagged total assets) in the past five fiscal years
Institutional ownership the number of shares held by institutional investors divided by the number
of shares outstanding from Thomson Reuters Institutional Holdings database
Sales growth the growth rate of sales (Compustat SALE) from the prior year
Past stock return annual stock return from the prior year
Loss indicator a dummy variable taking value of one if the current net income is negative and
zero otherwise
36
References
Aboody David 1996 Market Valuation of Employee Stock Options Journal of Accounting and
Economics 22 357-391
Aboody David Barth Mary E and Ron Kasznik 2004 Firms Voluntary Recognition of Stock-
Based Compensation Expense Journal of Accounting Research 42 123ndash150
Aboody David and Ron Kasznik 2008 Executive stock-based compensation and firmsrsquo cash
payout the role of shareholdersrsquo tax-related payout preferences Review of Accounting Studies
13 216ndash251
Anantharaman Divya and Yong Gyu Lee 2014 Managerial risk taking incentives and corporate
pension policy Journal of Financial Economics 111 328ndash351
Baker Malcolm and Jeffrey Wurgler 2004 A catering theory of dividends Journal of Finance
59 1125-1165
Baker Malcolm and Jeffrey Wurgler 2016 Dividends as reference points a behavioral signaling
approach Review of Financial Studies 29 697-738
Bakke Tor-Erik Hamed Mahmudi Chitru Fernando and Jesus Salas 2015 The causal effect of
option pay on corporate risk management Journal of Financial Economics forthcoming
Balsam Steven Austin Reitenga and Jennifer Yin 2008 Option acceleration in response to SFAS
No 123 (R) Accounting Horizons 22 23-45
Bens Daniel and Steven Monahan 2008 Altering Investment Decisions to Manage Financial
Reporting Outcomes Asset-Backed Commercial Paper Conduits and FIN 46 Journal of
Accounting Research 46 1017-1055
Bens Daniel A Venky Nagar Douglas J Skinner and MH Franco Wong 2003 Employee stock
options eps dilution and stock repurchases Journal of Accounting and Economics 36 51ndash90
Bertrand Marianne Esther Duflo and Sendhil Mullainathan 2004 How much should we trust
differences-in-differences estimates The Quarterly Journal of Economics 119 249ndash275
Blouin Jennifer L Jana S Raedy and Douglas A Shackelford 2011 Dividends Share
Repurchases and Tax Clienteles Evidence from the 2003 Reductions in Shareholder Taxes
The Accounting Review 86 887-914
Brav Alon John R Graham Campbell R Harvey and Roni Michaely 2005 Payout policy in the
21st century Journal of Financial Economics 77 483ndash527
Brown Lawrence D and Yen-Jung Lee 2011 Changes in Option-Based Compensation Around
the Issuance of SFAS123R Journal of Business Finance amp Accounting 38 1053ndash109
37
Brown Jeffrey R Nellie Liang and Scott Weisbenner 2007 Executive financial incentives and
payout policy Firm responses to the 2003 dividend tax cut Journal of Finance 62 1935ndash
1965
Burns Natasha Brian McTier and Kristina Minnick 2015 Equity-incentive compensation and
payout policy in Europe Journal of Corporate Finance 30 85-97
Carter Mary Ellen and Luann J Lynch 2003 The Consequences of the FASBrsquos 1998 Proposal on
Accounting for Stock Option Repricing Journal of Accounting and Economics 35 51-72
Carter Mary Ellen Luann J Lynch and Irem Tuna 2007 The role of accounting in the design of
CEO equity compensation The Accounting Review 82 327ndash357
Chava Sudheer and Amiyatosh Purnanandam 2010 CEOs versus CFOs Incentives and
corporate policies Journal of Financial Economics 97 263ndash278
Chetty Raj and Emmanuel Saez 2005 Dividend taxes and corporate behavior Evidence from the
2003 dividend tax cut The Quarterly Journal of Economics 120 791ndash833
Choudhary Preeti Shivaram Rajgopal and Mohan Venkatachalam 2009 Accelerated vesting of
employee stock options in anticipation of FAS123R Journal of Accounting Research 47 105ndash
146
Christensen Hans B and Valeri Nikolaev 2009 Contracting on Mandatory Changes to GAAP
New Practice and Its Determinants Working Paper University of Chicago
Chu Yongqiang and Tao Ma 2015 How does management compensation affect bank risk taking
evidence from FAS 123R University of South Carolina Working Paper
Cuny Charles J Gerald S Martin and John J Puthenpurackal 2009 Stock options and total
payout Journal of Financial and Quantitative Analysis 44 391ndash410
DeAngelo Harry Linda DeAngelo and Douglas J Skinner 2000 Special Dividends and the
Evolution of Dividend Signaling Journal of Financial Economics 57 309-354
Dechow Patricia M Amy P Hutton and Richard G Sloan 1996 Economic consequences of
accounting for stock-based compensation Journal of Accounting Research 34 1ndash20
Edgerton J 2013 Four facts about dividend payouts and the 2003 tax cut International Tax and
Public Finance 20 769-784
Edmans Alex and Xavier Gabaix 2015 Executive compensation a modern primer Journal of
Economic Literature forthcoming
38
Fama Eugene F and Kenneth R French 2001 Disappearing dividends changing firm
characteristics or lower propensity to pay Journal of Financial Economics 60 3ndash43
Farre-Mensa Joan Roni Michaely and Martin C Schmalz 2014 Payout policy Annual Review
of Financial Economics 6 75ndash134
Fenn George W and Nellie Liang 2001 Corporate payout policy and managerial stock
incentives Journal of Financial Economics 60 45ndash72
Ferri Fabrizio and Tatiana Sandino 2009 The impact of shareholder activism on financial
reporting and compensation the case of employee stock options expensing The Accounting
Review 84 433ndash466
Floyd Eric Nan Li and Douglas J Skinner 2015 Payout policy through the financial crisis the
growth of repurchases and the resilience of dividends Journal of Financial Economics 118
299-316
Frydman Carola and Dirk Jenter 2010 CEO compensation Annual Review of Financial
Economics 2 75-102
Gipper Brandon 2015 Assessing the Effects of Disclosing Management Compensation Working
Paper University of Chicago
Gormley Todd David Matsa and Todd Milbourn 2013 CEO compensation and corporate risk
evidence from a natural experiment Journal of Accounting and Economics 56 79-101
Graham John Michelle Hanlon and Terry Shevlin 2011 Real effects of accounting rules
evidence from multinational firmsrsquo investment locations and profit repatriation decisions
Journal of Accounting Research 49 137-185
Graham John Campbell Harvey and Shiva Rajgopal 2005 The Economic implications of
corporate financial reporting Journal of Accounting and Economics 40 3-73
Greenspan Alan 2002 Testimony of Alan Greenspan before the Committee on Banking
Housing and Urban Affairs US Senate July 16 Washington DC Government Printing
Office
Grullon Gustavo and Roni Michaely 2002 Dividends Share Repurchases and the Substitution
Hypothesis Journal of Finance 57 1649-1684
Hail Luzi Ahmed Tahoun and Clare Wang 2014 Dividend Payouts and Information Shocks
Journal of Accounting Research 52 403-456
Hall Brian J and Kevin J Murphy 2002 Stock options for undiversified executives Journal of
Accounting amp Economics 33 3-42
39
Hall Brian J and Kevin J Murphy 2003 The trouble with stock options Journal of Economic
Perspectives 17 49ndash70
Hanlon Michelle and Jeffrey L Hoopes 2014 What do firms do when dividend tax rates change
An examination of alternative payout responses Journal of Financial Economics 114 105-
124
Hayes Rachel M Michael Lemmon and Mingming Qiu 2012 Stock options and managerial
incentives for risk taking Evidence from FAS123R Journal of Financial Economics 105
174ndash190
Heron Randall A Erik Lie 2007 Does backdating explain the stock price pattern around
executive stock option grants Journal of Financial Economics 83 271-295
Hribar Paul Nicole Thorne Jenkins and W Bruce Johnson 2006 Stock repurchases as an
earnings management device Journal of Accounting and Economics 41 3ndash27
Jensen Michael C 1986 Agency cost of free cash flow corporate finance and takeovers
American Economic Review 76 323-329
Jolls Christine 1998 Stock repurchases and incentive compensation NBER Working Paper No
w6467
Jung Boochun Woo-Jong Lee and Yanhua Sunny Yang 2016 The Impact of Dividend
Covenants on Investment and Operating Performance Journal of Business Finance amp
Accounting 43 414ndash447
Kahle Kathleen M 2002 When a buyback isnrsquot a buyback open market repurchases and
employee options Journal of Financial Economics 63 235ndash261
Lambert Richard A William N Lanen and David F Larcker 1989 Executive stock option plans
and corporate dividend policy Journal of Financial and Quantitative Analysis 24 409ndash425
Lintner John 1956 Distribution of incomes of corporations among dividends retained earnings
and taxes The American Economic Review 46 97-113
Low Angie 2009 Managerial risk-taking behavior and equity-based compensation Journal of
Financial Economics 92 470-490
Miller Merton H and Franco Modigliani 1961 Dividend policy growth and the valuation of
shares The Journal of Business 34 411ndash433
Minnick Kristina and Leonard Rosenthal 2015 Stealth compensation Do CEOs increase their
pay by influencing dividend policy Journal of Corporate Finance 25 435-454
40
Murphy Kevin J 1999 Executive compensation In O Ashenfelter and D Card (eds) North
Holland Handbook of Labor Economics Amsterdam Elsevier Science BV
Murphy Kevin J 2013 Executive compensation Where we are and how we got there Handbook
of the Economics of Finance Elsevier Science North Holland 211-356
Nikolaev Valeri 2010 Debt Covenants and Accounting Conservatism Journal of Accounting
Research 48 143-176
Puri Manju Joumlrg Rocholl and Sascha Steffen 2011 Global retail lending in the aftermath of the
US financial crisis Distinguishing between supply and demand effects Journal of Financial
Economics 100 556-578
Shue Kelly and Richard R Townsend 2014 Swinging for the fences Executive reactions to
quasi-random option grants Working Paper University of Chicago
Skinner Douglas J 2008 The evolving relation between earnings dividends and stock
repurchases Journal of Financial Economics 87 582-609
Weisbenner Scott J 2000 Corporate share repurchases in the 1990s What role do stock options
play FEDS Working Paper No 2000-29
Zhang Dan 2013 CEO dividend protection Working Paper BI Norwegian Business School
41
Figure 1 Trends of dividends and repurchases from 2003 to 2007 Panel A plots the average
Regular DividendTotal Assets of firms in the highest and lowest quartiles of Accounting Impact
measured in 2002 Panel B shows the average Total RepurchaseTotal Assets of firms in the
highest and lowest quartiles of Accounting Impact measured in 2002
Panel A Trends of regular dividends
Panel B Trends of total repurchases
00
05
10
15
20
2003 2004 2005 2006 2007
Regular DividendTotal Assets
Lowest Acc Impact
Highest Acc Impact
Pre Post
00
20
40
60
80
100
2003 2004 2005 2006 2007
Total Repurchase Total Assets
Lowest Acc Impact
Highest Acc Impact
Pre Post
42
Table 1
Summary Statistics
Panel A Firm characteristics - full sample
N Mean Std dev 25 pctl Median 75 pctl
Accounting impact (2002) 1176 173 366 022 052 163
Payout variablesRegular dividendTotal assets 5653 093 148 000 000 142
RepurchaseTotal assets 5653 394 710 000 035 500
Total payoutTotal assets 5653 488 748 000 175 666
Regular dividendTotal payout 4091 3874 4057 000 2237 8833
Level of executive compensation (in $1000)
Salary_$ 5653 450 190 314 409 544
Bonus_$ 5653 476 616 122 295 586
Option grant_$ 5653 791 1137 62 384 1002
Restricted stock grant_$ 5653 458 866 0 58 518
Total pay_$ 5653 2481 2475 890 1647 3074
Percentage of executive compensation
Salary_ 5653 296 183 165 251 382
Bonus_ 5653 197 148 97 177 268
Option grant_ 5653 283 235 67 256 445
Restricted stock grant_ 5653 141 180 00 41 249
Control variables
Size ($M) 5653 11086 27294 1017 2459 8117
Log(size) 5653 7985 1565 6925 7808 9002
Book-to-market 5653 0445 0287 0251 0388 0578
Leverage 5653 0202 0172 0038 0187 0309
Asset tangibility 5653 0806 0184 0691 0853 0965
Free cash flow 5653 0059 0091 0013 0059 0108
Cash holding 5653 0166 0172 0034 0100 0247
ROA volatility 5653 0056 0056 0021 0038 0070
Institutional ownership 5653 0753 0202 0639 0795 0910
Sales growth 5653 0121 0189 0028 0096 0183
Past stock return 5653 0094 0183 -0012 0094 0199
Loss indicator 5653 0164 0370 0000 0000 0000
This table presents summary statistics Panel A shows the descriptive statistics of payout variables compensation
variables and other firm characteristics for the full sample Accounting impact is the implied option expense
measured at fiscal year 2002 All other variables are measured at firm-year level from fiscal year 2003 to 2007
resulting in 5653 firm-year observations (except for Regular dividendTotal Payout which can be measured only
for the 4901 firm-year observations with Total payout greater than zero) Panel B shows the pairwise correlations
between main variables at firm-year level Panel C compares payout variables compensation variables and other
firm characteristics before and after FAS123R The Pre-FAS123R period consists of fiscal year 2003 and 2004
the Post-FAS123R period covers fiscal year 2005-2007 Panel D compares the trends of payout and compensation
variables around FAS123R across four quartile groups ranked by 2002 accounting impact Panel E compares the
trends of payout and compensation variables around FAS123R between the treated and control group under the
alternative treatment definition in Bakke et al (2015) (see Section 22) All variables are defined in Appendix The
notation and in Panel C indicates statistically significant at 10 5 and 1 level in T-tests for equal
means respectively
43
Pa
nel
B
Pea
rso
n c
orr
ela
tio
ns
Reg div
Repurchase
Total payout
Salary_
Bonus_
Option_
RS_
Log(size)
BM
Leverage
Tangibility
FCF
Cash holdingROA vol
Inst own
Sales growth
Past ret
urn
Loss
Reg
div
10
0
Repurc
hase
01
610
0
Tota
l payout
03
509
810
0
Sala
ry_
-0
10
-01
8-0
19
10
0
Bonus_
00
700
100
3-0
01
10
0
Option_
-0
10
00
900
6-0
41
-03
510
0
RS
_
01
000
901
0-0
32
-01
1-0
40
10
0
Log(s
ize)
03
101
802
3-0
56
01
101
202
210
0
BM
-02
1-0
28
-03
103
0-0
03
-02
000
0-0
33
10
0
Levera
ge
-00
1-0
08
-00
8-0
05
00
6-0
11
00
801
9-0
03
10
0
Tangib
ility
00
200
100
101
200
1-0
05
-00
6-0
12
-00
4-0
18
10
0
FC
F02
203
703
9-0
20
00
901
1-0
01
02
4-0
32
-02
1-0
16
10
0
Cash
hold
ing
-01
301
000
700
2-0
14
02
2-0
10
-02
3-0
16
-03
502
901
210
0
RO
A v
ol
-01
5-0
04
-00
700
4-0
11
01
9-0
11
-02
3-0
08
-01
101
2-0
02
03
910
0
Inst
ow
n
-00
901
401
1-0
17
00
200
701
200
7-0
01
00
3-0
08
01
4-0
06
-01
110
0
Sale
s gro
wth
-00
8-0
04
-00
6-0
15
00
501
0-0
02
00
7-0
16
-00
3-0
08
01
300
201
400
410
0
Past
retu
rn00
901
301
4-0
18
01
5-0
01
00
301
6-0
29
-01
000
102
7-0
14
-01
001
602
710
0
Loss
-02
0-0
19
-02
201
8-0
18
00
4-0
05
-02
601
901
300
6-0
41
01
702
3-0
16
-01
8-0
40
10
0
44
Panel C Firm characteristics - before and after FAS123R
Pre FAS 123R Post FAS 123R Difference
Payout variables
Regular dividendTotal assets 083 099 016
RepurchaseTotal assets 245 490 245
Total payoutTotal assets 328 589 261
Regular dividendTotal payout 3914 2790 -1124
Level of executive compensation (in $1000)
Salary_$ 426 463 37
Bonus_$ 418 505 87
Option grant_$ 896 707 -191
Restricted stock grant_$ 269 574 305
Total pay_$ 2263 2584 321
Percentage of executive compensation
Salary_ 305 293 -12
Bonus_ 186 204 18
Option grant_ 343 240 -103
Restricted stock grant_ 87 176 89
Control variables
Size ($M) 9671 11631 1960
Log(size) 7860 8035 0175
Book-to-market 0437 0453 0016
Leverage 0201 0203 0002
Asset tangibility 0822 0793 -0029
Free cash flow 0061 0057 -0004
Cash holding 0175 0159 -0016
ROA volatility 0067 0048 -0019
Institutional ownership 0712 0781 0069
Sales growth 0137 0108 -0029
Past stock return 0080 0101 0021
Loss indicator 0173 0159 -0014
45
Pa
nel
D
Fir
m c
ha
racte
rist
ics
by q
ua
rtil
e o
f a
cco
un
tin
g i
mp
act
- b
efo
re a
nd
aft
er
FA
S1
23
R
Accounting im
pact
(2002)
Num
ber
of
Fir
ms
Pre
Post
Pre
Post
Pre
Post
Pre
Post
Payout
vari
able
s
Regula
r div
idendT
ota
l ass
ets
11
2
12
4
09
4
11
1
09
5
11
3
03
0
04
9
Repurc
hase
Tota
l ass
ets
11
3
26
8
19
2
37
3
32
7
63
1
35
1
68
7
Tota
l payout
Tota
l ass
ets
22
4
39
1
28
5
48
4
42
2
74
4
38
1
73
6
Regula
r div
idendT
ota
l payout
643
7
469
8
474
0
341
1
284
5
195
4
82
5
74
5
Perc
enta
ge o
f executive c
om
pensa
tion
Sala
ry_
337
295
313
287
296
289
276
300
Bonus_
223
226
214
228
172
192
134
169
Option g
rant_
201
167
290
210
373
260
507
325
Rest
ricte
d s
tock g
rant_
116
194
98
180
89
176
43
155
294
294
294
294
1st Q
uart
ile2
nd Q
uart
ile3
rd Q
uart
ile4
th Q
uart
ile
01
2
03
5
09
3
55
1
46
Accounting impact
Number of Firms
By accounting impact quartile
1
2
3
4
Pre Post Pre Post
Payout variables
Regular dividendTotal assets 09 11 08 10
RepurchaseTotal assets 18 31 26 52
Total payoutTotal assets 28 43 34 62
Regular dividendTotal payout 428 357 386 265
Percentage of executive compensation
Salary_ 435 364 282 280
Bonus_ 226 214 179 202
Option grant_ 92 125 387 261
Restricted stock grant_ 125 188 80 174
Percentage of CEO compensation
Salary_(CEO) 485 364 260 259
Bonus_(CEO) 249 228 185 219
Option grant_(CEO) 10 127 406 275
Restricted stock grant_(CEO) 128 182 82 183
Panel E Firm characteristics by alternative treatment definition - before and
after FAS123R
Treated
25
19
997
223
250
256
268
10
177
71
Control
44
37
47
Table 2
Differential effect of FAS123R on the use of option-based compensation
Panel A Two-period first-difference regression
Prediction Coeff t-stat Coeff t-stat Coeff t-stat
Accounting impact rank - -0044 -628
Accounting impact rank=2 - -0044 -327
Accounting impact rank=3 - -0075 -468
Accounting impact rank=4 - -0140 -613
Treated - -0132 -875
ΔLog(size) 0061 202 0061 200 0063 214
ΔBook-to-market 0032 091 0032 092 0051 143
ΔLeverage -0157 -213 -0160 -218 -0111 -153
ΔAsset tangibility -0012 -014 -0020 -023 -0023 -026
ΔFree cash flow -0106 -095 -0108 -097 -0128 -117
ΔCash holding -0197 -211 -0193 -206 -0180 -194
ΔFive-year ROA volatility -0065 -031 -0056 -026 -0098 -047
ΔInstitutional ownership -0044 -091 -0043 -088 -0044 -092
ΔSales growth -0064 -102 -0065 -104 -0090 -153
ΔPast one-year stock return 0051 078 0052 080 0091 138
ΔLoss frequency 0056 207 0057 207 0047 179
Log(size) -0009 -210 -0009 -207 -0002 -035
Book-to-market -0015 -056 -0013 -049 0018 072
Leverage 0022 046 0023 048 0068 150
Asset tangibility 0033 077 0033 078 0053 128
Free cash flow 0227 202 0220 195 0127 117
Cash holding -0002 -004 0012 019 -0078 -141
Five-year ROA volatility -0451 -240 -0430 -228 -0509 -283
Institutional ownership -0123 -360 -0122 -359 -0100 -292
Sales growth -0041 -056 -0040 -055 -0089 -125
Past one-year stock return -0009 -015 -0006 -010 0078 125
Loss frequency 0055 174 0056 178 0054 173
Fixed effect
Standard error
Adj R-squared
Observations
Model (3)
Dependent variable ΔAvg Option grantTotal pay
Huber-White
0156
This table investigates whether the effect of FAS123R on the use of option-based pay varies with its potential accounting impact Panel A
reports the results of estimating three two-period first-differencing models where for each firm we average its characteristics in Pre- and
Post-FAS123R period The Pre-FAS123R period consists of fiscal year 2003 and 2004 the Post-FAS123R period covers fiscal year 2005-
2007 In all three specifications the dependent variable is the change of average Option grantTotal pay from Pre- to Post-FAS123R period
The main independent variable varies by model in Model (1) the Accounting impact rank is the quartile rank of implied option expensetotal
assets measured in 2002 (1=lowest 4=highest) In Model (2) Accounting impact rank=2 (3 4) is an indicator that takes value of one if the
firmrsquos Accounting impact rank equals 2 (3 4) In Model (3) we use an alternative treatment construction following Bakke et al (2015)
where Treated is an indicator that takes value of zero if the firm granted zero option to its CEO in both 2003 and 2004 or the firm began to
voluntarily expense option-based pay at fair value in 2002 or earlier and one otherwise For each control variable we include both its level in
the Pre-FAS123R period and its change across the two periods Panel B shows the results of estimating fixed effect models with firm-year
observations The dependent variable is the firm-year level Option grantTotal pay The main independent variables are the interactions of
Post-FAS123R indicator (Post) with Accounting Impact rank Accounting impact rank indicators and Treated respectively All models in
Penal A have industry fixed effects and the standard errors are Huber-White heteroscedasticity-consistent standard errors All models in
Penal B have firm fixed effects and year fixed effects and the standard errors are clustered at firm level All variables are defined in
Appendix The notation and indicates statistically significant at 10 5 and 1 level respectively
Model (1) Model (2)
11711171 1171
Industry Industry
Huber-White
0124
Huber-White
0123
Industry
48
Panel B Panel fixed effects regression
Prediction Coeff t-stat Coeff t-stat Coeff t-stat
Acc impact rank x Post - -0044 -807
Acc impact rank 2 x Post - -0046 -333
Acc impact rank 3 x Post - -0077 -526
Acc impact rank 4 x Post - -0137 -776
Treated x Post - -0145 -970
Log(size) 0034 221 0034 217 0036 229
Book-to-market 0018 084 0017 083 0015 070
Leverage -0004 -009 -0006 -013 -0007 -015
Asset tangibility 0007 012 0004 006 0011 018
Free cash flow -0074 -151 -0072 -146 -0078 -158
Cash holding -0048 -086 -0050 -090 -0006 -011
Five-year ROA volatility 0250 231 0239 219 0437 414
Institutional ownership 0043 159 0044 161 0041 150
Sales growth -0033 -168 -0034 -171 -0031 -158
Past one-year stock return 0067 221 0068 224 0063 204
Loss indicator 0023 209 0022 207 0024 222
Fixed effects
Standard error
Adj R-squared
Observations
Dependent variable Option grantTotal pay
5653 5653 5653
Clustered by firm
Firm Year
Clustered by firm
Firm Year
Clustered by firm
0523 0523 0526
Model (1) Model (2) Model (3)
Firm Year
49
Table 3
Effect of option-based compensation on dividend policy
Panel A Two-period first-difference regression
Prediction Coeff t-stat Coeff t-stat Coeff t-stat
Accounting impact rank + 0000 077
Accounting impact rank=2 + 0001 091
Accounting impact rank=3 + 0000 044
Accounting impact rank=4 + 0001 092
Treated + 0000 -026
ΔLog(size) 0000 -030 0000 -030 0000 -026
ΔBook-to-market -0002 -190 -0002 -193 -0002 -195
ΔLeverage -0002 -059 -0002 -057 -0002 -059
ΔAsset tangibility 0016 431 0016 429 0016 430
ΔFree cash flow 0017 373 0017 373 0017 375
ΔCash holding -0011 -288 -0011 -285 -0010 -282
ΔFive-year ROA volatility 0003 034 0002 032 0003 035
ΔInstitutional ownership -0002 -073 -0002 -073 -0002 -070
ΔSales growth -0001 -040 -0001 -037 -0001 -038
ΔPast one-year stock return 0002 077 0002 076 0002 070
ΔLoss frequency 0000 -048 0000 -045 0000 -046
Log(size) 0000 183 0000 182 0000 182
Book-to-market -0002 -227 -0002 -225 -0002 -284
Leverage -0001 -037 -0001 -039 -0001 -048
Asset tangibility 0003 179 0003 180 0003 176
Free cash flow 0017 291 0017 291 0017 300
Cash holding 0002 080 0002 077 0002 098
Five-year ROA volatility 0003 035 0002 033 0003 044
Institutional ownership -0001 -068 -0001 -068 -0001 -058
Sales growth -0004 -177 -0004 -175 -0004 -172
Past one-year stock return 0004 169 0004 167 0004 165
Loss frequency -0001 -111 -0001 -109 -0001 -102
Fixed effect
Standard error
Adj R-squared
Observations
Dependent variable ΔAvg Regular dividendTotal assets
This table investigates the causal effect of option-based pay on dividend policy by examining whether changes in dividend policy around
FAS123R vary with its potential accounting impact Panel A reports the results of estimating three two-period first-differencing models
where for each firm we average its characteristics in Pre- and Post-FAS123R period In all three specifications the dependent variable is
the change of average Regular dividendTotal assets from Pre- to Post-FAS123R period The main independent variable varies by model in
Model (1) the Accounting impact rank is the quartile rank of implied option expensetotal assets measured in 2002 (1=lowest 4=highest) In
Model (2) Accounting impact rank=2 (3 4) is an indicator that takes value of one if the firmrsquos Accounting impact rank equals 2 (3 4) In
Model (3) we use an alternative treatment construction following Bakke et al (2015) where Treated is an indicator that takes value of zero
if the firm granted zero option to its CEO in both 2003 and 2004 or the firm began to voluntarily expense option-based pay at fair value in
2002 or earlier and one otherwise For each control variable we include both its level in the Pre-FAS123R period and its change across the
two periods Panel B shows the results of estimating fixed effect models with firm-year observations The dependent variable is the firm-
year level Regular dividendTotal assets The main independent variables are the interactions of Post-FAS123R indicator (Post) with
Accounting Impact rank Accounting impact rank indicators and Treated respectively Panel C examines the intensity of dividend changes
among firms with nonzero dividend per share in 2003 or 2004 In particular we estimates the same three models as in Panel A(with the
same independent variables) but for five dependent variables the change of average Regular dividendTotal assets from Pre- to Post-
FAS123R period (as in Panel A) the percentage change of DPS (dividend per share) from Pre- to Post-FAS123R period and three
indicators denoting respectively whether the percentage change of DPS was greater than 20 40 and 60 Panel D reports four
robustness tests of the dividend intensity regression In each of them a set of possible confounding observations is removed (see Section 33
for details) Panel E compares the trends of dividend initiation and termination around FAS123R across four quartile groups ranked by
accounting impact All models in Panel A C and D have industry fixed effects and the standard errors are Huber-White heteroscedasticity-
consistent standard errors All models in Penal B have firm fixed effects and year fixed effects and the standard errors are clustered at
firm level All variables are defined in Appendix The notation and indicates statistically significant at 10 5 and 1 level
Industry Industry Industry
Model (1) Model (2) Model (3)
1171 1171 1171
Huber-White Huber-White Huber-White
0105 0104 0105
50
Panel B Panel fixed effects regression
Prediction Coeff t-stat Coeff t-stat Coeff t-stat
Acc impact rank x Post + 0000 122
Acc impact rank 2 x Post + 0001 110
Acc impact rank 3 x Post + 0001 094
Acc impact rank 4 x Post + 0001 129
Treated x Post + 0000 -012
Log(size) 0001 179 0001 179 0001 181
Book-to-market 0000 025 0000 024 0000 031
Leverage 0001 062 0001 064 0001 069
Asset tangibility 0009 360 0009 358 0009 363
Free cash flow 0002 090 0002 093 0002 092
Cash holding -0007 -295 -0007 -298 -0007 -298
Five-year ROA volatility 0001 041 0001 038 0000 -006
Institutional ownership 0000 -027 0000 -026 0000 -027
Sales growth 0000 053 0000 051 0000 044
Past one-year stock return 0001 089 0001 088 0001 078
Loss indicator 0000 -060 0000 -057 0000 -076
Fixed effects
Standard error
Adj R-squared
Observations
Dependent variable Regular dividendTotal assets
Model (1) Model (2) Model (3)
Firm Year Firm Year Firm Year
5653 5653 5653
Clustered by firm Clustered by firm Clustered by firm
0877 0877 0877
51
Panel C Intensity of dividend changes around FAS123R
Prediction Coeff t-stat Coeff t-stat Coeff t-stat
Accounting impact rank + 0000 065
Accounting impact rank=2 + 0000 048
Accounting impact rank=3 + 0000 026
Accounting impact rank=4 + 0002 080
Treated + 0001 063
Dependent var DPS pct change
Accounting impact rank + -0145 -072
Accounting impact rank=2 + 0018 006
Accounting impact rank=3 + -0177 -045
Accounting impact rank=4 + -0746 -100
Treated + -0407 -119
Accounting impact rank + 0029 095
Accounting impact rank=2 + 0040 074
Accounting impact rank=3 + 0092 139
Accounting impact rank=4 + 0008 007
Treated + -0007 -012
Accounting impact rank + 0024 076
Accounting impact rank=2 + 0047 088
Accounting impact rank=3 + 0079 114
Accounting impact rank=4 + -0003 -002
Treated + 0030 052
Accounting impact rank + 0030 098
Accounting impact rank=2 + 0078 155
Accounting impact rank=3 + 0085 130
Accounting impact rank=4 + 0014 012
Treated + -0006 -011
Control variables
Fixed effect
Standard error
Observations 572 572 572
Yes Yes Yes
Huber-White Huber-White Huber-White
Industry Industry Industry
Dependent var DPS pct
change gt60 indicator
Model (1) Model (2) Model (3)
Dependent var ΔAvg Regular
dividendAssets
Dependent var DPS pct
change gt20 indicator
Dependent var DPS pct
change gt40 indicator
52
Panel D Robustness tests for intensity of dividend changes around FAS123R
Prediction Coeff t-stat Coeff t-stat Coeff t-stat
Accounting impact rank + 0006 017
Accounting impact rank=2 + 0067 118
Accounting impact rank=3 + 0041 057
Accounting impact rank=4 + -0061 -049
Treated + 0022 035Observations
Accounting impact rank + 0009 027
Accounting impact rank=2 + 0058 106
Accounting impact rank=3 + 0032 043
Accounting impact rank=4 + -0032 -024
Treated + 0018 028
Observations
Accounting impact rank + 0030 089
Accounting impact rank=2 + 0039 071
Accounting impact rank=3 + 0122 168
Accounting impact rank=4 + -0063 -052
Treated + 0075 132
Observations
Accounting impact rank + 0008 023
Accounting impact rank=2 + 0023 042
Accounting impact rank=3 + 0048 064
Accounting impact rank=4 + -0042 -033
Treated + -0010 -016
Observations
Control variables
Fixed effect
Standard error
Exclude firms with stable
payout ratio from 2003 to 2004
506 506 506
Dependent variable DPS pct change gt40 indicator
Model (1) Model (2) Model (3)
Exclude voluntary expensers
519 519
Exclude firms in the top decile
of option reduction (02-04)
Exclude firms that accelerated
option vesting
504 504 504
517 517 517
519
Huber-White Huber-White Huber-White
Yes Yes Yes
Industry Industry Industry
53
Panel E Dividend initiation and termination rates around FAS123R
Pre FAS 123R
1 280 75 7 6 13 173
2 284 135 18 9 27 200
3 286 181 11 14 25 138
4 282 260 9 10 19 73
Total 1132 651 45 39 84 129
Post FAS 123R
1 275 63 4 4 8 127
2 280 116 9 9 18 155
3 276 152 9 3 12 79
4 263 223 5 1 6 27
Total 1094 554 27 17 44 79
Pre FAS 123R
1 280 205 2 0 2 10
2 284 149 7 1 8 54
3 286 105 0 0 0 00
4 282 22 0 0 0 00
Total 1132 481 9 1 10 21
Post FAS 123R
1 275 212 3 6 9 42
2 280 164 1 2 3 18
3 276 124 1 1 2 16
4 263 40 0 3 3 75
Total 1094 540 5 12 17 31
termination
in 2004
03-04
cumulative
03-04
cumulative
Quartile firms
with
dividend in
2004
termination
in 2005
termination
in 2006
05-06
cumulative
05-06
cumulative
Termination
Quartile firms
with
dividend in
2002
termination
in 2003
without
dividend in
2004
initiation in
2003
initiation in
2004
03-04
cumulative
03-04
cumulative firmsQuartile
firmsQuartile initiation in
2005
initiation in
2006
05-06
cumulative
05-06
cumulative
Initiation
without
dividend in
2002
54
Table 4
Effect of option-based compensation on repurchases
Panel A Two-period first-difference regression with total repurchase
Prediction Coeff t-stat Coeff t-stat Coeff t-stat
Accounting impact rank - 0002 122
Accounting impact rank=2 - 0002 071
Accounting impact rank=3 - 0005 123
Accounting impact rank=4 - 0007 102
Treated - 0014 365
Control variables
Fixed effect
Standard error
Adj R-squared
Observations
Panel B Two-period first-difference regression with net repurchase
Prediction Coeff t-stat Coeff t-stat Coeff t-stat
Accounting impact rank - 0003 166
Accounting impact rank=2 - 0002 051
Accounting impact rank=3 - 0006 165
Accounting impact rank=4 - 0009 137
Treated - 0010 300
Control variables
Fixed effect
Standard error
Adj R-squared
Observations
Panel C Two-period first-difference regression with repurchase adjusted for exercised options
Prediction Coeff t-stat Coeff t-stat Coeff t-stat
Accounting impact rank - 0001 056
Accounting impact rank=2 - 0002 062
Accounting impact rank=3 - 0007 172
Accounting impact rank=4 - -0001 -008
Treated - 0006 197
Control variables
Fixed effect
Standard error
Adj R-squared
Observations
Dependent variable ΔAvg RepurchaseTotal assets
This table investigates the causal effect of option-based pay on payout policy by examining whether the changes of repurchase around
FAS123R vary with its potential accounting impact Panel A reports the results of estimating three two-period first-differencing models
where for each firm we average its characteristics in Pre- and Post-FAS123R period In all three specifications the dependent variable is
the change of average RepurchaseTotal assets from Pre- to Post-FAS123R period The main independent variable varies by model in
Model (1) the Accounting impact rank is the quartile rank of implied option expensetotal assets measured in 2002 (1=lowest 4=highest)
In Model (2) Accounting impact rank=2 (3 4) is an indicator that takes value of one if the firmrsquos Accounting impact rank equals 2 (3 4)
In Model (3) we use an alternative treatment construction following Bakke et al (2015) where Treated is an indicator that takes value of
zero if the firm granted zero option to its CEO in both 2003 and 2004 or the firm began to voluntarily expense option-based pay at fair
value in 2002 or earlier and one otherwise Panel B reports the regressions with the change of Net repurchaseTotal assets as the
dependent variable and the same independent variable as in Panel A Panel C reports the regressions with the change of Adjusted
repurchaseTotal assets as the dependent variable and the same independent variable as in Panel A All models in Panel A B and C have
industry fixed effects and the standard errors are Huber-White heteroscedasticity-consistent standard errors All variables are defined in
Appendix The notation and indicates statistically significant at 10 5 and 1 level respectively
Model (1) Model (2) Model (3)
Yes Yes Yes
Industry Industry Industry
Huber-White Huber-White Huber-White
Dependent variable ΔAvg Net repurchaseTotal assets
1171 1171 1171
0238 0237 0245
Model (1) Model (2) Model (3)
Yes Yes Yes
Industry Industry Industry
Huber-White Huber-White Huber-White
Dependent variable ΔAvg Adjusted repurchaseTotal assets
0229 0229 0233
1171 1171 1171
Model (1) Model (2) Model (3)
Yes Yes Yes
Industry Industry Industry
Huber-White Huber-White Huber-White
0111 0112 0114
1168 1168 1168
55
Table 5
Effect of option-based compensation on payout mix
Panel A Two-period first-difference regression with total payout mix
Prediction Coeff t-stat Coeff t-stat Coeff t-stat
Accounting impact rank + 0006 028
Accounting impact rank=2 + 0018 045
Accounting impact rank=3 + -0001 -001
Accounting impact rank=4 + 0043 052
Treated + -0035 -094
Control variables
Fixed effect
Standard error
Adj R-squared
Observations
Panel B Two-period first-difference regression with net payout mix
Prediction Coeff t-stat Coeff t-stat Coeff t-stat
Accounting impact rank + -0002 -008
Accounting impact rank=2 + 0008 016
Accounting impact rank=3 + 0018 034
Accounting impact rank=4 + -0059 -055
Treated + -0050 -101
Control variables
Fixed effect
Standard error
Adj R-squared
Observations
0049 0043 0054
257 257 257
Industry Industry Industry
Huber-White Huber-White Huber-White
Dependent variable ΔAvg Regular dividendNet payout
Model (1) Model (2) Model (3)
Yes Yes Yes
0154 0151 0156
362 362 362
Industry Industry Industry
Huber-White Huber-White Huber-White
This table investigates the causal effect of option-based pay on payout mix for firms using both dividend and repurchase by examining
whether the changes of payout mix around FAS123R vary with its potential accounting impact Panel A reports the results of estimating
three two-period first-differencing models where for each firm we average its characteristics in Pre- and Post-FAS123R period In all three
specifications the dependent variable is the change of average Regular dividendTotal payout from Pre- to Post-FAS123R period The main
independent variable varies by model in Model (1) the Accounting impact rank is the quartile rank of implied option expensetotal assets
measured in 2002 (1=lowest 4=highest) In Model (2) Accounting impact rank=2 (3 4) is an indicator that takes value of one if the firmrsquos
Accounting impact rank equals 2 (3 4) In Model (3) we use an alternative treatment construction following Bakke et al (2015) where
Treated is an indicator that takes value of zero if the firm granted zero option to its CEO in both 2003 and 2004 or the firm began to
voluntarily expense option-based pay at fair value in 2002 or earlier and one otherwise Panel B reports the regressions with the change of
Regular dividendNet payout as the dependent variable and the same independent variables as in Panel A Panel A (Panel B) is based on
observations with nonzero regular dividend and repurchase (net repurchase) in both Pre- and Post-FAS123R period All models in Panel A
and B have industry fixed effects and the standard errors are Huber-White heteroscedasticity-consistent standard errors All variables are
defined in Appendix The notation and indicates statistically significant at 10 5 and 1 level respectively
Yes Yes Yes
Dependent variable ΔAvg Regular dividendTotal payout
Model (1) Model (2) Model (3)

26
In the third row we exclude firms that accelerated the vesting of options before FAS123R
became effective in order to avoid recognizing an expense for the unvested portion of these
options (Choudhary et al 2009 Balsam Reitenga and Yin 2008) This encompasses 196 firms of
which 54 are dividend payers If accelerating vesting was used to reduce the impact of FAS123R
the inclusion of these firms may reduce the power of our tests26
In the fourth row we deal with the concern that if firms target a fixed dividend to net income
ratio (Lintner 1956) and do so without adjusting for changes in accounting standards then by
decreasing net income (via option expense) the accounting change would mechanically cause a
reduction in dividends This would potentially offset and confound the increase predicted under
the dividend-protection and dilution hypotheses This seems unlikely for two reasons First firms
are notoriously reluctant to cut dividends (Brav et al 2005) Hence it seems unlikely that they
would reduce dividends in response to a decline in net income with no economic or cash flow
implications (ie re-classification of an expense from the footnotes to the income statement)
Second firms today set dividends in terms of dividend per share rather than by targeting a net
income-based payout ratio (Brav et al (2005)) As noted by Skinner (2008) over the last few
decades as earnings have become more variable the relation between earnings and dividends has
become weaker with dividend payments increasing smoothly and largely independent of the
variation in earnings Nevertheless in the fourth row we exclude the 66 dividend-paying firms that
26 These firms explicitly stated that they accelerated the vesting of stock options to avoid the accounting charge
(Choudhary et al 2009) In fact 72 are classified in the top two quartiles of implied option expense (untabulated)
Thus we would have predicted these firms to experience a significant decline in option pay To the extent that this
decline did not materialize because they minimized the impact of FAS123R by accelerating vesting the ability of
Accounting Impact to predict the reduction in option pay and thus its usefulness in examining changes in dividends
around FAS123R may be reduced The list of firms accelerating vesting was kindly provided by Jack Ciesielsky of
The Analystsrsquo Accounting Observer
27
had a similar payout ratio in 2003 and 2004 as a proxy for firms with a target net income-based
payout ratio in the Pre period27
As shown in Panel D even after excluding these subsets of firms we continue to find no
association between Accounting Impact or Treated and changes in dividends for dividend-paying
firms This is inconsistent with a causal influence of option compensation on dividend policy
Another concern is that by reducing net income and thus retained earnings FAS123R
may have pushed some firms closer to violating dividend covenants in debt contracts and
thus prevented them from increasing dividends This would bias our study against finding a
causal effect of option-based pay on dividends However this does not appear to be a
significant concern for three reasons First the recognition of an option expense does not
imply a decline in net income In fact more than 70 (75) of the full sample firms
(dividend payers) experienced an increase in net income before extraordinary items from
2004 to 2005 (the percentages are similar across the four quartiles of implied option
expense) Second dividend covenants are less common among dividend-paying firms
(Nikolaev 2010) Third most loan contracts in recent years give parties the option to
ldquofreezerdquo GAAP when facing a mandatory change in accounting principles (Christensen and
Nikolaev 2009) Firms expecting an adverse impact of FAS123R on their dividend covenants
would likely exercise this option (particularly given the non-cash nature of option-based
expense) Nonetheless to alleviate this concern we perform three additional analyses
(untabulated) (i) we repeat the tests in Panel C after excluding firms with a drop in net
income between 2004 and 2005 (ie firms that perhaps faced some covenant-related
27 We define a ldquosimilarrdquo payout to be an absolute change in payout ratio of less than 1 from 2003 to 2004 Among
these 66 firms only 39 continued to have a similar payout ratio in 2005 We also try an alternative definition where
a firm is classified as likely to be using a net income-based target payout ratio if the absolute percentage change in the
ratio from 2003 to 2004 is less than 10 (100 firms) Our inferences are unchanged
28
constrains to their payout policy as a result of FAS123R) (ii) we explicitly control for net
income and retained earnings in the regression (as in Skinner 2008) (iii) we repeat the tests
in Panel C for dividend payers with dividendsasset ratio above the sample median on the
basis that dividend covenants are less frequent among firms paying large dividends (Jung
Lee and Yang 2016) Our inferences are unchanged
332 Option-Based Pay and Dividend Payouts Dividend Initiations
In this section we examine whether the accounting-driven change in option pay affected
dividend initiations among non-payers We cannot employ the difference-in-difference approach
adopted so far by definition the same firm cannot initiate dividends in both periods However we
can provide suggestive evidence as follows First we take all firms that did not pay dividends in
2002 and group them into quartiles based on 2002 implied option expense For each quartile we
find the number of firms initiating dividends in 2003 and 2004 (the Pre period) Next we take all
firms that did not pay dividends in 2004 group them into quartiles based on 2002 implied option
expense and for each quartile find the number of firms initiating dividends in 2005 and 2006 (the
Post period) We do not include 2007 so as to have the same number of years in both periods and
make the cumulative initiation rates comparable
The left portion of Panel E reports the results of this exercise There is a general decrease in
the dividend initiation rate from the Pre to the Post period This holds both in the full sample of
non-payers (from 129 to 79) and across all quartiles This decrease may reflect a temporary
spike in 2003 and 2004 in response to the 2003 dividend tax cut documented in Chetty and Saez
(2005) It is noteworthy that initiation rates in both periods are lower among firms with higher
implied option expense This is consistent with option-heavy firms being mostly high-growth
firms less inclined to pay dividends More relevant to our research question if the lower use of
29
option compensation increased the propensity to pay dividends we would expect to see a relative
increase (ie a lower decrease) in dividend initiations among firms with the highest accounting
impact Instead the rate does not differ depending on the accounting impact There is
approximatley a 5 decline in initiation rate in each quartile In the right portion of Panel E we
examine similar data for dividend terminations While the results should be interpreted with
caution due to their rarity firms with higher accounting impact do not experience a greater decline
in termination rates Our inferences in Panel E are similar when we compared treated and control
firms following Bakke et al (2015) (untabulated)
Even after taking into account the different nature of decisions for dividend paying and non-
dividend-paying firms we fail to find evidence of a causal influence of option-based compensation
on dividend policy This finding is in contrast to the associations documented in earlier studies It
is even more remarkable as most firms replaced stock options with restricted stock which are
generally dividend-protected and should provide further incentive to increase dividends28
34 Option-Based Pay and Repurchases
In this section we examine the effect of an exogenous (accounting-induced) change in option
compensation on repurchases by estimating Equation (2)
Table 4 Panel A presents the results using the change in repurchases (scaled by total assets)
from Pre to Post as a dependent variable If the use of option-based pay had a positive effect on
firmsrsquo propensity to engage in repurchases as posited by the dividend-protection and dilution
hypotheses we should find a negative association between Accounting Impact or Treated and
repurchases Firms with a higher (accounting-driven) reduction in option-based pay should reduce
28 In a sample of SampP 500 firms between 2000 and 2009 Zhang (2013) reports that 80 of the firms granting
restricted stocks offer dividend protection In that sense the FAS123R-induced shift from stock options to restricted
stock may be characterized as a ldquoshockrdquo to dividend protection in unearned equity pay Accordingly our results cast
doubt on the causal interpretation of the positive association between dividend protection and dividend payouts
documented in prior studies (Zhang 2013 Burns et al 2015 Minnick and Rosenthal 2015)
30
the use of repurchases either because they are shifting toward a greater use of dividends andor
because they have a lower need to offset the dilutive effects of stock options However we find no
significant association between Accounting Impact (columns 1 and 2) and the change in
repurchases around the adoption of FAS123R When we use the Treated indicator (column 3) we
find a significant positive association rather than a negative one In Panel B we repeat the analysis
using net repurchases (ie repurchases after removing the effect of share issuances) following
Fama and French (2001) and Skinner (2008) Our inferences are unchanged29
This test is subject to two important caveats The first is we may not detect a decline in
repurchases because in the Post period firms need to offset the exercise of options that were
granted during the Pre period That is a post-FAS123R reduction in grants may not (yet) translate
into a reduction in exercises during the Post period which reduces our ability to test the dilution
hypothesis (ie that firms repurchase shares to offset exercises)30 However we can examine a
variation of this hypothesis where firms use repurchases to manage the effect of unexercised
options on diluted EPS (Bens et al 2003) To do so in Panel C we use a measure of adjusted
repurchases where we subtract our estimate of repurchases undertaken to offset the exercise of
ESO31 We effectively test whether firms experiencing an accounting-induced decrease in option
grants engage in less repurchases (net of exercise-driven repurchases) because their need to
manage the effect of unexercised options on diluted EPS is lower However the coefficient on
the variables of interest is either insignificant or positive inconsistent with the hypothesis
29 In the case of repurchases we do not examine separately ldquoinitiationsrdquo and ldquointensityrdquo as we do for dividends
because initiation is not clearly defined for repurchases Unlike dividends the occurrence of a repurchase in a given
year (or the lack thereof) cannot be used to infer a general policy due to the more discretionary nature of the timing of
repurchases 30 To capture the effect of lower option-based compensation on option exercises and thus on repurchases we would
ideally extend the Post period beyond 2007 However as noted by Floyd et al (2015) repurchases declined
dramatically after 2007 because of the financial crisis making it difficult to detect the effect of any other factor 31 As upper bound estimate of exercise-driven repurchases we multiply the number of ESO exercised during the year
times the average stock price during the year Since the number of ESO exercised is available in Compustat starting in
2004 Panel C is based on observations from 2004 to 2007
31
A second important caveat is that most firms replaced stock options with restricted stock
(Table 2 Panel C) Unvested restricted stock is excluded from the denominator in the computation
of basic EPS (once vested it is included) However it is included in the denominator of diluted
EPS using the treasury stock method similar to stock options Given the complexity of this
method without access to all details of restricted stock grants and option grants it is difficult to
determine whether the switch from stock options to restricted stock decreased the need for
dilution-driven repurchases as our test implicitly assumes Hence it is possible that we do not find
a decrease in repurchases because a reduced need to offset the dilutive effect of stock options was
neutralized by an increased need to offset the dilutive effect of restricted stock
Subject to the above caveats the evidence in Table 4 is not consistent with a positive causal
relation between the use of option-based pay and repurchases More precisely it suggests that
option-driven dilution concerns do not have a first-order effect on the magnitude of repurchases
even though they may play a role in the repurchase decision Hence our result is not necessarily
in conflict with the evidence in Brav et al (2005) where two-thirds of the surveyed financial
executives state that offsetting the dilutionary effect of stock option plans or other stock
programs is an important factor to their repurchase decisions
35 Option-Based Pay and Payout Composition
As an alternative to examining dividends and repurchases separately we also look at the
payout composition the change in the DividendsTotal Payout ratio from the Pre to the Post period
where Total Payout is the sum of dividends and repurchases As noted earlier we focus on the
subsample of firms with both dividends and repurchases in both Pre and Post periods so as to
capture the change in payout mix by firms routinely using both vehicles to return cash to
shareholders If the use of option-based pay causes firms to substitute repurchases for dividends
32
we should find a positive association between Accounting Impact or Treated and the payout mix
defined as DividendsTotal Payout ratio Firms with a higher accounting-driven reduction in
option-based pay should have an increase (decrease) in the relative weight of dividends
(repurchases) to the total payout However as reported in Table 5 Panel A we fail to find a
significant association between Accounting Impact (column 1 and 2) or Treated (column 3) and
the change in payout mix The results are similar when we use Net Payout (dividends plus net
repurchases) instead of Total Payout in computing the payout mix (Panel B)
Overall the combined evidence in Tables 3-5 does not support the hypothesis that option-
based compensation has negative (positive) effect on dividends (repurchases) or that it causes
firms to replace dividends with repurchases
4 Conclusion
Prior literature has documented robust associations between option-based compensation and
payout policy yet it remains unclear whether this association reflcts a causal influence We
investigate the causal effect of option-based compensation on payout policy using the adoption of
FAS123R which resulted in a significant decrease in option grants making it a plausible
exogenous shock to the use of option-based pay To overcome the challenge of no control group
we exploit the fact that firms responded differently depending on the firm-specific accounting
impact as measured by the implied option expense disclosed in the footnotes prior to FAS123R
Firms with larger expected accounting impact curtailed option-based compensation much more
aggressively than firms with lower impact Using a sample of SampP 1500 firms we find no
evidence that firms with a larger accounting-induced decline in option compensation increased
dividends reduced repurchases or changed their payout composition contrary to the widely held
belief that option-based pay has a causal influence on payout policy
33
Appendix Variable Definitions and Data Sources
Accounting Impact Variables
Accounting impact Implied option expense (Compustat XINTOPT) divided by total assets
(Compustat AT) This variable is measured at fiscal year 2002 and is time-invariant
Accounting impact rank The quartile rank of Accounting impact (1=lowest 4=highest)
Payout Variables
Regular dividendTotal assets The numerator is total regular cash dividends in the fiscal year
from the distribution dataset in CRSP Regular cash dividends are identified by the distribution
codes 1212 1222 1232 or 1242 The denominator is one-year lagged total assets (Compustat
AT)
DPS Dividend per share (Compustat DVPSX_F)
DPS pct change The percentage change of average DPS from Pre- to Post-FAS123R period
DPS pct change gtX indicator A dummy variable that equals one if DPC pct change is greater
than X and zero otherwise
RepurchaseTotal assets The numerator is the repurchase of common equity which equals total
repurchase (Compustat PRSTK) minus the change in preferred stock redemption value
(Compustat PSTKRV) The denominator is one-year lagged total assets (Compustat AT)
Net repurchaseTotal assets Net repurchase removes the effect of share issuances The
construction follows Fama and French (2001) and Skinner (2008) if the firm uses the treasury
stock method for repurchase net repurchase equals the increase in common treasury stock
(Compustat TSTKC) if the firm uses the retirement method (when common treasury stock is zero
in the current and prior year) net repurchase equals total repurchases minus stock issuance
(Compustat SSTK) and change in preferred stock redemption value (Compustat PSTKRV)
When the above measures give negative value net repurchase is set to zero
Adjusted repurchaseTotal assets Adjusted repurchase removes from total repurchase the potential
effect of repurchasing exercised options This variable equals total repurchase of common stocks
minus the product between the number of options exercised (Compustat OPTEXD) and average
stock price during the year When the above measure gives negative value adjusted repurchase is
set to zero Since the number of options exercised is not available before 2003 we drop
observations in 2003 when we use this variable
34
Total payoutTotal assets the sum of Regular dividendTotal assets and RepurchaseTotal assets
Regular dividendTotal payout regular cash dividend divided by the sum of regular cash dividend
and repurchase from common equity In the two-period analysis (Pre- vs Post-FAS123R) we
separately sum the numerator and the denominator for each firm-period and then calculate the ratio
Regular dividendNet payout regular dividend divided by the sum of regular dividend and net
repurchase In the two-period analysis (Pre- vs Post-FAS123R) we separately sum the numerator
and the denominator for each firm-period and then calculate the ratio
Compensation Variables
Salary_$ Average salary (Execucomp SALARY) of the top 5 highest paid executives in $1000
Salary_ Average salary (Execucomp SALARY) divided by average total pay (Execucomp
TDC1) of the top 5 highest paid executives
Bonus_$ Average bonus (Execucomp BONUS) of the top 5 highest paid executives in $1000
Due to a data format change we add non-equity plan-based awards (Execucomp
NON_EQ_TARG) to this measure after 2006
Bonus_ Bonus_$ divided by average total pay (Execucomp TDC1) of the top 5 highest paid
executives
Option grant_$ Average option grant value (Execucomp OPTION_AWARDS_BLK_VALUE or
OPTION_AWARDS_FV) of the top 5 highest paid executives in $1000 Due to a data format
change we use OPTION_AWARDS_FV for this measure after 2006
Option grant_ Option grant_$ divided by average total pay (Execucomp TDC1) of the top 5
highest paid executives
Restricted stock grant_$ Average restricted stock grant value (Execucomp RSTKGRNT or
STOCK_AWARDS_FV) of the top 5 highest paid executives in $1000 Due to data format
change we use STOCK_AWARDS_FV for this measure after 2006
Restricted stock grant_ Restricted stock grant_$ divided by average total pay (Execucomp
TDC1) of the top 5 highest paid executives
Total pay_$ Average total pay (Execucomp TDC1) of the top 5 highest paid executives in $1000
35
Other Characteristics
Size The book value of total assets (Compustat AT) minus the book value of common equity
(Compustat CEQ) plus the market value of common equity from CRSP in $M
Log(size) the natural logarithm of size
Book-to-market the book value of common equity dividend by its market value
Leverage long term debt plus short term debt (Compustat DLTT + DLC) divided by total assets
Asset tangibility tangible assets (Compustat AT - INTAN) divided by total assets
Free cash flow Operating cash flow (Compustat OANCF) minus capital expenditure (Compustat
CAPX) then divided by lagged total assets
Cash holding Cash and short-term investments (Compustat CHE) divided by total assets
ROA volatility the standard deviation of returns on assets (operating income before tax divided by
lagged total assets) in the past five fiscal years
Institutional ownership the number of shares held by institutional investors divided by the number
of shares outstanding from Thomson Reuters Institutional Holdings database
Sales growth the growth rate of sales (Compustat SALE) from the prior year
Past stock return annual stock return from the prior year
Loss indicator a dummy variable taking value of one if the current net income is negative and
zero otherwise
36
References
Aboody David 1996 Market Valuation of Employee Stock Options Journal of Accounting and
Economics 22 357-391
Aboody David Barth Mary E and Ron Kasznik 2004 Firms Voluntary Recognition of Stock-
Based Compensation Expense Journal of Accounting Research 42 123ndash150
Aboody David and Ron Kasznik 2008 Executive stock-based compensation and firmsrsquo cash
payout the role of shareholdersrsquo tax-related payout preferences Review of Accounting Studies
13 216ndash251
Anantharaman Divya and Yong Gyu Lee 2014 Managerial risk taking incentives and corporate
pension policy Journal of Financial Economics 111 328ndash351
Baker Malcolm and Jeffrey Wurgler 2004 A catering theory of dividends Journal of Finance
59 1125-1165
Baker Malcolm and Jeffrey Wurgler 2016 Dividends as reference points a behavioral signaling
approach Review of Financial Studies 29 697-738
Bakke Tor-Erik Hamed Mahmudi Chitru Fernando and Jesus Salas 2015 The causal effect of
option pay on corporate risk management Journal of Financial Economics forthcoming
Balsam Steven Austin Reitenga and Jennifer Yin 2008 Option acceleration in response to SFAS
No 123 (R) Accounting Horizons 22 23-45
Bens Daniel and Steven Monahan 2008 Altering Investment Decisions to Manage Financial
Reporting Outcomes Asset-Backed Commercial Paper Conduits and FIN 46 Journal of
Accounting Research 46 1017-1055
Bens Daniel A Venky Nagar Douglas J Skinner and MH Franco Wong 2003 Employee stock
options eps dilution and stock repurchases Journal of Accounting and Economics 36 51ndash90
Bertrand Marianne Esther Duflo and Sendhil Mullainathan 2004 How much should we trust
differences-in-differences estimates The Quarterly Journal of Economics 119 249ndash275
Blouin Jennifer L Jana S Raedy and Douglas A Shackelford 2011 Dividends Share
Repurchases and Tax Clienteles Evidence from the 2003 Reductions in Shareholder Taxes
The Accounting Review 86 887-914
Brav Alon John R Graham Campbell R Harvey and Roni Michaely 2005 Payout policy in the
21st century Journal of Financial Economics 77 483ndash527
Brown Lawrence D and Yen-Jung Lee 2011 Changes in Option-Based Compensation Around
the Issuance of SFAS123R Journal of Business Finance amp Accounting 38 1053ndash109
37
Brown Jeffrey R Nellie Liang and Scott Weisbenner 2007 Executive financial incentives and
payout policy Firm responses to the 2003 dividend tax cut Journal of Finance 62 1935ndash
1965
Burns Natasha Brian McTier and Kristina Minnick 2015 Equity-incentive compensation and
payout policy in Europe Journal of Corporate Finance 30 85-97
Carter Mary Ellen and Luann J Lynch 2003 The Consequences of the FASBrsquos 1998 Proposal on
Accounting for Stock Option Repricing Journal of Accounting and Economics 35 51-72
Carter Mary Ellen Luann J Lynch and Irem Tuna 2007 The role of accounting in the design of
CEO equity compensation The Accounting Review 82 327ndash357
Chava Sudheer and Amiyatosh Purnanandam 2010 CEOs versus CFOs Incentives and
corporate policies Journal of Financial Economics 97 263ndash278
Chetty Raj and Emmanuel Saez 2005 Dividend taxes and corporate behavior Evidence from the
2003 dividend tax cut The Quarterly Journal of Economics 120 791ndash833
Choudhary Preeti Shivaram Rajgopal and Mohan Venkatachalam 2009 Accelerated vesting of
employee stock options in anticipation of FAS123R Journal of Accounting Research 47 105ndash
146
Christensen Hans B and Valeri Nikolaev 2009 Contracting on Mandatory Changes to GAAP
New Practice and Its Determinants Working Paper University of Chicago
Chu Yongqiang and Tao Ma 2015 How does management compensation affect bank risk taking
evidence from FAS 123R University of South Carolina Working Paper
Cuny Charles J Gerald S Martin and John J Puthenpurackal 2009 Stock options and total
payout Journal of Financial and Quantitative Analysis 44 391ndash410
DeAngelo Harry Linda DeAngelo and Douglas J Skinner 2000 Special Dividends and the
Evolution of Dividend Signaling Journal of Financial Economics 57 309-354
Dechow Patricia M Amy P Hutton and Richard G Sloan 1996 Economic consequences of
accounting for stock-based compensation Journal of Accounting Research 34 1ndash20
Edgerton J 2013 Four facts about dividend payouts and the 2003 tax cut International Tax and
Public Finance 20 769-784
Edmans Alex and Xavier Gabaix 2015 Executive compensation a modern primer Journal of
Economic Literature forthcoming
38
Fama Eugene F and Kenneth R French 2001 Disappearing dividends changing firm
characteristics or lower propensity to pay Journal of Financial Economics 60 3ndash43
Farre-Mensa Joan Roni Michaely and Martin C Schmalz 2014 Payout policy Annual Review
of Financial Economics 6 75ndash134
Fenn George W and Nellie Liang 2001 Corporate payout policy and managerial stock
incentives Journal of Financial Economics 60 45ndash72
Ferri Fabrizio and Tatiana Sandino 2009 The impact of shareholder activism on financial
reporting and compensation the case of employee stock options expensing The Accounting
Review 84 433ndash466
Floyd Eric Nan Li and Douglas J Skinner 2015 Payout policy through the financial crisis the
growth of repurchases and the resilience of dividends Journal of Financial Economics 118
299-316
Frydman Carola and Dirk Jenter 2010 CEO compensation Annual Review of Financial
Economics 2 75-102
Gipper Brandon 2015 Assessing the Effects of Disclosing Management Compensation Working
Paper University of Chicago
Gormley Todd David Matsa and Todd Milbourn 2013 CEO compensation and corporate risk
evidence from a natural experiment Journal of Accounting and Economics 56 79-101
Graham John Michelle Hanlon and Terry Shevlin 2011 Real effects of accounting rules
evidence from multinational firmsrsquo investment locations and profit repatriation decisions
Journal of Accounting Research 49 137-185
Graham John Campbell Harvey and Shiva Rajgopal 2005 The Economic implications of
corporate financial reporting Journal of Accounting and Economics 40 3-73
Greenspan Alan 2002 Testimony of Alan Greenspan before the Committee on Banking
Housing and Urban Affairs US Senate July 16 Washington DC Government Printing
Office
Grullon Gustavo and Roni Michaely 2002 Dividends Share Repurchases and the Substitution
Hypothesis Journal of Finance 57 1649-1684
Hail Luzi Ahmed Tahoun and Clare Wang 2014 Dividend Payouts and Information Shocks
Journal of Accounting Research 52 403-456
Hall Brian J and Kevin J Murphy 2002 Stock options for undiversified executives Journal of
Accounting amp Economics 33 3-42
39
Hall Brian J and Kevin J Murphy 2003 The trouble with stock options Journal of Economic
Perspectives 17 49ndash70
Hanlon Michelle and Jeffrey L Hoopes 2014 What do firms do when dividend tax rates change
An examination of alternative payout responses Journal of Financial Economics 114 105-
124
Hayes Rachel M Michael Lemmon and Mingming Qiu 2012 Stock options and managerial
incentives for risk taking Evidence from FAS123R Journal of Financial Economics 105
174ndash190
Heron Randall A Erik Lie 2007 Does backdating explain the stock price pattern around
executive stock option grants Journal of Financial Economics 83 271-295
Hribar Paul Nicole Thorne Jenkins and W Bruce Johnson 2006 Stock repurchases as an
earnings management device Journal of Accounting and Economics 41 3ndash27
Jensen Michael C 1986 Agency cost of free cash flow corporate finance and takeovers
American Economic Review 76 323-329
Jolls Christine 1998 Stock repurchases and incentive compensation NBER Working Paper No
w6467
Jung Boochun Woo-Jong Lee and Yanhua Sunny Yang 2016 The Impact of Dividend
Covenants on Investment and Operating Performance Journal of Business Finance amp
Accounting 43 414ndash447
Kahle Kathleen M 2002 When a buyback isnrsquot a buyback open market repurchases and
employee options Journal of Financial Economics 63 235ndash261
Lambert Richard A William N Lanen and David F Larcker 1989 Executive stock option plans
and corporate dividend policy Journal of Financial and Quantitative Analysis 24 409ndash425
Lintner John 1956 Distribution of incomes of corporations among dividends retained earnings
and taxes The American Economic Review 46 97-113
Low Angie 2009 Managerial risk-taking behavior and equity-based compensation Journal of
Financial Economics 92 470-490
Miller Merton H and Franco Modigliani 1961 Dividend policy growth and the valuation of
shares The Journal of Business 34 411ndash433
Minnick Kristina and Leonard Rosenthal 2015 Stealth compensation Do CEOs increase their
pay by influencing dividend policy Journal of Corporate Finance 25 435-454
40
Murphy Kevin J 1999 Executive compensation In O Ashenfelter and D Card (eds) North
Holland Handbook of Labor Economics Amsterdam Elsevier Science BV
Murphy Kevin J 2013 Executive compensation Where we are and how we got there Handbook
of the Economics of Finance Elsevier Science North Holland 211-356
Nikolaev Valeri 2010 Debt Covenants and Accounting Conservatism Journal of Accounting
Research 48 143-176
Puri Manju Joumlrg Rocholl and Sascha Steffen 2011 Global retail lending in the aftermath of the
US financial crisis Distinguishing between supply and demand effects Journal of Financial
Economics 100 556-578
Shue Kelly and Richard R Townsend 2014 Swinging for the fences Executive reactions to
quasi-random option grants Working Paper University of Chicago
Skinner Douglas J 2008 The evolving relation between earnings dividends and stock
repurchases Journal of Financial Economics 87 582-609
Weisbenner Scott J 2000 Corporate share repurchases in the 1990s What role do stock options
play FEDS Working Paper No 2000-29
Zhang Dan 2013 CEO dividend protection Working Paper BI Norwegian Business School
41
Figure 1 Trends of dividends and repurchases from 2003 to 2007 Panel A plots the average
Regular DividendTotal Assets of firms in the highest and lowest quartiles of Accounting Impact
measured in 2002 Panel B shows the average Total RepurchaseTotal Assets of firms in the
highest and lowest quartiles of Accounting Impact measured in 2002
Panel A Trends of regular dividends
Panel B Trends of total repurchases
00
05
10
15
20
2003 2004 2005 2006 2007
Regular DividendTotal Assets
Lowest Acc Impact
Highest Acc Impact
Pre Post
00
20
40
60
80
100
2003 2004 2005 2006 2007
Total Repurchase Total Assets
Lowest Acc Impact
Highest Acc Impact
Pre Post
42
Table 1
Summary Statistics
Panel A Firm characteristics - full sample
N Mean Std dev 25 pctl Median 75 pctl
Accounting impact (2002) 1176 173 366 022 052 163
Payout variablesRegular dividendTotal assets 5653 093 148 000 000 142
RepurchaseTotal assets 5653 394 710 000 035 500
Total payoutTotal assets 5653 488 748 000 175 666
Regular dividendTotal payout 4091 3874 4057 000 2237 8833
Level of executive compensation (in $1000)
Salary_$ 5653 450 190 314 409 544
Bonus_$ 5653 476 616 122 295 586
Option grant_$ 5653 791 1137 62 384 1002
Restricted stock grant_$ 5653 458 866 0 58 518
Total pay_$ 5653 2481 2475 890 1647 3074
Percentage of executive compensation
Salary_ 5653 296 183 165 251 382
Bonus_ 5653 197 148 97 177 268
Option grant_ 5653 283 235 67 256 445
Restricted stock grant_ 5653 141 180 00 41 249
Control variables
Size ($M) 5653 11086 27294 1017 2459 8117
Log(size) 5653 7985 1565 6925 7808 9002
Book-to-market 5653 0445 0287 0251 0388 0578
Leverage 5653 0202 0172 0038 0187 0309
Asset tangibility 5653 0806 0184 0691 0853 0965
Free cash flow 5653 0059 0091 0013 0059 0108
Cash holding 5653 0166 0172 0034 0100 0247
ROA volatility 5653 0056 0056 0021 0038 0070
Institutional ownership 5653 0753 0202 0639 0795 0910
Sales growth 5653 0121 0189 0028 0096 0183
Past stock return 5653 0094 0183 -0012 0094 0199
Loss indicator 5653 0164 0370 0000 0000 0000
This table presents summary statistics Panel A shows the descriptive statistics of payout variables compensation
variables and other firm characteristics for the full sample Accounting impact is the implied option expense
measured at fiscal year 2002 All other variables are measured at firm-year level from fiscal year 2003 to 2007
resulting in 5653 firm-year observations (except for Regular dividendTotal Payout which can be measured only
for the 4901 firm-year observations with Total payout greater than zero) Panel B shows the pairwise correlations
between main variables at firm-year level Panel C compares payout variables compensation variables and other
firm characteristics before and after FAS123R The Pre-FAS123R period consists of fiscal year 2003 and 2004
the Post-FAS123R period covers fiscal year 2005-2007 Panel D compares the trends of payout and compensation
variables around FAS123R across four quartile groups ranked by 2002 accounting impact Panel E compares the
trends of payout and compensation variables around FAS123R between the treated and control group under the
alternative treatment definition in Bakke et al (2015) (see Section 22) All variables are defined in Appendix The
notation and in Panel C indicates statistically significant at 10 5 and 1 level in T-tests for equal
means respectively
43
Pa
nel
B
Pea
rso
n c
orr
ela
tio
ns
Reg div
Repurchase
Total payout
Salary_
Bonus_
Option_
RS_
Log(size)
BM
Leverage
Tangibility
FCF
Cash holdingROA vol
Inst own
Sales growth
Past ret
urn
Loss
Reg
div
10
0
Repurc
hase
01
610
0
Tota
l payout
03
509
810
0
Sala
ry_
-0
10
-01
8-0
19
10
0
Bonus_
00
700
100
3-0
01
10
0
Option_
-0
10
00
900
6-0
41
-03
510
0
RS
_
01
000
901
0-0
32
-01
1-0
40
10
0
Log(s
ize)
03
101
802
3-0
56
01
101
202
210
0
BM
-02
1-0
28
-03
103
0-0
03
-02
000
0-0
33
10
0
Levera
ge
-00
1-0
08
-00
8-0
05
00
6-0
11
00
801
9-0
03
10
0
Tangib
ility
00
200
100
101
200
1-0
05
-00
6-0
12
-00
4-0
18
10
0
FC
F02
203
703
9-0
20
00
901
1-0
01
02
4-0
32
-02
1-0
16
10
0
Cash
hold
ing
-01
301
000
700
2-0
14
02
2-0
10
-02
3-0
16
-03
502
901
210
0
RO
A v
ol
-01
5-0
04
-00
700
4-0
11
01
9-0
11
-02
3-0
08
-01
101
2-0
02
03
910
0
Inst
ow
n
-00
901
401
1-0
17
00
200
701
200
7-0
01
00
3-0
08
01
4-0
06
-01
110
0
Sale
s gro
wth
-00
8-0
04
-00
6-0
15
00
501
0-0
02
00
7-0
16
-00
3-0
08
01
300
201
400
410
0
Past
retu
rn00
901
301
4-0
18
01
5-0
01
00
301
6-0
29
-01
000
102
7-0
14
-01
001
602
710
0
Loss
-02
0-0
19
-02
201
8-0
18
00
4-0
05
-02
601
901
300
6-0
41
01
702
3-0
16
-01
8-0
40
10
0
44
Panel C Firm characteristics - before and after FAS123R
Pre FAS 123R Post FAS 123R Difference
Payout variables
Regular dividendTotal assets 083 099 016
RepurchaseTotal assets 245 490 245
Total payoutTotal assets 328 589 261
Regular dividendTotal payout 3914 2790 -1124
Level of executive compensation (in $1000)
Salary_$ 426 463 37
Bonus_$ 418 505 87
Option grant_$ 896 707 -191
Restricted stock grant_$ 269 574 305
Total pay_$ 2263 2584 321
Percentage of executive compensation
Salary_ 305 293 -12
Bonus_ 186 204 18
Option grant_ 343 240 -103
Restricted stock grant_ 87 176 89
Control variables
Size ($M) 9671 11631 1960
Log(size) 7860 8035 0175
Book-to-market 0437 0453 0016
Leverage 0201 0203 0002
Asset tangibility 0822 0793 -0029
Free cash flow 0061 0057 -0004
Cash holding 0175 0159 -0016
ROA volatility 0067 0048 -0019
Institutional ownership 0712 0781 0069
Sales growth 0137 0108 -0029
Past stock return 0080 0101 0021
Loss indicator 0173 0159 -0014
45
Pa
nel
D
Fir
m c
ha
racte
rist
ics
by q
ua
rtil
e o
f a
cco
un
tin
g i
mp
act
- b
efo
re a
nd
aft
er
FA
S1
23
R
Accounting im
pact
(2002)
Num
ber
of
Fir
ms
Pre
Post
Pre
Post
Pre
Post
Pre
Post
Payout
vari
able
s
Regula
r div
idendT
ota
l ass
ets
11
2
12
4
09
4
11
1
09
5
11
3
03
0
04
9
Repurc
hase
Tota
l ass
ets
11
3
26
8
19
2
37
3
32
7
63
1
35
1
68
7
Tota
l payout
Tota
l ass
ets
22
4
39
1
28
5
48
4
42
2
74
4
38
1
73
6
Regula
r div
idendT
ota
l payout
643
7
469
8
474
0
341
1
284
5
195
4
82
5
74
5
Perc
enta
ge o
f executive c
om
pensa
tion
Sala
ry_
337
295
313
287
296
289
276
300
Bonus_
223
226
214
228
172
192
134
169
Option g
rant_
201
167
290
210
373
260
507
325
Rest
ricte
d s
tock g
rant_
116
194
98
180
89
176
43
155
294
294
294
294
1st Q
uart
ile2
nd Q
uart
ile3
rd Q
uart
ile4
th Q
uart
ile
01
2
03
5
09
3
55
1
46
Accounting impact
Number of Firms
By accounting impact quartile
1
2
3
4
Pre Post Pre Post
Payout variables
Regular dividendTotal assets 09 11 08 10
RepurchaseTotal assets 18 31 26 52
Total payoutTotal assets 28 43 34 62
Regular dividendTotal payout 428 357 386 265
Percentage of executive compensation
Salary_ 435 364 282 280
Bonus_ 226 214 179 202
Option grant_ 92 125 387 261
Restricted stock grant_ 125 188 80 174
Percentage of CEO compensation
Salary_(CEO) 485 364 260 259
Bonus_(CEO) 249 228 185 219
Option grant_(CEO) 10 127 406 275
Restricted stock grant_(CEO) 128 182 82 183
Panel E Firm characteristics by alternative treatment definition - before and
after FAS123R
Treated
25
19
997
223
250
256
268
10
177
71
Control
44
37
47
Table 2
Differential effect of FAS123R on the use of option-based compensation
Panel A Two-period first-difference regression
Prediction Coeff t-stat Coeff t-stat Coeff t-stat
Accounting impact rank - -0044 -628
Accounting impact rank=2 - -0044 -327
Accounting impact rank=3 - -0075 -468
Accounting impact rank=4 - -0140 -613
Treated - -0132 -875
ΔLog(size) 0061 202 0061 200 0063 214
ΔBook-to-market 0032 091 0032 092 0051 143
ΔLeverage -0157 -213 -0160 -218 -0111 -153
ΔAsset tangibility -0012 -014 -0020 -023 -0023 -026
ΔFree cash flow -0106 -095 -0108 -097 -0128 -117
ΔCash holding -0197 -211 -0193 -206 -0180 -194
ΔFive-year ROA volatility -0065 -031 -0056 -026 -0098 -047
ΔInstitutional ownership -0044 -091 -0043 -088 -0044 -092
ΔSales growth -0064 -102 -0065 -104 -0090 -153
ΔPast one-year stock return 0051 078 0052 080 0091 138
ΔLoss frequency 0056 207 0057 207 0047 179
Log(size) -0009 -210 -0009 -207 -0002 -035
Book-to-market -0015 -056 -0013 -049 0018 072
Leverage 0022 046 0023 048 0068 150
Asset tangibility 0033 077 0033 078 0053 128
Free cash flow 0227 202 0220 195 0127 117
Cash holding -0002 -004 0012 019 -0078 -141
Five-year ROA volatility -0451 -240 -0430 -228 -0509 -283
Institutional ownership -0123 -360 -0122 -359 -0100 -292
Sales growth -0041 -056 -0040 -055 -0089 -125
Past one-year stock return -0009 -015 -0006 -010 0078 125
Loss frequency 0055 174 0056 178 0054 173
Fixed effect
Standard error
Adj R-squared
Observations
Model (3)
Dependent variable ΔAvg Option grantTotal pay
Huber-White
0156
This table investigates whether the effect of FAS123R on the use of option-based pay varies with its potential accounting impact Panel A
reports the results of estimating three two-period first-differencing models where for each firm we average its characteristics in Pre- and
Post-FAS123R period The Pre-FAS123R period consists of fiscal year 2003 and 2004 the Post-FAS123R period covers fiscal year 2005-
2007 In all three specifications the dependent variable is the change of average Option grantTotal pay from Pre- to Post-FAS123R period
The main independent variable varies by model in Model (1) the Accounting impact rank is the quartile rank of implied option expensetotal
assets measured in 2002 (1=lowest 4=highest) In Model (2) Accounting impact rank=2 (3 4) is an indicator that takes value of one if the
firmrsquos Accounting impact rank equals 2 (3 4) In Model (3) we use an alternative treatment construction following Bakke et al (2015)
where Treated is an indicator that takes value of zero if the firm granted zero option to its CEO in both 2003 and 2004 or the firm began to
voluntarily expense option-based pay at fair value in 2002 or earlier and one otherwise For each control variable we include both its level in
the Pre-FAS123R period and its change across the two periods Panel B shows the results of estimating fixed effect models with firm-year
observations The dependent variable is the firm-year level Option grantTotal pay The main independent variables are the interactions of
Post-FAS123R indicator (Post) with Accounting Impact rank Accounting impact rank indicators and Treated respectively All models in
Penal A have industry fixed effects and the standard errors are Huber-White heteroscedasticity-consistent standard errors All models in
Penal B have firm fixed effects and year fixed effects and the standard errors are clustered at firm level All variables are defined in
Appendix The notation and indicates statistically significant at 10 5 and 1 level respectively
Model (1) Model (2)
11711171 1171
Industry Industry
Huber-White
0124
Huber-White
0123
Industry
48
Panel B Panel fixed effects regression
Prediction Coeff t-stat Coeff t-stat Coeff t-stat
Acc impact rank x Post - -0044 -807
Acc impact rank 2 x Post - -0046 -333
Acc impact rank 3 x Post - -0077 -526
Acc impact rank 4 x Post - -0137 -776
Treated x Post - -0145 -970
Log(size) 0034 221 0034 217 0036 229
Book-to-market 0018 084 0017 083 0015 070
Leverage -0004 -009 -0006 -013 -0007 -015
Asset tangibility 0007 012 0004 006 0011 018
Free cash flow -0074 -151 -0072 -146 -0078 -158
Cash holding -0048 -086 -0050 -090 -0006 -011
Five-year ROA volatility 0250 231 0239 219 0437 414
Institutional ownership 0043 159 0044 161 0041 150
Sales growth -0033 -168 -0034 -171 -0031 -158
Past one-year stock return 0067 221 0068 224 0063 204
Loss indicator 0023 209 0022 207 0024 222
Fixed effects
Standard error
Adj R-squared
Observations
Dependent variable Option grantTotal pay
5653 5653 5653
Clustered by firm
Firm Year
Clustered by firm
Firm Year
Clustered by firm
0523 0523 0526
Model (1) Model (2) Model (3)
Firm Year
49
Table 3
Effect of option-based compensation on dividend policy
Panel A Two-period first-difference regression
Prediction Coeff t-stat Coeff t-stat Coeff t-stat
Accounting impact rank + 0000 077
Accounting impact rank=2 + 0001 091
Accounting impact rank=3 + 0000 044
Accounting impact rank=4 + 0001 092
Treated + 0000 -026
ΔLog(size) 0000 -030 0000 -030 0000 -026
ΔBook-to-market -0002 -190 -0002 -193 -0002 -195
ΔLeverage -0002 -059 -0002 -057 -0002 -059
ΔAsset tangibility 0016 431 0016 429 0016 430
ΔFree cash flow 0017 373 0017 373 0017 375
ΔCash holding -0011 -288 -0011 -285 -0010 -282
ΔFive-year ROA volatility 0003 034 0002 032 0003 035
ΔInstitutional ownership -0002 -073 -0002 -073 -0002 -070
ΔSales growth -0001 -040 -0001 -037 -0001 -038
ΔPast one-year stock return 0002 077 0002 076 0002 070
ΔLoss frequency 0000 -048 0000 -045 0000 -046
Log(size) 0000 183 0000 182 0000 182
Book-to-market -0002 -227 -0002 -225 -0002 -284
Leverage -0001 -037 -0001 -039 -0001 -048
Asset tangibility 0003 179 0003 180 0003 176
Free cash flow 0017 291 0017 291 0017 300
Cash holding 0002 080 0002 077 0002 098
Five-year ROA volatility 0003 035 0002 033 0003 044
Institutional ownership -0001 -068 -0001 -068 -0001 -058
Sales growth -0004 -177 -0004 -175 -0004 -172
Past one-year stock return 0004 169 0004 167 0004 165
Loss frequency -0001 -111 -0001 -109 -0001 -102
Fixed effect
Standard error
Adj R-squared
Observations
Dependent variable ΔAvg Regular dividendTotal assets
This table investigates the causal effect of option-based pay on dividend policy by examining whether changes in dividend policy around
FAS123R vary with its potential accounting impact Panel A reports the results of estimating three two-period first-differencing models
where for each firm we average its characteristics in Pre- and Post-FAS123R period In all three specifications the dependent variable is
the change of average Regular dividendTotal assets from Pre- to Post-FAS123R period The main independent variable varies by model in
Model (1) the Accounting impact rank is the quartile rank of implied option expensetotal assets measured in 2002 (1=lowest 4=highest) In
Model (2) Accounting impact rank=2 (3 4) is an indicator that takes value of one if the firmrsquos Accounting impact rank equals 2 (3 4) In
Model (3) we use an alternative treatment construction following Bakke et al (2015) where Treated is an indicator that takes value of zero
if the firm granted zero option to its CEO in both 2003 and 2004 or the firm began to voluntarily expense option-based pay at fair value in
2002 or earlier and one otherwise For each control variable we include both its level in the Pre-FAS123R period and its change across the
two periods Panel B shows the results of estimating fixed effect models with firm-year observations The dependent variable is the firm-
year level Regular dividendTotal assets The main independent variables are the interactions of Post-FAS123R indicator (Post) with
Accounting Impact rank Accounting impact rank indicators and Treated respectively Panel C examines the intensity of dividend changes
among firms with nonzero dividend per share in 2003 or 2004 In particular we estimates the same three models as in Panel A(with the
same independent variables) but for five dependent variables the change of average Regular dividendTotal assets from Pre- to Post-
FAS123R period (as in Panel A) the percentage change of DPS (dividend per share) from Pre- to Post-FAS123R period and three
indicators denoting respectively whether the percentage change of DPS was greater than 20 40 and 60 Panel D reports four
robustness tests of the dividend intensity regression In each of them a set of possible confounding observations is removed (see Section 33
for details) Panel E compares the trends of dividend initiation and termination around FAS123R across four quartile groups ranked by
accounting impact All models in Panel A C and D have industry fixed effects and the standard errors are Huber-White heteroscedasticity-
consistent standard errors All models in Penal B have firm fixed effects and year fixed effects and the standard errors are clustered at
firm level All variables are defined in Appendix The notation and indicates statistically significant at 10 5 and 1 level
Industry Industry Industry
Model (1) Model (2) Model (3)
1171 1171 1171
Huber-White Huber-White Huber-White
0105 0104 0105
50
Panel B Panel fixed effects regression
Prediction Coeff t-stat Coeff t-stat Coeff t-stat
Acc impact rank x Post + 0000 122
Acc impact rank 2 x Post + 0001 110
Acc impact rank 3 x Post + 0001 094
Acc impact rank 4 x Post + 0001 129
Treated x Post + 0000 -012
Log(size) 0001 179 0001 179 0001 181
Book-to-market 0000 025 0000 024 0000 031
Leverage 0001 062 0001 064 0001 069
Asset tangibility 0009 360 0009 358 0009 363
Free cash flow 0002 090 0002 093 0002 092
Cash holding -0007 -295 -0007 -298 -0007 -298
Five-year ROA volatility 0001 041 0001 038 0000 -006
Institutional ownership 0000 -027 0000 -026 0000 -027
Sales growth 0000 053 0000 051 0000 044
Past one-year stock return 0001 089 0001 088 0001 078
Loss indicator 0000 -060 0000 -057 0000 -076
Fixed effects
Standard error
Adj R-squared
Observations
Dependent variable Regular dividendTotal assets
Model (1) Model (2) Model (3)
Firm Year Firm Year Firm Year
5653 5653 5653
Clustered by firm Clustered by firm Clustered by firm
0877 0877 0877
51
Panel C Intensity of dividend changes around FAS123R
Prediction Coeff t-stat Coeff t-stat Coeff t-stat
Accounting impact rank + 0000 065
Accounting impact rank=2 + 0000 048
Accounting impact rank=3 + 0000 026
Accounting impact rank=4 + 0002 080
Treated + 0001 063
Dependent var DPS pct change
Accounting impact rank + -0145 -072
Accounting impact rank=2 + 0018 006
Accounting impact rank=3 + -0177 -045
Accounting impact rank=4 + -0746 -100
Treated + -0407 -119
Accounting impact rank + 0029 095
Accounting impact rank=2 + 0040 074
Accounting impact rank=3 + 0092 139
Accounting impact rank=4 + 0008 007
Treated + -0007 -012
Accounting impact rank + 0024 076
Accounting impact rank=2 + 0047 088
Accounting impact rank=3 + 0079 114
Accounting impact rank=4 + -0003 -002
Treated + 0030 052
Accounting impact rank + 0030 098
Accounting impact rank=2 + 0078 155
Accounting impact rank=3 + 0085 130
Accounting impact rank=4 + 0014 012
Treated + -0006 -011
Control variables
Fixed effect
Standard error
Observations 572 572 572
Yes Yes Yes
Huber-White Huber-White Huber-White
Industry Industry Industry
Dependent var DPS pct
change gt60 indicator
Model (1) Model (2) Model (3)
Dependent var ΔAvg Regular
dividendAssets
Dependent var DPS pct
change gt20 indicator
Dependent var DPS pct
change gt40 indicator
52
Panel D Robustness tests for intensity of dividend changes around FAS123R
Prediction Coeff t-stat Coeff t-stat Coeff t-stat
Accounting impact rank + 0006 017
Accounting impact rank=2 + 0067 118
Accounting impact rank=3 + 0041 057
Accounting impact rank=4 + -0061 -049
Treated + 0022 035Observations
Accounting impact rank + 0009 027
Accounting impact rank=2 + 0058 106
Accounting impact rank=3 + 0032 043
Accounting impact rank=4 + -0032 -024
Treated + 0018 028
Observations
Accounting impact rank + 0030 089
Accounting impact rank=2 + 0039 071
Accounting impact rank=3 + 0122 168
Accounting impact rank=4 + -0063 -052
Treated + 0075 132
Observations
Accounting impact rank + 0008 023
Accounting impact rank=2 + 0023 042
Accounting impact rank=3 + 0048 064
Accounting impact rank=4 + -0042 -033
Treated + -0010 -016
Observations
Control variables
Fixed effect
Standard error
Exclude firms with stable
payout ratio from 2003 to 2004
506 506 506
Dependent variable DPS pct change gt40 indicator
Model (1) Model (2) Model (3)
Exclude voluntary expensers
519 519
Exclude firms in the top decile
of option reduction (02-04)
Exclude firms that accelerated
option vesting
504 504 504
517 517 517
519
Huber-White Huber-White Huber-White
Yes Yes Yes
Industry Industry Industry
53
Panel E Dividend initiation and termination rates around FAS123R
Pre FAS 123R
1 280 75 7 6 13 173
2 284 135 18 9 27 200
3 286 181 11 14 25 138
4 282 260 9 10 19 73
Total 1132 651 45 39 84 129
Post FAS 123R
1 275 63 4 4 8 127
2 280 116 9 9 18 155
3 276 152 9 3 12 79
4 263 223 5 1 6 27
Total 1094 554 27 17 44 79
Pre FAS 123R
1 280 205 2 0 2 10
2 284 149 7 1 8 54
3 286 105 0 0 0 00
4 282 22 0 0 0 00
Total 1132 481 9 1 10 21
Post FAS 123R
1 275 212 3 6 9 42
2 280 164 1 2 3 18
3 276 124 1 1 2 16
4 263 40 0 3 3 75
Total 1094 540 5 12 17 31
termination
in 2004
03-04
cumulative
03-04
cumulative
Quartile firms
with
dividend in
2004
termination
in 2005
termination
in 2006
05-06
cumulative
05-06
cumulative
Termination
Quartile firms
with
dividend in
2002
termination
in 2003
without
dividend in
2004
initiation in
2003
initiation in
2004
03-04
cumulative
03-04
cumulative firmsQuartile
firmsQuartile initiation in
2005
initiation in
2006
05-06
cumulative
05-06
cumulative
Initiation
without
dividend in
2002
54
Table 4
Effect of option-based compensation on repurchases
Panel A Two-period first-difference regression with total repurchase
Prediction Coeff t-stat Coeff t-stat Coeff t-stat
Accounting impact rank - 0002 122
Accounting impact rank=2 - 0002 071
Accounting impact rank=3 - 0005 123
Accounting impact rank=4 - 0007 102
Treated - 0014 365
Control variables
Fixed effect
Standard error
Adj R-squared
Observations
Panel B Two-period first-difference regression with net repurchase
Prediction Coeff t-stat Coeff t-stat Coeff t-stat
Accounting impact rank - 0003 166
Accounting impact rank=2 - 0002 051
Accounting impact rank=3 - 0006 165
Accounting impact rank=4 - 0009 137
Treated - 0010 300
Control variables
Fixed effect
Standard error
Adj R-squared
Observations
Panel C Two-period first-difference regression with repurchase adjusted for exercised options
Prediction Coeff t-stat Coeff t-stat Coeff t-stat
Accounting impact rank - 0001 056
Accounting impact rank=2 - 0002 062
Accounting impact rank=3 - 0007 172
Accounting impact rank=4 - -0001 -008
Treated - 0006 197
Control variables
Fixed effect
Standard error
Adj R-squared
Observations
Dependent variable ΔAvg RepurchaseTotal assets
This table investigates the causal effect of option-based pay on payout policy by examining whether the changes of repurchase around
FAS123R vary with its potential accounting impact Panel A reports the results of estimating three two-period first-differencing models
where for each firm we average its characteristics in Pre- and Post-FAS123R period In all three specifications the dependent variable is
the change of average RepurchaseTotal assets from Pre- to Post-FAS123R period The main independent variable varies by model in
Model (1) the Accounting impact rank is the quartile rank of implied option expensetotal assets measured in 2002 (1=lowest 4=highest)
In Model (2) Accounting impact rank=2 (3 4) is an indicator that takes value of one if the firmrsquos Accounting impact rank equals 2 (3 4)
In Model (3) we use an alternative treatment construction following Bakke et al (2015) where Treated is an indicator that takes value of
zero if the firm granted zero option to its CEO in both 2003 and 2004 or the firm began to voluntarily expense option-based pay at fair
value in 2002 or earlier and one otherwise Panel B reports the regressions with the change of Net repurchaseTotal assets as the
dependent variable and the same independent variable as in Panel A Panel C reports the regressions with the change of Adjusted
repurchaseTotal assets as the dependent variable and the same independent variable as in Panel A All models in Panel A B and C have
industry fixed effects and the standard errors are Huber-White heteroscedasticity-consistent standard errors All variables are defined in
Appendix The notation and indicates statistically significant at 10 5 and 1 level respectively
Model (1) Model (2) Model (3)
Yes Yes Yes
Industry Industry Industry
Huber-White Huber-White Huber-White
Dependent variable ΔAvg Net repurchaseTotal assets
1171 1171 1171
0238 0237 0245
Model (1) Model (2) Model (3)
Yes Yes Yes
Industry Industry Industry
Huber-White Huber-White Huber-White
Dependent variable ΔAvg Adjusted repurchaseTotal assets
0229 0229 0233
1171 1171 1171
Model (1) Model (2) Model (3)
Yes Yes Yes
Industry Industry Industry
Huber-White Huber-White Huber-White
0111 0112 0114
1168 1168 1168
55
Table 5
Effect of option-based compensation on payout mix
Panel A Two-period first-difference regression with total payout mix
Prediction Coeff t-stat Coeff t-stat Coeff t-stat
Accounting impact rank + 0006 028
Accounting impact rank=2 + 0018 045
Accounting impact rank=3 + -0001 -001
Accounting impact rank=4 + 0043 052
Treated + -0035 -094
Control variables
Fixed effect
Standard error
Adj R-squared
Observations
Panel B Two-period first-difference regression with net payout mix
Prediction Coeff t-stat Coeff t-stat Coeff t-stat
Accounting impact rank + -0002 -008
Accounting impact rank=2 + 0008 016
Accounting impact rank=3 + 0018 034
Accounting impact rank=4 + -0059 -055
Treated + -0050 -101
Control variables
Fixed effect
Standard error
Adj R-squared
Observations
0049 0043 0054
257 257 257
Industry Industry Industry
Huber-White Huber-White Huber-White
Dependent variable ΔAvg Regular dividendNet payout
Model (1) Model (2) Model (3)
Yes Yes Yes
0154 0151 0156
362 362 362
Industry Industry Industry
Huber-White Huber-White Huber-White
This table investigates the causal effect of option-based pay on payout mix for firms using both dividend and repurchase by examining
whether the changes of payout mix around FAS123R vary with its potential accounting impact Panel A reports the results of estimating
three two-period first-differencing models where for each firm we average its characteristics in Pre- and Post-FAS123R period In all three
specifications the dependent variable is the change of average Regular dividendTotal payout from Pre- to Post-FAS123R period The main
independent variable varies by model in Model (1) the Accounting impact rank is the quartile rank of implied option expensetotal assets
measured in 2002 (1=lowest 4=highest) In Model (2) Accounting impact rank=2 (3 4) is an indicator that takes value of one if the firmrsquos
Accounting impact rank equals 2 (3 4) In Model (3) we use an alternative treatment construction following Bakke et al (2015) where
Treated is an indicator that takes value of zero if the firm granted zero option to its CEO in both 2003 and 2004 or the firm began to
voluntarily expense option-based pay at fair value in 2002 or earlier and one otherwise Panel B reports the regressions with the change of
Regular dividendNet payout as the dependent variable and the same independent variables as in Panel A Panel A (Panel B) is based on
observations with nonzero regular dividend and repurchase (net repurchase) in both Pre- and Post-FAS123R period All models in Panel A
and B have industry fixed effects and the standard errors are Huber-White heteroscedasticity-consistent standard errors All variables are
defined in Appendix The notation and indicates statistically significant at 10 5 and 1 level respectively
Yes Yes Yes
Dependent variable ΔAvg Regular dividendTotal payout
Model (1) Model (2) Model (3)

28
constrains to their payout policy as a result of FAS123R) (ii) we explicitly control for net
income and retained earnings in the regression (as in Skinner 2008) (iii) we repeat the tests
in Panel C for dividend payers with dividendsasset ratio above the sample median on the
basis that dividend covenants are less frequent among firms paying large dividends (Jung
Lee and Yang 2016) Our inferences are unchanged
332 Option-Based Pay and Dividend Payouts Dividend Initiations
In this section we examine whether the accounting-driven change in option pay affected
dividend initiations among non-payers We cannot employ the difference-in-difference approach
adopted so far by definition the same firm cannot initiate dividends in both periods However we
can provide suggestive evidence as follows First we take all firms that did not pay dividends in
2002 and group them into quartiles based on 2002 implied option expense For each quartile we
find the number of firms initiating dividends in 2003 and 2004 (the Pre period) Next we take all
firms that did not pay dividends in 2004 group them into quartiles based on 2002 implied option
expense and for each quartile find the number of firms initiating dividends in 2005 and 2006 (the
Post period) We do not include 2007 so as to have the same number of years in both periods and
make the cumulative initiation rates comparable
The left portion of Panel E reports the results of this exercise There is a general decrease in
the dividend initiation rate from the Pre to the Post period This holds both in the full sample of
non-payers (from 129 to 79) and across all quartiles This decrease may reflect a temporary
spike in 2003 and 2004 in response to the 2003 dividend tax cut documented in Chetty and Saez
(2005) It is noteworthy that initiation rates in both periods are lower among firms with higher
implied option expense This is consistent with option-heavy firms being mostly high-growth
firms less inclined to pay dividends More relevant to our research question if the lower use of
29
option compensation increased the propensity to pay dividends we would expect to see a relative
increase (ie a lower decrease) in dividend initiations among firms with the highest accounting
impact Instead the rate does not differ depending on the accounting impact There is
approximatley a 5 decline in initiation rate in each quartile In the right portion of Panel E we
examine similar data for dividend terminations While the results should be interpreted with
caution due to their rarity firms with higher accounting impact do not experience a greater decline
in termination rates Our inferences in Panel E are similar when we compared treated and control
firms following Bakke et al (2015) (untabulated)
Even after taking into account the different nature of decisions for dividend paying and non-
dividend-paying firms we fail to find evidence of a causal influence of option-based compensation
on dividend policy This finding is in contrast to the associations documented in earlier studies It
is even more remarkable as most firms replaced stock options with restricted stock which are
generally dividend-protected and should provide further incentive to increase dividends28
34 Option-Based Pay and Repurchases
In this section we examine the effect of an exogenous (accounting-induced) change in option
compensation on repurchases by estimating Equation (2)
Table 4 Panel A presents the results using the change in repurchases (scaled by total assets)
from Pre to Post as a dependent variable If the use of option-based pay had a positive effect on
firmsrsquo propensity to engage in repurchases as posited by the dividend-protection and dilution
hypotheses we should find a negative association between Accounting Impact or Treated and
repurchases Firms with a higher (accounting-driven) reduction in option-based pay should reduce
28 In a sample of SampP 500 firms between 2000 and 2009 Zhang (2013) reports that 80 of the firms granting
restricted stocks offer dividend protection In that sense the FAS123R-induced shift from stock options to restricted
stock may be characterized as a ldquoshockrdquo to dividend protection in unearned equity pay Accordingly our results cast
doubt on the causal interpretation of the positive association between dividend protection and dividend payouts
documented in prior studies (Zhang 2013 Burns et al 2015 Minnick and Rosenthal 2015)
30
the use of repurchases either because they are shifting toward a greater use of dividends andor
because they have a lower need to offset the dilutive effects of stock options However we find no
significant association between Accounting Impact (columns 1 and 2) and the change in
repurchases around the adoption of FAS123R When we use the Treated indicator (column 3) we
find a significant positive association rather than a negative one In Panel B we repeat the analysis
using net repurchases (ie repurchases after removing the effect of share issuances) following
Fama and French (2001) and Skinner (2008) Our inferences are unchanged29
This test is subject to two important caveats The first is we may not detect a decline in
repurchases because in the Post period firms need to offset the exercise of options that were
granted during the Pre period That is a post-FAS123R reduction in grants may not (yet) translate
into a reduction in exercises during the Post period which reduces our ability to test the dilution
hypothesis (ie that firms repurchase shares to offset exercises)30 However we can examine a
variation of this hypothesis where firms use repurchases to manage the effect of unexercised
options on diluted EPS (Bens et al 2003) To do so in Panel C we use a measure of adjusted
repurchases where we subtract our estimate of repurchases undertaken to offset the exercise of
ESO31 We effectively test whether firms experiencing an accounting-induced decrease in option
grants engage in less repurchases (net of exercise-driven repurchases) because their need to
manage the effect of unexercised options on diluted EPS is lower However the coefficient on
the variables of interest is either insignificant or positive inconsistent with the hypothesis
29 In the case of repurchases we do not examine separately ldquoinitiationsrdquo and ldquointensityrdquo as we do for dividends
because initiation is not clearly defined for repurchases Unlike dividends the occurrence of a repurchase in a given
year (or the lack thereof) cannot be used to infer a general policy due to the more discretionary nature of the timing of
repurchases 30 To capture the effect of lower option-based compensation on option exercises and thus on repurchases we would
ideally extend the Post period beyond 2007 However as noted by Floyd et al (2015) repurchases declined
dramatically after 2007 because of the financial crisis making it difficult to detect the effect of any other factor 31 As upper bound estimate of exercise-driven repurchases we multiply the number of ESO exercised during the year
times the average stock price during the year Since the number of ESO exercised is available in Compustat starting in
2004 Panel C is based on observations from 2004 to 2007
31
A second important caveat is that most firms replaced stock options with restricted stock
(Table 2 Panel C) Unvested restricted stock is excluded from the denominator in the computation
of basic EPS (once vested it is included) However it is included in the denominator of diluted
EPS using the treasury stock method similar to stock options Given the complexity of this
method without access to all details of restricted stock grants and option grants it is difficult to
determine whether the switch from stock options to restricted stock decreased the need for
dilution-driven repurchases as our test implicitly assumes Hence it is possible that we do not find
a decrease in repurchases because a reduced need to offset the dilutive effect of stock options was
neutralized by an increased need to offset the dilutive effect of restricted stock
Subject to the above caveats the evidence in Table 4 is not consistent with a positive causal
relation between the use of option-based pay and repurchases More precisely it suggests that
option-driven dilution concerns do not have a first-order effect on the magnitude of repurchases
even though they may play a role in the repurchase decision Hence our result is not necessarily
in conflict with the evidence in Brav et al (2005) where two-thirds of the surveyed financial
executives state that offsetting the dilutionary effect of stock option plans or other stock
programs is an important factor to their repurchase decisions
35 Option-Based Pay and Payout Composition
As an alternative to examining dividends and repurchases separately we also look at the
payout composition the change in the DividendsTotal Payout ratio from the Pre to the Post period
where Total Payout is the sum of dividends and repurchases As noted earlier we focus on the
subsample of firms with both dividends and repurchases in both Pre and Post periods so as to
capture the change in payout mix by firms routinely using both vehicles to return cash to
shareholders If the use of option-based pay causes firms to substitute repurchases for dividends
32
we should find a positive association between Accounting Impact or Treated and the payout mix
defined as DividendsTotal Payout ratio Firms with a higher accounting-driven reduction in
option-based pay should have an increase (decrease) in the relative weight of dividends
(repurchases) to the total payout However as reported in Table 5 Panel A we fail to find a
significant association between Accounting Impact (column 1 and 2) or Treated (column 3) and
the change in payout mix The results are similar when we use Net Payout (dividends plus net
repurchases) instead of Total Payout in computing the payout mix (Panel B)
Overall the combined evidence in Tables 3-5 does not support the hypothesis that option-
based compensation has negative (positive) effect on dividends (repurchases) or that it causes
firms to replace dividends with repurchases
4 Conclusion
Prior literature has documented robust associations between option-based compensation and
payout policy yet it remains unclear whether this association reflcts a causal influence We
investigate the causal effect of option-based compensation on payout policy using the adoption of
FAS123R which resulted in a significant decrease in option grants making it a plausible
exogenous shock to the use of option-based pay To overcome the challenge of no control group
we exploit the fact that firms responded differently depending on the firm-specific accounting
impact as measured by the implied option expense disclosed in the footnotes prior to FAS123R
Firms with larger expected accounting impact curtailed option-based compensation much more
aggressively than firms with lower impact Using a sample of SampP 1500 firms we find no
evidence that firms with a larger accounting-induced decline in option compensation increased
dividends reduced repurchases or changed their payout composition contrary to the widely held
belief that option-based pay has a causal influence on payout policy
33
Appendix Variable Definitions and Data Sources
Accounting Impact Variables
Accounting impact Implied option expense (Compustat XINTOPT) divided by total assets
(Compustat AT) This variable is measured at fiscal year 2002 and is time-invariant
Accounting impact rank The quartile rank of Accounting impact (1=lowest 4=highest)
Payout Variables
Regular dividendTotal assets The numerator is total regular cash dividends in the fiscal year
from the distribution dataset in CRSP Regular cash dividends are identified by the distribution
codes 1212 1222 1232 or 1242 The denominator is one-year lagged total assets (Compustat
AT)
DPS Dividend per share (Compustat DVPSX_F)
DPS pct change The percentage change of average DPS from Pre- to Post-FAS123R period
DPS pct change gtX indicator A dummy variable that equals one if DPC pct change is greater
than X and zero otherwise
RepurchaseTotal assets The numerator is the repurchase of common equity which equals total
repurchase (Compustat PRSTK) minus the change in preferred stock redemption value
(Compustat PSTKRV) The denominator is one-year lagged total assets (Compustat AT)
Net repurchaseTotal assets Net repurchase removes the effect of share issuances The
construction follows Fama and French (2001) and Skinner (2008) if the firm uses the treasury
stock method for repurchase net repurchase equals the increase in common treasury stock
(Compustat TSTKC) if the firm uses the retirement method (when common treasury stock is zero
in the current and prior year) net repurchase equals total repurchases minus stock issuance
(Compustat SSTK) and change in preferred stock redemption value (Compustat PSTKRV)
When the above measures give negative value net repurchase is set to zero
Adjusted repurchaseTotal assets Adjusted repurchase removes from total repurchase the potential
effect of repurchasing exercised options This variable equals total repurchase of common stocks
minus the product between the number of options exercised (Compustat OPTEXD) and average
stock price during the year When the above measure gives negative value adjusted repurchase is
set to zero Since the number of options exercised is not available before 2003 we drop
observations in 2003 when we use this variable
34
Total payoutTotal assets the sum of Regular dividendTotal assets and RepurchaseTotal assets
Regular dividendTotal payout regular cash dividend divided by the sum of regular cash dividend
and repurchase from common equity In the two-period analysis (Pre- vs Post-FAS123R) we
separately sum the numerator and the denominator for each firm-period and then calculate the ratio
Regular dividendNet payout regular dividend divided by the sum of regular dividend and net
repurchase In the two-period analysis (Pre- vs Post-FAS123R) we separately sum the numerator
and the denominator for each firm-period and then calculate the ratio
Compensation Variables
Salary_$ Average salary (Execucomp SALARY) of the top 5 highest paid executives in $1000
Salary_ Average salary (Execucomp SALARY) divided by average total pay (Execucomp
TDC1) of the top 5 highest paid executives
Bonus_$ Average bonus (Execucomp BONUS) of the top 5 highest paid executives in $1000
Due to a data format change we add non-equity plan-based awards (Execucomp
NON_EQ_TARG) to this measure after 2006
Bonus_ Bonus_$ divided by average total pay (Execucomp TDC1) of the top 5 highest paid
executives
Option grant_$ Average option grant value (Execucomp OPTION_AWARDS_BLK_VALUE or
OPTION_AWARDS_FV) of the top 5 highest paid executives in $1000 Due to a data format
change we use OPTION_AWARDS_FV for this measure after 2006
Option grant_ Option grant_$ divided by average total pay (Execucomp TDC1) of the top 5
highest paid executives
Restricted stock grant_$ Average restricted stock grant value (Execucomp RSTKGRNT or
STOCK_AWARDS_FV) of the top 5 highest paid executives in $1000 Due to data format
change we use STOCK_AWARDS_FV for this measure after 2006
Restricted stock grant_ Restricted stock grant_$ divided by average total pay (Execucomp
TDC1) of the top 5 highest paid executives
Total pay_$ Average total pay (Execucomp TDC1) of the top 5 highest paid executives in $1000
35
Other Characteristics
Size The book value of total assets (Compustat AT) minus the book value of common equity
(Compustat CEQ) plus the market value of common equity from CRSP in $M
Log(size) the natural logarithm of size
Book-to-market the book value of common equity dividend by its market value
Leverage long term debt plus short term debt (Compustat DLTT + DLC) divided by total assets
Asset tangibility tangible assets (Compustat AT - INTAN) divided by total assets
Free cash flow Operating cash flow (Compustat OANCF) minus capital expenditure (Compustat
CAPX) then divided by lagged total assets
Cash holding Cash and short-term investments (Compustat CHE) divided by total assets
ROA volatility the standard deviation of returns on assets (operating income before tax divided by
lagged total assets) in the past five fiscal years
Institutional ownership the number of shares held by institutional investors divided by the number
of shares outstanding from Thomson Reuters Institutional Holdings database
Sales growth the growth rate of sales (Compustat SALE) from the prior year
Past stock return annual stock return from the prior year
Loss indicator a dummy variable taking value of one if the current net income is negative and
zero otherwise
36
References
Aboody David 1996 Market Valuation of Employee Stock Options Journal of Accounting and
Economics 22 357-391
Aboody David Barth Mary E and Ron Kasznik 2004 Firms Voluntary Recognition of Stock-
Based Compensation Expense Journal of Accounting Research 42 123ndash150
Aboody David and Ron Kasznik 2008 Executive stock-based compensation and firmsrsquo cash
payout the role of shareholdersrsquo tax-related payout preferences Review of Accounting Studies
13 216ndash251
Anantharaman Divya and Yong Gyu Lee 2014 Managerial risk taking incentives and corporate
pension policy Journal of Financial Economics 111 328ndash351
Baker Malcolm and Jeffrey Wurgler 2004 A catering theory of dividends Journal of Finance
59 1125-1165
Baker Malcolm and Jeffrey Wurgler 2016 Dividends as reference points a behavioral signaling
approach Review of Financial Studies 29 697-738
Bakke Tor-Erik Hamed Mahmudi Chitru Fernando and Jesus Salas 2015 The causal effect of
option pay on corporate risk management Journal of Financial Economics forthcoming
Balsam Steven Austin Reitenga and Jennifer Yin 2008 Option acceleration in response to SFAS
No 123 (R) Accounting Horizons 22 23-45
Bens Daniel and Steven Monahan 2008 Altering Investment Decisions to Manage Financial
Reporting Outcomes Asset-Backed Commercial Paper Conduits and FIN 46 Journal of
Accounting Research 46 1017-1055
Bens Daniel A Venky Nagar Douglas J Skinner and MH Franco Wong 2003 Employee stock
options eps dilution and stock repurchases Journal of Accounting and Economics 36 51ndash90
Bertrand Marianne Esther Duflo and Sendhil Mullainathan 2004 How much should we trust
differences-in-differences estimates The Quarterly Journal of Economics 119 249ndash275
Blouin Jennifer L Jana S Raedy and Douglas A Shackelford 2011 Dividends Share
Repurchases and Tax Clienteles Evidence from the 2003 Reductions in Shareholder Taxes
The Accounting Review 86 887-914
Brav Alon John R Graham Campbell R Harvey and Roni Michaely 2005 Payout policy in the
21st century Journal of Financial Economics 77 483ndash527
Brown Lawrence D and Yen-Jung Lee 2011 Changes in Option-Based Compensation Around
the Issuance of SFAS123R Journal of Business Finance amp Accounting 38 1053ndash109
37
Brown Jeffrey R Nellie Liang and Scott Weisbenner 2007 Executive financial incentives and
payout policy Firm responses to the 2003 dividend tax cut Journal of Finance 62 1935ndash
1965
Burns Natasha Brian McTier and Kristina Minnick 2015 Equity-incentive compensation and
payout policy in Europe Journal of Corporate Finance 30 85-97
Carter Mary Ellen and Luann J Lynch 2003 The Consequences of the FASBrsquos 1998 Proposal on
Accounting for Stock Option Repricing Journal of Accounting and Economics 35 51-72
Carter Mary Ellen Luann J Lynch and Irem Tuna 2007 The role of accounting in the design of
CEO equity compensation The Accounting Review 82 327ndash357
Chava Sudheer and Amiyatosh Purnanandam 2010 CEOs versus CFOs Incentives and
corporate policies Journal of Financial Economics 97 263ndash278
Chetty Raj and Emmanuel Saez 2005 Dividend taxes and corporate behavior Evidence from the
2003 dividend tax cut The Quarterly Journal of Economics 120 791ndash833
Choudhary Preeti Shivaram Rajgopal and Mohan Venkatachalam 2009 Accelerated vesting of
employee stock options in anticipation of FAS123R Journal of Accounting Research 47 105ndash
146
Christensen Hans B and Valeri Nikolaev 2009 Contracting on Mandatory Changes to GAAP
New Practice and Its Determinants Working Paper University of Chicago
Chu Yongqiang and Tao Ma 2015 How does management compensation affect bank risk taking
evidence from FAS 123R University of South Carolina Working Paper
Cuny Charles J Gerald S Martin and John J Puthenpurackal 2009 Stock options and total
payout Journal of Financial and Quantitative Analysis 44 391ndash410
DeAngelo Harry Linda DeAngelo and Douglas J Skinner 2000 Special Dividends and the
Evolution of Dividend Signaling Journal of Financial Economics 57 309-354
Dechow Patricia M Amy P Hutton and Richard G Sloan 1996 Economic consequences of
accounting for stock-based compensation Journal of Accounting Research 34 1ndash20
Edgerton J 2013 Four facts about dividend payouts and the 2003 tax cut International Tax and
Public Finance 20 769-784
Edmans Alex and Xavier Gabaix 2015 Executive compensation a modern primer Journal of
Economic Literature forthcoming
38
Fama Eugene F and Kenneth R French 2001 Disappearing dividends changing firm
characteristics or lower propensity to pay Journal of Financial Economics 60 3ndash43
Farre-Mensa Joan Roni Michaely and Martin C Schmalz 2014 Payout policy Annual Review
of Financial Economics 6 75ndash134
Fenn George W and Nellie Liang 2001 Corporate payout policy and managerial stock
incentives Journal of Financial Economics 60 45ndash72
Ferri Fabrizio and Tatiana Sandino 2009 The impact of shareholder activism on financial
reporting and compensation the case of employee stock options expensing The Accounting
Review 84 433ndash466
Floyd Eric Nan Li and Douglas J Skinner 2015 Payout policy through the financial crisis the
growth of repurchases and the resilience of dividends Journal of Financial Economics 118
299-316
Frydman Carola and Dirk Jenter 2010 CEO compensation Annual Review of Financial
Economics 2 75-102
Gipper Brandon 2015 Assessing the Effects of Disclosing Management Compensation Working
Paper University of Chicago
Gormley Todd David Matsa and Todd Milbourn 2013 CEO compensation and corporate risk
evidence from a natural experiment Journal of Accounting and Economics 56 79-101
Graham John Michelle Hanlon and Terry Shevlin 2011 Real effects of accounting rules
evidence from multinational firmsrsquo investment locations and profit repatriation decisions
Journal of Accounting Research 49 137-185
Graham John Campbell Harvey and Shiva Rajgopal 2005 The Economic implications of
corporate financial reporting Journal of Accounting and Economics 40 3-73
Greenspan Alan 2002 Testimony of Alan Greenspan before the Committee on Banking
Housing and Urban Affairs US Senate July 16 Washington DC Government Printing
Office
Grullon Gustavo and Roni Michaely 2002 Dividends Share Repurchases and the Substitution
Hypothesis Journal of Finance 57 1649-1684
Hail Luzi Ahmed Tahoun and Clare Wang 2014 Dividend Payouts and Information Shocks
Journal of Accounting Research 52 403-456
Hall Brian J and Kevin J Murphy 2002 Stock options for undiversified executives Journal of
Accounting amp Economics 33 3-42
39
Hall Brian J and Kevin J Murphy 2003 The trouble with stock options Journal of Economic
Perspectives 17 49ndash70
Hanlon Michelle and Jeffrey L Hoopes 2014 What do firms do when dividend tax rates change
An examination of alternative payout responses Journal of Financial Economics 114 105-
124
Hayes Rachel M Michael Lemmon and Mingming Qiu 2012 Stock options and managerial
incentives for risk taking Evidence from FAS123R Journal of Financial Economics 105
174ndash190
Heron Randall A Erik Lie 2007 Does backdating explain the stock price pattern around
executive stock option grants Journal of Financial Economics 83 271-295
Hribar Paul Nicole Thorne Jenkins and W Bruce Johnson 2006 Stock repurchases as an
earnings management device Journal of Accounting and Economics 41 3ndash27
Jensen Michael C 1986 Agency cost of free cash flow corporate finance and takeovers
American Economic Review 76 323-329
Jolls Christine 1998 Stock repurchases and incentive compensation NBER Working Paper No
w6467
Jung Boochun Woo-Jong Lee and Yanhua Sunny Yang 2016 The Impact of Dividend
Covenants on Investment and Operating Performance Journal of Business Finance amp
Accounting 43 414ndash447
Kahle Kathleen M 2002 When a buyback isnrsquot a buyback open market repurchases and
employee options Journal of Financial Economics 63 235ndash261
Lambert Richard A William N Lanen and David F Larcker 1989 Executive stock option plans
and corporate dividend policy Journal of Financial and Quantitative Analysis 24 409ndash425
Lintner John 1956 Distribution of incomes of corporations among dividends retained earnings
and taxes The American Economic Review 46 97-113
Low Angie 2009 Managerial risk-taking behavior and equity-based compensation Journal of
Financial Economics 92 470-490
Miller Merton H and Franco Modigliani 1961 Dividend policy growth and the valuation of
shares The Journal of Business 34 411ndash433
Minnick Kristina and Leonard Rosenthal 2015 Stealth compensation Do CEOs increase their
pay by influencing dividend policy Journal of Corporate Finance 25 435-454
40
Murphy Kevin J 1999 Executive compensation In O Ashenfelter and D Card (eds) North
Holland Handbook of Labor Economics Amsterdam Elsevier Science BV
Murphy Kevin J 2013 Executive compensation Where we are and how we got there Handbook
of the Economics of Finance Elsevier Science North Holland 211-356
Nikolaev Valeri 2010 Debt Covenants and Accounting Conservatism Journal of Accounting
Research 48 143-176
Puri Manju Joumlrg Rocholl and Sascha Steffen 2011 Global retail lending in the aftermath of the
US financial crisis Distinguishing between supply and demand effects Journal of Financial
Economics 100 556-578
Shue Kelly and Richard R Townsend 2014 Swinging for the fences Executive reactions to
quasi-random option grants Working Paper University of Chicago
Skinner Douglas J 2008 The evolving relation between earnings dividends and stock
repurchases Journal of Financial Economics 87 582-609
Weisbenner Scott J 2000 Corporate share repurchases in the 1990s What role do stock options
play FEDS Working Paper No 2000-29
Zhang Dan 2013 CEO dividend protection Working Paper BI Norwegian Business School
41
Figure 1 Trends of dividends and repurchases from 2003 to 2007 Panel A plots the average
Regular DividendTotal Assets of firms in the highest and lowest quartiles of Accounting Impact
measured in 2002 Panel B shows the average Total RepurchaseTotal Assets of firms in the
highest and lowest quartiles of Accounting Impact measured in 2002
Panel A Trends of regular dividends
Panel B Trends of total repurchases
00
05
10
15
20
2003 2004 2005 2006 2007
Regular DividendTotal Assets
Lowest Acc Impact
Highest Acc Impact
Pre Post
00
20
40
60
80
100
2003 2004 2005 2006 2007
Total Repurchase Total Assets
Lowest Acc Impact
Highest Acc Impact
Pre Post
42
Table 1
Summary Statistics
Panel A Firm characteristics - full sample
N Mean Std dev 25 pctl Median 75 pctl
Accounting impact (2002) 1176 173 366 022 052 163
Payout variablesRegular dividendTotal assets 5653 093 148 000 000 142
RepurchaseTotal assets 5653 394 710 000 035 500
Total payoutTotal assets 5653 488 748 000 175 666
Regular dividendTotal payout 4091 3874 4057 000 2237 8833
Level of executive compensation (in $1000)
Salary_$ 5653 450 190 314 409 544
Bonus_$ 5653 476 616 122 295 586
Option grant_$ 5653 791 1137 62 384 1002
Restricted stock grant_$ 5653 458 866 0 58 518
Total pay_$ 5653 2481 2475 890 1647 3074
Percentage of executive compensation
Salary_ 5653 296 183 165 251 382
Bonus_ 5653 197 148 97 177 268
Option grant_ 5653 283 235 67 256 445
Restricted stock grant_ 5653 141 180 00 41 249
Control variables
Size ($M) 5653 11086 27294 1017 2459 8117
Log(size) 5653 7985 1565 6925 7808 9002
Book-to-market 5653 0445 0287 0251 0388 0578
Leverage 5653 0202 0172 0038 0187 0309
Asset tangibility 5653 0806 0184 0691 0853 0965
Free cash flow 5653 0059 0091 0013 0059 0108
Cash holding 5653 0166 0172 0034 0100 0247
ROA volatility 5653 0056 0056 0021 0038 0070
Institutional ownership 5653 0753 0202 0639 0795 0910
Sales growth 5653 0121 0189 0028 0096 0183
Past stock return 5653 0094 0183 -0012 0094 0199
Loss indicator 5653 0164 0370 0000 0000 0000
This table presents summary statistics Panel A shows the descriptive statistics of payout variables compensation
variables and other firm characteristics for the full sample Accounting impact is the implied option expense
measured at fiscal year 2002 All other variables are measured at firm-year level from fiscal year 2003 to 2007
resulting in 5653 firm-year observations (except for Regular dividendTotal Payout which can be measured only
for the 4901 firm-year observations with Total payout greater than zero) Panel B shows the pairwise correlations
between main variables at firm-year level Panel C compares payout variables compensation variables and other
firm characteristics before and after FAS123R The Pre-FAS123R period consists of fiscal year 2003 and 2004
the Post-FAS123R period covers fiscal year 2005-2007 Panel D compares the trends of payout and compensation
variables around FAS123R across four quartile groups ranked by 2002 accounting impact Panel E compares the
trends of payout and compensation variables around FAS123R between the treated and control group under the
alternative treatment definition in Bakke et al (2015) (see Section 22) All variables are defined in Appendix The
notation and in Panel C indicates statistically significant at 10 5 and 1 level in T-tests for equal
means respectively
43
Pa
nel
B
Pea
rso
n c
orr
ela
tio
ns
Reg div
Repurchase
Total payout
Salary_
Bonus_
Option_
RS_
Log(size)
BM
Leverage
Tangibility
FCF
Cash holdingROA vol
Inst own
Sales growth
Past ret
urn
Loss
Reg
div
10
0
Repurc
hase
01
610
0
Tota
l payout
03
509
810
0
Sala
ry_
-0
10
-01
8-0
19
10
0
Bonus_
00
700
100
3-0
01
10
0
Option_
-0
10
00
900
6-0
41
-03
510
0
RS
_
01
000
901
0-0
32
-01
1-0
40
10
0
Log(s
ize)
03
101
802
3-0
56
01
101
202
210
0
BM
-02
1-0
28
-03
103
0-0
03
-02
000
0-0
33
10
0
Levera
ge
-00
1-0
08
-00
8-0
05
00
6-0
11
00
801
9-0
03
10
0
Tangib
ility
00
200
100
101
200
1-0
05
-00
6-0
12
-00
4-0
18
10
0
FC
F02
203
703
9-0
20
00
901
1-0
01
02
4-0
32
-02
1-0
16
10
0
Cash
hold
ing
-01
301
000
700
2-0
14
02
2-0
10
-02
3-0
16
-03
502
901
210
0
RO
A v
ol
-01
5-0
04
-00
700
4-0
11
01
9-0
11
-02
3-0
08
-01
101
2-0
02
03
910
0
Inst
ow
n
-00
901
401
1-0
17
00
200
701
200
7-0
01
00
3-0
08
01
4-0
06
-01
110
0
Sale
s gro
wth
-00
8-0
04
-00
6-0
15
00
501
0-0
02
00
7-0
16
-00
3-0
08
01
300
201
400
410
0
Past
retu
rn00
901
301
4-0
18
01
5-0
01
00
301
6-0
29
-01
000
102
7-0
14
-01
001
602
710
0
Loss
-02
0-0
19
-02
201
8-0
18
00
4-0
05
-02
601
901
300
6-0
41
01
702
3-0
16
-01
8-0
40
10
0
44
Panel C Firm characteristics - before and after FAS123R
Pre FAS 123R Post FAS 123R Difference
Payout variables
Regular dividendTotal assets 083 099 016
RepurchaseTotal assets 245 490 245
Total payoutTotal assets 328 589 261
Regular dividendTotal payout 3914 2790 -1124
Level of executive compensation (in $1000)
Salary_$ 426 463 37
Bonus_$ 418 505 87
Option grant_$ 896 707 -191
Restricted stock grant_$ 269 574 305
Total pay_$ 2263 2584 321
Percentage of executive compensation
Salary_ 305 293 -12
Bonus_ 186 204 18
Option grant_ 343 240 -103
Restricted stock grant_ 87 176 89
Control variables
Size ($M) 9671 11631 1960
Log(size) 7860 8035 0175
Book-to-market 0437 0453 0016
Leverage 0201 0203 0002
Asset tangibility 0822 0793 -0029
Free cash flow 0061 0057 -0004
Cash holding 0175 0159 -0016
ROA volatility 0067 0048 -0019
Institutional ownership 0712 0781 0069
Sales growth 0137 0108 -0029
Past stock return 0080 0101 0021
Loss indicator 0173 0159 -0014
45
Pa
nel
D
Fir
m c
ha
racte
rist
ics
by q
ua
rtil
e o
f a
cco
un
tin
g i
mp
act
- b
efo
re a
nd
aft
er
FA
S1
23
R
Accounting im
pact
(2002)
Num
ber
of
Fir
ms
Pre
Post
Pre
Post
Pre
Post
Pre
Post
Payout
vari
able
s
Regula
r div
idendT
ota
l ass
ets
11
2
12
4
09
4
11
1
09
5
11
3
03
0
04
9
Repurc
hase
Tota
l ass
ets
11
3
26
8
19
2
37
3
32
7
63
1
35
1
68
7
Tota
l payout
Tota
l ass
ets
22
4
39
1
28
5
48
4
42
2
74
4
38
1
73
6
Regula
r div
idendT
ota
l payout
643
7
469
8
474
0
341
1
284
5
195
4
82
5
74
5
Perc
enta
ge o
f executive c
om
pensa
tion
Sala
ry_
337
295
313
287
296
289
276
300
Bonus_
223
226
214
228
172
192
134
169
Option g
rant_
201
167
290
210
373
260
507
325
Rest
ricte
d s
tock g
rant_
116
194
98
180
89
176
43
155
294
294
294
294
1st Q
uart
ile2
nd Q
uart
ile3
rd Q
uart
ile4
th Q
uart
ile
01
2
03
5
09
3
55
1
46
Accounting impact
Number of Firms
By accounting impact quartile
1
2
3
4
Pre Post Pre Post
Payout variables
Regular dividendTotal assets 09 11 08 10
RepurchaseTotal assets 18 31 26 52
Total payoutTotal assets 28 43 34 62
Regular dividendTotal payout 428 357 386 265
Percentage of executive compensation
Salary_ 435 364 282 280
Bonus_ 226 214 179 202
Option grant_ 92 125 387 261
Restricted stock grant_ 125 188 80 174
Percentage of CEO compensation
Salary_(CEO) 485 364 260 259
Bonus_(CEO) 249 228 185 219
Option grant_(CEO) 10 127 406 275
Restricted stock grant_(CEO) 128 182 82 183
Panel E Firm characteristics by alternative treatment definition - before and
after FAS123R
Treated
25
19
997
223
250
256
268
10
177
71
Control
44
37
47
Table 2
Differential effect of FAS123R on the use of option-based compensation
Panel A Two-period first-difference regression
Prediction Coeff t-stat Coeff t-stat Coeff t-stat
Accounting impact rank - -0044 -628
Accounting impact rank=2 - -0044 -327
Accounting impact rank=3 - -0075 -468
Accounting impact rank=4 - -0140 -613
Treated - -0132 -875
ΔLog(size) 0061 202 0061 200 0063 214
ΔBook-to-market 0032 091 0032 092 0051 143
ΔLeverage -0157 -213 -0160 -218 -0111 -153
ΔAsset tangibility -0012 -014 -0020 -023 -0023 -026
ΔFree cash flow -0106 -095 -0108 -097 -0128 -117
ΔCash holding -0197 -211 -0193 -206 -0180 -194
ΔFive-year ROA volatility -0065 -031 -0056 -026 -0098 -047
ΔInstitutional ownership -0044 -091 -0043 -088 -0044 -092
ΔSales growth -0064 -102 -0065 -104 -0090 -153
ΔPast one-year stock return 0051 078 0052 080 0091 138
ΔLoss frequency 0056 207 0057 207 0047 179
Log(size) -0009 -210 -0009 -207 -0002 -035
Book-to-market -0015 -056 -0013 -049 0018 072
Leverage 0022 046 0023 048 0068 150
Asset tangibility 0033 077 0033 078 0053 128
Free cash flow 0227 202 0220 195 0127 117
Cash holding -0002 -004 0012 019 -0078 -141
Five-year ROA volatility -0451 -240 -0430 -228 -0509 -283
Institutional ownership -0123 -360 -0122 -359 -0100 -292
Sales growth -0041 -056 -0040 -055 -0089 -125
Past one-year stock return -0009 -015 -0006 -010 0078 125
Loss frequency 0055 174 0056 178 0054 173
Fixed effect
Standard error
Adj R-squared
Observations
Model (3)
Dependent variable ΔAvg Option grantTotal pay
Huber-White
0156
This table investigates whether the effect of FAS123R on the use of option-based pay varies with its potential accounting impact Panel A
reports the results of estimating three two-period first-differencing models where for each firm we average its characteristics in Pre- and
Post-FAS123R period The Pre-FAS123R period consists of fiscal year 2003 and 2004 the Post-FAS123R period covers fiscal year 2005-
2007 In all three specifications the dependent variable is the change of average Option grantTotal pay from Pre- to Post-FAS123R period
The main independent variable varies by model in Model (1) the Accounting impact rank is the quartile rank of implied option expensetotal
assets measured in 2002 (1=lowest 4=highest) In Model (2) Accounting impact rank=2 (3 4) is an indicator that takes value of one if the
firmrsquos Accounting impact rank equals 2 (3 4) In Model (3) we use an alternative treatment construction following Bakke et al (2015)
where Treated is an indicator that takes value of zero if the firm granted zero option to its CEO in both 2003 and 2004 or the firm began to
voluntarily expense option-based pay at fair value in 2002 or earlier and one otherwise For each control variable we include both its level in
the Pre-FAS123R period and its change across the two periods Panel B shows the results of estimating fixed effect models with firm-year
observations The dependent variable is the firm-year level Option grantTotal pay The main independent variables are the interactions of
Post-FAS123R indicator (Post) with Accounting Impact rank Accounting impact rank indicators and Treated respectively All models in
Penal A have industry fixed effects and the standard errors are Huber-White heteroscedasticity-consistent standard errors All models in
Penal B have firm fixed effects and year fixed effects and the standard errors are clustered at firm level All variables are defined in
Appendix The notation and indicates statistically significant at 10 5 and 1 level respectively
Model (1) Model (2)
11711171 1171
Industry Industry
Huber-White
0124
Huber-White
0123
Industry
48
Panel B Panel fixed effects regression
Prediction Coeff t-stat Coeff t-stat Coeff t-stat
Acc impact rank x Post - -0044 -807
Acc impact rank 2 x Post - -0046 -333
Acc impact rank 3 x Post - -0077 -526
Acc impact rank 4 x Post - -0137 -776
Treated x Post - -0145 -970
Log(size) 0034 221 0034 217 0036 229
Book-to-market 0018 084 0017 083 0015 070
Leverage -0004 -009 -0006 -013 -0007 -015
Asset tangibility 0007 012 0004 006 0011 018
Free cash flow -0074 -151 -0072 -146 -0078 -158
Cash holding -0048 -086 -0050 -090 -0006 -011
Five-year ROA volatility 0250 231 0239 219 0437 414
Institutional ownership 0043 159 0044 161 0041 150
Sales growth -0033 -168 -0034 -171 -0031 -158
Past one-year stock return 0067 221 0068 224 0063 204
Loss indicator 0023 209 0022 207 0024 222
Fixed effects
Standard error
Adj R-squared
Observations
Dependent variable Option grantTotal pay
5653 5653 5653
Clustered by firm
Firm Year
Clustered by firm
Firm Year
Clustered by firm
0523 0523 0526
Model (1) Model (2) Model (3)
Firm Year
49
Table 3
Effect of option-based compensation on dividend policy
Panel A Two-period first-difference regression
Prediction Coeff t-stat Coeff t-stat Coeff t-stat
Accounting impact rank + 0000 077
Accounting impact rank=2 + 0001 091
Accounting impact rank=3 + 0000 044
Accounting impact rank=4 + 0001 092
Treated + 0000 -026
ΔLog(size) 0000 -030 0000 -030 0000 -026
ΔBook-to-market -0002 -190 -0002 -193 -0002 -195
ΔLeverage -0002 -059 -0002 -057 -0002 -059
ΔAsset tangibility 0016 431 0016 429 0016 430
ΔFree cash flow 0017 373 0017 373 0017 375
ΔCash holding -0011 -288 -0011 -285 -0010 -282
ΔFive-year ROA volatility 0003 034 0002 032 0003 035
ΔInstitutional ownership -0002 -073 -0002 -073 -0002 -070
ΔSales growth -0001 -040 -0001 -037 -0001 -038
ΔPast one-year stock return 0002 077 0002 076 0002 070
ΔLoss frequency 0000 -048 0000 -045 0000 -046
Log(size) 0000 183 0000 182 0000 182
Book-to-market -0002 -227 -0002 -225 -0002 -284
Leverage -0001 -037 -0001 -039 -0001 -048
Asset tangibility 0003 179 0003 180 0003 176
Free cash flow 0017 291 0017 291 0017 300
Cash holding 0002 080 0002 077 0002 098
Five-year ROA volatility 0003 035 0002 033 0003 044
Institutional ownership -0001 -068 -0001 -068 -0001 -058
Sales growth -0004 -177 -0004 -175 -0004 -172
Past one-year stock return 0004 169 0004 167 0004 165
Loss frequency -0001 -111 -0001 -109 -0001 -102
Fixed effect
Standard error
Adj R-squared
Observations
Dependent variable ΔAvg Regular dividendTotal assets
This table investigates the causal effect of option-based pay on dividend policy by examining whether changes in dividend policy around
FAS123R vary with its potential accounting impact Panel A reports the results of estimating three two-period first-differencing models
where for each firm we average its characteristics in Pre- and Post-FAS123R period In all three specifications the dependent variable is
the change of average Regular dividendTotal assets from Pre- to Post-FAS123R period The main independent variable varies by model in
Model (1) the Accounting impact rank is the quartile rank of implied option expensetotal assets measured in 2002 (1=lowest 4=highest) In
Model (2) Accounting impact rank=2 (3 4) is an indicator that takes value of one if the firmrsquos Accounting impact rank equals 2 (3 4) In
Model (3) we use an alternative treatment construction following Bakke et al (2015) where Treated is an indicator that takes value of zero
if the firm granted zero option to its CEO in both 2003 and 2004 or the firm began to voluntarily expense option-based pay at fair value in
2002 or earlier and one otherwise For each control variable we include both its level in the Pre-FAS123R period and its change across the
two periods Panel B shows the results of estimating fixed effect models with firm-year observations The dependent variable is the firm-
year level Regular dividendTotal assets The main independent variables are the interactions of Post-FAS123R indicator (Post) with
Accounting Impact rank Accounting impact rank indicators and Treated respectively Panel C examines the intensity of dividend changes
among firms with nonzero dividend per share in 2003 or 2004 In particular we estimates the same three models as in Panel A(with the
same independent variables) but for five dependent variables the change of average Regular dividendTotal assets from Pre- to Post-
FAS123R period (as in Panel A) the percentage change of DPS (dividend per share) from Pre- to Post-FAS123R period and three
indicators denoting respectively whether the percentage change of DPS was greater than 20 40 and 60 Panel D reports four
robustness tests of the dividend intensity regression In each of them a set of possible confounding observations is removed (see Section 33
for details) Panel E compares the trends of dividend initiation and termination around FAS123R across four quartile groups ranked by
accounting impact All models in Panel A C and D have industry fixed effects and the standard errors are Huber-White heteroscedasticity-
consistent standard errors All models in Penal B have firm fixed effects and year fixed effects and the standard errors are clustered at
firm level All variables are defined in Appendix The notation and indicates statistically significant at 10 5 and 1 level
Industry Industry Industry
Model (1) Model (2) Model (3)
1171 1171 1171
Huber-White Huber-White Huber-White
0105 0104 0105
50
Panel B Panel fixed effects regression
Prediction Coeff t-stat Coeff t-stat Coeff t-stat
Acc impact rank x Post + 0000 122
Acc impact rank 2 x Post + 0001 110
Acc impact rank 3 x Post + 0001 094
Acc impact rank 4 x Post + 0001 129
Treated x Post + 0000 -012
Log(size) 0001 179 0001 179 0001 181
Book-to-market 0000 025 0000 024 0000 031
Leverage 0001 062 0001 064 0001 069
Asset tangibility 0009 360 0009 358 0009 363
Free cash flow 0002 090 0002 093 0002 092
Cash holding -0007 -295 -0007 -298 -0007 -298
Five-year ROA volatility 0001 041 0001 038 0000 -006
Institutional ownership 0000 -027 0000 -026 0000 -027
Sales growth 0000 053 0000 051 0000 044
Past one-year stock return 0001 089 0001 088 0001 078
Loss indicator 0000 -060 0000 -057 0000 -076
Fixed effects
Standard error
Adj R-squared
Observations
Dependent variable Regular dividendTotal assets
Model (1) Model (2) Model (3)
Firm Year Firm Year Firm Year
5653 5653 5653
Clustered by firm Clustered by firm Clustered by firm
0877 0877 0877
51
Panel C Intensity of dividend changes around FAS123R
Prediction Coeff t-stat Coeff t-stat Coeff t-stat
Accounting impact rank + 0000 065
Accounting impact rank=2 + 0000 048
Accounting impact rank=3 + 0000 026
Accounting impact rank=4 + 0002 080
Treated + 0001 063
Dependent var DPS pct change
Accounting impact rank + -0145 -072
Accounting impact rank=2 + 0018 006
Accounting impact rank=3 + -0177 -045
Accounting impact rank=4 + -0746 -100
Treated + -0407 -119
Accounting impact rank + 0029 095
Accounting impact rank=2 + 0040 074
Accounting impact rank=3 + 0092 139
Accounting impact rank=4 + 0008 007
Treated + -0007 -012
Accounting impact rank + 0024 076
Accounting impact rank=2 + 0047 088
Accounting impact rank=3 + 0079 114
Accounting impact rank=4 + -0003 -002
Treated + 0030 052
Accounting impact rank + 0030 098
Accounting impact rank=2 + 0078 155
Accounting impact rank=3 + 0085 130
Accounting impact rank=4 + 0014 012
Treated + -0006 -011
Control variables
Fixed effect
Standard error
Observations 572 572 572
Yes Yes Yes
Huber-White Huber-White Huber-White
Industry Industry Industry
Dependent var DPS pct
change gt60 indicator
Model (1) Model (2) Model (3)
Dependent var ΔAvg Regular
dividendAssets
Dependent var DPS pct
change gt20 indicator
Dependent var DPS pct
change gt40 indicator
52
Panel D Robustness tests for intensity of dividend changes around FAS123R
Prediction Coeff t-stat Coeff t-stat Coeff t-stat
Accounting impact rank + 0006 017
Accounting impact rank=2 + 0067 118
Accounting impact rank=3 + 0041 057
Accounting impact rank=4 + -0061 -049
Treated + 0022 035Observations
Accounting impact rank + 0009 027
Accounting impact rank=2 + 0058 106
Accounting impact rank=3 + 0032 043
Accounting impact rank=4 + -0032 -024
Treated + 0018 028
Observations
Accounting impact rank + 0030 089
Accounting impact rank=2 + 0039 071
Accounting impact rank=3 + 0122 168
Accounting impact rank=4 + -0063 -052
Treated + 0075 132
Observations
Accounting impact rank + 0008 023
Accounting impact rank=2 + 0023 042
Accounting impact rank=3 + 0048 064
Accounting impact rank=4 + -0042 -033
Treated + -0010 -016
Observations
Control variables
Fixed effect
Standard error
Exclude firms with stable
payout ratio from 2003 to 2004
506 506 506
Dependent variable DPS pct change gt40 indicator
Model (1) Model (2) Model (3)
Exclude voluntary expensers
519 519
Exclude firms in the top decile
of option reduction (02-04)
Exclude firms that accelerated
option vesting
504 504 504
517 517 517
519
Huber-White Huber-White Huber-White
Yes Yes Yes
Industry Industry Industry
53
Panel E Dividend initiation and termination rates around FAS123R
Pre FAS 123R
1 280 75 7 6 13 173
2 284 135 18 9 27 200
3 286 181 11 14 25 138
4 282 260 9 10 19 73
Total 1132 651 45 39 84 129
Post FAS 123R
1 275 63 4 4 8 127
2 280 116 9 9 18 155
3 276 152 9 3 12 79
4 263 223 5 1 6 27
Total 1094 554 27 17 44 79
Pre FAS 123R
1 280 205 2 0 2 10
2 284 149 7 1 8 54
3 286 105 0 0 0 00
4 282 22 0 0 0 00
Total 1132 481 9 1 10 21
Post FAS 123R
1 275 212 3 6 9 42
2 280 164 1 2 3 18
3 276 124 1 1 2 16
4 263 40 0 3 3 75
Total 1094 540 5 12 17 31
termination
in 2004
03-04
cumulative
03-04
cumulative
Quartile firms
with
dividend in
2004
termination
in 2005
termination
in 2006
05-06
cumulative
05-06
cumulative
Termination
Quartile firms
with
dividend in
2002
termination
in 2003
without
dividend in
2004
initiation in
2003
initiation in
2004
03-04
cumulative
03-04
cumulative firmsQuartile
firmsQuartile initiation in
2005
initiation in
2006
05-06
cumulative
05-06
cumulative
Initiation
without
dividend in
2002
54
Table 4
Effect of option-based compensation on repurchases
Panel A Two-period first-difference regression with total repurchase
Prediction Coeff t-stat Coeff t-stat Coeff t-stat
Accounting impact rank - 0002 122
Accounting impact rank=2 - 0002 071
Accounting impact rank=3 - 0005 123
Accounting impact rank=4 - 0007 102
Treated - 0014 365
Control variables
Fixed effect
Standard error
Adj R-squared
Observations
Panel B Two-period first-difference regression with net repurchase
Prediction Coeff t-stat Coeff t-stat Coeff t-stat
Accounting impact rank - 0003 166
Accounting impact rank=2 - 0002 051
Accounting impact rank=3 - 0006 165
Accounting impact rank=4 - 0009 137
Treated - 0010 300
Control variables
Fixed effect
Standard error
Adj R-squared
Observations
Panel C Two-period first-difference regression with repurchase adjusted for exercised options
Prediction Coeff t-stat Coeff t-stat Coeff t-stat
Accounting impact rank - 0001 056
Accounting impact rank=2 - 0002 062
Accounting impact rank=3 - 0007 172
Accounting impact rank=4 - -0001 -008
Treated - 0006 197
Control variables
Fixed effect
Standard error
Adj R-squared
Observations
Dependent variable ΔAvg RepurchaseTotal assets
This table investigates the causal effect of option-based pay on payout policy by examining whether the changes of repurchase around
FAS123R vary with its potential accounting impact Panel A reports the results of estimating three two-period first-differencing models
where for each firm we average its characteristics in Pre- and Post-FAS123R period In all three specifications the dependent variable is
the change of average RepurchaseTotal assets from Pre- to Post-FAS123R period The main independent variable varies by model in
Model (1) the Accounting impact rank is the quartile rank of implied option expensetotal assets measured in 2002 (1=lowest 4=highest)
In Model (2) Accounting impact rank=2 (3 4) is an indicator that takes value of one if the firmrsquos Accounting impact rank equals 2 (3 4)
In Model (3) we use an alternative treatment construction following Bakke et al (2015) where Treated is an indicator that takes value of
zero if the firm granted zero option to its CEO in both 2003 and 2004 or the firm began to voluntarily expense option-based pay at fair
value in 2002 or earlier and one otherwise Panel B reports the regressions with the change of Net repurchaseTotal assets as the
dependent variable and the same independent variable as in Panel A Panel C reports the regressions with the change of Adjusted
repurchaseTotal assets as the dependent variable and the same independent variable as in Panel A All models in Panel A B and C have
industry fixed effects and the standard errors are Huber-White heteroscedasticity-consistent standard errors All variables are defined in
Appendix The notation and indicates statistically significant at 10 5 and 1 level respectively
Model (1) Model (2) Model (3)
Yes Yes Yes
Industry Industry Industry
Huber-White Huber-White Huber-White
Dependent variable ΔAvg Net repurchaseTotal assets
1171 1171 1171
0238 0237 0245
Model (1) Model (2) Model (3)
Yes Yes Yes
Industry Industry Industry
Huber-White Huber-White Huber-White
Dependent variable ΔAvg Adjusted repurchaseTotal assets
0229 0229 0233
1171 1171 1171
Model (1) Model (2) Model (3)
Yes Yes Yes
Industry Industry Industry
Huber-White Huber-White Huber-White
0111 0112 0114
1168 1168 1168
55
Table 5
Effect of option-based compensation on payout mix
Panel A Two-period first-difference regression with total payout mix
Prediction Coeff t-stat Coeff t-stat Coeff t-stat
Accounting impact rank + 0006 028
Accounting impact rank=2 + 0018 045
Accounting impact rank=3 + -0001 -001
Accounting impact rank=4 + 0043 052
Treated + -0035 -094
Control variables
Fixed effect
Standard error
Adj R-squared
Observations
Panel B Two-period first-difference regression with net payout mix
Prediction Coeff t-stat Coeff t-stat Coeff t-stat
Accounting impact rank + -0002 -008
Accounting impact rank=2 + 0008 016
Accounting impact rank=3 + 0018 034
Accounting impact rank=4 + -0059 -055
Treated + -0050 -101
Control variables
Fixed effect
Standard error
Adj R-squared
Observations
0049 0043 0054
257 257 257
Industry Industry Industry
Huber-White Huber-White Huber-White
Dependent variable ΔAvg Regular dividendNet payout
Model (1) Model (2) Model (3)
Yes Yes Yes
0154 0151 0156
362 362 362
Industry Industry Industry
Huber-White Huber-White Huber-White
This table investigates the causal effect of option-based pay on payout mix for firms using both dividend and repurchase by examining
whether the changes of payout mix around FAS123R vary with its potential accounting impact Panel A reports the results of estimating
three two-period first-differencing models where for each firm we average its characteristics in Pre- and Post-FAS123R period In all three
specifications the dependent variable is the change of average Regular dividendTotal payout from Pre- to Post-FAS123R period The main
independent variable varies by model in Model (1) the Accounting impact rank is the quartile rank of implied option expensetotal assets
measured in 2002 (1=lowest 4=highest) In Model (2) Accounting impact rank=2 (3 4) is an indicator that takes value of one if the firmrsquos
Accounting impact rank equals 2 (3 4) In Model (3) we use an alternative treatment construction following Bakke et al (2015) where
Treated is an indicator that takes value of zero if the firm granted zero option to its CEO in both 2003 and 2004 or the firm began to
voluntarily expense option-based pay at fair value in 2002 or earlier and one otherwise Panel B reports the regressions with the change of
Regular dividendNet payout as the dependent variable and the same independent variables as in Panel A Panel A (Panel B) is based on
observations with nonzero regular dividend and repurchase (net repurchase) in both Pre- and Post-FAS123R period All models in Panel A
and B have industry fixed effects and the standard errors are Huber-White heteroscedasticity-consistent standard errors All variables are
defined in Appendix The notation and indicates statistically significant at 10 5 and 1 level respectively
Yes Yes Yes
Dependent variable ΔAvg Regular dividendTotal payout
Model (1) Model (2) Model (3)

29
option compensation increased the propensity to pay dividends we would expect to see a relative
increase (ie a lower decrease) in dividend initiations among firms with the highest accounting
impact Instead the rate does not differ depending on the accounting impact There is
approximatley a 5 decline in initiation rate in each quartile In the right portion of Panel E we
examine similar data for dividend terminations While the results should be interpreted with
caution due to their rarity firms with higher accounting impact do not experience a greater decline
in termination rates Our inferences in Panel E are similar when we compared treated and control
firms following Bakke et al (2015) (untabulated)
Even after taking into account the different nature of decisions for dividend paying and non-
dividend-paying firms we fail to find evidence of a causal influence of option-based compensation
on dividend policy This finding is in contrast to the associations documented in earlier studies It
is even more remarkable as most firms replaced stock options with restricted stock which are
generally dividend-protected and should provide further incentive to increase dividends28
34 Option-Based Pay and Repurchases
In this section we examine the effect of an exogenous (accounting-induced) change in option
compensation on repurchases by estimating Equation (2)
Table 4 Panel A presents the results using the change in repurchases (scaled by total assets)
from Pre to Post as a dependent variable If the use of option-based pay had a positive effect on
firmsrsquo propensity to engage in repurchases as posited by the dividend-protection and dilution
hypotheses we should find a negative association between Accounting Impact or Treated and
repurchases Firms with a higher (accounting-driven) reduction in option-based pay should reduce
28 In a sample of SampP 500 firms between 2000 and 2009 Zhang (2013) reports that 80 of the firms granting
restricted stocks offer dividend protection In that sense the FAS123R-induced shift from stock options to restricted
stock may be characterized as a ldquoshockrdquo to dividend protection in unearned equity pay Accordingly our results cast
doubt on the causal interpretation of the positive association between dividend protection and dividend payouts
documented in prior studies (Zhang 2013 Burns et al 2015 Minnick and Rosenthal 2015)
30
the use of repurchases either because they are shifting toward a greater use of dividends andor
because they have a lower need to offset the dilutive effects of stock options However we find no
significant association between Accounting Impact (columns 1 and 2) and the change in
repurchases around the adoption of FAS123R When we use the Treated indicator (column 3) we
find a significant positive association rather than a negative one In Panel B we repeat the analysis
using net repurchases (ie repurchases after removing the effect of share issuances) following
Fama and French (2001) and Skinner (2008) Our inferences are unchanged29
This test is subject to two important caveats The first is we may not detect a decline in
repurchases because in the Post period firms need to offset the exercise of options that were
granted during the Pre period That is a post-FAS123R reduction in grants may not (yet) translate
into a reduction in exercises during the Post period which reduces our ability to test the dilution
hypothesis (ie that firms repurchase shares to offset exercises)30 However we can examine a
variation of this hypothesis where firms use repurchases to manage the effect of unexercised
options on diluted EPS (Bens et al 2003) To do so in Panel C we use a measure of adjusted
repurchases where we subtract our estimate of repurchases undertaken to offset the exercise of
ESO31 We effectively test whether firms experiencing an accounting-induced decrease in option
grants engage in less repurchases (net of exercise-driven repurchases) because their need to
manage the effect of unexercised options on diluted EPS is lower However the coefficient on
the variables of interest is either insignificant or positive inconsistent with the hypothesis
29 In the case of repurchases we do not examine separately ldquoinitiationsrdquo and ldquointensityrdquo as we do for dividends
because initiation is not clearly defined for repurchases Unlike dividends the occurrence of a repurchase in a given
year (or the lack thereof) cannot be used to infer a general policy due to the more discretionary nature of the timing of
repurchases 30 To capture the effect of lower option-based compensation on option exercises and thus on repurchases we would
ideally extend the Post period beyond 2007 However as noted by Floyd et al (2015) repurchases declined
dramatically after 2007 because of the financial crisis making it difficult to detect the effect of any other factor 31 As upper bound estimate of exercise-driven repurchases we multiply the number of ESO exercised during the year
times the average stock price during the year Since the number of ESO exercised is available in Compustat starting in
2004 Panel C is based on observations from 2004 to 2007
31
A second important caveat is that most firms replaced stock options with restricted stock
(Table 2 Panel C) Unvested restricted stock is excluded from the denominator in the computation
of basic EPS (once vested it is included) However it is included in the denominator of diluted
EPS using the treasury stock method similar to stock options Given the complexity of this
method without access to all details of restricted stock grants and option grants it is difficult to
determine whether the switch from stock options to restricted stock decreased the need for
dilution-driven repurchases as our test implicitly assumes Hence it is possible that we do not find
a decrease in repurchases because a reduced need to offset the dilutive effect of stock options was
neutralized by an increased need to offset the dilutive effect of restricted stock
Subject to the above caveats the evidence in Table 4 is not consistent with a positive causal
relation between the use of option-based pay and repurchases More precisely it suggests that
option-driven dilution concerns do not have a first-order effect on the magnitude of repurchases
even though they may play a role in the repurchase decision Hence our result is not necessarily
in conflict with the evidence in Brav et al (2005) where two-thirds of the surveyed financial
executives state that offsetting the dilutionary effect of stock option plans or other stock
programs is an important factor to their repurchase decisions
35 Option-Based Pay and Payout Composition
As an alternative to examining dividends and repurchases separately we also look at the
payout composition the change in the DividendsTotal Payout ratio from the Pre to the Post period
where Total Payout is the sum of dividends and repurchases As noted earlier we focus on the
subsample of firms with both dividends and repurchases in both Pre and Post periods so as to
capture the change in payout mix by firms routinely using both vehicles to return cash to
shareholders If the use of option-based pay causes firms to substitute repurchases for dividends
32
we should find a positive association between Accounting Impact or Treated and the payout mix
defined as DividendsTotal Payout ratio Firms with a higher accounting-driven reduction in
option-based pay should have an increase (decrease) in the relative weight of dividends
(repurchases) to the total payout However as reported in Table 5 Panel A we fail to find a
significant association between Accounting Impact (column 1 and 2) or Treated (column 3) and
the change in payout mix The results are similar when we use Net Payout (dividends plus net
repurchases) instead of Total Payout in computing the payout mix (Panel B)
Overall the combined evidence in Tables 3-5 does not support the hypothesis that option-
based compensation has negative (positive) effect on dividends (repurchases) or that it causes
firms to replace dividends with repurchases
4 Conclusion
Prior literature has documented robust associations between option-based compensation and
payout policy yet it remains unclear whether this association reflcts a causal influence We
investigate the causal effect of option-based compensation on payout policy using the adoption of
FAS123R which resulted in a significant decrease in option grants making it a plausible
exogenous shock to the use of option-based pay To overcome the challenge of no control group
we exploit the fact that firms responded differently depending on the firm-specific accounting
impact as measured by the implied option expense disclosed in the footnotes prior to FAS123R
Firms with larger expected accounting impact curtailed option-based compensation much more
aggressively than firms with lower impact Using a sample of SampP 1500 firms we find no
evidence that firms with a larger accounting-induced decline in option compensation increased
dividends reduced repurchases or changed their payout composition contrary to the widely held
belief that option-based pay has a causal influence on payout policy
33
Appendix Variable Definitions and Data Sources
Accounting Impact Variables
Accounting impact Implied option expense (Compustat XINTOPT) divided by total assets
(Compustat AT) This variable is measured at fiscal year 2002 and is time-invariant
Accounting impact rank The quartile rank of Accounting impact (1=lowest 4=highest)
Payout Variables
Regular dividendTotal assets The numerator is total regular cash dividends in the fiscal year
from the distribution dataset in CRSP Regular cash dividends are identified by the distribution
codes 1212 1222 1232 or 1242 The denominator is one-year lagged total assets (Compustat
AT)
DPS Dividend per share (Compustat DVPSX_F)
DPS pct change The percentage change of average DPS from Pre- to Post-FAS123R period
DPS pct change gtX indicator A dummy variable that equals one if DPC pct change is greater
than X and zero otherwise
RepurchaseTotal assets The numerator is the repurchase of common equity which equals total
repurchase (Compustat PRSTK) minus the change in preferred stock redemption value
(Compustat PSTKRV) The denominator is one-year lagged total assets (Compustat AT)
Net repurchaseTotal assets Net repurchase removes the effect of share issuances The
construction follows Fama and French (2001) and Skinner (2008) if the firm uses the treasury
stock method for repurchase net repurchase equals the increase in common treasury stock
(Compustat TSTKC) if the firm uses the retirement method (when common treasury stock is zero
in the current and prior year) net repurchase equals total repurchases minus stock issuance
(Compustat SSTK) and change in preferred stock redemption value (Compustat PSTKRV)
When the above measures give negative value net repurchase is set to zero
Adjusted repurchaseTotal assets Adjusted repurchase removes from total repurchase the potential
effect of repurchasing exercised options This variable equals total repurchase of common stocks
minus the product between the number of options exercised (Compustat OPTEXD) and average
stock price during the year When the above measure gives negative value adjusted repurchase is
set to zero Since the number of options exercised is not available before 2003 we drop
observations in 2003 when we use this variable
34
Total payoutTotal assets the sum of Regular dividendTotal assets and RepurchaseTotal assets
Regular dividendTotal payout regular cash dividend divided by the sum of regular cash dividend
and repurchase from common equity In the two-period analysis (Pre- vs Post-FAS123R) we
separately sum the numerator and the denominator for each firm-period and then calculate the ratio
Regular dividendNet payout regular dividend divided by the sum of regular dividend and net
repurchase In the two-period analysis (Pre- vs Post-FAS123R) we separately sum the numerator
and the denominator for each firm-period and then calculate the ratio
Compensation Variables
Salary_$ Average salary (Execucomp SALARY) of the top 5 highest paid executives in $1000
Salary_ Average salary (Execucomp SALARY) divided by average total pay (Execucomp
TDC1) of the top 5 highest paid executives
Bonus_$ Average bonus (Execucomp BONUS) of the top 5 highest paid executives in $1000
Due to a data format change we add non-equity plan-based awards (Execucomp
NON_EQ_TARG) to this measure after 2006
Bonus_ Bonus_$ divided by average total pay (Execucomp TDC1) of the top 5 highest paid
executives
Option grant_$ Average option grant value (Execucomp OPTION_AWARDS_BLK_VALUE or
OPTION_AWARDS_FV) of the top 5 highest paid executives in $1000 Due to a data format
change we use OPTION_AWARDS_FV for this measure after 2006
Option grant_ Option grant_$ divided by average total pay (Execucomp TDC1) of the top 5
highest paid executives
Restricted stock grant_$ Average restricted stock grant value (Execucomp RSTKGRNT or
STOCK_AWARDS_FV) of the top 5 highest paid executives in $1000 Due to data format
change we use STOCK_AWARDS_FV for this measure after 2006
Restricted stock grant_ Restricted stock grant_$ divided by average total pay (Execucomp
TDC1) of the top 5 highest paid executives
Total pay_$ Average total pay (Execucomp TDC1) of the top 5 highest paid executives in $1000
35
Other Characteristics
Size The book value of total assets (Compustat AT) minus the book value of common equity
(Compustat CEQ) plus the market value of common equity from CRSP in $M
Log(size) the natural logarithm of size
Book-to-market the book value of common equity dividend by its market value
Leverage long term debt plus short term debt (Compustat DLTT + DLC) divided by total assets
Asset tangibility tangible assets (Compustat AT - INTAN) divided by total assets
Free cash flow Operating cash flow (Compustat OANCF) minus capital expenditure (Compustat
CAPX) then divided by lagged total assets
Cash holding Cash and short-term investments (Compustat CHE) divided by total assets
ROA volatility the standard deviation of returns on assets (operating income before tax divided by
lagged total assets) in the past five fiscal years
Institutional ownership the number of shares held by institutional investors divided by the number
of shares outstanding from Thomson Reuters Institutional Holdings database
Sales growth the growth rate of sales (Compustat SALE) from the prior year
Past stock return annual stock return from the prior year
Loss indicator a dummy variable taking value of one if the current net income is negative and
zero otherwise
36
References
Aboody David 1996 Market Valuation of Employee Stock Options Journal of Accounting and
Economics 22 357-391
Aboody David Barth Mary E and Ron Kasznik 2004 Firms Voluntary Recognition of Stock-
Based Compensation Expense Journal of Accounting Research 42 123ndash150
Aboody David and Ron Kasznik 2008 Executive stock-based compensation and firmsrsquo cash
payout the role of shareholdersrsquo tax-related payout preferences Review of Accounting Studies
13 216ndash251
Anantharaman Divya and Yong Gyu Lee 2014 Managerial risk taking incentives and corporate
pension policy Journal of Financial Economics 111 328ndash351
Baker Malcolm and Jeffrey Wurgler 2004 A catering theory of dividends Journal of Finance
59 1125-1165
Baker Malcolm and Jeffrey Wurgler 2016 Dividends as reference points a behavioral signaling
approach Review of Financial Studies 29 697-738
Bakke Tor-Erik Hamed Mahmudi Chitru Fernando and Jesus Salas 2015 The causal effect of
option pay on corporate risk management Journal of Financial Economics forthcoming
Balsam Steven Austin Reitenga and Jennifer Yin 2008 Option acceleration in response to SFAS
No 123 (R) Accounting Horizons 22 23-45
Bens Daniel and Steven Monahan 2008 Altering Investment Decisions to Manage Financial
Reporting Outcomes Asset-Backed Commercial Paper Conduits and FIN 46 Journal of
Accounting Research 46 1017-1055
Bens Daniel A Venky Nagar Douglas J Skinner and MH Franco Wong 2003 Employee stock
options eps dilution and stock repurchases Journal of Accounting and Economics 36 51ndash90
Bertrand Marianne Esther Duflo and Sendhil Mullainathan 2004 How much should we trust
differences-in-differences estimates The Quarterly Journal of Economics 119 249ndash275
Blouin Jennifer L Jana S Raedy and Douglas A Shackelford 2011 Dividends Share
Repurchases and Tax Clienteles Evidence from the 2003 Reductions in Shareholder Taxes
The Accounting Review 86 887-914
Brav Alon John R Graham Campbell R Harvey and Roni Michaely 2005 Payout policy in the
21st century Journal of Financial Economics 77 483ndash527
Brown Lawrence D and Yen-Jung Lee 2011 Changes in Option-Based Compensation Around
the Issuance of SFAS123R Journal of Business Finance amp Accounting 38 1053ndash109
37
Brown Jeffrey R Nellie Liang and Scott Weisbenner 2007 Executive financial incentives and
payout policy Firm responses to the 2003 dividend tax cut Journal of Finance 62 1935ndash
1965
Burns Natasha Brian McTier and Kristina Minnick 2015 Equity-incentive compensation and
payout policy in Europe Journal of Corporate Finance 30 85-97
Carter Mary Ellen and Luann J Lynch 2003 The Consequences of the FASBrsquos 1998 Proposal on
Accounting for Stock Option Repricing Journal of Accounting and Economics 35 51-72
Carter Mary Ellen Luann J Lynch and Irem Tuna 2007 The role of accounting in the design of
CEO equity compensation The Accounting Review 82 327ndash357
Chava Sudheer and Amiyatosh Purnanandam 2010 CEOs versus CFOs Incentives and
corporate policies Journal of Financial Economics 97 263ndash278
Chetty Raj and Emmanuel Saez 2005 Dividend taxes and corporate behavior Evidence from the
2003 dividend tax cut The Quarterly Journal of Economics 120 791ndash833
Choudhary Preeti Shivaram Rajgopal and Mohan Venkatachalam 2009 Accelerated vesting of
employee stock options in anticipation of FAS123R Journal of Accounting Research 47 105ndash
146
Christensen Hans B and Valeri Nikolaev 2009 Contracting on Mandatory Changes to GAAP
New Practice and Its Determinants Working Paper University of Chicago
Chu Yongqiang and Tao Ma 2015 How does management compensation affect bank risk taking
evidence from FAS 123R University of South Carolina Working Paper
Cuny Charles J Gerald S Martin and John J Puthenpurackal 2009 Stock options and total
payout Journal of Financial and Quantitative Analysis 44 391ndash410
DeAngelo Harry Linda DeAngelo and Douglas J Skinner 2000 Special Dividends and the
Evolution of Dividend Signaling Journal of Financial Economics 57 309-354
Dechow Patricia M Amy P Hutton and Richard G Sloan 1996 Economic consequences of
accounting for stock-based compensation Journal of Accounting Research 34 1ndash20
Edgerton J 2013 Four facts about dividend payouts and the 2003 tax cut International Tax and
Public Finance 20 769-784
Edmans Alex and Xavier Gabaix 2015 Executive compensation a modern primer Journal of
Economic Literature forthcoming
38
Fama Eugene F and Kenneth R French 2001 Disappearing dividends changing firm
characteristics or lower propensity to pay Journal of Financial Economics 60 3ndash43
Farre-Mensa Joan Roni Michaely and Martin C Schmalz 2014 Payout policy Annual Review
of Financial Economics 6 75ndash134
Fenn George W and Nellie Liang 2001 Corporate payout policy and managerial stock
incentives Journal of Financial Economics 60 45ndash72
Ferri Fabrizio and Tatiana Sandino 2009 The impact of shareholder activism on financial
reporting and compensation the case of employee stock options expensing The Accounting
Review 84 433ndash466
Floyd Eric Nan Li and Douglas J Skinner 2015 Payout policy through the financial crisis the
growth of repurchases and the resilience of dividends Journal of Financial Economics 118
299-316
Frydman Carola and Dirk Jenter 2010 CEO compensation Annual Review of Financial
Economics 2 75-102
Gipper Brandon 2015 Assessing the Effects of Disclosing Management Compensation Working
Paper University of Chicago
Gormley Todd David Matsa and Todd Milbourn 2013 CEO compensation and corporate risk
evidence from a natural experiment Journal of Accounting and Economics 56 79-101
Graham John Michelle Hanlon and Terry Shevlin 2011 Real effects of accounting rules
evidence from multinational firmsrsquo investment locations and profit repatriation decisions
Journal of Accounting Research 49 137-185
Graham John Campbell Harvey and Shiva Rajgopal 2005 The Economic implications of
corporate financial reporting Journal of Accounting and Economics 40 3-73
Greenspan Alan 2002 Testimony of Alan Greenspan before the Committee on Banking
Housing and Urban Affairs US Senate July 16 Washington DC Government Printing
Office
Grullon Gustavo and Roni Michaely 2002 Dividends Share Repurchases and the Substitution
Hypothesis Journal of Finance 57 1649-1684
Hail Luzi Ahmed Tahoun and Clare Wang 2014 Dividend Payouts and Information Shocks
Journal of Accounting Research 52 403-456
Hall Brian J and Kevin J Murphy 2002 Stock options for undiversified executives Journal of
Accounting amp Economics 33 3-42
39
Hall Brian J and Kevin J Murphy 2003 The trouble with stock options Journal of Economic
Perspectives 17 49ndash70
Hanlon Michelle and Jeffrey L Hoopes 2014 What do firms do when dividend tax rates change
An examination of alternative payout responses Journal of Financial Economics 114 105-
124
Hayes Rachel M Michael Lemmon and Mingming Qiu 2012 Stock options and managerial
incentives for risk taking Evidence from FAS123R Journal of Financial Economics 105
174ndash190
Heron Randall A Erik Lie 2007 Does backdating explain the stock price pattern around
executive stock option grants Journal of Financial Economics 83 271-295
Hribar Paul Nicole Thorne Jenkins and W Bruce Johnson 2006 Stock repurchases as an
earnings management device Journal of Accounting and Economics 41 3ndash27
Jensen Michael C 1986 Agency cost of free cash flow corporate finance and takeovers
American Economic Review 76 323-329
Jolls Christine 1998 Stock repurchases and incentive compensation NBER Working Paper No
w6467
Jung Boochun Woo-Jong Lee and Yanhua Sunny Yang 2016 The Impact of Dividend
Covenants on Investment and Operating Performance Journal of Business Finance amp
Accounting 43 414ndash447
Kahle Kathleen M 2002 When a buyback isnrsquot a buyback open market repurchases and
employee options Journal of Financial Economics 63 235ndash261
Lambert Richard A William N Lanen and David F Larcker 1989 Executive stock option plans
and corporate dividend policy Journal of Financial and Quantitative Analysis 24 409ndash425
Lintner John 1956 Distribution of incomes of corporations among dividends retained earnings
and taxes The American Economic Review 46 97-113
Low Angie 2009 Managerial risk-taking behavior and equity-based compensation Journal of
Financial Economics 92 470-490
Miller Merton H and Franco Modigliani 1961 Dividend policy growth and the valuation of
shares The Journal of Business 34 411ndash433
Minnick Kristina and Leonard Rosenthal 2015 Stealth compensation Do CEOs increase their
pay by influencing dividend policy Journal of Corporate Finance 25 435-454
40
Murphy Kevin J 1999 Executive compensation In O Ashenfelter and D Card (eds) North
Holland Handbook of Labor Economics Amsterdam Elsevier Science BV
Murphy Kevin J 2013 Executive compensation Where we are and how we got there Handbook
of the Economics of Finance Elsevier Science North Holland 211-356
Nikolaev Valeri 2010 Debt Covenants and Accounting Conservatism Journal of Accounting
Research 48 143-176
Puri Manju Joumlrg Rocholl and Sascha Steffen 2011 Global retail lending in the aftermath of the
US financial crisis Distinguishing between supply and demand effects Journal of Financial
Economics 100 556-578
Shue Kelly and Richard R Townsend 2014 Swinging for the fences Executive reactions to
quasi-random option grants Working Paper University of Chicago
Skinner Douglas J 2008 The evolving relation between earnings dividends and stock
repurchases Journal of Financial Economics 87 582-609
Weisbenner Scott J 2000 Corporate share repurchases in the 1990s What role do stock options
play FEDS Working Paper No 2000-29
Zhang Dan 2013 CEO dividend protection Working Paper BI Norwegian Business School
41
Figure 1 Trends of dividends and repurchases from 2003 to 2007 Panel A plots the average
Regular DividendTotal Assets of firms in the highest and lowest quartiles of Accounting Impact
measured in 2002 Panel B shows the average Total RepurchaseTotal Assets of firms in the
highest and lowest quartiles of Accounting Impact measured in 2002
Panel A Trends of regular dividends
Panel B Trends of total repurchases
00
05
10
15
20
2003 2004 2005 2006 2007
Regular DividendTotal Assets
Lowest Acc Impact
Highest Acc Impact
Pre Post
00
20
40
60
80
100
2003 2004 2005 2006 2007
Total Repurchase Total Assets
Lowest Acc Impact
Highest Acc Impact
Pre Post
42
Table 1
Summary Statistics
Panel A Firm characteristics - full sample
N Mean Std dev 25 pctl Median 75 pctl
Accounting impact (2002) 1176 173 366 022 052 163
Payout variablesRegular dividendTotal assets 5653 093 148 000 000 142
RepurchaseTotal assets 5653 394 710 000 035 500
Total payoutTotal assets 5653 488 748 000 175 666
Regular dividendTotal payout 4091 3874 4057 000 2237 8833
Level of executive compensation (in $1000)
Salary_$ 5653 450 190 314 409 544
Bonus_$ 5653 476 616 122 295 586
Option grant_$ 5653 791 1137 62 384 1002
Restricted stock grant_$ 5653 458 866 0 58 518
Total pay_$ 5653 2481 2475 890 1647 3074
Percentage of executive compensation
Salary_ 5653 296 183 165 251 382
Bonus_ 5653 197 148 97 177 268
Option grant_ 5653 283 235 67 256 445
Restricted stock grant_ 5653 141 180 00 41 249
Control variables
Size ($M) 5653 11086 27294 1017 2459 8117
Log(size) 5653 7985 1565 6925 7808 9002
Book-to-market 5653 0445 0287 0251 0388 0578
Leverage 5653 0202 0172 0038 0187 0309
Asset tangibility 5653 0806 0184 0691 0853 0965
Free cash flow 5653 0059 0091 0013 0059 0108
Cash holding 5653 0166 0172 0034 0100 0247
ROA volatility 5653 0056 0056 0021 0038 0070
Institutional ownership 5653 0753 0202 0639 0795 0910
Sales growth 5653 0121 0189 0028 0096 0183
Past stock return 5653 0094 0183 -0012 0094 0199
Loss indicator 5653 0164 0370 0000 0000 0000
This table presents summary statistics Panel A shows the descriptive statistics of payout variables compensation
variables and other firm characteristics for the full sample Accounting impact is the implied option expense
measured at fiscal year 2002 All other variables are measured at firm-year level from fiscal year 2003 to 2007
resulting in 5653 firm-year observations (except for Regular dividendTotal Payout which can be measured only
for the 4901 firm-year observations with Total payout greater than zero) Panel B shows the pairwise correlations
between main variables at firm-year level Panel C compares payout variables compensation variables and other
firm characteristics before and after FAS123R The Pre-FAS123R period consists of fiscal year 2003 and 2004
the Post-FAS123R period covers fiscal year 2005-2007 Panel D compares the trends of payout and compensation
variables around FAS123R across four quartile groups ranked by 2002 accounting impact Panel E compares the
trends of payout and compensation variables around FAS123R between the treated and control group under the
alternative treatment definition in Bakke et al (2015) (see Section 22) All variables are defined in Appendix The
notation and in Panel C indicates statistically significant at 10 5 and 1 level in T-tests for equal
means respectively
43
Pa
nel
B
Pea
rso
n c
orr
ela
tio
ns
Reg div
Repurchase
Total payout
Salary_
Bonus_
Option_
RS_
Log(size)
BM
Leverage
Tangibility
FCF
Cash holdingROA vol
Inst own
Sales growth
Past ret
urn
Loss
Reg
div
10
0
Repurc
hase
01
610
0
Tota
l payout
03
509
810
0
Sala
ry_
-0
10
-01
8-0
19
10
0
Bonus_
00
700
100
3-0
01
10
0
Option_
-0
10
00
900
6-0
41
-03
510
0
RS
_
01
000
901
0-0
32
-01
1-0
40
10
0
Log(s
ize)
03
101
802
3-0
56
01
101
202
210
0
BM
-02
1-0
28
-03
103
0-0
03
-02
000
0-0
33
10
0
Levera
ge
-00
1-0
08
-00
8-0
05
00
6-0
11
00
801
9-0
03
10
0
Tangib
ility
00
200
100
101
200
1-0
05
-00
6-0
12
-00
4-0
18
10
0
FC
F02
203
703
9-0
20
00
901
1-0
01
02
4-0
32
-02
1-0
16
10
0
Cash
hold
ing
-01
301
000
700
2-0
14
02
2-0
10
-02
3-0
16
-03
502
901
210
0
RO
A v
ol
-01
5-0
04
-00
700
4-0
11
01
9-0
11
-02
3-0
08
-01
101
2-0
02
03
910
0
Inst
ow
n
-00
901
401
1-0
17
00
200
701
200
7-0
01
00
3-0
08
01
4-0
06
-01
110
0
Sale
s gro
wth
-00
8-0
04
-00
6-0
15
00
501
0-0
02
00
7-0
16
-00
3-0
08
01
300
201
400
410
0
Past
retu
rn00
901
301
4-0
18
01
5-0
01
00
301
6-0
29
-01
000
102
7-0
14
-01
001
602
710
0
Loss
-02
0-0
19
-02
201
8-0
18
00
4-0
05
-02
601
901
300
6-0
41
01
702
3-0
16
-01
8-0
40
10
0
44
Panel C Firm characteristics - before and after FAS123R
Pre FAS 123R Post FAS 123R Difference
Payout variables
Regular dividendTotal assets 083 099 016
RepurchaseTotal assets 245 490 245
Total payoutTotal assets 328 589 261
Regular dividendTotal payout 3914 2790 -1124
Level of executive compensation (in $1000)
Salary_$ 426 463 37
Bonus_$ 418 505 87
Option grant_$ 896 707 -191
Restricted stock grant_$ 269 574 305
Total pay_$ 2263 2584 321
Percentage of executive compensation
Salary_ 305 293 -12
Bonus_ 186 204 18
Option grant_ 343 240 -103
Restricted stock grant_ 87 176 89
Control variables
Size ($M) 9671 11631 1960
Log(size) 7860 8035 0175
Book-to-market 0437 0453 0016
Leverage 0201 0203 0002
Asset tangibility 0822 0793 -0029
Free cash flow 0061 0057 -0004
Cash holding 0175 0159 -0016
ROA volatility 0067 0048 -0019
Institutional ownership 0712 0781 0069
Sales growth 0137 0108 -0029
Past stock return 0080 0101 0021
Loss indicator 0173 0159 -0014
45
Pa
nel
D
Fir
m c
ha
racte
rist
ics
by q
ua
rtil
e o
f a
cco
un
tin
g i
mp
act
- b
efo
re a
nd
aft
er
FA
S1
23
R
Accounting im
pact
(2002)
Num
ber
of
Fir
ms
Pre
Post
Pre
Post
Pre
Post
Pre
Post
Payout
vari
able
s
Regula
r div
idendT
ota
l ass
ets
11
2
12
4
09
4
11
1
09
5
11
3
03
0
04
9
Repurc
hase
Tota
l ass
ets
11
3
26
8
19
2
37
3
32
7
63
1
35
1
68
7
Tota
l payout
Tota
l ass
ets
22
4
39
1
28
5
48
4
42
2
74
4
38
1
73
6
Regula
r div
idendT
ota
l payout
643
7
469
8
474
0
341
1
284
5
195
4
82
5
74
5
Perc
enta
ge o
f executive c
om
pensa
tion
Sala
ry_
337
295
313
287
296
289
276
300
Bonus_
223
226
214
228
172
192
134
169
Option g
rant_
201
167
290
210
373
260
507
325
Rest
ricte
d s
tock g
rant_
116
194
98
180
89
176
43
155
294
294
294
294
1st Q
uart
ile2
nd Q
uart
ile3
rd Q
uart
ile4
th Q
uart
ile
01
2
03
5
09
3
55
1
46
Accounting impact
Number of Firms
By accounting impact quartile
1
2
3
4
Pre Post Pre Post
Payout variables
Regular dividendTotal assets 09 11 08 10
RepurchaseTotal assets 18 31 26 52
Total payoutTotal assets 28 43 34 62
Regular dividendTotal payout 428 357 386 265
Percentage of executive compensation
Salary_ 435 364 282 280
Bonus_ 226 214 179 202
Option grant_ 92 125 387 261
Restricted stock grant_ 125 188 80 174
Percentage of CEO compensation
Salary_(CEO) 485 364 260 259
Bonus_(CEO) 249 228 185 219
Option grant_(CEO) 10 127 406 275
Restricted stock grant_(CEO) 128 182 82 183
Panel E Firm characteristics by alternative treatment definition - before and
after FAS123R
Treated
25
19
997
223
250
256
268
10
177
71
Control
44
37
47
Table 2
Differential effect of FAS123R on the use of option-based compensation
Panel A Two-period first-difference regression
Prediction Coeff t-stat Coeff t-stat Coeff t-stat
Accounting impact rank - -0044 -628
Accounting impact rank=2 - -0044 -327
Accounting impact rank=3 - -0075 -468
Accounting impact rank=4 - -0140 -613
Treated - -0132 -875
ΔLog(size) 0061 202 0061 200 0063 214
ΔBook-to-market 0032 091 0032 092 0051 143
ΔLeverage -0157 -213 -0160 -218 -0111 -153
ΔAsset tangibility -0012 -014 -0020 -023 -0023 -026
ΔFree cash flow -0106 -095 -0108 -097 -0128 -117
ΔCash holding -0197 -211 -0193 -206 -0180 -194
ΔFive-year ROA volatility -0065 -031 -0056 -026 -0098 -047
ΔInstitutional ownership -0044 -091 -0043 -088 -0044 -092
ΔSales growth -0064 -102 -0065 -104 -0090 -153
ΔPast one-year stock return 0051 078 0052 080 0091 138
ΔLoss frequency 0056 207 0057 207 0047 179
Log(size) -0009 -210 -0009 -207 -0002 -035
Book-to-market -0015 -056 -0013 -049 0018 072
Leverage 0022 046 0023 048 0068 150
Asset tangibility 0033 077 0033 078 0053 128
Free cash flow 0227 202 0220 195 0127 117
Cash holding -0002 -004 0012 019 -0078 -141
Five-year ROA volatility -0451 -240 -0430 -228 -0509 -283
Institutional ownership -0123 -360 -0122 -359 -0100 -292
Sales growth -0041 -056 -0040 -055 -0089 -125
Past one-year stock return -0009 -015 -0006 -010 0078 125
Loss frequency 0055 174 0056 178 0054 173
Fixed effect
Standard error
Adj R-squared
Observations
Model (3)
Dependent variable ΔAvg Option grantTotal pay
Huber-White
0156
This table investigates whether the effect of FAS123R on the use of option-based pay varies with its potential accounting impact Panel A
reports the results of estimating three two-period first-differencing models where for each firm we average its characteristics in Pre- and
Post-FAS123R period The Pre-FAS123R period consists of fiscal year 2003 and 2004 the Post-FAS123R period covers fiscal year 2005-
2007 In all three specifications the dependent variable is the change of average Option grantTotal pay from Pre- to Post-FAS123R period
The main independent variable varies by model in Model (1) the Accounting impact rank is the quartile rank of implied option expensetotal
assets measured in 2002 (1=lowest 4=highest) In Model (2) Accounting impact rank=2 (3 4) is an indicator that takes value of one if the
firmrsquos Accounting impact rank equals 2 (3 4) In Model (3) we use an alternative treatment construction following Bakke et al (2015)
where Treated is an indicator that takes value of zero if the firm granted zero option to its CEO in both 2003 and 2004 or the firm began to
voluntarily expense option-based pay at fair value in 2002 or earlier and one otherwise For each control variable we include both its level in
the Pre-FAS123R period and its change across the two periods Panel B shows the results of estimating fixed effect models with firm-year
observations The dependent variable is the firm-year level Option grantTotal pay The main independent variables are the interactions of
Post-FAS123R indicator (Post) with Accounting Impact rank Accounting impact rank indicators and Treated respectively All models in
Penal A have industry fixed effects and the standard errors are Huber-White heteroscedasticity-consistent standard errors All models in
Penal B have firm fixed effects and year fixed effects and the standard errors are clustered at firm level All variables are defined in
Appendix The notation and indicates statistically significant at 10 5 and 1 level respectively
Model (1) Model (2)
11711171 1171
Industry Industry
Huber-White
0124
Huber-White
0123
Industry
48
Panel B Panel fixed effects regression
Prediction Coeff t-stat Coeff t-stat Coeff t-stat
Acc impact rank x Post - -0044 -807
Acc impact rank 2 x Post - -0046 -333
Acc impact rank 3 x Post - -0077 -526
Acc impact rank 4 x Post - -0137 -776
Treated x Post - -0145 -970
Log(size) 0034 221 0034 217 0036 229
Book-to-market 0018 084 0017 083 0015 070
Leverage -0004 -009 -0006 -013 -0007 -015
Asset tangibility 0007 012 0004 006 0011 018
Free cash flow -0074 -151 -0072 -146 -0078 -158
Cash holding -0048 -086 -0050 -090 -0006 -011
Five-year ROA volatility 0250 231 0239 219 0437 414
Institutional ownership 0043 159 0044 161 0041 150
Sales growth -0033 -168 -0034 -171 -0031 -158
Past one-year stock return 0067 221 0068 224 0063 204
Loss indicator 0023 209 0022 207 0024 222
Fixed effects
Standard error
Adj R-squared
Observations
Dependent variable Option grantTotal pay
5653 5653 5653
Clustered by firm
Firm Year
Clustered by firm
Firm Year
Clustered by firm
0523 0523 0526
Model (1) Model (2) Model (3)
Firm Year
49
Table 3
Effect of option-based compensation on dividend policy
Panel A Two-period first-difference regression
Prediction Coeff t-stat Coeff t-stat Coeff t-stat
Accounting impact rank + 0000 077
Accounting impact rank=2 + 0001 091
Accounting impact rank=3 + 0000 044
Accounting impact rank=4 + 0001 092
Treated + 0000 -026
ΔLog(size) 0000 -030 0000 -030 0000 -026
ΔBook-to-market -0002 -190 -0002 -193 -0002 -195
ΔLeverage -0002 -059 -0002 -057 -0002 -059
ΔAsset tangibility 0016 431 0016 429 0016 430
ΔFree cash flow 0017 373 0017 373 0017 375
ΔCash holding -0011 -288 -0011 -285 -0010 -282
ΔFive-year ROA volatility 0003 034 0002 032 0003 035
ΔInstitutional ownership -0002 -073 -0002 -073 -0002 -070
ΔSales growth -0001 -040 -0001 -037 -0001 -038
ΔPast one-year stock return 0002 077 0002 076 0002 070
ΔLoss frequency 0000 -048 0000 -045 0000 -046
Log(size) 0000 183 0000 182 0000 182
Book-to-market -0002 -227 -0002 -225 -0002 -284
Leverage -0001 -037 -0001 -039 -0001 -048
Asset tangibility 0003 179 0003 180 0003 176
Free cash flow 0017 291 0017 291 0017 300
Cash holding 0002 080 0002 077 0002 098
Five-year ROA volatility 0003 035 0002 033 0003 044
Institutional ownership -0001 -068 -0001 -068 -0001 -058
Sales growth -0004 -177 -0004 -175 -0004 -172
Past one-year stock return 0004 169 0004 167 0004 165
Loss frequency -0001 -111 -0001 -109 -0001 -102
Fixed effect
Standard error
Adj R-squared
Observations
Dependent variable ΔAvg Regular dividendTotal assets
This table investigates the causal effect of option-based pay on dividend policy by examining whether changes in dividend policy around
FAS123R vary with its potential accounting impact Panel A reports the results of estimating three two-period first-differencing models
where for each firm we average its characteristics in Pre- and Post-FAS123R period In all three specifications the dependent variable is
the change of average Regular dividendTotal assets from Pre- to Post-FAS123R period The main independent variable varies by model in
Model (1) the Accounting impact rank is the quartile rank of implied option expensetotal assets measured in 2002 (1=lowest 4=highest) In
Model (2) Accounting impact rank=2 (3 4) is an indicator that takes value of one if the firmrsquos Accounting impact rank equals 2 (3 4) In
Model (3) we use an alternative treatment construction following Bakke et al (2015) where Treated is an indicator that takes value of zero
if the firm granted zero option to its CEO in both 2003 and 2004 or the firm began to voluntarily expense option-based pay at fair value in
2002 or earlier and one otherwise For each control variable we include both its level in the Pre-FAS123R period and its change across the
two periods Panel B shows the results of estimating fixed effect models with firm-year observations The dependent variable is the firm-
year level Regular dividendTotal assets The main independent variables are the interactions of Post-FAS123R indicator (Post) with
Accounting Impact rank Accounting impact rank indicators and Treated respectively Panel C examines the intensity of dividend changes
among firms with nonzero dividend per share in 2003 or 2004 In particular we estimates the same three models as in Panel A(with the
same independent variables) but for five dependent variables the change of average Regular dividendTotal assets from Pre- to Post-
FAS123R period (as in Panel A) the percentage change of DPS (dividend per share) from Pre- to Post-FAS123R period and three
indicators denoting respectively whether the percentage change of DPS was greater than 20 40 and 60 Panel D reports four
robustness tests of the dividend intensity regression In each of them a set of possible confounding observations is removed (see Section 33
for details) Panel E compares the trends of dividend initiation and termination around FAS123R across four quartile groups ranked by
accounting impact All models in Panel A C and D have industry fixed effects and the standard errors are Huber-White heteroscedasticity-
consistent standard errors All models in Penal B have firm fixed effects and year fixed effects and the standard errors are clustered at
firm level All variables are defined in Appendix The notation and indicates statistically significant at 10 5 and 1 level
Industry Industry Industry
Model (1) Model (2) Model (3)
1171 1171 1171
Huber-White Huber-White Huber-White
0105 0104 0105
50
Panel B Panel fixed effects regression
Prediction Coeff t-stat Coeff t-stat Coeff t-stat
Acc impact rank x Post + 0000 122
Acc impact rank 2 x Post + 0001 110
Acc impact rank 3 x Post + 0001 094
Acc impact rank 4 x Post + 0001 129
Treated x Post + 0000 -012
Log(size) 0001 179 0001 179 0001 181
Book-to-market 0000 025 0000 024 0000 031
Leverage 0001 062 0001 064 0001 069
Asset tangibility 0009 360 0009 358 0009 363
Free cash flow 0002 090 0002 093 0002 092
Cash holding -0007 -295 -0007 -298 -0007 -298
Five-year ROA volatility 0001 041 0001 038 0000 -006
Institutional ownership 0000 -027 0000 -026 0000 -027
Sales growth 0000 053 0000 051 0000 044
Past one-year stock return 0001 089 0001 088 0001 078
Loss indicator 0000 -060 0000 -057 0000 -076
Fixed effects
Standard error
Adj R-squared
Observations
Dependent variable Regular dividendTotal assets
Model (1) Model (2) Model (3)
Firm Year Firm Year Firm Year
5653 5653 5653
Clustered by firm Clustered by firm Clustered by firm
0877 0877 0877
51
Panel C Intensity of dividend changes around FAS123R
Prediction Coeff t-stat Coeff t-stat Coeff t-stat
Accounting impact rank + 0000 065
Accounting impact rank=2 + 0000 048
Accounting impact rank=3 + 0000 026
Accounting impact rank=4 + 0002 080
Treated + 0001 063
Dependent var DPS pct change
Accounting impact rank + -0145 -072
Accounting impact rank=2 + 0018 006
Accounting impact rank=3 + -0177 -045
Accounting impact rank=4 + -0746 -100
Treated + -0407 -119
Accounting impact rank + 0029 095
Accounting impact rank=2 + 0040 074
Accounting impact rank=3 + 0092 139
Accounting impact rank=4 + 0008 007
Treated + -0007 -012
Accounting impact rank + 0024 076
Accounting impact rank=2 + 0047 088
Accounting impact rank=3 + 0079 114
Accounting impact rank=4 + -0003 -002
Treated + 0030 052
Accounting impact rank + 0030 098
Accounting impact rank=2 + 0078 155
Accounting impact rank=3 + 0085 130
Accounting impact rank=4 + 0014 012
Treated + -0006 -011
Control variables
Fixed effect
Standard error
Observations 572 572 572
Yes Yes Yes
Huber-White Huber-White Huber-White
Industry Industry Industry
Dependent var DPS pct
change gt60 indicator
Model (1) Model (2) Model (3)
Dependent var ΔAvg Regular
dividendAssets
Dependent var DPS pct
change gt20 indicator
Dependent var DPS pct
change gt40 indicator
52
Panel D Robustness tests for intensity of dividend changes around FAS123R
Prediction Coeff t-stat Coeff t-stat Coeff t-stat
Accounting impact rank + 0006 017
Accounting impact rank=2 + 0067 118
Accounting impact rank=3 + 0041 057
Accounting impact rank=4 + -0061 -049
Treated + 0022 035Observations
Accounting impact rank + 0009 027
Accounting impact rank=2 + 0058 106
Accounting impact rank=3 + 0032 043
Accounting impact rank=4 + -0032 -024
Treated + 0018 028
Observations
Accounting impact rank + 0030 089
Accounting impact rank=2 + 0039 071
Accounting impact rank=3 + 0122 168
Accounting impact rank=4 + -0063 -052
Treated + 0075 132
Observations
Accounting impact rank + 0008 023
Accounting impact rank=2 + 0023 042
Accounting impact rank=3 + 0048 064
Accounting impact rank=4 + -0042 -033
Treated + -0010 -016
Observations
Control variables
Fixed effect
Standard error
Exclude firms with stable
payout ratio from 2003 to 2004
506 506 506
Dependent variable DPS pct change gt40 indicator
Model (1) Model (2) Model (3)
Exclude voluntary expensers
519 519
Exclude firms in the top decile
of option reduction (02-04)
Exclude firms that accelerated
option vesting
504 504 504
517 517 517
519
Huber-White Huber-White Huber-White
Yes Yes Yes
Industry Industry Industry
53
Panel E Dividend initiation and termination rates around FAS123R
Pre FAS 123R
1 280 75 7 6 13 173
2 284 135 18 9 27 200
3 286 181 11 14 25 138
4 282 260 9 10 19 73
Total 1132 651 45 39 84 129
Post FAS 123R
1 275 63 4 4 8 127
2 280 116 9 9 18 155
3 276 152 9 3 12 79
4 263 223 5 1 6 27
Total 1094 554 27 17 44 79
Pre FAS 123R
1 280 205 2 0 2 10
2 284 149 7 1 8 54
3 286 105 0 0 0 00
4 282 22 0 0 0 00
Total 1132 481 9 1 10 21
Post FAS 123R
1 275 212 3 6 9 42
2 280 164 1 2 3 18
3 276 124 1 1 2 16
4 263 40 0 3 3 75
Total 1094 540 5 12 17 31
termination
in 2004
03-04
cumulative
03-04
cumulative
Quartile firms
with
dividend in
2004
termination
in 2005
termination
in 2006
05-06
cumulative
05-06
cumulative
Termination
Quartile firms
with
dividend in
2002
termination
in 2003
without
dividend in
2004
initiation in
2003
initiation in
2004
03-04
cumulative
03-04
cumulative firmsQuartile
firmsQuartile initiation in
2005
initiation in
2006
05-06
cumulative
05-06
cumulative
Initiation
without
dividend in
2002
54
Table 4
Effect of option-based compensation on repurchases
Panel A Two-period first-difference regression with total repurchase
Prediction Coeff t-stat Coeff t-stat Coeff t-stat
Accounting impact rank - 0002 122
Accounting impact rank=2 - 0002 071
Accounting impact rank=3 - 0005 123
Accounting impact rank=4 - 0007 102
Treated - 0014 365
Control variables
Fixed effect
Standard error
Adj R-squared
Observations
Panel B Two-period first-difference regression with net repurchase
Prediction Coeff t-stat Coeff t-stat Coeff t-stat
Accounting impact rank - 0003 166
Accounting impact rank=2 - 0002 051
Accounting impact rank=3 - 0006 165
Accounting impact rank=4 - 0009 137
Treated - 0010 300
Control variables
Fixed effect
Standard error
Adj R-squared
Observations
Panel C Two-period first-difference regression with repurchase adjusted for exercised options
Prediction Coeff t-stat Coeff t-stat Coeff t-stat
Accounting impact rank - 0001 056
Accounting impact rank=2 - 0002 062
Accounting impact rank=3 - 0007 172
Accounting impact rank=4 - -0001 -008
Treated - 0006 197
Control variables
Fixed effect
Standard error
Adj R-squared
Observations
Dependent variable ΔAvg RepurchaseTotal assets
This table investigates the causal effect of option-based pay on payout policy by examining whether the changes of repurchase around
FAS123R vary with its potential accounting impact Panel A reports the results of estimating three two-period first-differencing models
where for each firm we average its characteristics in Pre- and Post-FAS123R period In all three specifications the dependent variable is
the change of average RepurchaseTotal assets from Pre- to Post-FAS123R period The main independent variable varies by model in
Model (1) the Accounting impact rank is the quartile rank of implied option expensetotal assets measured in 2002 (1=lowest 4=highest)
In Model (2) Accounting impact rank=2 (3 4) is an indicator that takes value of one if the firmrsquos Accounting impact rank equals 2 (3 4)
In Model (3) we use an alternative treatment construction following Bakke et al (2015) where Treated is an indicator that takes value of
zero if the firm granted zero option to its CEO in both 2003 and 2004 or the firm began to voluntarily expense option-based pay at fair
value in 2002 or earlier and one otherwise Panel B reports the regressions with the change of Net repurchaseTotal assets as the
dependent variable and the same independent variable as in Panel A Panel C reports the regressions with the change of Adjusted
repurchaseTotal assets as the dependent variable and the same independent variable as in Panel A All models in Panel A B and C have
industry fixed effects and the standard errors are Huber-White heteroscedasticity-consistent standard errors All variables are defined in
Appendix The notation and indicates statistically significant at 10 5 and 1 level respectively
Model (1) Model (2) Model (3)
Yes Yes Yes
Industry Industry Industry
Huber-White Huber-White Huber-White
Dependent variable ΔAvg Net repurchaseTotal assets
1171 1171 1171
0238 0237 0245
Model (1) Model (2) Model (3)
Yes Yes Yes
Industry Industry Industry
Huber-White Huber-White Huber-White
Dependent variable ΔAvg Adjusted repurchaseTotal assets
0229 0229 0233
1171 1171 1171
Model (1) Model (2) Model (3)
Yes Yes Yes
Industry Industry Industry
Huber-White Huber-White Huber-White
0111 0112 0114
1168 1168 1168
55
Table 5
Effect of option-based compensation on payout mix
Panel A Two-period first-difference regression with total payout mix
Prediction Coeff t-stat Coeff t-stat Coeff t-stat
Accounting impact rank + 0006 028
Accounting impact rank=2 + 0018 045
Accounting impact rank=3 + -0001 -001
Accounting impact rank=4 + 0043 052
Treated + -0035 -094
Control variables
Fixed effect
Standard error
Adj R-squared
Observations
Panel B Two-period first-difference regression with net payout mix
Prediction Coeff t-stat Coeff t-stat Coeff t-stat
Accounting impact rank + -0002 -008
Accounting impact rank=2 + 0008 016
Accounting impact rank=3 + 0018 034
Accounting impact rank=4 + -0059 -055
Treated + -0050 -101
Control variables
Fixed effect
Standard error
Adj R-squared
Observations
0049 0043 0054
257 257 257
Industry Industry Industry
Huber-White Huber-White Huber-White
Dependent variable ΔAvg Regular dividendNet payout
Model (1) Model (2) Model (3)
Yes Yes Yes
0154 0151 0156
362 362 362
Industry Industry Industry
Huber-White Huber-White Huber-White
This table investigates the causal effect of option-based pay on payout mix for firms using both dividend and repurchase by examining
whether the changes of payout mix around FAS123R vary with its potential accounting impact Panel A reports the results of estimating
three two-period first-differencing models where for each firm we average its characteristics in Pre- and Post-FAS123R period In all three
specifications the dependent variable is the change of average Regular dividendTotal payout from Pre- to Post-FAS123R period The main
independent variable varies by model in Model (1) the Accounting impact rank is the quartile rank of implied option expensetotal assets
measured in 2002 (1=lowest 4=highest) In Model (2) Accounting impact rank=2 (3 4) is an indicator that takes value of one if the firmrsquos
Accounting impact rank equals 2 (3 4) In Model (3) we use an alternative treatment construction following Bakke et al (2015) where
Treated is an indicator that takes value of zero if the firm granted zero option to its CEO in both 2003 and 2004 or the firm began to
voluntarily expense option-based pay at fair value in 2002 or earlier and one otherwise Panel B reports the regressions with the change of
Regular dividendNet payout as the dependent variable and the same independent variables as in Panel A Panel A (Panel B) is based on
observations with nonzero regular dividend and repurchase (net repurchase) in both Pre- and Post-FAS123R period All models in Panel A
and B have industry fixed effects and the standard errors are Huber-White heteroscedasticity-consistent standard errors All variables are
defined in Appendix The notation and indicates statistically significant at 10 5 and 1 level respectively
Yes Yes Yes
Dependent variable ΔAvg Regular dividendTotal payout
Model (1) Model (2) Model (3)

32
we should find a positive association between Accounting Impact or Treated and the payout mix
defined as DividendsTotal Payout ratio Firms with a higher accounting-driven reduction in
option-based pay should have an increase (decrease) in the relative weight of dividends
(repurchases) to the total payout However as reported in Table 5 Panel A we fail to find a
significant association between Accounting Impact (column 1 and 2) or Treated (column 3) and
the change in payout mix The results are similar when we use Net Payout (dividends plus net
repurchases) instead of Total Payout in computing the payout mix (Panel B)
Overall the combined evidence in Tables 3-5 does not support the hypothesis that option-
based compensation has negative (positive) effect on dividends (repurchases) or that it causes
firms to replace dividends with repurchases
4 Conclusion
Prior literature has documented robust associations between option-based compensation and
payout policy yet it remains unclear whether this association reflcts a causal influence We
investigate the causal effect of option-based compensation on payout policy using the adoption of
FAS123R which resulted in a significant decrease in option grants making it a plausible
exogenous shock to the use of option-based pay To overcome the challenge of no control group
we exploit the fact that firms responded differently depending on the firm-specific accounting
impact as measured by the implied option expense disclosed in the footnotes prior to FAS123R
Firms with larger expected accounting impact curtailed option-based compensation much more
aggressively than firms with lower impact Using a sample of SampP 1500 firms we find no
evidence that firms with a larger accounting-induced decline in option compensation increased
dividends reduced repurchases or changed their payout composition contrary to the widely held
belief that option-based pay has a causal influence on payout policy
33
Appendix Variable Definitions and Data Sources
Accounting Impact Variables
Accounting impact Implied option expense (Compustat XINTOPT) divided by total assets
(Compustat AT) This variable is measured at fiscal year 2002 and is time-invariant
Accounting impact rank The quartile rank of Accounting impact (1=lowest 4=highest)
Payout Variables
Regular dividendTotal assets The numerator is total regular cash dividends in the fiscal year
from the distribution dataset in CRSP Regular cash dividends are identified by the distribution
codes 1212 1222 1232 or 1242 The denominator is one-year lagged total assets (Compustat
AT)
DPS Dividend per share (Compustat DVPSX_F)
DPS pct change The percentage change of average DPS from Pre- to Post-FAS123R period
DPS pct change gtX indicator A dummy variable that equals one if DPC pct change is greater
than X and zero otherwise
RepurchaseTotal assets The numerator is the repurchase of common equity which equals total
repurchase (Compustat PRSTK) minus the change in preferred stock redemption value
(Compustat PSTKRV) The denominator is one-year lagged total assets (Compustat AT)
Net repurchaseTotal assets Net repurchase removes the effect of share issuances The
construction follows Fama and French (2001) and Skinner (2008) if the firm uses the treasury
stock method for repurchase net repurchase equals the increase in common treasury stock
(Compustat TSTKC) if the firm uses the retirement method (when common treasury stock is zero
in the current and prior year) net repurchase equals total repurchases minus stock issuance
(Compustat SSTK) and change in preferred stock redemption value (Compustat PSTKRV)
When the above measures give negative value net repurchase is set to zero
Adjusted repurchaseTotal assets Adjusted repurchase removes from total repurchase the potential
effect of repurchasing exercised options This variable equals total repurchase of common stocks
minus the product between the number of options exercised (Compustat OPTEXD) and average
stock price during the year When the above measure gives negative value adjusted repurchase is
set to zero Since the number of options exercised is not available before 2003 we drop
observations in 2003 when we use this variable
34
Total payoutTotal assets the sum of Regular dividendTotal assets and RepurchaseTotal assets
Regular dividendTotal payout regular cash dividend divided by the sum of regular cash dividend
and repurchase from common equity In the two-period analysis (Pre- vs Post-FAS123R) we
separately sum the numerator and the denominator for each firm-period and then calculate the ratio
Regular dividendNet payout regular dividend divided by the sum of regular dividend and net
repurchase In the two-period analysis (Pre- vs Post-FAS123R) we separately sum the numerator
and the denominator for each firm-period and then calculate the ratio
Compensation Variables
Salary_$ Average salary (Execucomp SALARY) of the top 5 highest paid executives in $1000
Salary_ Average salary (Execucomp SALARY) divided by average total pay (Execucomp
TDC1) of the top 5 highest paid executives
Bonus_$ Average bonus (Execucomp BONUS) of the top 5 highest paid executives in $1000
Due to a data format change we add non-equity plan-based awards (Execucomp
NON_EQ_TARG) to this measure after 2006
Bonus_ Bonus_$ divided by average total pay (Execucomp TDC1) of the top 5 highest paid
executives
Option grant_$ Average option grant value (Execucomp OPTION_AWARDS_BLK_VALUE or
OPTION_AWARDS_FV) of the top 5 highest paid executives in $1000 Due to a data format
change we use OPTION_AWARDS_FV for this measure after 2006
Option grant_ Option grant_$ divided by average total pay (Execucomp TDC1) of the top 5
highest paid executives
Restricted stock grant_$ Average restricted stock grant value (Execucomp RSTKGRNT or
STOCK_AWARDS_FV) of the top 5 highest paid executives in $1000 Due to data format
change we use STOCK_AWARDS_FV for this measure after 2006
Restricted stock grant_ Restricted stock grant_$ divided by average total pay (Execucomp
TDC1) of the top 5 highest paid executives
Total pay_$ Average total pay (Execucomp TDC1) of the top 5 highest paid executives in $1000
35
Other Characteristics
Size The book value of total assets (Compustat AT) minus the book value of common equity
(Compustat CEQ) plus the market value of common equity from CRSP in $M
Log(size) the natural logarithm of size
Book-to-market the book value of common equity dividend by its market value
Leverage long term debt plus short term debt (Compustat DLTT + DLC) divided by total assets
Asset tangibility tangible assets (Compustat AT - INTAN) divided by total assets
Free cash flow Operating cash flow (Compustat OANCF) minus capital expenditure (Compustat
CAPX) then divided by lagged total assets
Cash holding Cash and short-term investments (Compustat CHE) divided by total assets
ROA volatility the standard deviation of returns on assets (operating income before tax divided by
lagged total assets) in the past five fiscal years
Institutional ownership the number of shares held by institutional investors divided by the number
of shares outstanding from Thomson Reuters Institutional Holdings database
Sales growth the growth rate of sales (Compustat SALE) from the prior year
Past stock return annual stock return from the prior year
Loss indicator a dummy variable taking value of one if the current net income is negative and
zero otherwise
36
References
Aboody David 1996 Market Valuation of Employee Stock Options Journal of Accounting and
Economics 22 357-391
Aboody David Barth Mary E and Ron Kasznik 2004 Firms Voluntary Recognition of Stock-
Based Compensation Expense Journal of Accounting Research 42 123ndash150
Aboody David and Ron Kasznik 2008 Executive stock-based compensation and firmsrsquo cash
payout the role of shareholdersrsquo tax-related payout preferences Review of Accounting Studies
13 216ndash251
Anantharaman Divya and Yong Gyu Lee 2014 Managerial risk taking incentives and corporate
pension policy Journal of Financial Economics 111 328ndash351
Baker Malcolm and Jeffrey Wurgler 2004 A catering theory of dividends Journal of Finance
59 1125-1165
Baker Malcolm and Jeffrey Wurgler 2016 Dividends as reference points a behavioral signaling
approach Review of Financial Studies 29 697-738
Bakke Tor-Erik Hamed Mahmudi Chitru Fernando and Jesus Salas 2015 The causal effect of
option pay on corporate risk management Journal of Financial Economics forthcoming
Balsam Steven Austin Reitenga and Jennifer Yin 2008 Option acceleration in response to SFAS
No 123 (R) Accounting Horizons 22 23-45
Bens Daniel and Steven Monahan 2008 Altering Investment Decisions to Manage Financial
Reporting Outcomes Asset-Backed Commercial Paper Conduits and FIN 46 Journal of
Accounting Research 46 1017-1055
Bens Daniel A Venky Nagar Douglas J Skinner and MH Franco Wong 2003 Employee stock
options eps dilution and stock repurchases Journal of Accounting and Economics 36 51ndash90
Bertrand Marianne Esther Duflo and Sendhil Mullainathan 2004 How much should we trust
differences-in-differences estimates The Quarterly Journal of Economics 119 249ndash275
Blouin Jennifer L Jana S Raedy and Douglas A Shackelford 2011 Dividends Share
Repurchases and Tax Clienteles Evidence from the 2003 Reductions in Shareholder Taxes
The Accounting Review 86 887-914
Brav Alon John R Graham Campbell R Harvey and Roni Michaely 2005 Payout policy in the
21st century Journal of Financial Economics 77 483ndash527
Brown Lawrence D and Yen-Jung Lee 2011 Changes in Option-Based Compensation Around
the Issuance of SFAS123R Journal of Business Finance amp Accounting 38 1053ndash109
37
Brown Jeffrey R Nellie Liang and Scott Weisbenner 2007 Executive financial incentives and
payout policy Firm responses to the 2003 dividend tax cut Journal of Finance 62 1935ndash
1965
Burns Natasha Brian McTier and Kristina Minnick 2015 Equity-incentive compensation and
payout policy in Europe Journal of Corporate Finance 30 85-97
Carter Mary Ellen and Luann J Lynch 2003 The Consequences of the FASBrsquos 1998 Proposal on
Accounting for Stock Option Repricing Journal of Accounting and Economics 35 51-72
Carter Mary Ellen Luann J Lynch and Irem Tuna 2007 The role of accounting in the design of
CEO equity compensation The Accounting Review 82 327ndash357
Chava Sudheer and Amiyatosh Purnanandam 2010 CEOs versus CFOs Incentives and
corporate policies Journal of Financial Economics 97 263ndash278
Chetty Raj and Emmanuel Saez 2005 Dividend taxes and corporate behavior Evidence from the
2003 dividend tax cut The Quarterly Journal of Economics 120 791ndash833
Choudhary Preeti Shivaram Rajgopal and Mohan Venkatachalam 2009 Accelerated vesting of
employee stock options in anticipation of FAS123R Journal of Accounting Research 47 105ndash
146
Christensen Hans B and Valeri Nikolaev 2009 Contracting on Mandatory Changes to GAAP
New Practice and Its Determinants Working Paper University of Chicago
Chu Yongqiang and Tao Ma 2015 How does management compensation affect bank risk taking
evidence from FAS 123R University of South Carolina Working Paper
Cuny Charles J Gerald S Martin and John J Puthenpurackal 2009 Stock options and total
payout Journal of Financial and Quantitative Analysis 44 391ndash410
DeAngelo Harry Linda DeAngelo and Douglas J Skinner 2000 Special Dividends and the
Evolution of Dividend Signaling Journal of Financial Economics 57 309-354
Dechow Patricia M Amy P Hutton and Richard G Sloan 1996 Economic consequences of
accounting for stock-based compensation Journal of Accounting Research 34 1ndash20
Edgerton J 2013 Four facts about dividend payouts and the 2003 tax cut International Tax and
Public Finance 20 769-784
Edmans Alex and Xavier Gabaix 2015 Executive compensation a modern primer Journal of
Economic Literature forthcoming
38
Fama Eugene F and Kenneth R French 2001 Disappearing dividends changing firm
characteristics or lower propensity to pay Journal of Financial Economics 60 3ndash43
Farre-Mensa Joan Roni Michaely and Martin C Schmalz 2014 Payout policy Annual Review
of Financial Economics 6 75ndash134
Fenn George W and Nellie Liang 2001 Corporate payout policy and managerial stock
incentives Journal of Financial Economics 60 45ndash72
Ferri Fabrizio and Tatiana Sandino 2009 The impact of shareholder activism on financial
reporting and compensation the case of employee stock options expensing The Accounting
Review 84 433ndash466
Floyd Eric Nan Li and Douglas J Skinner 2015 Payout policy through the financial crisis the
growth of repurchases and the resilience of dividends Journal of Financial Economics 118
299-316
Frydman Carola and Dirk Jenter 2010 CEO compensation Annual Review of Financial
Economics 2 75-102
Gipper Brandon 2015 Assessing the Effects of Disclosing Management Compensation Working
Paper University of Chicago
Gormley Todd David Matsa and Todd Milbourn 2013 CEO compensation and corporate risk
evidence from a natural experiment Journal of Accounting and Economics 56 79-101
Graham John Michelle Hanlon and Terry Shevlin 2011 Real effects of accounting rules
evidence from multinational firmsrsquo investment locations and profit repatriation decisions
Journal of Accounting Research 49 137-185
Graham John Campbell Harvey and Shiva Rajgopal 2005 The Economic implications of
corporate financial reporting Journal of Accounting and Economics 40 3-73
Greenspan Alan 2002 Testimony of Alan Greenspan before the Committee on Banking
Housing and Urban Affairs US Senate July 16 Washington DC Government Printing
Office
Grullon Gustavo and Roni Michaely 2002 Dividends Share Repurchases and the Substitution
Hypothesis Journal of Finance 57 1649-1684
Hail Luzi Ahmed Tahoun and Clare Wang 2014 Dividend Payouts and Information Shocks
Journal of Accounting Research 52 403-456
Hall Brian J and Kevin J Murphy 2002 Stock options for undiversified executives Journal of
Accounting amp Economics 33 3-42
39
Hall Brian J and Kevin J Murphy 2003 The trouble with stock options Journal of Economic
Perspectives 17 49ndash70
Hanlon Michelle and Jeffrey L Hoopes 2014 What do firms do when dividend tax rates change
An examination of alternative payout responses Journal of Financial Economics 114 105-
124
Hayes Rachel M Michael Lemmon and Mingming Qiu 2012 Stock options and managerial
incentives for risk taking Evidence from FAS123R Journal of Financial Economics 105
174ndash190
Heron Randall A Erik Lie 2007 Does backdating explain the stock price pattern around
executive stock option grants Journal of Financial Economics 83 271-295
Hribar Paul Nicole Thorne Jenkins and W Bruce Johnson 2006 Stock repurchases as an
earnings management device Journal of Accounting and Economics 41 3ndash27
Jensen Michael C 1986 Agency cost of free cash flow corporate finance and takeovers
American Economic Review 76 323-329
Jolls Christine 1998 Stock repurchases and incentive compensation NBER Working Paper No
w6467
Jung Boochun Woo-Jong Lee and Yanhua Sunny Yang 2016 The Impact of Dividend
Covenants on Investment and Operating Performance Journal of Business Finance amp
Accounting 43 414ndash447
Kahle Kathleen M 2002 When a buyback isnrsquot a buyback open market repurchases and
employee options Journal of Financial Economics 63 235ndash261
Lambert Richard A William N Lanen and David F Larcker 1989 Executive stock option plans
and corporate dividend policy Journal of Financial and Quantitative Analysis 24 409ndash425
Lintner John 1956 Distribution of incomes of corporations among dividends retained earnings
and taxes The American Economic Review 46 97-113
Low Angie 2009 Managerial risk-taking behavior and equity-based compensation Journal of
Financial Economics 92 470-490
Miller Merton H and Franco Modigliani 1961 Dividend policy growth and the valuation of
shares The Journal of Business 34 411ndash433
Minnick Kristina and Leonard Rosenthal 2015 Stealth compensation Do CEOs increase their
pay by influencing dividend policy Journal of Corporate Finance 25 435-454
40
Murphy Kevin J 1999 Executive compensation In O Ashenfelter and D Card (eds) North
Holland Handbook of Labor Economics Amsterdam Elsevier Science BV
Murphy Kevin J 2013 Executive compensation Where we are and how we got there Handbook
of the Economics of Finance Elsevier Science North Holland 211-356
Nikolaev Valeri 2010 Debt Covenants and Accounting Conservatism Journal of Accounting
Research 48 143-176
Puri Manju Joumlrg Rocholl and Sascha Steffen 2011 Global retail lending in the aftermath of the
US financial crisis Distinguishing between supply and demand effects Journal of Financial
Economics 100 556-578
Shue Kelly and Richard R Townsend 2014 Swinging for the fences Executive reactions to
quasi-random option grants Working Paper University of Chicago
Skinner Douglas J 2008 The evolving relation between earnings dividends and stock
repurchases Journal of Financial Economics 87 582-609
Weisbenner Scott J 2000 Corporate share repurchases in the 1990s What role do stock options
play FEDS Working Paper No 2000-29
Zhang Dan 2013 CEO dividend protection Working Paper BI Norwegian Business School
41
Figure 1 Trends of dividends and repurchases from 2003 to 2007 Panel A plots the average
Regular DividendTotal Assets of firms in the highest and lowest quartiles of Accounting Impact
measured in 2002 Panel B shows the average Total RepurchaseTotal Assets of firms in the
highest and lowest quartiles of Accounting Impact measured in 2002
Panel A Trends of regular dividends
Panel B Trends of total repurchases
00
05
10
15
20
2003 2004 2005 2006 2007
Regular DividendTotal Assets
Lowest Acc Impact
Highest Acc Impact
Pre Post
00
20
40
60
80
100
2003 2004 2005 2006 2007
Total Repurchase Total Assets
Lowest Acc Impact
Highest Acc Impact
Pre Post
42
Table 1
Summary Statistics
Panel A Firm characteristics - full sample
N Mean Std dev 25 pctl Median 75 pctl
Accounting impact (2002) 1176 173 366 022 052 163
Payout variablesRegular dividendTotal assets 5653 093 148 000 000 142
RepurchaseTotal assets 5653 394 710 000 035 500
Total payoutTotal assets 5653 488 748 000 175 666
Regular dividendTotal payout 4091 3874 4057 000 2237 8833
Level of executive compensation (in $1000)
Salary_$ 5653 450 190 314 409 544
Bonus_$ 5653 476 616 122 295 586
Option grant_$ 5653 791 1137 62 384 1002
Restricted stock grant_$ 5653 458 866 0 58 518
Total pay_$ 5653 2481 2475 890 1647 3074
Percentage of executive compensation
Salary_ 5653 296 183 165 251 382
Bonus_ 5653 197 148 97 177 268
Option grant_ 5653 283 235 67 256 445
Restricted stock grant_ 5653 141 180 00 41 249
Control variables
Size ($M) 5653 11086 27294 1017 2459 8117
Log(size) 5653 7985 1565 6925 7808 9002
Book-to-market 5653 0445 0287 0251 0388 0578
Leverage 5653 0202 0172 0038 0187 0309
Asset tangibility 5653 0806 0184 0691 0853 0965
Free cash flow 5653 0059 0091 0013 0059 0108
Cash holding 5653 0166 0172 0034 0100 0247
ROA volatility 5653 0056 0056 0021 0038 0070
Institutional ownership 5653 0753 0202 0639 0795 0910
Sales growth 5653 0121 0189 0028 0096 0183
Past stock return 5653 0094 0183 -0012 0094 0199
Loss indicator 5653 0164 0370 0000 0000 0000
This table presents summary statistics Panel A shows the descriptive statistics of payout variables compensation
variables and other firm characteristics for the full sample Accounting impact is the implied option expense
measured at fiscal year 2002 All other variables are measured at firm-year level from fiscal year 2003 to 2007
resulting in 5653 firm-year observations (except for Regular dividendTotal Payout which can be measured only
for the 4901 firm-year observations with Total payout greater than zero) Panel B shows the pairwise correlations
between main variables at firm-year level Panel C compares payout variables compensation variables and other
firm characteristics before and after FAS123R The Pre-FAS123R period consists of fiscal year 2003 and 2004
the Post-FAS123R period covers fiscal year 2005-2007 Panel D compares the trends of payout and compensation
variables around FAS123R across four quartile groups ranked by 2002 accounting impact Panel E compares the
trends of payout and compensation variables around FAS123R between the treated and control group under the
alternative treatment definition in Bakke et al (2015) (see Section 22) All variables are defined in Appendix The
notation and in Panel C indicates statistically significant at 10 5 and 1 level in T-tests for equal
means respectively
43
Pa
nel
B
Pea
rso
n c
orr
ela
tio
ns
Reg div
Repurchase
Total payout
Salary_
Bonus_
Option_
RS_
Log(size)
BM
Leverage
Tangibility
FCF
Cash holdingROA vol
Inst own
Sales growth
Past ret
urn
Loss
Reg
div
10
0
Repurc
hase
01
610
0
Tota
l payout
03
509
810
0
Sala
ry_
-0
10
-01
8-0
19
10
0
Bonus_
00
700
100
3-0
01
10
0
Option_
-0
10
00
900
6-0
41
-03
510
0
RS
_
01
000
901
0-0
32
-01
1-0
40
10
0
Log(s
ize)
03
101
802
3-0
56
01
101
202
210
0
BM
-02
1-0
28
-03
103
0-0
03
-02
000
0-0
33
10
0
Levera
ge
-00
1-0
08
-00
8-0
05
00
6-0
11
00
801
9-0
03
10
0
Tangib
ility
00
200
100
101
200
1-0
05
-00
6-0
12
-00
4-0
18
10
0
FC
F02
203
703
9-0
20
00
901
1-0
01
02
4-0
32
-02
1-0
16
10
0
Cash
hold
ing
-01
301
000
700
2-0
14
02
2-0
10
-02
3-0
16
-03
502
901
210
0
RO
A v
ol
-01
5-0
04
-00
700
4-0
11
01
9-0
11
-02
3-0
08
-01
101
2-0
02
03
910
0
Inst
ow
n
-00
901
401
1-0
17
00
200
701
200
7-0
01
00
3-0
08
01
4-0
06
-01
110
0
Sale
s gro
wth
-00
8-0
04
-00
6-0
15
00
501
0-0
02
00
7-0
16
-00
3-0
08
01
300
201
400
410
0
Past
retu
rn00
901
301
4-0
18
01
5-0
01
00
301
6-0
29
-01
000
102
7-0
14
-01
001
602
710
0
Loss
-02
0-0
19
-02
201
8-0
18
00
4-0
05
-02
601
901
300
6-0
41
01
702
3-0
16
-01
8-0
40
10
0
44
Panel C Firm characteristics - before and after FAS123R
Pre FAS 123R Post FAS 123R Difference
Payout variables
Regular dividendTotal assets 083 099 016
RepurchaseTotal assets 245 490 245
Total payoutTotal assets 328 589 261
Regular dividendTotal payout 3914 2790 -1124
Level of executive compensation (in $1000)
Salary_$ 426 463 37
Bonus_$ 418 505 87
Option grant_$ 896 707 -191
Restricted stock grant_$ 269 574 305
Total pay_$ 2263 2584 321
Percentage of executive compensation
Salary_ 305 293 -12
Bonus_ 186 204 18
Option grant_ 343 240 -103
Restricted stock grant_ 87 176 89
Control variables
Size ($M) 9671 11631 1960
Log(size) 7860 8035 0175
Book-to-market 0437 0453 0016
Leverage 0201 0203 0002
Asset tangibility 0822 0793 -0029
Free cash flow 0061 0057 -0004
Cash holding 0175 0159 -0016
ROA volatility 0067 0048 -0019
Institutional ownership 0712 0781 0069
Sales growth 0137 0108 -0029
Past stock return 0080 0101 0021
Loss indicator 0173 0159 -0014
45
Pa
nel
D
Fir
m c
ha
racte
rist
ics
by q
ua
rtil
e o
f a
cco
un
tin
g i
mp
act
- b
efo
re a
nd
aft
er
FA
S1
23
R
Accounting im
pact
(2002)
Num
ber
of
Fir
ms
Pre
Post
Pre
Post
Pre
Post
Pre
Post
Payout
vari
able
s
Regula
r div
idendT
ota
l ass
ets
11
2
12
4
09
4
11
1
09
5
11
3
03
0
04
9
Repurc
hase
Tota
l ass
ets
11
3
26
8
19
2
37
3
32
7
63
1
35
1
68
7
Tota
l payout
Tota
l ass
ets
22
4
39
1
28
5
48
4
42
2
74
4
38
1
73
6
Regula
r div
idendT
ota
l payout
643
7
469
8
474
0
341
1
284
5
195
4
82
5
74
5
Perc
enta
ge o
f executive c
om
pensa
tion
Sala
ry_
337
295
313
287
296
289
276
300
Bonus_
223
226
214
228
172
192
134
169
Option g
rant_
201
167
290
210
373
260
507
325
Rest
ricte
d s
tock g
rant_
116
194
98
180
89
176
43
155
294
294
294
294
1st Q
uart
ile2
nd Q
uart
ile3
rd Q
uart
ile4
th Q
uart
ile
01
2
03
5
09
3
55
1
46
Accounting impact
Number of Firms
By accounting impact quartile
1
2
3
4
Pre Post Pre Post
Payout variables
Regular dividendTotal assets 09 11 08 10
RepurchaseTotal assets 18 31 26 52
Total payoutTotal assets 28 43 34 62
Regular dividendTotal payout 428 357 386 265
Percentage of executive compensation
Salary_ 435 364 282 280
Bonus_ 226 214 179 202
Option grant_ 92 125 387 261
Restricted stock grant_ 125 188 80 174
Percentage of CEO compensation
Salary_(CEO) 485 364 260 259
Bonus_(CEO) 249 228 185 219
Option grant_(CEO) 10 127 406 275
Restricted stock grant_(CEO) 128 182 82 183
Panel E Firm characteristics by alternative treatment definition - before and
after FAS123R
Treated
25
19
997
223
250
256
268
10
177
71
Control
44
37
47
Table 2
Differential effect of FAS123R on the use of option-based compensation
Panel A Two-period first-difference regression
Prediction Coeff t-stat Coeff t-stat Coeff t-stat
Accounting impact rank - -0044 -628
Accounting impact rank=2 - -0044 -327
Accounting impact rank=3 - -0075 -468
Accounting impact rank=4 - -0140 -613
Treated - -0132 -875
ΔLog(size) 0061 202 0061 200 0063 214
ΔBook-to-market 0032 091 0032 092 0051 143
ΔLeverage -0157 -213 -0160 -218 -0111 -153
ΔAsset tangibility -0012 -014 -0020 -023 -0023 -026
ΔFree cash flow -0106 -095 -0108 -097 -0128 -117
ΔCash holding -0197 -211 -0193 -206 -0180 -194
ΔFive-year ROA volatility -0065 -031 -0056 -026 -0098 -047
ΔInstitutional ownership -0044 -091 -0043 -088 -0044 -092
ΔSales growth -0064 -102 -0065 -104 -0090 -153
ΔPast one-year stock return 0051 078 0052 080 0091 138
ΔLoss frequency 0056 207 0057 207 0047 179
Log(size) -0009 -210 -0009 -207 -0002 -035
Book-to-market -0015 -056 -0013 -049 0018 072
Leverage 0022 046 0023 048 0068 150
Asset tangibility 0033 077 0033 078 0053 128
Free cash flow 0227 202 0220 195 0127 117
Cash holding -0002 -004 0012 019 -0078 -141
Five-year ROA volatility -0451 -240 -0430 -228 -0509 -283
Institutional ownership -0123 -360 -0122 -359 -0100 -292
Sales growth -0041 -056 -0040 -055 -0089 -125
Past one-year stock return -0009 -015 -0006 -010 0078 125
Loss frequency 0055 174 0056 178 0054 173
Fixed effect
Standard error
Adj R-squared
Observations
Model (3)
Dependent variable ΔAvg Option grantTotal pay
Huber-White
0156
This table investigates whether the effect of FAS123R on the use of option-based pay varies with its potential accounting impact Panel A
reports the results of estimating three two-period first-differencing models where for each firm we average its characteristics in Pre- and
Post-FAS123R period The Pre-FAS123R period consists of fiscal year 2003 and 2004 the Post-FAS123R period covers fiscal year 2005-
2007 In all three specifications the dependent variable is the change of average Option grantTotal pay from Pre- to Post-FAS123R period
The main independent variable varies by model in Model (1) the Accounting impact rank is the quartile rank of implied option expensetotal
assets measured in 2002 (1=lowest 4=highest) In Model (2) Accounting impact rank=2 (3 4) is an indicator that takes value of one if the
firmrsquos Accounting impact rank equals 2 (3 4) In Model (3) we use an alternative treatment construction following Bakke et al (2015)
where Treated is an indicator that takes value of zero if the firm granted zero option to its CEO in both 2003 and 2004 or the firm began to
voluntarily expense option-based pay at fair value in 2002 or earlier and one otherwise For each control variable we include both its level in
the Pre-FAS123R period and its change across the two periods Panel B shows the results of estimating fixed effect models with firm-year
observations The dependent variable is the firm-year level Option grantTotal pay The main independent variables are the interactions of
Post-FAS123R indicator (Post) with Accounting Impact rank Accounting impact rank indicators and Treated respectively All models in
Penal A have industry fixed effects and the standard errors are Huber-White heteroscedasticity-consistent standard errors All models in
Penal B have firm fixed effects and year fixed effects and the standard errors are clustered at firm level All variables are defined in
Appendix The notation and indicates statistically significant at 10 5 and 1 level respectively
Model (1) Model (2)
11711171 1171
Industry Industry
Huber-White
0124
Huber-White
0123
Industry
48
Panel B Panel fixed effects regression
Prediction Coeff t-stat Coeff t-stat Coeff t-stat
Acc impact rank x Post - -0044 -807
Acc impact rank 2 x Post - -0046 -333
Acc impact rank 3 x Post - -0077 -526
Acc impact rank 4 x Post - -0137 -776
Treated x Post - -0145 -970
Log(size) 0034 221 0034 217 0036 229
Book-to-market 0018 084 0017 083 0015 070
Leverage -0004 -009 -0006 -013 -0007 -015
Asset tangibility 0007 012 0004 006 0011 018
Free cash flow -0074 -151 -0072 -146 -0078 -158
Cash holding -0048 -086 -0050 -090 -0006 -011
Five-year ROA volatility 0250 231 0239 219 0437 414
Institutional ownership 0043 159 0044 161 0041 150
Sales growth -0033 -168 -0034 -171 -0031 -158
Past one-year stock return 0067 221 0068 224 0063 204
Loss indicator 0023 209 0022 207 0024 222
Fixed effects
Standard error
Adj R-squared
Observations
Dependent variable Option grantTotal pay
5653 5653 5653
Clustered by firm
Firm Year
Clustered by firm
Firm Year
Clustered by firm
0523 0523 0526
Model (1) Model (2) Model (3)
Firm Year
49
Table 3
Effect of option-based compensation on dividend policy
Panel A Two-period first-difference regression
Prediction Coeff t-stat Coeff t-stat Coeff t-stat
Accounting impact rank + 0000 077
Accounting impact rank=2 + 0001 091
Accounting impact rank=3 + 0000 044
Accounting impact rank=4 + 0001 092
Treated + 0000 -026
ΔLog(size) 0000 -030 0000 -030 0000 -026
ΔBook-to-market -0002 -190 -0002 -193 -0002 -195
ΔLeverage -0002 -059 -0002 -057 -0002 -059
ΔAsset tangibility 0016 431 0016 429 0016 430
ΔFree cash flow 0017 373 0017 373 0017 375
ΔCash holding -0011 -288 -0011 -285 -0010 -282
ΔFive-year ROA volatility 0003 034 0002 032 0003 035
ΔInstitutional ownership -0002 -073 -0002 -073 -0002 -070
ΔSales growth -0001 -040 -0001 -037 -0001 -038
ΔPast one-year stock return 0002 077 0002 076 0002 070
ΔLoss frequency 0000 -048 0000 -045 0000 -046
Log(size) 0000 183 0000 182 0000 182
Book-to-market -0002 -227 -0002 -225 -0002 -284
Leverage -0001 -037 -0001 -039 -0001 -048
Asset tangibility 0003 179 0003 180 0003 176
Free cash flow 0017 291 0017 291 0017 300
Cash holding 0002 080 0002 077 0002 098
Five-year ROA volatility 0003 035 0002 033 0003 044
Institutional ownership -0001 -068 -0001 -068 -0001 -058
Sales growth -0004 -177 -0004 -175 -0004 -172
Past one-year stock return 0004 169 0004 167 0004 165
Loss frequency -0001 -111 -0001 -109 -0001 -102
Fixed effect
Standard error
Adj R-squared
Observations
Dependent variable ΔAvg Regular dividendTotal assets
This table investigates the causal effect of option-based pay on dividend policy by examining whether changes in dividend policy around
FAS123R vary with its potential accounting impact Panel A reports the results of estimating three two-period first-differencing models
where for each firm we average its characteristics in Pre- and Post-FAS123R period In all three specifications the dependent variable is
the change of average Regular dividendTotal assets from Pre- to Post-FAS123R period The main independent variable varies by model in
Model (1) the Accounting impact rank is the quartile rank of implied option expensetotal assets measured in 2002 (1=lowest 4=highest) In
Model (2) Accounting impact rank=2 (3 4) is an indicator that takes value of one if the firmrsquos Accounting impact rank equals 2 (3 4) In
Model (3) we use an alternative treatment construction following Bakke et al (2015) where Treated is an indicator that takes value of zero
if the firm granted zero option to its CEO in both 2003 and 2004 or the firm began to voluntarily expense option-based pay at fair value in
2002 or earlier and one otherwise For each control variable we include both its level in the Pre-FAS123R period and its change across the
two periods Panel B shows the results of estimating fixed effect models with firm-year observations The dependent variable is the firm-
year level Regular dividendTotal assets The main independent variables are the interactions of Post-FAS123R indicator (Post) with
Accounting Impact rank Accounting impact rank indicators and Treated respectively Panel C examines the intensity of dividend changes
among firms with nonzero dividend per share in 2003 or 2004 In particular we estimates the same three models as in Panel A(with the
same independent variables) but for five dependent variables the change of average Regular dividendTotal assets from Pre- to Post-
FAS123R period (as in Panel A) the percentage change of DPS (dividend per share) from Pre- to Post-FAS123R period and three
indicators denoting respectively whether the percentage change of DPS was greater than 20 40 and 60 Panel D reports four
robustness tests of the dividend intensity regression In each of them a set of possible confounding observations is removed (see Section 33
for details) Panel E compares the trends of dividend initiation and termination around FAS123R across four quartile groups ranked by
accounting impact All models in Panel A C and D have industry fixed effects and the standard errors are Huber-White heteroscedasticity-
consistent standard errors All models in Penal B have firm fixed effects and year fixed effects and the standard errors are clustered at
firm level All variables are defined in Appendix The notation and indicates statistically significant at 10 5 and 1 level
Industry Industry Industry
Model (1) Model (2) Model (3)
1171 1171 1171
Huber-White Huber-White Huber-White
0105 0104 0105
50
Panel B Panel fixed effects regression
Prediction Coeff t-stat Coeff t-stat Coeff t-stat
Acc impact rank x Post + 0000 122
Acc impact rank 2 x Post + 0001 110
Acc impact rank 3 x Post + 0001 094
Acc impact rank 4 x Post + 0001 129
Treated x Post + 0000 -012
Log(size) 0001 179 0001 179 0001 181
Book-to-market 0000 025 0000 024 0000 031
Leverage 0001 062 0001 064 0001 069
Asset tangibility 0009 360 0009 358 0009 363
Free cash flow 0002 090 0002 093 0002 092
Cash holding -0007 -295 -0007 -298 -0007 -298
Five-year ROA volatility 0001 041 0001 038 0000 -006
Institutional ownership 0000 -027 0000 -026 0000 -027
Sales growth 0000 053 0000 051 0000 044
Past one-year stock return 0001 089 0001 088 0001 078
Loss indicator 0000 -060 0000 -057 0000 -076
Fixed effects
Standard error
Adj R-squared
Observations
Dependent variable Regular dividendTotal assets
Model (1) Model (2) Model (3)
Firm Year Firm Year Firm Year
5653 5653 5653
Clustered by firm Clustered by firm Clustered by firm
0877 0877 0877
51
Panel C Intensity of dividend changes around FAS123R
Prediction Coeff t-stat Coeff t-stat Coeff t-stat
Accounting impact rank + 0000 065
Accounting impact rank=2 + 0000 048
Accounting impact rank=3 + 0000 026
Accounting impact rank=4 + 0002 080
Treated + 0001 063
Dependent var DPS pct change
Accounting impact rank + -0145 -072
Accounting impact rank=2 + 0018 006
Accounting impact rank=3 + -0177 -045
Accounting impact rank=4 + -0746 -100
Treated + -0407 -119
Accounting impact rank + 0029 095
Accounting impact rank=2 + 0040 074
Accounting impact rank=3 + 0092 139
Accounting impact rank=4 + 0008 007
Treated + -0007 -012
Accounting impact rank + 0024 076
Accounting impact rank=2 + 0047 088
Accounting impact rank=3 + 0079 114
Accounting impact rank=4 + -0003 -002
Treated + 0030 052
Accounting impact rank + 0030 098
Accounting impact rank=2 + 0078 155
Accounting impact rank=3 + 0085 130
Accounting impact rank=4 + 0014 012
Treated + -0006 -011
Control variables
Fixed effect
Standard error
Observations 572 572 572
Yes Yes Yes
Huber-White Huber-White Huber-White
Industry Industry Industry
Dependent var DPS pct
change gt60 indicator
Model (1) Model (2) Model (3)
Dependent var ΔAvg Regular
dividendAssets
Dependent var DPS pct
change gt20 indicator
Dependent var DPS pct
change gt40 indicator
52
Panel D Robustness tests for intensity of dividend changes around FAS123R
Prediction Coeff t-stat Coeff t-stat Coeff t-stat
Accounting impact rank + 0006 017
Accounting impact rank=2 + 0067 118
Accounting impact rank=3 + 0041 057
Accounting impact rank=4 + -0061 -049
Treated + 0022 035Observations
Accounting impact rank + 0009 027
Accounting impact rank=2 + 0058 106
Accounting impact rank=3 + 0032 043
Accounting impact rank=4 + -0032 -024
Treated + 0018 028
Observations
Accounting impact rank + 0030 089
Accounting impact rank=2 + 0039 071
Accounting impact rank=3 + 0122 168
Accounting impact rank=4 + -0063 -052
Treated + 0075 132
Observations
Accounting impact rank + 0008 023
Accounting impact rank=2 + 0023 042
Accounting impact rank=3 + 0048 064
Accounting impact rank=4 + -0042 -033
Treated + -0010 -016
Observations
Control variables
Fixed effect
Standard error
Exclude firms with stable
payout ratio from 2003 to 2004
506 506 506
Dependent variable DPS pct change gt40 indicator
Model (1) Model (2) Model (3)
Exclude voluntary expensers
519 519
Exclude firms in the top decile
of option reduction (02-04)
Exclude firms that accelerated
option vesting
504 504 504
517 517 517
519
Huber-White Huber-White Huber-White
Yes Yes Yes
Industry Industry Industry
53
Panel E Dividend initiation and termination rates around FAS123R
Pre FAS 123R
1 280 75 7 6 13 173
2 284 135 18 9 27 200
3 286 181 11 14 25 138
4 282 260 9 10 19 73
Total 1132 651 45 39 84 129
Post FAS 123R
1 275 63 4 4 8 127
2 280 116 9 9 18 155
3 276 152 9 3 12 79
4 263 223 5 1 6 27
Total 1094 554 27 17 44 79
Pre FAS 123R
1 280 205 2 0 2 10
2 284 149 7 1 8 54
3 286 105 0 0 0 00
4 282 22 0 0 0 00
Total 1132 481 9 1 10 21
Post FAS 123R
1 275 212 3 6 9 42
2 280 164 1 2 3 18
3 276 124 1 1 2 16
4 263 40 0 3 3 75
Total 1094 540 5 12 17 31
termination
in 2004
03-04
cumulative
03-04
cumulative
Quartile firms
with
dividend in
2004
termination
in 2005
termination
in 2006
05-06
cumulative
05-06
cumulative
Termination
Quartile firms
with
dividend in
2002
termination
in 2003
without
dividend in
2004
initiation in
2003
initiation in
2004
03-04
cumulative
03-04
cumulative firmsQuartile
firmsQuartile initiation in
2005
initiation in
2006
05-06
cumulative
05-06
cumulative
Initiation
without
dividend in
2002
54
Table 4
Effect of option-based compensation on repurchases
Panel A Two-period first-difference regression with total repurchase
Prediction Coeff t-stat Coeff t-stat Coeff t-stat
Accounting impact rank - 0002 122
Accounting impact rank=2 - 0002 071
Accounting impact rank=3 - 0005 123
Accounting impact rank=4 - 0007 102
Treated - 0014 365
Control variables
Fixed effect
Standard error
Adj R-squared
Observations
Panel B Two-period first-difference regression with net repurchase
Prediction Coeff t-stat Coeff t-stat Coeff t-stat
Accounting impact rank - 0003 166
Accounting impact rank=2 - 0002 051
Accounting impact rank=3 - 0006 165
Accounting impact rank=4 - 0009 137
Treated - 0010 300
Control variables
Fixed effect
Standard error
Adj R-squared
Observations
Panel C Two-period first-difference regression with repurchase adjusted for exercised options
Prediction Coeff t-stat Coeff t-stat Coeff t-stat
Accounting impact rank - 0001 056
Accounting impact rank=2 - 0002 062
Accounting impact rank=3 - 0007 172
Accounting impact rank=4 - -0001 -008
Treated - 0006 197
Control variables
Fixed effect
Standard error
Adj R-squared
Observations
Dependent variable ΔAvg RepurchaseTotal assets
This table investigates the causal effect of option-based pay on payout policy by examining whether the changes of repurchase around
FAS123R vary with its potential accounting impact Panel A reports the results of estimating three two-period first-differencing models
where for each firm we average its characteristics in Pre- and Post-FAS123R period In all three specifications the dependent variable is
the change of average RepurchaseTotal assets from Pre- to Post-FAS123R period The main independent variable varies by model in
Model (1) the Accounting impact rank is the quartile rank of implied option expensetotal assets measured in 2002 (1=lowest 4=highest)
In Model (2) Accounting impact rank=2 (3 4) is an indicator that takes value of one if the firmrsquos Accounting impact rank equals 2 (3 4)
In Model (3) we use an alternative treatment construction following Bakke et al (2015) where Treated is an indicator that takes value of
zero if the firm granted zero option to its CEO in both 2003 and 2004 or the firm began to voluntarily expense option-based pay at fair
value in 2002 or earlier and one otherwise Panel B reports the regressions with the change of Net repurchaseTotal assets as the
dependent variable and the same independent variable as in Panel A Panel C reports the regressions with the change of Adjusted
repurchaseTotal assets as the dependent variable and the same independent variable as in Panel A All models in Panel A B and C have
industry fixed effects and the standard errors are Huber-White heteroscedasticity-consistent standard errors All variables are defined in
Appendix The notation and indicates statistically significant at 10 5 and 1 level respectively
Model (1) Model (2) Model (3)
Yes Yes Yes
Industry Industry Industry
Huber-White Huber-White Huber-White
Dependent variable ΔAvg Net repurchaseTotal assets
1171 1171 1171
0238 0237 0245
Model (1) Model (2) Model (3)
Yes Yes Yes
Industry Industry Industry
Huber-White Huber-White Huber-White
Dependent variable ΔAvg Adjusted repurchaseTotal assets
0229 0229 0233
1171 1171 1171
Model (1) Model (2) Model (3)
Yes Yes Yes
Industry Industry Industry
Huber-White Huber-White Huber-White
0111 0112 0114
1168 1168 1168
55
Table 5
Effect of option-based compensation on payout mix
Panel A Two-period first-difference regression with total payout mix
Prediction Coeff t-stat Coeff t-stat Coeff t-stat
Accounting impact rank + 0006 028
Accounting impact rank=2 + 0018 045
Accounting impact rank=3 + -0001 -001
Accounting impact rank=4 + 0043 052
Treated + -0035 -094
Control variables
Fixed effect
Standard error
Adj R-squared
Observations
Panel B Two-period first-difference regression with net payout mix
Prediction Coeff t-stat Coeff t-stat Coeff t-stat
Accounting impact rank + -0002 -008
Accounting impact rank=2 + 0008 016
Accounting impact rank=3 + 0018 034
Accounting impact rank=4 + -0059 -055
Treated + -0050 -101
Control variables
Fixed effect
Standard error
Adj R-squared
Observations
0049 0043 0054
257 257 257
Industry Industry Industry
Huber-White Huber-White Huber-White
Dependent variable ΔAvg Regular dividendNet payout
Model (1) Model (2) Model (3)
Yes Yes Yes
0154 0151 0156
362 362 362
Industry Industry Industry
Huber-White Huber-White Huber-White
This table investigates the causal effect of option-based pay on payout mix for firms using both dividend and repurchase by examining
whether the changes of payout mix around FAS123R vary with its potential accounting impact Panel A reports the results of estimating
three two-period first-differencing models where for each firm we average its characteristics in Pre- and Post-FAS123R period In all three
specifications the dependent variable is the change of average Regular dividendTotal payout from Pre- to Post-FAS123R period The main
independent variable varies by model in Model (1) the Accounting impact rank is the quartile rank of implied option expensetotal assets
measured in 2002 (1=lowest 4=highest) In Model (2) Accounting impact rank=2 (3 4) is an indicator that takes value of one if the firmrsquos
Accounting impact rank equals 2 (3 4) In Model (3) we use an alternative treatment construction following Bakke et al (2015) where
Treated is an indicator that takes value of zero if the firm granted zero option to its CEO in both 2003 and 2004 or the firm began to
voluntarily expense option-based pay at fair value in 2002 or earlier and one otherwise Panel B reports the regressions with the change of
Regular dividendNet payout as the dependent variable and the same independent variables as in Panel A Panel A (Panel B) is based on
observations with nonzero regular dividend and repurchase (net repurchase) in both Pre- and Post-FAS123R period All models in Panel A
and B have industry fixed effects and the standard errors are Huber-White heteroscedasticity-consistent standard errors All variables are
defined in Appendix The notation and indicates statistically significant at 10 5 and 1 level respectively
Yes Yes Yes
Dependent variable ΔAvg Regular dividendTotal payout
Model (1) Model (2) Model (3)

33
Appendix Variable Definitions and Data Sources
Accounting Impact Variables
Accounting impact Implied option expense (Compustat XINTOPT) divided by total assets
(Compustat AT) This variable is measured at fiscal year 2002 and is time-invariant
Accounting impact rank The quartile rank of Accounting impact (1=lowest 4=highest)
Payout Variables
Regular dividendTotal assets The numerator is total regular cash dividends in the fiscal year
from the distribution dataset in CRSP Regular cash dividends are identified by the distribution
codes 1212 1222 1232 or 1242 The denominator is one-year lagged total assets (Compustat
AT)
DPS Dividend per share (Compustat DVPSX_F)
DPS pct change The percentage change of average DPS from Pre- to Post-FAS123R period
DPS pct change gtX indicator A dummy variable that equals one if DPC pct change is greater
than X and zero otherwise
RepurchaseTotal assets The numerator is the repurchase of common equity which equals total
repurchase (Compustat PRSTK) minus the change in preferred stock redemption value
(Compustat PSTKRV) The denominator is one-year lagged total assets (Compustat AT)
Net repurchaseTotal assets Net repurchase removes the effect of share issuances The
construction follows Fama and French (2001) and Skinner (2008) if the firm uses the treasury
stock method for repurchase net repurchase equals the increase in common treasury stock
(Compustat TSTKC) if the firm uses the retirement method (when common treasury stock is zero
in the current and prior year) net repurchase equals total repurchases minus stock issuance
(Compustat SSTK) and change in preferred stock redemption value (Compustat PSTKRV)
When the above measures give negative value net repurchase is set to zero
Adjusted repurchaseTotal assets Adjusted repurchase removes from total repurchase the potential
effect of repurchasing exercised options This variable equals total repurchase of common stocks
minus the product between the number of options exercised (Compustat OPTEXD) and average
stock price during the year When the above measure gives negative value adjusted repurchase is
set to zero Since the number of options exercised is not available before 2003 we drop
observations in 2003 when we use this variable
34
Total payoutTotal assets the sum of Regular dividendTotal assets and RepurchaseTotal assets
Regular dividendTotal payout regular cash dividend divided by the sum of regular cash dividend
and repurchase from common equity In the two-period analysis (Pre- vs Post-FAS123R) we
separately sum the numerator and the denominator for each firm-period and then calculate the ratio
Regular dividendNet payout regular dividend divided by the sum of regular dividend and net
repurchase In the two-period analysis (Pre- vs Post-FAS123R) we separately sum the numerator
and the denominator for each firm-period and then calculate the ratio
Compensation Variables
Salary_$ Average salary (Execucomp SALARY) of the top 5 highest paid executives in $1000
Salary_ Average salary (Execucomp SALARY) divided by average total pay (Execucomp
TDC1) of the top 5 highest paid executives
Bonus_$ Average bonus (Execucomp BONUS) of the top 5 highest paid executives in $1000
Due to a data format change we add non-equity plan-based awards (Execucomp
NON_EQ_TARG) to this measure after 2006
Bonus_ Bonus_$ divided by average total pay (Execucomp TDC1) of the top 5 highest paid
executives
Option grant_$ Average option grant value (Execucomp OPTION_AWARDS_BLK_VALUE or
OPTION_AWARDS_FV) of the top 5 highest paid executives in $1000 Due to a data format
change we use OPTION_AWARDS_FV for this measure after 2006
Option grant_ Option grant_$ divided by average total pay (Execucomp TDC1) of the top 5
highest paid executives
Restricted stock grant_$ Average restricted stock grant value (Execucomp RSTKGRNT or
STOCK_AWARDS_FV) of the top 5 highest paid executives in $1000 Due to data format
change we use STOCK_AWARDS_FV for this measure after 2006
Restricted stock grant_ Restricted stock grant_$ divided by average total pay (Execucomp
TDC1) of the top 5 highest paid executives
Total pay_$ Average total pay (Execucomp TDC1) of the top 5 highest paid executives in $1000
35
Other Characteristics
Size The book value of total assets (Compustat AT) minus the book value of common equity
(Compustat CEQ) plus the market value of common equity from CRSP in $M
Log(size) the natural logarithm of size
Book-to-market the book value of common equity dividend by its market value
Leverage long term debt plus short term debt (Compustat DLTT + DLC) divided by total assets
Asset tangibility tangible assets (Compustat AT - INTAN) divided by total assets
Free cash flow Operating cash flow (Compustat OANCF) minus capital expenditure (Compustat
CAPX) then divided by lagged total assets
Cash holding Cash and short-term investments (Compustat CHE) divided by total assets
ROA volatility the standard deviation of returns on assets (operating income before tax divided by
lagged total assets) in the past five fiscal years
Institutional ownership the number of shares held by institutional investors divided by the number
of shares outstanding from Thomson Reuters Institutional Holdings database
Sales growth the growth rate of sales (Compustat SALE) from the prior year
Past stock return annual stock return from the prior year
Loss indicator a dummy variable taking value of one if the current net income is negative and
zero otherwise
36
References
Aboody David 1996 Market Valuation of Employee Stock Options Journal of Accounting and
Economics 22 357-391
Aboody David Barth Mary E and Ron Kasznik 2004 Firms Voluntary Recognition of Stock-
Based Compensation Expense Journal of Accounting Research 42 123ndash150
Aboody David and Ron Kasznik 2008 Executive stock-based compensation and firmsrsquo cash
payout the role of shareholdersrsquo tax-related payout preferences Review of Accounting Studies
13 216ndash251
Anantharaman Divya and Yong Gyu Lee 2014 Managerial risk taking incentives and corporate
pension policy Journal of Financial Economics 111 328ndash351
Baker Malcolm and Jeffrey Wurgler 2004 A catering theory of dividends Journal of Finance
59 1125-1165
Baker Malcolm and Jeffrey Wurgler 2016 Dividends as reference points a behavioral signaling
approach Review of Financial Studies 29 697-738
Bakke Tor-Erik Hamed Mahmudi Chitru Fernando and Jesus Salas 2015 The causal effect of
option pay on corporate risk management Journal of Financial Economics forthcoming
Balsam Steven Austin Reitenga and Jennifer Yin 2008 Option acceleration in response to SFAS
No 123 (R) Accounting Horizons 22 23-45
Bens Daniel and Steven Monahan 2008 Altering Investment Decisions to Manage Financial
Reporting Outcomes Asset-Backed Commercial Paper Conduits and FIN 46 Journal of
Accounting Research 46 1017-1055
Bens Daniel A Venky Nagar Douglas J Skinner and MH Franco Wong 2003 Employee stock
options eps dilution and stock repurchases Journal of Accounting and Economics 36 51ndash90
Bertrand Marianne Esther Duflo and Sendhil Mullainathan 2004 How much should we trust
differences-in-differences estimates The Quarterly Journal of Economics 119 249ndash275
Blouin Jennifer L Jana S Raedy and Douglas A Shackelford 2011 Dividends Share
Repurchases and Tax Clienteles Evidence from the 2003 Reductions in Shareholder Taxes
The Accounting Review 86 887-914
Brav Alon John R Graham Campbell R Harvey and Roni Michaely 2005 Payout policy in the
21st century Journal of Financial Economics 77 483ndash527
Brown Lawrence D and Yen-Jung Lee 2011 Changes in Option-Based Compensation Around
the Issuance of SFAS123R Journal of Business Finance amp Accounting 38 1053ndash109
37
Brown Jeffrey R Nellie Liang and Scott Weisbenner 2007 Executive financial incentives and
payout policy Firm responses to the 2003 dividend tax cut Journal of Finance 62 1935ndash
1965
Burns Natasha Brian McTier and Kristina Minnick 2015 Equity-incentive compensation and
payout policy in Europe Journal of Corporate Finance 30 85-97
Carter Mary Ellen and Luann J Lynch 2003 The Consequences of the FASBrsquos 1998 Proposal on
Accounting for Stock Option Repricing Journal of Accounting and Economics 35 51-72
Carter Mary Ellen Luann J Lynch and Irem Tuna 2007 The role of accounting in the design of
CEO equity compensation The Accounting Review 82 327ndash357
Chava Sudheer and Amiyatosh Purnanandam 2010 CEOs versus CFOs Incentives and
corporate policies Journal of Financial Economics 97 263ndash278
Chetty Raj and Emmanuel Saez 2005 Dividend taxes and corporate behavior Evidence from the
2003 dividend tax cut The Quarterly Journal of Economics 120 791ndash833
Choudhary Preeti Shivaram Rajgopal and Mohan Venkatachalam 2009 Accelerated vesting of
employee stock options in anticipation of FAS123R Journal of Accounting Research 47 105ndash
146
Christensen Hans B and Valeri Nikolaev 2009 Contracting on Mandatory Changes to GAAP
New Practice and Its Determinants Working Paper University of Chicago
Chu Yongqiang and Tao Ma 2015 How does management compensation affect bank risk taking
evidence from FAS 123R University of South Carolina Working Paper
Cuny Charles J Gerald S Martin and John J Puthenpurackal 2009 Stock options and total
payout Journal of Financial and Quantitative Analysis 44 391ndash410
DeAngelo Harry Linda DeAngelo and Douglas J Skinner 2000 Special Dividends and the
Evolution of Dividend Signaling Journal of Financial Economics 57 309-354
Dechow Patricia M Amy P Hutton and Richard G Sloan 1996 Economic consequences of
accounting for stock-based compensation Journal of Accounting Research 34 1ndash20
Edgerton J 2013 Four facts about dividend payouts and the 2003 tax cut International Tax and
Public Finance 20 769-784
Edmans Alex and Xavier Gabaix 2015 Executive compensation a modern primer Journal of
Economic Literature forthcoming
38
Fama Eugene F and Kenneth R French 2001 Disappearing dividends changing firm
characteristics or lower propensity to pay Journal of Financial Economics 60 3ndash43
Farre-Mensa Joan Roni Michaely and Martin C Schmalz 2014 Payout policy Annual Review
of Financial Economics 6 75ndash134
Fenn George W and Nellie Liang 2001 Corporate payout policy and managerial stock
incentives Journal of Financial Economics 60 45ndash72
Ferri Fabrizio and Tatiana Sandino 2009 The impact of shareholder activism on financial
reporting and compensation the case of employee stock options expensing The Accounting
Review 84 433ndash466
Floyd Eric Nan Li and Douglas J Skinner 2015 Payout policy through the financial crisis the
growth of repurchases and the resilience of dividends Journal of Financial Economics 118
299-316
Frydman Carola and Dirk Jenter 2010 CEO compensation Annual Review of Financial
Economics 2 75-102
Gipper Brandon 2015 Assessing the Effects of Disclosing Management Compensation Working
Paper University of Chicago
Gormley Todd David Matsa and Todd Milbourn 2013 CEO compensation and corporate risk
evidence from a natural experiment Journal of Accounting and Economics 56 79-101
Graham John Michelle Hanlon and Terry Shevlin 2011 Real effects of accounting rules
evidence from multinational firmsrsquo investment locations and profit repatriation decisions
Journal of Accounting Research 49 137-185
Graham John Campbell Harvey and Shiva Rajgopal 2005 The Economic implications of
corporate financial reporting Journal of Accounting and Economics 40 3-73
Greenspan Alan 2002 Testimony of Alan Greenspan before the Committee on Banking
Housing and Urban Affairs US Senate July 16 Washington DC Government Printing
Office
Grullon Gustavo and Roni Michaely 2002 Dividends Share Repurchases and the Substitution
Hypothesis Journal of Finance 57 1649-1684
Hail Luzi Ahmed Tahoun and Clare Wang 2014 Dividend Payouts and Information Shocks
Journal of Accounting Research 52 403-456
Hall Brian J and Kevin J Murphy 2002 Stock options for undiversified executives Journal of
Accounting amp Economics 33 3-42
39
Hall Brian J and Kevin J Murphy 2003 The trouble with stock options Journal of Economic
Perspectives 17 49ndash70
Hanlon Michelle and Jeffrey L Hoopes 2014 What do firms do when dividend tax rates change
An examination of alternative payout responses Journal of Financial Economics 114 105-
124
Hayes Rachel M Michael Lemmon and Mingming Qiu 2012 Stock options and managerial
incentives for risk taking Evidence from FAS123R Journal of Financial Economics 105
174ndash190
Heron Randall A Erik Lie 2007 Does backdating explain the stock price pattern around
executive stock option grants Journal of Financial Economics 83 271-295
Hribar Paul Nicole Thorne Jenkins and W Bruce Johnson 2006 Stock repurchases as an
earnings management device Journal of Accounting and Economics 41 3ndash27
Jensen Michael C 1986 Agency cost of free cash flow corporate finance and takeovers
American Economic Review 76 323-329
Jolls Christine 1998 Stock repurchases and incentive compensation NBER Working Paper No
w6467
Jung Boochun Woo-Jong Lee and Yanhua Sunny Yang 2016 The Impact of Dividend
Covenants on Investment and Operating Performance Journal of Business Finance amp
Accounting 43 414ndash447
Kahle Kathleen M 2002 When a buyback isnrsquot a buyback open market repurchases and
employee options Journal of Financial Economics 63 235ndash261
Lambert Richard A William N Lanen and David F Larcker 1989 Executive stock option plans
and corporate dividend policy Journal of Financial and Quantitative Analysis 24 409ndash425
Lintner John 1956 Distribution of incomes of corporations among dividends retained earnings
and taxes The American Economic Review 46 97-113
Low Angie 2009 Managerial risk-taking behavior and equity-based compensation Journal of
Financial Economics 92 470-490
Miller Merton H and Franco Modigliani 1961 Dividend policy growth and the valuation of
shares The Journal of Business 34 411ndash433
Minnick Kristina and Leonard Rosenthal 2015 Stealth compensation Do CEOs increase their
pay by influencing dividend policy Journal of Corporate Finance 25 435-454
40
Murphy Kevin J 1999 Executive compensation In O Ashenfelter and D Card (eds) North
Holland Handbook of Labor Economics Amsterdam Elsevier Science BV
Murphy Kevin J 2013 Executive compensation Where we are and how we got there Handbook
of the Economics of Finance Elsevier Science North Holland 211-356
Nikolaev Valeri 2010 Debt Covenants and Accounting Conservatism Journal of Accounting
Research 48 143-176
Puri Manju Joumlrg Rocholl and Sascha Steffen 2011 Global retail lending in the aftermath of the
US financial crisis Distinguishing between supply and demand effects Journal of Financial
Economics 100 556-578
Shue Kelly and Richard R Townsend 2014 Swinging for the fences Executive reactions to
quasi-random option grants Working Paper University of Chicago
Skinner Douglas J 2008 The evolving relation between earnings dividends and stock
repurchases Journal of Financial Economics 87 582-609
Weisbenner Scott J 2000 Corporate share repurchases in the 1990s What role do stock options
play FEDS Working Paper No 2000-29
Zhang Dan 2013 CEO dividend protection Working Paper BI Norwegian Business School
41
Figure 1 Trends of dividends and repurchases from 2003 to 2007 Panel A plots the average
Regular DividendTotal Assets of firms in the highest and lowest quartiles of Accounting Impact
measured in 2002 Panel B shows the average Total RepurchaseTotal Assets of firms in the
highest and lowest quartiles of Accounting Impact measured in 2002
Panel A Trends of regular dividends
Panel B Trends of total repurchases
00
05
10
15
20
2003 2004 2005 2006 2007
Regular DividendTotal Assets
Lowest Acc Impact
Highest Acc Impact
Pre Post
00
20
40
60
80
100
2003 2004 2005 2006 2007
Total Repurchase Total Assets
Lowest Acc Impact
Highest Acc Impact
Pre Post
42
Table 1
Summary Statistics
Panel A Firm characteristics - full sample
N Mean Std dev 25 pctl Median 75 pctl
Accounting impact (2002) 1176 173 366 022 052 163
Payout variablesRegular dividendTotal assets 5653 093 148 000 000 142
RepurchaseTotal assets 5653 394 710 000 035 500
Total payoutTotal assets 5653 488 748 000 175 666
Regular dividendTotal payout 4091 3874 4057 000 2237 8833
Level of executive compensation (in $1000)
Salary_$ 5653 450 190 314 409 544
Bonus_$ 5653 476 616 122 295 586
Option grant_$ 5653 791 1137 62 384 1002
Restricted stock grant_$ 5653 458 866 0 58 518
Total pay_$ 5653 2481 2475 890 1647 3074
Percentage of executive compensation
Salary_ 5653 296 183 165 251 382
Bonus_ 5653 197 148 97 177 268
Option grant_ 5653 283 235 67 256 445
Restricted stock grant_ 5653 141 180 00 41 249
Control variables
Size ($M) 5653 11086 27294 1017 2459 8117
Log(size) 5653 7985 1565 6925 7808 9002
Book-to-market 5653 0445 0287 0251 0388 0578
Leverage 5653 0202 0172 0038 0187 0309
Asset tangibility 5653 0806 0184 0691 0853 0965
Free cash flow 5653 0059 0091 0013 0059 0108
Cash holding 5653 0166 0172 0034 0100 0247
ROA volatility 5653 0056 0056 0021 0038 0070
Institutional ownership 5653 0753 0202 0639 0795 0910
Sales growth 5653 0121 0189 0028 0096 0183
Past stock return 5653 0094 0183 -0012 0094 0199
Loss indicator 5653 0164 0370 0000 0000 0000
This table presents summary statistics Panel A shows the descriptive statistics of payout variables compensation
variables and other firm characteristics for the full sample Accounting impact is the implied option expense
measured at fiscal year 2002 All other variables are measured at firm-year level from fiscal year 2003 to 2007
resulting in 5653 firm-year observations (except for Regular dividendTotal Payout which can be measured only
for the 4901 firm-year observations with Total payout greater than zero) Panel B shows the pairwise correlations
between main variables at firm-year level Panel C compares payout variables compensation variables and other
firm characteristics before and after FAS123R The Pre-FAS123R period consists of fiscal year 2003 and 2004
the Post-FAS123R period covers fiscal year 2005-2007 Panel D compares the trends of payout and compensation
variables around FAS123R across four quartile groups ranked by 2002 accounting impact Panel E compares the
trends of payout and compensation variables around FAS123R between the treated and control group under the
alternative treatment definition in Bakke et al (2015) (see Section 22) All variables are defined in Appendix The
notation and in Panel C indicates statistically significant at 10 5 and 1 level in T-tests for equal
means respectively
43
Pa
nel
B
Pea
rso
n c
orr
ela
tio
ns
Reg div
Repurchase
Total payout
Salary_
Bonus_
Option_
RS_
Log(size)
BM
Leverage
Tangibility
FCF
Cash holdingROA vol
Inst own
Sales growth
Past ret
urn
Loss
Reg
div
10
0
Repurc
hase
01
610
0
Tota
l payout
03
509
810
0
Sala
ry_
-0
10
-01
8-0
19
10
0
Bonus_
00
700
100
3-0
01
10
0
Option_
-0
10
00
900
6-0
41
-03
510
0
RS
_
01
000
901
0-0
32
-01
1-0
40
10
0
Log(s
ize)
03
101
802
3-0
56
01
101
202
210
0
BM
-02
1-0
28
-03
103
0-0
03
-02
000
0-0
33
10
0
Levera
ge
-00
1-0
08
-00
8-0
05
00
6-0
11
00
801
9-0
03
10
0
Tangib
ility
00
200
100
101
200
1-0
05
-00
6-0
12
-00
4-0
18
10
0
FC
F02
203
703
9-0
20
00
901
1-0
01
02
4-0
32
-02
1-0
16
10
0
Cash
hold
ing
-01
301
000
700
2-0
14
02
2-0
10
-02
3-0
16
-03
502
901
210
0
RO
A v
ol
-01
5-0
04
-00
700
4-0
11
01
9-0
11
-02
3-0
08
-01
101
2-0
02
03
910
0
Inst
ow
n
-00
901
401
1-0
17
00
200
701
200
7-0
01
00
3-0
08
01
4-0
06
-01
110
0
Sale
s gro
wth
-00
8-0
04
-00
6-0
15
00
501
0-0
02
00
7-0
16
-00
3-0
08
01
300
201
400
410
0
Past
retu
rn00
901
301
4-0
18
01
5-0
01
00
301
6-0
29
-01
000
102
7-0
14
-01
001
602
710
0
Loss
-02
0-0
19
-02
201
8-0
18
00
4-0
05
-02
601
901
300
6-0
41
01
702
3-0
16
-01
8-0
40
10
0
44
Panel C Firm characteristics - before and after FAS123R
Pre FAS 123R Post FAS 123R Difference
Payout variables
Regular dividendTotal assets 083 099 016
RepurchaseTotal assets 245 490 245
Total payoutTotal assets 328 589 261
Regular dividendTotal payout 3914 2790 -1124
Level of executive compensation (in $1000)
Salary_$ 426 463 37
Bonus_$ 418 505 87
Option grant_$ 896 707 -191
Restricted stock grant_$ 269 574 305
Total pay_$ 2263 2584 321
Percentage of executive compensation
Salary_ 305 293 -12
Bonus_ 186 204 18
Option grant_ 343 240 -103
Restricted stock grant_ 87 176 89
Control variables
Size ($M) 9671 11631 1960
Log(size) 7860 8035 0175
Book-to-market 0437 0453 0016
Leverage 0201 0203 0002
Asset tangibility 0822 0793 -0029
Free cash flow 0061 0057 -0004
Cash holding 0175 0159 -0016
ROA volatility 0067 0048 -0019
Institutional ownership 0712 0781 0069
Sales growth 0137 0108 -0029
Past stock return 0080 0101 0021
Loss indicator 0173 0159 -0014
45
Pa
nel
D
Fir
m c
ha
racte
rist
ics
by q
ua
rtil
e o
f a
cco
un
tin
g i
mp
act
- b
efo
re a
nd
aft
er
FA
S1
23
R
Accounting im
pact
(2002)
Num
ber
of
Fir
ms
Pre
Post
Pre
Post
Pre
Post
Pre
Post
Payout
vari
able
s
Regula
r div
idendT
ota
l ass
ets
11
2
12
4
09
4
11
1
09
5
11
3
03
0
04
9
Repurc
hase
Tota
l ass
ets
11
3
26
8
19
2
37
3
32
7
63
1
35
1
68
7
Tota
l payout
Tota
l ass
ets
22
4
39
1
28
5
48
4
42
2
74
4
38
1
73
6
Regula
r div
idendT
ota
l payout
643
7
469
8
474
0
341
1
284
5
195
4
82
5
74
5
Perc
enta
ge o
f executive c
om
pensa
tion
Sala
ry_
337
295
313
287
296
289
276
300
Bonus_
223
226
214
228
172
192
134
169
Option g
rant_
201
167
290
210
373
260
507
325
Rest
ricte
d s
tock g
rant_
116
194
98
180
89
176
43
155
294
294
294
294
1st Q
uart
ile2
nd Q
uart
ile3
rd Q
uart
ile4
th Q
uart
ile
01
2
03
5
09
3
55
1
46
Accounting impact
Number of Firms
By accounting impact quartile
1
2
3
4
Pre Post Pre Post
Payout variables
Regular dividendTotal assets 09 11 08 10
RepurchaseTotal assets 18 31 26 52
Total payoutTotal assets 28 43 34 62
Regular dividendTotal payout 428 357 386 265
Percentage of executive compensation
Salary_ 435 364 282 280
Bonus_ 226 214 179 202
Option grant_ 92 125 387 261
Restricted stock grant_ 125 188 80 174
Percentage of CEO compensation
Salary_(CEO) 485 364 260 259
Bonus_(CEO) 249 228 185 219
Option grant_(CEO) 10 127 406 275
Restricted stock grant_(CEO) 128 182 82 183
Panel E Firm characteristics by alternative treatment definition - before and
after FAS123R
Treated
25
19
997
223
250
256
268
10
177
71
Control
44
37
47
Table 2
Differential effect of FAS123R on the use of option-based compensation
Panel A Two-period first-difference regression
Prediction Coeff t-stat Coeff t-stat Coeff t-stat
Accounting impact rank - -0044 -628
Accounting impact rank=2 - -0044 -327
Accounting impact rank=3 - -0075 -468
Accounting impact rank=4 - -0140 -613
Treated - -0132 -875
ΔLog(size) 0061 202 0061 200 0063 214
ΔBook-to-market 0032 091 0032 092 0051 143
ΔLeverage -0157 -213 -0160 -218 -0111 -153
ΔAsset tangibility -0012 -014 -0020 -023 -0023 -026
ΔFree cash flow -0106 -095 -0108 -097 -0128 -117
ΔCash holding -0197 -211 -0193 -206 -0180 -194
ΔFive-year ROA volatility -0065 -031 -0056 -026 -0098 -047
ΔInstitutional ownership -0044 -091 -0043 -088 -0044 -092
ΔSales growth -0064 -102 -0065 -104 -0090 -153
ΔPast one-year stock return 0051 078 0052 080 0091 138
ΔLoss frequency 0056 207 0057 207 0047 179
Log(size) -0009 -210 -0009 -207 -0002 -035
Book-to-market -0015 -056 -0013 -049 0018 072
Leverage 0022 046 0023 048 0068 150
Asset tangibility 0033 077 0033 078 0053 128
Free cash flow 0227 202 0220 195 0127 117
Cash holding -0002 -004 0012 019 -0078 -141
Five-year ROA volatility -0451 -240 -0430 -228 -0509 -283
Institutional ownership -0123 -360 -0122 -359 -0100 -292
Sales growth -0041 -056 -0040 -055 -0089 -125
Past one-year stock return -0009 -015 -0006 -010 0078 125
Loss frequency 0055 174 0056 178 0054 173
Fixed effect
Standard error
Adj R-squared
Observations
Model (3)
Dependent variable ΔAvg Option grantTotal pay
Huber-White
0156
This table investigates whether the effect of FAS123R on the use of option-based pay varies with its potential accounting impact Panel A
reports the results of estimating three two-period first-differencing models where for each firm we average its characteristics in Pre- and
Post-FAS123R period The Pre-FAS123R period consists of fiscal year 2003 and 2004 the Post-FAS123R period covers fiscal year 2005-
2007 In all three specifications the dependent variable is the change of average Option grantTotal pay from Pre- to Post-FAS123R period
The main independent variable varies by model in Model (1) the Accounting impact rank is the quartile rank of implied option expensetotal
assets measured in 2002 (1=lowest 4=highest) In Model (2) Accounting impact rank=2 (3 4) is an indicator that takes value of one if the
firmrsquos Accounting impact rank equals 2 (3 4) In Model (3) we use an alternative treatment construction following Bakke et al (2015)
where Treated is an indicator that takes value of zero if the firm granted zero option to its CEO in both 2003 and 2004 or the firm began to
voluntarily expense option-based pay at fair value in 2002 or earlier and one otherwise For each control variable we include both its level in
the Pre-FAS123R period and its change across the two periods Panel B shows the results of estimating fixed effect models with firm-year
observations The dependent variable is the firm-year level Option grantTotal pay The main independent variables are the interactions of
Post-FAS123R indicator (Post) with Accounting Impact rank Accounting impact rank indicators and Treated respectively All models in
Penal A have industry fixed effects and the standard errors are Huber-White heteroscedasticity-consistent standard errors All models in
Penal B have firm fixed effects and year fixed effects and the standard errors are clustered at firm level All variables are defined in
Appendix The notation and indicates statistically significant at 10 5 and 1 level respectively
Model (1) Model (2)
11711171 1171
Industry Industry
Huber-White
0124
Huber-White
0123
Industry
48
Panel B Panel fixed effects regression
Prediction Coeff t-stat Coeff t-stat Coeff t-stat
Acc impact rank x Post - -0044 -807
Acc impact rank 2 x Post - -0046 -333
Acc impact rank 3 x Post - -0077 -526
Acc impact rank 4 x Post - -0137 -776
Treated x Post - -0145 -970
Log(size) 0034 221 0034 217 0036 229
Book-to-market 0018 084 0017 083 0015 070
Leverage -0004 -009 -0006 -013 -0007 -015
Asset tangibility 0007 012 0004 006 0011 018
Free cash flow -0074 -151 -0072 -146 -0078 -158
Cash holding -0048 -086 -0050 -090 -0006 -011
Five-year ROA volatility 0250 231 0239 219 0437 414
Institutional ownership 0043 159 0044 161 0041 150
Sales growth -0033 -168 -0034 -171 -0031 -158
Past one-year stock return 0067 221 0068 224 0063 204
Loss indicator 0023 209 0022 207 0024 222
Fixed effects
Standard error
Adj R-squared
Observations
Dependent variable Option grantTotal pay
5653 5653 5653
Clustered by firm
Firm Year
Clustered by firm
Firm Year
Clustered by firm
0523 0523 0526
Model (1) Model (2) Model (3)
Firm Year
49
Table 3
Effect of option-based compensation on dividend policy
Panel A Two-period first-difference regression
Prediction Coeff t-stat Coeff t-stat Coeff t-stat
Accounting impact rank + 0000 077
Accounting impact rank=2 + 0001 091
Accounting impact rank=3 + 0000 044
Accounting impact rank=4 + 0001 092
Treated + 0000 -026
ΔLog(size) 0000 -030 0000 -030 0000 -026
ΔBook-to-market -0002 -190 -0002 -193 -0002 -195
ΔLeverage -0002 -059 -0002 -057 -0002 -059
ΔAsset tangibility 0016 431 0016 429 0016 430
ΔFree cash flow 0017 373 0017 373 0017 375
ΔCash holding -0011 -288 -0011 -285 -0010 -282
ΔFive-year ROA volatility 0003 034 0002 032 0003 035
ΔInstitutional ownership -0002 -073 -0002 -073 -0002 -070
ΔSales growth -0001 -040 -0001 -037 -0001 -038
ΔPast one-year stock return 0002 077 0002 076 0002 070
ΔLoss frequency 0000 -048 0000 -045 0000 -046
Log(size) 0000 183 0000 182 0000 182
Book-to-market -0002 -227 -0002 -225 -0002 -284
Leverage -0001 -037 -0001 -039 -0001 -048
Asset tangibility 0003 179 0003 180 0003 176
Free cash flow 0017 291 0017 291 0017 300
Cash holding 0002 080 0002 077 0002 098
Five-year ROA volatility 0003 035 0002 033 0003 044
Institutional ownership -0001 -068 -0001 -068 -0001 -058
Sales growth -0004 -177 -0004 -175 -0004 -172
Past one-year stock return 0004 169 0004 167 0004 165
Loss frequency -0001 -111 -0001 -109 -0001 -102
Fixed effect
Standard error
Adj R-squared
Observations
Dependent variable ΔAvg Regular dividendTotal assets
This table investigates the causal effect of option-based pay on dividend policy by examining whether changes in dividend policy around
FAS123R vary with its potential accounting impact Panel A reports the results of estimating three two-period first-differencing models
where for each firm we average its characteristics in Pre- and Post-FAS123R period In all three specifications the dependent variable is
the change of average Regular dividendTotal assets from Pre- to Post-FAS123R period The main independent variable varies by model in
Model (1) the Accounting impact rank is the quartile rank of implied option expensetotal assets measured in 2002 (1=lowest 4=highest) In
Model (2) Accounting impact rank=2 (3 4) is an indicator that takes value of one if the firmrsquos Accounting impact rank equals 2 (3 4) In
Model (3) we use an alternative treatment construction following Bakke et al (2015) where Treated is an indicator that takes value of zero
if the firm granted zero option to its CEO in both 2003 and 2004 or the firm began to voluntarily expense option-based pay at fair value in
2002 or earlier and one otherwise For each control variable we include both its level in the Pre-FAS123R period and its change across the
two periods Panel B shows the results of estimating fixed effect models with firm-year observations The dependent variable is the firm-
year level Regular dividendTotal assets The main independent variables are the interactions of Post-FAS123R indicator (Post) with
Accounting Impact rank Accounting impact rank indicators and Treated respectively Panel C examines the intensity of dividend changes
among firms with nonzero dividend per share in 2003 or 2004 In particular we estimates the same three models as in Panel A(with the
same independent variables) but for five dependent variables the change of average Regular dividendTotal assets from Pre- to Post-
FAS123R period (as in Panel A) the percentage change of DPS (dividend per share) from Pre- to Post-FAS123R period and three
indicators denoting respectively whether the percentage change of DPS was greater than 20 40 and 60 Panel D reports four
robustness tests of the dividend intensity regression In each of them a set of possible confounding observations is removed (see Section 33
for details) Panel E compares the trends of dividend initiation and termination around FAS123R across four quartile groups ranked by
accounting impact All models in Panel A C and D have industry fixed effects and the standard errors are Huber-White heteroscedasticity-
consistent standard errors All models in Penal B have firm fixed effects and year fixed effects and the standard errors are clustered at
firm level All variables are defined in Appendix The notation and indicates statistically significant at 10 5 and 1 level
Industry Industry Industry
Model (1) Model (2) Model (3)
1171 1171 1171
Huber-White Huber-White Huber-White
0105 0104 0105
50
Panel B Panel fixed effects regression
Prediction Coeff t-stat Coeff t-stat Coeff t-stat
Acc impact rank x Post + 0000 122
Acc impact rank 2 x Post + 0001 110
Acc impact rank 3 x Post + 0001 094
Acc impact rank 4 x Post + 0001 129
Treated x Post + 0000 -012
Log(size) 0001 179 0001 179 0001 181
Book-to-market 0000 025 0000 024 0000 031
Leverage 0001 062 0001 064 0001 069
Asset tangibility 0009 360 0009 358 0009 363
Free cash flow 0002 090 0002 093 0002 092
Cash holding -0007 -295 -0007 -298 -0007 -298
Five-year ROA volatility 0001 041 0001 038 0000 -006
Institutional ownership 0000 -027 0000 -026 0000 -027
Sales growth 0000 053 0000 051 0000 044
Past one-year stock return 0001 089 0001 088 0001 078
Loss indicator 0000 -060 0000 -057 0000 -076
Fixed effects
Standard error
Adj R-squared
Observations
Dependent variable Regular dividendTotal assets
Model (1) Model (2) Model (3)
Firm Year Firm Year Firm Year
5653 5653 5653
Clustered by firm Clustered by firm Clustered by firm
0877 0877 0877
51
Panel C Intensity of dividend changes around FAS123R
Prediction Coeff t-stat Coeff t-stat Coeff t-stat
Accounting impact rank + 0000 065
Accounting impact rank=2 + 0000 048
Accounting impact rank=3 + 0000 026
Accounting impact rank=4 + 0002 080
Treated + 0001 063
Dependent var DPS pct change
Accounting impact rank + -0145 -072
Accounting impact rank=2 + 0018 006
Accounting impact rank=3 + -0177 -045
Accounting impact rank=4 + -0746 -100
Treated + -0407 -119
Accounting impact rank + 0029 095
Accounting impact rank=2 + 0040 074
Accounting impact rank=3 + 0092 139
Accounting impact rank=4 + 0008 007
Treated + -0007 -012
Accounting impact rank + 0024 076
Accounting impact rank=2 + 0047 088
Accounting impact rank=3 + 0079 114
Accounting impact rank=4 + -0003 -002
Treated + 0030 052
Accounting impact rank + 0030 098
Accounting impact rank=2 + 0078 155
Accounting impact rank=3 + 0085 130
Accounting impact rank=4 + 0014 012
Treated + -0006 -011
Control variables
Fixed effect
Standard error
Observations 572 572 572
Yes Yes Yes
Huber-White Huber-White Huber-White
Industry Industry Industry
Dependent var DPS pct
change gt60 indicator
Model (1) Model (2) Model (3)
Dependent var ΔAvg Regular
dividendAssets
Dependent var DPS pct
change gt20 indicator
Dependent var DPS pct
change gt40 indicator
52
Panel D Robustness tests for intensity of dividend changes around FAS123R
Prediction Coeff t-stat Coeff t-stat Coeff t-stat
Accounting impact rank + 0006 017
Accounting impact rank=2 + 0067 118
Accounting impact rank=3 + 0041 057
Accounting impact rank=4 + -0061 -049
Treated + 0022 035Observations
Accounting impact rank + 0009 027
Accounting impact rank=2 + 0058 106
Accounting impact rank=3 + 0032 043
Accounting impact rank=4 + -0032 -024
Treated + 0018 028
Observations
Accounting impact rank + 0030 089
Accounting impact rank=2 + 0039 071
Accounting impact rank=3 + 0122 168
Accounting impact rank=4 + -0063 -052
Treated + 0075 132
Observations
Accounting impact rank + 0008 023
Accounting impact rank=2 + 0023 042
Accounting impact rank=3 + 0048 064
Accounting impact rank=4 + -0042 -033
Treated + -0010 -016
Observations
Control variables
Fixed effect
Standard error
Exclude firms with stable
payout ratio from 2003 to 2004
506 506 506
Dependent variable DPS pct change gt40 indicator
Model (1) Model (2) Model (3)
Exclude voluntary expensers
519 519
Exclude firms in the top decile
of option reduction (02-04)
Exclude firms that accelerated
option vesting
504 504 504
517 517 517
519
Huber-White Huber-White Huber-White
Yes Yes Yes
Industry Industry Industry
53
Panel E Dividend initiation and termination rates around FAS123R
Pre FAS 123R
1 280 75 7 6 13 173
2 284 135 18 9 27 200
3 286 181 11 14 25 138
4 282 260 9 10 19 73
Total 1132 651 45 39 84 129
Post FAS 123R
1 275 63 4 4 8 127
2 280 116 9 9 18 155
3 276 152 9 3 12 79
4 263 223 5 1 6 27
Total 1094 554 27 17 44 79
Pre FAS 123R
1 280 205 2 0 2 10
2 284 149 7 1 8 54
3 286 105 0 0 0 00
4 282 22 0 0 0 00
Total 1132 481 9 1 10 21
Post FAS 123R
1 275 212 3 6 9 42
2 280 164 1 2 3 18
3 276 124 1 1 2 16
4 263 40 0 3 3 75
Total 1094 540 5 12 17 31
termination
in 2004
03-04
cumulative
03-04
cumulative
Quartile firms
with
dividend in
2004
termination
in 2005
termination
in 2006
05-06
cumulative
05-06
cumulative
Termination
Quartile firms
with
dividend in
2002
termination
in 2003
without
dividend in
2004
initiation in
2003
initiation in
2004
03-04
cumulative
03-04
cumulative firmsQuartile
firmsQuartile initiation in
2005
initiation in
2006
05-06
cumulative
05-06
cumulative
Initiation
without
dividend in
2002
54
Table 4
Effect of option-based compensation on repurchases
Panel A Two-period first-difference regression with total repurchase
Prediction Coeff t-stat Coeff t-stat Coeff t-stat
Accounting impact rank - 0002 122
Accounting impact rank=2 - 0002 071
Accounting impact rank=3 - 0005 123
Accounting impact rank=4 - 0007 102
Treated - 0014 365
Control variables
Fixed effect
Standard error
Adj R-squared
Observations
Panel B Two-period first-difference regression with net repurchase
Prediction Coeff t-stat Coeff t-stat Coeff t-stat
Accounting impact rank - 0003 166
Accounting impact rank=2 - 0002 051
Accounting impact rank=3 - 0006 165
Accounting impact rank=4 - 0009 137
Treated - 0010 300
Control variables
Fixed effect
Standard error
Adj R-squared
Observations
Panel C Two-period first-difference regression with repurchase adjusted for exercised options
Prediction Coeff t-stat Coeff t-stat Coeff t-stat
Accounting impact rank - 0001 056
Accounting impact rank=2 - 0002 062
Accounting impact rank=3 - 0007 172
Accounting impact rank=4 - -0001 -008
Treated - 0006 197
Control variables
Fixed effect
Standard error
Adj R-squared
Observations
Dependent variable ΔAvg RepurchaseTotal assets
This table investigates the causal effect of option-based pay on payout policy by examining whether the changes of repurchase around
FAS123R vary with its potential accounting impact Panel A reports the results of estimating three two-period first-differencing models
where for each firm we average its characteristics in Pre- and Post-FAS123R period In all three specifications the dependent variable is
the change of average RepurchaseTotal assets from Pre- to Post-FAS123R period The main independent variable varies by model in
Model (1) the Accounting impact rank is the quartile rank of implied option expensetotal assets measured in 2002 (1=lowest 4=highest)
In Model (2) Accounting impact rank=2 (3 4) is an indicator that takes value of one if the firmrsquos Accounting impact rank equals 2 (3 4)
In Model (3) we use an alternative treatment construction following Bakke et al (2015) where Treated is an indicator that takes value of
zero if the firm granted zero option to its CEO in both 2003 and 2004 or the firm began to voluntarily expense option-based pay at fair
value in 2002 or earlier and one otherwise Panel B reports the regressions with the change of Net repurchaseTotal assets as the
dependent variable and the same independent variable as in Panel A Panel C reports the regressions with the change of Adjusted
repurchaseTotal assets as the dependent variable and the same independent variable as in Panel A All models in Panel A B and C have
industry fixed effects and the standard errors are Huber-White heteroscedasticity-consistent standard errors All variables are defined in
Appendix The notation and indicates statistically significant at 10 5 and 1 level respectively
Model (1) Model (2) Model (3)
Yes Yes Yes
Industry Industry Industry
Huber-White Huber-White Huber-White
Dependent variable ΔAvg Net repurchaseTotal assets
1171 1171 1171
0238 0237 0245
Model (1) Model (2) Model (3)
Yes Yes Yes
Industry Industry Industry
Huber-White Huber-White Huber-White
Dependent variable ΔAvg Adjusted repurchaseTotal assets
0229 0229 0233
1171 1171 1171
Model (1) Model (2) Model (3)
Yes Yes Yes
Industry Industry Industry
Huber-White Huber-White Huber-White
0111 0112 0114
1168 1168 1168
55
Table 5
Effect of option-based compensation on payout mix
Panel A Two-period first-difference regression with total payout mix
Prediction Coeff t-stat Coeff t-stat Coeff t-stat
Accounting impact rank + 0006 028
Accounting impact rank=2 + 0018 045
Accounting impact rank=3 + -0001 -001
Accounting impact rank=4 + 0043 052
Treated + -0035 -094
Control variables
Fixed effect
Standard error
Adj R-squared
Observations
Panel B Two-period first-difference regression with net payout mix
Prediction Coeff t-stat Coeff t-stat Coeff t-stat
Accounting impact rank + -0002 -008
Accounting impact rank=2 + 0008 016
Accounting impact rank=3 + 0018 034
Accounting impact rank=4 + -0059 -055
Treated + -0050 -101
Control variables
Fixed effect
Standard error
Adj R-squared
Observations
0049 0043 0054
257 257 257
Industry Industry Industry
Huber-White Huber-White Huber-White
Dependent variable ΔAvg Regular dividendNet payout
Model (1) Model (2) Model (3)
Yes Yes Yes
0154 0151 0156
362 362 362
Industry Industry Industry
Huber-White Huber-White Huber-White
This table investigates the causal effect of option-based pay on payout mix for firms using both dividend and repurchase by examining
whether the changes of payout mix around FAS123R vary with its potential accounting impact Panel A reports the results of estimating
three two-period first-differencing models where for each firm we average its characteristics in Pre- and Post-FAS123R period In all three
specifications the dependent variable is the change of average Regular dividendTotal payout from Pre- to Post-FAS123R period The main
independent variable varies by model in Model (1) the Accounting impact rank is the quartile rank of implied option expensetotal assets
measured in 2002 (1=lowest 4=highest) In Model (2) Accounting impact rank=2 (3 4) is an indicator that takes value of one if the firmrsquos
Accounting impact rank equals 2 (3 4) In Model (3) we use an alternative treatment construction following Bakke et al (2015) where
Treated is an indicator that takes value of zero if the firm granted zero option to its CEO in both 2003 and 2004 or the firm began to
voluntarily expense option-based pay at fair value in 2002 or earlier and one otherwise Panel B reports the regressions with the change of
Regular dividendNet payout as the dependent variable and the same independent variables as in Panel A Panel A (Panel B) is based on
observations with nonzero regular dividend and repurchase (net repurchase) in both Pre- and Post-FAS123R period All models in Panel A
and B have industry fixed effects and the standard errors are Huber-White heteroscedasticity-consistent standard errors All variables are
defined in Appendix The notation and indicates statistically significant at 10 5 and 1 level respectively
Yes Yes Yes
Dependent variable ΔAvg Regular dividendTotal payout
Model (1) Model (2) Model (3)

35
Other Characteristics
Size The book value of total assets (Compustat AT) minus the book value of common equity
(Compustat CEQ) plus the market value of common equity from CRSP in $M
Log(size) the natural logarithm of size
Book-to-market the book value of common equity dividend by its market value
Leverage long term debt plus short term debt (Compustat DLTT + DLC) divided by total assets
Asset tangibility tangible assets (Compustat AT - INTAN) divided by total assets
Free cash flow Operating cash flow (Compustat OANCF) minus capital expenditure (Compustat
CAPX) then divided by lagged total assets
Cash holding Cash and short-term investments (Compustat CHE) divided by total assets
ROA volatility the standard deviation of returns on assets (operating income before tax divided by
lagged total assets) in the past five fiscal years
Institutional ownership the number of shares held by institutional investors divided by the number
of shares outstanding from Thomson Reuters Institutional Holdings database
Sales growth the growth rate of sales (Compustat SALE) from the prior year
Past stock return annual stock return from the prior year
Loss indicator a dummy variable taking value of one if the current net income is negative and
zero otherwise
36
References
Aboody David 1996 Market Valuation of Employee Stock Options Journal of Accounting and
Economics 22 357-391
Aboody David Barth Mary E and Ron Kasznik 2004 Firms Voluntary Recognition of Stock-
Based Compensation Expense Journal of Accounting Research 42 123ndash150
Aboody David and Ron Kasznik 2008 Executive stock-based compensation and firmsrsquo cash
payout the role of shareholdersrsquo tax-related payout preferences Review of Accounting Studies
13 216ndash251
Anantharaman Divya and Yong Gyu Lee 2014 Managerial risk taking incentives and corporate
pension policy Journal of Financial Economics 111 328ndash351
Baker Malcolm and Jeffrey Wurgler 2004 A catering theory of dividends Journal of Finance
59 1125-1165
Baker Malcolm and Jeffrey Wurgler 2016 Dividends as reference points a behavioral signaling
approach Review of Financial Studies 29 697-738
Bakke Tor-Erik Hamed Mahmudi Chitru Fernando and Jesus Salas 2015 The causal effect of
option pay on corporate risk management Journal of Financial Economics forthcoming
Balsam Steven Austin Reitenga and Jennifer Yin 2008 Option acceleration in response to SFAS
No 123 (R) Accounting Horizons 22 23-45
Bens Daniel and Steven Monahan 2008 Altering Investment Decisions to Manage Financial
Reporting Outcomes Asset-Backed Commercial Paper Conduits and FIN 46 Journal of
Accounting Research 46 1017-1055
Bens Daniel A Venky Nagar Douglas J Skinner and MH Franco Wong 2003 Employee stock
options eps dilution and stock repurchases Journal of Accounting and Economics 36 51ndash90
Bertrand Marianne Esther Duflo and Sendhil Mullainathan 2004 How much should we trust
differences-in-differences estimates The Quarterly Journal of Economics 119 249ndash275
Blouin Jennifer L Jana S Raedy and Douglas A Shackelford 2011 Dividends Share
Repurchases and Tax Clienteles Evidence from the 2003 Reductions in Shareholder Taxes
The Accounting Review 86 887-914
Brav Alon John R Graham Campbell R Harvey and Roni Michaely 2005 Payout policy in the
21st century Journal of Financial Economics 77 483ndash527
Brown Lawrence D and Yen-Jung Lee 2011 Changes in Option-Based Compensation Around
the Issuance of SFAS123R Journal of Business Finance amp Accounting 38 1053ndash109
37
Brown Jeffrey R Nellie Liang and Scott Weisbenner 2007 Executive financial incentives and
payout policy Firm responses to the 2003 dividend tax cut Journal of Finance 62 1935ndash
1965
Burns Natasha Brian McTier and Kristina Minnick 2015 Equity-incentive compensation and
payout policy in Europe Journal of Corporate Finance 30 85-97
Carter Mary Ellen and Luann J Lynch 2003 The Consequences of the FASBrsquos 1998 Proposal on
Accounting for Stock Option Repricing Journal of Accounting and Economics 35 51-72
Carter Mary Ellen Luann J Lynch and Irem Tuna 2007 The role of accounting in the design of
CEO equity compensation The Accounting Review 82 327ndash357
Chava Sudheer and Amiyatosh Purnanandam 2010 CEOs versus CFOs Incentives and
corporate policies Journal of Financial Economics 97 263ndash278
Chetty Raj and Emmanuel Saez 2005 Dividend taxes and corporate behavior Evidence from the
2003 dividend tax cut The Quarterly Journal of Economics 120 791ndash833
Choudhary Preeti Shivaram Rajgopal and Mohan Venkatachalam 2009 Accelerated vesting of
employee stock options in anticipation of FAS123R Journal of Accounting Research 47 105ndash
146
Christensen Hans B and Valeri Nikolaev 2009 Contracting on Mandatory Changes to GAAP
New Practice and Its Determinants Working Paper University of Chicago
Chu Yongqiang and Tao Ma 2015 How does management compensation affect bank risk taking
evidence from FAS 123R University of South Carolina Working Paper
Cuny Charles J Gerald S Martin and John J Puthenpurackal 2009 Stock options and total
payout Journal of Financial and Quantitative Analysis 44 391ndash410
DeAngelo Harry Linda DeAngelo and Douglas J Skinner 2000 Special Dividends and the
Evolution of Dividend Signaling Journal of Financial Economics 57 309-354
Dechow Patricia M Amy P Hutton and Richard G Sloan 1996 Economic consequences of
accounting for stock-based compensation Journal of Accounting Research 34 1ndash20
Edgerton J 2013 Four facts about dividend payouts and the 2003 tax cut International Tax and
Public Finance 20 769-784
Edmans Alex and Xavier Gabaix 2015 Executive compensation a modern primer Journal of
Economic Literature forthcoming
38
Fama Eugene F and Kenneth R French 2001 Disappearing dividends changing firm
characteristics or lower propensity to pay Journal of Financial Economics 60 3ndash43
Farre-Mensa Joan Roni Michaely and Martin C Schmalz 2014 Payout policy Annual Review
of Financial Economics 6 75ndash134
Fenn George W and Nellie Liang 2001 Corporate payout policy and managerial stock
incentives Journal of Financial Economics 60 45ndash72
Ferri Fabrizio and Tatiana Sandino 2009 The impact of shareholder activism on financial
reporting and compensation the case of employee stock options expensing The Accounting
Review 84 433ndash466
Floyd Eric Nan Li and Douglas J Skinner 2015 Payout policy through the financial crisis the
growth of repurchases and the resilience of dividends Journal of Financial Economics 118
299-316
Frydman Carola and Dirk Jenter 2010 CEO compensation Annual Review of Financial
Economics 2 75-102
Gipper Brandon 2015 Assessing the Effects of Disclosing Management Compensation Working
Paper University of Chicago
Gormley Todd David Matsa and Todd Milbourn 2013 CEO compensation and corporate risk
evidence from a natural experiment Journal of Accounting and Economics 56 79-101
Graham John Michelle Hanlon and Terry Shevlin 2011 Real effects of accounting rules
evidence from multinational firmsrsquo investment locations and profit repatriation decisions
Journal of Accounting Research 49 137-185
Graham John Campbell Harvey and Shiva Rajgopal 2005 The Economic implications of
corporate financial reporting Journal of Accounting and Economics 40 3-73
Greenspan Alan 2002 Testimony of Alan Greenspan before the Committee on Banking
Housing and Urban Affairs US Senate July 16 Washington DC Government Printing
Office
Grullon Gustavo and Roni Michaely 2002 Dividends Share Repurchases and the Substitution
Hypothesis Journal of Finance 57 1649-1684
Hail Luzi Ahmed Tahoun and Clare Wang 2014 Dividend Payouts and Information Shocks
Journal of Accounting Research 52 403-456
Hall Brian J and Kevin J Murphy 2002 Stock options for undiversified executives Journal of
Accounting amp Economics 33 3-42
39
Hall Brian J and Kevin J Murphy 2003 The trouble with stock options Journal of Economic
Perspectives 17 49ndash70
Hanlon Michelle and Jeffrey L Hoopes 2014 What do firms do when dividend tax rates change
An examination of alternative payout responses Journal of Financial Economics 114 105-
124
Hayes Rachel M Michael Lemmon and Mingming Qiu 2012 Stock options and managerial
incentives for risk taking Evidence from FAS123R Journal of Financial Economics 105
174ndash190
Heron Randall A Erik Lie 2007 Does backdating explain the stock price pattern around
executive stock option grants Journal of Financial Economics 83 271-295
Hribar Paul Nicole Thorne Jenkins and W Bruce Johnson 2006 Stock repurchases as an
earnings management device Journal of Accounting and Economics 41 3ndash27
Jensen Michael C 1986 Agency cost of free cash flow corporate finance and takeovers
American Economic Review 76 323-329
Jolls Christine 1998 Stock repurchases and incentive compensation NBER Working Paper No
w6467
Jung Boochun Woo-Jong Lee and Yanhua Sunny Yang 2016 The Impact of Dividend
Covenants on Investment and Operating Performance Journal of Business Finance amp
Accounting 43 414ndash447
Kahle Kathleen M 2002 When a buyback isnrsquot a buyback open market repurchases and
employee options Journal of Financial Economics 63 235ndash261
Lambert Richard A William N Lanen and David F Larcker 1989 Executive stock option plans
and corporate dividend policy Journal of Financial and Quantitative Analysis 24 409ndash425
Lintner John 1956 Distribution of incomes of corporations among dividends retained earnings
and taxes The American Economic Review 46 97-113
Low Angie 2009 Managerial risk-taking behavior and equity-based compensation Journal of
Financial Economics 92 470-490
Miller Merton H and Franco Modigliani 1961 Dividend policy growth and the valuation of
shares The Journal of Business 34 411ndash433
Minnick Kristina and Leonard Rosenthal 2015 Stealth compensation Do CEOs increase their
pay by influencing dividend policy Journal of Corporate Finance 25 435-454
40
Murphy Kevin J 1999 Executive compensation In O Ashenfelter and D Card (eds) North
Holland Handbook of Labor Economics Amsterdam Elsevier Science BV
Murphy Kevin J 2013 Executive compensation Where we are and how we got there Handbook
of the Economics of Finance Elsevier Science North Holland 211-356
Nikolaev Valeri 2010 Debt Covenants and Accounting Conservatism Journal of Accounting
Research 48 143-176
Puri Manju Joumlrg Rocholl and Sascha Steffen 2011 Global retail lending in the aftermath of the
US financial crisis Distinguishing between supply and demand effects Journal of Financial
Economics 100 556-578
Shue Kelly and Richard R Townsend 2014 Swinging for the fences Executive reactions to
quasi-random option grants Working Paper University of Chicago
Skinner Douglas J 2008 The evolving relation between earnings dividends and stock
repurchases Journal of Financial Economics 87 582-609
Weisbenner Scott J 2000 Corporate share repurchases in the 1990s What role do stock options
play FEDS Working Paper No 2000-29
Zhang Dan 2013 CEO dividend protection Working Paper BI Norwegian Business School
41
Figure 1 Trends of dividends and repurchases from 2003 to 2007 Panel A plots the average
Regular DividendTotal Assets of firms in the highest and lowest quartiles of Accounting Impact
measured in 2002 Panel B shows the average Total RepurchaseTotal Assets of firms in the
highest and lowest quartiles of Accounting Impact measured in 2002
Panel A Trends of regular dividends
Panel B Trends of total repurchases
00
05
10
15
20
2003 2004 2005 2006 2007
Regular DividendTotal Assets
Lowest Acc Impact
Highest Acc Impact
Pre Post
00
20
40
60
80
100
2003 2004 2005 2006 2007
Total Repurchase Total Assets
Lowest Acc Impact
Highest Acc Impact
Pre Post
42
Table 1
Summary Statistics
Panel A Firm characteristics - full sample
N Mean Std dev 25 pctl Median 75 pctl
Accounting impact (2002) 1176 173 366 022 052 163
Payout variablesRegular dividendTotal assets 5653 093 148 000 000 142
RepurchaseTotal assets 5653 394 710 000 035 500
Total payoutTotal assets 5653 488 748 000 175 666
Regular dividendTotal payout 4091 3874 4057 000 2237 8833
Level of executive compensation (in $1000)
Salary_$ 5653 450 190 314 409 544
Bonus_$ 5653 476 616 122 295 586
Option grant_$ 5653 791 1137 62 384 1002
Restricted stock grant_$ 5653 458 866 0 58 518
Total pay_$ 5653 2481 2475 890 1647 3074
Percentage of executive compensation
Salary_ 5653 296 183 165 251 382
Bonus_ 5653 197 148 97 177 268
Option grant_ 5653 283 235 67 256 445
Restricted stock grant_ 5653 141 180 00 41 249
Control variables
Size ($M) 5653 11086 27294 1017 2459 8117
Log(size) 5653 7985 1565 6925 7808 9002
Book-to-market 5653 0445 0287 0251 0388 0578
Leverage 5653 0202 0172 0038 0187 0309
Asset tangibility 5653 0806 0184 0691 0853 0965
Free cash flow 5653 0059 0091 0013 0059 0108
Cash holding 5653 0166 0172 0034 0100 0247
ROA volatility 5653 0056 0056 0021 0038 0070
Institutional ownership 5653 0753 0202 0639 0795 0910
Sales growth 5653 0121 0189 0028 0096 0183
Past stock return 5653 0094 0183 -0012 0094 0199
Loss indicator 5653 0164 0370 0000 0000 0000
This table presents summary statistics Panel A shows the descriptive statistics of payout variables compensation
variables and other firm characteristics for the full sample Accounting impact is the implied option expense
measured at fiscal year 2002 All other variables are measured at firm-year level from fiscal year 2003 to 2007
resulting in 5653 firm-year observations (except for Regular dividendTotal Payout which can be measured only
for the 4901 firm-year observations with Total payout greater than zero) Panel B shows the pairwise correlations
between main variables at firm-year level Panel C compares payout variables compensation variables and other
firm characteristics before and after FAS123R The Pre-FAS123R period consists of fiscal year 2003 and 2004
the Post-FAS123R period covers fiscal year 2005-2007 Panel D compares the trends of payout and compensation
variables around FAS123R across four quartile groups ranked by 2002 accounting impact Panel E compares the
trends of payout and compensation variables around FAS123R between the treated and control group under the
alternative treatment definition in Bakke et al (2015) (see Section 22) All variables are defined in Appendix The
notation and in Panel C indicates statistically significant at 10 5 and 1 level in T-tests for equal
means respectively
43
Pa
nel
B
Pea
rso
n c
orr
ela
tio
ns
Reg div
Repurchase
Total payout
Salary_
Bonus_
Option_
RS_
Log(size)
BM
Leverage
Tangibility
FCF
Cash holdingROA vol
Inst own
Sales growth
Past ret
urn
Loss
Reg
div
10
0
Repurc
hase
01
610
0
Tota
l payout
03
509
810
0
Sala
ry_
-0
10
-01
8-0
19
10
0
Bonus_
00
700
100
3-0
01
10
0
Option_
-0
10
00
900
6-0
41
-03
510
0
RS
_
01
000
901
0-0
32
-01
1-0
40
10
0
Log(s
ize)
03
101
802
3-0
56
01
101
202
210
0
BM
-02
1-0
28
-03
103
0-0
03
-02
000
0-0
33
10
0
Levera
ge
-00
1-0
08
-00
8-0
05
00
6-0
11
00
801
9-0
03
10
0
Tangib
ility
00
200
100
101
200
1-0
05
-00
6-0
12
-00
4-0
18
10
0
FC
F02
203
703
9-0
20
00
901
1-0
01
02
4-0
32
-02
1-0
16
10
0
Cash
hold
ing
-01
301
000
700
2-0
14
02
2-0
10
-02
3-0
16
-03
502
901
210
0
RO
A v
ol
-01
5-0
04
-00
700
4-0
11
01
9-0
11
-02
3-0
08
-01
101
2-0
02
03
910
0
Inst
ow
n
-00
901
401
1-0
17
00
200
701
200
7-0
01
00
3-0
08
01
4-0
06
-01
110
0
Sale
s gro
wth
-00
8-0
04
-00
6-0
15
00
501
0-0
02
00
7-0
16
-00
3-0
08
01
300
201
400
410
0
Past
retu
rn00
901
301
4-0
18
01
5-0
01
00
301
6-0
29
-01
000
102
7-0
14
-01
001
602
710
0
Loss
-02
0-0
19
-02
201
8-0
18
00
4-0
05
-02
601
901
300
6-0
41
01
702
3-0
16
-01
8-0
40
10
0
44
Panel C Firm characteristics - before and after FAS123R
Pre FAS 123R Post FAS 123R Difference
Payout variables
Regular dividendTotal assets 083 099 016
RepurchaseTotal assets 245 490 245
Total payoutTotal assets 328 589 261
Regular dividendTotal payout 3914 2790 -1124
Level of executive compensation (in $1000)
Salary_$ 426 463 37
Bonus_$ 418 505 87
Option grant_$ 896 707 -191
Restricted stock grant_$ 269 574 305
Total pay_$ 2263 2584 321
Percentage of executive compensation
Salary_ 305 293 -12
Bonus_ 186 204 18
Option grant_ 343 240 -103
Restricted stock grant_ 87 176 89
Control variables
Size ($M) 9671 11631 1960
Log(size) 7860 8035 0175
Book-to-market 0437 0453 0016
Leverage 0201 0203 0002
Asset tangibility 0822 0793 -0029
Free cash flow 0061 0057 -0004
Cash holding 0175 0159 -0016
ROA volatility 0067 0048 -0019
Institutional ownership 0712 0781 0069
Sales growth 0137 0108 -0029
Past stock return 0080 0101 0021
Loss indicator 0173 0159 -0014
45
Pa
nel
D
Fir
m c
ha
racte
rist
ics
by q
ua
rtil
e o
f a
cco
un
tin
g i
mp
act
- b
efo
re a
nd
aft
er
FA
S1
23
R
Accounting im
pact
(2002)
Num
ber
of
Fir
ms
Pre
Post
Pre
Post
Pre
Post
Pre
Post
Payout
vari
able
s
Regula
r div
idendT
ota
l ass
ets
11
2
12
4
09
4
11
1
09
5
11
3
03
0
04
9
Repurc
hase
Tota
l ass
ets
11
3
26
8
19
2
37
3
32
7
63
1
35
1
68
7
Tota
l payout
Tota
l ass
ets
22
4
39
1
28
5
48
4
42
2
74
4
38
1
73
6
Regula
r div
idendT
ota
l payout
643
7
469
8
474
0
341
1
284
5
195
4
82
5
74
5
Perc
enta
ge o
f executive c
om
pensa
tion
Sala
ry_
337
295
313
287
296
289
276
300
Bonus_
223
226
214
228
172
192
134
169
Option g
rant_
201
167
290
210
373
260
507
325
Rest
ricte
d s
tock g
rant_
116
194
98
180
89
176
43
155
294
294
294
294
1st Q
uart
ile2
nd Q
uart
ile3
rd Q
uart
ile4
th Q
uart
ile
01
2
03
5
09
3
55
1
46
Accounting impact
Number of Firms
By accounting impact quartile
1
2
3
4
Pre Post Pre Post
Payout variables
Regular dividendTotal assets 09 11 08 10
RepurchaseTotal assets 18 31 26 52
Total payoutTotal assets 28 43 34 62
Regular dividendTotal payout 428 357 386 265
Percentage of executive compensation
Salary_ 435 364 282 280
Bonus_ 226 214 179 202
Option grant_ 92 125 387 261
Restricted stock grant_ 125 188 80 174
Percentage of CEO compensation
Salary_(CEO) 485 364 260 259
Bonus_(CEO) 249 228 185 219
Option grant_(CEO) 10 127 406 275
Restricted stock grant_(CEO) 128 182 82 183
Panel E Firm characteristics by alternative treatment definition - before and
after FAS123R
Treated
25
19
997
223
250
256
268
10
177
71
Control
44
37
47
Table 2
Differential effect of FAS123R on the use of option-based compensation
Panel A Two-period first-difference regression
Prediction Coeff t-stat Coeff t-stat Coeff t-stat
Accounting impact rank - -0044 -628
Accounting impact rank=2 - -0044 -327
Accounting impact rank=3 - -0075 -468
Accounting impact rank=4 - -0140 -613
Treated - -0132 -875
ΔLog(size) 0061 202 0061 200 0063 214
ΔBook-to-market 0032 091 0032 092 0051 143
ΔLeverage -0157 -213 -0160 -218 -0111 -153
ΔAsset tangibility -0012 -014 -0020 -023 -0023 -026
ΔFree cash flow -0106 -095 -0108 -097 -0128 -117
ΔCash holding -0197 -211 -0193 -206 -0180 -194
ΔFive-year ROA volatility -0065 -031 -0056 -026 -0098 -047
ΔInstitutional ownership -0044 -091 -0043 -088 -0044 -092
ΔSales growth -0064 -102 -0065 -104 -0090 -153
ΔPast one-year stock return 0051 078 0052 080 0091 138
ΔLoss frequency 0056 207 0057 207 0047 179
Log(size) -0009 -210 -0009 -207 -0002 -035
Book-to-market -0015 -056 -0013 -049 0018 072
Leverage 0022 046 0023 048 0068 150
Asset tangibility 0033 077 0033 078 0053 128
Free cash flow 0227 202 0220 195 0127 117
Cash holding -0002 -004 0012 019 -0078 -141
Five-year ROA volatility -0451 -240 -0430 -228 -0509 -283
Institutional ownership -0123 -360 -0122 -359 -0100 -292
Sales growth -0041 -056 -0040 -055 -0089 -125
Past one-year stock return -0009 -015 -0006 -010 0078 125
Loss frequency 0055 174 0056 178 0054 173
Fixed effect
Standard error
Adj R-squared
Observations
Model (3)
Dependent variable ΔAvg Option grantTotal pay
Huber-White
0156
This table investigates whether the effect of FAS123R on the use of option-based pay varies with its potential accounting impact Panel A
reports the results of estimating three two-period first-differencing models where for each firm we average its characteristics in Pre- and
Post-FAS123R period The Pre-FAS123R period consists of fiscal year 2003 and 2004 the Post-FAS123R period covers fiscal year 2005-
2007 In all three specifications the dependent variable is the change of average Option grantTotal pay from Pre- to Post-FAS123R period
The main independent variable varies by model in Model (1) the Accounting impact rank is the quartile rank of implied option expensetotal
assets measured in 2002 (1=lowest 4=highest) In Model (2) Accounting impact rank=2 (3 4) is an indicator that takes value of one if the
firmrsquos Accounting impact rank equals 2 (3 4) In Model (3) we use an alternative treatment construction following Bakke et al (2015)
where Treated is an indicator that takes value of zero if the firm granted zero option to its CEO in both 2003 and 2004 or the firm began to
voluntarily expense option-based pay at fair value in 2002 or earlier and one otherwise For each control variable we include both its level in
the Pre-FAS123R period and its change across the two periods Panel B shows the results of estimating fixed effect models with firm-year
observations The dependent variable is the firm-year level Option grantTotal pay The main independent variables are the interactions of
Post-FAS123R indicator (Post) with Accounting Impact rank Accounting impact rank indicators and Treated respectively All models in
Penal A have industry fixed effects and the standard errors are Huber-White heteroscedasticity-consistent standard errors All models in
Penal B have firm fixed effects and year fixed effects and the standard errors are clustered at firm level All variables are defined in
Appendix The notation and indicates statistically significant at 10 5 and 1 level respectively
Model (1) Model (2)
11711171 1171
Industry Industry
Huber-White
0124
Huber-White
0123
Industry
48
Panel B Panel fixed effects regression
Prediction Coeff t-stat Coeff t-stat Coeff t-stat
Acc impact rank x Post - -0044 -807
Acc impact rank 2 x Post - -0046 -333
Acc impact rank 3 x Post - -0077 -526
Acc impact rank 4 x Post - -0137 -776
Treated x Post - -0145 -970
Log(size) 0034 221 0034 217 0036 229
Book-to-market 0018 084 0017 083 0015 070
Leverage -0004 -009 -0006 -013 -0007 -015
Asset tangibility 0007 012 0004 006 0011 018
Free cash flow -0074 -151 -0072 -146 -0078 -158
Cash holding -0048 -086 -0050 -090 -0006 -011
Five-year ROA volatility 0250 231 0239 219 0437 414
Institutional ownership 0043 159 0044 161 0041 150
Sales growth -0033 -168 -0034 -171 -0031 -158
Past one-year stock return 0067 221 0068 224 0063 204
Loss indicator 0023 209 0022 207 0024 222
Fixed effects
Standard error
Adj R-squared
Observations
Dependent variable Option grantTotal pay
5653 5653 5653
Clustered by firm
Firm Year
Clustered by firm
Firm Year
Clustered by firm
0523 0523 0526
Model (1) Model (2) Model (3)
Firm Year
49
Table 3
Effect of option-based compensation on dividend policy
Panel A Two-period first-difference regression
Prediction Coeff t-stat Coeff t-stat Coeff t-stat
Accounting impact rank + 0000 077
Accounting impact rank=2 + 0001 091
Accounting impact rank=3 + 0000 044
Accounting impact rank=4 + 0001 092
Treated + 0000 -026
ΔLog(size) 0000 -030 0000 -030 0000 -026
ΔBook-to-market -0002 -190 -0002 -193 -0002 -195
ΔLeverage -0002 -059 -0002 -057 -0002 -059
ΔAsset tangibility 0016 431 0016 429 0016 430
ΔFree cash flow 0017 373 0017 373 0017 375
ΔCash holding -0011 -288 -0011 -285 -0010 -282
ΔFive-year ROA volatility 0003 034 0002 032 0003 035
ΔInstitutional ownership -0002 -073 -0002 -073 -0002 -070
ΔSales growth -0001 -040 -0001 -037 -0001 -038
ΔPast one-year stock return 0002 077 0002 076 0002 070
ΔLoss frequency 0000 -048 0000 -045 0000 -046
Log(size) 0000 183 0000 182 0000 182
Book-to-market -0002 -227 -0002 -225 -0002 -284
Leverage -0001 -037 -0001 -039 -0001 -048
Asset tangibility 0003 179 0003 180 0003 176
Free cash flow 0017 291 0017 291 0017 300
Cash holding 0002 080 0002 077 0002 098
Five-year ROA volatility 0003 035 0002 033 0003 044
Institutional ownership -0001 -068 -0001 -068 -0001 -058
Sales growth -0004 -177 -0004 -175 -0004 -172
Past one-year stock return 0004 169 0004 167 0004 165
Loss frequency -0001 -111 -0001 -109 -0001 -102
Fixed effect
Standard error
Adj R-squared
Observations
Dependent variable ΔAvg Regular dividendTotal assets
This table investigates the causal effect of option-based pay on dividend policy by examining whether changes in dividend policy around
FAS123R vary with its potential accounting impact Panel A reports the results of estimating three two-period first-differencing models
where for each firm we average its characteristics in Pre- and Post-FAS123R period In all three specifications the dependent variable is
the change of average Regular dividendTotal assets from Pre- to Post-FAS123R period The main independent variable varies by model in
Model (1) the Accounting impact rank is the quartile rank of implied option expensetotal assets measured in 2002 (1=lowest 4=highest) In
Model (2) Accounting impact rank=2 (3 4) is an indicator that takes value of one if the firmrsquos Accounting impact rank equals 2 (3 4) In
Model (3) we use an alternative treatment construction following Bakke et al (2015) where Treated is an indicator that takes value of zero
if the firm granted zero option to its CEO in both 2003 and 2004 or the firm began to voluntarily expense option-based pay at fair value in
2002 or earlier and one otherwise For each control variable we include both its level in the Pre-FAS123R period and its change across the
two periods Panel B shows the results of estimating fixed effect models with firm-year observations The dependent variable is the firm-
year level Regular dividendTotal assets The main independent variables are the interactions of Post-FAS123R indicator (Post) with
Accounting Impact rank Accounting impact rank indicators and Treated respectively Panel C examines the intensity of dividend changes
among firms with nonzero dividend per share in 2003 or 2004 In particular we estimates the same three models as in Panel A(with the
same independent variables) but for five dependent variables the change of average Regular dividendTotal assets from Pre- to Post-
FAS123R period (as in Panel A) the percentage change of DPS (dividend per share) from Pre- to Post-FAS123R period and three
indicators denoting respectively whether the percentage change of DPS was greater than 20 40 and 60 Panel D reports four
robustness tests of the dividend intensity regression In each of them a set of possible confounding observations is removed (see Section 33
for details) Panel E compares the trends of dividend initiation and termination around FAS123R across four quartile groups ranked by
accounting impact All models in Panel A C and D have industry fixed effects and the standard errors are Huber-White heteroscedasticity-
consistent standard errors All models in Penal B have firm fixed effects and year fixed effects and the standard errors are clustered at
firm level All variables are defined in Appendix The notation and indicates statistically significant at 10 5 and 1 level
Industry Industry Industry
Model (1) Model (2) Model (3)
1171 1171 1171
Huber-White Huber-White Huber-White
0105 0104 0105
50
Panel B Panel fixed effects regression
Prediction Coeff t-stat Coeff t-stat Coeff t-stat
Acc impact rank x Post + 0000 122
Acc impact rank 2 x Post + 0001 110
Acc impact rank 3 x Post + 0001 094
Acc impact rank 4 x Post + 0001 129
Treated x Post + 0000 -012
Log(size) 0001 179 0001 179 0001 181
Book-to-market 0000 025 0000 024 0000 031
Leverage 0001 062 0001 064 0001 069
Asset tangibility 0009 360 0009 358 0009 363
Free cash flow 0002 090 0002 093 0002 092
Cash holding -0007 -295 -0007 -298 -0007 -298
Five-year ROA volatility 0001 041 0001 038 0000 -006
Institutional ownership 0000 -027 0000 -026 0000 -027
Sales growth 0000 053 0000 051 0000 044
Past one-year stock return 0001 089 0001 088 0001 078
Loss indicator 0000 -060 0000 -057 0000 -076
Fixed effects
Standard error
Adj R-squared
Observations
Dependent variable Regular dividendTotal assets
Model (1) Model (2) Model (3)
Firm Year Firm Year Firm Year
5653 5653 5653
Clustered by firm Clustered by firm Clustered by firm
0877 0877 0877
51
Panel C Intensity of dividend changes around FAS123R
Prediction Coeff t-stat Coeff t-stat Coeff t-stat
Accounting impact rank + 0000 065
Accounting impact rank=2 + 0000 048
Accounting impact rank=3 + 0000 026
Accounting impact rank=4 + 0002 080
Treated + 0001 063
Dependent var DPS pct change
Accounting impact rank + -0145 -072
Accounting impact rank=2 + 0018 006
Accounting impact rank=3 + -0177 -045
Accounting impact rank=4 + -0746 -100
Treated + -0407 -119
Accounting impact rank + 0029 095
Accounting impact rank=2 + 0040 074
Accounting impact rank=3 + 0092 139
Accounting impact rank=4 + 0008 007
Treated + -0007 -012
Accounting impact rank + 0024 076
Accounting impact rank=2 + 0047 088
Accounting impact rank=3 + 0079 114
Accounting impact rank=4 + -0003 -002
Treated + 0030 052
Accounting impact rank + 0030 098
Accounting impact rank=2 + 0078 155
Accounting impact rank=3 + 0085 130
Accounting impact rank=4 + 0014 012
Treated + -0006 -011
Control variables
Fixed effect
Standard error
Observations 572 572 572
Yes Yes Yes
Huber-White Huber-White Huber-White
Industry Industry Industry
Dependent var DPS pct
change gt60 indicator
Model (1) Model (2) Model (3)
Dependent var ΔAvg Regular
dividendAssets
Dependent var DPS pct
change gt20 indicator
Dependent var DPS pct
change gt40 indicator
52
Panel D Robustness tests for intensity of dividend changes around FAS123R
Prediction Coeff t-stat Coeff t-stat Coeff t-stat
Accounting impact rank + 0006 017
Accounting impact rank=2 + 0067 118
Accounting impact rank=3 + 0041 057
Accounting impact rank=4 + -0061 -049
Treated + 0022 035Observations
Accounting impact rank + 0009 027
Accounting impact rank=2 + 0058 106
Accounting impact rank=3 + 0032 043
Accounting impact rank=4 + -0032 -024
Treated + 0018 028
Observations
Accounting impact rank + 0030 089
Accounting impact rank=2 + 0039 071
Accounting impact rank=3 + 0122 168
Accounting impact rank=4 + -0063 -052
Treated + 0075 132
Observations
Accounting impact rank + 0008 023
Accounting impact rank=2 + 0023 042
Accounting impact rank=3 + 0048 064
Accounting impact rank=4 + -0042 -033
Treated + -0010 -016
Observations
Control variables
Fixed effect
Standard error
Exclude firms with stable
payout ratio from 2003 to 2004
506 506 506
Dependent variable DPS pct change gt40 indicator
Model (1) Model (2) Model (3)
Exclude voluntary expensers
519 519
Exclude firms in the top decile
of option reduction (02-04)
Exclude firms that accelerated
option vesting
504 504 504
517 517 517
519
Huber-White Huber-White Huber-White
Yes Yes Yes
Industry Industry Industry
53
Panel E Dividend initiation and termination rates around FAS123R
Pre FAS 123R
1 280 75 7 6 13 173
2 284 135 18 9 27 200
3 286 181 11 14 25 138
4 282 260 9 10 19 73
Total 1132 651 45 39 84 129
Post FAS 123R
1 275 63 4 4 8 127
2 280 116 9 9 18 155
3 276 152 9 3 12 79
4 263 223 5 1 6 27
Total 1094 554 27 17 44 79
Pre FAS 123R
1 280 205 2 0 2 10
2 284 149 7 1 8 54
3 286 105 0 0 0 00
4 282 22 0 0 0 00
Total 1132 481 9 1 10 21
Post FAS 123R
1 275 212 3 6 9 42
2 280 164 1 2 3 18
3 276 124 1 1 2 16
4 263 40 0 3 3 75
Total 1094 540 5 12 17 31
termination
in 2004
03-04
cumulative
03-04
cumulative
Quartile firms
with
dividend in
2004
termination
in 2005
termination
in 2006
05-06
cumulative
05-06
cumulative
Termination
Quartile firms
with
dividend in
2002
termination
in 2003
without
dividend in
2004
initiation in
2003
initiation in
2004
03-04
cumulative
03-04
cumulative firmsQuartile
firmsQuartile initiation in
2005
initiation in
2006
05-06
cumulative
05-06
cumulative
Initiation
without
dividend in
2002
54
Table 4
Effect of option-based compensation on repurchases
Panel A Two-period first-difference regression with total repurchase
Prediction Coeff t-stat Coeff t-stat Coeff t-stat
Accounting impact rank - 0002 122
Accounting impact rank=2 - 0002 071
Accounting impact rank=3 - 0005 123
Accounting impact rank=4 - 0007 102
Treated - 0014 365
Control variables
Fixed effect
Standard error
Adj R-squared
Observations
Panel B Two-period first-difference regression with net repurchase
Prediction Coeff t-stat Coeff t-stat Coeff t-stat
Accounting impact rank - 0003 166
Accounting impact rank=2 - 0002 051
Accounting impact rank=3 - 0006 165
Accounting impact rank=4 - 0009 137
Treated - 0010 300
Control variables
Fixed effect
Standard error
Adj R-squared
Observations
Panel C Two-period first-difference regression with repurchase adjusted for exercised options
Prediction Coeff t-stat Coeff t-stat Coeff t-stat
Accounting impact rank - 0001 056
Accounting impact rank=2 - 0002 062
Accounting impact rank=3 - 0007 172
Accounting impact rank=4 - -0001 -008
Treated - 0006 197
Control variables
Fixed effect
Standard error
Adj R-squared
Observations
Dependent variable ΔAvg RepurchaseTotal assets
This table investigates the causal effect of option-based pay on payout policy by examining whether the changes of repurchase around
FAS123R vary with its potential accounting impact Panel A reports the results of estimating three two-period first-differencing models
where for each firm we average its characteristics in Pre- and Post-FAS123R period In all three specifications the dependent variable is
the change of average RepurchaseTotal assets from Pre- to Post-FAS123R period The main independent variable varies by model in
Model (1) the Accounting impact rank is the quartile rank of implied option expensetotal assets measured in 2002 (1=lowest 4=highest)
In Model (2) Accounting impact rank=2 (3 4) is an indicator that takes value of one if the firmrsquos Accounting impact rank equals 2 (3 4)
In Model (3) we use an alternative treatment construction following Bakke et al (2015) where Treated is an indicator that takes value of
zero if the firm granted zero option to its CEO in both 2003 and 2004 or the firm began to voluntarily expense option-based pay at fair
value in 2002 or earlier and one otherwise Panel B reports the regressions with the change of Net repurchaseTotal assets as the
dependent variable and the same independent variable as in Panel A Panel C reports the regressions with the change of Adjusted
repurchaseTotal assets as the dependent variable and the same independent variable as in Panel A All models in Panel A B and C have
industry fixed effects and the standard errors are Huber-White heteroscedasticity-consistent standard errors All variables are defined in
Appendix The notation and indicates statistically significant at 10 5 and 1 level respectively
Model (1) Model (2) Model (3)
Yes Yes Yes
Industry Industry Industry
Huber-White Huber-White Huber-White
Dependent variable ΔAvg Net repurchaseTotal assets
1171 1171 1171
0238 0237 0245
Model (1) Model (2) Model (3)
Yes Yes Yes
Industry Industry Industry
Huber-White Huber-White Huber-White
Dependent variable ΔAvg Adjusted repurchaseTotal assets
0229 0229 0233
1171 1171 1171
Model (1) Model (2) Model (3)
Yes Yes Yes
Industry Industry Industry
Huber-White Huber-White Huber-White
0111 0112 0114
1168 1168 1168
55
Table 5
Effect of option-based compensation on payout mix
Panel A Two-period first-difference regression with total payout mix
Prediction Coeff t-stat Coeff t-stat Coeff t-stat
Accounting impact rank + 0006 028
Accounting impact rank=2 + 0018 045
Accounting impact rank=3 + -0001 -001
Accounting impact rank=4 + 0043 052
Treated + -0035 -094
Control variables
Fixed effect
Standard error
Adj R-squared
Observations
Panel B Two-period first-difference regression with net payout mix
Prediction Coeff t-stat Coeff t-stat Coeff t-stat
Accounting impact rank + -0002 -008
Accounting impact rank=2 + 0008 016
Accounting impact rank=3 + 0018 034
Accounting impact rank=4 + -0059 -055
Treated + -0050 -101
Control variables
Fixed effect
Standard error
Adj R-squared
Observations
0049 0043 0054
257 257 257
Industry Industry Industry
Huber-White Huber-White Huber-White
Dependent variable ΔAvg Regular dividendNet payout
Model (1) Model (2) Model (3)
Yes Yes Yes
0154 0151 0156
362 362 362
Industry Industry Industry
Huber-White Huber-White Huber-White
This table investigates the causal effect of option-based pay on payout mix for firms using both dividend and repurchase by examining
whether the changes of payout mix around FAS123R vary with its potential accounting impact Panel A reports the results of estimating
three two-period first-differencing models where for each firm we average its characteristics in Pre- and Post-FAS123R period In all three
specifications the dependent variable is the change of average Regular dividendTotal payout from Pre- to Post-FAS123R period The main
independent variable varies by model in Model (1) the Accounting impact rank is the quartile rank of implied option expensetotal assets
measured in 2002 (1=lowest 4=highest) In Model (2) Accounting impact rank=2 (3 4) is an indicator that takes value of one if the firmrsquos
Accounting impact rank equals 2 (3 4) In Model (3) we use an alternative treatment construction following Bakke et al (2015) where
Treated is an indicator that takes value of zero if the firm granted zero option to its CEO in both 2003 and 2004 or the firm began to
voluntarily expense option-based pay at fair value in 2002 or earlier and one otherwise Panel B reports the regressions with the change of
Regular dividendNet payout as the dependent variable and the same independent variables as in Panel A Panel A (Panel B) is based on
observations with nonzero regular dividend and repurchase (net repurchase) in both Pre- and Post-FAS123R period All models in Panel A
and B have industry fixed effects and the standard errors are Huber-White heteroscedasticity-consistent standard errors All variables are
defined in Appendix The notation and indicates statistically significant at 10 5 and 1 level respectively
Yes Yes Yes
Dependent variable ΔAvg Regular dividendTotal payout
Model (1) Model (2) Model (3)
37
Brown Jeffrey R Nellie Liang and Scott Weisbenner 2007 Executive financial incentives and
payout policy Firm responses to the 2003 dividend tax cut Journal of Finance 62 1935ndash
1965
Burns Natasha Brian McTier and Kristina Minnick 2015 Equity-incentive compensation and
payout policy in Europe Journal of Corporate Finance 30 85-97
Carter Mary Ellen and Luann J Lynch 2003 The Consequences of the FASBrsquos 1998 Proposal on
Accounting for Stock Option Repricing Journal of Accounting and Economics 35 51-72
Carter Mary Ellen Luann J Lynch and Irem Tuna 2007 The role of accounting in the design of
CEO equity compensation The Accounting Review 82 327ndash357
Chava Sudheer and Amiyatosh Purnanandam 2010 CEOs versus CFOs Incentives and
corporate policies Journal of Financial Economics 97 263ndash278
Chetty Raj and Emmanuel Saez 2005 Dividend taxes and corporate behavior Evidence from the
2003 dividend tax cut The Quarterly Journal of Economics 120 791ndash833
Choudhary Preeti Shivaram Rajgopal and Mohan Venkatachalam 2009 Accelerated vesting of
employee stock options in anticipation of FAS123R Journal of Accounting Research 47 105ndash
146
Christensen Hans B and Valeri Nikolaev 2009 Contracting on Mandatory Changes to GAAP
New Practice and Its Determinants Working Paper University of Chicago
Chu Yongqiang and Tao Ma 2015 How does management compensation affect bank risk taking
evidence from FAS 123R University of South Carolina Working Paper
Cuny Charles J Gerald S Martin and John J Puthenpurackal 2009 Stock options and total
payout Journal of Financial and Quantitative Analysis 44 391ndash410
DeAngelo Harry Linda DeAngelo and Douglas J Skinner 2000 Special Dividends and the
Evolution of Dividend Signaling Journal of Financial Economics 57 309-354
Dechow Patricia M Amy P Hutton and Richard G Sloan 1996 Economic consequences of
accounting for stock-based compensation Journal of Accounting Research 34 1ndash20
Edgerton J 2013 Four facts about dividend payouts and the 2003 tax cut International Tax and
Public Finance 20 769-784
Edmans Alex and Xavier Gabaix 2015 Executive compensation a modern primer Journal of
Economic Literature forthcoming
38
Fama Eugene F and Kenneth R French 2001 Disappearing dividends changing firm
characteristics or lower propensity to pay Journal of Financial Economics 60 3ndash43
Farre-Mensa Joan Roni Michaely and Martin C Schmalz 2014 Payout policy Annual Review
of Financial Economics 6 75ndash134
Fenn George W and Nellie Liang 2001 Corporate payout policy and managerial stock
incentives Journal of Financial Economics 60 45ndash72
Ferri Fabrizio and Tatiana Sandino 2009 The impact of shareholder activism on financial
reporting and compensation the case of employee stock options expensing The Accounting
Review 84 433ndash466
Floyd Eric Nan Li and Douglas J Skinner 2015 Payout policy through the financial crisis the
growth of repurchases and the resilience of dividends Journal of Financial Economics 118
299-316
Frydman Carola and Dirk Jenter 2010 CEO compensation Annual Review of Financial
Economics 2 75-102
Gipper Brandon 2015 Assessing the Effects of Disclosing Management Compensation Working
Paper University of Chicago
Gormley Todd David Matsa and Todd Milbourn 2013 CEO compensation and corporate risk
evidence from a natural experiment Journal of Accounting and Economics 56 79-101
Graham John Michelle Hanlon and Terry Shevlin 2011 Real effects of accounting rules
evidence from multinational firmsrsquo investment locations and profit repatriation decisions
Journal of Accounting Research 49 137-185
Graham John Campbell Harvey and Shiva Rajgopal 2005 The Economic implications of
corporate financial reporting Journal of Accounting and Economics 40 3-73
Greenspan Alan 2002 Testimony of Alan Greenspan before the Committee on Banking
Housing and Urban Affairs US Senate July 16 Washington DC Government Printing
Office
Grullon Gustavo and Roni Michaely 2002 Dividends Share Repurchases and the Substitution
Hypothesis Journal of Finance 57 1649-1684
Hail Luzi Ahmed Tahoun and Clare Wang 2014 Dividend Payouts and Information Shocks
Journal of Accounting Research 52 403-456
Hall Brian J and Kevin J Murphy 2002 Stock options for undiversified executives Journal of
Accounting amp Economics 33 3-42
39
Hall Brian J and Kevin J Murphy 2003 The trouble with stock options Journal of Economic
Perspectives 17 49ndash70
Hanlon Michelle and Jeffrey L Hoopes 2014 What do firms do when dividend tax rates change
An examination of alternative payout responses Journal of Financial Economics 114 105-
124
Hayes Rachel M Michael Lemmon and Mingming Qiu 2012 Stock options and managerial
incentives for risk taking Evidence from FAS123R Journal of Financial Economics 105
174ndash190
Heron Randall A Erik Lie 2007 Does backdating explain the stock price pattern around
executive stock option grants Journal of Financial Economics 83 271-295
Hribar Paul Nicole Thorne Jenkins and W Bruce Johnson 2006 Stock repurchases as an
earnings management device Journal of Accounting and Economics 41 3ndash27
Jensen Michael C 1986 Agency cost of free cash flow corporate finance and takeovers
American Economic Review 76 323-329
Jolls Christine 1998 Stock repurchases and incentive compensation NBER Working Paper No
w6467
Jung Boochun Woo-Jong Lee and Yanhua Sunny Yang 2016 The Impact of Dividend
Covenants on Investment and Operating Performance Journal of Business Finance amp
Accounting 43 414ndash447
Kahle Kathleen M 2002 When a buyback isnrsquot a buyback open market repurchases and
employee options Journal of Financial Economics 63 235ndash261
Lambert Richard A William N Lanen and David F Larcker 1989 Executive stock option plans
and corporate dividend policy Journal of Financial and Quantitative Analysis 24 409ndash425
Lintner John 1956 Distribution of incomes of corporations among dividends retained earnings
and taxes The American Economic Review 46 97-113
Low Angie 2009 Managerial risk-taking behavior and equity-based compensation Journal of
Financial Economics 92 470-490
Miller Merton H and Franco Modigliani 1961 Dividend policy growth and the valuation of
shares The Journal of Business 34 411ndash433
Minnick Kristina and Leonard Rosenthal 2015 Stealth compensation Do CEOs increase their
pay by influencing dividend policy Journal of Corporate Finance 25 435-454
40
Murphy Kevin J 1999 Executive compensation In O Ashenfelter and D Card (eds) North
Holland Handbook of Labor Economics Amsterdam Elsevier Science BV
Murphy Kevin J 2013 Executive compensation Where we are and how we got there Handbook
of the Economics of Finance Elsevier Science North Holland 211-356
Nikolaev Valeri 2010 Debt Covenants and Accounting Conservatism Journal of Accounting
Research 48 143-176
Puri Manju Joumlrg Rocholl and Sascha Steffen 2011 Global retail lending in the aftermath of the
US financial crisis Distinguishing between supply and demand effects Journal of Financial
Economics 100 556-578
Shue Kelly and Richard R Townsend 2014 Swinging for the fences Executive reactions to
quasi-random option grants Working Paper University of Chicago
Skinner Douglas J 2008 The evolving relation between earnings dividends and stock
repurchases Journal of Financial Economics 87 582-609
Weisbenner Scott J 2000 Corporate share repurchases in the 1990s What role do stock options
play FEDS Working Paper No 2000-29
Zhang Dan 2013 CEO dividend protection Working Paper BI Norwegian Business School
41
Figure 1 Trends of dividends and repurchases from 2003 to 2007 Panel A plots the average
Regular DividendTotal Assets of firms in the highest and lowest quartiles of Accounting Impact
measured in 2002 Panel B shows the average Total RepurchaseTotal Assets of firms in the
highest and lowest quartiles of Accounting Impact measured in 2002
Panel A Trends of regular dividends
Panel B Trends of total repurchases
00
05
10
15
20
2003 2004 2005 2006 2007
Regular DividendTotal Assets
Lowest Acc Impact
Highest Acc Impact
Pre Post
00
20
40
60
80
100
2003 2004 2005 2006 2007
Total Repurchase Total Assets
Lowest Acc Impact
Highest Acc Impact
Pre Post
42
Table 1
Summary Statistics
Panel A Firm characteristics - full sample
N Mean Std dev 25 pctl Median 75 pctl
Accounting impact (2002) 1176 173 366 022 052 163
Payout variablesRegular dividendTotal assets 5653 093 148 000 000 142
RepurchaseTotal assets 5653 394 710 000 035 500
Total payoutTotal assets 5653 488 748 000 175 666
Regular dividendTotal payout 4091 3874 4057 000 2237 8833
Level of executive compensation (in $1000)
Salary_$ 5653 450 190 314 409 544
Bonus_$ 5653 476 616 122 295 586
Option grant_$ 5653 791 1137 62 384 1002
Restricted stock grant_$ 5653 458 866 0 58 518
Total pay_$ 5653 2481 2475 890 1647 3074
Percentage of executive compensation
Salary_ 5653 296 183 165 251 382
Bonus_ 5653 197 148 97 177 268
Option grant_ 5653 283 235 67 256 445
Restricted stock grant_ 5653 141 180 00 41 249
Control variables
Size ($M) 5653 11086 27294 1017 2459 8117
Log(size) 5653 7985 1565 6925 7808 9002
Book-to-market 5653 0445 0287 0251 0388 0578
Leverage 5653 0202 0172 0038 0187 0309
Asset tangibility 5653 0806 0184 0691 0853 0965
Free cash flow 5653 0059 0091 0013 0059 0108
Cash holding 5653 0166 0172 0034 0100 0247
ROA volatility 5653 0056 0056 0021 0038 0070
Institutional ownership 5653 0753 0202 0639 0795 0910
Sales growth 5653 0121 0189 0028 0096 0183
Past stock return 5653 0094 0183 -0012 0094 0199
Loss indicator 5653 0164 0370 0000 0000 0000
This table presents summary statistics Panel A shows the descriptive statistics of payout variables compensation
variables and other firm characteristics for the full sample Accounting impact is the implied option expense
measured at fiscal year 2002 All other variables are measured at firm-year level from fiscal year 2003 to 2007
resulting in 5653 firm-year observations (except for Regular dividendTotal Payout which can be measured only
for the 4901 firm-year observations with Total payout greater than zero) Panel B shows the pairwise correlations
between main variables at firm-year level Panel C compares payout variables compensation variables and other
firm characteristics before and after FAS123R The Pre-FAS123R period consists of fiscal year 2003 and 2004
the Post-FAS123R period covers fiscal year 2005-2007 Panel D compares the trends of payout and compensation
variables around FAS123R across four quartile groups ranked by 2002 accounting impact Panel E compares the
trends of payout and compensation variables around FAS123R between the treated and control group under the
alternative treatment definition in Bakke et al (2015) (see Section 22) All variables are defined in Appendix The
notation and in Panel C indicates statistically significant at 10 5 and 1 level in T-tests for equal
means respectively
43
Pa
nel
B
Pea
rso
n c
orr
ela
tio
ns
Reg div
Repurchase
Total payout
Salary_
Bonus_
Option_
RS_
Log(size)
BM
Leverage
Tangibility
FCF
Cash holdingROA vol
Inst own
Sales growth
Past ret
urn
Loss
Reg
div
10
0
Repurc
hase
01
610
0
Tota
l payout
03
509
810
0
Sala
ry_
-0
10
-01
8-0
19
10
0
Bonus_
00
700
100
3-0
01
10
0
Option_
-0
10
00
900
6-0
41
-03
510
0
RS
_
01
000
901
0-0
32
-01
1-0
40
10
0
Log(s
ize)
03
101
802
3-0
56
01
101
202
210
0
BM
-02
1-0
28
-03
103
0-0
03
-02
000
0-0
33
10
0
Levera
ge
-00
1-0
08
-00
8-0
05
00
6-0
11
00
801
9-0
03
10
0
Tangib
ility
00
200
100
101
200
1-0
05
-00
6-0
12
-00
4-0
18
10
0
FC
F02
203
703
9-0
20
00
901
1-0
01
02
4-0
32
-02
1-0
16
10
0
Cash
hold
ing
-01
301
000
700
2-0
14
02
2-0
10
-02
3-0
16
-03
502
901
210
0
RO
A v
ol
-01
5-0
04
-00
700
4-0
11
01
9-0
11
-02
3-0
08
-01
101
2-0
02
03
910
0
Inst
ow
n
-00
901
401
1-0
17
00
200
701
200
7-0
01
00
3-0
08
01
4-0
06
-01
110
0
Sale
s gro
wth
-00
8-0
04
-00
6-0
15
00
501
0-0
02
00
7-0
16
-00
3-0
08
01
300
201
400
410
0
Past
retu
rn00
901
301
4-0
18
01
5-0
01
00
301
6-0
29
-01
000
102
7-0
14
-01
001
602
710
0
Loss
-02
0-0
19
-02
201
8-0
18
00
4-0
05
-02
601
901
300
6-0
41
01
702
3-0
16
-01
8-0
40
10
0
44
Panel C Firm characteristics - before and after FAS123R
Pre FAS 123R Post FAS 123R Difference
Payout variables
Regular dividendTotal assets 083 099 016
RepurchaseTotal assets 245 490 245
Total payoutTotal assets 328 589 261
Regular dividendTotal payout 3914 2790 -1124
Level of executive compensation (in $1000)
Salary_$ 426 463 37
Bonus_$ 418 505 87
Option grant_$ 896 707 -191
Restricted stock grant_$ 269 574 305
Total pay_$ 2263 2584 321
Percentage of executive compensation
Salary_ 305 293 -12
Bonus_ 186 204 18
Option grant_ 343 240 -103
Restricted stock grant_ 87 176 89
Control variables
Size ($M) 9671 11631 1960
Log(size) 7860 8035 0175
Book-to-market 0437 0453 0016
Leverage 0201 0203 0002
Asset tangibility 0822 0793 -0029
Free cash flow 0061 0057 -0004
Cash holding 0175 0159 -0016
ROA volatility 0067 0048 -0019
Institutional ownership 0712 0781 0069
Sales growth 0137 0108 -0029
Past stock return 0080 0101 0021
Loss indicator 0173 0159 -0014
45
Pa
nel
D
Fir
m c
ha
racte
rist
ics
by q
ua
rtil
e o
f a
cco
un
tin
g i
mp
act
- b
efo
re a
nd
aft
er
FA
S1
23
R
Accounting im
pact
(2002)
Num
ber
of
Fir
ms
Pre
Post
Pre
Post
Pre
Post
Pre
Post
Payout
vari
able
s
Regula
r div
idendT
ota
l ass
ets
11
2
12
4
09
4
11
1
09
5
11
3
03
0
04
9
Repurc
hase
Tota
l ass
ets
11
3
26
8
19
2
37
3
32
7
63
1
35
1
68
7
Tota
l payout
Tota
l ass
ets
22
4
39
1
28
5
48
4
42
2
74
4
38
1
73
6
Regula
r div
idendT
ota
l payout
643
7
469
8
474
0
341
1
284
5
195
4
82
5
74
5
Perc
enta
ge o
f executive c
om
pensa
tion
Sala
ry_
337
295
313
287
296
289
276
300
Bonus_
223
226
214
228
172
192
134
169
Option g
rant_
201
167
290
210
373
260
507
325
Rest
ricte
d s
tock g
rant_
116
194
98
180
89
176
43
155
294
294
294
294
1st Q
uart
ile2
nd Q
uart
ile3
rd Q
uart
ile4
th Q
uart
ile
01
2
03
5
09
3
55
1
46
Accounting impact
Number of Firms
By accounting impact quartile
1
2
3
4
Pre Post Pre Post
Payout variables
Regular dividendTotal assets 09 11 08 10
RepurchaseTotal assets 18 31 26 52
Total payoutTotal assets 28 43 34 62
Regular dividendTotal payout 428 357 386 265
Percentage of executive compensation
Salary_ 435 364 282 280
Bonus_ 226 214 179 202
Option grant_ 92 125 387 261
Restricted stock grant_ 125 188 80 174
Percentage of CEO compensation
Salary_(CEO) 485 364 260 259
Bonus_(CEO) 249 228 185 219
Option grant_(CEO) 10 127 406 275
Restricted stock grant_(CEO) 128 182 82 183
Panel E Firm characteristics by alternative treatment definition - before and
after FAS123R
Treated
25
19
997
223
250
256
268
10
177
71
Control
44
37
47
Table 2
Differential effect of FAS123R on the use of option-based compensation
Panel A Two-period first-difference regression
Prediction Coeff t-stat Coeff t-stat Coeff t-stat
Accounting impact rank - -0044 -628
Accounting impact rank=2 - -0044 -327
Accounting impact rank=3 - -0075 -468
Accounting impact rank=4 - -0140 -613
Treated - -0132 -875
ΔLog(size) 0061 202 0061 200 0063 214
ΔBook-to-market 0032 091 0032 092 0051 143
ΔLeverage -0157 -213 -0160 -218 -0111 -153
ΔAsset tangibility -0012 -014 -0020 -023 -0023 -026
ΔFree cash flow -0106 -095 -0108 -097 -0128 -117
ΔCash holding -0197 -211 -0193 -206 -0180 -194
ΔFive-year ROA volatility -0065 -031 -0056 -026 -0098 -047
ΔInstitutional ownership -0044 -091 -0043 -088 -0044 -092
ΔSales growth -0064 -102 -0065 -104 -0090 -153
ΔPast one-year stock return 0051 078 0052 080 0091 138
ΔLoss frequency 0056 207 0057 207 0047 179
Log(size) -0009 -210 -0009 -207 -0002 -035
Book-to-market -0015 -056 -0013 -049 0018 072
Leverage 0022 046 0023 048 0068 150
Asset tangibility 0033 077 0033 078 0053 128
Free cash flow 0227 202 0220 195 0127 117
Cash holding -0002 -004 0012 019 -0078 -141
Five-year ROA volatility -0451 -240 -0430 -228 -0509 -283
Institutional ownership -0123 -360 -0122 -359 -0100 -292
Sales growth -0041 -056 -0040 -055 -0089 -125
Past one-year stock return -0009 -015 -0006 -010 0078 125
Loss frequency 0055 174 0056 178 0054 173
Fixed effect
Standard error
Adj R-squared
Observations
Model (3)
Dependent variable ΔAvg Option grantTotal pay
Huber-White
0156
This table investigates whether the effect of FAS123R on the use of option-based pay varies with its potential accounting impact Panel A
reports the results of estimating three two-period first-differencing models where for each firm we average its characteristics in Pre- and
Post-FAS123R period The Pre-FAS123R period consists of fiscal year 2003 and 2004 the Post-FAS123R period covers fiscal year 2005-
2007 In all three specifications the dependent variable is the change of average Option grantTotal pay from Pre- to Post-FAS123R period
The main independent variable varies by model in Model (1) the Accounting impact rank is the quartile rank of implied option expensetotal
assets measured in 2002 (1=lowest 4=highest) In Model (2) Accounting impact rank=2 (3 4) is an indicator that takes value of one if the
firmrsquos Accounting impact rank equals 2 (3 4) In Model (3) we use an alternative treatment construction following Bakke et al (2015)
where Treated is an indicator that takes value of zero if the firm granted zero option to its CEO in both 2003 and 2004 or the firm began to
voluntarily expense option-based pay at fair value in 2002 or earlier and one otherwise For each control variable we include both its level in
the Pre-FAS123R period and its change across the two periods Panel B shows the results of estimating fixed effect models with firm-year
observations The dependent variable is the firm-year level Option grantTotal pay The main independent variables are the interactions of
Post-FAS123R indicator (Post) with Accounting Impact rank Accounting impact rank indicators and Treated respectively All models in
Penal A have industry fixed effects and the standard errors are Huber-White heteroscedasticity-consistent standard errors All models in
Penal B have firm fixed effects and year fixed effects and the standard errors are clustered at firm level All variables are defined in
Appendix The notation and indicates statistically significant at 10 5 and 1 level respectively
Model (1) Model (2)
11711171 1171
Industry Industry
Huber-White
0124
Huber-White
0123
Industry
48
Panel B Panel fixed effects regression
Prediction Coeff t-stat Coeff t-stat Coeff t-stat
Acc impact rank x Post - -0044 -807
Acc impact rank 2 x Post - -0046 -333
Acc impact rank 3 x Post - -0077 -526
Acc impact rank 4 x Post - -0137 -776
Treated x Post - -0145 -970
Log(size) 0034 221 0034 217 0036 229
Book-to-market 0018 084 0017 083 0015 070
Leverage -0004 -009 -0006 -013 -0007 -015
Asset tangibility 0007 012 0004 006 0011 018
Free cash flow -0074 -151 -0072 -146 -0078 -158
Cash holding -0048 -086 -0050 -090 -0006 -011
Five-year ROA volatility 0250 231 0239 219 0437 414
Institutional ownership 0043 159 0044 161 0041 150
Sales growth -0033 -168 -0034 -171 -0031 -158
Past one-year stock return 0067 221 0068 224 0063 204
Loss indicator 0023 209 0022 207 0024 222
Fixed effects
Standard error
Adj R-squared
Observations
Dependent variable Option grantTotal pay
5653 5653 5653
Clustered by firm
Firm Year
Clustered by firm
Firm Year
Clustered by firm
0523 0523 0526
Model (1) Model (2) Model (3)
Firm Year
49
Table 3
Effect of option-based compensation on dividend policy
Panel A Two-period first-difference regression
Prediction Coeff t-stat Coeff t-stat Coeff t-stat
Accounting impact rank + 0000 077
Accounting impact rank=2 + 0001 091
Accounting impact rank=3 + 0000 044
Accounting impact rank=4 + 0001 092
Treated + 0000 -026
ΔLog(size) 0000 -030 0000 -030 0000 -026
ΔBook-to-market -0002 -190 -0002 -193 -0002 -195
ΔLeverage -0002 -059 -0002 -057 -0002 -059
ΔAsset tangibility 0016 431 0016 429 0016 430
ΔFree cash flow 0017 373 0017 373 0017 375
ΔCash holding -0011 -288 -0011 -285 -0010 -282
ΔFive-year ROA volatility 0003 034 0002 032 0003 035
ΔInstitutional ownership -0002 -073 -0002 -073 -0002 -070
ΔSales growth -0001 -040 -0001 -037 -0001 -038
ΔPast one-year stock return 0002 077 0002 076 0002 070
ΔLoss frequency 0000 -048 0000 -045 0000 -046
Log(size) 0000 183 0000 182 0000 182
Book-to-market -0002 -227 -0002 -225 -0002 -284
Leverage -0001 -037 -0001 -039 -0001 -048
Asset tangibility 0003 179 0003 180 0003 176
Free cash flow 0017 291 0017 291 0017 300
Cash holding 0002 080 0002 077 0002 098
Five-year ROA volatility 0003 035 0002 033 0003 044
Institutional ownership -0001 -068 -0001 -068 -0001 -058
Sales growth -0004 -177 -0004 -175 -0004 -172
Past one-year stock return 0004 169 0004 167 0004 165
Loss frequency -0001 -111 -0001 -109 -0001 -102
Fixed effect
Standard error
Adj R-squared
Observations
Dependent variable ΔAvg Regular dividendTotal assets
This table investigates the causal effect of option-based pay on dividend policy by examining whether changes in dividend policy around
FAS123R vary with its potential accounting impact Panel A reports the results of estimating three two-period first-differencing models
where for each firm we average its characteristics in Pre- and Post-FAS123R period In all three specifications the dependent variable is
the change of average Regular dividendTotal assets from Pre- to Post-FAS123R period The main independent variable varies by model in
Model (1) the Accounting impact rank is the quartile rank of implied option expensetotal assets measured in 2002 (1=lowest 4=highest) In
Model (2) Accounting impact rank=2 (3 4) is an indicator that takes value of one if the firmrsquos Accounting impact rank equals 2 (3 4) In
Model (3) we use an alternative treatment construction following Bakke et al (2015) where Treated is an indicator that takes value of zero
if the firm granted zero option to its CEO in both 2003 and 2004 or the firm began to voluntarily expense option-based pay at fair value in
2002 or earlier and one otherwise For each control variable we include both its level in the Pre-FAS123R period and its change across the
two periods Panel B shows the results of estimating fixed effect models with firm-year observations The dependent variable is the firm-
year level Regular dividendTotal assets The main independent variables are the interactions of Post-FAS123R indicator (Post) with
Accounting Impact rank Accounting impact rank indicators and Treated respectively Panel C examines the intensity of dividend changes
among firms with nonzero dividend per share in 2003 or 2004 In particular we estimates the same three models as in Panel A(with the
same independent variables) but for five dependent variables the change of average Regular dividendTotal assets from Pre- to Post-
FAS123R period (as in Panel A) the percentage change of DPS (dividend per share) from Pre- to Post-FAS123R period and three
indicators denoting respectively whether the percentage change of DPS was greater than 20 40 and 60 Panel D reports four
robustness tests of the dividend intensity regression In each of them a set of possible confounding observations is removed (see Section 33
for details) Panel E compares the trends of dividend initiation and termination around FAS123R across four quartile groups ranked by
accounting impact All models in Panel A C and D have industry fixed effects and the standard errors are Huber-White heteroscedasticity-
consistent standard errors All models in Penal B have firm fixed effects and year fixed effects and the standard errors are clustered at
firm level All variables are defined in Appendix The notation and indicates statistically significant at 10 5 and 1 level
Industry Industry Industry
Model (1) Model (2) Model (3)
1171 1171 1171
Huber-White Huber-White Huber-White
0105 0104 0105
50
Panel B Panel fixed effects regression
Prediction Coeff t-stat Coeff t-stat Coeff t-stat
Acc impact rank x Post + 0000 122
Acc impact rank 2 x Post + 0001 110
Acc impact rank 3 x Post + 0001 094
Acc impact rank 4 x Post + 0001 129
Treated x Post + 0000 -012
Log(size) 0001 179 0001 179 0001 181
Book-to-market 0000 025 0000 024 0000 031
Leverage 0001 062 0001 064 0001 069
Asset tangibility 0009 360 0009 358 0009 363
Free cash flow 0002 090 0002 093 0002 092
Cash holding -0007 -295 -0007 -298 -0007 -298
Five-year ROA volatility 0001 041 0001 038 0000 -006
Institutional ownership 0000 -027 0000 -026 0000 -027
Sales growth 0000 053 0000 051 0000 044
Past one-year stock return 0001 089 0001 088 0001 078
Loss indicator 0000 -060 0000 -057 0000 -076
Fixed effects
Standard error
Adj R-squared
Observations
Dependent variable Regular dividendTotal assets
Model (1) Model (2) Model (3)
Firm Year Firm Year Firm Year
5653 5653 5653
Clustered by firm Clustered by firm Clustered by firm
0877 0877 0877
51
Panel C Intensity of dividend changes around FAS123R
Prediction Coeff t-stat Coeff t-stat Coeff t-stat
Accounting impact rank + 0000 065
Accounting impact rank=2 + 0000 048
Accounting impact rank=3 + 0000 026
Accounting impact rank=4 + 0002 080
Treated + 0001 063
Dependent var DPS pct change
Accounting impact rank + -0145 -072
Accounting impact rank=2 + 0018 006
Accounting impact rank=3 + -0177 -045
Accounting impact rank=4 + -0746 -100
Treated + -0407 -119
Accounting impact rank + 0029 095
Accounting impact rank=2 + 0040 074
Accounting impact rank=3 + 0092 139
Accounting impact rank=4 + 0008 007
Treated + -0007 -012
Accounting impact rank + 0024 076
Accounting impact rank=2 + 0047 088
Accounting impact rank=3 + 0079 114
Accounting impact rank=4 + -0003 -002
Treated + 0030 052
Accounting impact rank + 0030 098
Accounting impact rank=2 + 0078 155
Accounting impact rank=3 + 0085 130
Accounting impact rank=4 + 0014 012
Treated + -0006 -011
Control variables
Fixed effect
Standard error
Observations 572 572 572
Yes Yes Yes
Huber-White Huber-White Huber-White
Industry Industry Industry
Dependent var DPS pct
change gt60 indicator
Model (1) Model (2) Model (3)
Dependent var ΔAvg Regular
dividendAssets
Dependent var DPS pct
change gt20 indicator
Dependent var DPS pct
change gt40 indicator
52
Panel D Robustness tests for intensity of dividend changes around FAS123R
Prediction Coeff t-stat Coeff t-stat Coeff t-stat
Accounting impact rank + 0006 017
Accounting impact rank=2 + 0067 118
Accounting impact rank=3 + 0041 057
Accounting impact rank=4 + -0061 -049
Treated + 0022 035Observations
Accounting impact rank + 0009 027
Accounting impact rank=2 + 0058 106
Accounting impact rank=3 + 0032 043
Accounting impact rank=4 + -0032 -024
Treated + 0018 028
Observations
Accounting impact rank + 0030 089
Accounting impact rank=2 + 0039 071
Accounting impact rank=3 + 0122 168
Accounting impact rank=4 + -0063 -052
Treated + 0075 132
Observations
Accounting impact rank + 0008 023
Accounting impact rank=2 + 0023 042
Accounting impact rank=3 + 0048 064
Accounting impact rank=4 + -0042 -033
Treated + -0010 -016
Observations
Control variables
Fixed effect
Standard error
Exclude firms with stable
payout ratio from 2003 to 2004
506 506 506
Dependent variable DPS pct change gt40 indicator
Model (1) Model (2) Model (3)
Exclude voluntary expensers
519 519
Exclude firms in the top decile
of option reduction (02-04)
Exclude firms that accelerated
option vesting
504 504 504
517 517 517
519
Huber-White Huber-White Huber-White
Yes Yes Yes
Industry Industry Industry
53
Panel E Dividend initiation and termination rates around FAS123R
Pre FAS 123R
1 280 75 7 6 13 173
2 284 135 18 9 27 200
3 286 181 11 14 25 138
4 282 260 9 10 19 73
Total 1132 651 45 39 84 129
Post FAS 123R
1 275 63 4 4 8 127
2 280 116 9 9 18 155
3 276 152 9 3 12 79
4 263 223 5 1 6 27
Total 1094 554 27 17 44 79
Pre FAS 123R
1 280 205 2 0 2 10
2 284 149 7 1 8 54
3 286 105 0 0 0 00
4 282 22 0 0 0 00
Total 1132 481 9 1 10 21
Post FAS 123R
1 275 212 3 6 9 42
2 280 164 1 2 3 18
3 276 124 1 1 2 16
4 263 40 0 3 3 75
Total 1094 540 5 12 17 31
termination
in 2004
03-04
cumulative
03-04
cumulative
Quartile firms
with
dividend in
2004
termination
in 2005
termination
in 2006
05-06
cumulative
05-06
cumulative
Termination
Quartile firms
with
dividend in
2002
termination
in 2003
without
dividend in
2004
initiation in
2003
initiation in
2004
03-04
cumulative
03-04
cumulative firmsQuartile
firmsQuartile initiation in
2005
initiation in
2006
05-06
cumulative
05-06
cumulative
Initiation
without
dividend in
2002
54
Table 4
Effect of option-based compensation on repurchases
Panel A Two-period first-difference regression with total repurchase
Prediction Coeff t-stat Coeff t-stat Coeff t-stat
Accounting impact rank - 0002 122
Accounting impact rank=2 - 0002 071
Accounting impact rank=3 - 0005 123
Accounting impact rank=4 - 0007 102
Treated - 0014 365
Control variables
Fixed effect
Standard error
Adj R-squared
Observations
Panel B Two-period first-difference regression with net repurchase
Prediction Coeff t-stat Coeff t-stat Coeff t-stat
Accounting impact rank - 0003 166
Accounting impact rank=2 - 0002 051
Accounting impact rank=3 - 0006 165
Accounting impact rank=4 - 0009 137
Treated - 0010 300
Control variables
Fixed effect
Standard error
Adj R-squared
Observations
Panel C Two-period first-difference regression with repurchase adjusted for exercised options
Prediction Coeff t-stat Coeff t-stat Coeff t-stat
Accounting impact rank - 0001 056
Accounting impact rank=2 - 0002 062
Accounting impact rank=3 - 0007 172
Accounting impact rank=4 - -0001 -008
Treated - 0006 197
Control variables
Fixed effect
Standard error
Adj R-squared
Observations
Dependent variable ΔAvg RepurchaseTotal assets
This table investigates the causal effect of option-based pay on payout policy by examining whether the changes of repurchase around
FAS123R vary with its potential accounting impact Panel A reports the results of estimating three two-period first-differencing models
where for each firm we average its characteristics in Pre- and Post-FAS123R period In all three specifications the dependent variable is
the change of average RepurchaseTotal assets from Pre- to Post-FAS123R period The main independent variable varies by model in
Model (1) the Accounting impact rank is the quartile rank of implied option expensetotal assets measured in 2002 (1=lowest 4=highest)
In Model (2) Accounting impact rank=2 (3 4) is an indicator that takes value of one if the firmrsquos Accounting impact rank equals 2 (3 4)
In Model (3) we use an alternative treatment construction following Bakke et al (2015) where Treated is an indicator that takes value of
zero if the firm granted zero option to its CEO in both 2003 and 2004 or the firm began to voluntarily expense option-based pay at fair
value in 2002 or earlier and one otherwise Panel B reports the regressions with the change of Net repurchaseTotal assets as the
dependent variable and the same independent variable as in Panel A Panel C reports the regressions with the change of Adjusted
repurchaseTotal assets as the dependent variable and the same independent variable as in Panel A All models in Panel A B and C have
industry fixed effects and the standard errors are Huber-White heteroscedasticity-consistent standard errors All variables are defined in
Appendix The notation and indicates statistically significant at 10 5 and 1 level respectively
Model (1) Model (2) Model (3)
Yes Yes Yes
Industry Industry Industry
Huber-White Huber-White Huber-White
Dependent variable ΔAvg Net repurchaseTotal assets
1171 1171 1171
0238 0237 0245
Model (1) Model (2) Model (3)
Yes Yes Yes
Industry Industry Industry
Huber-White Huber-White Huber-White
Dependent variable ΔAvg Adjusted repurchaseTotal assets
0229 0229 0233
1171 1171 1171
Model (1) Model (2) Model (3)
Yes Yes Yes
Industry Industry Industry
Huber-White Huber-White Huber-White
0111 0112 0114
1168 1168 1168
55
Table 5
Effect of option-based compensation on payout mix
Panel A Two-period first-difference regression with total payout mix
Prediction Coeff t-stat Coeff t-stat Coeff t-stat
Accounting impact rank + 0006 028
Accounting impact rank=2 + 0018 045
Accounting impact rank=3 + -0001 -001
Accounting impact rank=4 + 0043 052
Treated + -0035 -094
Control variables
Fixed effect
Standard error
Adj R-squared
Observations
Panel B Two-period first-difference regression with net payout mix
Prediction Coeff t-stat Coeff t-stat Coeff t-stat
Accounting impact rank + -0002 -008
Accounting impact rank=2 + 0008 016
Accounting impact rank=3 + 0018 034
Accounting impact rank=4 + -0059 -055
Treated + -0050 -101
Control variables
Fixed effect
Standard error
Adj R-squared
Observations
0049 0043 0054
257 257 257
Industry Industry Industry
Huber-White Huber-White Huber-White
Dependent variable ΔAvg Regular dividendNet payout
Model (1) Model (2) Model (3)
Yes Yes Yes
0154 0151 0156
362 362 362
Industry Industry Industry
Huber-White Huber-White Huber-White
This table investigates the causal effect of option-based pay on payout mix for firms using both dividend and repurchase by examining
whether the changes of payout mix around FAS123R vary with its potential accounting impact Panel A reports the results of estimating
three two-period first-differencing models where for each firm we average its characteristics in Pre- and Post-FAS123R period In all three
specifications the dependent variable is the change of average Regular dividendTotal payout from Pre- to Post-FAS123R period The main
independent variable varies by model in Model (1) the Accounting impact rank is the quartile rank of implied option expensetotal assets
measured in 2002 (1=lowest 4=highest) In Model (2) Accounting impact rank=2 (3 4) is an indicator that takes value of one if the firmrsquos
Accounting impact rank equals 2 (3 4) In Model (3) we use an alternative treatment construction following Bakke et al (2015) where
Treated is an indicator that takes value of zero if the firm granted zero option to its CEO in both 2003 and 2004 or the firm began to
voluntarily expense option-based pay at fair value in 2002 or earlier and one otherwise Panel B reports the regressions with the change of
Regular dividendNet payout as the dependent variable and the same independent variables as in Panel A Panel A (Panel B) is based on
observations with nonzero regular dividend and repurchase (net repurchase) in both Pre- and Post-FAS123R period All models in Panel A
and B have industry fixed effects and the standard errors are Huber-White heteroscedasticity-consistent standard errors All variables are
defined in Appendix The notation and indicates statistically significant at 10 5 and 1 level respectively
Yes Yes Yes
Dependent variable ΔAvg Regular dividendTotal payout
Model (1) Model (2) Model (3)

38
Fama Eugene F and Kenneth R French 2001 Disappearing dividends changing firm
characteristics or lower propensity to pay Journal of Financial Economics 60 3ndash43
Farre-Mensa Joan Roni Michaely and Martin C Schmalz 2014 Payout policy Annual Review
of Financial Economics 6 75ndash134
Fenn George W and Nellie Liang 2001 Corporate payout policy and managerial stock
incentives Journal of Financial Economics 60 45ndash72
Ferri Fabrizio and Tatiana Sandino 2009 The impact of shareholder activism on financial
reporting and compensation the case of employee stock options expensing The Accounting
Review 84 433ndash466
Floyd Eric Nan Li and Douglas J Skinner 2015 Payout policy through the financial crisis the
growth of repurchases and the resilience of dividends Journal of Financial Economics 118
299-316
Frydman Carola and Dirk Jenter 2010 CEO compensation Annual Review of Financial
Economics 2 75-102
Gipper Brandon 2015 Assessing the Effects of Disclosing Management Compensation Working
Paper University of Chicago
Gormley Todd David Matsa and Todd Milbourn 2013 CEO compensation and corporate risk
evidence from a natural experiment Journal of Accounting and Economics 56 79-101
Graham John Michelle Hanlon and Terry Shevlin 2011 Real effects of accounting rules
evidence from multinational firmsrsquo investment locations and profit repatriation decisions
Journal of Accounting Research 49 137-185
Graham John Campbell Harvey and Shiva Rajgopal 2005 The Economic implications of
corporate financial reporting Journal of Accounting and Economics 40 3-73
Greenspan Alan 2002 Testimony of Alan Greenspan before the Committee on Banking
Housing and Urban Affairs US Senate July 16 Washington DC Government Printing
Office
Grullon Gustavo and Roni Michaely 2002 Dividends Share Repurchases and the Substitution
Hypothesis Journal of Finance 57 1649-1684
Hail Luzi Ahmed Tahoun and Clare Wang 2014 Dividend Payouts and Information Shocks
Journal of Accounting Research 52 403-456
Hall Brian J and Kevin J Murphy 2002 Stock options for undiversified executives Journal of
Accounting amp Economics 33 3-42
39
Hall Brian J and Kevin J Murphy 2003 The trouble with stock options Journal of Economic
Perspectives 17 49ndash70
Hanlon Michelle and Jeffrey L Hoopes 2014 What do firms do when dividend tax rates change
An examination of alternative payout responses Journal of Financial Economics 114 105-
124
Hayes Rachel M Michael Lemmon and Mingming Qiu 2012 Stock options and managerial
incentives for risk taking Evidence from FAS123R Journal of Financial Economics 105
174ndash190
Heron Randall A Erik Lie 2007 Does backdating explain the stock price pattern around
executive stock option grants Journal of Financial Economics 83 271-295
Hribar Paul Nicole Thorne Jenkins and W Bruce Johnson 2006 Stock repurchases as an
earnings management device Journal of Accounting and Economics 41 3ndash27
Jensen Michael C 1986 Agency cost of free cash flow corporate finance and takeovers
American Economic Review 76 323-329
Jolls Christine 1998 Stock repurchases and incentive compensation NBER Working Paper No
w6467
Jung Boochun Woo-Jong Lee and Yanhua Sunny Yang 2016 The Impact of Dividend
Covenants on Investment and Operating Performance Journal of Business Finance amp
Accounting 43 414ndash447
Kahle Kathleen M 2002 When a buyback isnrsquot a buyback open market repurchases and
employee options Journal of Financial Economics 63 235ndash261
Lambert Richard A William N Lanen and David F Larcker 1989 Executive stock option plans
and corporate dividend policy Journal of Financial and Quantitative Analysis 24 409ndash425
Lintner John 1956 Distribution of incomes of corporations among dividends retained earnings
and taxes The American Economic Review 46 97-113
Low Angie 2009 Managerial risk-taking behavior and equity-based compensation Journal of
Financial Economics 92 470-490
Miller Merton H and Franco Modigliani 1961 Dividend policy growth and the valuation of
shares The Journal of Business 34 411ndash433
Minnick Kristina and Leonard Rosenthal 2015 Stealth compensation Do CEOs increase their
pay by influencing dividend policy Journal of Corporate Finance 25 435-454
40
Murphy Kevin J 1999 Executive compensation In O Ashenfelter and D Card (eds) North
Holland Handbook of Labor Economics Amsterdam Elsevier Science BV
Murphy Kevin J 2013 Executive compensation Where we are and how we got there Handbook
of the Economics of Finance Elsevier Science North Holland 211-356
Nikolaev Valeri 2010 Debt Covenants and Accounting Conservatism Journal of Accounting
Research 48 143-176
Puri Manju Joumlrg Rocholl and Sascha Steffen 2011 Global retail lending in the aftermath of the
US financial crisis Distinguishing between supply and demand effects Journal of Financial
Economics 100 556-578
Shue Kelly and Richard R Townsend 2014 Swinging for the fences Executive reactions to
quasi-random option grants Working Paper University of Chicago
Skinner Douglas J 2008 The evolving relation between earnings dividends and stock
repurchases Journal of Financial Economics 87 582-609
Weisbenner Scott J 2000 Corporate share repurchases in the 1990s What role do stock options
play FEDS Working Paper No 2000-29
Zhang Dan 2013 CEO dividend protection Working Paper BI Norwegian Business School
41
Figure 1 Trends of dividends and repurchases from 2003 to 2007 Panel A plots the average
Regular DividendTotal Assets of firms in the highest and lowest quartiles of Accounting Impact
measured in 2002 Panel B shows the average Total RepurchaseTotal Assets of firms in the
highest and lowest quartiles of Accounting Impact measured in 2002
Panel A Trends of regular dividends
Panel B Trends of total repurchases
00
05
10
15
20
2003 2004 2005 2006 2007
Regular DividendTotal Assets
Lowest Acc Impact
Highest Acc Impact
Pre Post
00
20
40
60
80
100
2003 2004 2005 2006 2007
Total Repurchase Total Assets
Lowest Acc Impact
Highest Acc Impact
Pre Post
42
Table 1
Summary Statistics
Panel A Firm characteristics - full sample
N Mean Std dev 25 pctl Median 75 pctl
Accounting impact (2002) 1176 173 366 022 052 163
Payout variablesRegular dividendTotal assets 5653 093 148 000 000 142
RepurchaseTotal assets 5653 394 710 000 035 500
Total payoutTotal assets 5653 488 748 000 175 666
Regular dividendTotal payout 4091 3874 4057 000 2237 8833
Level of executive compensation (in $1000)
Salary_$ 5653 450 190 314 409 544
Bonus_$ 5653 476 616 122 295 586
Option grant_$ 5653 791 1137 62 384 1002
Restricted stock grant_$ 5653 458 866 0 58 518
Total pay_$ 5653 2481 2475 890 1647 3074
Percentage of executive compensation
Salary_ 5653 296 183 165 251 382
Bonus_ 5653 197 148 97 177 268
Option grant_ 5653 283 235 67 256 445
Restricted stock grant_ 5653 141 180 00 41 249
Control variables
Size ($M) 5653 11086 27294 1017 2459 8117
Log(size) 5653 7985 1565 6925 7808 9002
Book-to-market 5653 0445 0287 0251 0388 0578
Leverage 5653 0202 0172 0038 0187 0309
Asset tangibility 5653 0806 0184 0691 0853 0965
Free cash flow 5653 0059 0091 0013 0059 0108
Cash holding 5653 0166 0172 0034 0100 0247
ROA volatility 5653 0056 0056 0021 0038 0070
Institutional ownership 5653 0753 0202 0639 0795 0910
Sales growth 5653 0121 0189 0028 0096 0183
Past stock return 5653 0094 0183 -0012 0094 0199
Loss indicator 5653 0164 0370 0000 0000 0000
This table presents summary statistics Panel A shows the descriptive statistics of payout variables compensation
variables and other firm characteristics for the full sample Accounting impact is the implied option expense
measured at fiscal year 2002 All other variables are measured at firm-year level from fiscal year 2003 to 2007
resulting in 5653 firm-year observations (except for Regular dividendTotal Payout which can be measured only
for the 4901 firm-year observations with Total payout greater than zero) Panel B shows the pairwise correlations
between main variables at firm-year level Panel C compares payout variables compensation variables and other
firm characteristics before and after FAS123R The Pre-FAS123R period consists of fiscal year 2003 and 2004
the Post-FAS123R period covers fiscal year 2005-2007 Panel D compares the trends of payout and compensation
variables around FAS123R across four quartile groups ranked by 2002 accounting impact Panel E compares the
trends of payout and compensation variables around FAS123R between the treated and control group under the
alternative treatment definition in Bakke et al (2015) (see Section 22) All variables are defined in Appendix The
notation and in Panel C indicates statistically significant at 10 5 and 1 level in T-tests for equal
means respectively
43
Pa
nel
B
Pea
rso
n c
orr
ela
tio
ns
Reg div
Repurchase
Total payout
Salary_
Bonus_
Option_
RS_
Log(size)
BM
Leverage
Tangibility
FCF
Cash holdingROA vol
Inst own
Sales growth
Past ret
urn
Loss
Reg
div
10
0
Repurc
hase
01
610
0
Tota
l payout
03
509
810
0
Sala
ry_
-0
10
-01
8-0
19
10
0
Bonus_
00
700
100
3-0
01
10
0
Option_
-0
10
00
900
6-0
41
-03
510
0
RS
_
01
000
901
0-0
32
-01
1-0
40
10
0
Log(s
ize)
03
101
802
3-0
56
01
101
202
210
0
BM
-02
1-0
28
-03
103
0-0
03
-02
000
0-0
33
10
0
Levera
ge
-00
1-0
08
-00
8-0
05
00
6-0
11
00
801
9-0
03
10
0
Tangib
ility
00
200
100
101
200
1-0
05
-00
6-0
12
-00
4-0
18
10
0
FC
F02
203
703
9-0
20
00
901
1-0
01
02
4-0
32
-02
1-0
16
10
0
Cash
hold
ing
-01
301
000
700
2-0
14
02
2-0
10
-02
3-0
16
-03
502
901
210
0
RO
A v
ol
-01
5-0
04
-00
700
4-0
11
01
9-0
11
-02
3-0
08
-01
101
2-0
02
03
910
0
Inst
ow
n
-00
901
401
1-0
17
00
200
701
200
7-0
01
00
3-0
08
01
4-0
06
-01
110
0
Sale
s gro
wth
-00
8-0
04
-00
6-0
15
00
501
0-0
02
00
7-0
16
-00
3-0
08
01
300
201
400
410
0
Past
retu
rn00
901
301
4-0
18
01
5-0
01
00
301
6-0
29
-01
000
102
7-0
14
-01
001
602
710
0
Loss
-02
0-0
19
-02
201
8-0
18
00
4-0
05
-02
601
901
300
6-0
41
01
702
3-0
16
-01
8-0
40
10
0
44
Panel C Firm characteristics - before and after FAS123R
Pre FAS 123R Post FAS 123R Difference
Payout variables
Regular dividendTotal assets 083 099 016
RepurchaseTotal assets 245 490 245
Total payoutTotal assets 328 589 261
Regular dividendTotal payout 3914 2790 -1124
Level of executive compensation (in $1000)
Salary_$ 426 463 37
Bonus_$ 418 505 87
Option grant_$ 896 707 -191
Restricted stock grant_$ 269 574 305
Total pay_$ 2263 2584 321
Percentage of executive compensation
Salary_ 305 293 -12
Bonus_ 186 204 18
Option grant_ 343 240 -103
Restricted stock grant_ 87 176 89
Control variables
Size ($M) 9671 11631 1960
Log(size) 7860 8035 0175
Book-to-market 0437 0453 0016
Leverage 0201 0203 0002
Asset tangibility 0822 0793 -0029
Free cash flow 0061 0057 -0004
Cash holding 0175 0159 -0016
ROA volatility 0067 0048 -0019
Institutional ownership 0712 0781 0069
Sales growth 0137 0108 -0029
Past stock return 0080 0101 0021
Loss indicator 0173 0159 -0014
45
Pa
nel
D
Fir
m c
ha
racte
rist
ics
by q
ua
rtil
e o
f a
cco
un
tin
g i
mp
act
- b
efo
re a
nd
aft
er
FA
S1
23
R
Accounting im
pact
(2002)
Num
ber
of
Fir
ms
Pre
Post
Pre
Post
Pre
Post
Pre
Post
Payout
vari
able
s
Regula
r div
idendT
ota
l ass
ets
11
2
12
4
09
4
11
1
09
5
11
3
03
0
04
9
Repurc
hase
Tota
l ass
ets
11
3
26
8
19
2
37
3
32
7
63
1
35
1
68
7
Tota
l payout
Tota
l ass
ets
22
4
39
1
28
5
48
4
42
2
74
4
38
1
73
6
Regula
r div
idendT
ota
l payout
643
7
469
8
474
0
341
1
284
5
195
4
82
5
74
5
Perc
enta
ge o
f executive c
om
pensa
tion
Sala
ry_
337
295
313
287
296
289
276
300
Bonus_
223
226
214
228
172
192
134
169
Option g
rant_
201
167
290
210
373
260
507
325
Rest
ricte
d s
tock g
rant_
116
194
98
180
89
176
43
155
294
294
294
294
1st Q
uart
ile2
nd Q
uart
ile3
rd Q
uart
ile4
th Q
uart
ile
01
2
03
5
09
3
55
1
46
Accounting impact
Number of Firms
By accounting impact quartile
1
2
3
4
Pre Post Pre Post
Payout variables
Regular dividendTotal assets 09 11 08 10
RepurchaseTotal assets 18 31 26 52
Total payoutTotal assets 28 43 34 62
Regular dividendTotal payout 428 357 386 265
Percentage of executive compensation
Salary_ 435 364 282 280
Bonus_ 226 214 179 202
Option grant_ 92 125 387 261
Restricted stock grant_ 125 188 80 174
Percentage of CEO compensation
Salary_(CEO) 485 364 260 259
Bonus_(CEO) 249 228 185 219
Option grant_(CEO) 10 127 406 275
Restricted stock grant_(CEO) 128 182 82 183
Panel E Firm characteristics by alternative treatment definition - before and
after FAS123R
Treated
25
19
997
223
250
256
268
10
177
71
Control
44
37
47
Table 2
Differential effect of FAS123R on the use of option-based compensation
Panel A Two-period first-difference regression
Prediction Coeff t-stat Coeff t-stat Coeff t-stat
Accounting impact rank - -0044 -628
Accounting impact rank=2 - -0044 -327
Accounting impact rank=3 - -0075 -468
Accounting impact rank=4 - -0140 -613
Treated - -0132 -875
ΔLog(size) 0061 202 0061 200 0063 214
ΔBook-to-market 0032 091 0032 092 0051 143
ΔLeverage -0157 -213 -0160 -218 -0111 -153
ΔAsset tangibility -0012 -014 -0020 -023 -0023 -026
ΔFree cash flow -0106 -095 -0108 -097 -0128 -117
ΔCash holding -0197 -211 -0193 -206 -0180 -194
ΔFive-year ROA volatility -0065 -031 -0056 -026 -0098 -047
ΔInstitutional ownership -0044 -091 -0043 -088 -0044 -092
ΔSales growth -0064 -102 -0065 -104 -0090 -153
ΔPast one-year stock return 0051 078 0052 080 0091 138
ΔLoss frequency 0056 207 0057 207 0047 179
Log(size) -0009 -210 -0009 -207 -0002 -035
Book-to-market -0015 -056 -0013 -049 0018 072
Leverage 0022 046 0023 048 0068 150
Asset tangibility 0033 077 0033 078 0053 128
Free cash flow 0227 202 0220 195 0127 117
Cash holding -0002 -004 0012 019 -0078 -141
Five-year ROA volatility -0451 -240 -0430 -228 -0509 -283
Institutional ownership -0123 -360 -0122 -359 -0100 -292
Sales growth -0041 -056 -0040 -055 -0089 -125
Past one-year stock return -0009 -015 -0006 -010 0078 125
Loss frequency 0055 174 0056 178 0054 173
Fixed effect
Standard error
Adj R-squared
Observations
Model (3)
Dependent variable ΔAvg Option grantTotal pay
Huber-White
0156
This table investigates whether the effect of FAS123R on the use of option-based pay varies with its potential accounting impact Panel A
reports the results of estimating three two-period first-differencing models where for each firm we average its characteristics in Pre- and
Post-FAS123R period The Pre-FAS123R period consists of fiscal year 2003 and 2004 the Post-FAS123R period covers fiscal year 2005-
2007 In all three specifications the dependent variable is the change of average Option grantTotal pay from Pre- to Post-FAS123R period
The main independent variable varies by model in Model (1) the Accounting impact rank is the quartile rank of implied option expensetotal
assets measured in 2002 (1=lowest 4=highest) In Model (2) Accounting impact rank=2 (3 4) is an indicator that takes value of one if the
firmrsquos Accounting impact rank equals 2 (3 4) In Model (3) we use an alternative treatment construction following Bakke et al (2015)
where Treated is an indicator that takes value of zero if the firm granted zero option to its CEO in both 2003 and 2004 or the firm began to
voluntarily expense option-based pay at fair value in 2002 or earlier and one otherwise For each control variable we include both its level in
the Pre-FAS123R period and its change across the two periods Panel B shows the results of estimating fixed effect models with firm-year
observations The dependent variable is the firm-year level Option grantTotal pay The main independent variables are the interactions of
Post-FAS123R indicator (Post) with Accounting Impact rank Accounting impact rank indicators and Treated respectively All models in
Penal A have industry fixed effects and the standard errors are Huber-White heteroscedasticity-consistent standard errors All models in
Penal B have firm fixed effects and year fixed effects and the standard errors are clustered at firm level All variables are defined in
Appendix The notation and indicates statistically significant at 10 5 and 1 level respectively
Model (1) Model (2)
11711171 1171
Industry Industry
Huber-White
0124
Huber-White
0123
Industry
48
Panel B Panel fixed effects regression
Prediction Coeff t-stat Coeff t-stat Coeff t-stat
Acc impact rank x Post - -0044 -807
Acc impact rank 2 x Post - -0046 -333
Acc impact rank 3 x Post - -0077 -526
Acc impact rank 4 x Post - -0137 -776
Treated x Post - -0145 -970
Log(size) 0034 221 0034 217 0036 229
Book-to-market 0018 084 0017 083 0015 070
Leverage -0004 -009 -0006 -013 -0007 -015
Asset tangibility 0007 012 0004 006 0011 018
Free cash flow -0074 -151 -0072 -146 -0078 -158
Cash holding -0048 -086 -0050 -090 -0006 -011
Five-year ROA volatility 0250 231 0239 219 0437 414
Institutional ownership 0043 159 0044 161 0041 150
Sales growth -0033 -168 -0034 -171 -0031 -158
Past one-year stock return 0067 221 0068 224 0063 204
Loss indicator 0023 209 0022 207 0024 222
Fixed effects
Standard error
Adj R-squared
Observations
Dependent variable Option grantTotal pay
5653 5653 5653
Clustered by firm
Firm Year
Clustered by firm
Firm Year
Clustered by firm
0523 0523 0526
Model (1) Model (2) Model (3)
Firm Year
49
Table 3
Effect of option-based compensation on dividend policy
Panel A Two-period first-difference regression
Prediction Coeff t-stat Coeff t-stat Coeff t-stat
Accounting impact rank + 0000 077
Accounting impact rank=2 + 0001 091
Accounting impact rank=3 + 0000 044
Accounting impact rank=4 + 0001 092
Treated + 0000 -026
ΔLog(size) 0000 -030 0000 -030 0000 -026
ΔBook-to-market -0002 -190 -0002 -193 -0002 -195
ΔLeverage -0002 -059 -0002 -057 -0002 -059
ΔAsset tangibility 0016 431 0016 429 0016 430
ΔFree cash flow 0017 373 0017 373 0017 375
ΔCash holding -0011 -288 -0011 -285 -0010 -282
ΔFive-year ROA volatility 0003 034 0002 032 0003 035
ΔInstitutional ownership -0002 -073 -0002 -073 -0002 -070
ΔSales growth -0001 -040 -0001 -037 -0001 -038
ΔPast one-year stock return 0002 077 0002 076 0002 070
ΔLoss frequency 0000 -048 0000 -045 0000 -046
Log(size) 0000 183 0000 182 0000 182
Book-to-market -0002 -227 -0002 -225 -0002 -284
Leverage -0001 -037 -0001 -039 -0001 -048
Asset tangibility 0003 179 0003 180 0003 176
Free cash flow 0017 291 0017 291 0017 300
Cash holding 0002 080 0002 077 0002 098
Five-year ROA volatility 0003 035 0002 033 0003 044
Institutional ownership -0001 -068 -0001 -068 -0001 -058
Sales growth -0004 -177 -0004 -175 -0004 -172
Past one-year stock return 0004 169 0004 167 0004 165
Loss frequency -0001 -111 -0001 -109 -0001 -102
Fixed effect
Standard error
Adj R-squared
Observations
Dependent variable ΔAvg Regular dividendTotal assets
This table investigates the causal effect of option-based pay on dividend policy by examining whether changes in dividend policy around
FAS123R vary with its potential accounting impact Panel A reports the results of estimating three two-period first-differencing models
where for each firm we average its characteristics in Pre- and Post-FAS123R period In all three specifications the dependent variable is
the change of average Regular dividendTotal assets from Pre- to Post-FAS123R period The main independent variable varies by model in
Model (1) the Accounting impact rank is the quartile rank of implied option expensetotal assets measured in 2002 (1=lowest 4=highest) In
Model (2) Accounting impact rank=2 (3 4) is an indicator that takes value of one if the firmrsquos Accounting impact rank equals 2 (3 4) In
Model (3) we use an alternative treatment construction following Bakke et al (2015) where Treated is an indicator that takes value of zero
if the firm granted zero option to its CEO in both 2003 and 2004 or the firm began to voluntarily expense option-based pay at fair value in
2002 or earlier and one otherwise For each control variable we include both its level in the Pre-FAS123R period and its change across the
two periods Panel B shows the results of estimating fixed effect models with firm-year observations The dependent variable is the firm-
year level Regular dividendTotal assets The main independent variables are the interactions of Post-FAS123R indicator (Post) with
Accounting Impact rank Accounting impact rank indicators and Treated respectively Panel C examines the intensity of dividend changes
among firms with nonzero dividend per share in 2003 or 2004 In particular we estimates the same three models as in Panel A(with the
same independent variables) but for five dependent variables the change of average Regular dividendTotal assets from Pre- to Post-
FAS123R period (as in Panel A) the percentage change of DPS (dividend per share) from Pre- to Post-FAS123R period and three
indicators denoting respectively whether the percentage change of DPS was greater than 20 40 and 60 Panel D reports four
robustness tests of the dividend intensity regression In each of them a set of possible confounding observations is removed (see Section 33
for details) Panel E compares the trends of dividend initiation and termination around FAS123R across four quartile groups ranked by
accounting impact All models in Panel A C and D have industry fixed effects and the standard errors are Huber-White heteroscedasticity-
consistent standard errors All models in Penal B have firm fixed effects and year fixed effects and the standard errors are clustered at
firm level All variables are defined in Appendix The notation and indicates statistically significant at 10 5 and 1 level
Industry Industry Industry
Model (1) Model (2) Model (3)
1171 1171 1171
Huber-White Huber-White Huber-White
0105 0104 0105
50
Panel B Panel fixed effects regression
Prediction Coeff t-stat Coeff t-stat Coeff t-stat
Acc impact rank x Post + 0000 122
Acc impact rank 2 x Post + 0001 110
Acc impact rank 3 x Post + 0001 094
Acc impact rank 4 x Post + 0001 129
Treated x Post + 0000 -012
Log(size) 0001 179 0001 179 0001 181
Book-to-market 0000 025 0000 024 0000 031
Leverage 0001 062 0001 064 0001 069
Asset tangibility 0009 360 0009 358 0009 363
Free cash flow 0002 090 0002 093 0002 092
Cash holding -0007 -295 -0007 -298 -0007 -298
Five-year ROA volatility 0001 041 0001 038 0000 -006
Institutional ownership 0000 -027 0000 -026 0000 -027
Sales growth 0000 053 0000 051 0000 044
Past one-year stock return 0001 089 0001 088 0001 078
Loss indicator 0000 -060 0000 -057 0000 -076
Fixed effects
Standard error
Adj R-squared
Observations
Dependent variable Regular dividendTotal assets
Model (1) Model (2) Model (3)
Firm Year Firm Year Firm Year
5653 5653 5653
Clustered by firm Clustered by firm Clustered by firm
0877 0877 0877
51
Panel C Intensity of dividend changes around FAS123R
Prediction Coeff t-stat Coeff t-stat Coeff t-stat
Accounting impact rank + 0000 065
Accounting impact rank=2 + 0000 048
Accounting impact rank=3 + 0000 026
Accounting impact rank=4 + 0002 080
Treated + 0001 063
Dependent var DPS pct change
Accounting impact rank + -0145 -072
Accounting impact rank=2 + 0018 006
Accounting impact rank=3 + -0177 -045
Accounting impact rank=4 + -0746 -100
Treated + -0407 -119
Accounting impact rank + 0029 095
Accounting impact rank=2 + 0040 074
Accounting impact rank=3 + 0092 139
Accounting impact rank=4 + 0008 007
Treated + -0007 -012
Accounting impact rank + 0024 076
Accounting impact rank=2 + 0047 088
Accounting impact rank=3 + 0079 114
Accounting impact rank=4 + -0003 -002
Treated + 0030 052
Accounting impact rank + 0030 098
Accounting impact rank=2 + 0078 155
Accounting impact rank=3 + 0085 130
Accounting impact rank=4 + 0014 012
Treated + -0006 -011
Control variables
Fixed effect
Standard error
Observations 572 572 572
Yes Yes Yes
Huber-White Huber-White Huber-White
Industry Industry Industry
Dependent var DPS pct
change gt60 indicator
Model (1) Model (2) Model (3)
Dependent var ΔAvg Regular
dividendAssets
Dependent var DPS pct
change gt20 indicator
Dependent var DPS pct
change gt40 indicator
52
Panel D Robustness tests for intensity of dividend changes around FAS123R
Prediction Coeff t-stat Coeff t-stat Coeff t-stat
Accounting impact rank + 0006 017
Accounting impact rank=2 + 0067 118
Accounting impact rank=3 + 0041 057
Accounting impact rank=4 + -0061 -049
Treated + 0022 035Observations
Accounting impact rank + 0009 027
Accounting impact rank=2 + 0058 106
Accounting impact rank=3 + 0032 043
Accounting impact rank=4 + -0032 -024
Treated + 0018 028
Observations
Accounting impact rank + 0030 089
Accounting impact rank=2 + 0039 071
Accounting impact rank=3 + 0122 168
Accounting impact rank=4 + -0063 -052
Treated + 0075 132
Observations
Accounting impact rank + 0008 023
Accounting impact rank=2 + 0023 042
Accounting impact rank=3 + 0048 064
Accounting impact rank=4 + -0042 -033
Treated + -0010 -016
Observations
Control variables
Fixed effect
Standard error
Exclude firms with stable
payout ratio from 2003 to 2004
506 506 506
Dependent variable DPS pct change gt40 indicator
Model (1) Model (2) Model (3)
Exclude voluntary expensers
519 519
Exclude firms in the top decile
of option reduction (02-04)
Exclude firms that accelerated
option vesting
504 504 504
517 517 517
519
Huber-White Huber-White Huber-White
Yes Yes Yes
Industry Industry Industry
53
Panel E Dividend initiation and termination rates around FAS123R
Pre FAS 123R
1 280 75 7 6 13 173
2 284 135 18 9 27 200
3 286 181 11 14 25 138
4 282 260 9 10 19 73
Total 1132 651 45 39 84 129
Post FAS 123R
1 275 63 4 4 8 127
2 280 116 9 9 18 155
3 276 152 9 3 12 79
4 263 223 5 1 6 27
Total 1094 554 27 17 44 79
Pre FAS 123R
1 280 205 2 0 2 10
2 284 149 7 1 8 54
3 286 105 0 0 0 00
4 282 22 0 0 0 00
Total 1132 481 9 1 10 21
Post FAS 123R
1 275 212 3 6 9 42
2 280 164 1 2 3 18
3 276 124 1 1 2 16
4 263 40 0 3 3 75
Total 1094 540 5 12 17 31
termination
in 2004
03-04
cumulative
03-04
cumulative
Quartile firms
with
dividend in
2004
termination
in 2005
termination
in 2006
05-06
cumulative
05-06
cumulative
Termination
Quartile firms
with
dividend in
2002
termination
in 2003
without
dividend in
2004
initiation in
2003
initiation in
2004
03-04
cumulative
03-04
cumulative firmsQuartile
firmsQuartile initiation in
2005
initiation in
2006
05-06
cumulative
05-06
cumulative
Initiation
without
dividend in
2002
54
Table 4
Effect of option-based compensation on repurchases
Panel A Two-period first-difference regression with total repurchase
Prediction Coeff t-stat Coeff t-stat Coeff t-stat
Accounting impact rank - 0002 122
Accounting impact rank=2 - 0002 071
Accounting impact rank=3 - 0005 123
Accounting impact rank=4 - 0007 102
Treated - 0014 365
Control variables
Fixed effect
Standard error
Adj R-squared
Observations
Panel B Two-period first-difference regression with net repurchase
Prediction Coeff t-stat Coeff t-stat Coeff t-stat
Accounting impact rank - 0003 166
Accounting impact rank=2 - 0002 051
Accounting impact rank=3 - 0006 165
Accounting impact rank=4 - 0009 137
Treated - 0010 300
Control variables
Fixed effect
Standard error
Adj R-squared
Observations
Panel C Two-period first-difference regression with repurchase adjusted for exercised options
Prediction Coeff t-stat Coeff t-stat Coeff t-stat
Accounting impact rank - 0001 056
Accounting impact rank=2 - 0002 062
Accounting impact rank=3 - 0007 172
Accounting impact rank=4 - -0001 -008
Treated - 0006 197
Control variables
Fixed effect
Standard error
Adj R-squared
Observations
Dependent variable ΔAvg RepurchaseTotal assets
This table investigates the causal effect of option-based pay on payout policy by examining whether the changes of repurchase around
FAS123R vary with its potential accounting impact Panel A reports the results of estimating three two-period first-differencing models
where for each firm we average its characteristics in Pre- and Post-FAS123R period In all three specifications the dependent variable is
the change of average RepurchaseTotal assets from Pre- to Post-FAS123R period The main independent variable varies by model in
Model (1) the Accounting impact rank is the quartile rank of implied option expensetotal assets measured in 2002 (1=lowest 4=highest)
In Model (2) Accounting impact rank=2 (3 4) is an indicator that takes value of one if the firmrsquos Accounting impact rank equals 2 (3 4)
In Model (3) we use an alternative treatment construction following Bakke et al (2015) where Treated is an indicator that takes value of
zero if the firm granted zero option to its CEO in both 2003 and 2004 or the firm began to voluntarily expense option-based pay at fair
value in 2002 or earlier and one otherwise Panel B reports the regressions with the change of Net repurchaseTotal assets as the
dependent variable and the same independent variable as in Panel A Panel C reports the regressions with the change of Adjusted
repurchaseTotal assets as the dependent variable and the same independent variable as in Panel A All models in Panel A B and C have
industry fixed effects and the standard errors are Huber-White heteroscedasticity-consistent standard errors All variables are defined in
Appendix The notation and indicates statistically significant at 10 5 and 1 level respectively
Model (1) Model (2) Model (3)
Yes Yes Yes
Industry Industry Industry
Huber-White Huber-White Huber-White
Dependent variable ΔAvg Net repurchaseTotal assets
1171 1171 1171
0238 0237 0245
Model (1) Model (2) Model (3)
Yes Yes Yes
Industry Industry Industry
Huber-White Huber-White Huber-White
Dependent variable ΔAvg Adjusted repurchaseTotal assets
0229 0229 0233
1171 1171 1171
Model (1) Model (2) Model (3)
Yes Yes Yes
Industry Industry Industry
Huber-White Huber-White Huber-White
0111 0112 0114
1168 1168 1168
55
Table 5
Effect of option-based compensation on payout mix
Panel A Two-period first-difference regression with total payout mix
Prediction Coeff t-stat Coeff t-stat Coeff t-stat
Accounting impact rank + 0006 028
Accounting impact rank=2 + 0018 045
Accounting impact rank=3 + -0001 -001
Accounting impact rank=4 + 0043 052
Treated + -0035 -094
Control variables
Fixed effect
Standard error
Adj R-squared
Observations
Panel B Two-period first-difference regression with net payout mix
Prediction Coeff t-stat Coeff t-stat Coeff t-stat
Accounting impact rank + -0002 -008
Accounting impact rank=2 + 0008 016
Accounting impact rank=3 + 0018 034
Accounting impact rank=4 + -0059 -055
Treated + -0050 -101
Control variables
Fixed effect
Standard error
Adj R-squared
Observations
0049 0043 0054
257 257 257
Industry Industry Industry
Huber-White Huber-White Huber-White
Dependent variable ΔAvg Regular dividendNet payout
Model (1) Model (2) Model (3)
Yes Yes Yes
0154 0151 0156
362 362 362
Industry Industry Industry
Huber-White Huber-White Huber-White
This table investigates the causal effect of option-based pay on payout mix for firms using both dividend and repurchase by examining
whether the changes of payout mix around FAS123R vary with its potential accounting impact Panel A reports the results of estimating
three two-period first-differencing models where for each firm we average its characteristics in Pre- and Post-FAS123R period In all three
specifications the dependent variable is the change of average Regular dividendTotal payout from Pre- to Post-FAS123R period The main
independent variable varies by model in Model (1) the Accounting impact rank is the quartile rank of implied option expensetotal assets
measured in 2002 (1=lowest 4=highest) In Model (2) Accounting impact rank=2 (3 4) is an indicator that takes value of one if the firmrsquos
Accounting impact rank equals 2 (3 4) In Model (3) we use an alternative treatment construction following Bakke et al (2015) where
Treated is an indicator that takes value of zero if the firm granted zero option to its CEO in both 2003 and 2004 or the firm began to
voluntarily expense option-based pay at fair value in 2002 or earlier and one otherwise Panel B reports the regressions with the change of
Regular dividendNet payout as the dependent variable and the same independent variables as in Panel A Panel A (Panel B) is based on
observations with nonzero regular dividend and repurchase (net repurchase) in both Pre- and Post-FAS123R period All models in Panel A
and B have industry fixed effects and the standard errors are Huber-White heteroscedasticity-consistent standard errors All variables are
defined in Appendix The notation and indicates statistically significant at 10 5 and 1 level respectively
Yes Yes Yes
Dependent variable ΔAvg Regular dividendTotal payout
Model (1) Model (2) Model (3)

39
Hall Brian J and Kevin J Murphy 2003 The trouble with stock options Journal of Economic
Perspectives 17 49ndash70
Hanlon Michelle and Jeffrey L Hoopes 2014 What do firms do when dividend tax rates change
An examination of alternative payout responses Journal of Financial Economics 114 105-
124
Hayes Rachel M Michael Lemmon and Mingming Qiu 2012 Stock options and managerial
incentives for risk taking Evidence from FAS123R Journal of Financial Economics 105
174ndash190
Heron Randall A Erik Lie 2007 Does backdating explain the stock price pattern around
executive stock option grants Journal of Financial Economics 83 271-295
Hribar Paul Nicole Thorne Jenkins and W Bruce Johnson 2006 Stock repurchases as an
earnings management device Journal of Accounting and Economics 41 3ndash27
Jensen Michael C 1986 Agency cost of free cash flow corporate finance and takeovers
American Economic Review 76 323-329
Jolls Christine 1998 Stock repurchases and incentive compensation NBER Working Paper No
w6467
Jung Boochun Woo-Jong Lee and Yanhua Sunny Yang 2016 The Impact of Dividend
Covenants on Investment and Operating Performance Journal of Business Finance amp
Accounting 43 414ndash447
Kahle Kathleen M 2002 When a buyback isnrsquot a buyback open market repurchases and
employee options Journal of Financial Economics 63 235ndash261
Lambert Richard A William N Lanen and David F Larcker 1989 Executive stock option plans
and corporate dividend policy Journal of Financial and Quantitative Analysis 24 409ndash425
Lintner John 1956 Distribution of incomes of corporations among dividends retained earnings
and taxes The American Economic Review 46 97-113
Low Angie 2009 Managerial risk-taking behavior and equity-based compensation Journal of
Financial Economics 92 470-490
Miller Merton H and Franco Modigliani 1961 Dividend policy growth and the valuation of
shares The Journal of Business 34 411ndash433
Minnick Kristina and Leonard Rosenthal 2015 Stealth compensation Do CEOs increase their
pay by influencing dividend policy Journal of Corporate Finance 25 435-454
40
Murphy Kevin J 1999 Executive compensation In O Ashenfelter and D Card (eds) North
Holland Handbook of Labor Economics Amsterdam Elsevier Science BV
Murphy Kevin J 2013 Executive compensation Where we are and how we got there Handbook
of the Economics of Finance Elsevier Science North Holland 211-356
Nikolaev Valeri 2010 Debt Covenants and Accounting Conservatism Journal of Accounting
Research 48 143-176
Puri Manju Joumlrg Rocholl and Sascha Steffen 2011 Global retail lending in the aftermath of the
US financial crisis Distinguishing between supply and demand effects Journal of Financial
Economics 100 556-578
Shue Kelly and Richard R Townsend 2014 Swinging for the fences Executive reactions to
quasi-random option grants Working Paper University of Chicago
Skinner Douglas J 2008 The evolving relation between earnings dividends and stock
repurchases Journal of Financial Economics 87 582-609
Weisbenner Scott J 2000 Corporate share repurchases in the 1990s What role do stock options
play FEDS Working Paper No 2000-29
Zhang Dan 2013 CEO dividend protection Working Paper BI Norwegian Business School
41
Figure 1 Trends of dividends and repurchases from 2003 to 2007 Panel A plots the average
Regular DividendTotal Assets of firms in the highest and lowest quartiles of Accounting Impact
measured in 2002 Panel B shows the average Total RepurchaseTotal Assets of firms in the
highest and lowest quartiles of Accounting Impact measured in 2002
Panel A Trends of regular dividends
Panel B Trends of total repurchases
00
05
10
15
20
2003 2004 2005 2006 2007
Regular DividendTotal Assets
Lowest Acc Impact
Highest Acc Impact
Pre Post
00
20
40
60
80
100
2003 2004 2005 2006 2007
Total Repurchase Total Assets
Lowest Acc Impact
Highest Acc Impact
Pre Post
42
Table 1
Summary Statistics
Panel A Firm characteristics - full sample
N Mean Std dev 25 pctl Median 75 pctl
Accounting impact (2002) 1176 173 366 022 052 163
Payout variablesRegular dividendTotal assets 5653 093 148 000 000 142
RepurchaseTotal assets 5653 394 710 000 035 500
Total payoutTotal assets 5653 488 748 000 175 666
Regular dividendTotal payout 4091 3874 4057 000 2237 8833
Level of executive compensation (in $1000)
Salary_$ 5653 450 190 314 409 544
Bonus_$ 5653 476 616 122 295 586
Option grant_$ 5653 791 1137 62 384 1002
Restricted stock grant_$ 5653 458 866 0 58 518
Total pay_$ 5653 2481 2475 890 1647 3074
Percentage of executive compensation
Salary_ 5653 296 183 165 251 382
Bonus_ 5653 197 148 97 177 268
Option grant_ 5653 283 235 67 256 445
Restricted stock grant_ 5653 141 180 00 41 249
Control variables
Size ($M) 5653 11086 27294 1017 2459 8117
Log(size) 5653 7985 1565 6925 7808 9002
Book-to-market 5653 0445 0287 0251 0388 0578
Leverage 5653 0202 0172 0038 0187 0309
Asset tangibility 5653 0806 0184 0691 0853 0965
Free cash flow 5653 0059 0091 0013 0059 0108
Cash holding 5653 0166 0172 0034 0100 0247
ROA volatility 5653 0056 0056 0021 0038 0070
Institutional ownership 5653 0753 0202 0639 0795 0910
Sales growth 5653 0121 0189 0028 0096 0183
Past stock return 5653 0094 0183 -0012 0094 0199
Loss indicator 5653 0164 0370 0000 0000 0000
This table presents summary statistics Panel A shows the descriptive statistics of payout variables compensation
variables and other firm characteristics for the full sample Accounting impact is the implied option expense
measured at fiscal year 2002 All other variables are measured at firm-year level from fiscal year 2003 to 2007
resulting in 5653 firm-year observations (except for Regular dividendTotal Payout which can be measured only
for the 4901 firm-year observations with Total payout greater than zero) Panel B shows the pairwise correlations
between main variables at firm-year level Panel C compares payout variables compensation variables and other
firm characteristics before and after FAS123R The Pre-FAS123R period consists of fiscal year 2003 and 2004
the Post-FAS123R period covers fiscal year 2005-2007 Panel D compares the trends of payout and compensation
variables around FAS123R across four quartile groups ranked by 2002 accounting impact Panel E compares the
trends of payout and compensation variables around FAS123R between the treated and control group under the
alternative treatment definition in Bakke et al (2015) (see Section 22) All variables are defined in Appendix The
notation and in Panel C indicates statistically significant at 10 5 and 1 level in T-tests for equal
means respectively
43
Pa
nel
B
Pea
rso
n c
orr
ela
tio
ns
Reg div
Repurchase
Total payout
Salary_
Bonus_
Option_
RS_
Log(size)
BM
Leverage
Tangibility
FCF
Cash holdingROA vol
Inst own
Sales growth
Past ret
urn
Loss
Reg
div
10
0
Repurc
hase
01
610
0
Tota
l payout
03
509
810
0
Sala
ry_
-0
10
-01
8-0
19
10
0
Bonus_
00
700
100
3-0
01
10
0
Option_
-0
10
00
900
6-0
41
-03
510
0
RS
_
01
000
901
0-0
32
-01
1-0
40
10
0
Log(s
ize)
03
101
802
3-0
56
01
101
202
210
0
BM
-02
1-0
28
-03
103
0-0
03
-02
000
0-0
33
10
0
Levera
ge
-00
1-0
08
-00
8-0
05
00
6-0
11
00
801
9-0
03
10
0
Tangib
ility
00
200
100
101
200
1-0
05
-00
6-0
12
-00
4-0
18
10
0
FC
F02
203
703
9-0
20
00
901
1-0
01
02
4-0
32
-02
1-0
16
10
0
Cash
hold
ing
-01
301
000
700
2-0
14
02
2-0
10
-02
3-0
16
-03
502
901
210
0
RO
A v
ol
-01
5-0
04
-00
700
4-0
11
01
9-0
11
-02
3-0
08
-01
101
2-0
02
03
910
0
Inst
ow
n
-00
901
401
1-0
17
00
200
701
200
7-0
01
00
3-0
08
01
4-0
06
-01
110
0
Sale
s gro
wth
-00
8-0
04
-00
6-0
15
00
501
0-0
02
00
7-0
16
-00
3-0
08
01
300
201
400
410
0
Past
retu
rn00
901
301
4-0
18
01
5-0
01
00
301
6-0
29
-01
000
102
7-0
14
-01
001
602
710
0
Loss
-02
0-0
19
-02
201
8-0
18
00
4-0
05
-02
601
901
300
6-0
41
01
702
3-0
16
-01
8-0
40
10
0
44
Panel C Firm characteristics - before and after FAS123R
Pre FAS 123R Post FAS 123R Difference
Payout variables
Regular dividendTotal assets 083 099 016
RepurchaseTotal assets 245 490 245
Total payoutTotal assets 328 589 261
Regular dividendTotal payout 3914 2790 -1124
Level of executive compensation (in $1000)
Salary_$ 426 463 37
Bonus_$ 418 505 87
Option grant_$ 896 707 -191
Restricted stock grant_$ 269 574 305
Total pay_$ 2263 2584 321
Percentage of executive compensation
Salary_ 305 293 -12
Bonus_ 186 204 18
Option grant_ 343 240 -103
Restricted stock grant_ 87 176 89
Control variables
Size ($M) 9671 11631 1960
Log(size) 7860 8035 0175
Book-to-market 0437 0453 0016
Leverage 0201 0203 0002
Asset tangibility 0822 0793 -0029
Free cash flow 0061 0057 -0004
Cash holding 0175 0159 -0016
ROA volatility 0067 0048 -0019
Institutional ownership 0712 0781 0069
Sales growth 0137 0108 -0029
Past stock return 0080 0101 0021
Loss indicator 0173 0159 -0014
45
Pa
nel
D
Fir
m c
ha
racte
rist
ics
by q
ua
rtil
e o
f a
cco
un
tin
g i
mp
act
- b
efo
re a
nd
aft
er
FA
S1
23
R
Accounting im
pact
(2002)
Num
ber
of
Fir
ms
Pre
Post
Pre
Post
Pre
Post
Pre
Post
Payout
vari
able
s
Regula
r div
idendT
ota
l ass
ets
11
2
12
4
09
4
11
1
09
5
11
3
03
0
04
9
Repurc
hase
Tota
l ass
ets
11
3
26
8
19
2
37
3
32
7
63
1
35
1
68
7
Tota
l payout
Tota
l ass
ets
22
4
39
1
28
5
48
4
42
2
74
4
38
1
73
6
Regula
r div
idendT
ota
l payout
643
7
469
8
474
0
341
1
284
5
195
4
82
5
74
5
Perc
enta
ge o
f executive c
om
pensa
tion
Sala
ry_
337
295
313
287
296
289
276
300
Bonus_
223
226
214
228
172
192
134
169
Option g
rant_
201
167
290
210
373
260
507
325
Rest
ricte
d s
tock g
rant_
116
194
98
180
89
176
43
155
294
294
294
294
1st Q
uart
ile2
nd Q
uart
ile3
rd Q
uart
ile4
th Q
uart
ile
01
2
03
5
09
3
55
1
46
Accounting impact
Number of Firms
By accounting impact quartile
1
2
3
4
Pre Post Pre Post
Payout variables
Regular dividendTotal assets 09 11 08 10
RepurchaseTotal assets 18 31 26 52
Total payoutTotal assets 28 43 34 62
Regular dividendTotal payout 428 357 386 265
Percentage of executive compensation
Salary_ 435 364 282 280
Bonus_ 226 214 179 202
Option grant_ 92 125 387 261
Restricted stock grant_ 125 188 80 174
Percentage of CEO compensation
Salary_(CEO) 485 364 260 259
Bonus_(CEO) 249 228 185 219
Option grant_(CEO) 10 127 406 275
Restricted stock grant_(CEO) 128 182 82 183
Panel E Firm characteristics by alternative treatment definition - before and
after FAS123R
Treated
25
19
997
223
250
256
268
10
177
71
Control
44
37
47
Table 2
Differential effect of FAS123R on the use of option-based compensation
Panel A Two-period first-difference regression
Prediction Coeff t-stat Coeff t-stat Coeff t-stat
Accounting impact rank - -0044 -628
Accounting impact rank=2 - -0044 -327
Accounting impact rank=3 - -0075 -468
Accounting impact rank=4 - -0140 -613
Treated - -0132 -875
ΔLog(size) 0061 202 0061 200 0063 214
ΔBook-to-market 0032 091 0032 092 0051 143
ΔLeverage -0157 -213 -0160 -218 -0111 -153
ΔAsset tangibility -0012 -014 -0020 -023 -0023 -026
ΔFree cash flow -0106 -095 -0108 -097 -0128 -117
ΔCash holding -0197 -211 -0193 -206 -0180 -194
ΔFive-year ROA volatility -0065 -031 -0056 -026 -0098 -047
ΔInstitutional ownership -0044 -091 -0043 -088 -0044 -092
ΔSales growth -0064 -102 -0065 -104 -0090 -153
ΔPast one-year stock return 0051 078 0052 080 0091 138
ΔLoss frequency 0056 207 0057 207 0047 179
Log(size) -0009 -210 -0009 -207 -0002 -035
Book-to-market -0015 -056 -0013 -049 0018 072
Leverage 0022 046 0023 048 0068 150
Asset tangibility 0033 077 0033 078 0053 128
Free cash flow 0227 202 0220 195 0127 117
Cash holding -0002 -004 0012 019 -0078 -141
Five-year ROA volatility -0451 -240 -0430 -228 -0509 -283
Institutional ownership -0123 -360 -0122 -359 -0100 -292
Sales growth -0041 -056 -0040 -055 -0089 -125
Past one-year stock return -0009 -015 -0006 -010 0078 125
Loss frequency 0055 174 0056 178 0054 173
Fixed effect
Standard error
Adj R-squared
Observations
Model (3)
Dependent variable ΔAvg Option grantTotal pay
Huber-White
0156
This table investigates whether the effect of FAS123R on the use of option-based pay varies with its potential accounting impact Panel A
reports the results of estimating three two-period first-differencing models where for each firm we average its characteristics in Pre- and
Post-FAS123R period The Pre-FAS123R period consists of fiscal year 2003 and 2004 the Post-FAS123R period covers fiscal year 2005-
2007 In all three specifications the dependent variable is the change of average Option grantTotal pay from Pre- to Post-FAS123R period
The main independent variable varies by model in Model (1) the Accounting impact rank is the quartile rank of implied option expensetotal
assets measured in 2002 (1=lowest 4=highest) In Model (2) Accounting impact rank=2 (3 4) is an indicator that takes value of one if the
firmrsquos Accounting impact rank equals 2 (3 4) In Model (3) we use an alternative treatment construction following Bakke et al (2015)
where Treated is an indicator that takes value of zero if the firm granted zero option to its CEO in both 2003 and 2004 or the firm began to
voluntarily expense option-based pay at fair value in 2002 or earlier and one otherwise For each control variable we include both its level in
the Pre-FAS123R period and its change across the two periods Panel B shows the results of estimating fixed effect models with firm-year
observations The dependent variable is the firm-year level Option grantTotal pay The main independent variables are the interactions of
Post-FAS123R indicator (Post) with Accounting Impact rank Accounting impact rank indicators and Treated respectively All models in
Penal A have industry fixed effects and the standard errors are Huber-White heteroscedasticity-consistent standard errors All models in
Penal B have firm fixed effects and year fixed effects and the standard errors are clustered at firm level All variables are defined in
Appendix The notation and indicates statistically significant at 10 5 and 1 level respectively
Model (1) Model (2)
11711171 1171
Industry Industry
Huber-White
0124
Huber-White
0123
Industry
48
Panel B Panel fixed effects regression
Prediction Coeff t-stat Coeff t-stat Coeff t-stat
Acc impact rank x Post - -0044 -807
Acc impact rank 2 x Post - -0046 -333
Acc impact rank 3 x Post - -0077 -526
Acc impact rank 4 x Post - -0137 -776
Treated x Post - -0145 -970
Log(size) 0034 221 0034 217 0036 229
Book-to-market 0018 084 0017 083 0015 070
Leverage -0004 -009 -0006 -013 -0007 -015
Asset tangibility 0007 012 0004 006 0011 018
Free cash flow -0074 -151 -0072 -146 -0078 -158
Cash holding -0048 -086 -0050 -090 -0006 -011
Five-year ROA volatility 0250 231 0239 219 0437 414
Institutional ownership 0043 159 0044 161 0041 150
Sales growth -0033 -168 -0034 -171 -0031 -158
Past one-year stock return 0067 221 0068 224 0063 204
Loss indicator 0023 209 0022 207 0024 222
Fixed effects
Standard error
Adj R-squared
Observations
Dependent variable Option grantTotal pay
5653 5653 5653
Clustered by firm
Firm Year
Clustered by firm
Firm Year
Clustered by firm
0523 0523 0526
Model (1) Model (2) Model (3)
Firm Year
49
Table 3
Effect of option-based compensation on dividend policy
Panel A Two-period first-difference regression
Prediction Coeff t-stat Coeff t-stat Coeff t-stat
Accounting impact rank + 0000 077
Accounting impact rank=2 + 0001 091
Accounting impact rank=3 + 0000 044
Accounting impact rank=4 + 0001 092
Treated + 0000 -026
ΔLog(size) 0000 -030 0000 -030 0000 -026
ΔBook-to-market -0002 -190 -0002 -193 -0002 -195
ΔLeverage -0002 -059 -0002 -057 -0002 -059
ΔAsset tangibility 0016 431 0016 429 0016 430
ΔFree cash flow 0017 373 0017 373 0017 375
ΔCash holding -0011 -288 -0011 -285 -0010 -282
ΔFive-year ROA volatility 0003 034 0002 032 0003 035
ΔInstitutional ownership -0002 -073 -0002 -073 -0002 -070
ΔSales growth -0001 -040 -0001 -037 -0001 -038
ΔPast one-year stock return 0002 077 0002 076 0002 070
ΔLoss frequency 0000 -048 0000 -045 0000 -046
Log(size) 0000 183 0000 182 0000 182
Book-to-market -0002 -227 -0002 -225 -0002 -284
Leverage -0001 -037 -0001 -039 -0001 -048
Asset tangibility 0003 179 0003 180 0003 176
Free cash flow 0017 291 0017 291 0017 300
Cash holding 0002 080 0002 077 0002 098
Five-year ROA volatility 0003 035 0002 033 0003 044
Institutional ownership -0001 -068 -0001 -068 -0001 -058
Sales growth -0004 -177 -0004 -175 -0004 -172
Past one-year stock return 0004 169 0004 167 0004 165
Loss frequency -0001 -111 -0001 -109 -0001 -102
Fixed effect
Standard error
Adj R-squared
Observations
Dependent variable ΔAvg Regular dividendTotal assets
This table investigates the causal effect of option-based pay on dividend policy by examining whether changes in dividend policy around
FAS123R vary with its potential accounting impact Panel A reports the results of estimating three two-period first-differencing models
where for each firm we average its characteristics in Pre- and Post-FAS123R period In all three specifications the dependent variable is
the change of average Regular dividendTotal assets from Pre- to Post-FAS123R period The main independent variable varies by model in
Model (1) the Accounting impact rank is the quartile rank of implied option expensetotal assets measured in 2002 (1=lowest 4=highest) In
Model (2) Accounting impact rank=2 (3 4) is an indicator that takes value of one if the firmrsquos Accounting impact rank equals 2 (3 4) In
Model (3) we use an alternative treatment construction following Bakke et al (2015) where Treated is an indicator that takes value of zero
if the firm granted zero option to its CEO in both 2003 and 2004 or the firm began to voluntarily expense option-based pay at fair value in
2002 or earlier and one otherwise For each control variable we include both its level in the Pre-FAS123R period and its change across the
two periods Panel B shows the results of estimating fixed effect models with firm-year observations The dependent variable is the firm-
year level Regular dividendTotal assets The main independent variables are the interactions of Post-FAS123R indicator (Post) with
Accounting Impact rank Accounting impact rank indicators and Treated respectively Panel C examines the intensity of dividend changes
among firms with nonzero dividend per share in 2003 or 2004 In particular we estimates the same three models as in Panel A(with the
same independent variables) but for five dependent variables the change of average Regular dividendTotal assets from Pre- to Post-
FAS123R period (as in Panel A) the percentage change of DPS (dividend per share) from Pre- to Post-FAS123R period and three
indicators denoting respectively whether the percentage change of DPS was greater than 20 40 and 60 Panel D reports four
robustness tests of the dividend intensity regression In each of them a set of possible confounding observations is removed (see Section 33
for details) Panel E compares the trends of dividend initiation and termination around FAS123R across four quartile groups ranked by
accounting impact All models in Panel A C and D have industry fixed effects and the standard errors are Huber-White heteroscedasticity-
consistent standard errors All models in Penal B have firm fixed effects and year fixed effects and the standard errors are clustered at
firm level All variables are defined in Appendix The notation and indicates statistically significant at 10 5 and 1 level
Industry Industry Industry
Model (1) Model (2) Model (3)
1171 1171 1171
Huber-White Huber-White Huber-White
0105 0104 0105
50
Panel B Panel fixed effects regression
Prediction Coeff t-stat Coeff t-stat Coeff t-stat
Acc impact rank x Post + 0000 122
Acc impact rank 2 x Post + 0001 110
Acc impact rank 3 x Post + 0001 094
Acc impact rank 4 x Post + 0001 129
Treated x Post + 0000 -012
Log(size) 0001 179 0001 179 0001 181
Book-to-market 0000 025 0000 024 0000 031
Leverage 0001 062 0001 064 0001 069
Asset tangibility 0009 360 0009 358 0009 363
Free cash flow 0002 090 0002 093 0002 092
Cash holding -0007 -295 -0007 -298 -0007 -298
Five-year ROA volatility 0001 041 0001 038 0000 -006
Institutional ownership 0000 -027 0000 -026 0000 -027
Sales growth 0000 053 0000 051 0000 044
Past one-year stock return 0001 089 0001 088 0001 078
Loss indicator 0000 -060 0000 -057 0000 -076
Fixed effects
Standard error
Adj R-squared
Observations
Dependent variable Regular dividendTotal assets
Model (1) Model (2) Model (3)
Firm Year Firm Year Firm Year
5653 5653 5653
Clustered by firm Clustered by firm Clustered by firm
0877 0877 0877
51
Panel C Intensity of dividend changes around FAS123R
Prediction Coeff t-stat Coeff t-stat Coeff t-stat
Accounting impact rank + 0000 065
Accounting impact rank=2 + 0000 048
Accounting impact rank=3 + 0000 026
Accounting impact rank=4 + 0002 080
Treated + 0001 063
Dependent var DPS pct change
Accounting impact rank + -0145 -072
Accounting impact rank=2 + 0018 006
Accounting impact rank=3 + -0177 -045
Accounting impact rank=4 + -0746 -100
Treated + -0407 -119
Accounting impact rank + 0029 095
Accounting impact rank=2 + 0040 074
Accounting impact rank=3 + 0092 139
Accounting impact rank=4 + 0008 007
Treated + -0007 -012
Accounting impact rank + 0024 076
Accounting impact rank=2 + 0047 088
Accounting impact rank=3 + 0079 114
Accounting impact rank=4 + -0003 -002
Treated + 0030 052
Accounting impact rank + 0030 098
Accounting impact rank=2 + 0078 155
Accounting impact rank=3 + 0085 130
Accounting impact rank=4 + 0014 012
Treated + -0006 -011
Control variables
Fixed effect
Standard error
Observations 572 572 572
Yes Yes Yes
Huber-White Huber-White Huber-White
Industry Industry Industry
Dependent var DPS pct
change gt60 indicator
Model (1) Model (2) Model (3)
Dependent var ΔAvg Regular
dividendAssets
Dependent var DPS pct
change gt20 indicator
Dependent var DPS pct
change gt40 indicator
52
Panel D Robustness tests for intensity of dividend changes around FAS123R
Prediction Coeff t-stat Coeff t-stat Coeff t-stat
Accounting impact rank + 0006 017
Accounting impact rank=2 + 0067 118
Accounting impact rank=3 + 0041 057
Accounting impact rank=4 + -0061 -049
Treated + 0022 035Observations
Accounting impact rank + 0009 027
Accounting impact rank=2 + 0058 106
Accounting impact rank=3 + 0032 043
Accounting impact rank=4 + -0032 -024
Treated + 0018 028
Observations
Accounting impact rank + 0030 089
Accounting impact rank=2 + 0039 071
Accounting impact rank=3 + 0122 168
Accounting impact rank=4 + -0063 -052
Treated + 0075 132
Observations
Accounting impact rank + 0008 023
Accounting impact rank=2 + 0023 042
Accounting impact rank=3 + 0048 064
Accounting impact rank=4 + -0042 -033
Treated + -0010 -016
Observations
Control variables
Fixed effect
Standard error
Exclude firms with stable
payout ratio from 2003 to 2004
506 506 506
Dependent variable DPS pct change gt40 indicator
Model (1) Model (2) Model (3)
Exclude voluntary expensers
519 519
Exclude firms in the top decile
of option reduction (02-04)
Exclude firms that accelerated
option vesting
504 504 504
517 517 517
519
Huber-White Huber-White Huber-White
Yes Yes Yes
Industry Industry Industry
53
Panel E Dividend initiation and termination rates around FAS123R
Pre FAS 123R
1 280 75 7 6 13 173
2 284 135 18 9 27 200
3 286 181 11 14 25 138
4 282 260 9 10 19 73
Total 1132 651 45 39 84 129
Post FAS 123R
1 275 63 4 4 8 127
2 280 116 9 9 18 155
3 276 152 9 3 12 79
4 263 223 5 1 6 27
Total 1094 554 27 17 44 79
Pre FAS 123R
1 280 205 2 0 2 10
2 284 149 7 1 8 54
3 286 105 0 0 0 00
4 282 22 0 0 0 00
Total 1132 481 9 1 10 21
Post FAS 123R
1 275 212 3 6 9 42
2 280 164 1 2 3 18
3 276 124 1 1 2 16
4 263 40 0 3 3 75
Total 1094 540 5 12 17 31
termination
in 2004
03-04
cumulative
03-04
cumulative
Quartile firms
with
dividend in
2004
termination
in 2005
termination
in 2006
05-06
cumulative
05-06
cumulative
Termination
Quartile firms
with
dividend in
2002
termination
in 2003
without
dividend in
2004
initiation in
2003
initiation in
2004
03-04
cumulative
03-04
cumulative firmsQuartile
firmsQuartile initiation in
2005
initiation in
2006
05-06
cumulative
05-06
cumulative
Initiation
without
dividend in
2002
54
Table 4
Effect of option-based compensation on repurchases
Panel A Two-period first-difference regression with total repurchase
Prediction Coeff t-stat Coeff t-stat Coeff t-stat
Accounting impact rank - 0002 122
Accounting impact rank=2 - 0002 071
Accounting impact rank=3 - 0005 123
Accounting impact rank=4 - 0007 102
Treated - 0014 365
Control variables
Fixed effect
Standard error
Adj R-squared
Observations
Panel B Two-period first-difference regression with net repurchase
Prediction Coeff t-stat Coeff t-stat Coeff t-stat
Accounting impact rank - 0003 166
Accounting impact rank=2 - 0002 051
Accounting impact rank=3 - 0006 165
Accounting impact rank=4 - 0009 137
Treated - 0010 300
Control variables
Fixed effect
Standard error
Adj R-squared
Observations
Panel C Two-period first-difference regression with repurchase adjusted for exercised options
Prediction Coeff t-stat Coeff t-stat Coeff t-stat
Accounting impact rank - 0001 056
Accounting impact rank=2 - 0002 062
Accounting impact rank=3 - 0007 172
Accounting impact rank=4 - -0001 -008
Treated - 0006 197
Control variables
Fixed effect
Standard error
Adj R-squared
Observations
Dependent variable ΔAvg RepurchaseTotal assets
This table investigates the causal effect of option-based pay on payout policy by examining whether the changes of repurchase around
FAS123R vary with its potential accounting impact Panel A reports the results of estimating three two-period first-differencing models
where for each firm we average its characteristics in Pre- and Post-FAS123R period In all three specifications the dependent variable is
the change of average RepurchaseTotal assets from Pre- to Post-FAS123R period The main independent variable varies by model in
Model (1) the Accounting impact rank is the quartile rank of implied option expensetotal assets measured in 2002 (1=lowest 4=highest)
In Model (2) Accounting impact rank=2 (3 4) is an indicator that takes value of one if the firmrsquos Accounting impact rank equals 2 (3 4)
In Model (3) we use an alternative treatment construction following Bakke et al (2015) where Treated is an indicator that takes value of
zero if the firm granted zero option to its CEO in both 2003 and 2004 or the firm began to voluntarily expense option-based pay at fair
value in 2002 or earlier and one otherwise Panel B reports the regressions with the change of Net repurchaseTotal assets as the
dependent variable and the same independent variable as in Panel A Panel C reports the regressions with the change of Adjusted
repurchaseTotal assets as the dependent variable and the same independent variable as in Panel A All models in Panel A B and C have
industry fixed effects and the standard errors are Huber-White heteroscedasticity-consistent standard errors All variables are defined in
Appendix The notation and indicates statistically significant at 10 5 and 1 level respectively
Model (1) Model (2) Model (3)
Yes Yes Yes
Industry Industry Industry
Huber-White Huber-White Huber-White
Dependent variable ΔAvg Net repurchaseTotal assets
1171 1171 1171
0238 0237 0245
Model (1) Model (2) Model (3)
Yes Yes Yes
Industry Industry Industry
Huber-White Huber-White Huber-White
Dependent variable ΔAvg Adjusted repurchaseTotal assets
0229 0229 0233
1171 1171 1171
Model (1) Model (2) Model (3)
Yes Yes Yes
Industry Industry Industry
Huber-White Huber-White Huber-White
0111 0112 0114
1168 1168 1168
55
Table 5
Effect of option-based compensation on payout mix
Panel A Two-period first-difference regression with total payout mix
Prediction Coeff t-stat Coeff t-stat Coeff t-stat
Accounting impact rank + 0006 028
Accounting impact rank=2 + 0018 045
Accounting impact rank=3 + -0001 -001
Accounting impact rank=4 + 0043 052
Treated + -0035 -094
Control variables
Fixed effect
Standard error
Adj R-squared
Observations
Panel B Two-period first-difference regression with net payout mix
Prediction Coeff t-stat Coeff t-stat Coeff t-stat
Accounting impact rank + -0002 -008
Accounting impact rank=2 + 0008 016
Accounting impact rank=3 + 0018 034
Accounting impact rank=4 + -0059 -055
Treated + -0050 -101
Control variables
Fixed effect
Standard error
Adj R-squared
Observations
0049 0043 0054
257 257 257
Industry Industry Industry
Huber-White Huber-White Huber-White
Dependent variable ΔAvg Regular dividendNet payout
Model (1) Model (2) Model (3)
Yes Yes Yes
0154 0151 0156
362 362 362
Industry Industry Industry
Huber-White Huber-White Huber-White
This table investigates the causal effect of option-based pay on payout mix for firms using both dividend and repurchase by examining
whether the changes of payout mix around FAS123R vary with its potential accounting impact Panel A reports the results of estimating
three two-period first-differencing models where for each firm we average its characteristics in Pre- and Post-FAS123R period In all three
specifications the dependent variable is the change of average Regular dividendTotal payout from Pre- to Post-FAS123R period The main
independent variable varies by model in Model (1) the Accounting impact rank is the quartile rank of implied option expensetotal assets
measured in 2002 (1=lowest 4=highest) In Model (2) Accounting impact rank=2 (3 4) is an indicator that takes value of one if the firmrsquos
Accounting impact rank equals 2 (3 4) In Model (3) we use an alternative treatment construction following Bakke et al (2015) where
Treated is an indicator that takes value of zero if the firm granted zero option to its CEO in both 2003 and 2004 or the firm began to
voluntarily expense option-based pay at fair value in 2002 or earlier and one otherwise Panel B reports the regressions with the change of
Regular dividendNet payout as the dependent variable and the same independent variables as in Panel A Panel A (Panel B) is based on
observations with nonzero regular dividend and repurchase (net repurchase) in both Pre- and Post-FAS123R period All models in Panel A
and B have industry fixed effects and the standard errors are Huber-White heteroscedasticity-consistent standard errors All variables are
defined in Appendix The notation and indicates statistically significant at 10 5 and 1 level respectively
Yes Yes Yes
Dependent variable ΔAvg Regular dividendTotal payout
Model (1) Model (2) Model (3)

40
Murphy Kevin J 1999 Executive compensation In O Ashenfelter and D Card (eds) North
Holland Handbook of Labor Economics Amsterdam Elsevier Science BV
Murphy Kevin J 2013 Executive compensation Where we are and how we got there Handbook
of the Economics of Finance Elsevier Science North Holland 211-356
Nikolaev Valeri 2010 Debt Covenants and Accounting Conservatism Journal of Accounting
Research 48 143-176
Puri Manju Joumlrg Rocholl and Sascha Steffen 2011 Global retail lending in the aftermath of the
US financial crisis Distinguishing between supply and demand effects Journal of Financial
Economics 100 556-578
Shue Kelly and Richard R Townsend 2014 Swinging for the fences Executive reactions to
quasi-random option grants Working Paper University of Chicago
Skinner Douglas J 2008 The evolving relation between earnings dividends and stock
repurchases Journal of Financial Economics 87 582-609
Weisbenner Scott J 2000 Corporate share repurchases in the 1990s What role do stock options
play FEDS Working Paper No 2000-29
Zhang Dan 2013 CEO dividend protection Working Paper BI Norwegian Business School
41
Figure 1 Trends of dividends and repurchases from 2003 to 2007 Panel A plots the average
Regular DividendTotal Assets of firms in the highest and lowest quartiles of Accounting Impact
measured in 2002 Panel B shows the average Total RepurchaseTotal Assets of firms in the
highest and lowest quartiles of Accounting Impact measured in 2002
Panel A Trends of regular dividends
Panel B Trends of total repurchases
00
05
10
15
20
2003 2004 2005 2006 2007
Regular DividendTotal Assets
Lowest Acc Impact
Highest Acc Impact
Pre Post
00
20
40
60
80
100
2003 2004 2005 2006 2007
Total Repurchase Total Assets
Lowest Acc Impact
Highest Acc Impact
Pre Post
42
Table 1
Summary Statistics
Panel A Firm characteristics - full sample
N Mean Std dev 25 pctl Median 75 pctl
Accounting impact (2002) 1176 173 366 022 052 163
Payout variablesRegular dividendTotal assets 5653 093 148 000 000 142
RepurchaseTotal assets 5653 394 710 000 035 500
Total payoutTotal assets 5653 488 748 000 175 666
Regular dividendTotal payout 4091 3874 4057 000 2237 8833
Level of executive compensation (in $1000)
Salary_$ 5653 450 190 314 409 544
Bonus_$ 5653 476 616 122 295 586
Option grant_$ 5653 791 1137 62 384 1002
Restricted stock grant_$ 5653 458 866 0 58 518
Total pay_$ 5653 2481 2475 890 1647 3074
Percentage of executive compensation
Salary_ 5653 296 183 165 251 382
Bonus_ 5653 197 148 97 177 268
Option grant_ 5653 283 235 67 256 445
Restricted stock grant_ 5653 141 180 00 41 249
Control variables
Size ($M) 5653 11086 27294 1017 2459 8117
Log(size) 5653 7985 1565 6925 7808 9002
Book-to-market 5653 0445 0287 0251 0388 0578
Leverage 5653 0202 0172 0038 0187 0309
Asset tangibility 5653 0806 0184 0691 0853 0965
Free cash flow 5653 0059 0091 0013 0059 0108
Cash holding 5653 0166 0172 0034 0100 0247
ROA volatility 5653 0056 0056 0021 0038 0070
Institutional ownership 5653 0753 0202 0639 0795 0910
Sales growth 5653 0121 0189 0028 0096 0183
Past stock return 5653 0094 0183 -0012 0094 0199
Loss indicator 5653 0164 0370 0000 0000 0000
This table presents summary statistics Panel A shows the descriptive statistics of payout variables compensation
variables and other firm characteristics for the full sample Accounting impact is the implied option expense
measured at fiscal year 2002 All other variables are measured at firm-year level from fiscal year 2003 to 2007
resulting in 5653 firm-year observations (except for Regular dividendTotal Payout which can be measured only
for the 4901 firm-year observations with Total payout greater than zero) Panel B shows the pairwise correlations
between main variables at firm-year level Panel C compares payout variables compensation variables and other
firm characteristics before and after FAS123R The Pre-FAS123R period consists of fiscal year 2003 and 2004
the Post-FAS123R period covers fiscal year 2005-2007 Panel D compares the trends of payout and compensation
variables around FAS123R across four quartile groups ranked by 2002 accounting impact Panel E compares the
trends of payout and compensation variables around FAS123R between the treated and control group under the
alternative treatment definition in Bakke et al (2015) (see Section 22) All variables are defined in Appendix The
notation and in Panel C indicates statistically significant at 10 5 and 1 level in T-tests for equal
means respectively
43
Pa
nel
B
Pea
rso
n c
orr
ela
tio
ns
Reg div
Repurchase
Total payout
Salary_
Bonus_
Option_
RS_
Log(size)
BM
Leverage
Tangibility
FCF
Cash holdingROA vol
Inst own
Sales growth
Past ret
urn
Loss
Reg
div
10
0
Repurc
hase
01
610
0
Tota
l payout
03
509
810
0
Sala
ry_
-0
10
-01
8-0
19
10
0
Bonus_
00
700
100
3-0
01
10
0
Option_
-0
10
00
900
6-0
41
-03
510
0
RS
_
01
000
901
0-0
32
-01
1-0
40
10
0
Log(s
ize)
03
101
802
3-0
56
01
101
202
210
0
BM
-02
1-0
28
-03
103
0-0
03
-02
000
0-0
33
10
0
Levera
ge
-00
1-0
08
-00
8-0
05
00
6-0
11
00
801
9-0
03
10
0
Tangib
ility
00
200
100
101
200
1-0
05
-00
6-0
12
-00
4-0
18
10
0
FC
F02
203
703
9-0
20
00
901
1-0
01
02
4-0
32
-02
1-0
16
10
0
Cash
hold
ing
-01
301
000
700
2-0
14
02
2-0
10
-02
3-0
16
-03
502
901
210
0
RO
A v
ol
-01
5-0
04
-00
700
4-0
11
01
9-0
11
-02
3-0
08
-01
101
2-0
02
03
910
0
Inst
ow
n
-00
901
401
1-0
17
00
200
701
200
7-0
01
00
3-0
08
01
4-0
06
-01
110
0
Sale
s gro
wth
-00
8-0
04
-00
6-0
15
00
501
0-0
02
00
7-0
16
-00
3-0
08
01
300
201
400
410
0
Past
retu
rn00
901
301
4-0
18
01
5-0
01
00
301
6-0
29
-01
000
102
7-0
14
-01
001
602
710
0
Loss
-02
0-0
19
-02
201
8-0
18
00
4-0
05
-02
601
901
300
6-0
41
01
702
3-0
16
-01
8-0
40
10
0
44
Panel C Firm characteristics - before and after FAS123R
Pre FAS 123R Post FAS 123R Difference
Payout variables
Regular dividendTotal assets 083 099 016
RepurchaseTotal assets 245 490 245
Total payoutTotal assets 328 589 261
Regular dividendTotal payout 3914 2790 -1124
Level of executive compensation (in $1000)
Salary_$ 426 463 37
Bonus_$ 418 505 87
Option grant_$ 896 707 -191
Restricted stock grant_$ 269 574 305
Total pay_$ 2263 2584 321
Percentage of executive compensation
Salary_ 305 293 -12
Bonus_ 186 204 18
Option grant_ 343 240 -103
Restricted stock grant_ 87 176 89
Control variables
Size ($M) 9671 11631 1960
Log(size) 7860 8035 0175
Book-to-market 0437 0453 0016
Leverage 0201 0203 0002
Asset tangibility 0822 0793 -0029
Free cash flow 0061 0057 -0004
Cash holding 0175 0159 -0016
ROA volatility 0067 0048 -0019
Institutional ownership 0712 0781 0069
Sales growth 0137 0108 -0029
Past stock return 0080 0101 0021
Loss indicator 0173 0159 -0014
45
Pa
nel
D
Fir
m c
ha
racte
rist
ics
by q
ua
rtil
e o
f a
cco
un
tin
g i
mp
act
- b
efo
re a
nd
aft
er
FA
S1
23
R
Accounting im
pact
(2002)
Num
ber
of
Fir
ms
Pre
Post
Pre
Post
Pre
Post
Pre
Post
Payout
vari
able
s
Regula
r div
idendT
ota
l ass
ets
11
2
12
4
09
4
11
1
09
5
11
3
03
0
04
9
Repurc
hase
Tota
l ass
ets
11
3
26
8
19
2
37
3
32
7
63
1
35
1
68
7
Tota
l payout
Tota
l ass
ets
22
4
39
1
28
5
48
4
42
2
74
4
38
1
73
6
Regula
r div
idendT
ota
l payout
643
7
469
8
474
0
341
1
284
5
195
4
82
5
74
5
Perc
enta
ge o
f executive c
om
pensa
tion
Sala
ry_
337
295
313
287
296
289
276
300
Bonus_
223
226
214
228
172
192
134
169
Option g
rant_
201
167
290
210
373
260
507
325
Rest
ricte
d s
tock g
rant_
116
194
98
180
89
176
43
155
294
294
294
294
1st Q
uart
ile2
nd Q
uart
ile3
rd Q
uart
ile4
th Q
uart
ile
01
2
03
5
09
3
55
1
46
Accounting impact
Number of Firms
By accounting impact quartile
1
2
3
4
Pre Post Pre Post
Payout variables
Regular dividendTotal assets 09 11 08 10
RepurchaseTotal assets 18 31 26 52
Total payoutTotal assets 28 43 34 62
Regular dividendTotal payout 428 357 386 265
Percentage of executive compensation
Salary_ 435 364 282 280
Bonus_ 226 214 179 202
Option grant_ 92 125 387 261
Restricted stock grant_ 125 188 80 174
Percentage of CEO compensation
Salary_(CEO) 485 364 260 259
Bonus_(CEO) 249 228 185 219
Option grant_(CEO) 10 127 406 275
Restricted stock grant_(CEO) 128 182 82 183
Panel E Firm characteristics by alternative treatment definition - before and
after FAS123R
Treated
25
19
997
223
250
256
268
10
177
71
Control
44
37
47
Table 2
Differential effect of FAS123R on the use of option-based compensation
Panel A Two-period first-difference regression
Prediction Coeff t-stat Coeff t-stat Coeff t-stat
Accounting impact rank - -0044 -628
Accounting impact rank=2 - -0044 -327
Accounting impact rank=3 - -0075 -468
Accounting impact rank=4 - -0140 -613
Treated - -0132 -875
ΔLog(size) 0061 202 0061 200 0063 214
ΔBook-to-market 0032 091 0032 092 0051 143
ΔLeverage -0157 -213 -0160 -218 -0111 -153
ΔAsset tangibility -0012 -014 -0020 -023 -0023 -026
ΔFree cash flow -0106 -095 -0108 -097 -0128 -117
ΔCash holding -0197 -211 -0193 -206 -0180 -194
ΔFive-year ROA volatility -0065 -031 -0056 -026 -0098 -047
ΔInstitutional ownership -0044 -091 -0043 -088 -0044 -092
ΔSales growth -0064 -102 -0065 -104 -0090 -153
ΔPast one-year stock return 0051 078 0052 080 0091 138
ΔLoss frequency 0056 207 0057 207 0047 179
Log(size) -0009 -210 -0009 -207 -0002 -035
Book-to-market -0015 -056 -0013 -049 0018 072
Leverage 0022 046 0023 048 0068 150
Asset tangibility 0033 077 0033 078 0053 128
Free cash flow 0227 202 0220 195 0127 117
Cash holding -0002 -004 0012 019 -0078 -141
Five-year ROA volatility -0451 -240 -0430 -228 -0509 -283
Institutional ownership -0123 -360 -0122 -359 -0100 -292
Sales growth -0041 -056 -0040 -055 -0089 -125
Past one-year stock return -0009 -015 -0006 -010 0078 125
Loss frequency 0055 174 0056 178 0054 173
Fixed effect
Standard error
Adj R-squared
Observations
Model (3)
Dependent variable ΔAvg Option grantTotal pay
Huber-White
0156
This table investigates whether the effect of FAS123R on the use of option-based pay varies with its potential accounting impact Panel A
reports the results of estimating three two-period first-differencing models where for each firm we average its characteristics in Pre- and
Post-FAS123R period The Pre-FAS123R period consists of fiscal year 2003 and 2004 the Post-FAS123R period covers fiscal year 2005-
2007 In all three specifications the dependent variable is the change of average Option grantTotal pay from Pre- to Post-FAS123R period
The main independent variable varies by model in Model (1) the Accounting impact rank is the quartile rank of implied option expensetotal
assets measured in 2002 (1=lowest 4=highest) In Model (2) Accounting impact rank=2 (3 4) is an indicator that takes value of one if the
firmrsquos Accounting impact rank equals 2 (3 4) In Model (3) we use an alternative treatment construction following Bakke et al (2015)
where Treated is an indicator that takes value of zero if the firm granted zero option to its CEO in both 2003 and 2004 or the firm began to
voluntarily expense option-based pay at fair value in 2002 or earlier and one otherwise For each control variable we include both its level in
the Pre-FAS123R period and its change across the two periods Panel B shows the results of estimating fixed effect models with firm-year
observations The dependent variable is the firm-year level Option grantTotal pay The main independent variables are the interactions of
Post-FAS123R indicator (Post) with Accounting Impact rank Accounting impact rank indicators and Treated respectively All models in
Penal A have industry fixed effects and the standard errors are Huber-White heteroscedasticity-consistent standard errors All models in
Penal B have firm fixed effects and year fixed effects and the standard errors are clustered at firm level All variables are defined in
Appendix The notation and indicates statistically significant at 10 5 and 1 level respectively
Model (1) Model (2)
11711171 1171
Industry Industry
Huber-White
0124
Huber-White
0123
Industry
48
Panel B Panel fixed effects regression
Prediction Coeff t-stat Coeff t-stat Coeff t-stat
Acc impact rank x Post - -0044 -807
Acc impact rank 2 x Post - -0046 -333
Acc impact rank 3 x Post - -0077 -526
Acc impact rank 4 x Post - -0137 -776
Treated x Post - -0145 -970
Log(size) 0034 221 0034 217 0036 229
Book-to-market 0018 084 0017 083 0015 070
Leverage -0004 -009 -0006 -013 -0007 -015
Asset tangibility 0007 012 0004 006 0011 018
Free cash flow -0074 -151 -0072 -146 -0078 -158
Cash holding -0048 -086 -0050 -090 -0006 -011
Five-year ROA volatility 0250 231 0239 219 0437 414
Institutional ownership 0043 159 0044 161 0041 150
Sales growth -0033 -168 -0034 -171 -0031 -158
Past one-year stock return 0067 221 0068 224 0063 204
Loss indicator 0023 209 0022 207 0024 222
Fixed effects
Standard error
Adj R-squared
Observations
Dependent variable Option grantTotal pay
5653 5653 5653
Clustered by firm
Firm Year
Clustered by firm
Firm Year
Clustered by firm
0523 0523 0526
Model (1) Model (2) Model (3)
Firm Year
49
Table 3
Effect of option-based compensation on dividend policy
Panel A Two-period first-difference regression
Prediction Coeff t-stat Coeff t-stat Coeff t-stat
Accounting impact rank + 0000 077
Accounting impact rank=2 + 0001 091
Accounting impact rank=3 + 0000 044
Accounting impact rank=4 + 0001 092
Treated + 0000 -026
ΔLog(size) 0000 -030 0000 -030 0000 -026
ΔBook-to-market -0002 -190 -0002 -193 -0002 -195
ΔLeverage -0002 -059 -0002 -057 -0002 -059
ΔAsset tangibility 0016 431 0016 429 0016 430
ΔFree cash flow 0017 373 0017 373 0017 375
ΔCash holding -0011 -288 -0011 -285 -0010 -282
ΔFive-year ROA volatility 0003 034 0002 032 0003 035
ΔInstitutional ownership -0002 -073 -0002 -073 -0002 -070
ΔSales growth -0001 -040 -0001 -037 -0001 -038
ΔPast one-year stock return 0002 077 0002 076 0002 070
ΔLoss frequency 0000 -048 0000 -045 0000 -046
Log(size) 0000 183 0000 182 0000 182
Book-to-market -0002 -227 -0002 -225 -0002 -284
Leverage -0001 -037 -0001 -039 -0001 -048
Asset tangibility 0003 179 0003 180 0003 176
Free cash flow 0017 291 0017 291 0017 300
Cash holding 0002 080 0002 077 0002 098
Five-year ROA volatility 0003 035 0002 033 0003 044
Institutional ownership -0001 -068 -0001 -068 -0001 -058
Sales growth -0004 -177 -0004 -175 -0004 -172
Past one-year stock return 0004 169 0004 167 0004 165
Loss frequency -0001 -111 -0001 -109 -0001 -102
Fixed effect
Standard error
Adj R-squared
Observations
Dependent variable ΔAvg Regular dividendTotal assets
This table investigates the causal effect of option-based pay on dividend policy by examining whether changes in dividend policy around
FAS123R vary with its potential accounting impact Panel A reports the results of estimating three two-period first-differencing models
where for each firm we average its characteristics in Pre- and Post-FAS123R period In all three specifications the dependent variable is
the change of average Regular dividendTotal assets from Pre- to Post-FAS123R period The main independent variable varies by model in
Model (1) the Accounting impact rank is the quartile rank of implied option expensetotal assets measured in 2002 (1=lowest 4=highest) In
Model (2) Accounting impact rank=2 (3 4) is an indicator that takes value of one if the firmrsquos Accounting impact rank equals 2 (3 4) In
Model (3) we use an alternative treatment construction following Bakke et al (2015) where Treated is an indicator that takes value of zero
if the firm granted zero option to its CEO in both 2003 and 2004 or the firm began to voluntarily expense option-based pay at fair value in
2002 or earlier and one otherwise For each control variable we include both its level in the Pre-FAS123R period and its change across the
two periods Panel B shows the results of estimating fixed effect models with firm-year observations The dependent variable is the firm-
year level Regular dividendTotal assets The main independent variables are the interactions of Post-FAS123R indicator (Post) with
Accounting Impact rank Accounting impact rank indicators and Treated respectively Panel C examines the intensity of dividend changes
among firms with nonzero dividend per share in 2003 or 2004 In particular we estimates the same three models as in Panel A(with the
same independent variables) but for five dependent variables the change of average Regular dividendTotal assets from Pre- to Post-
FAS123R period (as in Panel A) the percentage change of DPS (dividend per share) from Pre- to Post-FAS123R period and three
indicators denoting respectively whether the percentage change of DPS was greater than 20 40 and 60 Panel D reports four
robustness tests of the dividend intensity regression In each of them a set of possible confounding observations is removed (see Section 33
for details) Panel E compares the trends of dividend initiation and termination around FAS123R across four quartile groups ranked by
accounting impact All models in Panel A C and D have industry fixed effects and the standard errors are Huber-White heteroscedasticity-
consistent standard errors All models in Penal B have firm fixed effects and year fixed effects and the standard errors are clustered at
firm level All variables are defined in Appendix The notation and indicates statistically significant at 10 5 and 1 level
Industry Industry Industry
Model (1) Model (2) Model (3)
1171 1171 1171
Huber-White Huber-White Huber-White
0105 0104 0105
50
Panel B Panel fixed effects regression
Prediction Coeff t-stat Coeff t-stat Coeff t-stat
Acc impact rank x Post + 0000 122
Acc impact rank 2 x Post + 0001 110
Acc impact rank 3 x Post + 0001 094
Acc impact rank 4 x Post + 0001 129
Treated x Post + 0000 -012
Log(size) 0001 179 0001 179 0001 181
Book-to-market 0000 025 0000 024 0000 031
Leverage 0001 062 0001 064 0001 069
Asset tangibility 0009 360 0009 358 0009 363
Free cash flow 0002 090 0002 093 0002 092
Cash holding -0007 -295 -0007 -298 -0007 -298
Five-year ROA volatility 0001 041 0001 038 0000 -006
Institutional ownership 0000 -027 0000 -026 0000 -027
Sales growth 0000 053 0000 051 0000 044
Past one-year stock return 0001 089 0001 088 0001 078
Loss indicator 0000 -060 0000 -057 0000 -076
Fixed effects
Standard error
Adj R-squared
Observations
Dependent variable Regular dividendTotal assets
Model (1) Model (2) Model (3)
Firm Year Firm Year Firm Year
5653 5653 5653
Clustered by firm Clustered by firm Clustered by firm
0877 0877 0877
51
Panel C Intensity of dividend changes around FAS123R
Prediction Coeff t-stat Coeff t-stat Coeff t-stat
Accounting impact rank + 0000 065
Accounting impact rank=2 + 0000 048
Accounting impact rank=3 + 0000 026
Accounting impact rank=4 + 0002 080
Treated + 0001 063
Dependent var DPS pct change
Accounting impact rank + -0145 -072
Accounting impact rank=2 + 0018 006
Accounting impact rank=3 + -0177 -045
Accounting impact rank=4 + -0746 -100
Treated + -0407 -119
Accounting impact rank + 0029 095
Accounting impact rank=2 + 0040 074
Accounting impact rank=3 + 0092 139
Accounting impact rank=4 + 0008 007
Treated + -0007 -012
Accounting impact rank + 0024 076
Accounting impact rank=2 + 0047 088
Accounting impact rank=3 + 0079 114
Accounting impact rank=4 + -0003 -002
Treated + 0030 052
Accounting impact rank + 0030 098
Accounting impact rank=2 + 0078 155
Accounting impact rank=3 + 0085 130
Accounting impact rank=4 + 0014 012
Treated + -0006 -011
Control variables
Fixed effect
Standard error
Observations 572 572 572
Yes Yes Yes
Huber-White Huber-White Huber-White
Industry Industry Industry
Dependent var DPS pct
change gt60 indicator
Model (1) Model (2) Model (3)
Dependent var ΔAvg Regular
dividendAssets
Dependent var DPS pct
change gt20 indicator
Dependent var DPS pct
change gt40 indicator
52
Panel D Robustness tests for intensity of dividend changes around FAS123R
Prediction Coeff t-stat Coeff t-stat Coeff t-stat
Accounting impact rank + 0006 017
Accounting impact rank=2 + 0067 118
Accounting impact rank=3 + 0041 057
Accounting impact rank=4 + -0061 -049
Treated + 0022 035Observations
Accounting impact rank + 0009 027
Accounting impact rank=2 + 0058 106
Accounting impact rank=3 + 0032 043
Accounting impact rank=4 + -0032 -024
Treated + 0018 028
Observations
Accounting impact rank + 0030 089
Accounting impact rank=2 + 0039 071
Accounting impact rank=3 + 0122 168
Accounting impact rank=4 + -0063 -052
Treated + 0075 132
Observations
Accounting impact rank + 0008 023
Accounting impact rank=2 + 0023 042
Accounting impact rank=3 + 0048 064
Accounting impact rank=4 + -0042 -033
Treated + -0010 -016
Observations
Control variables
Fixed effect
Standard error
Exclude firms with stable
payout ratio from 2003 to 2004
506 506 506
Dependent variable DPS pct change gt40 indicator
Model (1) Model (2) Model (3)
Exclude voluntary expensers
519 519
Exclude firms in the top decile
of option reduction (02-04)
Exclude firms that accelerated
option vesting
504 504 504
517 517 517
519
Huber-White Huber-White Huber-White
Yes Yes Yes
Industry Industry Industry
53
Panel E Dividend initiation and termination rates around FAS123R
Pre FAS 123R
1 280 75 7 6 13 173
2 284 135 18 9 27 200
3 286 181 11 14 25 138
4 282 260 9 10 19 73
Total 1132 651 45 39 84 129
Post FAS 123R
1 275 63 4 4 8 127
2 280 116 9 9 18 155
3 276 152 9 3 12 79
4 263 223 5 1 6 27
Total 1094 554 27 17 44 79
Pre FAS 123R
1 280 205 2 0 2 10
2 284 149 7 1 8 54
3 286 105 0 0 0 00
4 282 22 0 0 0 00
Total 1132 481 9 1 10 21
Post FAS 123R
1 275 212 3 6 9 42
2 280 164 1 2 3 18
3 276 124 1 1 2 16
4 263 40 0 3 3 75
Total 1094 540 5 12 17 31
termination
in 2004
03-04
cumulative
03-04
cumulative
Quartile firms
with
dividend in
2004
termination
in 2005
termination
in 2006
05-06
cumulative
05-06
cumulative
Termination
Quartile firms
with
dividend in
2002
termination
in 2003
without
dividend in
2004
initiation in
2003
initiation in
2004
03-04
cumulative
03-04
cumulative firmsQuartile
firmsQuartile initiation in
2005
initiation in
2006
05-06
cumulative
05-06
cumulative
Initiation
without
dividend in
2002
54
Table 4
Effect of option-based compensation on repurchases
Panel A Two-period first-difference regression with total repurchase
Prediction Coeff t-stat Coeff t-stat Coeff t-stat
Accounting impact rank - 0002 122
Accounting impact rank=2 - 0002 071
Accounting impact rank=3 - 0005 123
Accounting impact rank=4 - 0007 102
Treated - 0014 365
Control variables
Fixed effect
Standard error
Adj R-squared
Observations
Panel B Two-period first-difference regression with net repurchase
Prediction Coeff t-stat Coeff t-stat Coeff t-stat
Accounting impact rank - 0003 166
Accounting impact rank=2 - 0002 051
Accounting impact rank=3 - 0006 165
Accounting impact rank=4 - 0009 137
Treated - 0010 300
Control variables
Fixed effect
Standard error
Adj R-squared
Observations
Panel C Two-period first-difference regression with repurchase adjusted for exercised options
Prediction Coeff t-stat Coeff t-stat Coeff t-stat
Accounting impact rank - 0001 056
Accounting impact rank=2 - 0002 062
Accounting impact rank=3 - 0007 172
Accounting impact rank=4 - -0001 -008
Treated - 0006 197
Control variables
Fixed effect
Standard error
Adj R-squared
Observations
Dependent variable ΔAvg RepurchaseTotal assets
This table investigates the causal effect of option-based pay on payout policy by examining whether the changes of repurchase around
FAS123R vary with its potential accounting impact Panel A reports the results of estimating three two-period first-differencing models
where for each firm we average its characteristics in Pre- and Post-FAS123R period In all three specifications the dependent variable is
the change of average RepurchaseTotal assets from Pre- to Post-FAS123R period The main independent variable varies by model in
Model (1) the Accounting impact rank is the quartile rank of implied option expensetotal assets measured in 2002 (1=lowest 4=highest)
In Model (2) Accounting impact rank=2 (3 4) is an indicator that takes value of one if the firmrsquos Accounting impact rank equals 2 (3 4)
In Model (3) we use an alternative treatment construction following Bakke et al (2015) where Treated is an indicator that takes value of
zero if the firm granted zero option to its CEO in both 2003 and 2004 or the firm began to voluntarily expense option-based pay at fair
value in 2002 or earlier and one otherwise Panel B reports the regressions with the change of Net repurchaseTotal assets as the
dependent variable and the same independent variable as in Panel A Panel C reports the regressions with the change of Adjusted
repurchaseTotal assets as the dependent variable and the same independent variable as in Panel A All models in Panel A B and C have
industry fixed effects and the standard errors are Huber-White heteroscedasticity-consistent standard errors All variables are defined in
Appendix The notation and indicates statistically significant at 10 5 and 1 level respectively
Model (1) Model (2) Model (3)
Yes Yes Yes
Industry Industry Industry
Huber-White Huber-White Huber-White
Dependent variable ΔAvg Net repurchaseTotal assets
1171 1171 1171
0238 0237 0245
Model (1) Model (2) Model (3)
Yes Yes Yes
Industry Industry Industry
Huber-White Huber-White Huber-White
Dependent variable ΔAvg Adjusted repurchaseTotal assets
0229 0229 0233
1171 1171 1171
Model (1) Model (2) Model (3)
Yes Yes Yes
Industry Industry Industry
Huber-White Huber-White Huber-White
0111 0112 0114
1168 1168 1168
55
Table 5
Effect of option-based compensation on payout mix
Panel A Two-period first-difference regression with total payout mix
Prediction Coeff t-stat Coeff t-stat Coeff t-stat
Accounting impact rank + 0006 028
Accounting impact rank=2 + 0018 045
Accounting impact rank=3 + -0001 -001
Accounting impact rank=4 + 0043 052
Treated + -0035 -094
Control variables
Fixed effect
Standard error
Adj R-squared
Observations
Panel B Two-period first-difference regression with net payout mix
Prediction Coeff t-stat Coeff t-stat Coeff t-stat
Accounting impact rank + -0002 -008
Accounting impact rank=2 + 0008 016
Accounting impact rank=3 + 0018 034
Accounting impact rank=4 + -0059 -055
Treated + -0050 -101
Control variables
Fixed effect
Standard error
Adj R-squared
Observations
0049 0043 0054
257 257 257
Industry Industry Industry
Huber-White Huber-White Huber-White
Dependent variable ΔAvg Regular dividendNet payout
Model (1) Model (2) Model (3)
Yes Yes Yes
0154 0151 0156
362 362 362
Industry Industry Industry
Huber-White Huber-White Huber-White
This table investigates the causal effect of option-based pay on payout mix for firms using both dividend and repurchase by examining
whether the changes of payout mix around FAS123R vary with its potential accounting impact Panel A reports the results of estimating
three two-period first-differencing models where for each firm we average its characteristics in Pre- and Post-FAS123R period In all three
specifications the dependent variable is the change of average Regular dividendTotal payout from Pre- to Post-FAS123R period The main
independent variable varies by model in Model (1) the Accounting impact rank is the quartile rank of implied option expensetotal assets
measured in 2002 (1=lowest 4=highest) In Model (2) Accounting impact rank=2 (3 4) is an indicator that takes value of one if the firmrsquos
Accounting impact rank equals 2 (3 4) In Model (3) we use an alternative treatment construction following Bakke et al (2015) where
Treated is an indicator that takes value of zero if the firm granted zero option to its CEO in both 2003 and 2004 or the firm began to
voluntarily expense option-based pay at fair value in 2002 or earlier and one otherwise Panel B reports the regressions with the change of
Regular dividendNet payout as the dependent variable and the same independent variables as in Panel A Panel A (Panel B) is based on
observations with nonzero regular dividend and repurchase (net repurchase) in both Pre- and Post-FAS123R period All models in Panel A
and B have industry fixed effects and the standard errors are Huber-White heteroscedasticity-consistent standard errors All variables are
defined in Appendix The notation and indicates statistically significant at 10 5 and 1 level respectively
Yes Yes Yes
Dependent variable ΔAvg Regular dividendTotal payout
Model (1) Model (2) Model (3)

41
Figure 1 Trends of dividends and repurchases from 2003 to 2007 Panel A plots the average
Regular DividendTotal Assets of firms in the highest and lowest quartiles of Accounting Impact
measured in 2002 Panel B shows the average Total RepurchaseTotal Assets of firms in the
highest and lowest quartiles of Accounting Impact measured in 2002
Panel A Trends of regular dividends
Panel B Trends of total repurchases
00
05
10
15
20
2003 2004 2005 2006 2007
Regular DividendTotal Assets
Lowest Acc Impact
Highest Acc Impact
Pre Post
00
20
40
60
80
100
2003 2004 2005 2006 2007
Total Repurchase Total Assets
Lowest Acc Impact
Highest Acc Impact
Pre Post
42
Table 1
Summary Statistics
Panel A Firm characteristics - full sample
N Mean Std dev 25 pctl Median 75 pctl
Accounting impact (2002) 1176 173 366 022 052 163
Payout variablesRegular dividendTotal assets 5653 093 148 000 000 142
RepurchaseTotal assets 5653 394 710 000 035 500
Total payoutTotal assets 5653 488 748 000 175 666
Regular dividendTotal payout 4091 3874 4057 000 2237 8833
Level of executive compensation (in $1000)
Salary_$ 5653 450 190 314 409 544
Bonus_$ 5653 476 616 122 295 586
Option grant_$ 5653 791 1137 62 384 1002
Restricted stock grant_$ 5653 458 866 0 58 518
Total pay_$ 5653 2481 2475 890 1647 3074
Percentage of executive compensation
Salary_ 5653 296 183 165 251 382
Bonus_ 5653 197 148 97 177 268
Option grant_ 5653 283 235 67 256 445
Restricted stock grant_ 5653 141 180 00 41 249
Control variables
Size ($M) 5653 11086 27294 1017 2459 8117
Log(size) 5653 7985 1565 6925 7808 9002
Book-to-market 5653 0445 0287 0251 0388 0578
Leverage 5653 0202 0172 0038 0187 0309
Asset tangibility 5653 0806 0184 0691 0853 0965
Free cash flow 5653 0059 0091 0013 0059 0108
Cash holding 5653 0166 0172 0034 0100 0247
ROA volatility 5653 0056 0056 0021 0038 0070
Institutional ownership 5653 0753 0202 0639 0795 0910
Sales growth 5653 0121 0189 0028 0096 0183
Past stock return 5653 0094 0183 -0012 0094 0199
Loss indicator 5653 0164 0370 0000 0000 0000
This table presents summary statistics Panel A shows the descriptive statistics of payout variables compensation
variables and other firm characteristics for the full sample Accounting impact is the implied option expense
measured at fiscal year 2002 All other variables are measured at firm-year level from fiscal year 2003 to 2007
resulting in 5653 firm-year observations (except for Regular dividendTotal Payout which can be measured only
for the 4901 firm-year observations with Total payout greater than zero) Panel B shows the pairwise correlations
between main variables at firm-year level Panel C compares payout variables compensation variables and other
firm characteristics before and after FAS123R The Pre-FAS123R period consists of fiscal year 2003 and 2004
the Post-FAS123R period covers fiscal year 2005-2007 Panel D compares the trends of payout and compensation
variables around FAS123R across four quartile groups ranked by 2002 accounting impact Panel E compares the
trends of payout and compensation variables around FAS123R between the treated and control group under the
alternative treatment definition in Bakke et al (2015) (see Section 22) All variables are defined in Appendix The
notation and in Panel C indicates statistically significant at 10 5 and 1 level in T-tests for equal
means respectively
43
Pa
nel
B
Pea
rso
n c
orr
ela
tio
ns
Reg div
Repurchase
Total payout
Salary_
Bonus_
Option_
RS_
Log(size)
BM
Leverage
Tangibility
FCF
Cash holdingROA vol
Inst own
Sales growth
Past ret
urn
Loss
Reg
div
10
0
Repurc
hase
01
610
0
Tota
l payout
03
509
810
0
Sala
ry_
-0
10
-01
8-0
19
10
0
Bonus_
00
700
100
3-0
01
10
0
Option_
-0
10
00
900
6-0
41
-03
510
0
RS
_
01
000
901
0-0
32
-01
1-0
40
10
0
Log(s
ize)
03
101
802
3-0
56
01
101
202
210
0
BM
-02
1-0
28
-03
103
0-0
03
-02
000
0-0
33
10
0
Levera
ge
-00
1-0
08
-00
8-0
05
00
6-0
11
00
801
9-0
03
10
0
Tangib
ility
00
200
100
101
200
1-0
05
-00
6-0
12
-00
4-0
18
10
0
FC
F02
203
703
9-0
20
00
901
1-0
01
02
4-0
32
-02
1-0
16
10
0
Cash
hold
ing
-01
301
000
700
2-0
14
02
2-0
10
-02
3-0
16
-03
502
901
210
0
RO
A v
ol
-01
5-0
04
-00
700
4-0
11
01
9-0
11
-02
3-0
08
-01
101
2-0
02
03
910
0
Inst
ow
n
-00
901
401
1-0
17
00
200
701
200
7-0
01
00
3-0
08
01
4-0
06
-01
110
0
Sale
s gro
wth
-00
8-0
04
-00
6-0
15
00
501
0-0
02
00
7-0
16
-00
3-0
08
01
300
201
400
410
0
Past
retu
rn00
901
301
4-0
18
01
5-0
01
00
301
6-0
29
-01
000
102
7-0
14
-01
001
602
710
0
Loss
-02
0-0
19
-02
201
8-0
18
00
4-0
05
-02
601
901
300
6-0
41
01
702
3-0
16
-01
8-0
40
10
0
44
Panel C Firm characteristics - before and after FAS123R
Pre FAS 123R Post FAS 123R Difference
Payout variables
Regular dividendTotal assets 083 099 016
RepurchaseTotal assets 245 490 245
Total payoutTotal assets 328 589 261
Regular dividendTotal payout 3914 2790 -1124
Level of executive compensation (in $1000)
Salary_$ 426 463 37
Bonus_$ 418 505 87
Option grant_$ 896 707 -191
Restricted stock grant_$ 269 574 305
Total pay_$ 2263 2584 321
Percentage of executive compensation
Salary_ 305 293 -12
Bonus_ 186 204 18
Option grant_ 343 240 -103
Restricted stock grant_ 87 176 89
Control variables
Size ($M) 9671 11631 1960
Log(size) 7860 8035 0175
Book-to-market 0437 0453 0016
Leverage 0201 0203 0002
Asset tangibility 0822 0793 -0029
Free cash flow 0061 0057 -0004
Cash holding 0175 0159 -0016
ROA volatility 0067 0048 -0019
Institutional ownership 0712 0781 0069
Sales growth 0137 0108 -0029
Past stock return 0080 0101 0021
Loss indicator 0173 0159 -0014
45
Pa
nel
D
Fir
m c
ha
racte
rist
ics
by q
ua
rtil
e o
f a
cco
un
tin
g i
mp
act
- b
efo
re a
nd
aft
er
FA
S1
23
R
Accounting im
pact
(2002)
Num
ber
of
Fir
ms
Pre
Post
Pre
Post
Pre
Post
Pre
Post
Payout
vari
able
s
Regula
r div
idendT
ota
l ass
ets
11
2
12
4
09
4
11
1
09
5
11
3
03
0
04
9
Repurc
hase
Tota
l ass
ets
11
3
26
8
19
2
37
3
32
7
63
1
35
1
68
7
Tota
l payout
Tota
l ass
ets
22
4
39
1
28
5
48
4
42
2
74
4
38
1
73
6
Regula
r div
idendT
ota
l payout
643
7
469
8
474
0
341
1
284
5
195
4
82
5
74
5
Perc
enta
ge o
f executive c
om
pensa
tion
Sala
ry_
337
295
313
287
296
289
276
300
Bonus_
223
226
214
228
172
192
134
169
Option g
rant_
201
167
290
210
373
260
507
325
Rest
ricte
d s
tock g
rant_
116
194
98
180
89
176
43
155
294
294
294
294
1st Q
uart
ile2
nd Q
uart
ile3
rd Q
uart
ile4
th Q
uart
ile
01
2
03
5
09
3
55
1
46
Accounting impact
Number of Firms
By accounting impact quartile
1
2
3
4
Pre Post Pre Post
Payout variables
Regular dividendTotal assets 09 11 08 10
RepurchaseTotal assets 18 31 26 52
Total payoutTotal assets 28 43 34 62
Regular dividendTotal payout 428 357 386 265
Percentage of executive compensation
Salary_ 435 364 282 280
Bonus_ 226 214 179 202
Option grant_ 92 125 387 261
Restricted stock grant_ 125 188 80 174
Percentage of CEO compensation
Salary_(CEO) 485 364 260 259
Bonus_(CEO) 249 228 185 219
Option grant_(CEO) 10 127 406 275
Restricted stock grant_(CEO) 128 182 82 183
Panel E Firm characteristics by alternative treatment definition - before and
after FAS123R
Treated
25
19
997
223
250
256
268
10
177
71
Control
44
37
47
Table 2
Differential effect of FAS123R on the use of option-based compensation
Panel A Two-period first-difference regression
Prediction Coeff t-stat Coeff t-stat Coeff t-stat
Accounting impact rank - -0044 -628
Accounting impact rank=2 - -0044 -327
Accounting impact rank=3 - -0075 -468
Accounting impact rank=4 - -0140 -613
Treated - -0132 -875
ΔLog(size) 0061 202 0061 200 0063 214
ΔBook-to-market 0032 091 0032 092 0051 143
ΔLeverage -0157 -213 -0160 -218 -0111 -153
ΔAsset tangibility -0012 -014 -0020 -023 -0023 -026
ΔFree cash flow -0106 -095 -0108 -097 -0128 -117
ΔCash holding -0197 -211 -0193 -206 -0180 -194
ΔFive-year ROA volatility -0065 -031 -0056 -026 -0098 -047
ΔInstitutional ownership -0044 -091 -0043 -088 -0044 -092
ΔSales growth -0064 -102 -0065 -104 -0090 -153
ΔPast one-year stock return 0051 078 0052 080 0091 138
ΔLoss frequency 0056 207 0057 207 0047 179
Log(size) -0009 -210 -0009 -207 -0002 -035
Book-to-market -0015 -056 -0013 -049 0018 072
Leverage 0022 046 0023 048 0068 150
Asset tangibility 0033 077 0033 078 0053 128
Free cash flow 0227 202 0220 195 0127 117
Cash holding -0002 -004 0012 019 -0078 -141
Five-year ROA volatility -0451 -240 -0430 -228 -0509 -283
Institutional ownership -0123 -360 -0122 -359 -0100 -292
Sales growth -0041 -056 -0040 -055 -0089 -125
Past one-year stock return -0009 -015 -0006 -010 0078 125
Loss frequency 0055 174 0056 178 0054 173
Fixed effect
Standard error
Adj R-squared
Observations
Model (3)
Dependent variable ΔAvg Option grantTotal pay
Huber-White
0156
This table investigates whether the effect of FAS123R on the use of option-based pay varies with its potential accounting impact Panel A
reports the results of estimating three two-period first-differencing models where for each firm we average its characteristics in Pre- and
Post-FAS123R period The Pre-FAS123R period consists of fiscal year 2003 and 2004 the Post-FAS123R period covers fiscal year 2005-
2007 In all three specifications the dependent variable is the change of average Option grantTotal pay from Pre- to Post-FAS123R period
The main independent variable varies by model in Model (1) the Accounting impact rank is the quartile rank of implied option expensetotal
assets measured in 2002 (1=lowest 4=highest) In Model (2) Accounting impact rank=2 (3 4) is an indicator that takes value of one if the
firmrsquos Accounting impact rank equals 2 (3 4) In Model (3) we use an alternative treatment construction following Bakke et al (2015)
where Treated is an indicator that takes value of zero if the firm granted zero option to its CEO in both 2003 and 2004 or the firm began to
voluntarily expense option-based pay at fair value in 2002 or earlier and one otherwise For each control variable we include both its level in
the Pre-FAS123R period and its change across the two periods Panel B shows the results of estimating fixed effect models with firm-year
observations The dependent variable is the firm-year level Option grantTotal pay The main independent variables are the interactions of
Post-FAS123R indicator (Post) with Accounting Impact rank Accounting impact rank indicators and Treated respectively All models in
Penal A have industry fixed effects and the standard errors are Huber-White heteroscedasticity-consistent standard errors All models in
Penal B have firm fixed effects and year fixed effects and the standard errors are clustered at firm level All variables are defined in
Appendix The notation and indicates statistically significant at 10 5 and 1 level respectively
Model (1) Model (2)
11711171 1171
Industry Industry
Huber-White
0124
Huber-White
0123
Industry
48
Panel B Panel fixed effects regression
Prediction Coeff t-stat Coeff t-stat Coeff t-stat
Acc impact rank x Post - -0044 -807
Acc impact rank 2 x Post - -0046 -333
Acc impact rank 3 x Post - -0077 -526
Acc impact rank 4 x Post - -0137 -776
Treated x Post - -0145 -970
Log(size) 0034 221 0034 217 0036 229
Book-to-market 0018 084 0017 083 0015 070
Leverage -0004 -009 -0006 -013 -0007 -015
Asset tangibility 0007 012 0004 006 0011 018
Free cash flow -0074 -151 -0072 -146 -0078 -158
Cash holding -0048 -086 -0050 -090 -0006 -011
Five-year ROA volatility 0250 231 0239 219 0437 414
Institutional ownership 0043 159 0044 161 0041 150
Sales growth -0033 -168 -0034 -171 -0031 -158
Past one-year stock return 0067 221 0068 224 0063 204
Loss indicator 0023 209 0022 207 0024 222
Fixed effects
Standard error
Adj R-squared
Observations
Dependent variable Option grantTotal pay
5653 5653 5653
Clustered by firm
Firm Year
Clustered by firm
Firm Year
Clustered by firm
0523 0523 0526
Model (1) Model (2) Model (3)
Firm Year
49
Table 3
Effect of option-based compensation on dividend policy
Panel A Two-period first-difference regression
Prediction Coeff t-stat Coeff t-stat Coeff t-stat
Accounting impact rank + 0000 077
Accounting impact rank=2 + 0001 091
Accounting impact rank=3 + 0000 044
Accounting impact rank=4 + 0001 092
Treated + 0000 -026
ΔLog(size) 0000 -030 0000 -030 0000 -026
ΔBook-to-market -0002 -190 -0002 -193 -0002 -195
ΔLeverage -0002 -059 -0002 -057 -0002 -059
ΔAsset tangibility 0016 431 0016 429 0016 430
ΔFree cash flow 0017 373 0017 373 0017 375
ΔCash holding -0011 -288 -0011 -285 -0010 -282
ΔFive-year ROA volatility 0003 034 0002 032 0003 035
ΔInstitutional ownership -0002 -073 -0002 -073 -0002 -070
ΔSales growth -0001 -040 -0001 -037 -0001 -038
ΔPast one-year stock return 0002 077 0002 076 0002 070
ΔLoss frequency 0000 -048 0000 -045 0000 -046
Log(size) 0000 183 0000 182 0000 182
Book-to-market -0002 -227 -0002 -225 -0002 -284
Leverage -0001 -037 -0001 -039 -0001 -048
Asset tangibility 0003 179 0003 180 0003 176
Free cash flow 0017 291 0017 291 0017 300
Cash holding 0002 080 0002 077 0002 098
Five-year ROA volatility 0003 035 0002 033 0003 044
Institutional ownership -0001 -068 -0001 -068 -0001 -058
Sales growth -0004 -177 -0004 -175 -0004 -172
Past one-year stock return 0004 169 0004 167 0004 165
Loss frequency -0001 -111 -0001 -109 -0001 -102
Fixed effect
Standard error
Adj R-squared
Observations
Dependent variable ΔAvg Regular dividendTotal assets
This table investigates the causal effect of option-based pay on dividend policy by examining whether changes in dividend policy around
FAS123R vary with its potential accounting impact Panel A reports the results of estimating three two-period first-differencing models
where for each firm we average its characteristics in Pre- and Post-FAS123R period In all three specifications the dependent variable is
the change of average Regular dividendTotal assets from Pre- to Post-FAS123R period The main independent variable varies by model in
Model (1) the Accounting impact rank is the quartile rank of implied option expensetotal assets measured in 2002 (1=lowest 4=highest) In
Model (2) Accounting impact rank=2 (3 4) is an indicator that takes value of one if the firmrsquos Accounting impact rank equals 2 (3 4) In
Model (3) we use an alternative treatment construction following Bakke et al (2015) where Treated is an indicator that takes value of zero
if the firm granted zero option to its CEO in both 2003 and 2004 or the firm began to voluntarily expense option-based pay at fair value in
2002 or earlier and one otherwise For each control variable we include both its level in the Pre-FAS123R period and its change across the
two periods Panel B shows the results of estimating fixed effect models with firm-year observations The dependent variable is the firm-
year level Regular dividendTotal assets The main independent variables are the interactions of Post-FAS123R indicator (Post) with
Accounting Impact rank Accounting impact rank indicators and Treated respectively Panel C examines the intensity of dividend changes
among firms with nonzero dividend per share in 2003 or 2004 In particular we estimates the same three models as in Panel A(with the
same independent variables) but for five dependent variables the change of average Regular dividendTotal assets from Pre- to Post-
FAS123R period (as in Panel A) the percentage change of DPS (dividend per share) from Pre- to Post-FAS123R period and three
indicators denoting respectively whether the percentage change of DPS was greater than 20 40 and 60 Panel D reports four
robustness tests of the dividend intensity regression In each of them a set of possible confounding observations is removed (see Section 33
for details) Panel E compares the trends of dividend initiation and termination around FAS123R across four quartile groups ranked by
accounting impact All models in Panel A C and D have industry fixed effects and the standard errors are Huber-White heteroscedasticity-
consistent standard errors All models in Penal B have firm fixed effects and year fixed effects and the standard errors are clustered at
firm level All variables are defined in Appendix The notation and indicates statistically significant at 10 5 and 1 level
Industry Industry Industry
Model (1) Model (2) Model (3)
1171 1171 1171
Huber-White Huber-White Huber-White
0105 0104 0105
50
Panel B Panel fixed effects regression
Prediction Coeff t-stat Coeff t-stat Coeff t-stat
Acc impact rank x Post + 0000 122
Acc impact rank 2 x Post + 0001 110
Acc impact rank 3 x Post + 0001 094
Acc impact rank 4 x Post + 0001 129
Treated x Post + 0000 -012
Log(size) 0001 179 0001 179 0001 181
Book-to-market 0000 025 0000 024 0000 031
Leverage 0001 062 0001 064 0001 069
Asset tangibility 0009 360 0009 358 0009 363
Free cash flow 0002 090 0002 093 0002 092
Cash holding -0007 -295 -0007 -298 -0007 -298
Five-year ROA volatility 0001 041 0001 038 0000 -006
Institutional ownership 0000 -027 0000 -026 0000 -027
Sales growth 0000 053 0000 051 0000 044
Past one-year stock return 0001 089 0001 088 0001 078
Loss indicator 0000 -060 0000 -057 0000 -076
Fixed effects
Standard error
Adj R-squared
Observations
Dependent variable Regular dividendTotal assets
Model (1) Model (2) Model (3)
Firm Year Firm Year Firm Year
5653 5653 5653
Clustered by firm Clustered by firm Clustered by firm
0877 0877 0877
51
Panel C Intensity of dividend changes around FAS123R
Prediction Coeff t-stat Coeff t-stat Coeff t-stat
Accounting impact rank + 0000 065
Accounting impact rank=2 + 0000 048
Accounting impact rank=3 + 0000 026
Accounting impact rank=4 + 0002 080
Treated + 0001 063
Dependent var DPS pct change
Accounting impact rank + -0145 -072
Accounting impact rank=2 + 0018 006
Accounting impact rank=3 + -0177 -045
Accounting impact rank=4 + -0746 -100
Treated + -0407 -119
Accounting impact rank + 0029 095
Accounting impact rank=2 + 0040 074
Accounting impact rank=3 + 0092 139
Accounting impact rank=4 + 0008 007
Treated + -0007 -012
Accounting impact rank + 0024 076
Accounting impact rank=2 + 0047 088
Accounting impact rank=3 + 0079 114
Accounting impact rank=4 + -0003 -002
Treated + 0030 052
Accounting impact rank + 0030 098
Accounting impact rank=2 + 0078 155
Accounting impact rank=3 + 0085 130
Accounting impact rank=4 + 0014 012
Treated + -0006 -011
Control variables
Fixed effect
Standard error
Observations 572 572 572
Yes Yes Yes
Huber-White Huber-White Huber-White
Industry Industry Industry
Dependent var DPS pct
change gt60 indicator
Model (1) Model (2) Model (3)
Dependent var ΔAvg Regular
dividendAssets
Dependent var DPS pct
change gt20 indicator
Dependent var DPS pct
change gt40 indicator
52
Panel D Robustness tests for intensity of dividend changes around FAS123R
Prediction Coeff t-stat Coeff t-stat Coeff t-stat
Accounting impact rank + 0006 017
Accounting impact rank=2 + 0067 118
Accounting impact rank=3 + 0041 057
Accounting impact rank=4 + -0061 -049
Treated + 0022 035Observations
Accounting impact rank + 0009 027
Accounting impact rank=2 + 0058 106
Accounting impact rank=3 + 0032 043
Accounting impact rank=4 + -0032 -024
Treated + 0018 028
Observations
Accounting impact rank + 0030 089
Accounting impact rank=2 + 0039 071
Accounting impact rank=3 + 0122 168
Accounting impact rank=4 + -0063 -052
Treated + 0075 132
Observations
Accounting impact rank + 0008 023
Accounting impact rank=2 + 0023 042
Accounting impact rank=3 + 0048 064
Accounting impact rank=4 + -0042 -033
Treated + -0010 -016
Observations
Control variables
Fixed effect
Standard error
Exclude firms with stable
payout ratio from 2003 to 2004
506 506 506
Dependent variable DPS pct change gt40 indicator
Model (1) Model (2) Model (3)
Exclude voluntary expensers
519 519
Exclude firms in the top decile
of option reduction (02-04)
Exclude firms that accelerated
option vesting
504 504 504
517 517 517
519
Huber-White Huber-White Huber-White
Yes Yes Yes
Industry Industry Industry
53
Panel E Dividend initiation and termination rates around FAS123R
Pre FAS 123R
1 280 75 7 6 13 173
2 284 135 18 9 27 200
3 286 181 11 14 25 138
4 282 260 9 10 19 73
Total 1132 651 45 39 84 129
Post FAS 123R
1 275 63 4 4 8 127
2 280 116 9 9 18 155
3 276 152 9 3 12 79
4 263 223 5 1 6 27
Total 1094 554 27 17 44 79
Pre FAS 123R
1 280 205 2 0 2 10
2 284 149 7 1 8 54
3 286 105 0 0 0 00
4 282 22 0 0 0 00
Total 1132 481 9 1 10 21
Post FAS 123R
1 275 212 3 6 9 42
2 280 164 1 2 3 18
3 276 124 1 1 2 16
4 263 40 0 3 3 75
Total 1094 540 5 12 17 31
termination
in 2004
03-04
cumulative
03-04
cumulative
Quartile firms
with
dividend in
2004
termination
in 2005
termination
in 2006
05-06
cumulative
05-06
cumulative
Termination
Quartile firms
with
dividend in
2002
termination
in 2003
without
dividend in
2004
initiation in
2003
initiation in
2004
03-04
cumulative
03-04
cumulative firmsQuartile
firmsQuartile initiation in
2005
initiation in
2006
05-06
cumulative
05-06
cumulative
Initiation
without
dividend in
2002
54
Table 4
Effect of option-based compensation on repurchases
Panel A Two-period first-difference regression with total repurchase
Prediction Coeff t-stat Coeff t-stat Coeff t-stat
Accounting impact rank - 0002 122
Accounting impact rank=2 - 0002 071
Accounting impact rank=3 - 0005 123
Accounting impact rank=4 - 0007 102
Treated - 0014 365
Control variables
Fixed effect
Standard error
Adj R-squared
Observations
Panel B Two-period first-difference regression with net repurchase
Prediction Coeff t-stat Coeff t-stat Coeff t-stat
Accounting impact rank - 0003 166
Accounting impact rank=2 - 0002 051
Accounting impact rank=3 - 0006 165
Accounting impact rank=4 - 0009 137
Treated - 0010 300
Control variables
Fixed effect
Standard error
Adj R-squared
Observations
Panel C Two-period first-difference regression with repurchase adjusted for exercised options
Prediction Coeff t-stat Coeff t-stat Coeff t-stat
Accounting impact rank - 0001 056
Accounting impact rank=2 - 0002 062
Accounting impact rank=3 - 0007 172
Accounting impact rank=4 - -0001 -008
Treated - 0006 197
Control variables
Fixed effect
Standard error
Adj R-squared
Observations
Dependent variable ΔAvg RepurchaseTotal assets
This table investigates the causal effect of option-based pay on payout policy by examining whether the changes of repurchase around
FAS123R vary with its potential accounting impact Panel A reports the results of estimating three two-period first-differencing models
where for each firm we average its characteristics in Pre- and Post-FAS123R period In all three specifications the dependent variable is
the change of average RepurchaseTotal assets from Pre- to Post-FAS123R period The main independent variable varies by model in
Model (1) the Accounting impact rank is the quartile rank of implied option expensetotal assets measured in 2002 (1=lowest 4=highest)
In Model (2) Accounting impact rank=2 (3 4) is an indicator that takes value of one if the firmrsquos Accounting impact rank equals 2 (3 4)
In Model (3) we use an alternative treatment construction following Bakke et al (2015) where Treated is an indicator that takes value of
zero if the firm granted zero option to its CEO in both 2003 and 2004 or the firm began to voluntarily expense option-based pay at fair
value in 2002 or earlier and one otherwise Panel B reports the regressions with the change of Net repurchaseTotal assets as the
dependent variable and the same independent variable as in Panel A Panel C reports the regressions with the change of Adjusted
repurchaseTotal assets as the dependent variable and the same independent variable as in Panel A All models in Panel A B and C have
industry fixed effects and the standard errors are Huber-White heteroscedasticity-consistent standard errors All variables are defined in
Appendix The notation and indicates statistically significant at 10 5 and 1 level respectively
Model (1) Model (2) Model (3)
Yes Yes Yes
Industry Industry Industry
Huber-White Huber-White Huber-White
Dependent variable ΔAvg Net repurchaseTotal assets
1171 1171 1171
0238 0237 0245
Model (1) Model (2) Model (3)
Yes Yes Yes
Industry Industry Industry
Huber-White Huber-White Huber-White
Dependent variable ΔAvg Adjusted repurchaseTotal assets
0229 0229 0233
1171 1171 1171
Model (1) Model (2) Model (3)
Yes Yes Yes
Industry Industry Industry
Huber-White Huber-White Huber-White
0111 0112 0114
1168 1168 1168
55
Table 5
Effect of option-based compensation on payout mix
Panel A Two-period first-difference regression with total payout mix
Prediction Coeff t-stat Coeff t-stat Coeff t-stat
Accounting impact rank + 0006 028
Accounting impact rank=2 + 0018 045
Accounting impact rank=3 + -0001 -001
Accounting impact rank=4 + 0043 052
Treated + -0035 -094
Control variables
Fixed effect
Standard error
Adj R-squared
Observations
Panel B Two-period first-difference regression with net payout mix
Prediction Coeff t-stat Coeff t-stat Coeff t-stat
Accounting impact rank + -0002 -008
Accounting impact rank=2 + 0008 016
Accounting impact rank=3 + 0018 034
Accounting impact rank=4 + -0059 -055
Treated + -0050 -101
Control variables
Fixed effect
Standard error
Adj R-squared
Observations
0049 0043 0054
257 257 257
Industry Industry Industry
Huber-White Huber-White Huber-White
Dependent variable ΔAvg Regular dividendNet payout
Model (1) Model (2) Model (3)
Yes Yes Yes
0154 0151 0156
362 362 362
Industry Industry Industry
Huber-White Huber-White Huber-White
This table investigates the causal effect of option-based pay on payout mix for firms using both dividend and repurchase by examining
whether the changes of payout mix around FAS123R vary with its potential accounting impact Panel A reports the results of estimating
three two-period first-differencing models where for each firm we average its characteristics in Pre- and Post-FAS123R period In all three
specifications the dependent variable is the change of average Regular dividendTotal payout from Pre- to Post-FAS123R period The main
independent variable varies by model in Model (1) the Accounting impact rank is the quartile rank of implied option expensetotal assets
measured in 2002 (1=lowest 4=highest) In Model (2) Accounting impact rank=2 (3 4) is an indicator that takes value of one if the firmrsquos
Accounting impact rank equals 2 (3 4) In Model (3) we use an alternative treatment construction following Bakke et al (2015) where
Treated is an indicator that takes value of zero if the firm granted zero option to its CEO in both 2003 and 2004 or the firm began to
voluntarily expense option-based pay at fair value in 2002 or earlier and one otherwise Panel B reports the regressions with the change of
Regular dividendNet payout as the dependent variable and the same independent variables as in Panel A Panel A (Panel B) is based on
observations with nonzero regular dividend and repurchase (net repurchase) in both Pre- and Post-FAS123R period All models in Panel A
and B have industry fixed effects and the standard errors are Huber-White heteroscedasticity-consistent standard errors All variables are
defined in Appendix The notation and indicates statistically significant at 10 5 and 1 level respectively
Yes Yes Yes
Dependent variable ΔAvg Regular dividendTotal payout
Model (1) Model (2) Model (3)
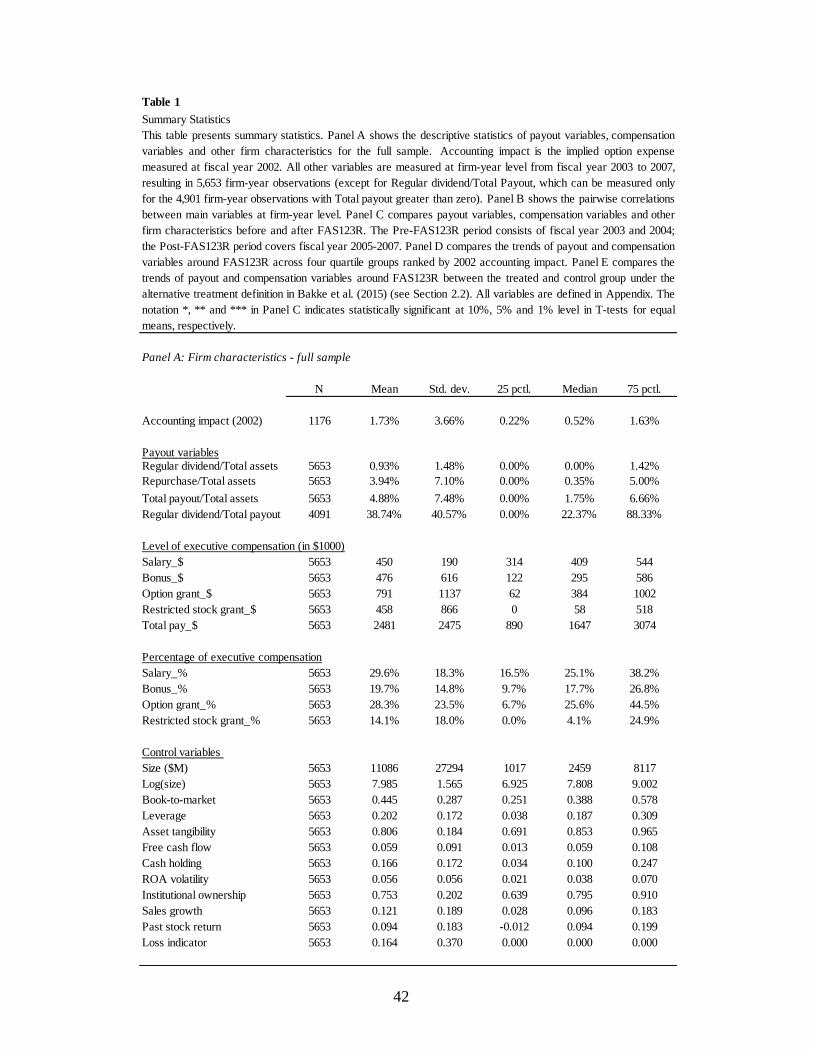
42
Table 1
Summary Statistics
Panel A Firm characteristics - full sample
N Mean Std dev 25 pctl Median 75 pctl
Accounting impact (2002) 1176 173 366 022 052 163
Payout variablesRegular dividendTotal assets 5653 093 148 000 000 142
RepurchaseTotal assets 5653 394 710 000 035 500
Total payoutTotal assets 5653 488 748 000 175 666
Regular dividendTotal payout 4091 3874 4057 000 2237 8833
Level of executive compensation (in $1000)
Salary_$ 5653 450 190 314 409 544
Bonus_$ 5653 476 616 122 295 586
Option grant_$ 5653 791 1137 62 384 1002
Restricted stock grant_$ 5653 458 866 0 58 518
Total pay_$ 5653 2481 2475 890 1647 3074
Percentage of executive compensation
Salary_ 5653 296 183 165 251 382
Bonus_ 5653 197 148 97 177 268
Option grant_ 5653 283 235 67 256 445
Restricted stock grant_ 5653 141 180 00 41 249
Control variables
Size ($M) 5653 11086 27294 1017 2459 8117
Log(size) 5653 7985 1565 6925 7808 9002
Book-to-market 5653 0445 0287 0251 0388 0578
Leverage 5653 0202 0172 0038 0187 0309
Asset tangibility 5653 0806 0184 0691 0853 0965
Free cash flow 5653 0059 0091 0013 0059 0108
Cash holding 5653 0166 0172 0034 0100 0247
ROA volatility 5653 0056 0056 0021 0038 0070
Institutional ownership 5653 0753 0202 0639 0795 0910
Sales growth 5653 0121 0189 0028 0096 0183
Past stock return 5653 0094 0183 -0012 0094 0199
Loss indicator 5653 0164 0370 0000 0000 0000
This table presents summary statistics Panel A shows the descriptive statistics of payout variables compensation
variables and other firm characteristics for the full sample Accounting impact is the implied option expense
measured at fiscal year 2002 All other variables are measured at firm-year level from fiscal year 2003 to 2007
resulting in 5653 firm-year observations (except for Regular dividendTotal Payout which can be measured only
for the 4901 firm-year observations with Total payout greater than zero) Panel B shows the pairwise correlations
between main variables at firm-year level Panel C compares payout variables compensation variables and other
firm characteristics before and after FAS123R The Pre-FAS123R period consists of fiscal year 2003 and 2004
the Post-FAS123R period covers fiscal year 2005-2007 Panel D compares the trends of payout and compensation
variables around FAS123R across four quartile groups ranked by 2002 accounting impact Panel E compares the
trends of payout and compensation variables around FAS123R between the treated and control group under the
alternative treatment definition in Bakke et al (2015) (see Section 22) All variables are defined in Appendix The
notation and in Panel C indicates statistically significant at 10 5 and 1 level in T-tests for equal
means respectively
43
Pa
nel
B
Pea
rso
n c
orr
ela
tio
ns
Reg div
Repurchase
Total payout
Salary_
Bonus_
Option_
RS_
Log(size)
BM
Leverage
Tangibility
FCF
Cash holdingROA vol
Inst own
Sales growth
Past ret
urn
Loss
Reg
div
10
0
Repurc
hase
01
610
0
Tota
l payout
03
509
810
0
Sala
ry_
-0
10
-01
8-0
19
10
0
Bonus_
00
700
100
3-0
01
10
0
Option_
-0
10
00
900
6-0
41
-03
510
0
RS
_
01
000
901
0-0
32
-01
1-0
40
10
0
Log(s
ize)
03
101
802
3-0
56
01
101
202
210
0
BM
-02
1-0
28
-03
103
0-0
03
-02
000
0-0
33
10
0
Levera
ge
-00
1-0
08
-00
8-0
05
00
6-0
11
00
801
9-0
03
10
0
Tangib
ility
00
200
100
101
200
1-0
05
-00
6-0
12
-00
4-0
18
10
0
FC
F02
203
703
9-0
20
00
901
1-0
01
02
4-0
32
-02
1-0
16
10
0
Cash
hold
ing
-01
301
000
700
2-0
14
02
2-0
10
-02
3-0
16
-03
502
901
210
0
RO
A v
ol
-01
5-0
04
-00
700
4-0
11
01
9-0
11
-02
3-0
08
-01
101
2-0
02
03
910
0
Inst
ow
n
-00
901
401
1-0
17
00
200
701
200
7-0
01
00
3-0
08
01
4-0
06
-01
110
0
Sale
s gro
wth
-00
8-0
04
-00
6-0
15
00
501
0-0
02
00
7-0
16
-00
3-0
08
01
300
201
400
410
0
Past
retu
rn00
901
301
4-0
18
01
5-0
01
00
301
6-0
29
-01
000
102
7-0
14
-01
001
602
710
0
Loss
-02
0-0
19
-02
201
8-0
18
00
4-0
05
-02
601
901
300
6-0
41
01
702
3-0
16
-01
8-0
40
10
0
44
Panel C Firm characteristics - before and after FAS123R
Pre FAS 123R Post FAS 123R Difference
Payout variables
Regular dividendTotal assets 083 099 016
RepurchaseTotal assets 245 490 245
Total payoutTotal assets 328 589 261
Regular dividendTotal payout 3914 2790 -1124
Level of executive compensation (in $1000)
Salary_$ 426 463 37
Bonus_$ 418 505 87
Option grant_$ 896 707 -191
Restricted stock grant_$ 269 574 305
Total pay_$ 2263 2584 321
Percentage of executive compensation
Salary_ 305 293 -12
Bonus_ 186 204 18
Option grant_ 343 240 -103
Restricted stock grant_ 87 176 89
Control variables
Size ($M) 9671 11631 1960
Log(size) 7860 8035 0175
Book-to-market 0437 0453 0016
Leverage 0201 0203 0002
Asset tangibility 0822 0793 -0029
Free cash flow 0061 0057 -0004
Cash holding 0175 0159 -0016
ROA volatility 0067 0048 -0019
Institutional ownership 0712 0781 0069
Sales growth 0137 0108 -0029
Past stock return 0080 0101 0021
Loss indicator 0173 0159 -0014
45
Pa
nel
D
Fir
m c
ha
racte
rist
ics
by q
ua
rtil
e o
f a
cco
un
tin
g i
mp
act
- b
efo
re a
nd
aft
er
FA
S1
23
R
Accounting im
pact
(2002)
Num
ber
of
Fir
ms
Pre
Post
Pre
Post
Pre
Post
Pre
Post
Payout
vari
able
s
Regula
r div
idendT
ota
l ass
ets
11
2
12
4
09
4
11
1
09
5
11
3
03
0
04
9
Repurc
hase
Tota
l ass
ets
11
3
26
8
19
2
37
3
32
7
63
1
35
1
68
7
Tota
l payout
Tota
l ass
ets
22
4
39
1
28
5
48
4
42
2
74
4
38
1
73
6
Regula
r div
idendT
ota
l payout
643
7
469
8
474
0
341
1
284
5
195
4
82
5
74
5
Perc
enta
ge o
f executive c
om
pensa
tion
Sala
ry_
337
295
313
287
296
289
276
300
Bonus_
223
226
214
228
172
192
134
169
Option g
rant_
201
167
290
210
373
260
507
325
Rest
ricte
d s
tock g
rant_
116
194
98
180
89
176
43
155
294
294
294
294
1st Q
uart
ile2
nd Q
uart
ile3
rd Q
uart
ile4
th Q
uart
ile
01
2
03
5
09
3
55
1
46
Accounting impact
Number of Firms
By accounting impact quartile
1
2
3
4
Pre Post Pre Post
Payout variables
Regular dividendTotal assets 09 11 08 10
RepurchaseTotal assets 18 31 26 52
Total payoutTotal assets 28 43 34 62
Regular dividendTotal payout 428 357 386 265
Percentage of executive compensation
Salary_ 435 364 282 280
Bonus_ 226 214 179 202
Option grant_ 92 125 387 261
Restricted stock grant_ 125 188 80 174
Percentage of CEO compensation
Salary_(CEO) 485 364 260 259
Bonus_(CEO) 249 228 185 219
Option grant_(CEO) 10 127 406 275
Restricted stock grant_(CEO) 128 182 82 183
Panel E Firm characteristics by alternative treatment definition - before and
after FAS123R
Treated
25
19
997
223
250
256
268
10
177
71
Control
44
37
47
Table 2
Differential effect of FAS123R on the use of option-based compensation
Panel A Two-period first-difference regression
Prediction Coeff t-stat Coeff t-stat Coeff t-stat
Accounting impact rank - -0044 -628
Accounting impact rank=2 - -0044 -327
Accounting impact rank=3 - -0075 -468
Accounting impact rank=4 - -0140 -613
Treated - -0132 -875
ΔLog(size) 0061 202 0061 200 0063 214
ΔBook-to-market 0032 091 0032 092 0051 143
ΔLeverage -0157 -213 -0160 -218 -0111 -153
ΔAsset tangibility -0012 -014 -0020 -023 -0023 -026
ΔFree cash flow -0106 -095 -0108 -097 -0128 -117
ΔCash holding -0197 -211 -0193 -206 -0180 -194
ΔFive-year ROA volatility -0065 -031 -0056 -026 -0098 -047
ΔInstitutional ownership -0044 -091 -0043 -088 -0044 -092
ΔSales growth -0064 -102 -0065 -104 -0090 -153
ΔPast one-year stock return 0051 078 0052 080 0091 138
ΔLoss frequency 0056 207 0057 207 0047 179
Log(size) -0009 -210 -0009 -207 -0002 -035
Book-to-market -0015 -056 -0013 -049 0018 072
Leverage 0022 046 0023 048 0068 150
Asset tangibility 0033 077 0033 078 0053 128
Free cash flow 0227 202 0220 195 0127 117
Cash holding -0002 -004 0012 019 -0078 -141
Five-year ROA volatility -0451 -240 -0430 -228 -0509 -283
Institutional ownership -0123 -360 -0122 -359 -0100 -292
Sales growth -0041 -056 -0040 -055 -0089 -125
Past one-year stock return -0009 -015 -0006 -010 0078 125
Loss frequency 0055 174 0056 178 0054 173
Fixed effect
Standard error
Adj R-squared
Observations
Model (3)
Dependent variable ΔAvg Option grantTotal pay
Huber-White
0156
This table investigates whether the effect of FAS123R on the use of option-based pay varies with its potential accounting impact Panel A
reports the results of estimating three two-period first-differencing models where for each firm we average its characteristics in Pre- and
Post-FAS123R period The Pre-FAS123R period consists of fiscal year 2003 and 2004 the Post-FAS123R period covers fiscal year 2005-
2007 In all three specifications the dependent variable is the change of average Option grantTotal pay from Pre- to Post-FAS123R period
The main independent variable varies by model in Model (1) the Accounting impact rank is the quartile rank of implied option expensetotal
assets measured in 2002 (1=lowest 4=highest) In Model (2) Accounting impact rank=2 (3 4) is an indicator that takes value of one if the
firmrsquos Accounting impact rank equals 2 (3 4) In Model (3) we use an alternative treatment construction following Bakke et al (2015)
where Treated is an indicator that takes value of zero if the firm granted zero option to its CEO in both 2003 and 2004 or the firm began to
voluntarily expense option-based pay at fair value in 2002 or earlier and one otherwise For each control variable we include both its level in
the Pre-FAS123R period and its change across the two periods Panel B shows the results of estimating fixed effect models with firm-year
observations The dependent variable is the firm-year level Option grantTotal pay The main independent variables are the interactions of
Post-FAS123R indicator (Post) with Accounting Impact rank Accounting impact rank indicators and Treated respectively All models in
Penal A have industry fixed effects and the standard errors are Huber-White heteroscedasticity-consistent standard errors All models in
Penal B have firm fixed effects and year fixed effects and the standard errors are clustered at firm level All variables are defined in
Appendix The notation and indicates statistically significant at 10 5 and 1 level respectively
Model (1) Model (2)
11711171 1171
Industry Industry
Huber-White
0124
Huber-White
0123
Industry
48
Panel B Panel fixed effects regression
Prediction Coeff t-stat Coeff t-stat Coeff t-stat
Acc impact rank x Post - -0044 -807
Acc impact rank 2 x Post - -0046 -333
Acc impact rank 3 x Post - -0077 -526
Acc impact rank 4 x Post - -0137 -776
Treated x Post - -0145 -970
Log(size) 0034 221 0034 217 0036 229
Book-to-market 0018 084 0017 083 0015 070
Leverage -0004 -009 -0006 -013 -0007 -015
Asset tangibility 0007 012 0004 006 0011 018
Free cash flow -0074 -151 -0072 -146 -0078 -158
Cash holding -0048 -086 -0050 -090 -0006 -011
Five-year ROA volatility 0250 231 0239 219 0437 414
Institutional ownership 0043 159 0044 161 0041 150
Sales growth -0033 -168 -0034 -171 -0031 -158
Past one-year stock return 0067 221 0068 224 0063 204
Loss indicator 0023 209 0022 207 0024 222
Fixed effects
Standard error
Adj R-squared
Observations
Dependent variable Option grantTotal pay
5653 5653 5653
Clustered by firm
Firm Year
Clustered by firm
Firm Year
Clustered by firm
0523 0523 0526
Model (1) Model (2) Model (3)
Firm Year
49
Table 3
Effect of option-based compensation on dividend policy
Panel A Two-period first-difference regression
Prediction Coeff t-stat Coeff t-stat Coeff t-stat
Accounting impact rank + 0000 077
Accounting impact rank=2 + 0001 091
Accounting impact rank=3 + 0000 044
Accounting impact rank=4 + 0001 092
Treated + 0000 -026
ΔLog(size) 0000 -030 0000 -030 0000 -026
ΔBook-to-market -0002 -190 -0002 -193 -0002 -195
ΔLeverage -0002 -059 -0002 -057 -0002 -059
ΔAsset tangibility 0016 431 0016 429 0016 430
ΔFree cash flow 0017 373 0017 373 0017 375
ΔCash holding -0011 -288 -0011 -285 -0010 -282
ΔFive-year ROA volatility 0003 034 0002 032 0003 035
ΔInstitutional ownership -0002 -073 -0002 -073 -0002 -070
ΔSales growth -0001 -040 -0001 -037 -0001 -038
ΔPast one-year stock return 0002 077 0002 076 0002 070
ΔLoss frequency 0000 -048 0000 -045 0000 -046
Log(size) 0000 183 0000 182 0000 182
Book-to-market -0002 -227 -0002 -225 -0002 -284
Leverage -0001 -037 -0001 -039 -0001 -048
Asset tangibility 0003 179 0003 180 0003 176
Free cash flow 0017 291 0017 291 0017 300
Cash holding 0002 080 0002 077 0002 098
Five-year ROA volatility 0003 035 0002 033 0003 044
Institutional ownership -0001 -068 -0001 -068 -0001 -058
Sales growth -0004 -177 -0004 -175 -0004 -172
Past one-year stock return 0004 169 0004 167 0004 165
Loss frequency -0001 -111 -0001 -109 -0001 -102
Fixed effect
Standard error
Adj R-squared
Observations
Dependent variable ΔAvg Regular dividendTotal assets
This table investigates the causal effect of option-based pay on dividend policy by examining whether changes in dividend policy around
FAS123R vary with its potential accounting impact Panel A reports the results of estimating three two-period first-differencing models
where for each firm we average its characteristics in Pre- and Post-FAS123R period In all three specifications the dependent variable is
the change of average Regular dividendTotal assets from Pre- to Post-FAS123R period The main independent variable varies by model in
Model (1) the Accounting impact rank is the quartile rank of implied option expensetotal assets measured in 2002 (1=lowest 4=highest) In
Model (2) Accounting impact rank=2 (3 4) is an indicator that takes value of one if the firmrsquos Accounting impact rank equals 2 (3 4) In
Model (3) we use an alternative treatment construction following Bakke et al (2015) where Treated is an indicator that takes value of zero
if the firm granted zero option to its CEO in both 2003 and 2004 or the firm began to voluntarily expense option-based pay at fair value in
2002 or earlier and one otherwise For each control variable we include both its level in the Pre-FAS123R period and its change across the
two periods Panel B shows the results of estimating fixed effect models with firm-year observations The dependent variable is the firm-
year level Regular dividendTotal assets The main independent variables are the interactions of Post-FAS123R indicator (Post) with
Accounting Impact rank Accounting impact rank indicators and Treated respectively Panel C examines the intensity of dividend changes
among firms with nonzero dividend per share in 2003 or 2004 In particular we estimates the same three models as in Panel A(with the
same independent variables) but for five dependent variables the change of average Regular dividendTotal assets from Pre- to Post-
FAS123R period (as in Panel A) the percentage change of DPS (dividend per share) from Pre- to Post-FAS123R period and three
indicators denoting respectively whether the percentage change of DPS was greater than 20 40 and 60 Panel D reports four
robustness tests of the dividend intensity regression In each of them a set of possible confounding observations is removed (see Section 33
for details) Panel E compares the trends of dividend initiation and termination around FAS123R across four quartile groups ranked by
accounting impact All models in Panel A C and D have industry fixed effects and the standard errors are Huber-White heteroscedasticity-
consistent standard errors All models in Penal B have firm fixed effects and year fixed effects and the standard errors are clustered at
firm level All variables are defined in Appendix The notation and indicates statistically significant at 10 5 and 1 level
Industry Industry Industry
Model (1) Model (2) Model (3)
1171 1171 1171
Huber-White Huber-White Huber-White
0105 0104 0105
50
Panel B Panel fixed effects regression
Prediction Coeff t-stat Coeff t-stat Coeff t-stat
Acc impact rank x Post + 0000 122
Acc impact rank 2 x Post + 0001 110
Acc impact rank 3 x Post + 0001 094
Acc impact rank 4 x Post + 0001 129
Treated x Post + 0000 -012
Log(size) 0001 179 0001 179 0001 181
Book-to-market 0000 025 0000 024 0000 031
Leverage 0001 062 0001 064 0001 069
Asset tangibility 0009 360 0009 358 0009 363
Free cash flow 0002 090 0002 093 0002 092
Cash holding -0007 -295 -0007 -298 -0007 -298
Five-year ROA volatility 0001 041 0001 038 0000 -006
Institutional ownership 0000 -027 0000 -026 0000 -027
Sales growth 0000 053 0000 051 0000 044
Past one-year stock return 0001 089 0001 088 0001 078
Loss indicator 0000 -060 0000 -057 0000 -076
Fixed effects
Standard error
Adj R-squared
Observations
Dependent variable Regular dividendTotal assets
Model (1) Model (2) Model (3)
Firm Year Firm Year Firm Year
5653 5653 5653
Clustered by firm Clustered by firm Clustered by firm
0877 0877 0877
51
Panel C Intensity of dividend changes around FAS123R
Prediction Coeff t-stat Coeff t-stat Coeff t-stat
Accounting impact rank + 0000 065
Accounting impact rank=2 + 0000 048
Accounting impact rank=3 + 0000 026
Accounting impact rank=4 + 0002 080
Treated + 0001 063
Dependent var DPS pct change
Accounting impact rank + -0145 -072
Accounting impact rank=2 + 0018 006
Accounting impact rank=3 + -0177 -045
Accounting impact rank=4 + -0746 -100
Treated + -0407 -119
Accounting impact rank + 0029 095
Accounting impact rank=2 + 0040 074
Accounting impact rank=3 + 0092 139
Accounting impact rank=4 + 0008 007
Treated + -0007 -012
Accounting impact rank + 0024 076
Accounting impact rank=2 + 0047 088
Accounting impact rank=3 + 0079 114
Accounting impact rank=4 + -0003 -002
Treated + 0030 052
Accounting impact rank + 0030 098
Accounting impact rank=2 + 0078 155
Accounting impact rank=3 + 0085 130
Accounting impact rank=4 + 0014 012
Treated + -0006 -011
Control variables
Fixed effect
Standard error
Observations 572 572 572
Yes Yes Yes
Huber-White Huber-White Huber-White
Industry Industry Industry
Dependent var DPS pct
change gt60 indicator
Model (1) Model (2) Model (3)
Dependent var ΔAvg Regular
dividendAssets
Dependent var DPS pct
change gt20 indicator
Dependent var DPS pct
change gt40 indicator
52
Panel D Robustness tests for intensity of dividend changes around FAS123R
Prediction Coeff t-stat Coeff t-stat Coeff t-stat
Accounting impact rank + 0006 017
Accounting impact rank=2 + 0067 118
Accounting impact rank=3 + 0041 057
Accounting impact rank=4 + -0061 -049
Treated + 0022 035Observations
Accounting impact rank + 0009 027
Accounting impact rank=2 + 0058 106
Accounting impact rank=3 + 0032 043
Accounting impact rank=4 + -0032 -024
Treated + 0018 028
Observations
Accounting impact rank + 0030 089
Accounting impact rank=2 + 0039 071
Accounting impact rank=3 + 0122 168
Accounting impact rank=4 + -0063 -052
Treated + 0075 132
Observations
Accounting impact rank + 0008 023
Accounting impact rank=2 + 0023 042
Accounting impact rank=3 + 0048 064
Accounting impact rank=4 + -0042 -033
Treated + -0010 -016
Observations
Control variables
Fixed effect
Standard error
Exclude firms with stable
payout ratio from 2003 to 2004
506 506 506
Dependent variable DPS pct change gt40 indicator
Model (1) Model (2) Model (3)
Exclude voluntary expensers
519 519
Exclude firms in the top decile
of option reduction (02-04)
Exclude firms that accelerated
option vesting
504 504 504
517 517 517
519
Huber-White Huber-White Huber-White
Yes Yes Yes
Industry Industry Industry
53
Panel E Dividend initiation and termination rates around FAS123R
Pre FAS 123R
1 280 75 7 6 13 173
2 284 135 18 9 27 200
3 286 181 11 14 25 138
4 282 260 9 10 19 73
Total 1132 651 45 39 84 129
Post FAS 123R
1 275 63 4 4 8 127
2 280 116 9 9 18 155
3 276 152 9 3 12 79
4 263 223 5 1 6 27
Total 1094 554 27 17 44 79
Pre FAS 123R
1 280 205 2 0 2 10
2 284 149 7 1 8 54
3 286 105 0 0 0 00
4 282 22 0 0 0 00
Total 1132 481 9 1 10 21
Post FAS 123R
1 275 212 3 6 9 42
2 280 164 1 2 3 18
3 276 124 1 1 2 16
4 263 40 0 3 3 75
Total 1094 540 5 12 17 31
termination
in 2004
03-04
cumulative
03-04
cumulative
Quartile firms
with
dividend in
2004
termination
in 2005
termination
in 2006
05-06
cumulative
05-06
cumulative
Termination
Quartile firms
with
dividend in
2002
termination
in 2003
without
dividend in
2004
initiation in
2003
initiation in
2004
03-04
cumulative
03-04
cumulative firmsQuartile
firmsQuartile initiation in
2005
initiation in
2006
05-06
cumulative
05-06
cumulative
Initiation
without
dividend in
2002
54
Table 4
Effect of option-based compensation on repurchases
Panel A Two-period first-difference regression with total repurchase
Prediction Coeff t-stat Coeff t-stat Coeff t-stat
Accounting impact rank - 0002 122
Accounting impact rank=2 - 0002 071
Accounting impact rank=3 - 0005 123
Accounting impact rank=4 - 0007 102
Treated - 0014 365
Control variables
Fixed effect
Standard error
Adj R-squared
Observations
Panel B Two-period first-difference regression with net repurchase
Prediction Coeff t-stat Coeff t-stat Coeff t-stat
Accounting impact rank - 0003 166
Accounting impact rank=2 - 0002 051
Accounting impact rank=3 - 0006 165
Accounting impact rank=4 - 0009 137
Treated - 0010 300
Control variables
Fixed effect
Standard error
Adj R-squared
Observations
Panel C Two-period first-difference regression with repurchase adjusted for exercised options
Prediction Coeff t-stat Coeff t-stat Coeff t-stat
Accounting impact rank - 0001 056
Accounting impact rank=2 - 0002 062
Accounting impact rank=3 - 0007 172
Accounting impact rank=4 - -0001 -008
Treated - 0006 197
Control variables
Fixed effect
Standard error
Adj R-squared
Observations
Dependent variable ΔAvg RepurchaseTotal assets
This table investigates the causal effect of option-based pay on payout policy by examining whether the changes of repurchase around
FAS123R vary with its potential accounting impact Panel A reports the results of estimating three two-period first-differencing models
where for each firm we average its characteristics in Pre- and Post-FAS123R period In all three specifications the dependent variable is
the change of average RepurchaseTotal assets from Pre- to Post-FAS123R period The main independent variable varies by model in
Model (1) the Accounting impact rank is the quartile rank of implied option expensetotal assets measured in 2002 (1=lowest 4=highest)
In Model (2) Accounting impact rank=2 (3 4) is an indicator that takes value of one if the firmrsquos Accounting impact rank equals 2 (3 4)
In Model (3) we use an alternative treatment construction following Bakke et al (2015) where Treated is an indicator that takes value of
zero if the firm granted zero option to its CEO in both 2003 and 2004 or the firm began to voluntarily expense option-based pay at fair
value in 2002 or earlier and one otherwise Panel B reports the regressions with the change of Net repurchaseTotal assets as the
dependent variable and the same independent variable as in Panel A Panel C reports the regressions with the change of Adjusted
repurchaseTotal assets as the dependent variable and the same independent variable as in Panel A All models in Panel A B and C have
industry fixed effects and the standard errors are Huber-White heteroscedasticity-consistent standard errors All variables are defined in
Appendix The notation and indicates statistically significant at 10 5 and 1 level respectively
Model (1) Model (2) Model (3)
Yes Yes Yes
Industry Industry Industry
Huber-White Huber-White Huber-White
Dependent variable ΔAvg Net repurchaseTotal assets
1171 1171 1171
0238 0237 0245
Model (1) Model (2) Model (3)
Yes Yes Yes
Industry Industry Industry
Huber-White Huber-White Huber-White
Dependent variable ΔAvg Adjusted repurchaseTotal assets
0229 0229 0233
1171 1171 1171
Model (1) Model (2) Model (3)
Yes Yes Yes
Industry Industry Industry
Huber-White Huber-White Huber-White
0111 0112 0114
1168 1168 1168
55
Table 5
Effect of option-based compensation on payout mix
Panel A Two-period first-difference regression with total payout mix
Prediction Coeff t-stat Coeff t-stat Coeff t-stat
Accounting impact rank + 0006 028
Accounting impact rank=2 + 0018 045
Accounting impact rank=3 + -0001 -001
Accounting impact rank=4 + 0043 052
Treated + -0035 -094
Control variables
Fixed effect
Standard error
Adj R-squared
Observations
Panel B Two-period first-difference regression with net payout mix
Prediction Coeff t-stat Coeff t-stat Coeff t-stat
Accounting impact rank + -0002 -008
Accounting impact rank=2 + 0008 016
Accounting impact rank=3 + 0018 034
Accounting impact rank=4 + -0059 -055
Treated + -0050 -101
Control variables
Fixed effect
Standard error
Adj R-squared
Observations
0049 0043 0054
257 257 257
Industry Industry Industry
Huber-White Huber-White Huber-White
Dependent variable ΔAvg Regular dividendNet payout
Model (1) Model (2) Model (3)
Yes Yes Yes
0154 0151 0156
362 362 362
Industry Industry Industry
Huber-White Huber-White Huber-White
This table investigates the causal effect of option-based pay on payout mix for firms using both dividend and repurchase by examining
whether the changes of payout mix around FAS123R vary with its potential accounting impact Panel A reports the results of estimating
three two-period first-differencing models where for each firm we average its characteristics in Pre- and Post-FAS123R period In all three
specifications the dependent variable is the change of average Regular dividendTotal payout from Pre- to Post-FAS123R period The main
independent variable varies by model in Model (1) the Accounting impact rank is the quartile rank of implied option expensetotal assets
measured in 2002 (1=lowest 4=highest) In Model (2) Accounting impact rank=2 (3 4) is an indicator that takes value of one if the firmrsquos
Accounting impact rank equals 2 (3 4) In Model (3) we use an alternative treatment construction following Bakke et al (2015) where
Treated is an indicator that takes value of zero if the firm granted zero option to its CEO in both 2003 and 2004 or the firm began to
voluntarily expense option-based pay at fair value in 2002 or earlier and one otherwise Panel B reports the regressions with the change of
Regular dividendNet payout as the dependent variable and the same independent variables as in Panel A Panel A (Panel B) is based on
observations with nonzero regular dividend and repurchase (net repurchase) in both Pre- and Post-FAS123R period All models in Panel A
and B have industry fixed effects and the standard errors are Huber-White heteroscedasticity-consistent standard errors All variables are
defined in Appendix The notation and indicates statistically significant at 10 5 and 1 level respectively
Yes Yes Yes
Dependent variable ΔAvg Regular dividendTotal payout
Model (1) Model (2) Model (3)

43
Pa
nel
B
Pea
rso
n c
orr
ela
tio
ns
Reg div
Repurchase
Total payout
Salary_
Bonus_
Option_
RS_
Log(size)
BM
Leverage
Tangibility
FCF
Cash holdingROA vol
Inst own
Sales growth
Past ret
urn
Loss
Reg
div
10
0
Repurc
hase
01
610
0
Tota
l payout
03
509
810
0
Sala
ry_
-0
10
-01
8-0
19
10
0
Bonus_
00
700
100
3-0
01
10
0
Option_
-0
10
00
900
6-0
41
-03
510
0
RS
_
01
000
901
0-0
32
-01
1-0
40
10
0
Log(s
ize)
03
101
802
3-0
56
01
101
202
210
0
BM
-02
1-0
28
-03
103
0-0
03
-02
000
0-0
33
10
0
Levera
ge
-00
1-0
08
-00
8-0
05
00
6-0
11
00
801
9-0
03
10
0
Tangib
ility
00
200
100
101
200
1-0
05
-00
6-0
12
-00
4-0
18
10
0
FC
F02
203
703
9-0
20
00
901
1-0
01
02
4-0
32
-02
1-0
16
10
0
Cash
hold
ing
-01
301
000
700
2-0
14
02
2-0
10
-02
3-0
16
-03
502
901
210
0
RO
A v
ol
-01
5-0
04
-00
700
4-0
11
01
9-0
11
-02
3-0
08
-01
101
2-0
02
03
910
0
Inst
ow
n
-00
901
401
1-0
17
00
200
701
200
7-0
01
00
3-0
08
01
4-0
06
-01
110
0
Sale
s gro
wth
-00
8-0
04
-00
6-0
15
00
501
0-0
02
00
7-0
16
-00
3-0
08
01
300
201
400
410
0
Past
retu
rn00
901
301
4-0
18
01
5-0
01
00
301
6-0
29
-01
000
102
7-0
14
-01
001
602
710
0
Loss
-02
0-0
19
-02
201
8-0
18
00
4-0
05
-02
601
901
300
6-0
41
01
702
3-0
16
-01
8-0
40
10
0
44
Panel C Firm characteristics - before and after FAS123R
Pre FAS 123R Post FAS 123R Difference
Payout variables
Regular dividendTotal assets 083 099 016
RepurchaseTotal assets 245 490 245
Total payoutTotal assets 328 589 261
Regular dividendTotal payout 3914 2790 -1124
Level of executive compensation (in $1000)
Salary_$ 426 463 37
Bonus_$ 418 505 87
Option grant_$ 896 707 -191
Restricted stock grant_$ 269 574 305
Total pay_$ 2263 2584 321
Percentage of executive compensation
Salary_ 305 293 -12
Bonus_ 186 204 18
Option grant_ 343 240 -103
Restricted stock grant_ 87 176 89
Control variables
Size ($M) 9671 11631 1960
Log(size) 7860 8035 0175
Book-to-market 0437 0453 0016
Leverage 0201 0203 0002
Asset tangibility 0822 0793 -0029
Free cash flow 0061 0057 -0004
Cash holding 0175 0159 -0016
ROA volatility 0067 0048 -0019
Institutional ownership 0712 0781 0069
Sales growth 0137 0108 -0029
Past stock return 0080 0101 0021
Loss indicator 0173 0159 -0014
45
Pa
nel
D
Fir
m c
ha
racte
rist
ics
by q
ua
rtil
e o
f a
cco
un
tin
g i
mp
act
- b
efo
re a
nd
aft
er
FA
S1
23
R
Accounting im
pact
(2002)
Num
ber
of
Fir
ms
Pre
Post
Pre
Post
Pre
Post
Pre
Post
Payout
vari
able
s
Regula
r div
idendT
ota
l ass
ets
11
2
12
4
09
4
11
1
09
5
11
3
03
0
04
9
Repurc
hase
Tota
l ass
ets
11
3
26
8
19
2
37
3
32
7
63
1
35
1
68
7
Tota
l payout
Tota
l ass
ets
22
4
39
1
28
5
48
4
42
2
74
4
38
1
73
6
Regula
r div
idendT
ota
l payout
643
7
469
8
474
0
341
1
284
5
195
4
82
5
74
5
Perc
enta
ge o
f executive c
om
pensa
tion
Sala
ry_
337
295
313
287
296
289
276
300
Bonus_
223
226
214
228
172
192
134
169
Option g
rant_
201
167
290
210
373
260
507
325
Rest
ricte
d s
tock g
rant_
116
194
98
180
89
176
43
155
294
294
294
294
1st Q
uart
ile2
nd Q
uart
ile3
rd Q
uart
ile4
th Q
uart
ile
01
2
03
5
09
3
55
1
46
Accounting impact
Number of Firms
By accounting impact quartile
1
2
3
4
Pre Post Pre Post
Payout variables
Regular dividendTotal assets 09 11 08 10
RepurchaseTotal assets 18 31 26 52
Total payoutTotal assets 28 43 34 62
Regular dividendTotal payout 428 357 386 265
Percentage of executive compensation
Salary_ 435 364 282 280
Bonus_ 226 214 179 202
Option grant_ 92 125 387 261
Restricted stock grant_ 125 188 80 174
Percentage of CEO compensation
Salary_(CEO) 485 364 260 259
Bonus_(CEO) 249 228 185 219
Option grant_(CEO) 10 127 406 275
Restricted stock grant_(CEO) 128 182 82 183
Panel E Firm characteristics by alternative treatment definition - before and
after FAS123R
Treated
25
19
997
223
250
256
268
10
177
71
Control
44
37
47
Table 2
Differential effect of FAS123R on the use of option-based compensation
Panel A Two-period first-difference regression
Prediction Coeff t-stat Coeff t-stat Coeff t-stat
Accounting impact rank - -0044 -628
Accounting impact rank=2 - -0044 -327
Accounting impact rank=3 - -0075 -468
Accounting impact rank=4 - -0140 -613
Treated - -0132 -875
ΔLog(size) 0061 202 0061 200 0063 214
ΔBook-to-market 0032 091 0032 092 0051 143
ΔLeverage -0157 -213 -0160 -218 -0111 -153
ΔAsset tangibility -0012 -014 -0020 -023 -0023 -026
ΔFree cash flow -0106 -095 -0108 -097 -0128 -117
ΔCash holding -0197 -211 -0193 -206 -0180 -194
ΔFive-year ROA volatility -0065 -031 -0056 -026 -0098 -047
ΔInstitutional ownership -0044 -091 -0043 -088 -0044 -092
ΔSales growth -0064 -102 -0065 -104 -0090 -153
ΔPast one-year stock return 0051 078 0052 080 0091 138
ΔLoss frequency 0056 207 0057 207 0047 179
Log(size) -0009 -210 -0009 -207 -0002 -035
Book-to-market -0015 -056 -0013 -049 0018 072
Leverage 0022 046 0023 048 0068 150
Asset tangibility 0033 077 0033 078 0053 128
Free cash flow 0227 202 0220 195 0127 117
Cash holding -0002 -004 0012 019 -0078 -141
Five-year ROA volatility -0451 -240 -0430 -228 -0509 -283
Institutional ownership -0123 -360 -0122 -359 -0100 -292
Sales growth -0041 -056 -0040 -055 -0089 -125
Past one-year stock return -0009 -015 -0006 -010 0078 125
Loss frequency 0055 174 0056 178 0054 173
Fixed effect
Standard error
Adj R-squared
Observations
Model (3)
Dependent variable ΔAvg Option grantTotal pay
Huber-White
0156
This table investigates whether the effect of FAS123R on the use of option-based pay varies with its potential accounting impact Panel A
reports the results of estimating three two-period first-differencing models where for each firm we average its characteristics in Pre- and
Post-FAS123R period The Pre-FAS123R period consists of fiscal year 2003 and 2004 the Post-FAS123R period covers fiscal year 2005-
2007 In all three specifications the dependent variable is the change of average Option grantTotal pay from Pre- to Post-FAS123R period
The main independent variable varies by model in Model (1) the Accounting impact rank is the quartile rank of implied option expensetotal
assets measured in 2002 (1=lowest 4=highest) In Model (2) Accounting impact rank=2 (3 4) is an indicator that takes value of one if the
firmrsquos Accounting impact rank equals 2 (3 4) In Model (3) we use an alternative treatment construction following Bakke et al (2015)
where Treated is an indicator that takes value of zero if the firm granted zero option to its CEO in both 2003 and 2004 or the firm began to
voluntarily expense option-based pay at fair value in 2002 or earlier and one otherwise For each control variable we include both its level in
the Pre-FAS123R period and its change across the two periods Panel B shows the results of estimating fixed effect models with firm-year
observations The dependent variable is the firm-year level Option grantTotal pay The main independent variables are the interactions of
Post-FAS123R indicator (Post) with Accounting Impact rank Accounting impact rank indicators and Treated respectively All models in
Penal A have industry fixed effects and the standard errors are Huber-White heteroscedasticity-consistent standard errors All models in
Penal B have firm fixed effects and year fixed effects and the standard errors are clustered at firm level All variables are defined in
Appendix The notation and indicates statistically significant at 10 5 and 1 level respectively
Model (1) Model (2)
11711171 1171
Industry Industry
Huber-White
0124
Huber-White
0123
Industry
48
Panel B Panel fixed effects regression
Prediction Coeff t-stat Coeff t-stat Coeff t-stat
Acc impact rank x Post - -0044 -807
Acc impact rank 2 x Post - -0046 -333
Acc impact rank 3 x Post - -0077 -526
Acc impact rank 4 x Post - -0137 -776
Treated x Post - -0145 -970
Log(size) 0034 221 0034 217 0036 229
Book-to-market 0018 084 0017 083 0015 070
Leverage -0004 -009 -0006 -013 -0007 -015
Asset tangibility 0007 012 0004 006 0011 018
Free cash flow -0074 -151 -0072 -146 -0078 -158
Cash holding -0048 -086 -0050 -090 -0006 -011
Five-year ROA volatility 0250 231 0239 219 0437 414
Institutional ownership 0043 159 0044 161 0041 150
Sales growth -0033 -168 -0034 -171 -0031 -158
Past one-year stock return 0067 221 0068 224 0063 204
Loss indicator 0023 209 0022 207 0024 222
Fixed effects
Standard error
Adj R-squared
Observations
Dependent variable Option grantTotal pay
5653 5653 5653
Clustered by firm
Firm Year
Clustered by firm
Firm Year
Clustered by firm
0523 0523 0526
Model (1) Model (2) Model (3)
Firm Year
49
Table 3
Effect of option-based compensation on dividend policy
Panel A Two-period first-difference regression
Prediction Coeff t-stat Coeff t-stat Coeff t-stat
Accounting impact rank + 0000 077
Accounting impact rank=2 + 0001 091
Accounting impact rank=3 + 0000 044
Accounting impact rank=4 + 0001 092
Treated + 0000 -026
ΔLog(size) 0000 -030 0000 -030 0000 -026
ΔBook-to-market -0002 -190 -0002 -193 -0002 -195
ΔLeverage -0002 -059 -0002 -057 -0002 -059
ΔAsset tangibility 0016 431 0016 429 0016 430
ΔFree cash flow 0017 373 0017 373 0017 375
ΔCash holding -0011 -288 -0011 -285 -0010 -282
ΔFive-year ROA volatility 0003 034 0002 032 0003 035
ΔInstitutional ownership -0002 -073 -0002 -073 -0002 -070
ΔSales growth -0001 -040 -0001 -037 -0001 -038
ΔPast one-year stock return 0002 077 0002 076 0002 070
ΔLoss frequency 0000 -048 0000 -045 0000 -046
Log(size) 0000 183 0000 182 0000 182
Book-to-market -0002 -227 -0002 -225 -0002 -284
Leverage -0001 -037 -0001 -039 -0001 -048
Asset tangibility 0003 179 0003 180 0003 176
Free cash flow 0017 291 0017 291 0017 300
Cash holding 0002 080 0002 077 0002 098
Five-year ROA volatility 0003 035 0002 033 0003 044
Institutional ownership -0001 -068 -0001 -068 -0001 -058
Sales growth -0004 -177 -0004 -175 -0004 -172
Past one-year stock return 0004 169 0004 167 0004 165
Loss frequency -0001 -111 -0001 -109 -0001 -102
Fixed effect
Standard error
Adj R-squared
Observations
Dependent variable ΔAvg Regular dividendTotal assets
This table investigates the causal effect of option-based pay on dividend policy by examining whether changes in dividend policy around
FAS123R vary with its potential accounting impact Panel A reports the results of estimating three two-period first-differencing models
where for each firm we average its characteristics in Pre- and Post-FAS123R period In all three specifications the dependent variable is
the change of average Regular dividendTotal assets from Pre- to Post-FAS123R period The main independent variable varies by model in
Model (1) the Accounting impact rank is the quartile rank of implied option expensetotal assets measured in 2002 (1=lowest 4=highest) In
Model (2) Accounting impact rank=2 (3 4) is an indicator that takes value of one if the firmrsquos Accounting impact rank equals 2 (3 4) In
Model (3) we use an alternative treatment construction following Bakke et al (2015) where Treated is an indicator that takes value of zero
if the firm granted zero option to its CEO in both 2003 and 2004 or the firm began to voluntarily expense option-based pay at fair value in
2002 or earlier and one otherwise For each control variable we include both its level in the Pre-FAS123R period and its change across the
two periods Panel B shows the results of estimating fixed effect models with firm-year observations The dependent variable is the firm-
year level Regular dividendTotal assets The main independent variables are the interactions of Post-FAS123R indicator (Post) with
Accounting Impact rank Accounting impact rank indicators and Treated respectively Panel C examines the intensity of dividend changes
among firms with nonzero dividend per share in 2003 or 2004 In particular we estimates the same three models as in Panel A(with the
same independent variables) but for five dependent variables the change of average Regular dividendTotal assets from Pre- to Post-
FAS123R period (as in Panel A) the percentage change of DPS (dividend per share) from Pre- to Post-FAS123R period and three
indicators denoting respectively whether the percentage change of DPS was greater than 20 40 and 60 Panel D reports four
robustness tests of the dividend intensity regression In each of them a set of possible confounding observations is removed (see Section 33
for details) Panel E compares the trends of dividend initiation and termination around FAS123R across four quartile groups ranked by
accounting impact All models in Panel A C and D have industry fixed effects and the standard errors are Huber-White heteroscedasticity-
consistent standard errors All models in Penal B have firm fixed effects and year fixed effects and the standard errors are clustered at
firm level All variables are defined in Appendix The notation and indicates statistically significant at 10 5 and 1 level
Industry Industry Industry
Model (1) Model (2) Model (3)
1171 1171 1171
Huber-White Huber-White Huber-White
0105 0104 0105
50
Panel B Panel fixed effects regression
Prediction Coeff t-stat Coeff t-stat Coeff t-stat
Acc impact rank x Post + 0000 122
Acc impact rank 2 x Post + 0001 110
Acc impact rank 3 x Post + 0001 094
Acc impact rank 4 x Post + 0001 129
Treated x Post + 0000 -012
Log(size) 0001 179 0001 179 0001 181
Book-to-market 0000 025 0000 024 0000 031
Leverage 0001 062 0001 064 0001 069
Asset tangibility 0009 360 0009 358 0009 363
Free cash flow 0002 090 0002 093 0002 092
Cash holding -0007 -295 -0007 -298 -0007 -298
Five-year ROA volatility 0001 041 0001 038 0000 -006
Institutional ownership 0000 -027 0000 -026 0000 -027
Sales growth 0000 053 0000 051 0000 044
Past one-year stock return 0001 089 0001 088 0001 078
Loss indicator 0000 -060 0000 -057 0000 -076
Fixed effects
Standard error
Adj R-squared
Observations
Dependent variable Regular dividendTotal assets
Model (1) Model (2) Model (3)
Firm Year Firm Year Firm Year
5653 5653 5653
Clustered by firm Clustered by firm Clustered by firm
0877 0877 0877
51
Panel C Intensity of dividend changes around FAS123R
Prediction Coeff t-stat Coeff t-stat Coeff t-stat
Accounting impact rank + 0000 065
Accounting impact rank=2 + 0000 048
Accounting impact rank=3 + 0000 026
Accounting impact rank=4 + 0002 080
Treated + 0001 063
Dependent var DPS pct change
Accounting impact rank + -0145 -072
Accounting impact rank=2 + 0018 006
Accounting impact rank=3 + -0177 -045
Accounting impact rank=4 + -0746 -100
Treated + -0407 -119
Accounting impact rank + 0029 095
Accounting impact rank=2 + 0040 074
Accounting impact rank=3 + 0092 139
Accounting impact rank=4 + 0008 007
Treated + -0007 -012
Accounting impact rank + 0024 076
Accounting impact rank=2 + 0047 088
Accounting impact rank=3 + 0079 114
Accounting impact rank=4 + -0003 -002
Treated + 0030 052
Accounting impact rank + 0030 098
Accounting impact rank=2 + 0078 155
Accounting impact rank=3 + 0085 130
Accounting impact rank=4 + 0014 012
Treated + -0006 -011
Control variables
Fixed effect
Standard error
Observations 572 572 572
Yes Yes Yes
Huber-White Huber-White Huber-White
Industry Industry Industry
Dependent var DPS pct
change gt60 indicator
Model (1) Model (2) Model (3)
Dependent var ΔAvg Regular
dividendAssets
Dependent var DPS pct
change gt20 indicator
Dependent var DPS pct
change gt40 indicator
52
Panel D Robustness tests for intensity of dividend changes around FAS123R
Prediction Coeff t-stat Coeff t-stat Coeff t-stat
Accounting impact rank + 0006 017
Accounting impact rank=2 + 0067 118
Accounting impact rank=3 + 0041 057
Accounting impact rank=4 + -0061 -049
Treated + 0022 035Observations
Accounting impact rank + 0009 027
Accounting impact rank=2 + 0058 106
Accounting impact rank=3 + 0032 043
Accounting impact rank=4 + -0032 -024
Treated + 0018 028
Observations
Accounting impact rank + 0030 089
Accounting impact rank=2 + 0039 071
Accounting impact rank=3 + 0122 168
Accounting impact rank=4 + -0063 -052
Treated + 0075 132
Observations
Accounting impact rank + 0008 023
Accounting impact rank=2 + 0023 042
Accounting impact rank=3 + 0048 064
Accounting impact rank=4 + -0042 -033
Treated + -0010 -016
Observations
Control variables
Fixed effect
Standard error
Exclude firms with stable
payout ratio from 2003 to 2004
506 506 506
Dependent variable DPS pct change gt40 indicator
Model (1) Model (2) Model (3)
Exclude voluntary expensers
519 519
Exclude firms in the top decile
of option reduction (02-04)
Exclude firms that accelerated
option vesting
504 504 504
517 517 517
519
Huber-White Huber-White Huber-White
Yes Yes Yes
Industry Industry Industry
53
Panel E Dividend initiation and termination rates around FAS123R
Pre FAS 123R
1 280 75 7 6 13 173
2 284 135 18 9 27 200
3 286 181 11 14 25 138
4 282 260 9 10 19 73
Total 1132 651 45 39 84 129
Post FAS 123R
1 275 63 4 4 8 127
2 280 116 9 9 18 155
3 276 152 9 3 12 79
4 263 223 5 1 6 27
Total 1094 554 27 17 44 79
Pre FAS 123R
1 280 205 2 0 2 10
2 284 149 7 1 8 54
3 286 105 0 0 0 00
4 282 22 0 0 0 00
Total 1132 481 9 1 10 21
Post FAS 123R
1 275 212 3 6 9 42
2 280 164 1 2 3 18
3 276 124 1 1 2 16
4 263 40 0 3 3 75
Total 1094 540 5 12 17 31
termination
in 2004
03-04
cumulative
03-04
cumulative
Quartile firms
with
dividend in
2004
termination
in 2005
termination
in 2006
05-06
cumulative
05-06
cumulative
Termination
Quartile firms
with
dividend in
2002
termination
in 2003
without
dividend in
2004
initiation in
2003
initiation in
2004
03-04
cumulative
03-04
cumulative firmsQuartile
firmsQuartile initiation in
2005
initiation in
2006
05-06
cumulative
05-06
cumulative
Initiation
without
dividend in
2002
54
Table 4
Effect of option-based compensation on repurchases
Panel A Two-period first-difference regression with total repurchase
Prediction Coeff t-stat Coeff t-stat Coeff t-stat
Accounting impact rank - 0002 122
Accounting impact rank=2 - 0002 071
Accounting impact rank=3 - 0005 123
Accounting impact rank=4 - 0007 102
Treated - 0014 365
Control variables
Fixed effect
Standard error
Adj R-squared
Observations
Panel B Two-period first-difference regression with net repurchase
Prediction Coeff t-stat Coeff t-stat Coeff t-stat
Accounting impact rank - 0003 166
Accounting impact rank=2 - 0002 051
Accounting impact rank=3 - 0006 165
Accounting impact rank=4 - 0009 137
Treated - 0010 300
Control variables
Fixed effect
Standard error
Adj R-squared
Observations
Panel C Two-period first-difference regression with repurchase adjusted for exercised options
Prediction Coeff t-stat Coeff t-stat Coeff t-stat
Accounting impact rank - 0001 056
Accounting impact rank=2 - 0002 062
Accounting impact rank=3 - 0007 172
Accounting impact rank=4 - -0001 -008
Treated - 0006 197
Control variables
Fixed effect
Standard error
Adj R-squared
Observations
Dependent variable ΔAvg RepurchaseTotal assets
This table investigates the causal effect of option-based pay on payout policy by examining whether the changes of repurchase around
FAS123R vary with its potential accounting impact Panel A reports the results of estimating three two-period first-differencing models
where for each firm we average its characteristics in Pre- and Post-FAS123R period In all three specifications the dependent variable is
the change of average RepurchaseTotal assets from Pre- to Post-FAS123R period The main independent variable varies by model in
Model (1) the Accounting impact rank is the quartile rank of implied option expensetotal assets measured in 2002 (1=lowest 4=highest)
In Model (2) Accounting impact rank=2 (3 4) is an indicator that takes value of one if the firmrsquos Accounting impact rank equals 2 (3 4)
In Model (3) we use an alternative treatment construction following Bakke et al (2015) where Treated is an indicator that takes value of
zero if the firm granted zero option to its CEO in both 2003 and 2004 or the firm began to voluntarily expense option-based pay at fair
value in 2002 or earlier and one otherwise Panel B reports the regressions with the change of Net repurchaseTotal assets as the
dependent variable and the same independent variable as in Panel A Panel C reports the regressions with the change of Adjusted
repurchaseTotal assets as the dependent variable and the same independent variable as in Panel A All models in Panel A B and C have
industry fixed effects and the standard errors are Huber-White heteroscedasticity-consistent standard errors All variables are defined in
Appendix The notation and indicates statistically significant at 10 5 and 1 level respectively
Model (1) Model (2) Model (3)
Yes Yes Yes
Industry Industry Industry
Huber-White Huber-White Huber-White
Dependent variable ΔAvg Net repurchaseTotal assets
1171 1171 1171
0238 0237 0245
Model (1) Model (2) Model (3)
Yes Yes Yes
Industry Industry Industry
Huber-White Huber-White Huber-White
Dependent variable ΔAvg Adjusted repurchaseTotal assets
0229 0229 0233
1171 1171 1171
Model (1) Model (2) Model (3)
Yes Yes Yes
Industry Industry Industry
Huber-White Huber-White Huber-White
0111 0112 0114
1168 1168 1168
55
Table 5
Effect of option-based compensation on payout mix
Panel A Two-period first-difference regression with total payout mix
Prediction Coeff t-stat Coeff t-stat Coeff t-stat
Accounting impact rank + 0006 028
Accounting impact rank=2 + 0018 045
Accounting impact rank=3 + -0001 -001
Accounting impact rank=4 + 0043 052
Treated + -0035 -094
Control variables
Fixed effect
Standard error
Adj R-squared
Observations
Panel B Two-period first-difference regression with net payout mix
Prediction Coeff t-stat Coeff t-stat Coeff t-stat
Accounting impact rank + -0002 -008
Accounting impact rank=2 + 0008 016
Accounting impact rank=3 + 0018 034
Accounting impact rank=4 + -0059 -055
Treated + -0050 -101
Control variables
Fixed effect
Standard error
Adj R-squared
Observations
0049 0043 0054
257 257 257
Industry Industry Industry
Huber-White Huber-White Huber-White
Dependent variable ΔAvg Regular dividendNet payout
Model (1) Model (2) Model (3)
Yes Yes Yes
0154 0151 0156
362 362 362
Industry Industry Industry
Huber-White Huber-White Huber-White
This table investigates the causal effect of option-based pay on payout mix for firms using both dividend and repurchase by examining
whether the changes of payout mix around FAS123R vary with its potential accounting impact Panel A reports the results of estimating
three two-period first-differencing models where for each firm we average its characteristics in Pre- and Post-FAS123R period In all three
specifications the dependent variable is the change of average Regular dividendTotal payout from Pre- to Post-FAS123R period The main
independent variable varies by model in Model (1) the Accounting impact rank is the quartile rank of implied option expensetotal assets
measured in 2002 (1=lowest 4=highest) In Model (2) Accounting impact rank=2 (3 4) is an indicator that takes value of one if the firmrsquos
Accounting impact rank equals 2 (3 4) In Model (3) we use an alternative treatment construction following Bakke et al (2015) where
Treated is an indicator that takes value of zero if the firm granted zero option to its CEO in both 2003 and 2004 or the firm began to
voluntarily expense option-based pay at fair value in 2002 or earlier and one otherwise Panel B reports the regressions with the change of
Regular dividendNet payout as the dependent variable and the same independent variables as in Panel A Panel A (Panel B) is based on
observations with nonzero regular dividend and repurchase (net repurchase) in both Pre- and Post-FAS123R period All models in Panel A
and B have industry fixed effects and the standard errors are Huber-White heteroscedasticity-consistent standard errors All variables are
defined in Appendix The notation and indicates statistically significant at 10 5 and 1 level respectively
Yes Yes Yes
Dependent variable ΔAvg Regular dividendTotal payout
Model (1) Model (2) Model (3)

44
Panel C Firm characteristics - before and after FAS123R
Pre FAS 123R Post FAS 123R Difference
Payout variables
Regular dividendTotal assets 083 099 016
RepurchaseTotal assets 245 490 245
Total payoutTotal assets 328 589 261
Regular dividendTotal payout 3914 2790 -1124
Level of executive compensation (in $1000)
Salary_$ 426 463 37
Bonus_$ 418 505 87
Option grant_$ 896 707 -191
Restricted stock grant_$ 269 574 305
Total pay_$ 2263 2584 321
Percentage of executive compensation
Salary_ 305 293 -12
Bonus_ 186 204 18
Option grant_ 343 240 -103
Restricted stock grant_ 87 176 89
Control variables
Size ($M) 9671 11631 1960
Log(size) 7860 8035 0175
Book-to-market 0437 0453 0016
Leverage 0201 0203 0002
Asset tangibility 0822 0793 -0029
Free cash flow 0061 0057 -0004
Cash holding 0175 0159 -0016
ROA volatility 0067 0048 -0019
Institutional ownership 0712 0781 0069
Sales growth 0137 0108 -0029
Past stock return 0080 0101 0021
Loss indicator 0173 0159 -0014
45
Pa
nel
D
Fir
m c
ha
racte
rist
ics
by q
ua
rtil
e o
f a
cco
un
tin
g i
mp
act
- b
efo
re a
nd
aft
er
FA
S1
23
R
Accounting im
pact
(2002)
Num
ber
of
Fir
ms
Pre
Post
Pre
Post
Pre
Post
Pre
Post
Payout
vari
able
s
Regula
r div
idendT
ota
l ass
ets
11
2
12
4
09
4
11
1
09
5
11
3
03
0
04
9
Repurc
hase
Tota
l ass
ets
11
3
26
8
19
2
37
3
32
7
63
1
35
1
68
7
Tota
l payout
Tota
l ass
ets
22
4
39
1
28
5
48
4
42
2
74
4
38
1
73
6
Regula
r div
idendT
ota
l payout
643
7
469
8
474
0
341
1
284
5
195
4
82
5
74
5
Perc
enta
ge o
f executive c
om
pensa
tion
Sala
ry_
337
295
313
287
296
289
276
300
Bonus_
223
226
214
228
172
192
134
169
Option g
rant_
201
167
290
210
373
260
507
325
Rest
ricte
d s
tock g
rant_
116
194
98
180
89
176
43
155
294
294
294
294
1st Q
uart
ile2
nd Q
uart
ile3
rd Q
uart
ile4
th Q
uart
ile
01
2
03
5
09
3
55
1
46
Accounting impact
Number of Firms
By accounting impact quartile
1
2
3
4
Pre Post Pre Post
Payout variables
Regular dividendTotal assets 09 11 08 10
RepurchaseTotal assets 18 31 26 52
Total payoutTotal assets 28 43 34 62
Regular dividendTotal payout 428 357 386 265
Percentage of executive compensation
Salary_ 435 364 282 280
Bonus_ 226 214 179 202
Option grant_ 92 125 387 261
Restricted stock grant_ 125 188 80 174
Percentage of CEO compensation
Salary_(CEO) 485 364 260 259
Bonus_(CEO) 249 228 185 219
Option grant_(CEO) 10 127 406 275
Restricted stock grant_(CEO) 128 182 82 183
Panel E Firm characteristics by alternative treatment definition - before and
after FAS123R
Treated
25
19
997
223
250
256
268
10
177
71
Control
44
37
47
Table 2
Differential effect of FAS123R on the use of option-based compensation
Panel A Two-period first-difference regression
Prediction Coeff t-stat Coeff t-stat Coeff t-stat
Accounting impact rank - -0044 -628
Accounting impact rank=2 - -0044 -327
Accounting impact rank=3 - -0075 -468
Accounting impact rank=4 - -0140 -613
Treated - -0132 -875
ΔLog(size) 0061 202 0061 200 0063 214
ΔBook-to-market 0032 091 0032 092 0051 143
ΔLeverage -0157 -213 -0160 -218 -0111 -153
ΔAsset tangibility -0012 -014 -0020 -023 -0023 -026
ΔFree cash flow -0106 -095 -0108 -097 -0128 -117
ΔCash holding -0197 -211 -0193 -206 -0180 -194
ΔFive-year ROA volatility -0065 -031 -0056 -026 -0098 -047
ΔInstitutional ownership -0044 -091 -0043 -088 -0044 -092
ΔSales growth -0064 -102 -0065 -104 -0090 -153
ΔPast one-year stock return 0051 078 0052 080 0091 138
ΔLoss frequency 0056 207 0057 207 0047 179
Log(size) -0009 -210 -0009 -207 -0002 -035
Book-to-market -0015 -056 -0013 -049 0018 072
Leverage 0022 046 0023 048 0068 150
Asset tangibility 0033 077 0033 078 0053 128
Free cash flow 0227 202 0220 195 0127 117
Cash holding -0002 -004 0012 019 -0078 -141
Five-year ROA volatility -0451 -240 -0430 -228 -0509 -283
Institutional ownership -0123 -360 -0122 -359 -0100 -292
Sales growth -0041 -056 -0040 -055 -0089 -125
Past one-year stock return -0009 -015 -0006 -010 0078 125
Loss frequency 0055 174 0056 178 0054 173
Fixed effect
Standard error
Adj R-squared
Observations
Model (3)
Dependent variable ΔAvg Option grantTotal pay
Huber-White
0156
This table investigates whether the effect of FAS123R on the use of option-based pay varies with its potential accounting impact Panel A
reports the results of estimating three two-period first-differencing models where for each firm we average its characteristics in Pre- and
Post-FAS123R period The Pre-FAS123R period consists of fiscal year 2003 and 2004 the Post-FAS123R period covers fiscal year 2005-
2007 In all three specifications the dependent variable is the change of average Option grantTotal pay from Pre- to Post-FAS123R period
The main independent variable varies by model in Model (1) the Accounting impact rank is the quartile rank of implied option expensetotal
assets measured in 2002 (1=lowest 4=highest) In Model (2) Accounting impact rank=2 (3 4) is an indicator that takes value of one if the
firmrsquos Accounting impact rank equals 2 (3 4) In Model (3) we use an alternative treatment construction following Bakke et al (2015)
where Treated is an indicator that takes value of zero if the firm granted zero option to its CEO in both 2003 and 2004 or the firm began to
voluntarily expense option-based pay at fair value in 2002 or earlier and one otherwise For each control variable we include both its level in
the Pre-FAS123R period and its change across the two periods Panel B shows the results of estimating fixed effect models with firm-year
observations The dependent variable is the firm-year level Option grantTotal pay The main independent variables are the interactions of
Post-FAS123R indicator (Post) with Accounting Impact rank Accounting impact rank indicators and Treated respectively All models in
Penal A have industry fixed effects and the standard errors are Huber-White heteroscedasticity-consistent standard errors All models in
Penal B have firm fixed effects and year fixed effects and the standard errors are clustered at firm level All variables are defined in
Appendix The notation and indicates statistically significant at 10 5 and 1 level respectively
Model (1) Model (2)
11711171 1171
Industry Industry
Huber-White
0124
Huber-White
0123
Industry
48
Panel B Panel fixed effects regression
Prediction Coeff t-stat Coeff t-stat Coeff t-stat
Acc impact rank x Post - -0044 -807
Acc impact rank 2 x Post - -0046 -333
Acc impact rank 3 x Post - -0077 -526
Acc impact rank 4 x Post - -0137 -776
Treated x Post - -0145 -970
Log(size) 0034 221 0034 217 0036 229
Book-to-market 0018 084 0017 083 0015 070
Leverage -0004 -009 -0006 -013 -0007 -015
Asset tangibility 0007 012 0004 006 0011 018
Free cash flow -0074 -151 -0072 -146 -0078 -158
Cash holding -0048 -086 -0050 -090 -0006 -011
Five-year ROA volatility 0250 231 0239 219 0437 414
Institutional ownership 0043 159 0044 161 0041 150
Sales growth -0033 -168 -0034 -171 -0031 -158
Past one-year stock return 0067 221 0068 224 0063 204
Loss indicator 0023 209 0022 207 0024 222
Fixed effects
Standard error
Adj R-squared
Observations
Dependent variable Option grantTotal pay
5653 5653 5653
Clustered by firm
Firm Year
Clustered by firm
Firm Year
Clustered by firm
0523 0523 0526
Model (1) Model (2) Model (3)
Firm Year
49
Table 3
Effect of option-based compensation on dividend policy
Panel A Two-period first-difference regression
Prediction Coeff t-stat Coeff t-stat Coeff t-stat
Accounting impact rank + 0000 077
Accounting impact rank=2 + 0001 091
Accounting impact rank=3 + 0000 044
Accounting impact rank=4 + 0001 092
Treated + 0000 -026
ΔLog(size) 0000 -030 0000 -030 0000 -026
ΔBook-to-market -0002 -190 -0002 -193 -0002 -195
ΔLeverage -0002 -059 -0002 -057 -0002 -059
ΔAsset tangibility 0016 431 0016 429 0016 430
ΔFree cash flow 0017 373 0017 373 0017 375
ΔCash holding -0011 -288 -0011 -285 -0010 -282
ΔFive-year ROA volatility 0003 034 0002 032 0003 035
ΔInstitutional ownership -0002 -073 -0002 -073 -0002 -070
ΔSales growth -0001 -040 -0001 -037 -0001 -038
ΔPast one-year stock return 0002 077 0002 076 0002 070
ΔLoss frequency 0000 -048 0000 -045 0000 -046
Log(size) 0000 183 0000 182 0000 182
Book-to-market -0002 -227 -0002 -225 -0002 -284
Leverage -0001 -037 -0001 -039 -0001 -048
Asset tangibility 0003 179 0003 180 0003 176
Free cash flow 0017 291 0017 291 0017 300
Cash holding 0002 080 0002 077 0002 098
Five-year ROA volatility 0003 035 0002 033 0003 044
Institutional ownership -0001 -068 -0001 -068 -0001 -058
Sales growth -0004 -177 -0004 -175 -0004 -172
Past one-year stock return 0004 169 0004 167 0004 165
Loss frequency -0001 -111 -0001 -109 -0001 -102
Fixed effect
Standard error
Adj R-squared
Observations
Dependent variable ΔAvg Regular dividendTotal assets
This table investigates the causal effect of option-based pay on dividend policy by examining whether changes in dividend policy around
FAS123R vary with its potential accounting impact Panel A reports the results of estimating three two-period first-differencing models
where for each firm we average its characteristics in Pre- and Post-FAS123R period In all three specifications the dependent variable is
the change of average Regular dividendTotal assets from Pre- to Post-FAS123R period The main independent variable varies by model in
Model (1) the Accounting impact rank is the quartile rank of implied option expensetotal assets measured in 2002 (1=lowest 4=highest) In
Model (2) Accounting impact rank=2 (3 4) is an indicator that takes value of one if the firmrsquos Accounting impact rank equals 2 (3 4) In
Model (3) we use an alternative treatment construction following Bakke et al (2015) where Treated is an indicator that takes value of zero
if the firm granted zero option to its CEO in both 2003 and 2004 or the firm began to voluntarily expense option-based pay at fair value in
2002 or earlier and one otherwise For each control variable we include both its level in the Pre-FAS123R period and its change across the
two periods Panel B shows the results of estimating fixed effect models with firm-year observations The dependent variable is the firm-
year level Regular dividendTotal assets The main independent variables are the interactions of Post-FAS123R indicator (Post) with
Accounting Impact rank Accounting impact rank indicators and Treated respectively Panel C examines the intensity of dividend changes
among firms with nonzero dividend per share in 2003 or 2004 In particular we estimates the same three models as in Panel A(with the
same independent variables) but for five dependent variables the change of average Regular dividendTotal assets from Pre- to Post-
FAS123R period (as in Panel A) the percentage change of DPS (dividend per share) from Pre- to Post-FAS123R period and three
indicators denoting respectively whether the percentage change of DPS was greater than 20 40 and 60 Panel D reports four
robustness tests of the dividend intensity regression In each of them a set of possible confounding observations is removed (see Section 33
for details) Panel E compares the trends of dividend initiation and termination around FAS123R across four quartile groups ranked by
accounting impact All models in Panel A C and D have industry fixed effects and the standard errors are Huber-White heteroscedasticity-
consistent standard errors All models in Penal B have firm fixed effects and year fixed effects and the standard errors are clustered at
firm level All variables are defined in Appendix The notation and indicates statistically significant at 10 5 and 1 level
Industry Industry Industry
Model (1) Model (2) Model (3)
1171 1171 1171
Huber-White Huber-White Huber-White
0105 0104 0105
50
Panel B Panel fixed effects regression
Prediction Coeff t-stat Coeff t-stat Coeff t-stat
Acc impact rank x Post + 0000 122
Acc impact rank 2 x Post + 0001 110
Acc impact rank 3 x Post + 0001 094
Acc impact rank 4 x Post + 0001 129
Treated x Post + 0000 -012
Log(size) 0001 179 0001 179 0001 181
Book-to-market 0000 025 0000 024 0000 031
Leverage 0001 062 0001 064 0001 069
Asset tangibility 0009 360 0009 358 0009 363
Free cash flow 0002 090 0002 093 0002 092
Cash holding -0007 -295 -0007 -298 -0007 -298
Five-year ROA volatility 0001 041 0001 038 0000 -006
Institutional ownership 0000 -027 0000 -026 0000 -027
Sales growth 0000 053 0000 051 0000 044
Past one-year stock return 0001 089 0001 088 0001 078
Loss indicator 0000 -060 0000 -057 0000 -076
Fixed effects
Standard error
Adj R-squared
Observations
Dependent variable Regular dividendTotal assets
Model (1) Model (2) Model (3)
Firm Year Firm Year Firm Year
5653 5653 5653
Clustered by firm Clustered by firm Clustered by firm
0877 0877 0877
51
Panel C Intensity of dividend changes around FAS123R
Prediction Coeff t-stat Coeff t-stat Coeff t-stat
Accounting impact rank + 0000 065
Accounting impact rank=2 + 0000 048
Accounting impact rank=3 + 0000 026
Accounting impact rank=4 + 0002 080
Treated + 0001 063
Dependent var DPS pct change
Accounting impact rank + -0145 -072
Accounting impact rank=2 + 0018 006
Accounting impact rank=3 + -0177 -045
Accounting impact rank=4 + -0746 -100
Treated + -0407 -119
Accounting impact rank + 0029 095
Accounting impact rank=2 + 0040 074
Accounting impact rank=3 + 0092 139
Accounting impact rank=4 + 0008 007
Treated + -0007 -012
Accounting impact rank + 0024 076
Accounting impact rank=2 + 0047 088
Accounting impact rank=3 + 0079 114
Accounting impact rank=4 + -0003 -002
Treated + 0030 052
Accounting impact rank + 0030 098
Accounting impact rank=2 + 0078 155
Accounting impact rank=3 + 0085 130
Accounting impact rank=4 + 0014 012
Treated + -0006 -011
Control variables
Fixed effect
Standard error
Observations 572 572 572
Yes Yes Yes
Huber-White Huber-White Huber-White
Industry Industry Industry
Dependent var DPS pct
change gt60 indicator
Model (1) Model (2) Model (3)
Dependent var ΔAvg Regular
dividendAssets
Dependent var DPS pct
change gt20 indicator
Dependent var DPS pct
change gt40 indicator
52
Panel D Robustness tests for intensity of dividend changes around FAS123R
Prediction Coeff t-stat Coeff t-stat Coeff t-stat
Accounting impact rank + 0006 017
Accounting impact rank=2 + 0067 118
Accounting impact rank=3 + 0041 057
Accounting impact rank=4 + -0061 -049
Treated + 0022 035Observations
Accounting impact rank + 0009 027
Accounting impact rank=2 + 0058 106
Accounting impact rank=3 + 0032 043
Accounting impact rank=4 + -0032 -024
Treated + 0018 028
Observations
Accounting impact rank + 0030 089
Accounting impact rank=2 + 0039 071
Accounting impact rank=3 + 0122 168
Accounting impact rank=4 + -0063 -052
Treated + 0075 132
Observations
Accounting impact rank + 0008 023
Accounting impact rank=2 + 0023 042
Accounting impact rank=3 + 0048 064
Accounting impact rank=4 + -0042 -033
Treated + -0010 -016
Observations
Control variables
Fixed effect
Standard error
Exclude firms with stable
payout ratio from 2003 to 2004
506 506 506
Dependent variable DPS pct change gt40 indicator
Model (1) Model (2) Model (3)
Exclude voluntary expensers
519 519
Exclude firms in the top decile
of option reduction (02-04)
Exclude firms that accelerated
option vesting
504 504 504
517 517 517
519
Huber-White Huber-White Huber-White
Yes Yes Yes
Industry Industry Industry
53
Panel E Dividend initiation and termination rates around FAS123R
Pre FAS 123R
1 280 75 7 6 13 173
2 284 135 18 9 27 200
3 286 181 11 14 25 138
4 282 260 9 10 19 73
Total 1132 651 45 39 84 129
Post FAS 123R
1 275 63 4 4 8 127
2 280 116 9 9 18 155
3 276 152 9 3 12 79
4 263 223 5 1 6 27
Total 1094 554 27 17 44 79
Pre FAS 123R
1 280 205 2 0 2 10
2 284 149 7 1 8 54
3 286 105 0 0 0 00
4 282 22 0 0 0 00
Total 1132 481 9 1 10 21
Post FAS 123R
1 275 212 3 6 9 42
2 280 164 1 2 3 18
3 276 124 1 1 2 16
4 263 40 0 3 3 75
Total 1094 540 5 12 17 31
termination
in 2004
03-04
cumulative
03-04
cumulative
Quartile firms
with
dividend in
2004
termination
in 2005
termination
in 2006
05-06
cumulative
05-06
cumulative
Termination
Quartile firms
with
dividend in
2002
termination
in 2003
without
dividend in
2004
initiation in
2003
initiation in
2004
03-04
cumulative
03-04
cumulative firmsQuartile
firmsQuartile initiation in
2005
initiation in
2006
05-06
cumulative
05-06
cumulative
Initiation
without
dividend in
2002
54
Table 4
Effect of option-based compensation on repurchases
Panel A Two-period first-difference regression with total repurchase
Prediction Coeff t-stat Coeff t-stat Coeff t-stat
Accounting impact rank - 0002 122
Accounting impact rank=2 - 0002 071
Accounting impact rank=3 - 0005 123
Accounting impact rank=4 - 0007 102
Treated - 0014 365
Control variables
Fixed effect
Standard error
Adj R-squared
Observations
Panel B Two-period first-difference regression with net repurchase
Prediction Coeff t-stat Coeff t-stat Coeff t-stat
Accounting impact rank - 0003 166
Accounting impact rank=2 - 0002 051
Accounting impact rank=3 - 0006 165
Accounting impact rank=4 - 0009 137
Treated - 0010 300
Control variables
Fixed effect
Standard error
Adj R-squared
Observations
Panel C Two-period first-difference regression with repurchase adjusted for exercised options
Prediction Coeff t-stat Coeff t-stat Coeff t-stat
Accounting impact rank - 0001 056
Accounting impact rank=2 - 0002 062
Accounting impact rank=3 - 0007 172
Accounting impact rank=4 - -0001 -008
Treated - 0006 197
Control variables
Fixed effect
Standard error
Adj R-squared
Observations
Dependent variable ΔAvg RepurchaseTotal assets
This table investigates the causal effect of option-based pay on payout policy by examining whether the changes of repurchase around
FAS123R vary with its potential accounting impact Panel A reports the results of estimating three two-period first-differencing models
where for each firm we average its characteristics in Pre- and Post-FAS123R period In all three specifications the dependent variable is
the change of average RepurchaseTotal assets from Pre- to Post-FAS123R period The main independent variable varies by model in
Model (1) the Accounting impact rank is the quartile rank of implied option expensetotal assets measured in 2002 (1=lowest 4=highest)
In Model (2) Accounting impact rank=2 (3 4) is an indicator that takes value of one if the firmrsquos Accounting impact rank equals 2 (3 4)
In Model (3) we use an alternative treatment construction following Bakke et al (2015) where Treated is an indicator that takes value of
zero if the firm granted zero option to its CEO in both 2003 and 2004 or the firm began to voluntarily expense option-based pay at fair
value in 2002 or earlier and one otherwise Panel B reports the regressions with the change of Net repurchaseTotal assets as the
dependent variable and the same independent variable as in Panel A Panel C reports the regressions with the change of Adjusted
repurchaseTotal assets as the dependent variable and the same independent variable as in Panel A All models in Panel A B and C have
industry fixed effects and the standard errors are Huber-White heteroscedasticity-consistent standard errors All variables are defined in
Appendix The notation and indicates statistically significant at 10 5 and 1 level respectively
Model (1) Model (2) Model (3)
Yes Yes Yes
Industry Industry Industry
Huber-White Huber-White Huber-White
Dependent variable ΔAvg Net repurchaseTotal assets
1171 1171 1171
0238 0237 0245
Model (1) Model (2) Model (3)
Yes Yes Yes
Industry Industry Industry
Huber-White Huber-White Huber-White
Dependent variable ΔAvg Adjusted repurchaseTotal assets
0229 0229 0233
1171 1171 1171
Model (1) Model (2) Model (3)
Yes Yes Yes
Industry Industry Industry
Huber-White Huber-White Huber-White
0111 0112 0114
1168 1168 1168
55
Table 5
Effect of option-based compensation on payout mix
Panel A Two-period first-difference regression with total payout mix
Prediction Coeff t-stat Coeff t-stat Coeff t-stat
Accounting impact rank + 0006 028
Accounting impact rank=2 + 0018 045
Accounting impact rank=3 + -0001 -001
Accounting impact rank=4 + 0043 052
Treated + -0035 -094
Control variables
Fixed effect
Standard error
Adj R-squared
Observations
Panel B Two-period first-difference regression with net payout mix
Prediction Coeff t-stat Coeff t-stat Coeff t-stat
Accounting impact rank + -0002 -008
Accounting impact rank=2 + 0008 016
Accounting impact rank=3 + 0018 034
Accounting impact rank=4 + -0059 -055
Treated + -0050 -101
Control variables
Fixed effect
Standard error
Adj R-squared
Observations
0049 0043 0054
257 257 257
Industry Industry Industry
Huber-White Huber-White Huber-White
Dependent variable ΔAvg Regular dividendNet payout
Model (1) Model (2) Model (3)
Yes Yes Yes
0154 0151 0156
362 362 362
Industry Industry Industry
Huber-White Huber-White Huber-White
This table investigates the causal effect of option-based pay on payout mix for firms using both dividend and repurchase by examining
whether the changes of payout mix around FAS123R vary with its potential accounting impact Panel A reports the results of estimating
three two-period first-differencing models where for each firm we average its characteristics in Pre- and Post-FAS123R period In all three
specifications the dependent variable is the change of average Regular dividendTotal payout from Pre- to Post-FAS123R period The main
independent variable varies by model in Model (1) the Accounting impact rank is the quartile rank of implied option expensetotal assets
measured in 2002 (1=lowest 4=highest) In Model (2) Accounting impact rank=2 (3 4) is an indicator that takes value of one if the firmrsquos
Accounting impact rank equals 2 (3 4) In Model (3) we use an alternative treatment construction following Bakke et al (2015) where
Treated is an indicator that takes value of zero if the firm granted zero option to its CEO in both 2003 and 2004 or the firm began to
voluntarily expense option-based pay at fair value in 2002 or earlier and one otherwise Panel B reports the regressions with the change of
Regular dividendNet payout as the dependent variable and the same independent variables as in Panel A Panel A (Panel B) is based on
observations with nonzero regular dividend and repurchase (net repurchase) in both Pre- and Post-FAS123R period All models in Panel A
and B have industry fixed effects and the standard errors are Huber-White heteroscedasticity-consistent standard errors All variables are
defined in Appendix The notation and indicates statistically significant at 10 5 and 1 level respectively
Yes Yes Yes
Dependent variable ΔAvg Regular dividendTotal payout
Model (1) Model (2) Model (3)