Embed Size (px)
Citation preview

THE EFFECT OF NATIONAL EXAMINATION’S POLICY ON READINESS, MOTIVATION, SCHOOL TEST SCORE, AND
NATIONAL EXAMINATION SCORE
Furintasari Setya Astuti Yogyakarta State University, Indonesia
Heri Retnawati
Mathematics Education Departement, Yogyakarta State University, Indonesia [email protected]
ABSTRACT The aims of this study were to describe the number of students’ responses who agreed and disagreed with score of national examination as one of graduation requirement, the existence of readiness, motivation, score of school test, and score of mathematics national examination diversity simultaneously or for each variables, and which group of students that has better readiness, motivation, school test score, and national examination score from two groups. The method of this research is survey. Analysis technique in this study was using MANOVA and independent samples t-test. The result of this study shows that there are 20.88% students with disagree response and 79.12% students agree with policy that national examination score is not one of graduation requirement. There were differences between readiness, motivation, school test score, and national examination score simultaneously among two groups. Students with disagree response has better motivation and national examination score, but they have lower score in school examination than agreed student. INTRODUCTION Education has a very important role in the process of improving the quality of human resources. In improving the quality of education, the government had sought to make it happen through various efforts such as improving facilities and infrastructure, developing and provisioning teaching materials, training for teachers and education personnel and the most important thing is improving curricula and evaluation system. According to Kemendikbud No. 66 (2013) assessment of students’ learning outcomes in primary and secondary school was held based on national standard of educational assessment . In this case, national examination was a form of students’ outcomes assessment. National Exam (UN) was a final students’ evaluation tool. According to Kemendikbud No. 5 (2015), score of national examination was used to map the quality of educational programs, one of requirement of higher education selection, and to consider in giving the assistance to the education units to improve their quality. According to Mustofik (2011, p.3), the national examination played a strategic role in the educational management. The final examination was a strategy to improve the quality of education of developing whose limited resources. Examination will give information that encourages and improves quality of education continuously. Apart from that fact that national examination was important, the society debate and criticize it. As we know, multiple choices were a form of national exam. It assesses students’ achievement effectively because it has wide scope of learning topics (Aziz & Sugiman, 2015, p.163). Therefore, despite of many pros and cons about national exam, the government still held it. Government had a policy to change the standard of student’s graduation annually. It has a purpose to make human resources more qualified. Furthermore, graduation criterion increases for national examination in 2013–2014. Certainly, the higher criterion make students more motivated and readily. As it was before 2015, the national examination is one of requisite of student’s graduation. To face national exam, students must prepare themselves, both material and psychological readiness. One thing that should be considered was student’s readiness to learn mathematics. It is because if students have learned, they will get better results. However, almost all of students have learning obstacles. Because national examination would not be held soon, so readiness of 12th grade students became less. In learning activities in the classroom, students faced many obstacles due to the lack of readiness in learning. According to Baden and Major (2004, p.27) "Piaget believed that the activities learners could complete matched views their cognitive stage or readiness". This means that Piaget believes that the activities of learners can be related to cognitive aspects and their readiness. So their readiness will certainly affect the cognitive aspects, such as national examination scores.
The Online Journal of New Horizons in Education - July 2017 Volume 7, Issue 3
www.tojned.net Copyright © The Online Journal of New Horizons in Education 58

Seeing how important the role of national examination in determining students’ graduation, they should prepare before the day of national examination. Students need to be strengthened their understanding of the learning materials. Beside of that, teacher should concern students’ psychological condition. The effect of policy, the scores of national examination was not the only one graduation requirement, was the average score of the national examination of high school students in Ngawi decrease and lower than the national average. In the year of 2014, the score of national examination still determined students' graduation. But, in 2015 the government changed the rules against its previous policy that the national examination score did not determine the graduation. In 2015, the score of national examination of senior high school students in Ngawi decreased. In 2014, the average score of national examination was 65.80 and in 2015, the average score was 61.96. Thus the average score of the national examination in Ngawi decreased to be 3.84, while overall the average scores of its test increased by 0.29. It can be seen that the score of national examination of high school students in Ngawi decreased, while overall nationally increased. It happened because of the students’ readiness in national examination is low. Readiness was close to the students' knowledge, and their knowledge affected their readiness. According to Morrison & Fletcher (2002, p. I-3), cognitive readiness is a mental preparation (including the skills, knowledge, abilities, motivations, and personal dispositions) that individual needs to establish and sustain a competent performance in the complex and unpredictable environment. So beside cognitive readiness, mental and psychological readiness was needed. Lack of subject mastery lead to students’ anxiety to face national examination which determining students’ graduation and vice versa. It means students’ understanding also has impact to their anxiety and confidence. On the other side, their anxiety was useful because they can find out the cause and how to overcome it. When students were faced with a problem, the main action was comparing their skill to the problems. So, the students can find out whether they able to solve the problems encountered or not. Beside their readiness, students should have high motivation to learn to take the national exam. Their high motivation will improve their interest, willingness and enthusiasm to learn (Trisnawati & Wutsqa, 2015, p.299). Learning motivation was one of the characteristics influencing affective aspect. Motivation has positive impact upon learning; stimulates, sustains and give directions to an activity. Highly motivated students often require little guidance from the teachers and are capable of doing many higher degree of complicated work independently (Mubeen, Saeed, & Arif, 2013, p.81). The meaning of that argument is the motivation has positive impact on learning. Students who have high motivation can do a lot of complex issues independently with few teacher’s guidance. Motivation is one’s internal and external encouragement (Elliot, 2000, Evans, 1999), spirit, effort, and persistence of behavior to hold a change to achieve certain goals (Schunk, Pintrich, & Meece 2010, Woolfolk, 2007, Santrock, 2014, Elliot, 2005, Ormrod, 2003). Motivation includes intrinsic and extrinsic motivation. Intrinsic motivation comes from someone’s interest or his pleasure naturally (Wolkfolk & Margetts, 2007, p.391; Miller, 2009, p.104). Meanwhile, extrinsic motivation comes from environment effect such teaching style, group learning influence, fun and innovative learning, and reward or punishment (Wolkfolk, 2007, Santrock , 2014, Amri &Abadi, 2013, p.56; Farhan &Retnawati, 2014, p.230). According to Santrock (2014) intrinsic motivation has positive correlation with a value. Therefore, motivation is very important to achieve the learning objectives. There significant correlation between achievement and motivation (Sikhawari, 2012, p.19; Widyastuti, 2010, p.13).Related to government policy changes about the graduation requirement, teachers in low level school were easier affected by policy changes in preparing students to face national exam than teachers in high level school (Saukah & Cahyono, 2015, p. 243). The test has had negative effect on the curriculum implementation. National exam played central role in school program and affect every activity in school. Because of stress due to exams, the teachers cannot implement all teaching and learning methods to improve students’ interest. Teaching and learning method used by teachers wasn’t considering students understanding. Its test also make teachers must be selective in learning content. Integration of life skills in different subjects are also ignored (Boit, Njoki, & Chang'ach, 2012, p.182). METHODS This research was ex-post facto research. It is because of subjects in this study were not given treatment or manipulation to variables. This research was conducted by survey method. The research question about the percentage of students who agree and disagree with the policy of the national exam related to the graduation references that influence of readiness, motivation, and math score of national test in high school students in Ngawi was answered by quantitative descriptive. The population of this research was all class XII high school students in Ngawi. There were 2637 students from 13 high schools and 6 Islamic schools. The sample of this research was some high school students in Ngawi as
The Online Journal of New Horizons in Education - July 2017 Volume 7, Issue 3
www.tojned.net Copyright © The Online Journal of New Horizons in Education 59
many as 364 students from six schools. This study was conducted from March – May, 2016. The sampling technique was stratified random sampling to categorize the schools based on mathematics national examination scores in 2014/2015. There are six schools were chosen twelve classes using cluster random sampling technique. There are two classes in each school. Variables in this study were readiness, motivation, school test score, and mathematics national examination scores. Readiness was a condition influenced by the level of maturity, knowledge, and skills to achieve the students’ expectations to learn something. In this study, students’ readiness defined as students condition related to their knowledge as a form of their maturity in national examination. Motivation was students’ internal and external encouragement, enthusiasm, effort, and persistence to change their behavior to achieve certain goals. School test score were combined among the student’s average score in third to fifth semester. The percentage of student’s report score was 30% to 70%, while for the national exam was 30% to 50%. The percentage of school test score was 100%. The national examination score of mathematics was a pure score obtained learners in national exam. National test scores were secondary data. Instruments in this research were test of student’s readiness that consists of 40 questions multiple-choice test for science and social class and motivation questionnaire. Data of student’s readiness were obtained using test. Motivation questionnaire consisted of 25 items statements. Data of school test score and mathematics national examination is gotten from the school directly. Content validity was used in this study to prove the validity of the readiness test and motivation questionnaire based on experts judgments. Construct validity was used to prove the validity of the questionnaires. Based on the construct validity exploratory concluded that motivation questionnaire was valid. By using SPSS 20.0, the reliability coefficient was 0.80. Due to the reliability coefficient of readiness test and motivation questionnaire more than 0.6, it could be said that those tests were reliable.
The data analysis technique was used to analyze the data of readiness, motivation, and school test score, and mathematics national examination score. Beside that, it is also used to test the hypotheses of this study. Before testing the hypothesis, firstly need to test the assumption of normality and homogeneity test (multivariate and univariat).
Hypothesis test was used to determine whether there are differences in readiness, motivation, score of school and national test in group of agree and disagree response about national test scores become the only one graduation requirements. Hypothesis was testes by using MANOVA to see Hotteling's Trace significant value with the following formula:
(Huberty, 2006)
with: = Hotelling’s Trace = number of sample I = number of sample II
= average vector = invers covariance matrix.
After obtaining Hotelling's value, then its value was transformed to get value of distribution F with the following formula:
(Steven, 2009)
P was the number of dependent variables. The criterion of the test was Ho was rejected if the significance value is less than 0.05. Hypotheses were used to determine whether there are differences in readiness, motivation, score of school and national test in the agreed and disagreed group about national test scores as the only one graduation requirements as follows:
The Online Journal of New Horizons in Education - July 2017 Volume 7, Issue 3
www.tojned.net Copyright © The Online Journal of New Horizons in Education 60
Ho: There is no difference in readiness, motivation, and mathematics national examination scores between agreed and disagreed groups. H1: There is difference in readiness, motivation, and mathematics national examination scores between agreed and disagreed groups.
After using MANOVA and there is difference, then it was followed by independent samples t-test to determine which variable that has differences. Before testing by independent test, it should be formulated hypotheses. Hypotheses used to determine whether each variable has a difference or not as follows: 1) H0: (there is no difference between readiness of the students’ group who agree and disagree
with the policy that the score of national examination as determinant of graduation). H1: (there are differences between readiness of students’ group who agree and disagree with the policy that the score of national examination as determinant of graduation).
2) H0: (there is no difference between motivations of students’ group who agree and disagree with the policy that the score of national examination as determinant of graduation). H1: (there are differences between motivations of students group who agree and disagree with the policy that the score of national examination as determinant of graduation).
3) H0: (there is no difference between the score of mathematics school test of students’ group who agree and disagree with the policy that the score of national examination as determinant of graduation). H1: (there are differences between the score of mathematics school test of students’ group who agree and disagree with the policy that the score of national examination as determinant of graduation).
4) H0: (there is no difference between score of mathematics national examination of students’ groups who agree and disagree with the policy that the score of national examination as determinant of graduation). H1: (There are differences between score of mathematics national examination of students’ groups who agree and disagree with the policy that the score of national examination as determinant of graduation).
The test statistic that be used to test these hypotheses by using independents sample t-test with the following formula:
(Stevens, 2009)
= average value of sample I = average value of sample II = variance of sample I = variance of sample I = the number of samples I = the number of sample II
The decision criterion of the test was Ho is rejected if the value of with p is the number
of dependent variables. After knowing which variables are having differences, to determine which group has readiness, motivation, school test score, and national test. The hypotheses are follows:
1) H0 :
H1:
2) H0 :
H1:
3) H0 :
H1:
4) H0 :
The Online Journal of New Horizons in Education - July 2017 Volume 7, Issue 3
www.tojned.net Copyright © The Online Journal of New Horizons in Education 61
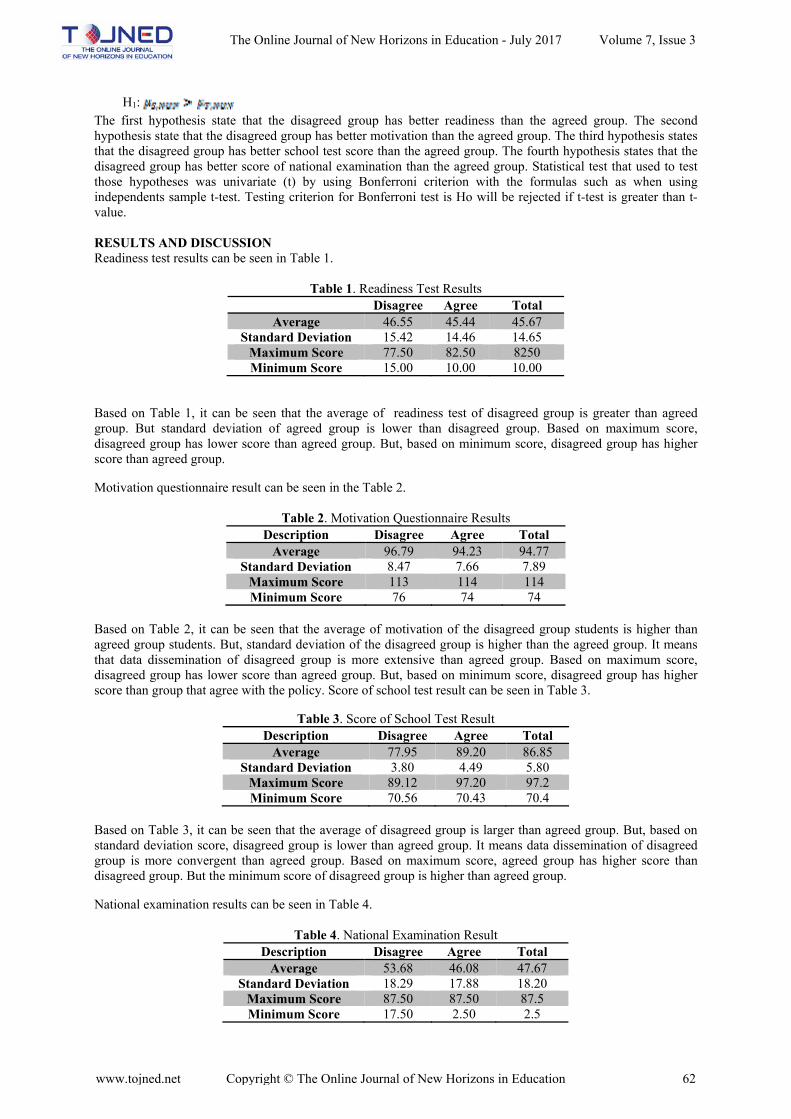
H1: The first hypothesis state that the disagreed group has better readiness than the agreed group. The second hypothesis state that the disagreed group has better motivation than the agreed group. The third hypothesis states that the disagreed group has better school test score than the agreed group. The fourth hypothesis states that the disagreed group has better score of national examination than the agreed group. Statistical test that used to test those hypotheses was univariate (t) by using Bonferroni criterion with the formulas such as when using independents sample t-test. Testing criterion for Bonferroni test is Ho will be rejected if t-test is greater than t-value. RESULTS AND DISCUSSION Readiness test results can be seen in Table 1.
Table 1. Readiness Test Results Disagree Agree Total
Average 46.55 45.44 45.67 Standard Deviation 15.42 14.46 14.65
Maximum Score 77.50 82.50 8250 Minimum Score 15.00 10.00 10.00
Based on Table 1, it can be seen that the average of readiness test of disagreed group is greater than agreed group. But standard deviation of agreed group is lower than disagreed group. Based on maximum score, disagreed group has lower score than agreed group. But, based on minimum score, disagreed group has higher score than agreed group.
Motivation questionnaire result can be seen in the Table 2.
Table 2. Motivation Questionnaire Results Description Disagree Agree Total
Average 96.79 94.23 94.77 Standard Deviation 8.47 7.66 7.89
Maximum Score 113 114 114 Minimum Score 76 74 74
Based on Table 2, it can be seen that the average of motivation of the disagreed group students is higher than agreed group students. But, standard deviation of the disagreed group is higher than the agreed group. It means that data dissemination of disagreed group is more extensive than agreed group. Based on maximum score, disagreed group has lower score than agreed group. But, based on minimum score, disagreed group has higher score than group that agree with the policy. Score of school test result can be seen in Table 3.
Table 3. Score of School Test Result Description Disagree Agree Total
Average 77.95 89.20 86.85 Standard Deviation 3.80 4.49 5.80
Maximum Score 89.12 97.20 97.2 Minimum Score 70.56 70.43 70.4
Based on Table 3, it can be seen that the average of disagreed group is larger than agreed group. But, based on standard deviation score, disagreed group is lower than agreed group. It means data dissemination of disagreed group is more convergent than agreed group. Based on maximum score, agreed group has higher score than disagreed group. But the minimum score of disagreed group is higher than agreed group.
National examination results can be seen in Table 4.
Table 4. National Examination Result Description Disagree Agree Total
Average 53.68 46.08 47.67 Standard Deviation 18.29 17.88 18.20
Maximum Score 87.50 87.50 87.5 Minimum Score 17.50 2.50 2.5
The Online Journal of New Horizons in Education - July 2017 Volume 7, Issue 3
www.tojned.net Copyright © The Online Journal of New Horizons in Education 62

Based on Table 4, it can be seen that the average of disagreed group is higher than agreed group. But, disagreed group has lower standard deviation than agreed group. It means that data dissemination of disagreed group is more convergent than agreed group. Based on maximum score, disagreed group has same score with agreed group. But, based on minimum score, disagreed group is higher than agreed group.
Based on the data, it continued with hypothesis test to determine whether or not differences in readiness, motivation, school test score, and national examination test scores. Hypothesis test used MANOVA test. Using SPSS 20.0 was obtained the result in Table 5.
Table 5. MANOVA test Test F Sig
Hoteling’s Trace 152.282 0.0000 Based on Table 5, it can be seen that F- value is less than 0.05. It is 0.000. It means that there are differences in readiness, motivation, school test score, and national examination test between agreed group and disagreed group. Furthermore, it continued by testing the data to determine which one of the variable that has differences. The test used independent samples t-test. The result is in Table 6.
Table 6. Results of Independent Samples T-test Aspects
Specification
Readiness 0.59 2.51 H0 accepted Motivation 2.53 2.51 H0 rejected
School test score 24.50 2.51 H0 rejected National Examination Score 3.28 2.51 H0 rejected
Based on Table 6, it can be seen that readiness result is 0.59. It is greater than 2.51. Because of t-test is greater than t-value, it can be concluded that the Ho accepted. It means that there is no difference between both of groups. Meanwhile, the t-test result of motivation variable, school test score, and national examination score are greater than t-value. It can be concluded that there are differences for each variable motivation, school test score, and national examination scores significantly between the disagreed groups and agreed group. Based on the average of readiness variable, the both of two groups have little difference average. It is 1.11. It is caused the lack of difference readiness between disagreed groups and agreed group. The conclusion, there is no significant differences in readiness between the both of two groups. Another fact is the average score of the both of groups readiness is relatively low. It is less than 55. Based on the data, there are different of motivations, school test score, and mathematics national examination scores. It was continued by using t-test Bonferroni. Using SPSS 20.0 was obtained the results in Table 7.
Table 7. Results of t-test Bonferroni Variable t-Bonferroni
Decision
Motivation 2.50 2.41 H0 rejected School test score -24.50 2.41
H0 accepted National Examination Score 3.28 2.41 H0 rejected
Based on Table 7, it can be seen that the result of t-test for motivation variable is greater than t-value. It is conclude that Ho is rejected. It means that disagreed group has better motivation than the agreed group. Based on t-test result of school test score, it is less than t-value. It can be concluded that the Ho is accepted. It means that school test score of agreed group is better than disagreed group. Meanwhile, the t-test result of national examination scores variable is greater than t-value. It can be concluded that disagreed group has better score than agreed group. Based on motivation data, disagreed group has higher score than agreed group. Disagreed group is more dominated by high school category. Disagreed group average is 96.70. It is greater than agreed group that is 92.65. The standard deviation of disagreed group is lower than agreed group. Students’ learning motivations can be seen from the cognitive aspect (Elliot, 2000). One of cognitive aspect is students’ effort. It is also supported by Ormrod (2003), one of the effects of motivation is increasing effort and energy. In the case of national policies that related to the graduation of examination, disagreed group tend to have a high effort in school test
The Online Journal of New Horizons in Education - July 2017 Volume 7, Issue 3
www.tojned.net Copyright © The Online Journal of New Horizons in Education 63
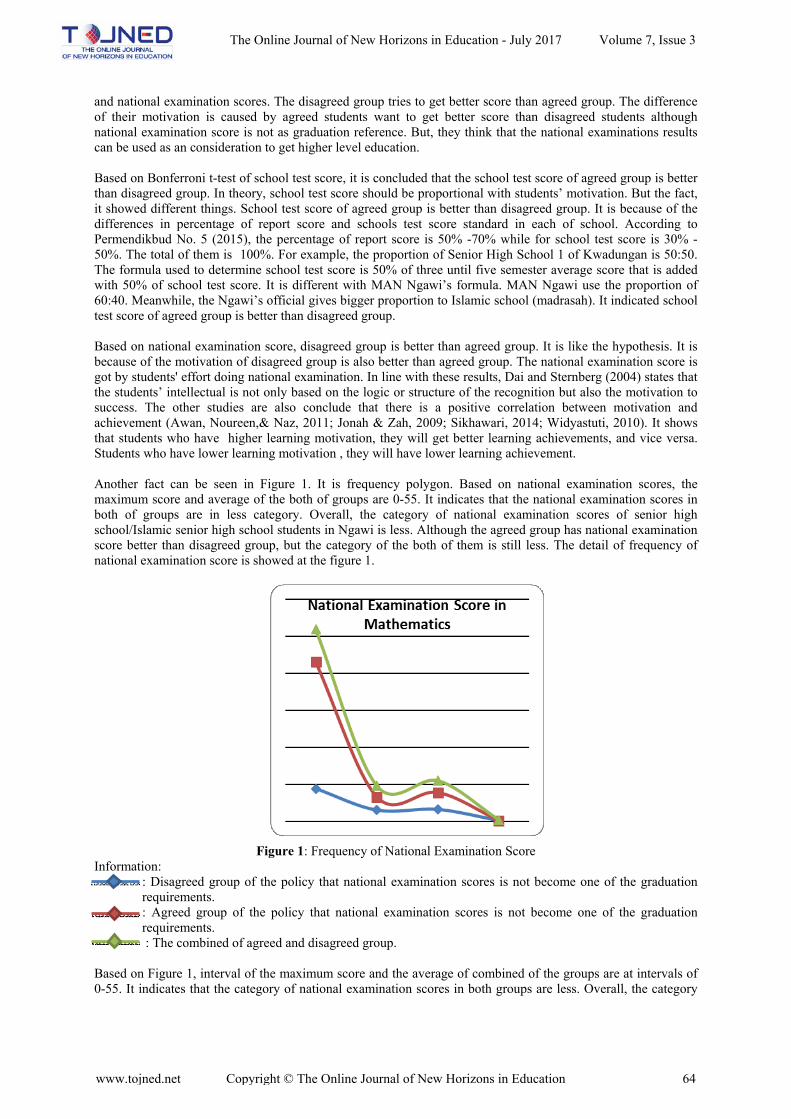
and national examination scores. The disagreed group tries to get better score than agreed group. The difference of their motivation is caused by agreed students want to get better score than disagreed students although national examination score is not as graduation reference. But, they think that the national examinations results can be used as an consideration to get higher level education. Based on Bonferroni t-test of school test score, it is concluded that the school test score of agreed group is better than disagreed group. In theory, school test score should be proportional with students’ motivation. But the fact, it showed different things. School test score of agreed group is better than disagreed group. It is because of the differences in percentage of report score and schools test score standard in each of school. According to Permendikbud No. 5 (2015), the percentage of report score is 50% -70% while for school test score is 30% -50%. The total of them is 100%. For example, the proportion of Senior High School 1 of Kwadungan is 50:50. The formula used to determine school test score is 50% of three until five semester average score that is added with 50% of school test score. It is different with MAN Ngawi’s formula. MAN Ngawi use the proportion of 60:40. Meanwhile, the Ngawi’s official gives bigger proportion to Islamic school (madrasah). It indicated school test score of agreed group is better than disagreed group. Based on national examination score, disagreed group is better than agreed group. It is like the hypothesis. It is because of the motivation of disagreed group is also better than agreed group. The national examination score is got by students' effort doing national examination. In line with these results, Dai and Sternberg (2004) states that the students’ intellectual is not only based on the logic or structure of the recognition but also the motivation to success. The other studies are also conclude that there is a positive correlation between motivation and achievement (Awan, Noureen,& Naz, 2011; Jonah & Zah, 2009; Sikhawari, 2014; Widyastuti, 2010). It shows that students who have higher learning motivation, they will get better learning achievements, and vice versa. Students who have lower learning motivation , they will have lower learning achievement. Another fact can be seen in Figure 1. It is frequency polygon. Based on national examination scores, the maximum score and average of the both of groups are 0-55. It indicates that the national examination scores in both of groups are in less category. Overall, the category of national examination scores of senior high school/Islamic senior high school students in Ngawi is less. Although the agreed group has national examination score better than disagreed group, but the category of the both of them is still less. The detail of frequency of national examination score is showed at the figure 1.
Figure 1: Frequency of National Examination Score Information:
: Disagreed group of the policy that national examination scores is not become one of the graduation requirements. : Agreed group of the policy that national examination scores is not become one of the graduation requirements. : The combined of agreed and disagreed group.
Based on Figure 1, interval of the maximum score and the average of combined of the groups are at intervals of 0-55. It indicates that the category of national examination scores in both groups are less. Overall, the category
The Online Journal of New Horizons in Education - July 2017 Volume 7, Issue 3
www.tojned.net Copyright © The Online Journal of New Horizons in Education 64
of national test scores of senior high school / Islamic high school students in Ngawi are in the less. Although the agreed group has national examination score better than disagreed group, but their category are still less. In this study, researcher is also focus on the correlation between the school test score and national examination score. It is because the results show that the school test score of disagreed group is better than agreed group agreed. Besides that, the national examination score of agreed group is better than disagreed group. The result if correlation analysis shows that correlation coefficient between school test score and national examination scores is -0.175. Based on the result, it means that there is not a high correlation between school test score and national examination score. It indicates that the difference in school test score and national examination score are not based on the classification of students who agree and disagree about the policy. The differences can be caused by internal factors that influence achievement, such as interests, independent learning, self-efficacy, curiosity, the ability to think critically or creativity. As for external factors that influence the differences between school test score and national examination score are students’ condition in each schools. It also causes the difference between school test score and national examination score. Based on the data, it can be concluded that the category of national examination scores of high school students/Islamic high school students in Ngawi are less. Based on the fact, the results of national examination of high school students/Islamic high school students in Ngawi declined nationally. But, national examination score increased. It can be said that the category of input or students’’ condition of high school students/Islamic high school in Ngawi is less. CONCLUSIONS Students who disagreed with national examination score do not become one of the graduation requirements is 76 students, or 20.88%. Students’ who agreed is 288 students or 79.12%. There is a difference (simultaneously) between readiness, motivation, school test score, and mathematics national examination scores of students who agree and disagree with national test scores do not become one of the graduation requirements. Besides that, there is no difference readiness of agreed and disagreed students. But, there are differences in motivation, school test score, and mathematics national examination scores of agreed and disagreed students. Next analysis concluded that motivation and national examination scores of disagreed group is better than agreed group. School test score of agreed group is better than disagreed group. SUGGESTIONS Based on data, the readiness score of the groups is under 55. It is suggested to the school that should apply methods that can trigger students' reasoning. Students are not only given the exercise in understanding and application level, but also reasoning abilities level. It is also recommend that students should have good readiness although the national examination is not as a graduation reference. The impact is they will get good score in national examination scores. It is because the national examination scores can be used for mapping the quality of programs and / or the education unit, consideration of selection to get next education level, consideration in the development and delivery of aid education to improve the quality of education. In the next study, it is should made a case study of students who has highest and lowest readiness, motivation, school test score, and national examination scores in mathematics. The aim is to dig directly the unique things that may be used as research findings. Another suggestion is to enlarge the population that is residency of Madiun in order to see a larger influence of the policy that related to the graduation reference. It will become an evaluation for the authorities to determine the national examination policy.
REFERENCES Saukah, A., & Cahyono, A.E. (2015). National exams in Indonesia and its implications for learning English.
Journal of Educational Evaluation and Research, 19, 243-255. Amri, M: S., & Abadi, A.M. (2013). Effect of PMR with IGT to motivation, attitude, and problem solving skills
geometry class VII. Pythagoras: Journal of Mathematics Education, 8 (1), 55-68. Awan, R.U.N., Noureen, G., & Naz, A. (2011). A study of relationship between achievement motivation, self-
concept and achievement in English and mathematics at the secondary level. Journal of International Education Studies, 3 (3), 72-79.
Aziz., & Sugiman. (2015). Analysis of cognitive difficulties and affective problems high school students in learning math national exams. Mathematics Education Research Journal, 2 (2), 162-174.
Baden, M: S., & Major, C.H. (2004). Foundations of problem-based learning. Oxford: Open University Press. Boit, M., Njoki, S.A., Chang'ach, J. K. (2012). The influence of examinations on the stated curriculum goals.
Journal of Contemporary Research, 2 (2). 179-182. Dai, D.Y., & Sternberg, R. J. (2004). Motivation, emotion, and cognition. New Jersey, NJ: Lawrence Erlbaum
Associates. Elliot, S.N., Kratochwill, T.R., & Cook, J.L. (2000). Educational psychology; Effective teaching, effective
learning (3rd ed). Boston, MA: Mc Graw Hill.
The Online Journal of New Horizons in Education - July 2017 Volume 7, Issue 3
www.tojned.net Copyright © The Online Journal of New Horizons in Education 65
Elliot, J.G, et al (2005). Motivation, engagement, and educational performance. New York, NY: Palgrave Macmillan.
Evans, Linda. (1999). Managing to motivate: A guide for school leaders. London: Casell. Farhan, M., & retnawati, H. (2014). The effectiveness of PBL and IBL in terms of student achievement, the
ability of a mathematical representation, and motivation to learn. Mathematics Education Research Journal, 1 (2), 227-240.
Huberty, C. J., & Olejnik, S. (2006). Applied MANOVA and discriminant analysis. New Jersey, NJ: John Wiley & Sons, Inc.
Kemendikbud. (2013). Peraturan menteri pendidikan dan kebudayaan Republik Indonesia nomor 66 tahun 2013 tentang standar penilaian pendidikan.
Kemendikbud. (2015). Peraturan menteri pendidikan dan kebudayaan Republik Indonesia nomor 5 tahun 2015 tentang kriteria kelulusan peserta didik, penyelenggaraan ujian nasional, dan penyelenggaraan ujian sekolah/madrasah/pendidikan kesetaraan pada smp/mts atau yang sederajat dan sma/ma/smk atau yang sederajat.
Miller, M. D. (2009). Measurement and assessment in teaching. New Jersey, NJ: The Lehigh Press, Inc. Mubeen, S., Saeed, S., & Arif, M.H. (2013). An investigaton the gender difference into the status of intrinsic
motivation towards learning science among intermediate science students. Journal of humanities and social sience, 10 (6), 81-85.
Mustofik Slamet. (2011). Analysis of policy implementation at the national examinations upper secondary school level (SMA) in Jakarta city center. Master's thesis, unpublished.Jakarta: University of Indonesia
Ormrod, J.E. (2003). Educational psycology developing learners (4rd ed.). New Jersey, NJ: Pearson Education. Widyastuti, R. (2010). The relationship between motivation to learn and the results of intelligence tests and
academic achievement. Master's thesis, unpublished. Surakarta: Sebelas Maret University. Santrock, John W. (2014). Educational psychology. (Translated by Harya Bhimasena). Jakarta: Salemba
Humanika Schunk, D.H., Pintrich, P.R., Meece, J.L. (2010). Motivation in education: Theory, research, and
applications.Upper Saddle River, NJ: Pearson Education Stevens, J.P. (2009). Applied multivariate statistics for the social sciences. New York, NY: Routledge. Trisnawati., & Wutsqa, D.U. (2015). Comparison of the effectiveness of quantum teaching and learning of
mathematics IGT in terms of achievement and motivation. Mathematics Education Research Journal, 2 (2), 297-307.
The Online Journal of New Horizons in Education - July 2017 Volume 7, Issue 3
www.tojned.net Copyright © The Online Journal of New Horizons in Education 66