Embed Size (px)
Citation preview
1
The Effect of Materials Architecture in TiO2/MOF Composites on
CO2 Photoreduction and Charge Transfer
Angus Crakea, Konstantinos C. Christoforidisa⊥, Aoife Gregg a, Benjamin Mossb, Andreas Kafizasb
,
Camille Petit*a
a Barrer Centre, Department of Chemical Engineering, Imperial College London, South Kensington
Campus, London SW7 2AZ, UK
b Department of Chemistry, Imperial College London, South Kensington Campus, London SW7
2AZ, UK
⊥Current address: Department of Environmental Engineering, Democritus University of Thrace,
Xanthi, Greece
* E-mail: [email protected]; Phone: +44 (0)20 7594 3182 (Petit C.)
2
Abstract
CO2 photoreduction to C1/C1+ energized molecules is a key reaction of solar fuel technologies.
Building heterojunctions can enhance photocatalysts performance, by facilitating charge transfer
between two heterojunction phases. The material parameters that control this charge transfer remain
unclear. Here, we hypothesize that governing factors for CO2 photoreduction in gas phase are: (i) a
large porosity to accumulate CO2 molecules close to catalytic sites and (ii) a high number of ‘points
of contact’ between the heterojunction components to enhance charge transfer. The former
requirement can be met by using porous materials, the latter requirement by controlling the
morphology of the heterojunction components. Hence, we built composites of titanium oxide or
titanate and metal-organic framework (MOF), a highly porous material. TiO2 or titanate nanofiber
were synthesized and MOF particles were grown on the fibers. All composites produced CO under
UV-vis light, using H2 as reducing agent. They are more active than their component materials: ~9
times more active than titanate. The controlled composites morphology is confirmed and transient
absorption spectroscopy highlight charge transfer between the composite components. We
demonstrate that electrons transfer from TiO2 into the MOF, and holes from the MOF into TiO2, as
the MOF induces band bending in TiO2.
Keywords: metal organic frameworks; titanium dioxide; photocatalysis; CO2 reduction;
heterojunction
3
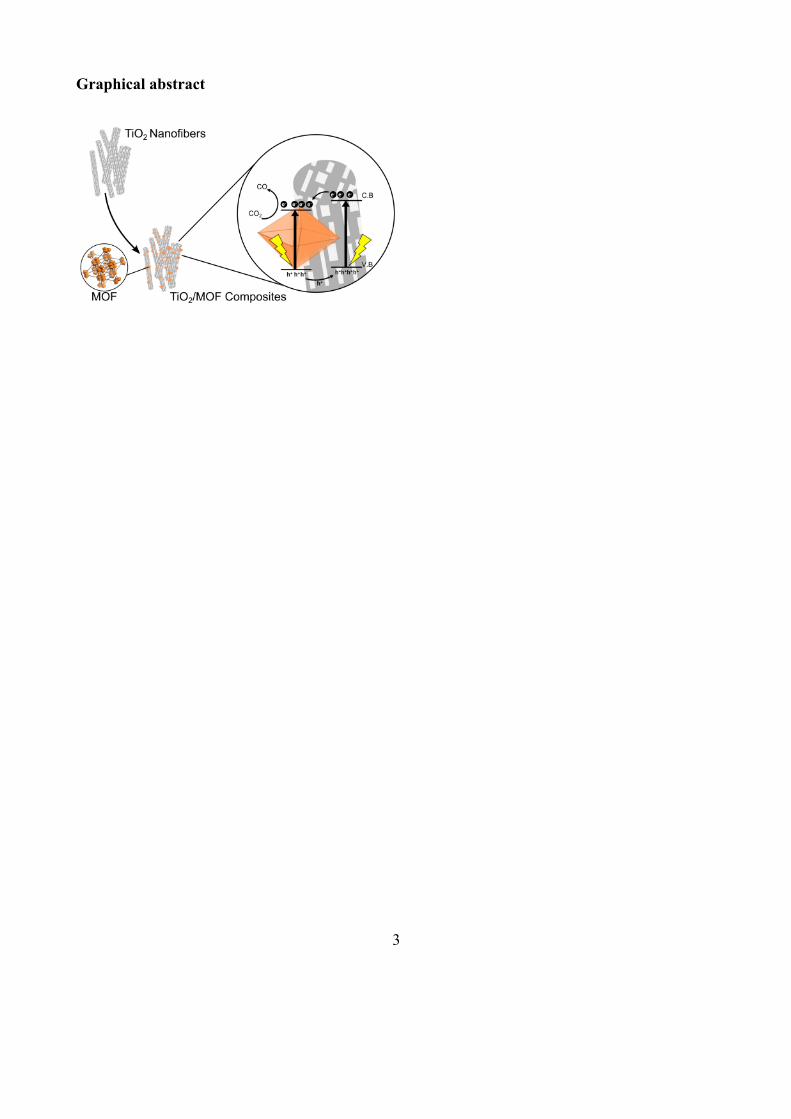
Graphical abstract
4
1 Introduction
Driven by strong environmental incentives to diversify our energy portfolio and increase the share
of renewables, researchers need to identify efficient routes towards solar fuels production. Solar
fuels refer to fuels produced by action of sunlight, particularly H2 produced from water and C1 or
C1+ energized molecules (i.e. CO, CH4, CH3OH) produced from CO2.[1] The latter reaction, i.e. CO2
photoreduction, is the focus of this study. Photocatalysis represents one route towards CO2
photoreduction. In that case, the design and manufacturing of a cost-effective, sustainable, efficient
and robust photocatalyst is of paramount importance and remains a highly challenging task
combining aspects of materials science, photochemistry and reactor design engineering.
The most widely researched photocatalysts for CO2 reduction are semiconductors. Of which, TiO2
has inspired intense research since the first demonstration in 1972,[2] owing to its high stability, low
cost, and non-toxic nature. These studies have shown that the TiO2 morphology (e.g. 1D structures),
crystalline form (e.g. anatase, rutile, brookite, and titanate), and composition (e.g. heterojunction,
heterostucture formation) all are critical factors for improved photocatalytic activity.[3] Another
example of semiconductor, considered as a derivative of titania, is titanate. Titanate materials are
photocatalytically active, with a crystalline structure similar to anatase TiO2 and a one-dimensional
morphology. Compared to conventional TiO2, they exhibit attractive properties for photocatalysis
such as a high surface area, a well-defined morphology, an improved photogenerated charge
separation, and a small bandgap.[4] Titanates have been used for photocatalysis,[5] and in particular,
we note two studies on CO2 photoreduction.[6] Recent photocatalytic improvements routes using
titanate – not limited to CO2 photoreduction – include the formation of composite materials for
improved charge separation,[4b, 5d, 7] and the conversion to a mixed phase anatase/titanate material
hydrothermally, whilst retaining the fiber morphology.[8] Specifically, mixed phase TiO2 can
5
enhance charge separation and catalytic activity.[9] Despite these improvements, the photocatalytic
activity of TiO2 remains below acceptable levels for large scale deployment due to its large
bandgap, rapid photogenerated charge recombination, and low CO2 adsorption capacity.[10]
Metal organic frameworks (MOFs) have also recently been explored as photocatalysts for CO2
reduction, with their chemical and structural modularities allowing a systematic and flexible design
of the photocatalyst. For details on these studies, we direct the readers towards these reviews: [11].
The UiO-66 MOF family has been utilised most widely due to its chemical stability, visible light
absorption, and straightforward synthesis.[12] The formation of MOF composites with other
photocatalysts, notably TiO2, can increase photocatalytic activity owing to a synergistic effect
between the coupled materials.[13] Li et al.[13a] synthesized TiO2 nanoparticles onto HKUST-1 to
form a TiO2@HKUST-1 composite with superior photocatalytic activity in CO2 reduction. We
recently showed TiO2/NH2-UiO-66 nanocomposites with controlled MOF content can enhance CO2
adsorption capacity and photocatalytic activity.[14] In both studies the formation of a heterojunction
to facilitate charge separation as evidenced by transient absorption spectroscopy led to higher
activity. Taking into account the findings from our previous work, we hypothesised that controlling
the interface between titania and MOF particles, and therefore the morphology of the respective
particles, would influence the photoreduction of CO2. In particular, we expect that increasing the
number of ‘points of contact’ between the two materials will further improve the charge separation
and transfer.
Herein, we report a study dedicated to testing the above hypothesis. Specifically, we synthesized
nanocomposites of titanium oxide nanofibers with NH2-UiO-66 for combined CO2 capture and
photocatalytic conversion. We selected these two materials to couple the high photocatalytic ability
of the TiO2 component with the high CO2 adsorption capacity of the MOF. Additionally, the MOF
6
high CO2 adsorption capacity should increase the CO2 concentation close to the TiO2 catalytic sites.
To study the TiO2-MOF interaction for CO2 conversion, the MOF loading, TiO2 morphology, and
TiO2 phase were controlled. We selected a 1D nanofibers morphology for the TiO2 phase, and grew
the MOF particles in-situ on top of these preformed fibers (Scheme 1) to maximise efficient charge
transfer. We used a microwave-antenna synthesis to induce “super-hot” dots on the TiO2 fibers for
TiO2/MOF composite formation.[15] We opted for this rapid technique owing to its low energy
requirements and its ability to promote MOF formation directly on the fiber leading to strong
TiO2/MOF interactions.[16] We studied the nanocomposites using various analytical, imaging, and
spectroscopic techniques and were evaluated for CO2 adsorption and photocatalytic reduction. We
report for the first time the synthesis and application of these materials for photocatalytic CO2
reduction using H2 or H2O as sacrificial agents in a gas-solid heterogeneous system under
UV-visible irradiation.
2 Results and Discussion
2.1 TiO2 nanofibers and NH2-UiO-66 nanocomposites formation
A schematic of the composites synthesis routes is provided in Scheme 1. Overall, we used a
microwave-assisted synthesis to form NH2-UiO-66 particles on the surface of preformed titanate
fibers. The temperature was kept relatively low (80°C) to suppress NH2-UiO-66 formation in the
bulk solution. Instead, we grew NH2-UiO-66 particles directly on the TiO2 fibers via the creation of
microwave induced by the “super-hot” dots on the TiO2 [15a] – Scheme 1 route a. To study and
optimise the titanate:NH2-UiO-66 composites for photocatalytic CO2 reduction, we varied the
quantity of titanate present in the synthesis. The composites are denoted as t-x-MOF, where x is the
quantity in mg of titanate used and MOF is NH2-UiO-66. We attempted to improve further the
7
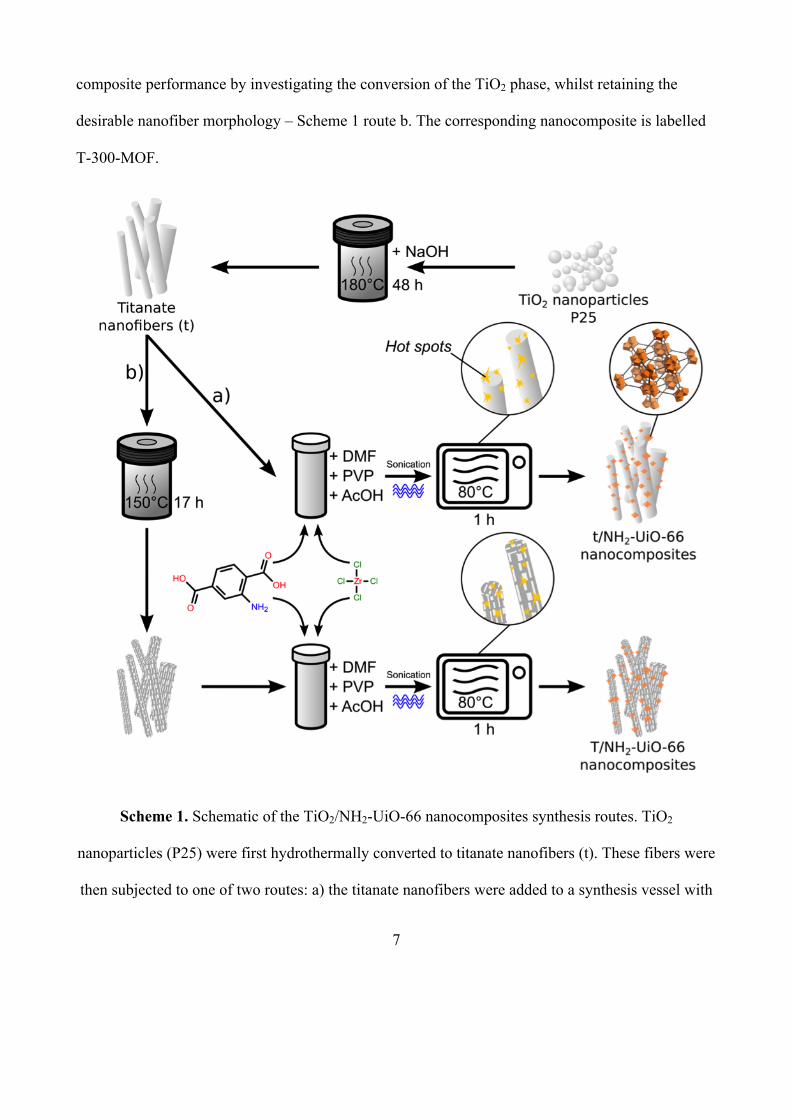
composite performance by investigating the conversion of the TiO2 phase, whilst retaining the
desirable nanofiber morphology – Scheme 1 route b. The corresponding nanocomposite is labelled
T-300-MOF.
Scheme 1. Schematic of the TiO2/NH2-UiO-66 nanocomposites synthesis routes. TiO2
nanoparticles (P25) were first hydrothermally converted to titanate nanofibers (t). These fibers were
then subjected to one of two routes: a) the titanate nanofibers were added to a synthesis vessel with
8
NH2-UiO-66 precursors and heated using microwaves to 80°C to form t/NH2-UiO-66 composites;
b) the titanate nanofibers were converted to anatase phase nanofibers (T) hydrothermally, these
were then added to a synthesis vessel and heated using microwaves to form T/NH2-UiO-66
composites. The microwave induced hot spots on the TiO2 promoted direct growth of the MOF on
the fibers.
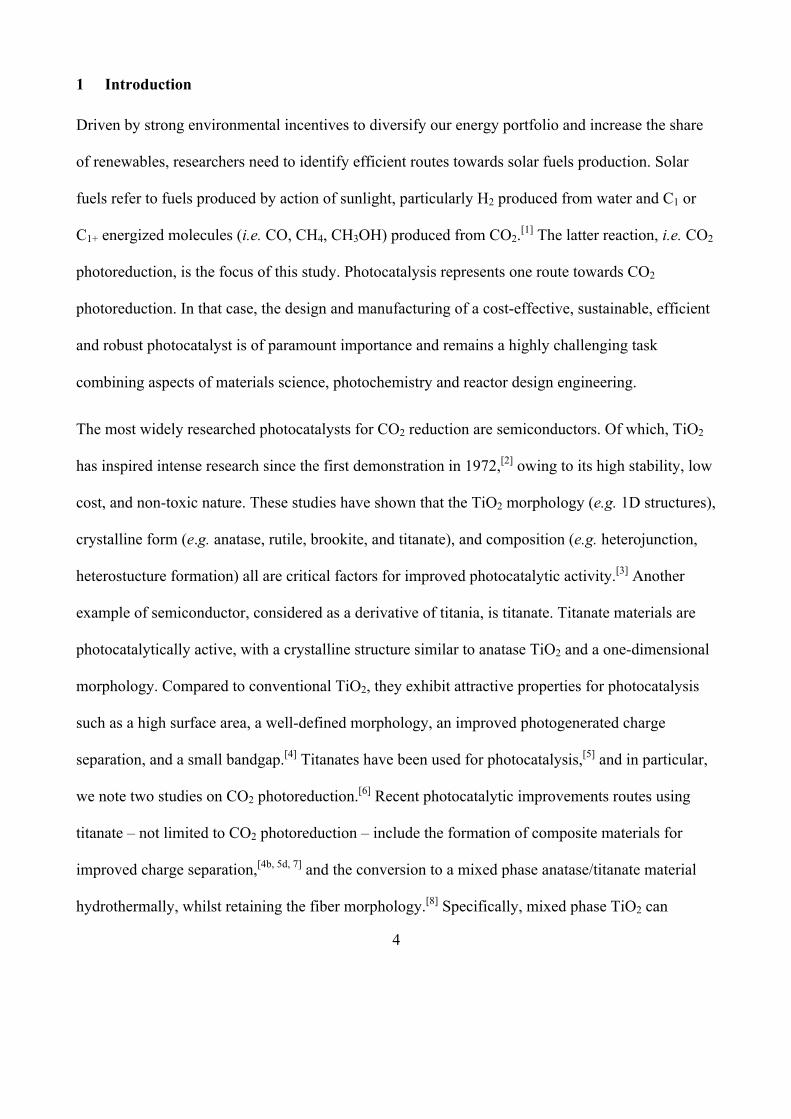
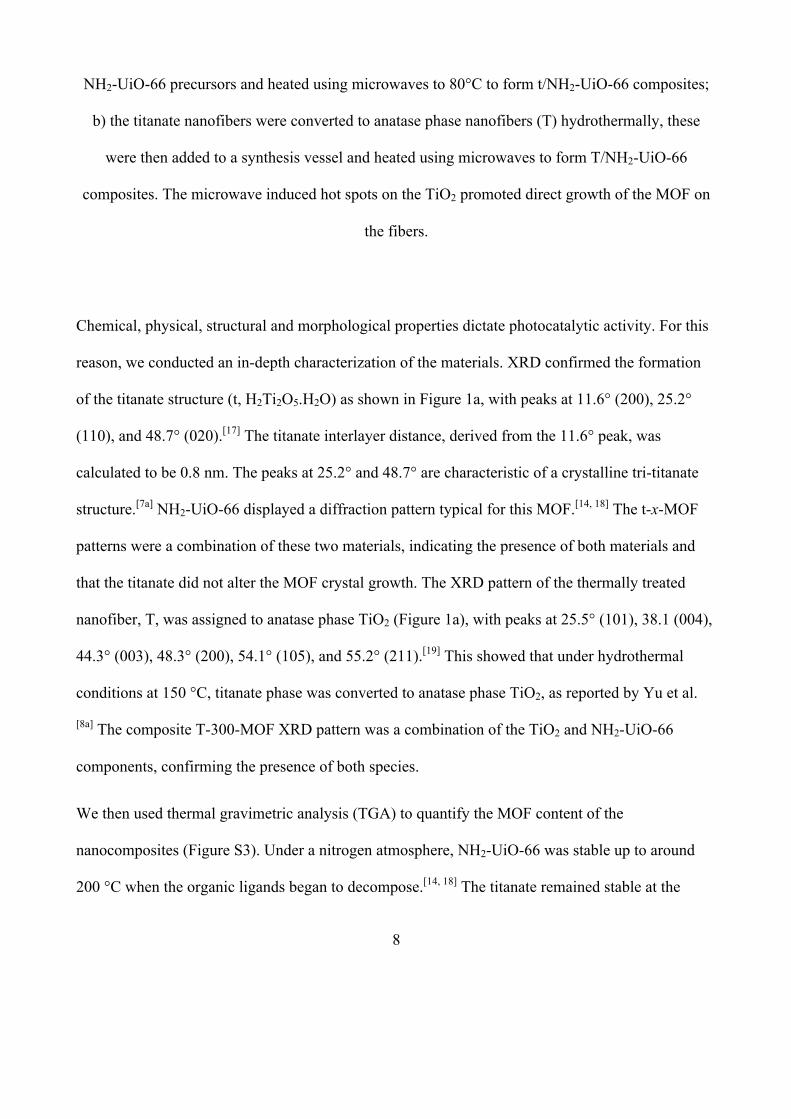
Chemical, physical, structural and morphological properties dictate photocatalytic activity. For this
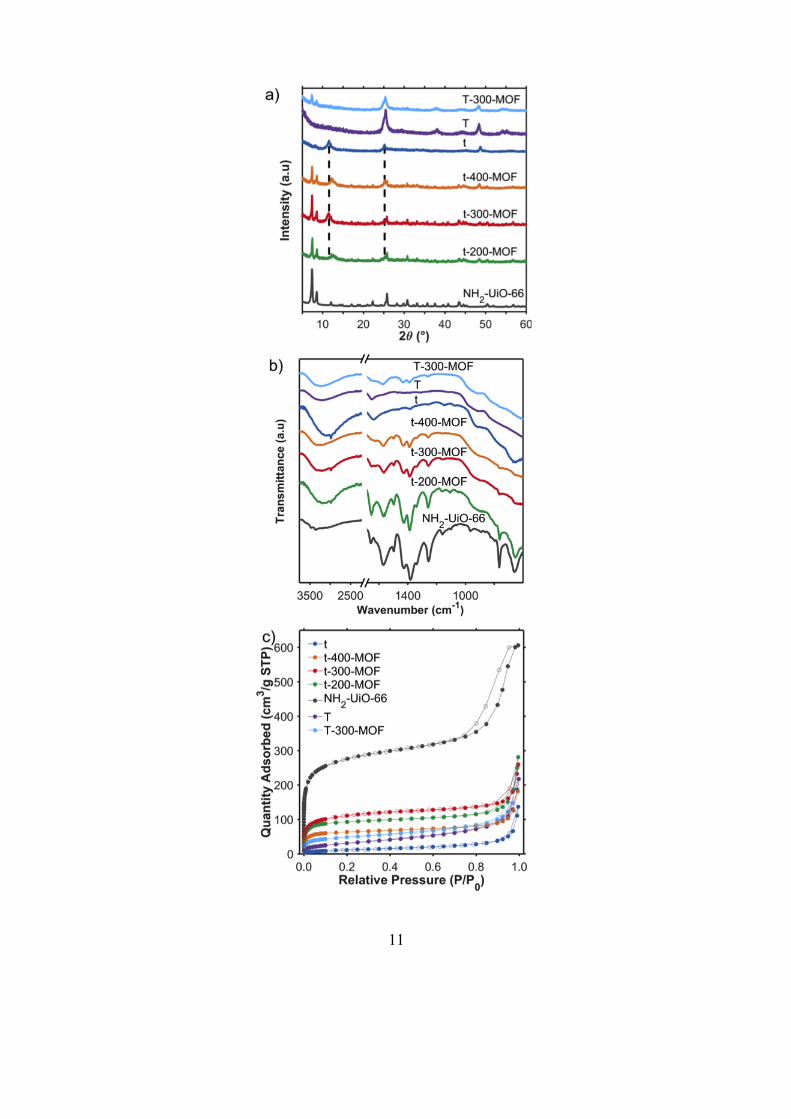
reason, we conducted an in-depth characterization of the materials. XRD confirmed the formation
of the titanate structure (t, H2Ti2O5.H2O) as shown in Figure 1a, with peaks at 11.6° (200), 25.2°
(110), and 48.7° (020).[17] The titanate interlayer distance, derived from the 11.6° peak, was
calculated to be 0.8 nm. The peaks at 25.2° and 48.7° are characteristic of a crystalline tri-titanate
structure.[7a] NH2-UiO-66 displayed a diffraction pattern typical for this MOF.[14, 18] The t-x-MOF
patterns were a combination of these two materials, indicating the presence of both materials and
that the titanate did not alter the MOF crystal growth. The XRD pattern of the thermally treated
nanofiber, T, was assigned to anatase phase TiO2 (Figure 1a), with peaks at 25.5° (101), 38.1 (004),
44.3° (003), 48.3° (200), 54.1° (105), and 55.2° (211).[19] This showed that under hydrothermal
conditions at 150 °C, titanate phase was converted to anatase phase TiO2, as reported by Yu et al.
[8a] The composite T-300-MOF XRD pattern was a combination of the TiO2 and NH2-UiO-66
components, confirming the presence of both species.
We then used thermal gravimetric analysis (TGA) to quantify the MOF content of the
nanocomposites (Figure S3). Under a nitrogen atmosphere, NH2-UiO-66 was stable up to around
200 °C when the organic ligands began to decompose.[14, 18] The titanate remained stable at the
9
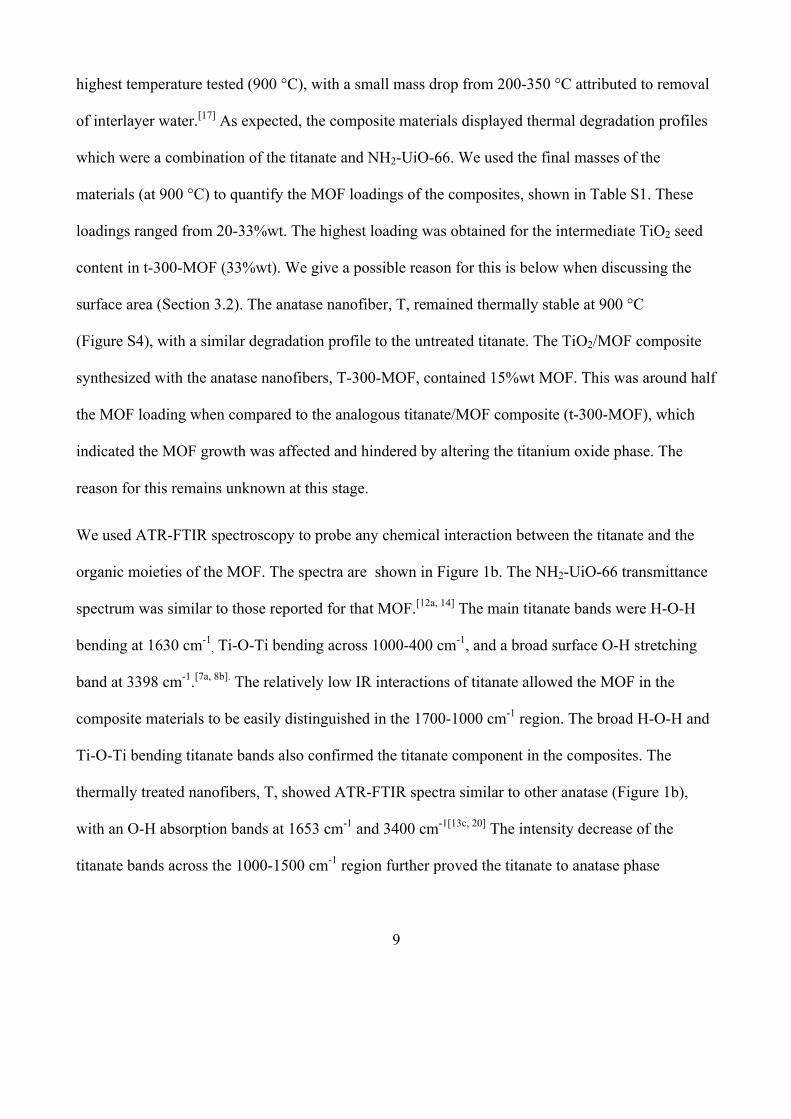
highest temperature tested (900 °C), with a small mass drop from 200-350 °C attributed to removal
of interlayer water.[17] As expected, the composite materials displayed thermal degradation profiles
which were a combination of the titanate and NH2-UiO-66. We used the final masses of the
materials (at 900 °C) to quantify the MOF loadings of the composites, shown in Table S1. These
loadings ranged from 20-33%wt. The highest loading was obtained for the intermediate TiO2 seed
content in t-300-MOF (33%wt). We give a possible reason for this is below when discussing the
surface area (Section 3.2). The anatase nanofiber, T, remained thermally stable at 900 °C
(Figure S4), with a similar degradation profile to the untreated titanate. The TiO2/MOF composite
synthesized with the anatase nanofibers, T-300-MOF, contained 15%wt MOF. This was around half
the MOF loading when compared to the analogous titanate/MOF composite (t-300-MOF), which
indicated the MOF growth was affected and hindered by altering the titanium oxide phase. The
reason for this remains unknown at this stage.
We used ATR-FTIR spectroscopy to probe any chemical interaction between the titanate and the
organic moieties of the MOF. The spectra are shown in Figure 1b. The NH2-UiO-66 transmittance
spectrum was similar to those reported for that MOF.[12a, 14] The main titanate bands were H-O-H
bending at 1630 cm-1, Ti-O-Ti bending across 1000-400 cm-1, and a broad surface O-H stretching
band at 3398 cm-1.[7a, 8b]. The relatively low IR interactions of titanate allowed the MOF in the
composite materials to be easily distinguished in the 1700-1000 cm-1 region. The broad H-O-H and
Ti-O-Ti bending titanate bands also confirmed the titanate component in the composites. The
thermally treated nanofibers, T, showed ATR-FTIR spectra similar to other anatase (Figure 1b),
with an O-H absorption bands at 1653 cm-1 and 3400 cm-1[13c, 20] The intensity decrease of the
titanate bands across the 1000-1500 cm-1 region further proved the titanate to anatase phase
10
conversion. The transmission spectrum of T-300-MOF confirmed the presence of both components
in the composite, with features of both T and NH2-UiO-66 visible.
X-ray photoemission spectrum from anatase nanorods (T) also indicated that annealing of titanate
(t) produced high purity TiO2. Indeed, Ti 2p core lines (Figure S5a) exhibited a doublet (458.5 eV,
464.3 eV) consistent with a single Ti4+ environment, split by spin-obit coupling.[21] The O 1s
spectrum confirmed the formation of TiO2 with the strongest emission peak arising from O2- anions
in the TiO2 lattice (529.8 eV, Figure S5c).[22] Like for other particulate TiO2 systems, we observed
small amounts of adventitious carbon on the TiO2 surface (C-C at 284.8 eV, C-O 288.1 eV, Figure
S5b; and C-O 532.1 eV, Figure S5c).[23] NH2-UiO-66 exhibited core line emission broadly
consistent with previous reports of this material.[14] We observed a single Zr4+ 3d environment (Zr
3d5/2 at 283 eV)[24] (Figure S6a). The carbon emission spectrum reflected the carbon oxidation
states in the linker: O=C-O at 288.9 eV and C-C at 284.8 eV and a less oxidised C-O environment
at 286.1 eV, Figure S6b). For the oxygen environment, we observed: a small peak with a binding
energy typical of oxide anions in a ZrO2 environment (i.e. a ZrO6 octahedral environment from the
MOF) (530.2 eV)[25] and a large peak at 532.0 eV consistent with the carboxyl groups in the linker.
T-300-MOF composite did not exhibit further chemical environments to those indicated above and
the Ti:Zr ratio of 8:1 measured by XPS was in line with that obtained from TGA (Figure S7 a-d).
Surprisingly, we note a strong shift to higher binding energy (0.6 eV) in all core levels associated
with TiO2 (Figure S8c-d.). We attribute this to a shift in the Fermi level of TiO2 upon forming a
junction with NH2-UiO-66 (see discussion for a detailed appraisal of this effect). Considering the O
1s spectrum of the composite and the peaks attributable to the MOF, we observed a carboxyl to
oxide area ratio of 10:1, which is consistent with the structure of the MOF.
11
12
Figure 1. Structural and chemical characterisation of titanium oxide nanofibers, NH2-UiO-66,
TiO2/NH2-UiO-66 composites: a) XRD patterns, b) ATR-FTIR spectra, c) 77 K N2 sorption
isotherms.
2.2 TiO2 nanofibers and NH2-UiO-66 nanocomposites morphology and porosity
While the former analyses confirmed the successful synthesis of the composites and provided
insights into their structures, they did not inform on their morphology which represents a main
aspect of this study. Hence, we employed electron microscopy images of the materials to visualise
the titanate morphology and to provide direct evidence of titanate/NH2-UiO-66 composite
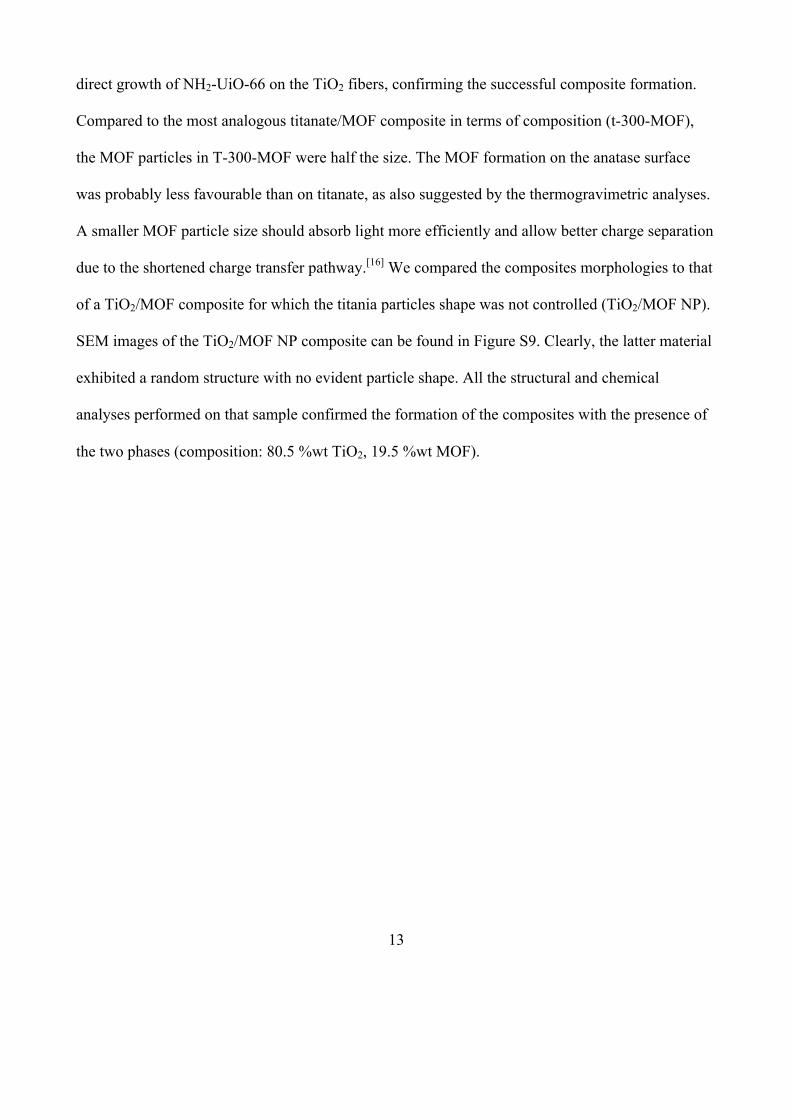
formation. Figure 2a-b confirmed the nanofiber/nanowire morphology and smooth surface of the
titanate material (t). Fibers ranged from 25 to 250 nm in diameter, and up to several microns in
length. The titanate interlayer spacing (200) was 0.8 nm.[8a, 8b, 26] This aligns with the interlayer
spacing derived from XRD (Figure 1a). The NH2-UiO-66 (Figure 2c) formed agglomerated crystals
around 25-50 nm in diameter.[16, 27] Imaging the nanocomposites showed the titanate nanofibers
coated in MOF particles (Figure 2e-f). MOF particles grew directly on the titanate nanofibers and
did not alter their morphology (Figure 2f). The MOF particles on the titanate were larger than those
synthesized in the absence of titanate, supporting the presence of “super-hot” spots on the fiber[15a]
for preferential MOF growth . TEM images of T confirmed that the nanofiber retained their
morphology following thermal treatment at 150 °C (Figure 2g-i). However, the fibers were more
coarse and porous.[8a] This conversion of titanate to anatase phase via the formation of nanocavities
was described as “anti-crystal growth” by Han et al.[28] The lattice spacing was observed to be
anatase phase TiO2 (101).[29] Again, SEM and TEM images of T-300-MOF (Figure 2j-l) showed
13
direct growth of NH2-UiO-66 on the TiO2 fibers, confirming the successful composite formation.
Compared to the most analogous titanate/MOF composite in terms of composition (t-300-MOF),
the MOF particles in T-300-MOF were half the size. The MOF formation on the anatase surface
was probably less favourable than on titanate, as also suggested by the thermogravimetric analyses.
A smaller MOF particle size should absorb light more efficiently and allow better charge separation
due to the shortened charge transfer pathway.[16] We compared the composites morphologies to that
of a TiO2/MOF composite for which the titania particles shape was not controlled (TiO2/MOF NP).
SEM images of the TiO2/MOF NP composite can be found in Figure S9. Clearly, the latter material
exhibited a random structure with no evident particle shape. All the structural and chemical
analyses performed on that sample confirmed the formation of the composites with the presence of
the two phases (composition: 80.5 %wt TiO2, 19.5 %wt MOF).
14
Figure 2. Electron microscopy images highlighting the well-defined morphology of the materials:
of a-b) titanate fibers (t), c) NH2-UiO-66, and d-f) t-300-MOF composite, g-i) anatase fibers (T), j-l)
T-300-MOF composite.
Not only morphology plays a role in the CO2 photoreduction, porosity was expected to as well.
Hence, we analyzed the textural properties of the materials. The results are presented in Figure 1c
15
and Table S1. Titanate (t) had a low surface area (45 m2g-1) with a Type IV isotherm with H3
hysteresis indicating a mesoporous structure.[8a, 30] NH2-UiO-66 exhibited a high surface area
(1004 m2g-1) due to the presence of micropores,[12a, 30] similar to those reported using an open vessel
[14, 18] and microwave-irradiation induced syntheses.[16] As expected, the composites had surface
areas and a porous network intermediate to their two components, and proportional to the MOF
content measured by TGA. The increase of titanate seeds from 200 mg to 300 mg resulted in the
highest composite surface area and MOF loading, a further increase to titanate seeds to 400 mg
lowered to MOF content. We explain this based on the hot spots created on the surface of titanate
for MOF formation: low quantities of titanate limit the available sites and results in low MOF
formation in the short synthesis period, while excess quantities of titanate reduces the density of
induced hot spots so lowers the overall MOF loading. The anatase fibers, T, surface area
(113 m2g-1) doubled compared to titanate. due to an increased mesoporosity. This aligns with the
rougher surface observed using electron microscopy (Figure 2g-i) as well as the literature [8a, 8b].
T-300-MOF had a lower mesoporosity but increased surface area compared to the anatase TiO2
fibers (170 m2g-1) due to the formation of microporous MOF particles.
3.3. Light absorption
We then evaluated the light absorption of the materials using diffuse reflectance ultraviolet-visible
(DR-UV/Vis) spectroscopy. The spectra were converted to a Tauc plot presented in Figure S10
using the Kubelka-Munk function with TiO2 and NH2-UiO-66 as indirect and direct
semiconductors, respectively.[7a, 8a, 8b, 31] The derived bandgaps are presented in Table S3. Both
titanate and anatase phase TiO2 materials onsets were in the UV region. The titanate bandgap of
16
3.16 eV was close to values in literature,[7a, 8a, 8b] as was the 3.11 eV bandgap of the anatase phase
(T).[8a, 31a] The red-shift from titanate to anatase phase fibers was expected, based on an earlier
study. [8a] NH2-UiO-66 absorbed in the visible (2.77 eV).[12b, 31c] Hence, the composite materials had
increased absorption in the visible region compared to their TiO2 components, a desirable feature
for photocatalysis due to the increased solar light utilization.
3.4. CO2 adsorption capacity and photocatalytic CO2 reduction evaluations
One of the first steps towards the photoreduction of CO2 is the adsorption of the molecules on the
surface of the catalyst. An increase in CO2 adsorption may benefit photocatalysis due to the
increased abundance of CO2 at the catalytic sites.[13b, 14] To understand how this aspect may impact
the reaction, we measured CO2 adsorption capacity of the photocatalysts at 25°C up to 1 bara
(Figure 3a). On average, the CO2 adsorption capacities followed the trend of the BET surface areas,
though this is likely a coincidence given that porosity only plays a minor role at low pressure.
NH2-UiO-66 had a capacity of 1.23 mmol g-1, comparable to results reported before.[12a] The
nanocomposites CO2 adsorption capacities were enhanced considerably compared to titanate, with a
9-fold increase for t-300-MOF. The thermally treated nanofiber, T, had a higher adsorption capacity
than titanate. The composite T-300-MOF adsorbed slightly less CO2 than TiO2. T-300-MOF
adsorbed as much CO2 as the TiO2/MOF composite with ‘random’ morphology (TiO2/MOF NP).[14]
We conducted the CO2 photoreduction tests in a heterogeneous gas/solid photoreactor, at ambient
temperature, using H2 as a reducing agent under UV-Vis illumination (λ > 325 nm, 150 W), without
the addition of any co-catalyst or photosensitiser. We opted for a gas phase photoreactor in an effort
to combine CO2 capture and CO2 conversion into a single process.[14] The CO evolution rates of the
17
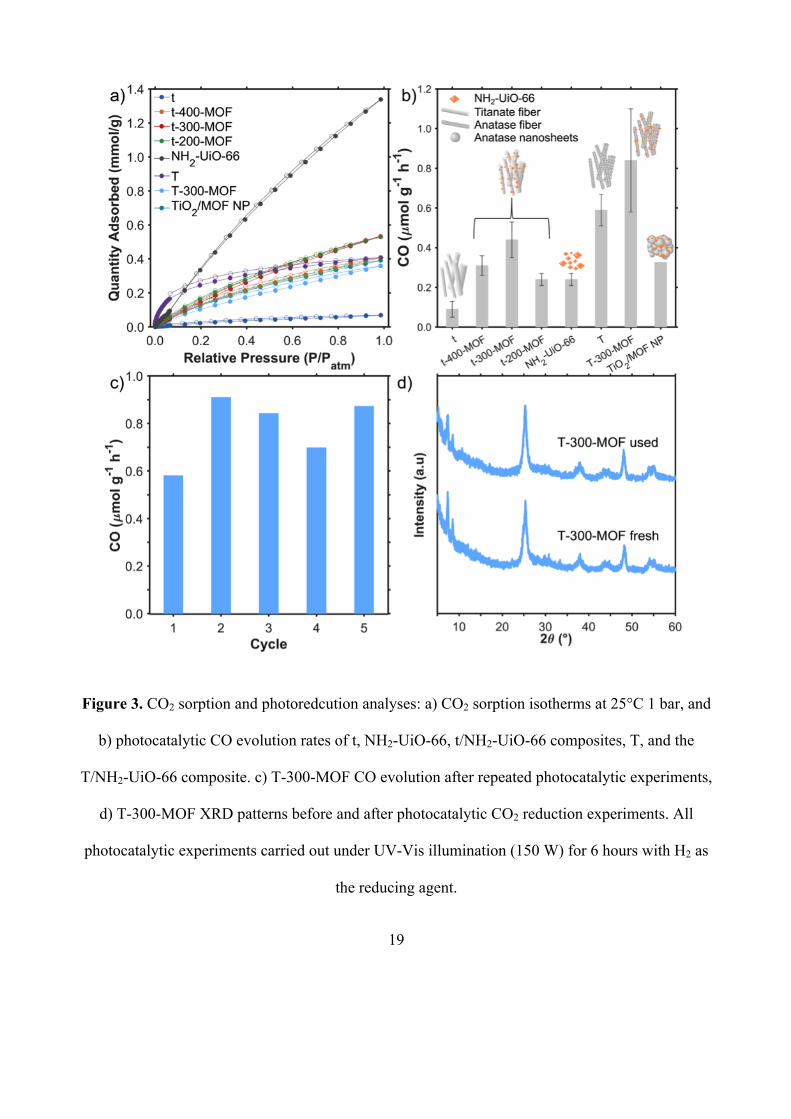
photocatalysts are presented in Figure 3b. CO was the only gaseous product detected. Titanate (t)
was the least active photocatalyst tested and the activity of NH2-UiO-66 was almost 3 times higher.
This MOF has been recently demonstrated for photocatalytic CO2 reduction in liquid phase
photoreactors.[12a, 12c] The composites were all more active than their parent materials showing a
synergetic effect between titania and the MOF. Importantly, the composite with the ‘random’
morphology (TiO2/MOF NP) was the least active of all composites of similar composition. This
observation supports our initial hypothesis that the optimized mixing and contact between the MOF
and titania particles via control of their respective morphology plays a role in the catalytic process.
t-300-MOF was the most active composite: it generated 1.8 to 5 times more CO than pure
NH2-UiO-66 and titanate, respectively. The anatase fibers (T) were around 6 times more active than
titanate fibers, this improvement aligns with other studies,[5d, 8b, 32] and is likely due to presence of
the more active anatase phase. We measured a further increase in CO evolution rate for T-300-
MOF, confirming the synergistic effect of forming a composite. The anatase/MOF composite (T-
300-MOF) was twice as active as the most active titanate/MOF composite (t-300-MOF), and
around 9 times more active than titanate. To allow comparison with other studies on CO2
photoreduction reported in the literature using a different reaction set-up, we have also measured
the performance of titania P25 as it represents the benchmark in the field. Using our set-up, P25
leads to a 1.0 µmol g-1 hr-1, which is slightly higher the best performing composite in this study. We
note that most studies on CO2 photoreduction using MOF-based materials are conducted in the
liquid phase and hence cannot be compared to the work presented here. Looking at selectivity, we
observe 100% selectivity towards CO. Other studies using MOF/TiO2 composites in the gas phase
have reported either pure CH4 production,[13a] or a mixture of CH4 and CO[13b] or pure CO. [13b]
18
As the most active photocatalyst in this study, further investigations were made into the
photocatalytic properties of the anatase fiber MOF composite (T-300-MOF). The CO evolution was
linear over a 6-hour testing period (Figure S11a), indicating a stable CO2 reduction rate. T-300-
MOF remained active over 5 catalytic cycles with no obvious decline in performance (Figure 3c).
We observe variations in the performance over these 5 cycles, though no noticeable drop compared
to the first run. We formulated two hypotheses for these variations. The first one is that it is
experimental error. In fact, if we consider the variations, they are of the same order of the standard
deviation for a run. The second hypothesis is that the product remained adsorbed for some time on
the material and was desorbed and therefore picked up by the GC only later. Following these
experiments, the XRD patterns were unchanged (Figure 3d). In addition, TEM images and XPS
spectra of the used samples remained unchanged as well (Figures S12 and S13). A control test
under a N2 and H2 atmosphere (Table S2, entry 8) yielded no CO. In addition, isotopic tracing
experiments using 13CO2 yielded 13CO (Figure S11b). These tests proved the photocatalytic origin
of the CO in the CO2 reduction experiments. Water as an alternate reducing agent was also
investigated under higher power UV-Vis illumination (300 W), which evolved 1.8 µmol g-1 h-1 CO
(Table S2, entry 9).
19
Figure 3. CO2 sorption and photoredcution analyses: a) CO2 sorption isotherms at 25°C 1 bar, and
b) photocatalytic CO evolution rates of t, NH2-UiO-66, t/NH2-UiO-66 composites, T, and the
T/NH2-UiO-66 composite. c) T-300-MOF CO evolution after repeated photocatalytic experiments,
d) T-300-MOF XRD patterns before and after photocatalytic CO2 reduction experiments. All
photocatalytic experiments carried out under UV-Vis illumination (150 W) for 6 hours with H2 as
the reducing agent.
20
We now trun our attention to the relative contribution of TiO2 morphology, crystalline phase, and
composite heterojunction formation on the performance of the different samples. While a definite
quantitative analysis of the different factors remains challenging, a number of insightful
observations can be made, especially relating to our previous work on MOF/TiO2 composites for
which the morphology of the composites were not controlled:[14]
- the formation of a heretojunction allowed an increase between 1.5 and 3 times that obtained for a
physical mixture of tinate (or titania) and the MOF, depending on the composites.
- the optimisation of the morphology allows to more than doubled the performance of the
composites.
- analysis of the effect of the crystalline phase is more difficult as the titanate/MOF and
titania/MOF composites do not have the same composition. Yet comparing the performance of t-
400-MOF (titanate phase, 20 wt% MOF) and T-300-MOF (titania phase, 15 wt% MOF), which
exhibited the closest composition, we observed an increase of 3.5 in CO production rate.
Hence, overall, the contributions of the three parameters discussed above are of the same order of
magnitude.
3.5. Charge carrier dynamics
We used transient absorption spectroscopy (TAS) to measure the charge carrier dynamics in NH2-
UiO-66, T, as well as infer the direction of charge transfer in the best performing composite, T-300-
MOF. The decay dynamics and spectral changes are provided in Figures S12 and S13, respectively.
The decay dynamics and spectral changes found in the MOF were analogous to previous work [14].
However, the decay dynamics found in the anatase TiO2 powder, T, differed from previous studies
[9c, 33]. In anatase TiO2 (T), charge carriers were longer lived (t50% from 10 µs, ~10 ms) compared to
21
what has been previously observed in mesoporous and dense thin films of anatase (t50% from 10 µs,
~0.5 ms). In the T-300-MOF composite, charge carriers recombined at a similar rate to that in NH2-
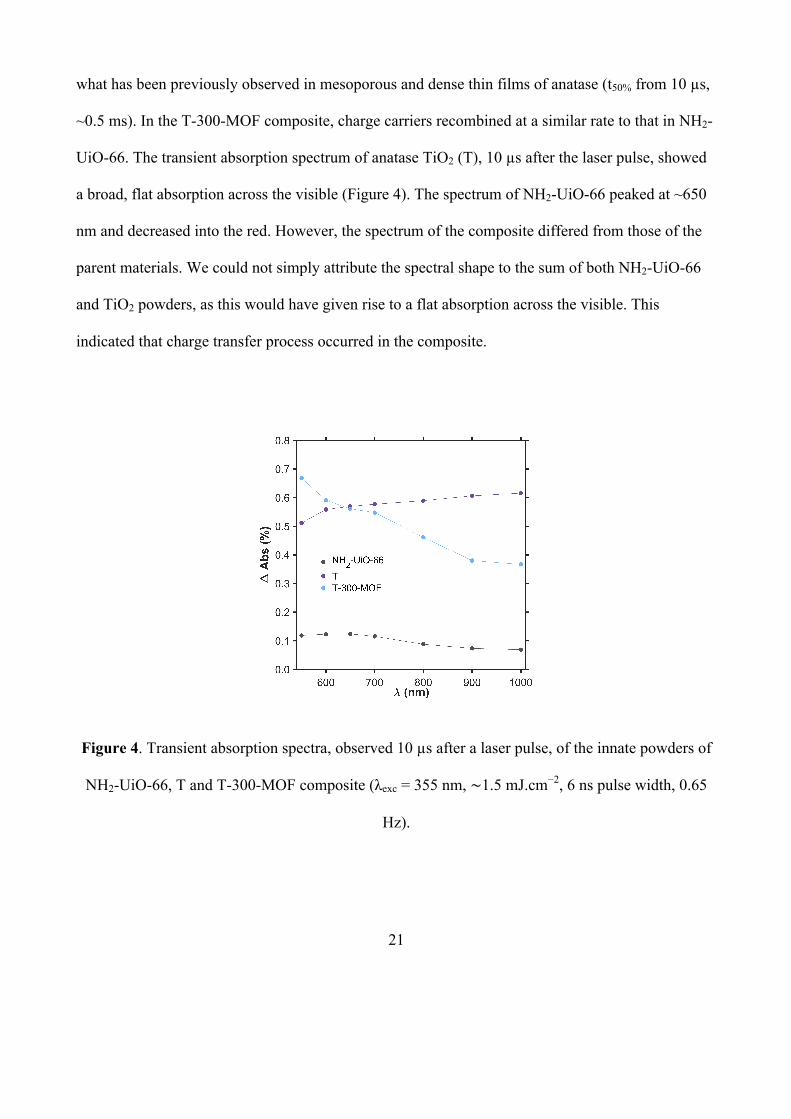
UiO-66. The transient absorption spectrum of anatase TiO2 (T), 10 µs after the laser pulse, showed
a broad, flat absorption across the visible (Figure 4). The spectrum of NH2-UiO-66 peaked at ~650
nm and decreased into the red. However, the spectrum of the composite differed from those of the
parent materials. We could not simply attribute the spectral shape to the sum of both NH2-UiO-66
and TiO2 powders, as this would have given rise to a flat absorption across the visible. This
indicated that charge transfer process occurred in the composite.
Figure 4. Transient absorption spectra, observed 10 µs after a laser pulse, of the innate powders of
NH2-UiO-66, T and T-300-MOF composite (λexc = 355 nm, ∼1.5 mJ.cm−2, 6 ns pulse width, 0.65
Hz).
22
We then carried out chemical scavenger studies to determine the direction of charge transfer using
methanol as a hole scavenger and silver nitrate(aq) as an electron scavenger.[33] We did not observe
any effect on the charge carrier dynamics in the MOF when dispersed in a silver nitrate solution,
unlike in the case of methanol (Figure S14). With methanol, significant hole scavenging occurred
from ∼1 ms resulting in a plateau in the decay dynamics (Figure S14a). We attribute this plateau to
the formation of long-lived electrons, which absorb more strongly in the blue (Figure S14b). The
anatase TiO2 sample, T, showed a scavenging effect in both methanol (Figure S15) and silver
nitrate solution (Figure S16). In methanol, holes were scavenged on the pre-µs timescale, giving
rise to long-lived electrons (Figure S15a); an effect previously observed in mesoporous anatase
TiO2.[33] These electrons absorb more strongly in the red, at ∼900 nm (Figure S15b). Electron
scavenging in silver nitrate solution was less pronounced (Figure S16). From the decay dynamics,
electron scavenging occurred from ∼1 ms (Figure S16a), where the concomitant holes gave rise to a
strong absorption in the blue (Figure S16b). The locations of electron and holes signals in T were
analogous to previous studies of anatase TiO2.[9c]
In summary, our scavenging studies showed that photogenerated electrons in NH2-UiO-66, and
holes in anatase TiO2, both absorb more strongly in the blue. Given the composite material showed
a stronger absorption in the blue, with respect to its parent materials, we attribute this rise in
absorption to either: (i) hole transfer from NH2-UiO-66 to T, (ii) electron transfer from T to
NH2-UiO-66 or (iii) a combination of these two effects.
23
3.6. Mode of charge transfer in the TiO2/NH2-UiO-66 composites
To identify the mode of charge in the composites from the three options listed above, we
investigated the relative band energy diagram of TiO2 and NH2-UiO-66 in the composites using
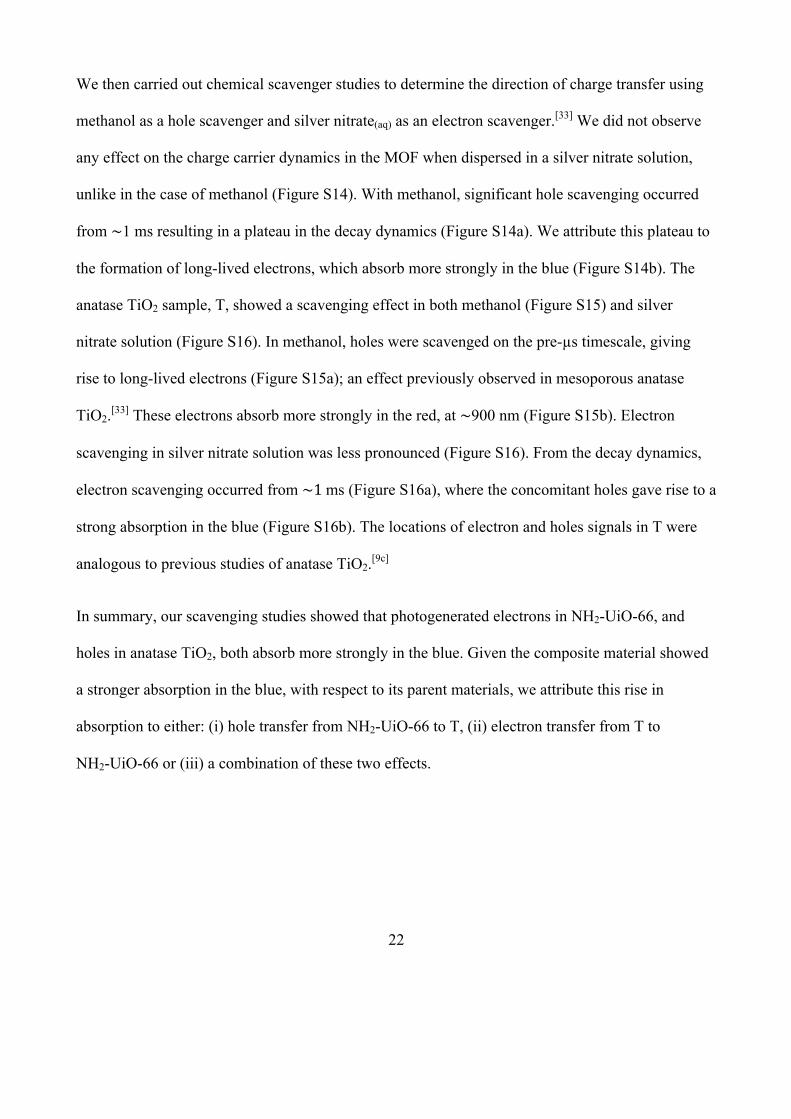
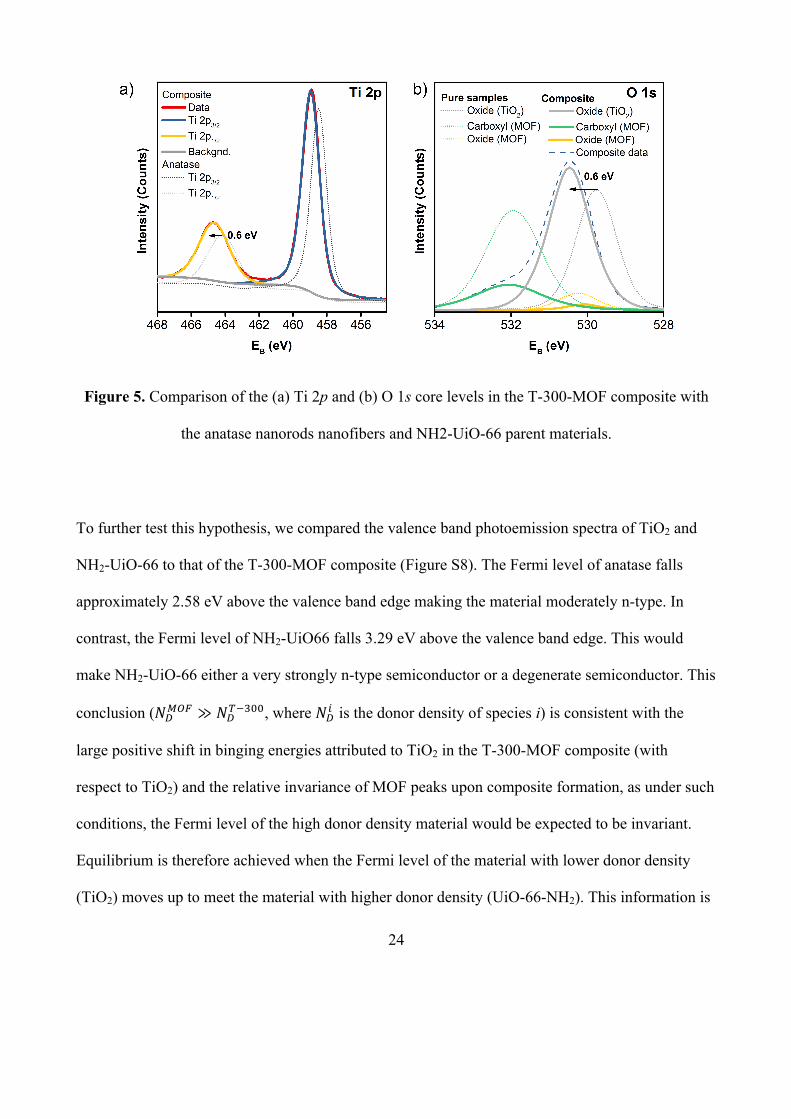
XPS. The O 1s and Ti 2p core emission spectra of the composite exhibited the same number of
chemical environments as the parent materials (Figure 5). Peaks in all core levels associated with
NH2-UiO-66 in the composite appeared at commensurate binding energies to those of the parent
material (Figure S6a-c). However, as mentioned earlier, a large shift (0.6 eV) to higher binding
energy was observed in peaks attributed to TiO2. O 1s peaks from transition metal oxides are
broadly insensitive to changes in metal redox state.[25] Consequently, the positive binding energy
shift observed cannot be attributed to the formation of more oxidised states upon composite
formation (which is unlikely in an already oxidised material such as TiO2). Rather, the shifts are
attributed to a 0.6 eV increase in the Fermi level (the reference/zero level in XPS) of TiO2 upon
forming a junction with NH2-UiO-66. As peaks attributed to the NH2-UiO-66 did not shift
significantly upon composite formation, it is likely that Fermi level of the MOF did not shift
substantially. This implies that the donor density of the MOF greatly exceeded that of the anatase
nanofibers.
24
Figure 5. Comparison of the (a) Ti 2p and (b) O 1s core levels in the T-300-MOF composite with
the anatase nanorods nanofibers and NH2-UiO-66 parent materials.
To further test this hypothesis, we compared the valence band photoemission spectra of TiO2 and
NH2-UiO-66 to that of the T-300-MOF composite (Figure S8). The Fermi level of anatase falls
approximately 2.58 eV above the valence band edge making the material moderately n-type. In
contrast, the Fermi level of NH2-UiO66 falls 3.29 eV above the valence band edge. This would
make NH2-UiO-66 either a very strongly n-type semiconductor or a degenerate semiconductor. This
conclusion (𝑁!!"# ≫ 𝑁!!!!"", where 𝑁!! is the donor density of species i) is consistent with the
large positive shift in binging energies attributed to TiO2 in the T-300-MOF composite (with
respect to TiO2) and the relative invariance of MOF peaks upon composite formation, as under such
conditions, the Fermi level of the high donor density material would be expected to be invariant.
Equilibrium is therefore achieved when the Fermi level of the material with lower donor density
(TiO2) moves up to meet the material with higher donor density (UiO-66-NH2). This information is
25
consistent with the valence band spectrum of the composite, which is aligned with that of the MOF,
implying that the Fermi Level of the composite is determined by the MOF (Figure S8b). The shape
of the valence band spectrum of the T-300-MOF composite is distinct from that of the MOF.
However, applying Fermi level shift of +0.6 eV to the valence band spectrum of anatase (Figure
S8c) demonstrates that the valance band of the T-300-MOF composite matches that of anatase. This
implies that in the composite, the highest energy (valence) states are mainly TiO2 valence states.
This is likely a result of anatase making up most of the composite.
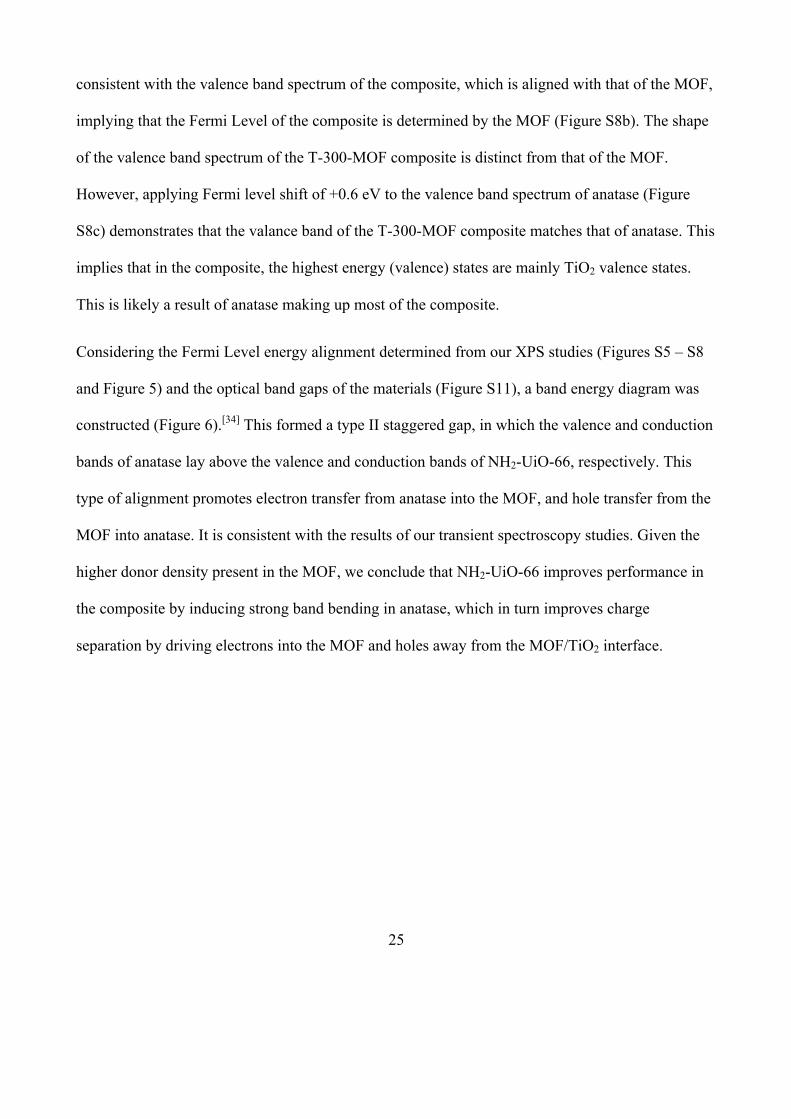
Considering the Fermi Level energy alignment determined from our XPS studies (Figures S5 – S8
and Figure 5) and the optical band gaps of the materials (Figure S11), a band energy diagram was
constructed (Figure 6).[34] This formed a type II staggered gap, in which the valence and conduction
bands of anatase lay above the valence and conduction bands of NH2-UiO-66, respectively. This
type of alignment promotes electron transfer from anatase into the MOF, and hole transfer from the
MOF into anatase. It is consistent with the results of our transient spectroscopy studies. Given the
higher donor density present in the MOF, we conclude that NH2-UiO-66 improves performance in
the composite by inducing strong band bending in anatase, which in turn improves charge
separation by driving electrons into the MOF and holes away from the MOF/TiO2 interface.
26
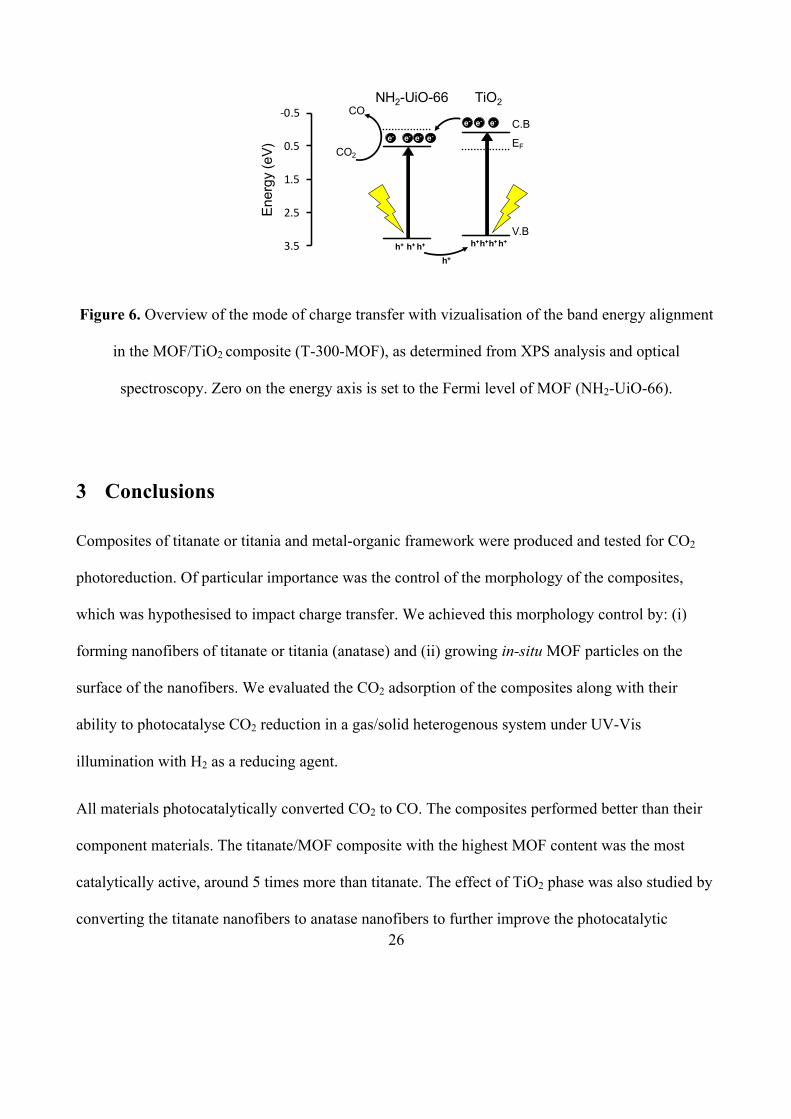
Figure 6. Overview of the mode of charge transfer with vizualisation of the band energy alignment
in the MOF/TiO2 composite (T-300-MOF), as determined from XPS analysis and optical
spectroscopy. Zero on the energy axis is set to the Fermi level of MOF (NH2-UiO-66).
3 Conclusions
Composites of titanate or titania and metal-organic framework were produced and tested for CO2
photoreduction. Of particular importance was the control of the morphology of the composites,
which was hypothesised to impact charge transfer. We achieved this morphology control by: (i)
forming nanofibers of titanate or titania (anatase) and (ii) growing in-situ MOF particles on the
surface of the nanofibers. We evaluated the CO2 adsorption of the composites along with their
ability to photocatalyse CO2 reduction in a gas/solid heterogenous system under UV-Vis
illumination with H2 as a reducing agent.
All materials photocatalytically converted CO2 to CO. The composites performed better than their
component materials. The titanate/MOF composite with the highest MOF content was the most
catalytically active, around 5 times more than titanate. The effect of TiO2 phase was also studied by
converting the titanate nanofibers to anatase nanofibers to further improve the photocatalytic
NH2-UiO-66 TiO2
e-C.B
V.B
e-
h+ h+h+ h+ h+
e- e- e-
e-
h+
CO
CO2
e-
-‐0.5
0.5
1.5
2.5
3.5
Ene
rgy
(eV)
h+h+
EF
27
activity. The titania/MOF composite exhibited a further increase in photocatalytic activity, 9 times
more when compared to titanate.
The in-depth study of the composites morphology, light absorption and charge carrier dynamics
allowed to confirm: (i) the positive effect of the morphology control on the charge separation, (ii)
the beneficial red shift toward lower energy absorption compared to the parent materials and (iii)
the interfacial charge transfer across the heterojunction (type II) in the materials. We demonstrate
that the MOF induces strong band bending in anatase. This leads to an improved charge separation
as electrons transfer from TiO2 to the MOF.
Overall, the study shows that the control of the TiO2 morphology, crystalline phase, and composite
heterojunction formation can lead to significant increase in photocatalytic activity for CO2
reduction. The contributions of each of these factors seem to be of the same order of magnitude.
4 Experimental Section
4.1 Material synthesis
All reagents used in this study were of analytical grade and used without further purification.
Titanium oxide P25 (≥99.5% trace metals), sodium hydroxide (≥98%), zirconium chloride (≥99.5%
trace metals), polyvinylpyrrolidone (PVP, average molecular weight 10,000), N,N-‐Dimethyl
Formamide (99.9%), hydrochloric acid (37%wt), and acetic acid (≥99.7%) were purchased from
Sigma-Aldrich.
28
4.1.1 Synthesis of titanium dioxide nanofibers
We produced TiO2 nanofibers (NF) via a hydrothermal synthesis, following a previously reported
method.[35] P25 (5 g) was dispersed in 10 M sodium hydroxide (70 mL), the mixture was then
sealed in an autoclave (polytetrafluoroethylene liner) and heated to 180 °C for 48 h. After cooling,
the white solid was collected and washed by filtration with 1 M hydrochloric acid until the pH of
the filtrate reached 1. Finally, the white solid was washed by filtration with deionised water until
the filtrate was pH neutral - the titanate product was denoted “t”.
We initiated for phase conversion of the TiO2 nanofibers – from titanate to titania via a thermal
treatment (Scheme 1 route b).[36] “t” (600 mg), 30 mL deionised, and ethanol (20 mL) were added
to a PTFE autoclave liner under stirring. This was then sealed and heated to 150 °C for 17 h, the
white solid product was recovered and washed by centrifugation (3 ethanol washes), vacuum dried
at 120 °C and stored in a desiccator. The thermally treated titanate was denoted “T”.
4.1.2 Synthesis of NH2-UiO-66 and TiO2/NH2-UiO-66 nanocomposites
We employed an in-situ growth method to synthesize NH2-UiO-66 on the as-synthesized TiO2
nanofibers – Scheme 1 route a. The formation of the NH2-UiO-66 particles was based on a
previously reported method,[18] but applying much lower temperature (80 oC) to suppress MOF
formation in the bulk solution. A CEM MARS 5 microwave oven with XP-1500 Plus vessels was
used for all microwave syntheses. The following was added to reaction vessels: zirconium chloride
(291 mg), 2-aminoteraphtalic acid (226 mg), titanate (varied mass), N,N-dimethyl formamide
(30 mL), acetic acid (8.4 mL), and deionised water (540 µL). The mixture was sonicated for 30
minutes before heating at 80 °C for 1 h. After synthesis, the solid product was recovered and
washed by centrifugation (3 ethanol washes), vacuum dried at 120°C and stored in a desiccator. The
29
MOF/TiO2 ratio of the nanocomposites was controlled by altering the mass of titanate present in the
synthesis. These were labelled t-x-MOF, where x refers to the mass of titanate in mg used during
synthesis, and MOF is NH2-UiO-66. NH2-UiO-66 was synthesized using the same procedure above
but with no titanate present.
The thermally treated titanate, T, was also used for the synthesis of a TiO2/MOF nanocomposites
using the same procedure as above. This composite was labelled T-300-MOF to identify its
thermally treated TiO2 component (T), and the quantity of TiO2 present during synthesis (300 mg).
To assess the role of the composites morphology on the photoreduction process, we compared the
composites in the present study to a composite of the same materials in a previous study in which
the morphology of the titania and the MOF synthesis sites were not controlled.[14] In brief, for this
synthesis 0.147 g of zirconium (IV) chloride, 17.63 mL N,N-Dimethyl Formamide, 1.18 mL
concentrated hydrochloric acid (37 %), 0.158 g of 2-aminoterephtalic acid (99%) and 0.5 g of TiO2
nanosheets were combined, sonicated, transferred to a round bottom flask, and then heated under
stirring to 150 °C for 24 h. This in-situ approach was adopted for the development of NH2-UiO-66
in the presence of pre-synthesized TiO2 nanosheets. The TiO2/NH2-UiO-66 nanocomposite formed
had a MOF content of 19.5%wt and was the most photocatalytically active for CO2 to CO
conversion in that previous study. Herein, we refer to that sample as TiO2/MOF composite with
“random” nanoparticle (NP) morphology, denoted “TiO2/MOF NP”.
4.2 Materials characterization methods
X-ray diffraction measurements were performed with a PANalytical X'Pert PRO instrument at room
temperature (reflection mode at 40 kV and 40 mA using Cu Kα radiation (α1 = 1.54057 Å, α2 =
30
1.54433 Å, weighted average = 1.54178 Å). The interplanar spacing was calculated using Bragg’s
law:
2𝑑 sin 𝜃 = 𝑛𝜆
Attenuated total reflection Fourier transform-infrared (ATR-FTIR) spectra was collected using a
Perkin-Elmer Spectrum 100 Spectrometer equipped with an ATR cell at room temperature. The
spectra was generated, collected 8 times, and corrected for the background noise. The experiments
were performed using powdered samples, without KBr addition. Scanning electron microscopy
(SEM) images were taken using a high resolution LEO Gemini 1525 microscope in secondary
electron mode at 5 kV (InLens detector). Prior to imaging, the samples were mounted on carbon
tape and coated with 10 nm chromium. Transmission electron microscope (TEM) images were
taken by a JEOL 2100Plus instrument at an acceleration voltage of 200 kV. Before imaging, the
samples were sonicated in ethanol and then drop casted on a carbon coated copper grid. Nitrogen
adsorption and desorption isotherms at -196 °C were measured using a Micrometrics 3Flex sorption
analyzer. The surface area was calculated from the Brunauer-Emmett-Teller method.[37] The total
volume of pore was calculated from the volume adsorbed at P/P0=0.97. The volume of micropores
was determined using the Dubinin-Radushkevich method.[38] The volume of mesopores was
calculated as the difference between the total pore volume and the volume of micropores. CO2
sorption isotherms at 25°C were measured up to 1 bara using the same instrument. Prior to all
sorption measurements the samples were degassed at 0.2 mTorr, 120 °C for 24 hours. Diffuse
reflectance ultraviolet-visible (DR-UV/Vis) spectra were obtained using an Agilent Cary 500 UV-
Vis-NIR spectrometer equipped with an integrating sphere. Spectral band width was set to 2 nm,
with Spectralon as a standard. Spectra were treated using Kubelka-Munk function[39] to eliminate
any tailing contribution from the DR-UV–vis spectra. The following equation was applied:
31
𝐹 𝑅 =1− 𝑅 !
2𝑅
where R is the reflectance. The band-gap (Eg) values were estimated from the plot of F(R)hv1/n
versus energy by extrapolating the linear section.
X-ray photoemission spectroscopy (XPS) was performed on a Thermo Scientific K-Alpha
spectrometer equipped with an Al Kα X-Ray source (1486.6 eV) and an 180° double focusing
hemispherical analyzer with a 2D detector at an operating pressure of 1x10⁻⁸ mbar and a flood gun
to minimise charging from photoemission. Powders were mounted onto conductive carbon tape
adhered to a sample holder. To further correct for charging, all core lines were referenced against
the C 1s (C-C) core line at 284.8 eV. Data was then processed and analyzed in the Avantage
software package.
4.3 Photocatalytic CO2 reduction
A gas-solid reactor setup was assembled as illustrated in Figure S1.[14] The photocatalysts (25 mg)
were deposited on a stainless steel metal disc with a fixed area of 9.6 cm2. Research grade
(99.999%) CO2 and H2 (99.9995%, Peak Scientific PH200 hydrogen generator) were flowed at
controlled rates using mass flow controllers (Omega Engineering, 0-50 mL/min). For experiments
requiring water vapour, this was generated from a saturator at room temperature (20 °C). The
photoreactor (35 cm3) was vacuumed and replenished with reactant gases five times. Then the
reactor was purged with the reactant gases for 15 residence times before it was sealed at 1.25 bara.
A CO2/H2 ratio of 1.5 (vol/vol) was used for experiments using both these gases. A xenon arc lamp
(150 W and 300 W, λ > 325 nm – see Figure S2 for full spectra, LOT Quantum Design), equipped
with a water filter was used as the irradiation source. Evolved gases were detected by a gas
chromatograph (GC, Agilent Technologies) with hayesep and mol sieve columns in series, thermal
32
conductivity (TCD) and flame ionisation (FID) detectors. The stability of the photocatalysts was
tested by repeating process above after each 6 h illumination without opening the photoreactor.
Isotopic tracing experiments were performed with 13CO2 (BOC, >98% atom 13CO2 compared to
12CO2, >99%).
4.4 Transient absorption spectroscopy (TAS)
We studied the charge carrier dynamics of the materials using transient absorption spectroscopy,
from the microsecond to second timescale, measured in diffuse reflection mode. We used a
WeNd:YAG laser (OPOTEK Opolette 355 II, ~6 ns pulse width) as the excitation source,
generating 355 nm light from the third harmonic transmitted to the sample through a light guide.
The laser was fired at the sample at a rate of 0.65 Hz with a power density of ∼1.5 mJ.cm-2. As the
photo-induced changes in reflectance were low (< 1%), we assumed that the transient signal was
directly proportional to the concentration of excited species. The probe light was a 100 W Bentham
IL1 quartz halogen lamp. Long pass filter (Comar Instruments) were placed between the lamp and
sample to minimize short wavelength irradiation of the sample. Diffuse reflectance from the sample
was collected by a 2” diameter, 2” focal length lens and relayed to a monochromator (Oriel
Cornerstone 130) to select the probe wavelength. Time-resolved intensity data was collected with a
Si photodiode (Hamamatsu S3071). Data at times faster than 3.6 ms was recorded by an
oscilloscope (Tektronics DPO3012) after passing through an amplifier box (Costronics), whereas
data slower than 3.6 ms was simultaneously recorded on a National Instrument DAQ card (NI USB-
6251). Each kinetic trace was obtained from the average of between 100 and 250 laser pulses.
Acquisitions were triggered by a photodiode (Thorlabs DET10A) exposed to laser scatter. Data was
acquired and processed using home-built software written in Labview.
33
Experiments were carried out in diffuse reflectance, since the materials were highly light scattering.
Two types of experiment were conducted: (i) analysis of the innate powder and (ii) chemical
scavenger experiments in which ~10 mg of the powder was dissolved in a chemical scavenger
solution (0.6 mL of either pure methanol, a well-known hole scavenger, or an aqueous solution of
silver nitrate [2 mM], a well-known electron scavenger).[33] Solutions were sonicated for 15 minutes
to achieve good dispersion (VWR ultra-sonic cleaner, 30 W, 45 kHz). Transient changes in diffuse
reflectance were then measured in the visible region between 500 and 1000 nm.
5 Acknowledgements
This work was supported by the Engineering and Physical Science Research Council through the
First Grant scheme (EP/N024206/1). A.C. and B.M thank Imperial College London and the
Engineering and Physical Sciences Research Council for Doctoral Training Partnerships. A.K.
thanks Imperial College London for a Junior Research Fellowship and the Royal Society for a
Research Grant (RSG\R1\180434). A.G. thank the Royal Society of Chemistry for the
Undergraduate Research Bursary.
6 Supporting Information
Supplementary data is available containing: Photocatalytic reactor set-up, lamps emission spectra,
thermogravimetric analysis, N2 isotherms, X-ray Photoelectron Spectra, 13C analyses, SEM images,
DR-UV-Vis, and transient absorption spectroscopy spectra.
34
7 References
[1] a) Y. Izumi, Coordination Chemistry Reviews 2013, 257, 171; b) M. Mikkelsen, M. Jorgensen, F. C. Krebs, Energy & Environmental Science 2010, 3, 43.
[2] A. Fujishima, K. Honda, Nature 1972, 238, 37. [3] a) H. Xu, S. Ouyang, L. Liu, P. Reunchan, N. Umezawa, J. Ye, Journal of Materials
Chemistry A 2014, 2, 12642; b) B. Wang, W. Chen, Y. Song, G. Li, W. Wei, J. Fang, Y. Sun, Catalysis Today 2018, 311, 23.
[4] a) V. Bem, M. C. Neves, M. R. Nunes, A. J. Silvestre, O. C. Monteiro, Journal of Photochemistry and Photobiology A: Chemistry 2012, 232, 50; b) B. Barrocas, T. J. Entradas, C. D. Nunes, O. C. Monteiro, Applied Catalysis B: Environmental 2017, 218, 709; c) S. Thennarasu, K. Rajasekar, K. Balkis Ameen, Journal of Molecular Structure 2013, 1049, 446.
[5] a) H.-H. Ou, S.-L. Lo, Separation and Purification Technology 2007, 58, 179; b) D. V. Bavykin, F. C. Walsh, European Journal of Inorganic Chemistry 2009, 2009, 977; c) Y. Zhang, Z. Jiang, J. Huang, L. Y. Lim, W. Li, J. Deng, D. Gong, Y. Tang, Y. Lai, Z. Chen, RSC Advances 2015, 5, 79479; d) K. C. Christoforidis, A. Sengele, V. Keller, N. Keller, ACS Applied Materials & Interfaces 2015, 7, 19324.
[6] a) S. K. Parayil, A. Razzaq, S.-M. Park, H. R. Kim, C. A. Grimes, S.-I. In, Applied Catalysis A: General 2015, 498, 205; b) H. Park, H.-H. Ou, A. J. Colussi, M. R. Hoffmann, The Journal of Physical Chemistry A 2015, 119, 4658.
[7] a) T. A. Silva, J. Diniz, L. Paixão, B. Vieira, B. Barrocas, C. D. Nunes, O. C. Monteiro, Solid State Sciences 2017, 63, 30; b) Z. Xiong, X. S. Zhao, Journal of the American Chemical Society 2012, 134, 5754.
[8] a) H. Yu, J. Yu, B. Cheng, M. Zhou, Journal of Solid State Chemistry 2006, 179, 349; b) E. Ylhäinen, M. Nunes, A. Silvestre, O. Monteiro, Journal of Materials Science 2012, 47, 4305; c) H. Y. Zhu, Y. Lan, X. P. Gao, S. P. Ringer, Z. F. Zheng, D. Y. Song, J. C. Zhao, Journal of the American Chemical Society 2005, 127, 6730.
[9] a) D. C. Hurum, A. G. Agrios, K. A. Gray, T. Rajh, M. C. Thurnauer, The Journal of Physical Chemistry B 2003, 107, 4545; b) S.-G. Kim, L. K. Dhandole, J.-M. Lim, W.-S. Chae, H.-S. Chung, B.-T. Oh, J. S. Jang, Applied Catalysis B: Environmental 2018, 224, 791; c) A. Kafizas, X. Wang, S. R. Pendlebury, P. Barnes, M. Ling, C. Sotelo-Vazquez, R. Quesada-Cabrera, C. Li, I. P. Parkin, J. R. Durrant, The Journal of Physical Chemistry A 2016, 120, 715.
[10] a) C. Han, Y. Wang, Y. Lei, B. Wang, N. Wu, Q. Shi, Q. Li, Nano Research 2015, 8, 1199; b) K. Li, T. Peng, Z. Ying, S. Song, J. Zhang, Applied Catalysis B: Environmental 2016, 180, 130.
[11] a) C. Wang, Z. Xie, K. E. deKrafft, W. Lin, Journal of the American Chemical Society 2011, 133, 13445; b) Y. Fu, D. Sun, Y. Chen, R. Huang, Z. Ding, X. Fu, Z. Li, Angewandte Chemie 2012, 124, 3420; c) H. Zhang, J. Wei, J. Dong, G. Liu, L. Shi, P. An, G. Zhao, J. Kong, X. Wang, X. Meng, J. Zhang, J. Ye, Angew Chem Int Ed Engl 2016, 55, 14310; d) T. Zhang, W. Lin, Chemical Society Reviews 2014, 43, 5982; e) A. Crake, Materials Science and Technology 2017, 33, 1737; f) S. Wang, X. Wang, Small 2015, 11, 3098; g) R. Li , W. Zhang, K. Zhou, Advanced Materials 2018, 30, 1705512.
35
[12] a) D. Sun, Y. Fu, W. Liu, L. Ye, D. Wang, L. Yang, X. Fu, Z. Li, Chemistry – A European Journal 2013, 19, 14279; b) D. Sun, W. Liu, M. Qiu, Y. Zhang, Z. Li, Chemical Communications 2015, 51, 2056; c) Y. Lee, S. Kim, J. K. Kang, S. M. Cohen, Chem Commun (Camb) 2015, 51, 5735.
[13] a) R. Li, J. Hu, M. Deng, H. Wang, X. Wang, Y. Hu, H.-L. Jiang, J. Jiang, Q. Zhang, Y. Xie, Y. Xiong, Advanced Materials 2014, 26, 4783; b) M. Wang, D. Wang, Z. Li, Applied Catalysis B: Environmental 2016, 183, 47; c) S. S. Yan, S. X. Ouyang, H. Xu, M. Zhao, X. L. Zhang, J. H. Ye, Journal of Materials Chemistry A 2016, 4, 15126; d) L. Liu, F. Zhang, J. Zhang, X. Tan, B. Zhang, J. Shi, D. Shao, D. Tan, B. Han, G. Yang, Soft Matter 2017, 13, 9174; e) J. C. Cardoso, S. Stulp, J. F. de Brito, J. B. S. Flor, R. C. G. Frem, M. V. B. Zanoni, Applied Catalysis B: Environmental 2018, 225, 563; f) Z. Huang, P. Dong, Y. Zhang, X. Nie, X. Wang, X. Zhang, Journal of CO2 Utilization 2018, 24, 369.
[14] A. Crake, K. C. Christoforidis, A. Kafizas, S. Zafeiratos, C. Petit, Applied Catalysis B: Environmental 2017, 210, 131.
[15] a) D. Zhang, P. Liu, S. Xiao, X. Qian, H. Zhang, M. Wen, Y. Kuwahara, K. Mori, H. Li, H. Yamashita, Nanoscale 2016, 8, 7749; b) S. Xiao, P. Liu, W. Zhu, G. Li, D. Zhang, H. Li, Nano Letters 2015, 15, 4853.
[16] X. Wang, X. Zhao, D. Zhang, G. Li, H. Li, Applied Catalysis B: Environmental 2018, 228, 47.
[17] F. Jiang, S. Zheng, L. An, H. Chen, Applied Surface Science 2012, 258, 7188. [18] M. J. Katz, Z. J. Brown, Y. J. Colon, P. W. Siu, K. A. Scheidt, R. Q. Snurr, J. T.
Hupp, O. K. Farha, Chemical Communications 2013, 49, 9449. [19] a) K. C. Christoforidis, M. Fernandez-Garcia, Catalysis Science & Technology 2016,
6, 1094; b) J. Cui, D. Sun, W. Zhou, H. Liu, P. Hu, N. Ren, H. Qin, Z. Huang, J. Lin, H. Ma, Physical Chemistry Chemical Physics 2011, 13, 9232.
[20] M. Mehta, N. Kodan, S. Kumar, A. Kaushal, L. Mayrhofer, M. Walter, M. Moseler, A. Dey, S. Krishnamurthy, S. Basu, A. P. Singh, Journal of Materials Chemistry A 2016, 4, 2670.
[21] D. Courcot, L. Gengembre, M. Guelton, Y. Barbaux, B. Grzybowska, Journal of the Chemical Society, Faraday Transactions 1994, 90, 895.
[22] J. L. Ong, L. C. Lucas, G. N. Raikar, J. C. Gregory, Applied Surface Science 1993, 72, 7.
[23] B. Moss, K. K. Lim, A. Beltram, S. Moniz, J. Tang, P. Fornasiero, P. Barnes, J. Durrant, A. Kafizas, Scientific Reports 2017, 7, 2938.
[24] A. E. Hughes, B. A. Sexton, Journal of Electron Spectroscopy and Related Phenomena 1990, 50, C15.
[25] E. N. K. Glover, S. G. Ellington, G. Sankar, R. G. Palgrave, Journal of Materials Chemistry A 2016, 4, 6946.
[26] C. Huang, X. Liu, L. Kong, W. Lan, Q. Su, Y. Wang, Applied Physics A 2007, 87, 781.
[27] N. Yin, K. Wang, L. Wang, Z. Li, Chemical Engineering Journal 2016, 306, 619. [28] W. Q. Han, L. J. Wu, R. F. Klie, Y. M. Zhu, Advanced Materials 2007, 19, 2525. [29] Q. Xiang, K. Lv, J. Yu, Applied Catalysis B: Environmental 2010, 96, 557. [30] K. S. W. Sing, in Adsorption by Powders and Porous Solids (Second Edition) (Ed:
F. R. R. S. W. S. L. Maurin), Academic Press, Oxford 2014, p. 237.
36
[31] a) K. C. Christoforidis, A. Iglesias-Juez, S. J. A. Figueroa, M. Di Michiel, M. A. Newton, M. Fernandez-Garcia, Catalysis Science & Technology 2013, 3, 626; b) L. Valenzano, B. Civalleri, S. Chavan, S. Bordiga, M. H. Nilsen, S. Jakobsen, K. P. Lillerud, C. Lamberti, Chemistry of Materials 2011, 23, 1700; c) Y. Su, Z. Zhang, H. Liu, Y. Wang, Applied Catalysis B: Environmental 2017, 200, 448.
[32] X. Zhang, J. Yuan, Y. Yu, Q. Dong, Z. Xiong, H. Yu, X. Zhu, H. Shen, Y. Xie, Journal of Alloys and Compounds 2017, 712, 549.
[33] X. Wang, A. Kafizas, X. Li, S. J. Moniz, P. J. Reardon, J. Tang, I. P. Parkin, J. R. Durrant, The Journal of Physical Chemistry C 2015, 119, 10439.
[34] D. O. Scanlon, C. W. Dunnill, J. Buckeridge, S. A. Shevlin, A. J. Logsdail, S. M. Woodley, C. R. A. Catlow, M. J. Powell, R. G. Palgrave, I. P. Parkin, G. W. Watson, T. W. Keal, P. Sherwood, A. Walsh, A. A. Sokol, Nat Mater 2013, 12, 798.
[35] T. Kasuga, M. Hiramatsu, A. Hoson, T. Sekino, K. Niihara, Langmuir 1998, 14, 3160.
[36] M. Chaudhary, S.-m. Chang, R.-a. Doong, H.-m. Tsai, The Journal of Physical Chemistry C 2016, 120, 21381.
[37] S. Brunauer, P. H. Emmett, E. Teller, Journal of the American Chemical Society 1938, 60, 309.
[38] S. G. Chen, R. T. Yang, Langmuir 1994, 10, 4244. [39] P. C. Rao, A. K. S, S. Mandal, CrystEngComm 2014, 16, 9320.