Embed Size (px)
Citation preview

JOURNAL OF GEOPHYSICAL RESEARCH, VOL. 101, NO. B9, PAGES 20,175-20,194, SEPTEMBER 10, 1996
The effect of lower crustal flow on continental extension
and passive margin formation
John R. Hopper Danish Lithosphere Centre, Copenhagen
W. Roger Buck Lamont-Doherty Earth Observatory and the Department of Geological Sciences, Columbia University Palisades, New York
Abstract. The great variety of styles of continental extension may reflect different crustal thick- ness and thermal states of continental lithosphere during the initiation of rifting. To investigate how these and other factors affect rifting and the development of passive continental margins, we develop a simplified model of lithospheric extension. We consider the evolution of extensional deformation for a three-layer model lithosphere bounded laterally by much stronger lithosphere. The cold part of the crust and mantle are treated as thin brittle/plastic layers. The lower crust is approximated as a thin viscous channel. Each brittle/plastic layer can extend in only one location determined by the strength of the layer, shear of the lower crust, and buoyancy forces related to both crustal thickness variations and thermally induced density differences. The lower crust flows in response to crustal thickness variations and is sheared when the loci of extension for the two brittle/plastic layers are horizontally offset, a situation we term shear decoupling. As in previous studies, we see three distinct patterns, or modes, of extensional deformation that occur under dif- ferent sets of model parameters: the core complex mode, the wide rift mode, and the narrow rift mode. Shear decoupling occurs only in cases with a crustal rheology at the weak end of the spec- trum of laboratory estimated values. We are aware of no observations that require that the upper crust and upper mantle strain at laterally displaced positions. We show that for large magnitudes of extension there can be transitions between modes as inferred for some highly extended conti- nental areas. Predicted patterns of crustal thickness and heat flow for some models are similar to observations at several rifted continental margins, including very wide and asymmetric margins.
Introduction
It has been recognized for several decades that passive continental margins form by continental rifting and breakup (see Bond and Kominz [1988] for an historical perspective). Extensional styles of continental rifts and the patterns of observed strain, however, show great variability [Ruppel, 1995]. In particular, rifted areas range from tens of kilometers to several hundred kilometers in width. At one extreme are the Baikal and
the East African rift systems, which are less than 100 km wide [Logatchev et al., 1983]. At the other extreme is the U.S. Basin and Range province, which is several hundreds of kilometers wide [Hamilton, 1987]. In addition to narrow rifts and wide rifts, a third important style of extension is now recognized: the metamorphic core complex. Core complexes are areas where high-grade metamorphic rocks have been unroofed and are juxtaposed to overlying low-grade upper crustal rocks. One particularly puzzling aspect about core complexes is that they show very high surface strains but no evidence for local crustal thinning [Dokka et al., 1986; Davis, 1988]. One of the primary goals of recent modeling work has been to understand how extension of the lithosphere can produce such a great diversity of rifted structures and strain patterns.
Copyfight 1996 by the American Geophysical Union.
Paper number 96JB01644. 0148-0227/96/96JB-01644509.00
Narrow rifts and margins can be understood simply as stretching, or necking, of a strong plastic layer. For example, Artemjev and Artyushkov [ 1971] assume small perturbations in the layer thickness and therefore strength. Strain is concentrated in the weakest part of the layer, which therefore thins and so continues to weaken. In this way, a narrow rift system develops. Thermal models based on this idea assume pure shear deformation in the necking area [McKenzie, 1978] and are successful at predicting subsidence patterns at passive margins as recorded in the sediments [LePichon and Sibuet, 1981 ]. Several mechanical analyses suggest that finite-sized perturbations should cause deformation to localize in extending plastic or viscous layers [Zuber et al., 1986; Lin and Parmentier, 1990]. In addition, several coupled thermomechanical models of lithospheric stretching predict the formation of narrow margins [Braun and Beaumont, 1987; Bassi, 1991; Dunbar and Sawyer, 1989a,b].
While the origin of narrow rifts is not much debated, the origin of wide rifts has been more controversial. One idea is that wide
rifts are produced when extension rates are very slow relative to thermal diffusion rates in the lithosphere [England, 1983]. Because the weaker crust is replaced by stronger mantle, conductive cooling of the thinning lithosphere can result in an increase in the total force required to rift. If this happens, then the necking area becomes stronger and the deformation is instead spread out to other parts of the layer, thus creating a broad, diffuse zone of rifted crust [Kusznir and Park, 1987; Sonder and England, 1989].
20,175
20,176 HOPPER AND BUCK: LOWER CRUSTAL FLOW AND CONTINENTAL RIFFING
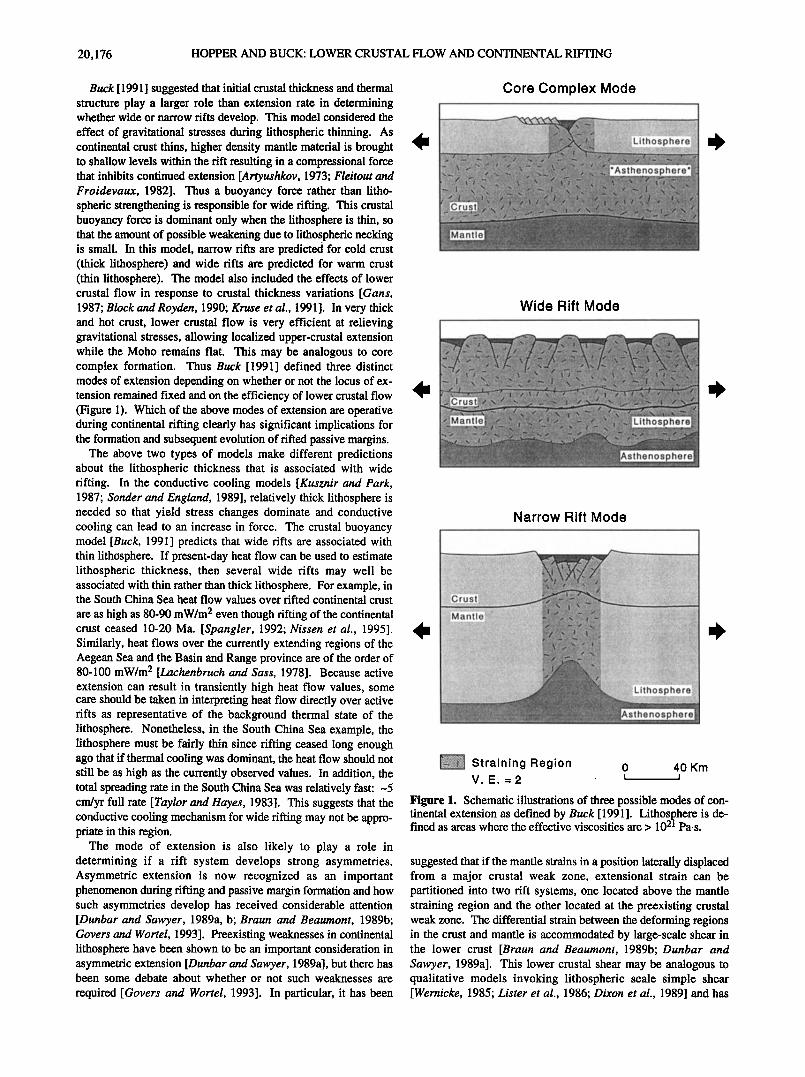
Buck [ 1991 ] suggested that initial crustal thickness and thermal structure play a larger role than extension rate in determining whether wide or narrow riffs develop. This model considered the effect of gravitational stresses during lithospheric thinning. As continental crust thins, higher density mantle material is brought to shallow levels within the riff resulting in a compressional force that inhibits continued extension [Artyushkov, 1973; Fleitout and Froidevaux, 1982]. Thus a buoyancy force rather than litho- spheric strengthening is responsible for wide rifting. This crustal buoyancy force is dominant only when the lithosphere is thin, so that the amount of possible weakening due to lithospheric necking is small. In this model, narrow rifts are predicted for cold crust (thick lithosphere) and wide riffs are predicted for warm crust (thin lithosphere). The model also included the effects of lower crustal flow in response to crustal thickness variations [Gans, 1987; Block and Royden, 1990; Kruse et al., 1991]. In very thick and hot crust, lower crustal flow is very efficient at relieving gravitational stresses, allowing localized upper-crustal extension while the Moho remains flat. This may be analogous to core complex formation. Thus Buck [1991] defined three distinct modes of extension depending on whether or not the locus of ex- tension remained fixed and on the efficiency of lower crustal flow (Figure 1). Which of the above modes of extension are operative during continental rifting clearly has significant implications for the formation and subsequent evolution of rifted passive margins.
The above two types of models make different predictions about the lithospheric thickness that is associated with wide rifting. In the conductive cooling models [Kusznir and Park, 1987; Sonder and England, 1989], relatively thick lithosphere is needed so that yield stress changes dominate and conductive cooling can lead to an increase in force. The crustal buoyancy model [Buck, 1991] predicts that wide rifts are associated with thin lithosphere. If present-day heat flow can be used to estimate lithospheric thickness, then several wide riffs may well be associated with thin rather than thick lithosphere. For example, in the South China Sea heat flow values over rifled continental crust
are as high as 80-90 mW/m 2 even though rifting of the continental crust ceased 10-20 Ma. [Spangler, 1992; Nissen et al., 1995]. Similarly, heat flows over the currently extending regions of the Aegean Sea and the Basin and Range province are of the order of 80-100 mW/m 2 [Lachenbruch and Sass, 1978]. Because active extension can result in transiently high heat flow values, some care should be taken in interpreting heat flow directly over active rifts as representative of the background thermal state of the lithosphere. Nonetheless, in the South China Sea example, the lithosphere must be fairly thin since rifting ceased long enough ago that if thermal cooling was dominant, the heat flow should not still be as high as the currently observed values. In addition, the total spreading rate in the South China Sea was relatively fast: ~5 cm/yr full rate [Taylor and Hayes, 1983]. This suggests that the
conductive cooling mechanism for wide rifting may not be ap• pro- priate in this region.
The mode of extension is also likely to play a role in determining if a riff system develops strong asymmetries. Asymmetric extension is now recognized as an important phenomenon during rifting and passive margin formation and how such asymmetries develop has received considerable attention [Dunbar and Sawyer, 1989a, b; Braun and Beaurnont, 1989b; Govers and Wonel, 1993]. Preexisting weaknesses in continental lithosphere have been shown to be an important consideration in asymmetric extension [Dunbar and Sawyer, 1989a], but there has been some debate about whether or not such weaknesses are
required [Govers and Wortel, 1993]. In particular, it has been
Core Complex Mode
Wide Rift Mode
Narrow Rift Mode
• ...... Straining Region 0 40 Km V.E.=2 • •
Figure 1. Schematic illustrations of three possible modes of con- tinental extension as defined by Buck [ 1991 ]. Lithosphere is de- fined as areas where the effective viscosities are > 102• Pa.s.
suggested that if the mantle strains in a position laterally displaced from a major crustal weak zone, extensional strain can be partitioned into two rift systems, one located above the mantle straining region and the other located at the preexisting crustal weak zone. The differential strain between the deforming regions in the crust and mantle is accommodated by large-scale shear in the lower crust [Braun and Beaumont, 1989b; Dunbar and Sawyer, 1989a]. This lower crustal shear may be analogous to qualitative models invoking lithospheric scale simple shear [Wernicke, 1985; Lister et al., 1986; Dixon et al., 1989] and has
HOPPER AND BUCK: LOWER CRUSTAL FLOW AND CONTINENTAL RIFTING 20,177
lead to the suggestion that shear decoupling of the upper crust and upper mantle is possible.
In this contribution, we further develop the model of Buck [ 1991 ] to look at the long time evolution of an extending region. We investigate how changes in the mode and geometry of extension can occur with time. For the thermal evolution, we solve the two-dimensional equations for conduction and advection of heat. Mechanically, the continental lithosphere is modeled as three interacting thin layers on top of an inviscid substrate. The upper crust and mantle lithosphere layers are brittle/plastic and the lower crust is a viscous channel. This layered lithosphere ap- proach is similar to that taken by Bird [1989] to look at one sce- nario for the three-dimensional deformation history of the western United States. Here we consider only the two-dimensional devel- opment of margins and show how the initial crustal thickness and thermal structure of a region affects its extensional evolution. We consider how different crustal rheologies and rates of extension affect the evolution. Also, we allow for decoupling in the sense that the upper crust and upper mantle are treated separately but in- teract by shearing the lower crust. We show what conditions are required for the crust and mantle to deform at positions laterally displaced from each other.
Model Description and Methods Continental crust has a composition, rheology, and density very
different from the mantle. These differences may cause the crust and mantle to deform in a different manner during continental ex- tension. For a range of thermal gradients, the lower crust may be hot enough to creep at a low level of applied stress, while the up- per crust and uppermost part of the mantle are so strong that they can only deform when the stress is great enough to cause brittle faulting and frictional sliding [Brace and Kohlstedt, 1980]. On the basis of laboratory measurements extrapolated to Earth condi- tions, there can be several orders of magnitude variation in the strength (or the effective viscosity) between the upper surface of
the crust to the mantle lithosphere. Such large variations are dif- ficult to incorporate in continuum models of lithospheric deforma- tion that numerically solve the conservation equations in two and even three dimensions.
While there are many numerical techniques that can solve for deformation with such large strength variations, most tend to be computationally intensive and so it is difficult to run many models over a wide range of parameter space [e.g., Braun and Beaumont, 1987; Christensen, 1992]. Here we adopt several approximations commonly used to make calculations computationally more effi- cient. The most important is the thin sheet approximation, which effectively removes the vertical dimension from the problem by assuming that the properties of the lithosphere at some horizontal position can be approximated by vertical averages [England et al., 1985; Sonder and England, 1989]. Models that solve the full set of conservation equations in two dimensions confirm that the predicted behavior of these more approximate models is basically correct [Christensen, 1992; Bassi et al., 1993]. The thin sheet ap- proach implies that vertical gradients in horizontal velocities are negligible, a condition that is not satisfied when there is signifi- cant lower crustal flow. Thus we consider the lower crust as a
separate layer and treat the continental lithosphere as three thin interacting layers.
Mechanical Considerations and Geometry
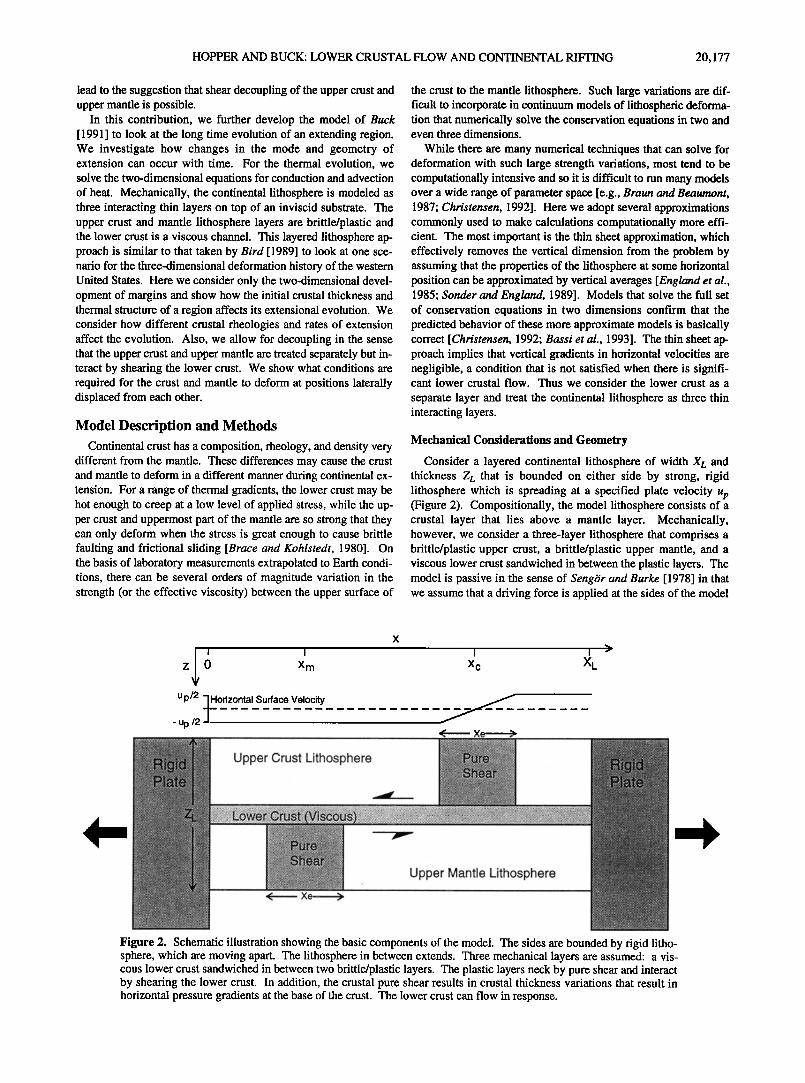
Consider a layered continental lithosphere of width Xœ and thickness Zœ that is bounded on either side by strong, rigid lithosphere which is spreading at a specified plate velocity up (Figure 2). Compositionally, the model lithosphere consists of a crustal layer that lies above a mantle layer. Mechanically, however, we consider a three-layer lithosphere that comprises a brittle/plastic upper crust, a brittle/plastic upper mantle, and a viscous lower crust sandwiched in between the plastic layers. The model is passive in the sense of Seng6r and Burke [1978] in that we assume that a driving force is applied at the sides of the model
x
Z 0 X m Xc XL
Up/2 •Ho rizont_.al_.S u..?a_ce V_elo_cit._y ............. • ....... -Up/2
' r -' '. -'
ß Upper Crust L,thosphere IF
........... • .................................................................................................................................................................................................................... •"•'z '•'•'••••••;•••••{•.• ............................... '•• '• .••i
•...•. >,•.•... •...: ......... •.•.. ß ß •:;,• .......... .
[--'•x ..... -'-'"'•'•-•••;•l Upper Mantle Lithosphere .::•..•! '
< Xe Figure 2. Schematic illustration showing the basic components of the model. The sides are bounded by rigid litho- sphere, which are moving apart. The lithosphere in between extends. Three mechanical layers are assumed: a vis- cous lower crust sandwiched in between two brittle/plastic layers. The plastic layers neck by pure shear and interact by shearing the lower crust. In addition, the crustal pure shear results in crustal thickness variations that result in horizontal pressure gradients at the base of the crust. The lower crust can flow in response.
20,178 HOPPER AND BUCK: LOWER CRUSTAL FLOW AND CONTINENTAL RIFTING
lithosphere and that there is always enough force available to drive extension. The upper crust and upper mantle are assumed to strain at locations centered at Xc and Xm, respectively, while the lower crust deforms anywhere it is stressed.
Force balance. The lithosphere will strain in such a way that the total force required to deform is minimized. There are four contributions that we consider in our approximation of the total force: yield stresses, crustal buoyancy forces, thermal buoyancy forces, and shear stresses in the lower crust.
Yield stresses. Following Brace and Kohlstedt [1980], we treat the continental lithosphere as rheologically layered. At any given depth, it is assumed that a rock will deform if enough stress is applied to cause either frictional sliding (Byedee's law) or ductile flow at a specified strain rate. Whichever of these two processes has the lower required stress difference at a given depth defines the yield stress there. The differential stress for brittle deformation is a linear function of the vertical stress (i.e., crb = Btxl) where the constant depends on the fluid pressure and the friction coefficient [Brace and Kohlstedt, 1980]. Here the vertical stress is found explicitly as o) = fp(z)dz, where p(z) is the density as a function of depth.
For ductile flow, the stress difference can be related to strain rate as
a= exp[E/nRT], (1)
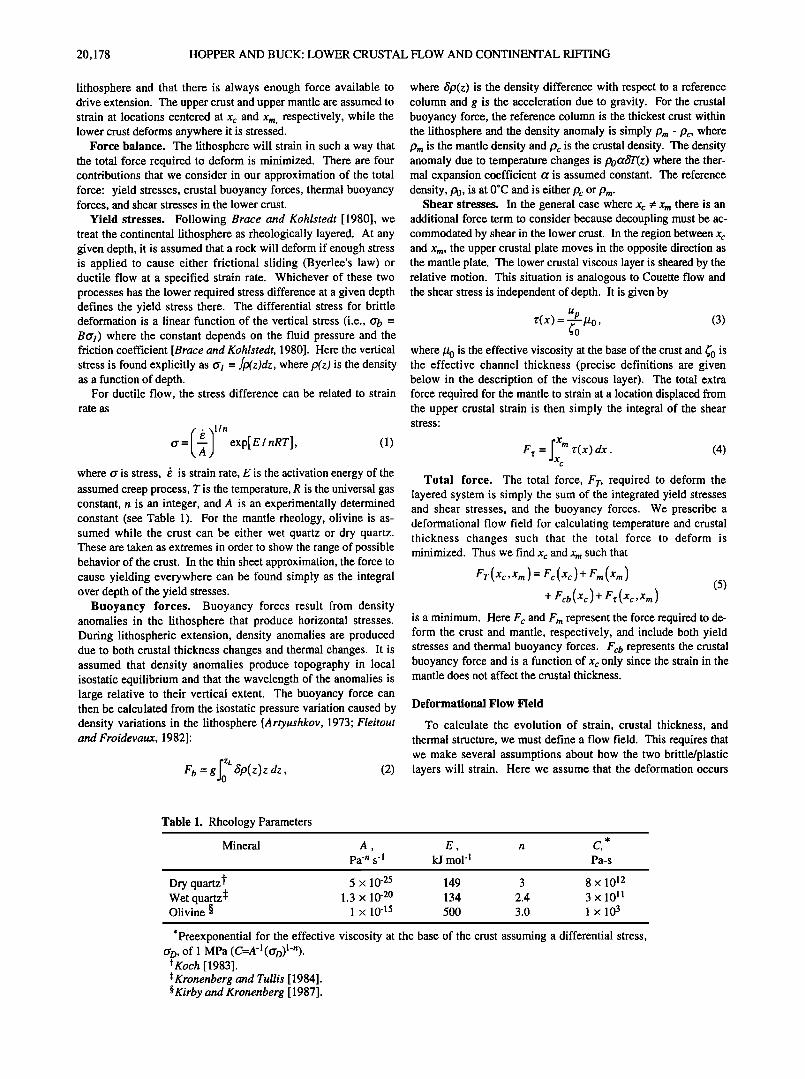
where o' is stress, k is strain rate, E is the activation energy of the assumed creep process, T is the temperature, R is the universal gas constant, n is an integer, and A is an experimentally determined constant (see Table 1). For the mantle theology, olivine is as- sumed while the crust can be either wet quartz or dry quartz. These are taken as extremes in order to show the range of possible behavior of the crest. In the thin sheet approximation, the force to cause yielding everywhere can be found simply as the integral over depth of the yield stresses.
anomalies in •he lithosphere •hat produce horizontal stresses. •uring lithospheric extension, density anomalies are produced due to both crustal thickness changes and thermal changes. It is assumed that density anomalies produce topography in local isostatic equilibrium and that the wavelength of the anomalies is large relative to their vertical extent. The buoyancy force can then be calculated from the isostatic pressure variation caused by density variations in the lithosphere [Artyushkov, 1973' Fleitout and Froidevaux, 1982]:
F b =g tSp(z)zdz, (2)
where 6p(z) is the density difference with respect to a reference column and g is the acceleration due to gravity. For the crustal buoyancy force, the reference column is the thickest cmst within the lithosphere and the density anomaly is simply Pm- Pc, where Pm is the mantle density and Pc is the cmstal density. The density anomaly due to temperature changes is poOtb•(z) where the ther- mal expansion coefficient a is assumed constant. The reference density, P0, is at 0øC and is either Pc or Pa.
Shear stresses. In the general case where Xc • Xm there is an additional force term to consider because decoupling must be ac- commodated by shear in the lower cmst. In the region between Xc and Xm, the upper crustal plate moves in the opposite direction as the mantle plate. The lower cmstal viscous layer is sheared by the relative motion. This situation is analogous to Couette flow and the shear stress is independent of depth. It is given by
Up
x(x) = •0 kt 0 , (3) where P0 is the effective viscosity at the base of the cmst and •J0 is the effective channel thickness (precise definitions are given below in the description of the viscous layer). The total extra force required for the mantle to strain at a location displaced from the upper cmstal strain is then simply the integral of the shear stress:
F r = lx• n •'(x) dx. (4) Total force. The total force, F r, required to deform the
layered system is simply the sum of the integrated yield stresses and shear stresses, and the buoyancy forces. We prescribe a deformational flow field for calculating temperature and crustal thickness changes such that the total force to deform is minimized. Thus we find x c and x m such that
r•(Xc,Xm)= rc(Xc)+ •m(Xm) (5)
+ Fcb(Xc )+ Fr(xc,Xm) is a minimum. Here F c and Fm represent the force required to de- form the crust and mantle, respectively, and include both yield stresses and thermal buoyancy forces. Fct , represents the crustal buoyancy force and is a function of Xc only since the strain in the mantle does not affect the crustal thickness.
Deformational Flow Field
To calculate the evolution of strain, crustal thickness, and
thermal structure, we must define a flow field. This requires that we make several assumptions about how the two brittle/plastic layers will strain. Here we assume that the deformation occurs
Table 1. Rheology Parameters
Mineral A, E, n C, Pa -n s -1 kJ mo1-1 Pa-s
Dry quartz•' 5 x 10 -25 149 3 8 x 10¹² Wet quartz :l: 1.3 x 10 © 134 2.4 3 x 10 TM Olivine õ 1 x 10 -15 500 3.0 1 x 10³
*Preexponential for the effective viscosity at the base of the crust assuming a differential stress, o' D, of 1 MPa (C-A'I(O'D)I-n). t Koch [ 1983 ]. • Kronenberg and Tullis [ 1984]. õ Kirby and Kronenberg [ 1987].
HOPPER AND BUCK: LOWER CRUSTAL FLOW AND CONTINENTAL RIFTING 20,179
via bulk pure shear over a width determined by the thickness and viscosity structure of the layers. The velocities vary linearly as a function of depth and horizontal position within the straining region. This assumption is justified based on numerical and analytic models that show that the width of a plastic necking region scales roughly as the thickness of that layer [e.g., Lin and Parmentier, 1990]. As described above, the centers of the deforming regions are determined by the position where strain can occur at the minimum of tectonic force according to equation (5). The mantle passively upwells beneath the crustal necking region. In each layer we calculate the depth to where the effective viscosity (determined as cr/• for an assumed • ) is an order of magnitude less than at the brittle ductile transition in each layer. The total thickness from the top of the layer to this depth determines the width of the necking region. The minimum assumed width for either layer is 20 km so that the pure shear flow field is always well defined on the numerical grid. When the crust is very thick and/or very hot, the upper mantle may be entirely ductile. In this case the width of the mantle straining region is again set to the minimum value of 20 km.
The viscous lower crust deforms anywhere it is stressed. Horizontal pressure gradients caused by crustal thickness varia- tions will cause the lower crust to flow at a rate determined by its effective viscosity [Bird, 1991; Buck, 1991]. In addition, the lower crust is sheared when the localized extension in the upper crust is laterally displaced from extension in the mantle (i.e., when x c •: Xm).
We consider a linear viscous, temperature dependent viscosity in the lower crust of the form #(•) = #0 exp[ •0], where • = Zm- z and is the distance above the base of the crust, which is at a
depth Zm. The effective viscosity at the base of the crust is/•o = C exp[E/RTm] and the viscous channel length scale is (,0 = RTm2/(E.o•F/•). Here C is an experimentally determined rheologic parameter, T m is the temperature at the base of the crust, and aT/•' is the temperature gradient at the base of the crust. The viscosity is linearized in a way consistent with the power law rheology specified in (1). Thus C = O'd (I-n) A 'l, where o' a is the average deviatoric stress at the base of the crust. Table 1 shows values of C for cra = 1 MPa, which we assume as a lower limit for calculating viscosity. The linear viscosity therefore does not imply anything about creep mechanisms in the lower crust.
The basic equations for lower crustal flow have been derived previously by Bird [1991] and Buck [1991]. The problem is con- sidered as a simple channel flow problem and the velocities can be solved for analytically. The final result can be expressed as a one-dimensional diffusion-advection equation for crustal thick- ness variations through time:
o•h o• tc f Sh •x •' = •xx '•xx - ( uh ) , (6) where h(x) is the crustal thickness, and • is the crustal diffusiv- ity:
g P'-'C-C(pm -Pc )•0 3 (x) Pm
tcf = . (7) u0(x)
The last term in (6) accounts for the pure shear in the crust as well as advection of crustal thickness variations. The effect of lower
crustal flow is entirely described by the diffusion term. The me- chanical boundary condition can be thought of as moving walls where o•h/0x = 0 at x = 0 and x = Xœ, but the distance Xœ increases with time according to the specified plate velocity. Initially, the straining regions are assumed to be at the center of the model, presumably because of some infinitesimal weakness there.
To record the surface strain of the model lithosphere, we include passive, Lagrangian strain markers at the surface. These are simply advected at each time step and the horizontal surface strain, e, is calculated as the change in distance between adjacent markers divided by the original distance between them. In plots of the surface strain, we show l+e for direct comparison to the crustal thinning parameter/5. The basic model parameters and constants are given in Table 2. The total velocity field for deformation is simply the sum of the pure shear fields and the lower crustal flow field.
Thermal Calculation
Both the lower crustal viscosity and lithospheric strength are strongly temperature dependent. Thus we consider the heat flow equation in two dimensions:
•t ( •'-•- + a-•-) , (8) •T
where T is temperature, r r is the thermal diffusivity (assumed const•t throughout the lithosphere), •d H(x,z) represents crustal heat sources. For the heat soume term, we adopt the usual formu- lation that assumes the decay of radioactive elements is the only impo•ant source of heat and that the abundance of such elements decreases exponentially with depth [Birch et aL, 1968; •chenbruch, 1970; Sclater et al., 1980]. The heat source term is
H(z)=Hsexp[-z/Hr] z<zm , (9)
z>zm
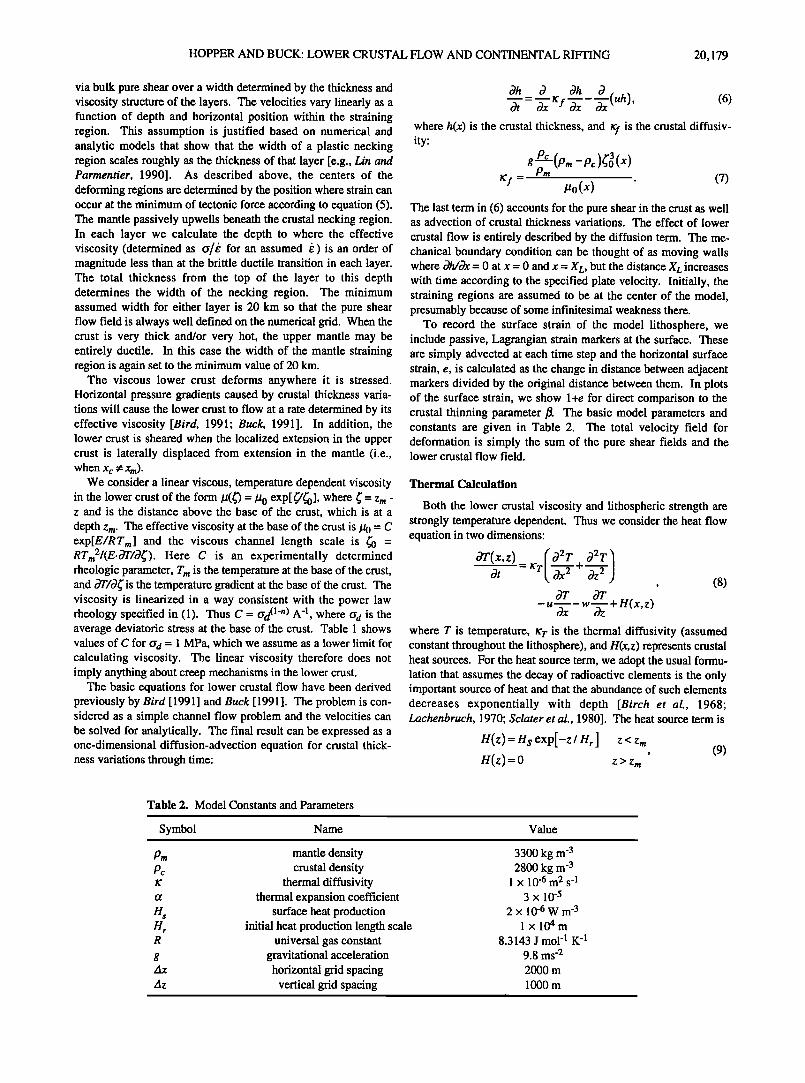
Table 2. Model Constants and Parameters
Symbol Name
Pm mantle density Pc crustal density tc thermal diffusivity o• thermal expansion coefficient H s surface heat production H r initial heat production length scale R universal gas constant g gravitational acceleration Ax horizontal grid spacing Az vertical grid spacing
Value
3300 kg m -3 2800 kg m -3
1 x 10⁻⁶ m2 s -1 3x l0 -5
2x 10⁻⁶ W m -3 1 x10⁴m
8.3143 J mo1-1 K '1 9.8 ms -2 2000 m
1000 m
20,180 HOPPER AND BUCK: LOWER CRUSTAL FLOW AND CONTINENTAL RIFFING
where H s is the surface heat production, H r is a length scale for decay, and Zm is the base of the crust as before. The values used here are given in Table 2 and contribute 20 mW/m 2 to the initial surface heat flow. The H r length scale changes as the model lithosphere deforms. This is accomplished by advecting the heat source terms at each time step according to the prescribed velocity field. The advective velocities, u and w, are simply the sum of the pure shear velocities and lower crustal flow velocities as de- scribed earlier.
The initial condition is found as the steady state thermal profile for a given mantle heat flux (which is varied in the calculations) and a surface temperature of T=25øC. The initial lithospheric thickness is then defined as the depth to the 1330øC isotherm and depends on the assumed mantle heat flux. The thermal boundary conditions are constant temperature at the surface and at a fixed depth which is set at the initial base of the lithosphere. The sur- face is kept at 25øC while the base is kept at 1330øC. At the sides, we set c7F/o• = 0.
At each time step we calculate a new crustal thickness using (6) and update the temperature field according to (8). The equations are solved using explicit finite differences where the diffusive terms are center differenced and the advective terms are
upwind differenced. We then calculate the force to continue deformation and determine x c and x m such that the total force is minimized (equation (5)).
The mode of deformation can be defined based on whether or
not the positions x c and x m change through time. This depends on the difference in force required to strain the lithosphere within the actively straining region and the force required to strain the nearby undeformed regions. A negative force difference implies that the force to deform within the straining region is less than that outside of the straining region. On the other hand, a positive difference implies that the force is greater within the straining re- gion.
A positive difference in force makes continued extension more difficult and so a wide rift develops as the centers of active ex- tension migrate to other areas of the model lithosphere. in this model, there are two possibilities for wide rift mode. The first is that the crust and mantle straining regions migrate together during wide rift mode and the second is that the crust can deform in wide
rift mode while the mantle straining region remains fixed. The magnitude of the extra force required to shear the lower crust (equation (4)) will then determine which of these two wide rift modes is expected.
A negative difference in force favors continued extension at a single location and so results in either core complex mode or narrow rift mode depending on the efficiency of lower crustal flow. Under cooler conditions, the lower crust is too viscous to
flow easily on the timescale of the model and a narrow rift forms. Under hot conditions, the lower crust flows rapidly and a core complex develops. The Moho and surface topography stay flat in this case. The efficiency of flow is measured by comparing the crustal thickness in the straining region to the thickness that would be predicted if lower crustal flow were neglected. Core complex mode is defined when the crustal buoyancy force is less than one-tenth the value that would be predicted for the same cal- culation with no lower crustal flow.
Model Results
Because of the simplicity of the model, it is possible to do calculations relatively quickly. This makes it possible to consider a wide range of material parameters and initial conditions. In the
calculations, the most important factors to consider are the initial crustal thickness, the surface heat flow, and the rheology of the lower crust. All of these control the effective viscosity of the lower crust and the channel thickness (•'o), which determine the rate of lower crustal flow. We first show how decoupling modi- fies the modes of extension defined previously and then demon- strate calculations of the time evolution of deformation.
Predicted Modes of Extension
We first do short-time duration calculations to map out the conditions for which the model predicts each mode of extension as defined previously. In this calculation, the forces are not calculated every iteration. The model is allowed to evolve with x c = Xm = a constant for 1 m.y. of dimensional model time (of the order of 1000 time steps or less, depending primarily on the efficiency of lower crustal flow) and then the force balance is calculated to determine the mode of extension. This is similar to
the approach taken by Buck [ 1991 ] for making such mode maps. The shear force term is calculated assuming that the maximum displacement of x c from x m is Xœ/2 in determining the force balance.
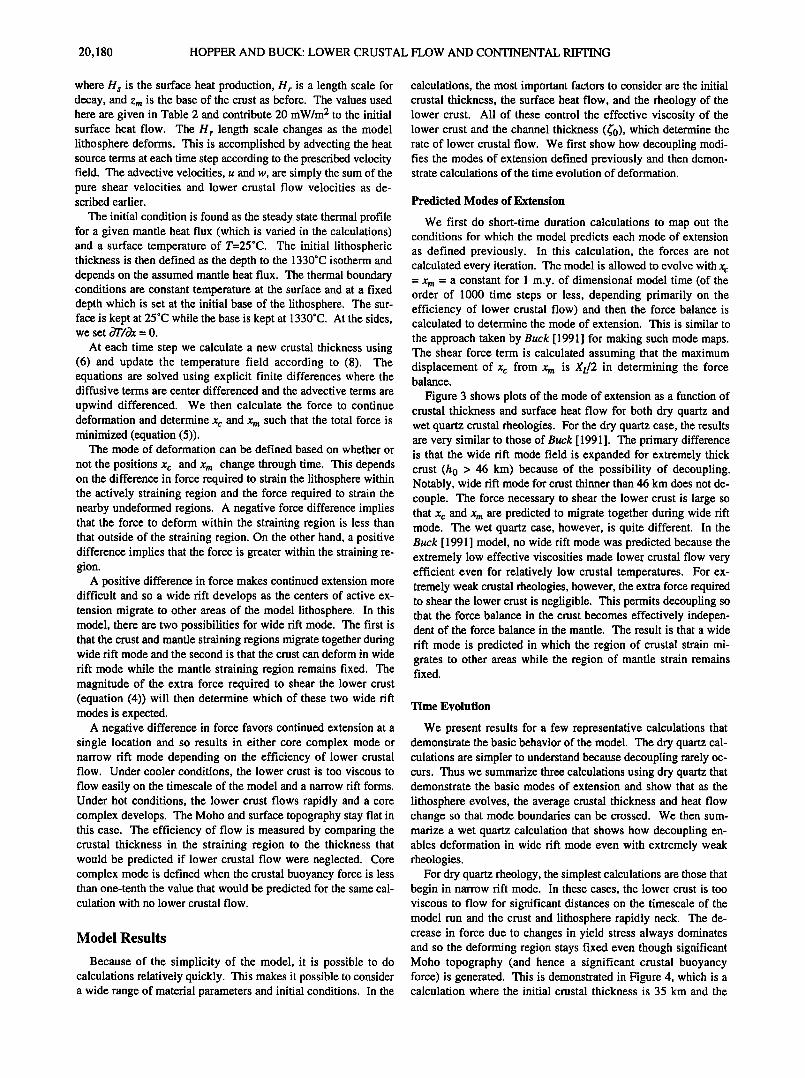
Figure 3 shows plots of the mode of extension as a function of crustal thickness and surface heat flow for both dry quartz and wet quartz crustal rheologies. For the dry quartz case, the results are very similar to those of Buck [ 1991 ]. The primary difference is that the wide rift mode field is expanded for extremely thick crust (h 0 > 46 km) because of the possibility of decoupling. Notably, wide rift mode for crust thinner than 46 km does not de- couple. The force necessary to shear the lower crust is large so that Xc and x m are predicted to migrate together during wide rift mode. The wet quartz case, however, is quite different. In the Buck [ 1991 ] model, no wide rift mode was predicted because the extremely low effective viscosities made lower crustal flow very efficient even for relatively low crustal temperatures. For ex- tremely weak crustal rheologies, however, the extra force required to shear the lower crust is negligible. This permits decoupling so that the force balance in the crust becomes effectively indepen- dent of the force balance in the mantle. The result is that a wide
rift mode is predicted in which the region of crustal strain mi- grates to other areas while the region of mantle strain remains fixed.
Time Evolution
We present results for a few representative calculations that demonstrate the basic behavior of the model. The dry quartz cal- culations are simpler to understand because decoupling rarely oc- curs. Thus we summarize three calculations using dry quartz that demonstrate the basic modes of extension and show that as the
lithosphere evolves, the average crustal thickness and heat flow change so that mode boundaries can be crossed. We then sum- marize a wet quartz calculation that shows how decoupling en- ables deformation in wide rift mode even with extremely weak rheologies.
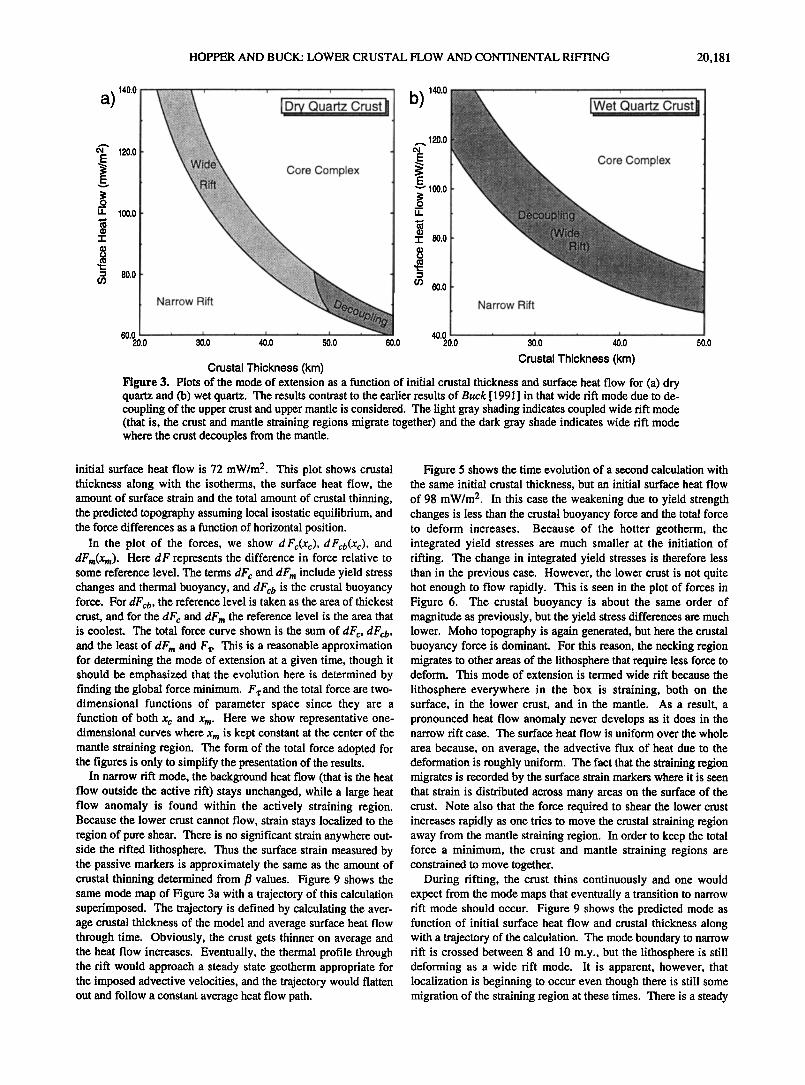
For dry quartz rheology, the simplest calculations are those that begin in narrow rift mode. In these cases, the lower crust is too viscous to flow for significant distances on the timescale of the model run and the crust and lithosphere rapidly neck. The de- crease in force due to changes in yield stress always dominates and so the deforming region stays fixed even though significant Moho topography (and hence a significant crustal buoyancy force) is generated. This is demonstrated in Figure 4, which is a calculation where the initial crustal thickness is 35 km and the
HOPPER AND BUCK: LOWER CRUSTAL FLOW AND CONTINENTAL RIFTING 20,181
140.0 140.0
•,, 120.0 120.0
100.0
100.0 iT'
• 80.0
80.0 • 60.0
60'•0.0 30.0 40.0 50.0 60.0 40.0 • • 20.0 30:0 40.0 50.0
Crustal Thickness (km) Crustal Thickness (km)
Figure 3. Plots of the mode of extension as a function of initial crustal thickness and surface heat flow for (a) dry quartz and (b) wet quartz. The results contrast to the earlier results of Buck [ 1991 ] in that wide rift mode due to de- coupling of the upper crust and upper mantle is considered. The light gray shading indicates coupled wide rift mode (that is, the crust and mantle straining regions migrate together) and the dark gray shade indicates wide rift mode where the crust decouples from the mantle.
initial surface heat flow is 72 mW/m 2. This plot shows crustal thickness along with the isotherms, the surface heat flow, the amount of surface strain and the total amount of crustal thinning, the predicted topography assuming local isostatic equilibrium, and the force differences as a function of horizontal position.
In the plot of the forces, we show d Fc(xc), d Fct,(Xc), and dFm(xm). Here d F represents the difference in force relative to some reference level. The terms dF c and dF m include yield stress changes and thermal buoyancy, and dFct, is the crustal buoyancy force• For dFct ,, the reference level is taken as the area of thickest crust, and for the dFc and dFm the reference level is the area that is coolest. The total force curve shown is the sum of dF c, dFct ,, and the least of dF m and F,. This is a reasonable approximation for determining the mode of extension at a given time, though it should be emphasized that the evolution here is determined by finding the global force minimum. F, and the total force are two- dimensional functions of parameter space since they are a function of both x c and Xm. Here we show representative one- dimensional curves where x m is kept constant at the center of the mantle straining region. The form of the total force adopted for the figures is only to simplify the presentation of the results.
In narrow rift mode, the background heat flow (that is the heat flow outside the active rift) stays unchanged, while a large heat flow anomaly is found within the actively straining region. Because the lower crust cannot flow, strain stays localized to the region of pure shear. There is no significant strain anywhere out- side the rifted lithosphere. Thus the surface strain measured by the passive markers is approximately the same as the amount of crustal thinning determined from ,B values. Figure 9 shows the same mode map of Figure 3a with a trajectory of this calculation superimposed. The trajectory is defined by calculating the aver- age crustal thickness of the model and average surface heat flow through time. Obviously, the crust gets thinner on average and the heat flow increases. Eventually, the thermal profile through the rift would approach a steady state geotherm appropriate for the imposed advective velocities, and the trajectory would flatten out and follow a constant average heat flow path.
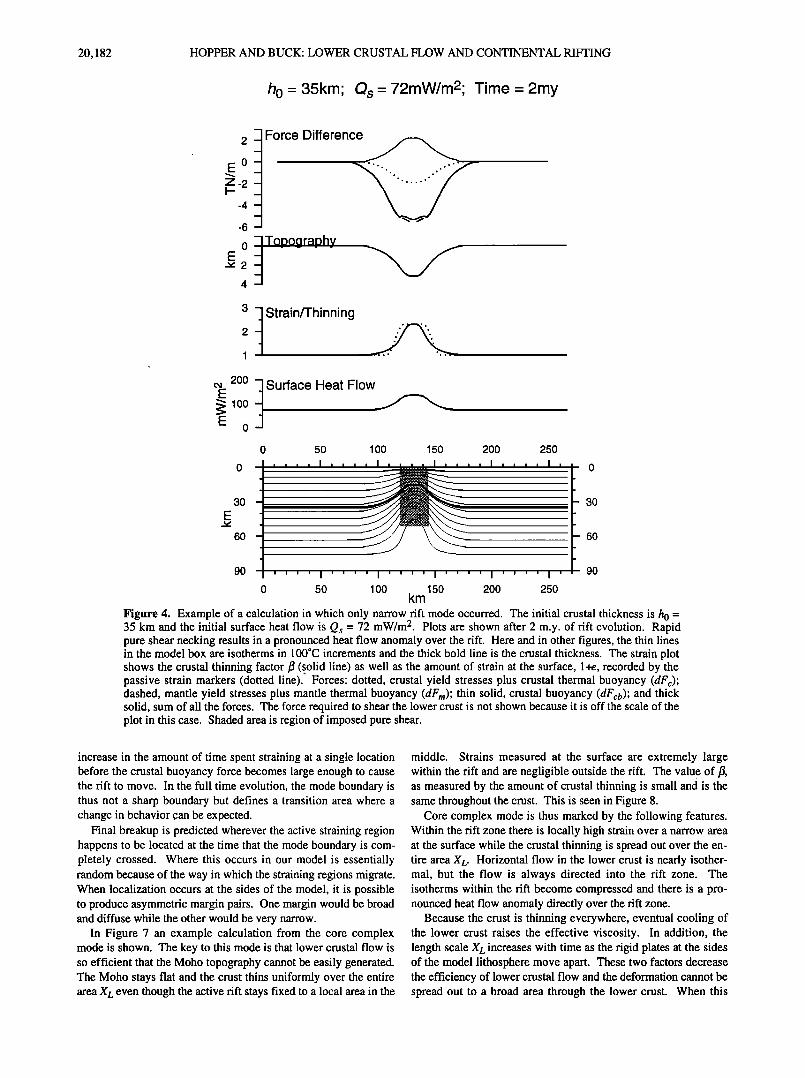
Figure 5 shows the time evolution of a second calculation with the same initial crustal thickness, but an initial surface heat flow
of 98 mW/m 2. In this case the weakening due to yield strength changes is less than the crustal buoyancy force and the total force to deform increases. Because of the hotter geotherm, the integrated yield stresses are much smaller at the initiation of rifting. The change in integrated yield stresses is therefore less than in the previous case. However, the lower crust is not quite hot enough to flow rapidly. This is seen in the plot of forces in Figure 6. The crustal buoyancy is about the same order of magnitude as previously, but the yield stress differences are much lower. Moho topography is again generated, but here the crustal buoyancy force is dominant. For this reason, the necking region migrates to other areas of the lithosphere that require less force to deform. This mode of extension is termed wide rift because the
lithosphere everywhere in the box is straining, both on the surface, in the lower crust, and in the mantle. As a result, a
pronounced heat flow anomaly never develops as it does in the narrow rift case. The surface heat flow is uniform over the whole
area because, on average, the advective flux of heat due to the deformation is roughly uniform. The fact that the straining region migrates is recorded by the surface strain markers where it is seen that strain is distributed across many areas on the surface of the crust. Note also that the force required to shear the lower crust increases rapidly as one tries to move the crustal straining region away from the mantle straining region. In order to keep the total force a minimum, the crust and mantle straining regions are constrained to move together.
During rifting, the crust thins continuously and one would expect from the mode maps that eventually a transition to narrow rift mode should occur. Figure 9 shows the predicted mode as function of initial surface heat flow and crustal thickness along with a trajectory of the calculation. The mode boundary to narrow rift is crossed between 8 and 10 m.y., but the lithosphere is still deforming as a wide rift mode. It is apparent, however, that localization is beginning to occur even though there is still some migration of the straining region at these times. There is a steady
20,182 HOPPER AND BUCK: LOWER CRUSTAL FLOW AND CONTINENTAL RIb-TING
h o - 35km; Qs- 72mW/m2; Time - 2my
Z-2- I-
-4
-6
o ¾2
4
Force Difference
200 •Surface Heat Flow 100 • o
0 50 1 O0 150 200 250
30
90
30
60
90
0 50 100 150 200 250 km
Figure 4. Example of a calculation in which only narrow rift mode occurred. The initial crustal thickness is h 0 = 35 km and the initial surface heat flow is Qs = 72 mW/m 2. Plots are shown after 2 m.y. of rift evolution. Rapid pure shear necking results in a pronounced heat flow anomaly over the rift. Here and in other figures, the thin lines in the model box are isotherms in 100øC increments and the thick bold line is the crustal thickness. The strain plot shows the crustal thinning factor ,6 (s, olid line) as well as the amount of strain at the surface, 1 +e, recorded by the passive strain markers (dotted line). Forces: dotted, crustal yield stresses plus crustal thermal buoyancy (dFc)' dashed, mantle yield stresses plus mantle thermal buoyancy (dFm); thin solid, crustal buoyancy (dFct,); and thick solid, sum of all the forces. The force required to shear the lower crust is not shown because it is off the scale of the plot in this case. Shaded area is region of imposed pure shear.
increase in the amount of time spent straining at a single location before the crustal buoyancy force becomes large enough to cause the rift to move. In the full time evolution, the mode boundary is thus not a sharp boundary but defines a transition area where a change in behavior can be expected.
Final breakup is predicted wherever the active straining region happens to be located at the time that the mode boundary is com- pletely crossed. Where this occurs in our model is essentially random because of the way in which the straining regions migrate. When localization occurs at the sides of the model, it is possible to produce asymmetric margin pairs. One margin would be broad and diffuse while the other would be very narrow.
In Figure 7 an example calculation from the core complex mode is shown. The key to this mode is that lower crustal flow is so efficient that the Moho topography cannot be easily generated. The Moho stays flat and the crust thins uniformly over the entire area X L even though the active rift stays fixed to a local area in the
middle. Strains measured at the surface are extremely large within the rift and are negligible outside the rift. The value of t5, as measured by the amount of crustal thinning is small and is the same throughout the crust. This is seen in Figure 8.
Core complex mode is thus marked by the following features. Within the rift zone there is locally high strain over a narrow area at the surface while the crustal thinning is spread out over the en- tire area Xœ. Horizontal flow in the lower crust is nearly isother- mal, but the flow is always directed into the rift zone. The isotherms within the rift become compressed and there is a pro- nounced heat flow anomaly directly over the rift zone.
Because the crust is thinning everywhere, eventual cooling of the lower crust raises the effective viscosity. In addition, the length scale Xœ increases with time as the rigid plates at the sides of the model lithosphere move apart. These two factors decrease the efficiency of lower crustal flow and the deformation cannot be spread out to a broad area through the lower crust. When this
HOPPER AND BUCK: LOWER CRUSTAL FLOW AND CONTINENTAL RIb-TING 20,183
o
o
20
14 my 4O
60
20
12 my 40
60
20 -
10 my 40 -
8 my
60
6 my
4 my
50 100 150 200 250 300 350
50 100 150 200 250 300 350
.... I .... I .... I .... ! .... I .... •'1 ....
i 0 20
- 40
60
0 50 1 O0 150 200 250 300 350
• • • • I , • • • I • , , , I .... I .... I .... I ....
-- , !:::::::'--".-'i.j•;ili;i;::;!;!:.i!! •
20
40
60
0 50 1 O0 150 200 250 300
0 I .... I .... I .... I .... I , , , 0
20 20
40 40
60 1 .... I .... I I 60
20
40
0 50 1 O0 150 200 250 300
60
20
40
60
0 50 100 150 200 250
I .... I .... I .... I .... I .... I , . , 0 .:....:.--.:.--.:..-.:.......:. 0
20 20
60 , • .... 60
0 50 1 O0 150 200 250
0 0
20
2 my 4O
60
20
40
60
20
40
60
0 50 1 O0 150 200 250
Figure 5. Time evolution of a calculation that begins in wide rift mode. The initial crustal thickness is h 0 = 35 km and the initial surface heat flow is Qs = 98 mW/m 2. Shaded areas represent the location of the imposed pure shear straining regions at the time plotted. Localization into narrow rift mode begins at 8-10 m.y. and by 14 m.y. rapid necking in a small area takes place. Both horizontal and vertical axes are scaled to km.
20,184 HOPPER AND BUCK: LOWER CRUSTAL FLOW AND CONTINENTAL RIFTING
h o = 35 km; Qs = 98 mW/m2; Time = 12 my
Force D•fference' -.. /
• 0 ............ '-
-2
1
200 '•.JSurface Heat Flow • •
o 0 50 1 O0 150 200 250 300 350
0 0
20 2O
40 40
60 60
0 50 1 O0 150 200 250 300 350 km
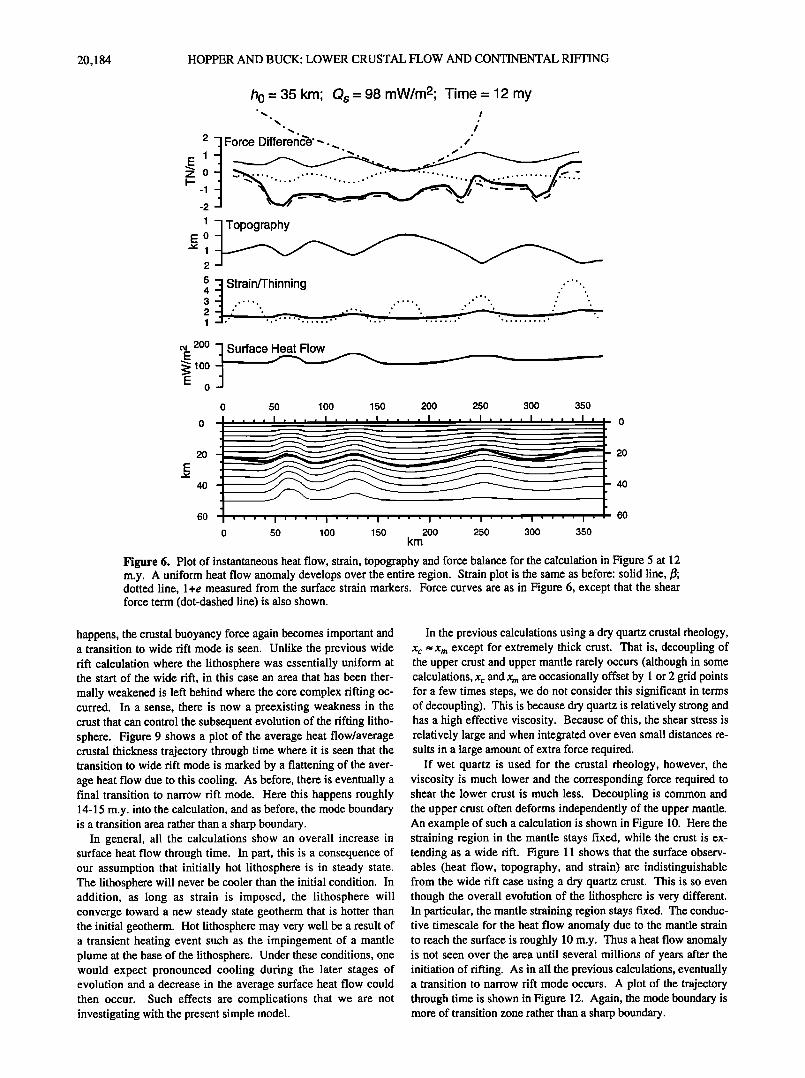
Figure 6. Plot of instantaneous heat flow, strain, topography and force balance for the calculation in Figure 5 at 12 m.y. A uniform heat flow anomaly develops over the entire region. Strain plot is the same as before: solid line, ]3; dotted line, l+e measured from the surface strain markers. Force curves are as in Figure 6, except that the shear force term (dot-dashed line) is also shown.
happens, the crustal buoyancy force again becomes important and a transition to wide rift mode is seen. Unlike the previous wide rift calculation where the lithosphere was essentially uniform at the start of the wide rift, in this case an area that has been ther- mally weakened is left behind where the core complex rifting oc- curred. In a sense, there is now a preexisting weakness in the crust that can control the subsequent evolution of the rifting litho- sphere. Figure 9 shows a plot of the average heat flow/average crustal •.hickness trajectory through time where it is seen that the transition to wide rift mode is marked by a flattening of the aver- age heat flow due to this cooling. As before, there is eventually a final transition to narrow rift mode. Here this happens roughly 14-15 m.y. into the calculation, and as before, the mode boundary is a transition area rather than a sharp boundary.
In general, all the calculations show an overall increase in surface heat flow through time. In part, this is a consequence of our assumption that initially hot lithosphere is in steady state. The lithosphere will never be cooler than the initial condition. In addition, as long as strain is imposed, the lithosphere will converge toward a new steady state geotherm that is hotter than the initial geotherm. Hot lithosphere may very well be a result of a transient heating event such as the impingement of a mantle plume at the base of the lithosphere. Under these conditions, one would expect pronounced cooling during the later stages of evolution and a decrease in the average surface heat flow could then occur. Such effects are complications that we are not investigating with the present simple model.
In the previous calculations using a dry quartz crustal rheology, Xc = Xm except for extremely thick crust. That is, decoupling of the upper crust and upper mantle rarely occurs (although in some calculations, x c and Xm are occasionally offset by 1 or 2 grid points for a few times steps, we do not consider this significant in terms of decoupling). This is because dry quartz is relatively strong and has a high effective viscosity. Because of this, the shear stress is relatively large and when integrated over even small distances re- suits in a large amount of extra force required.
If wet quartz is used for the crustal rheology, however, the viscosity is much lower and the corresponding force required to shear the lower crust is much less. Decoupling is common and the upper crust often deforms independently of the upper mantle. An example of such a calculation is shown in Figure 10. Here the straining region in the mantle stays fixed, while the crust is ex- tending as a wide rift. Figure 11 shows that the surface observ- ables (heat flow, topography, and strain) are indistinguishable from the wide rift case using a dry quartz crust. This is so even though the overall evolution of the lithosphere is very different. In particular, the mantle straining region stays fixed. The conduc- tive timescale for the heat flow anomaly due to the mantle strain to reach the surface is roughly 10 m.y. Thus a heat flow anomaly is not seen over the area until several millions of years after the initiation of rifting. As in all the previous calculations, eventually a transition to narrow rift mode occurs. A plot of the trajectory through time is shown in Figure 12. Again, the mode boundary is more of transition zone rather than a sharp boundary.
HOPPER AND BUCK: LOWER CRUSTAL FLOW AND CONTINENTAL RIFTING 20,185
16 my
14 my
12 my
10 my
0 50 1 O0 150 200 250 300 350 400
0 I .... I .... I .... I .... I .... I .... I .... I ß ß , , I 0
20 - 20
40 - 40
60 i - 60 I ' I
0 50 100 150 200 250 300 350 400
I .... I .... I .... I .... I .... I .... I .... I .... 0
20 20
40 , ,•,__•., 40 60 ..... • - - 60 0 50 100 150 200 250 300 350
I • ß , . I .... I .... I .... I .... I .... I .... I , , 0 0
20 • 20 40 40
i 60 ' ' I 0 50 100 150 200 250 300 350
0 I .... • .... • .... ! .... • .... • .... • .... • 0
20 20
40 40
60 60
0 50 100 150 200 250 300
o j,,,,t,,,,I,,,,, .... , .... , .... ,... •:::•:•:•:•:•:•l
•!! •:!•:•:•:•:•:;i:•;':i:• 20 •:I:•:•::-'-•<:.• 20
. ;:: :: ;:..., .... , .... , .... ;.. 0 50 100 150 200 250 300
0 0
20
6 my 40
60
0
0
20
4 my 40
20
2 my 40
8 my
20
50 100 150 200 250
0 50 100 150 200 250
0 50 100 150 200 250
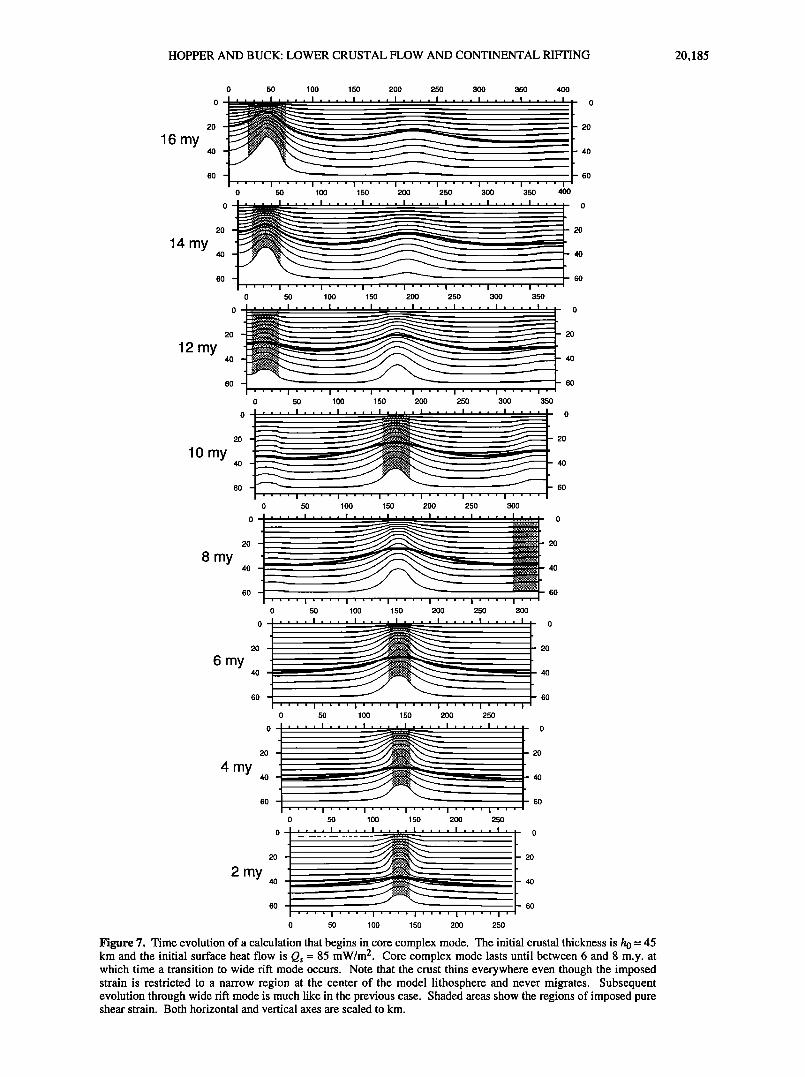
Figure 7. Time evolution of a calculation that begins in core complex mode. The initial crustal thickness is h 0 = 45 km and the initial surface heat flow is Qs = 85 mW/m 2. Core complex mode lasts until between 6 and 8 m.y. at which time a transition to wide rift mode occurs. Note that the crust thins everywhere even though the imposed strain is restricted to a narrow region at the center of the model lithosphere and never migrates. Subsequent evolution through wide rift mode is much like in the previous case. Shaded areas show the regions of imposed pure shear strain. Both horizontal and vertical axes are scaled to km.
20,186 HOPPER AND BUCK: LOWER CRUSTAL FLOW AND CONTINENTAL RIb-TING
h o - 45km; Qs- 85 mW/m2; Time - 4 my
i
i _.
-2-
Force Difference
I Topography E o --• 1
2 oo
Strain/Thinning .' '... ß ;
ß .
.' ;o ß
ß
lOO
0 50 100
0
150 200 250
20
60
20
40
60
0 50 100 150 200 250 km
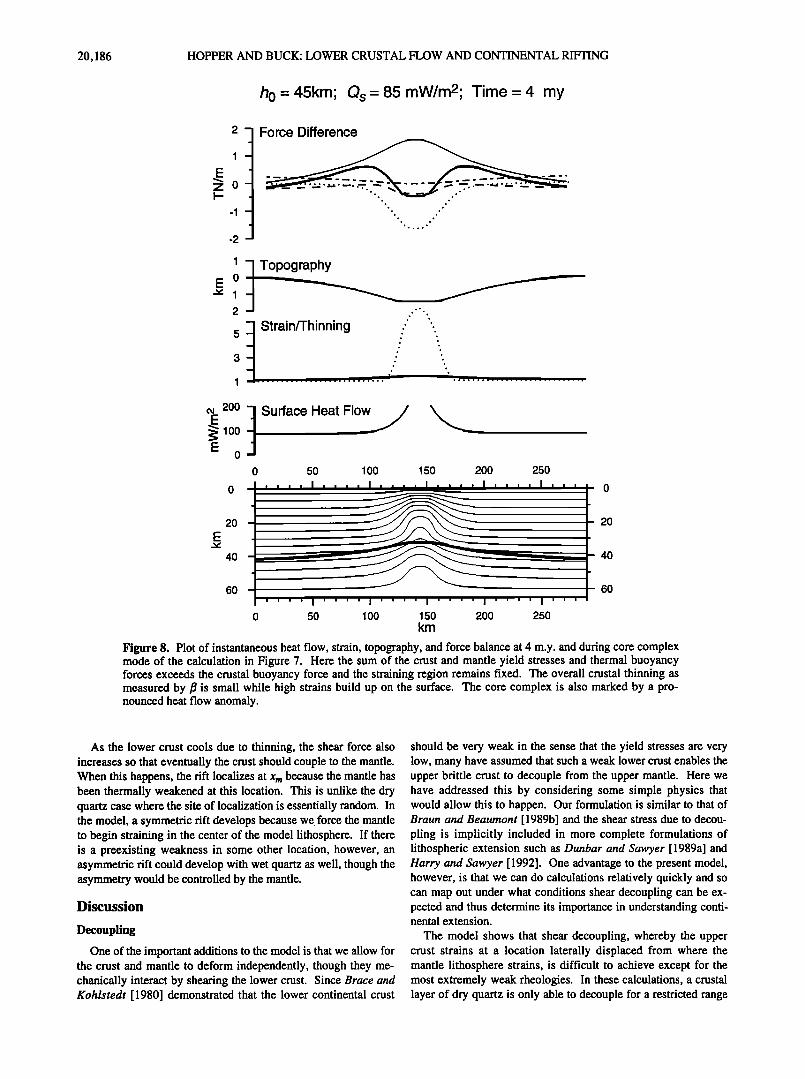
Figure 8. Plot of instantaneous heat flow, strain, topography, and force balance at 4 m.y. and during core complex mode of the calculation in Figure 7. Here the sum of the crust and mantle yield stresses and thermal buoyancy forces exceeds the crustal buoyancy force and the straining region remains fixed. The overall crustal thinning as measured by •6 is small while high strains build up on the surface. The core complex is also marked by a pro- nounced heat flow anomaly.
As the lower crust cools due to thinning, the shear force also increases so that eventually the crust should couple to the mantle. When this happens, the rift localizes at x m because the mantle has been thermally weakened at this location. This is unlike the dry quartz case where the site of localization is essentially random. In the model, a symmetric rift develops because we force the mantle to begin straining in the center of the model lithosphere. If there is a preexisting weakness in some other location, however, an asymmetric rift could develop with wet quartz as well, though the asymmetry would be controlled by the mantle.
Discussion
Decoupling
One of the important additions to the model is that we allow for the crust and mantle to deform independently, though they me- chanically interact by shearing the lower crust. Since Brace and Kohlstedt [1980] demonstrated that the lower continental crust
should be very weak in the sense that the yield stresses are very low, many have assumed that such a weak lower crust enables the upper brittle crust to decouple from the upper mantle. Here we have addressed this by considering some simple physics that would allow this to happen. Our formulation is similar to that of Braun and Beaurnont [1989b] and the shear stress due to decou- pling is implicitly included in more complete formulations of lithospheric extension such as Dunbar and Sawyer [ 1989a] and Harry and Sawyer [ 1992]. One advantage to the present model, however, is that we can do calculations relatively quickly and so can map out under what conditions shear decoupling can be ex- pected and thus determine its importance in understanding conti- nental extension.
The model shows that shear decoupling, whereby the upper crust strains at a location laterally displaced from where the mantle lithosphere strains, is difficult to achieve except for the most extremely weak rheologies. In these calculations, a crustal layer of dry quartz is only able to decouple for a restricted range
HOPPER AND BUCK: LOWER CRUSTAL FLOW AND CONTINENTAL RIFTING 20,187
140.0
• 120.0 E
E v
o
u_ lOO.O
::3 80.0
Narrow Rift Figure 4
IDry Quartz Crustl
Core Complex
ure 7
60.0 , I , 20.0 30.0 40.0 50.0 60.0
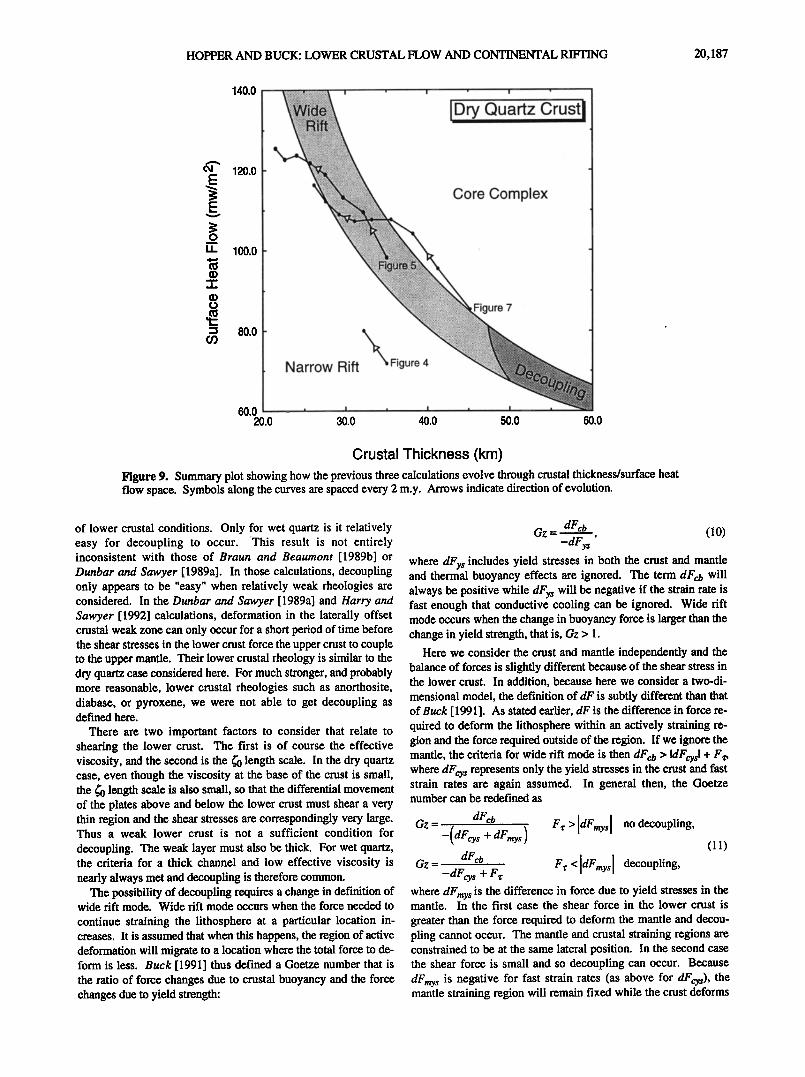
Crustal Thickness (km) Figure 9. Summary plot showing how the previous three calculations evolve through crustal thickness/surface heat flow space. Symbols along the curves are spaced every 2 m.y. Arrows indicate direction of evolution.
of lower crustal conditions. Only for wet quartz is it relatively easy for decoupling to occur. This result is not entirely inconsistent with those of Braun and Beaumont [1989b] or Dunbar and Sawyer [1989a]. In those calculations, decoupling only appears to be "easy" when relatively weak rheologies are considered. In the Dunbar and Sawyer [1989a] and Harry and Sawyer [1992] calculations, deformation in the laterally offset crustal weak zone can only occur for a short period of time before the shear stresses in the lower crust force the upper crust to couple to the upper mantle. Their lower crustal rheology is similar to the dry quartz case considered here. For much stronger, and probably more reasonable, lower crustal rheologies such as anorthosite, diabase, or pyroxene, we were not able to get decoupling as defined here.
There are two important factors to consider that relate to shearing the lower crust. The first is of course the effective viscosity, and the second is the •'0 length scale. In the dry quartz case, even though the viscosity at the base of the crust is small, the •'0 length scale is also small, so that the differential movement of the plates above and below the lower crust must shear a very thin region and the shear stresses are correspondingly very large. Thus a weak lower crust is not a sufficient condition for
decoupling. The weak layer must also be thick. For wet quartz, the criteria for a thick channel and low effective viscosity is nearly always met and decoupling is therefore common.
The possibility of decoupling requires a change in definition of wide rift mode. Wide rift mode occurs when the force needed to
continue straining the lithosphere at a particular location in- creases. It is assumed that when this happens, the region of active deformation will migrate to a location where the total force to de- form is less. Buck [1991] thus defined a Goetze number that is the ratio of force changes due to crustal buoyancy and the force changes due to yield strength:
cz = (]0)
where dFy s includes yield stresses in both the crust and mantle and thermal buoyancy effects are ignored. The term dFc6 will always be positive while dFy s will be negative if the strain rate is fast enough that conductive cooling can be ignored. Wide rift mode occurs when the change in buoyancy force is larger than the change in yield strength, that is, Gz > 1.
Here we consider the crust and mantle independently and the balance of forces is slightly different because of the shear stress in the lower crust. In addition, because here we consider a two-di- mensional model, the definition of dF is subtly different than that of Buck [ 1991 ]. As stated earlier, dF is the difference in force re- quired to deform the lithosphere within an actively straining re- gion and the force required outside of the region. If we ignore the mantle, the criteria for wide rift mode is then dFct, > IdFcysl + F,, where dFcy s represents only the yield stresses in the crust and fast strain rates are again assumed. In general then, the Goetze number can be redefined as
-( decys + demys ) deco
-dFcy s + F•
F•>[dFmysl no decoupling,
F•<ldFmys[ decoupling, (11)
where dFmy s is the difference in force due to yield stresses in the mantle. In the first case the shear force in the lower crust is
greater than the force required to deform the mantle and decou- pling cannot occur. The mantle and crustal straining regions are constrained to be at the same lateral position. In the second case the shear force is small and so decoupling can occur. Because
dFmy s is negative for fast strain rates (as above for dFcys), the mantle straining region will remain fixed while the crust deforms
20,188 HOPPER AND BUCK: LOWER CRUSTAL FLOW AND CONTINENTAL RIFTING
0 50 100 150 200 250 300 350 400
0
3O
16 my 60
0
0
50 100 150 200 250 300 350 400
3O
14 my 60
0
0
50 100 150 200 250 300 350
3O
12 my 60
90
0
0
3O
10 my 60
9O
0
0
3O
8 my 60
90
0
0
3O
6 my 60
9O
0
0
3O
4 my 60
3O
2 my 6O
50 100 150 200 250 300 350
50 100 150 200 250 300
50 100 150 200 250 300
50 100 150 200 250
0 50 100 150 200 250
0 50 100 150 200 250
3O
6O
9O
9O
6O
9O
9O
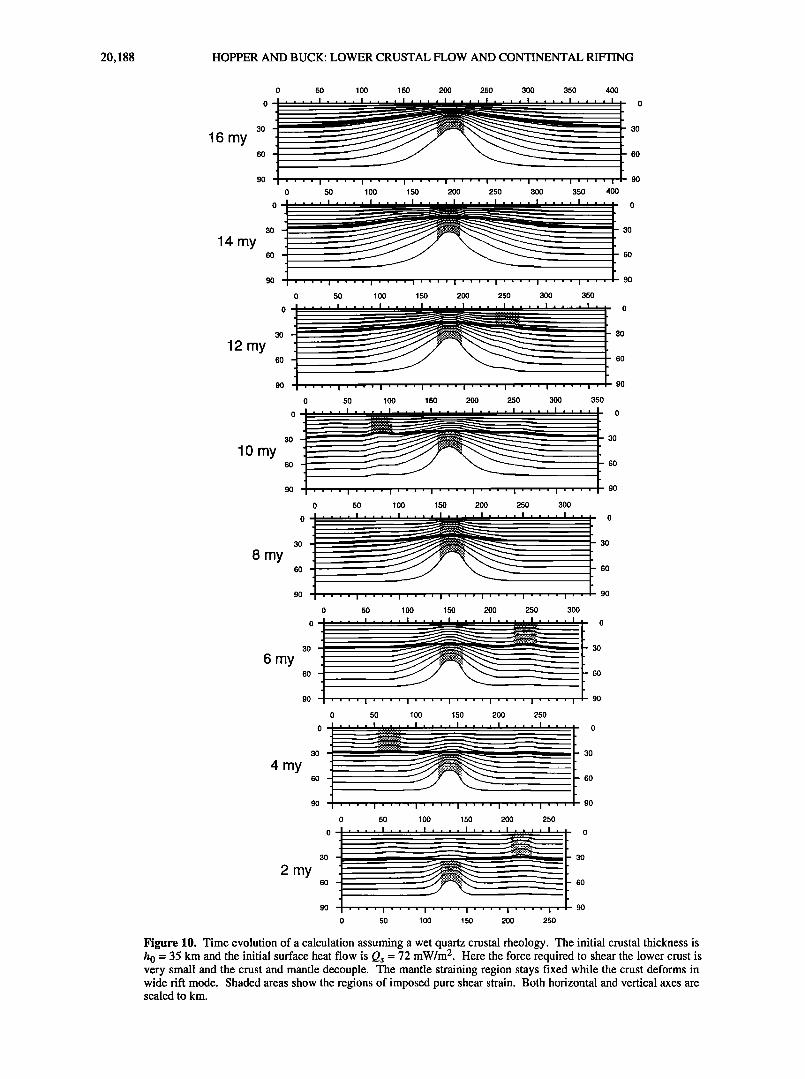
Figure 10. Time evolution of a calculation assuming a wet quartz crustal rheology. The initial crustal thickness is h 0 = 35 km and the initial surface heat flow is Qs = 72 mW/m 2. Here the force required to shear the lower crust is very small and the crust and mantle decouple. The mantle straining region stays fixed while the crust deforms in wide rift mode. Shaded areas show the regions of imposed pure shear strain. Both horizontal and vertical axes are scaled to km.
HOPPER AND BUCK: LOWER CRUSTAL FLOW AND CONTINENTAL RIb'TING 20,189
h 0 - 35km; Qs- 72 mW/m2; Time- 10 my
I - Force Difference
E Z-1 - I--
-2
-3-
100 0
0 50 100 150 200 250
0
300 35O
30
90
30
60
90
0 50 100 150 200 250 300 350 km
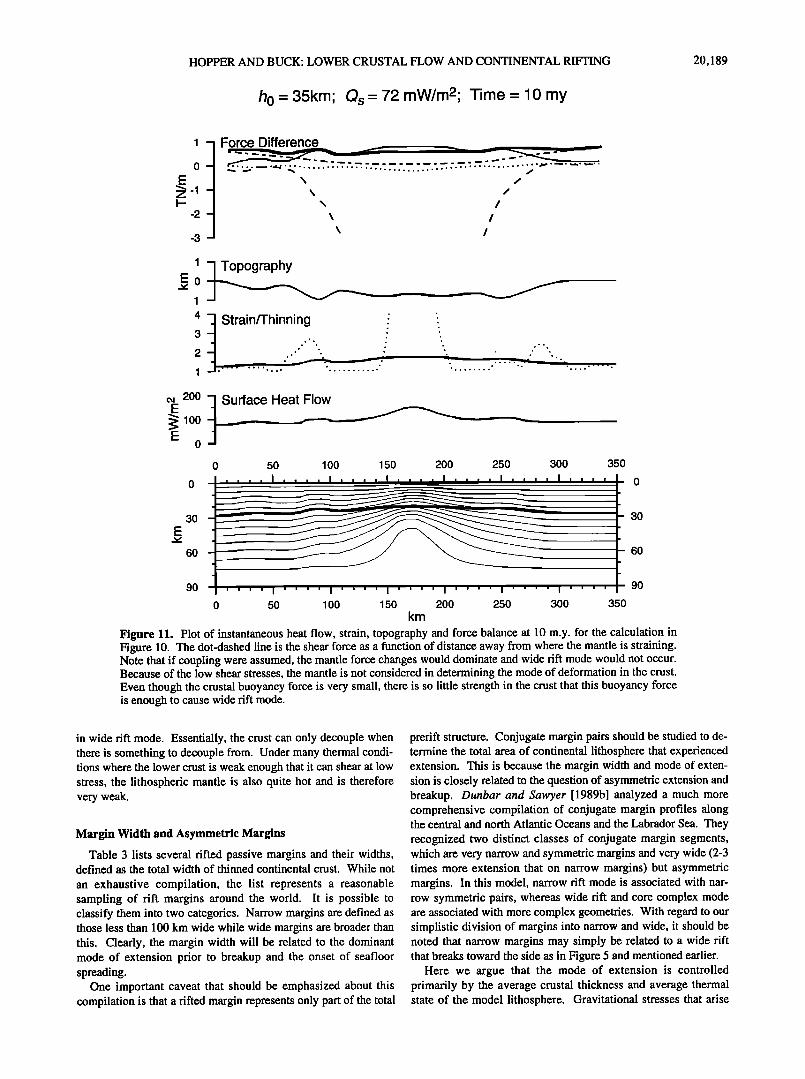
Figure 11. Plot of instantaneous heat flow, strain, topography and force balance at 10 m.y. for the calculation in Figure 10. The dot-dashed line is the shear force as a function of distance away from where the mantle is straining. Note that if coupling were assumed, the mantle force changes would dominate and wide rift mode would not occur. Because of the low shear stresses, the mantle is not considered in determining the mode of deformation in the crust. Even though the crustal buoyancy force is very small, there is so little strength in the crust that this buoyancy force is enough to cause wide rift mode.
in wide rift mode. Essentially, the crust can only decouple when there is something to decouple from. Under many thermal condi- tions where the lower crust is weak enough that it can shear at low stress, the lithospheric mantle is also quite hot and is therefore very weak.
Margin Width and Asymmetric Margins
Table 3 lists several rifted passive margins and their widths, defined as the total width of thinned continental crust. While not
an exhaustive compilation, the list represents a reasonable sampling of rift margins around the world. It is possible to classify them into two categories. Narrow margins are defined as those less than 100 km wide while wide margins are broader than this. Clearly, the margin width will be related to the dominant mode of extension prior to breakup and the onset of seafloor spreading.
One important caveat that should be emphasized about this compilation is that a rifted margin represents only part of the total
prerift structure. Conjugate margin pairs should be studied to de- termine the total area of continental lithosphere that experienced extension. This is because the margin width and mode of exten- sion is closely related to the question of asymmetric extension and breakup. Dunbar and Sawyer [1989b] analyzed a much more comprehensive compilation of conjugate margin profiles along the central and north Atlantic Oceans and the Labrador Sea. They recognized two distinct classes of conjugate margin segments, which are very narrow and symmetric margins and very wide (2-3 times more extension that on narrow margins) but asymmetric margins. In this model, narrow rift mode is associated with nar- row symmetric pairs, whereas wide rift and core complex mode are associated with more complex geometries. With regard to our simplistic division of margins into narrow and wide, it should be noted that narrow margins may simply be related to a wide rift that breaks toward the side as in Figure 5 and mentioned earlier.
Here we argue that the mode of extension is controlled primarily by the average crustal thickness and average thermal state of the model lithosphere. Gravitational stresses that arise
20,190 HOPPER AND BUCK: LOWER CRUSTAL FLOW AND CONTINENTAL RIFTING
140.0
120.0
E •' 100.0
o
'T' 80.0
60.0
Core Complex
Narrow Rift
40.0 20.0 30.0 40.0 50.0
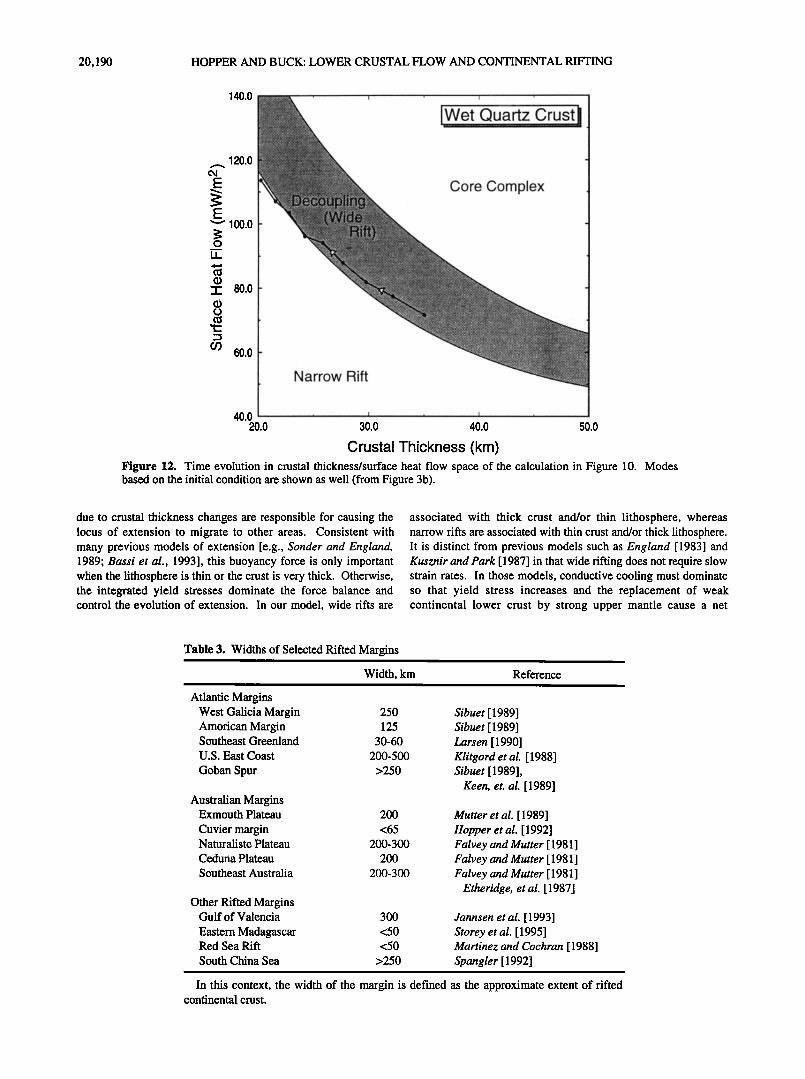
Crustal Thickness (km) Figure 12. Time evolution in crustal thickness/surface heat flow space of the calculation in Figure 10. Modes based on the initial condition are shown as well (from Figure 3b).
due to crustal thickness changes are responsible for causing the locus of extension to migrate to other areas. Consistent with many previous models of extension [e.g., Sonder and England, 1989; Bassi et al., 1993], this buoyancy force is only important when the lithosphere is thin. or the crust is very thick. Otherwise, the integrated yield stresses dominate the force balance and control the evolution of extension. In our model, wide rifts are
associated with thick crust and/or thin lithosphere, whereas narrow rifts are associated with thin crust .and/or thick lithosphere. It is distinct from previous models such as England [ 1983] and Kusznir and Park [ 1987] in that wide rifting does not require slow strain rates. In those models, conductive cooling-must dominate so that yield stress increases and the replacement of weak continenthi lower crust by strong upper mantle cause a net
Table 3. Widths of Selected Rifted Margins
Width, km Reference
Atlantic Margins West Galicia Margin 250 Amorican Margin 125 Southeast Greenland 30-60
U.S. East Coast 200-500
Goban Spur >250
Australian Margins Exmouth Plateau 200
Cuvier margin <65 Naturaliste Plateau 200-300
Ceduna Plateau 200
Southeast Australia 200-300
Other Rifted Margins Gulf of Valencia 300
Eastern Madagascar <50 Red Sea Rift <50
South China Sea >250
Sibuet [ 1989] Sibuet [ 1989] Larsen [ 1990] Klitgord eta/. [ 1988] Sibuet [ 1989],
Keen, et. al. [1989]
Mutter et al. [ 1989] Hopper et al. [1992] Falvey and Mutter [ 1981 ] Falvey and Mutter [ 1981 ] Falvey and Mutter [ 1981 ]
Etheridge, et al. [ 1987]
Jannsen et al. [1993] Storey et al. [ 1995] Martinez and Cochran [ 1988] Spangler [ 1992]
In this context, the width of the margin is defined as the approximate extent of rifted continental crust.
HOPPER AND BUCK: LOWER CRUSTAL FLOW AND CONTINENTAL RIFTING 20,191
strengthening of the thinning area and so strain migrates out to the edges. The fact that these margins eventually develop into seafloor spreading systems also argues against yield stress increases being important because final breakup would require a sudden change in boundary conditions that would allow for weakening to dominate. In contrast, the model presented here predicts that crustal thinning causes a transition from wide rift to narrow rift as extension evolves. A gradual transition to narrow
rift occurs as the crust thins and eventual extreme necking (and presumably breakup) does not require any sudden change in applied force or boundary conditions.
Because of the differences in lithospheric thickness associated with wide rifts and narrow rifts, surface heat flow should be one
way to help distinguish between the two. Figure 13 compares the measured surface heat flows for two rifts. The South China Sea
margin is a broad zone of thinned continental crust [Spangler,
2OO
a)
• 150
E v
o
LL 100
I:: 50
s lOO
, i , I
o lOO
Isouth China Sea
I i I , I e I
200 300 400 500
Distance. (kin)
N 600
b) 300
• 25o
E
E 200 v
o
LL 150
ß lOO
50
ß ! ß
I_.N.._:_ ...... _R.__e_._d seal
E 0 , I , I , I , I , I
500 400 300 100 0 100
ß
o i 1
W 200 200
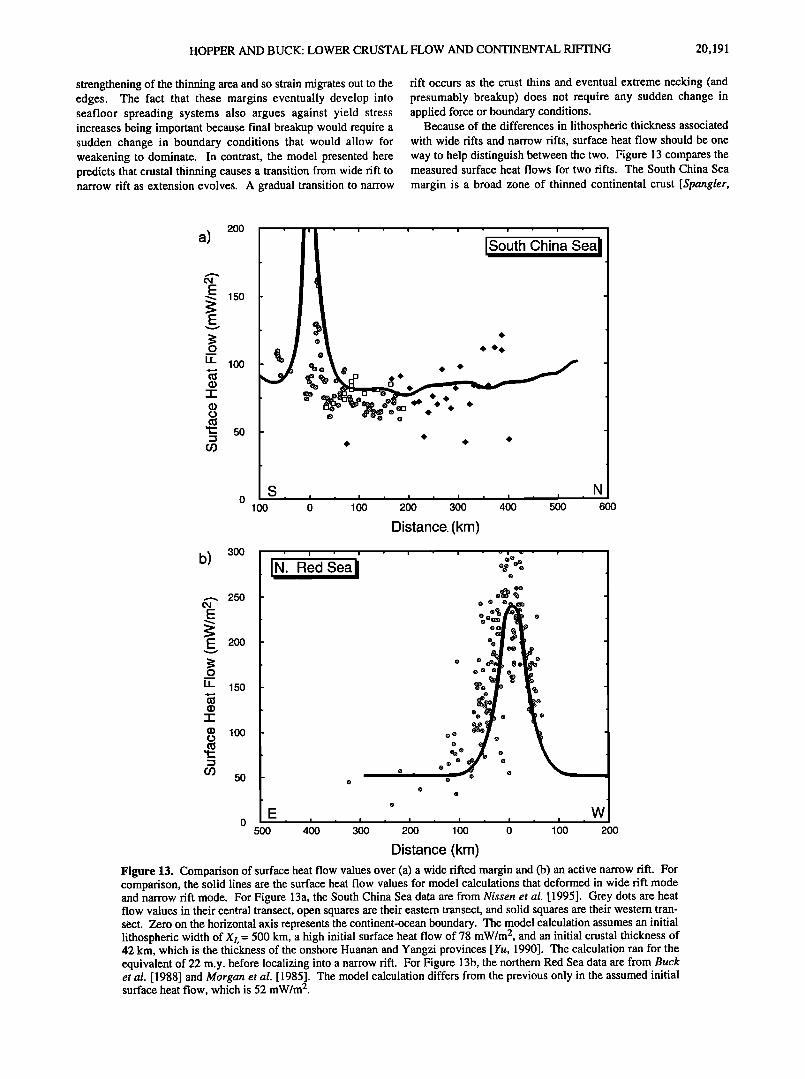
Distance (km) Figure 13. Comparison of surface heat flow values over (a) a wide rifted marin and (b) an active narrow rift. For comparison, the solid lines are the surface heat flow values for model calculations that deformed in wide rift mode and narrow rift mode. For Figure 13a, the South China Sea data are from Nissen et al. [ 1995]. Grey dots are heat flow values in their central transect, open squares are their eastern transect, and solid squares are their western tran- sect. Zero on the horizontal axis represents the continent-ocean boundary. The model calculation assumes an initial lithospheric width of X L = 500 km, a high initial surface heat flow of 78 mW/m :•, and an initial crustal thickness of 42 km, which is the thickness of the onshore Huanan and Yangzi provinces [ Yu, 1990]. The calculation ran for the equivalent of 22 m.y. before localizing into a narrow rift. For Figure 13b, the northern Red Sea data are from Buck et al. [ 1988] and Morgan et al. [ 1985]. The model calculation differs from the previous only in the assumed initial surface heat flow, which is 52 mW/m ;•.
20,192 HOPPER AND BUCK: LOWER CRUSTAL FLOW AND CONTINENTAL RIFTING
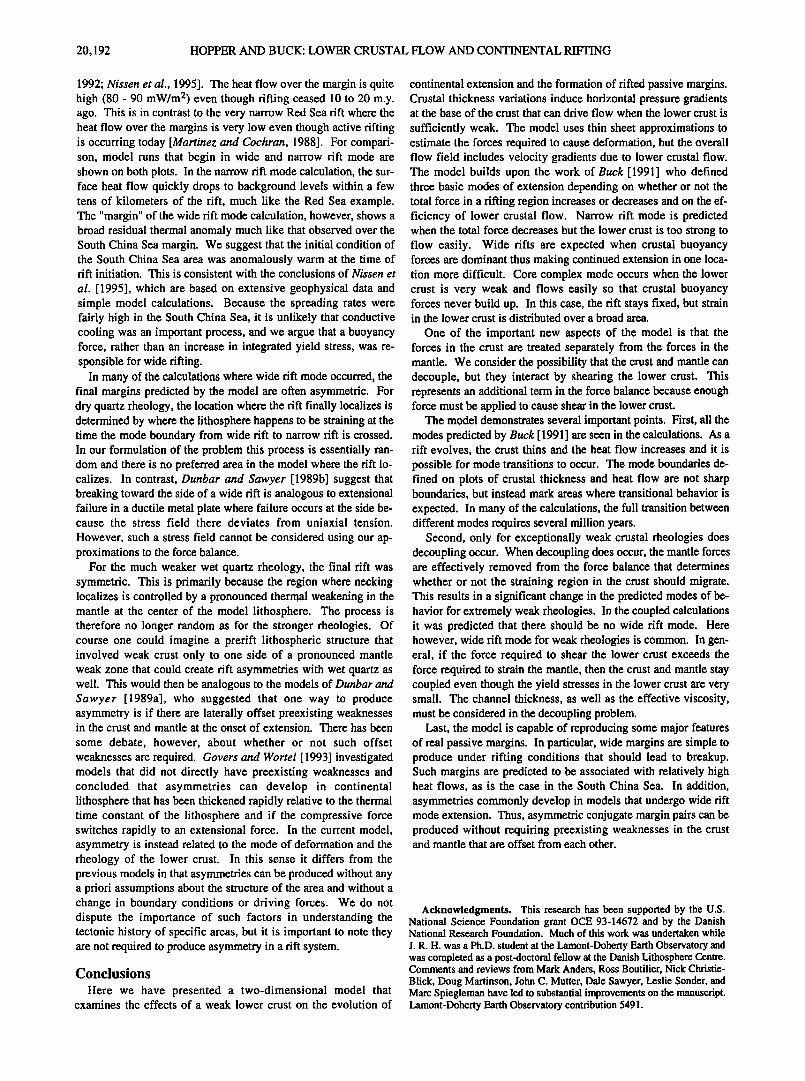
1992; Nissen et al., 1995]. The heat flow over the margin is quite high (80 - 90 mW/m 2) even though rifting ceased 10 to 20 m.y. ago. This is in contrast to the very narrow Red Sea rift where the heat flow over the margins is very low even though active rifting is occurring today [Martinez and Cochran, 1988]. For compari- son, model runs that begin in wide and narrow rift mode are shown on both plots. In the narrow rift mode calculation, the sur- face heat flow quickly drops to background levels within a few tens of kilometers of the rift, much like the Red Sea example. The "margin" of the wide rift mode calculation, however, shows a broad residual thermal anomaly much like that observed over the South China Sea margin. We suggest that the initial condition of the South China Sea area was anomalously warm at the time of rift initiation. This is consistent with the conclusions of Nissen et
al. [1995], which are based on extensive geophysical data and simple model calculations. Because the spreading rates were fairly high in the South China Sea, it is unlikely that conductive cooling was an important process, and we argue that a buoyancy force, rather than an increase in integrated yield stress, was re- sponsible for wide rifting.
In many of the calculations where wide rift mode occurred, the final margins predicted by the model are often asymmetric. For dry quartz theology, the location where the rift finally localizes is determined by where the lithosphere happens to be straining at the time the mode boundary from wide rift to narrow rift is crossed. In our formulation of the problem this process is essentially ran- dom and there is no preferred area in the model where the rift lo- calizes. In contrast, Dunbar and Sawyer [1989b] suggest that breaking toward the side of a wide rift is analogous to extensional failure in a ductile metal plate where failure occurs at the side be- cause the stress field there deviates from uniaxial tension.
However, such a stress field cannot be considered using our ap- proximations to the force balance.
For the much weaker wet quartz theology, the final rift was symmetric. This is primarily because the region where necking localizes is controlled by a pronounced thermal weakening in the mantle at the center of the model lithosphere. The process is therefore no longer random as for the stronger rheologies. Of course one could imagine a prerift lithospheric structure that involved weak crust only to one side of a pronounced mantle weak zone that could create rift asymmetries with wet quartz as well. This would then be analogous to the models of Dunbar and Sawyer [1989a], who suggested that one way to produce asymmetry is if there are laterally offset preexisting weaknesses in the crust and mantle at the onset of extension. There has been
some debate, however, about whether or not such offset
weaknesses are required. Govers and Wortel [ 1993] investigated models that did not directly have preexisting weaknesses and concluded that asymmetries can develop in continental lithosphere that has been thickened rapidly relative to the thermal time constant of the lithosphere and if the compressive force switches rapidly to an extensional force. In the current model, asymmetry is instead related to the mode of deformation and the theology of the lower crust. In this sense it differs from the previous models in that asymmetries can be produced without any a priori assumptions about the structure of the area and without a change in boundary conditions or driving forces. We do not dispute the importance of such factors in understanding the tectonic history of specific areas, but it is important to note they are not required to produce asymmetry in a rift system.
Conclusions
Here we have presented a two-dimensional model that examines the effects of a weak lower crust on the evolution of
continental extension and the formation of rifted passive margins. Crustal thickness variations induce horizontal pressure gradients at the base of the crust that can drive flow when the lower crust is
sufficiently weak. The model uses thin sheet approximations to estimate the forces required to cause deformation, but the overall flow field includes velocity gradients due to lower crustal flow. The model builds upon the work of Buck [1991] who defined three basic modes of extension depending on whether or not the total force in a rifting region increases or decreases and on the ef- ficiency of lower crustal flow. Narrow rift mode is predicted when the total force decreases but the lower crust is too strong to flow easily. Wide rifts are expected when crustal buoyancy forces are dominant thus making continued extension in one loca- tion more difficult. Core complex mode occurs when the lower crust is very weak and flows easily so that crustal buoyancy forces never build up. In this case, the rift stays fixed, but strain in the lower crust is distributed over a broad area.
One of the important new aspects of the model is that the forces in the crust are treated separately from the forces in the mantle. We consider the possibility that the crust and mantle can decouple, but they interact by shearing the lower crust. This represents an additional term in the force balance because enough force must be applied to cause shear in the lower crust.
The model demonstrates several important points. First, all the modes predicted by Buck [ 1991 ] are seen in the calculations. As a rift evolves, the crust thins and the heat flow increases and it is possible for mode transitions to occur. The mode boundaries de- fined on plots of crustal thickness and heat flow are not sharp boundaries, but instead mark areas where transitional behavior is expected. In many of the calculations, the full transition between different modes requires several million years.
Second, only for exceptionally weak crustal theologies does decoupling occur. When decoupling does occur, the mantle forces are effectively removed from the force balance that determines whether or not the straining region in the crust should migrate. This results in a significant change in the predicted modes of be- havior for extremely weak rheologies. In the coupled calculations it was predicted that there should be no wide rift mode. Here however, wide rift mode for weak theologies is common. In gen- eral, if the force required to shear the lower crust exceeds the force required to strain the mantle, then the crust and mantle stay coupled even though the yield stresses in the lower crust are very small. The channel thickness, as well as the effective viscosity, must be considered in the decoupling problem.
Last, the model is capable of reproducing some major features of real passive margins. In particular, wide margins are simple to produce under rifting conditions that should lead to breakup. Such margins are predicted to be associated with relatively high heat flows, as is the case in the South China Sea. In addition, asymmetries commonly develop in models that undergo wide rift mode extension. Thus, asymmetric conjugate margin pairs can be produced without requiring preexisting weaknesses in the crust and mantle that are offset from each other.
Acknowledgments. This research has been supported by the U.S. National Science Foundation grant OCE 93-14672 and by the Danish National Research Foundation. Much of this work was undertaken while
J. R. H. was a Ph.D. student at the Lamont-Doherty Earth Observatory and was completed as a post-doctoral fellow at the Danish Lithosphere Centre. Comments and reviews from Mark Anders, Ross Boutilier, Nick Christie- Blick, Doug Martinson, John C. Mutter, Dale Sawyer, Leslie Sonder, and Marc Spiegleman have led to substantial improvements on the manuscript. Lamont-Doherty Earth Observatory contribution 5491.
HOPPER AND BUCK: LOWER CRUSTAL FLOW AND CONTINENTAL RIFTING 20,193
References
Artemjev, M.E., and E.V. Artyushkov, Structure and isostasy of the Baikal Rift and the mechanism of rifting, J. Geophys. Res., 76, 1197- 1211, 1971.
Artyushkov, E.V., Stresses in the lithosphere caused by crustal thickness inhomogeneities, J. Geophys. Res., 78, 7675-7708, 1973.
Bassi, G., Factors controlling the style of continental rifting: Insights from numerical examples, Earth Planet. Sci. Lett., 105, 430-452, 1991.
Bassi, G., C.E. Keen, and P. Potter, Contrasting styles of rifting: Models and examples from the Eastern Canadian margin, Tectonics, 12, 639- 655, 1993.
Birch, F., R.F. Roy and E.R. Decker, Heat Flow and Thermal History in New England and New York, Wiley Interscience, New York, 1968.
Bird, P., New finite element techniques for modeling deformation histories of continents with stratified temperature-dependent theology, J. Geophys. Res., 94, 3967-3990, 1989.
Bird, P., Lateral extrusion of lower crust from under high topography, in the isostatic limit, J. Geophys. Res., 96, 10,275-10,286, 1991.
Block, L. and L.H. Royden, Core complex geometries and regional scale flow in the lower crust, Tectonics, 9, 557-567, 1990.
Bond, G.C., and M.A. Kominz, Evolution of thought on passive continen- tal margins from the origin of geosynclinal theory (-1860) to the pre- sent, Geol. Soc. Am. Bull., 100, 1909-1933, 1988.
Brace, W.F., and D.L. Kohlstedt, Limits on lithospheric stress imposed by laboratory experiments, J. Geophys. Res., 85, 6248-6252, 1980.
Braun, J., and C. Beaumont, Styles of continental rifting from dynamical models of lithospheric extension, Mere. Can. Soc. Pet. Geol., 12, 241- 258, 1987.
Braun, J., and C. Beaumont, Contrasting styles of lithospheric extension: Implications for differences between the Basin and Range Province and rifted continental margins, AAPG Mere., 46, 53-79, 1989a.
Braun, J., and C. Beaumont, Dynamical models of the role of crustal shear zones in asymmetric continental extension, Earth Planet. Sci. Lett., 93, 405-423, 1989b.
Buck, W.R., Modes of continental lithospheric extension, J. Geophys. Res., 96, 20,161-20,178, 1991.
Buck, W.R., F. Martinez, M.S. Steckler, and J.R. Cochran, Thermal con- sequences of lithospheric extension: Pure and simple, Tectonics, 7, 213-234, 1988.
Christensen, U.R., An Eulefian technique for thermo-mechanical model- ing ofhthosphefic extension, J. Geophys. Res., 97, 2015-2036, 1992.
Davis, G.A., Rapid upward transport of mid-crustal mylonitic gneisses in the footwall of a Tertiary detachment fault, Whipple mountains, south- eastern California, Geol. Rundsch., 77, 191-209, 1988.
Dixon, T.H., E.R. Ivins, and B.J. Franklin, Topographic and volcanic asymmetry around the Red Sea: Constraints on rift models, Tectonics, 8, 1193-1216, 1989.
Dokka, R.K., M.J. Mahaffie, and A.W. Snoke, Thermochronologic evi- dence of major tectonic denudation associated with detachment fault- ing, Northern Ruby Mountains - East Humbolt Range, Nevada, Tectonics, 5, 995-1006, 1986.
Dunbar, J.A. and D.S. Sawyer, How pre-existing weaknesses control the style of continental breakup, J. Geophys. Res., 94, 7278-7292, 1989a.
Dunbar, J.A., and D.S. Sawyer, Patterns of continental extension along the conjugate margins of the central and north Atlantic Oceans and Labrador Sea, Tectonics, 8, 1059-1077, 1989b.
England, P.C., Constraints on extension of continental lithosphere, J. Geophys. Res.,88, 1145-1152, 1983.
England, P.C., G.A. Houseman, and L.J. Sonder, Length scales for conti- nental deformation in convergent, divergent, and strike-slip environ- ments: Analytical and approximate solutions for a thin viscous sheet model, J. Geophys. Res., 90, 3551-3557, 1985.
Etheridge, M.A., J.C. Branson, and P.G. Stuart-Smith, The Bass, Gippsland and Otway basins, southeast Australia: A branched rift system formed by continental extension, Mere. Can. Soc. Pet. Geol., 12, 147-162, 1987.
Falvey, D.A., and J.C. Mutter, Regional plate tectonics and the evolution of Australia's passive continental margins, BMR J. Aus. Geol. Geoœhys., 6, 1-29, 1981.
Fleitout, L., and C. Froidevaux, Tectonics and topography for a litho- sphere containing density heterogeneities, Tectonics, 1, 21-56, 1982.
Gans, P.B., An open-system, two-layer, crustal stretching model for the eastern Great Basin, Tectonics, 6, 1-12, 1987.
Govers, R., and M.J.R. Wortel, Initiation of asymmetric extension in con- tinental lithosphere, Tectonophysics, 223, 75-96, 1993.
Hamilton, W., Crustal extension in the Basin and Range Province, south- western United States, in Continental Extensional Tectonics, edited by
M.P. Coward, J.F. Dewey, and P.L. Hancock, Spec. Publ. Geol. Soc. London, 28, 155-176, 1987.
Harry, D.L., and D.S. Sawyer, A dynamical model of extension in the Baltimore Canyon Trough region, Tectonics, I I, 420-436, 1992.
Hopper, J.R., J.C. Mutter, R.L. Larson, C.Z. Mutter, and the Northwest Australia Study Group, Magmatism and rift margin evolution: Evidence from northwest Australia, Geology, 20, 853-857, 1992.
Janssen, M.E., M. Torn6, S. Cloetingh, and E. Banda, Pliocene uplift of the eastern Iberian margin: Inferences from quantitative modeling of the Valencia Trough, Earth Planet. Sci. Lett., 119, 585-597, 1993.
Keen, C., C. Peddy, B. deVoogd, and D. Matthews, Conjugate margins of Canada and Europe: Results from deep reflection profiling, Geology, 17, 173-176, 1989.
Kirby, S.H., and A.K. Kronenberg, Rheology of the lithosphere: Selected topics, Rev. Geophys., 25, 1219-1244, 1987.
Klitgord, K.D., D.R. Hutchinson, and H. $chouten, U.S. Atlantic conti- nental margin; Structural and tectonic framework, in The Geology of North America, vol. I2, The Atlantic Continental Margin: U.S., edited by R.E. Sheridan and J.A. Grow, Geol. Soc. of Am., Boulder, Colo., pp. 19-55, 1988.
Koch, P.S., Rheology and microstructures of experimentally deformed quartz aggregates, Ph.D. thesis, 464 pp., Univ. of Calif., Los Angeles, 1983.
Kronenberg, A. K., and J. Tullis, Flow strengths of quartz aggregates: Grain size and pressure effects due to hydrolytic weakening, J. Geophys. Res., 89, 4281-4297, 1984.
Kruse, S., M. McNutt, J. Phipps-Morgan, L. Royden, and B. Wernicke, Lithospheric extension near Lake Mead: A model for ductile flow in the lower crust, J. Geophys. Res., 96, 4435-4456, 1991.
Kusznir, N.J., and R.G. Park, The extensional strength of continental lithosphere: Its dependence on geothermal gradient and crustal com- position and thickness, in Continental Extensional Tectonics, edited by M.P. Coward, J.F. Dewey, and P.L. Hancock, Spec. Publ. Geol. Soc. London, 28, 35-52, 1987.
Lachenbruch, A.H., Crustal temperature and heat production: Implications of the linear heat flow relation, J. Geophys. Res., 75, 3291-3300, 1970.
Lachenbruch, A.H., and J.H. Sass, Models of an extending lithosphere and heat flow in the Basin and Range province, in Cenozoic Tectonics and Regional Geophysics of the Western Cordillera, edited by R.B. Smith and G.P. Eaton, Mem. Geol. Soc. Am., 152, 209-250, 1978.
Larsen, H.C., The East Greenland Shelf, in The Geology of North America, vol. L, The Arctic Ocean Region, edited by A. Grantz, L. Johnson, and J.F. Sweeney, Geol. Soc. of Am., Boulder, Colo., pp. 185-210, 1990.
Le Pichon, X., and J.-C. Sibuet, Passive margins: A model of formation, J. Geophys. Res., 86, 3708-3720, 1981.
Lin, J., and E.M. Parmentier, A finite amplitude necking model of rifting in brittle lithosphere, J. Geophys. Res., 95, 4909-4923, 1990.
Lister, G.S., M.A. Etheridge, and P.A. Symonds, Detachment faulting and the evolution of passive continental margins, Geology, 14, 246-250, 1986.
Logatchev, N.A., Y. Sorin, and V.A. Rogozhina, Baikal Rift: Active or passive? Comparison of the Baikal and Kenya Rift zones, Tectonophysics, 94, 223-240, 1983.
Martinez, F., and J. R. Cochran, Structure and tectonics of the northern Red Sea: Catching a continental margin between rifting and drifting, Tectonophysics, 150, 1-32, 1988.
McKenzie, D., Some remarks on the development of sedimentary basins, Earth Planet. Sci. Lett., 40, 25-32, 1978.
Morgan, P., F.K. Boulos, S.F. Hennin, A.A. El-Sheriff, A.A. EI-Sayad, N.Z. Basta, and Y.S. Melek, Heat flow in eastern Egypt: The thermal signature of continental breakup, J. Geodyn., 4, 107-131, 1985.
Mutter, J.C., R.L. Larson, and the Northwest Australia Study Group, Extension of the Exmouth Plateau, offshore northwestern Australia: Deep seismic reflection/refraction evidence for simple and pure shear mechanisms, Geology, 17, 15-18, 1989.
Nissen, S.S., D.E. Hayes, Y. Bochu, Z. Weijun, C. Yongqin, and N. Xiaupin, Gravity, heat flow, and seismic constraints on the processes of crustal extension: Northern margin of the South China Sea, J. Geophys. Res., 100, 22,447-22,483, 1995.
Ruppel, C., Extensional processes in continental lithosphere, J. Geophys. Res., 100, 24,187-24,215, 1995.
Sclater, J.G., C. Jaupart, and D. Galson, The heat flow through oceanic and continental crust and the heat loss of the Earth, Rev. Geophys., 18, 269-311, 1980.
Seng6r, A.M.C., and K. Burke, Relative timing of rifting and volcanism on Earth and its tectonic implications, Geophys. Res. Lett., 5, 419-421, 1978.

20,194 HOPPER AND BUCK: LOWER CRUSTAL FLOW AND CONTINENTAL RIFTING
Sibuet, J., Paleoconstraints during rifting of the northeast Atlantic passive margins, J. Geophys. Res., 94, 7265-7277, 1989.
Sonder, L.J., and P.C. England, Effect of temperature dependent rheology on large-scale continental extension, J. Geophys. Res., 94, 7603-7619, 1989.
Spangler, S.E., Structure and Cenozoic evolution of the rifted northern margin of the South China Sea, Ph.D. thesis, 394 pp., Columbia Univ., New York, 1992.
Storey, M., J.J. Mahoney, A.D. Saunders, R.A. Duncan, S.P. Kelley, and M.F. Coffin, Timing of hot spot-related volcanism and the breakup of Madagascar and India, Science, 267, 852-855, 1995.
Taylor, B. and D.E. Hayes, Origin and history of the South China Sea Basin, in The Tectonic and Geologic Evolution of Southeast Asian Seas and Islands: Part 2, Geophys. Monogr. Ser., vol. 27, edited by D.E. Hayes, pp. 23-56, AGU, Washington, D.C., 1983.
Wernicke, B., Uniform sense normal simple shear of the continental litho- sphere, Can. J. Earth Sci., 22, 108-125, 1985.
Yu, H.S., The Pearl River Mouth Basin: A rift basin and its geodynamic relationship with the southeastern Eurasian margin, Tectonophysics, 183, 177-186, 1990.
Zuber, M.T., E.M. Parmentier, and R.C. Fletcher, Extension of the conti- nental lithosphere: A model for two scales of Basin and Range defor- mation, J. Geophys. Res., 91, 4826-4838, 1986.
W.R. Buck, Lamont-Doherty Earth Observatory and the Department of Geological Sciences, Columbia University, Palisades, NY 10964. (e-mail: buck @ ldeo.columbia.edu).
J.R. Hopper, Danish Lithosphere Centre, Oster Voldgade 10, DK-1350 Copenhagen K, Denmark. (e-mail: [email protected]).
(Received October 24, 1995; revised May 13, 1996; accepted May 17, 1996.)


![Transient rift opening in response to multiple dike ... · Macdonald, 1982; Smith and Cann, 1999]. Normal faulting also plays a role in accommodating crustal extension, but the largely](https://img.pdfslide.us/doc/110x75/5f1f455b3223440cae0fb9dd/transient-rift-opening-in-response-to-multiple-dike-macdonald-1982-smith-and.jpg)


![GNSS Observations of Crustal Deforamtion: A Case Study in ... · the Bailkal Rift and Mongolia [5]. The possibility of microplate motion independent of the ... areas and to assess](https://img.pdfslide.us/doc/110x75/5fedf6fa7d35ef0b47071e7c/gnss-observations-of-crustal-deforamtion-a-case-study-in-the-bailkal-rift-and.jpg)