Embed Size (px)
Citation preview
DOT/FAA/AR-01/24 Office of Aviation Research Washington, D.C. 20591
The Effect of Loading Parameters on Fatigue of Composite Laminates: Part V June 2001 Final Report This document is available to the U.S. public through the National Technical Information Service (NTIS), Springfield, Virginia 22161.
U.S. Department of Transportation Federal Aviation Administration
NOTICE
This document is disseminated under the sponsorship of the U.S. Department of Transportation in the interest of information exchange. The United States Government assumes no liability for the contents or use thereof. The United States Government does not endorse products or manufacturers. Trade or manufacturer's names appear herein solely because they are considered essential to the objective of this report. This document does not constitute FAA certification policy. Consult your local FAA aircraft certification office as to its use. This report is available at the Federal Aviation Administration William J. Hughes Technical Center's Full-Text Technical Reports page: actlibrary.tc.faa.gov in Adobe Acrobat portable document format (PDF).
Technical Report Documentation Page 1. Report No. DOT/FAA/AR-01/24
2. Government Accession No. 3. Recipient's Catalog No.
4. Title and Subtitle THE EFFECT OF LOADING PARAMETERS ON FATIGUE OF COMPOSITE
5. Report Date June 2001
LAMINATES: PART V 6. Performing Organization Code
7. Author(s)
H. Thomas Han and Sung Won Choi 8. Performing Organization Report No.
9. Performing Organization Name and Address
Mechanical and Aerospace Engineering Department Engineering IV
10. Work Unit No. (TRAIS)
University of California at Los Angeles Los Angeles, CA 90024-1597
11. Contract or Grant No.
95-G-021 12. Sponsoring Agency Name and Address
U.S. Department of Transportation Federal Aviation Administration
13. Type of Report and Period Covered
Final Report
Office of Aviation Research Washington, DC 20591
14. Sponsoring Agency Code
AIR-100 15. Supplementary Notes
The FAA William J. Hughes Technical Center Technical Monitor was Peter Shyprykevich. 16. Abstract
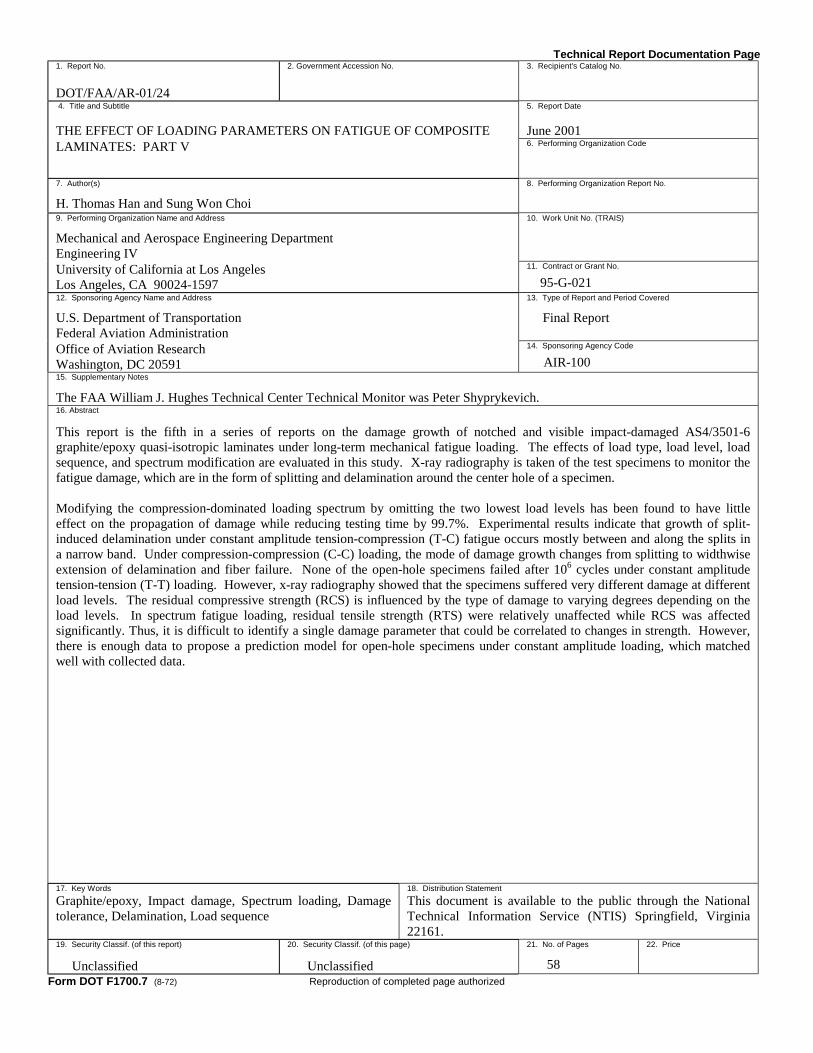
This report is the fifth in a series of reports on the damage growth of notched and visible impact-damaged AS4/3501-6 graphite/epoxy quasi-isotropic laminates under long-term mechanical fatigue loading. The effects of load type, load level, load sequence, and spectrum modification are evaluated in this study. X-ray radiography is taken of the test specimens to monitor the fatigue damage, which are in the form of splitting and delamination around the center hole of a specimen. Modifying the compression-dominated loading spectrum by omitting the two lowest load levels has been found to have little effect on the propagation of damage while reducing testing time by 99.7%. Experimental results indicate that growth of split-induced delamination under constant amplitude tension-compression (T-C) fatigue occurs mostly between and along the splits in a narrow band. Under compression-compression (C-C) loading, the mode of damage growth changes from splitting to widthwise extension of delamination and fiber failure. None of the open-hole specimens failed after 106 cycles under constant amplitude tension-tension (T-T) loading. However, x-ray radiography showed that the specimens suffered very different damage at different load levels. The residual compressive strength (RCS) is influenced by the type of damage to varying degrees depending on the load levels. In spectrum fatigue loading, residual tensile strength (RTS) were relatively unaffected while RCS was affected significantly. Thus, it is difficult to identify a single damage parameter that could be correlated to changes in strength. However, there is enough data to propose a prediction model for open-hole specimens under constant amplitude loading, which matched well with collected data.
17. Key Words
Graphite/epoxy, Impact damage, Spectrum loading, Damage tolerance, Delamination, Load sequence
18. Distribution Statement
This document is available to the public through the National Technical Information Service (NTIS) Springfield, Virginia 22161.
19. Security Classif. (of this report)
Unclassified
20. Security Classif. (of this page)
Unclassified
21. No. of Pages
58 22. Price
Form DOT F1700.7 (8-72) Reproduction of completed page authorized

iii
TABLE OF CONTENTS
Page
EXECUTIVE SUMMARY vii 1. INTRODUCTION 1
2. BACKGROUND 1
2.1 Open-Hole Composite Laminates 2 2.2 Impact Damage and Residual Strength 2 2.3 Postimpact Fatigue Behavior 4 2.4 Summary 5
3. EXPERIMENTAL PROCEDURE 5
3.1 Static and Fatigue Testing 5 3.2 Impact Loading 7
4. RESULTS AND DISCUSSION 8
4.1 Notch Compressive and Tension Strength 8 4.2 Notch Fatigue Behavior 9
4.2.1 Constant Amplitude Tension-Compression and Compression-
Compression Loading 9
4.2.2 Constant Amplitude Tension-Tension Loading 16
4.2.3 Two-Level Block Tension-Compression Loading 19
4.2.4 Compression-Dominated Spectrum Loading 20
4.2.5 Tension-Dominated Spectrum Loading 27
4.2.6 Stress Ratio Effect on Spectrum Fatigue Loading 33
4.3 Compressive Strength After Impact (CSAI) 34 4.4 Postimpact Fatigue Behavior (8-Joules Impact) 38
4.4.1 Constant Amplitude Compression-Compression Loading 38 4.4.2 Compression-Dominated Blocked TWIST Loading 42
4.5 Residual Strength Evaluation 42
4.5.1 Residual Strength of Open-Hole Specimens 42 4.5.2 Residual Strength of 8-Joules-Impacted Specimens 46

iv
5. SUMMARY 46
6. REFERENCES 47
LIST OF FIGURES Figure Page 1 Compressive Strength After Impact Versus Damage Size and Design Ultimate
and Limit Load Values 3
2 Comparison of Composite and Metal Damage Tolerance Behavior 3
3 Static Compression Setup 6
4 Schematic Representation of TWIST Loading 7
5 Specimen Dimensions 8
6 Damage Accumulation in C.A. T-C and C-C Fatigue 13
7 Normalized Split Length Measurement and Normalized Split Length in T-C Loading 14
8 Constant Amplitude C-C (a) Split Length vs Number of Cycles and (b) S-N Curve 15
9 Split Initiation vs Stress Level 15
10 Split Length Growth With Number of Cycles C.A. C-C (Using Bnew) 16
11 Damage Accumulation in C.A. T-T Fatigue 17
12 Damage Growth With 80% C.A. T-T 18
13 Constant Amplitude T-T Loading and Cumulative Damage Rules 18
14 Final Normalized Split Length Due to Two-Level Block T-C Loading (Observed vs Predicted) (a) 40%/30% and 30%/40% of NCS and (b) 50%/30% and 30%/50% of NCS 19
15 Final Damage Patterns After Ten Blocks in Full and Modified Spectrum for Flight Mean Load of 27.5% NCS 20
16 Final Damage Patterns After Ten Blocks in Full and Modified Spectrum for Flight Mean Load of 30% NCS 21

v
17 Final Damage Patterns After Ten Blocks in Full and Modified Spectrum for Flight Mean Load of 32.5% NCS 21
18 Split Length in Full and Modified TWIST Spectrum 22
19 Delamination Area in Full and Modified TWIST Spectrum 22
20 Constant Amplitude C-C Loading (a) 90% and 50% (b) 90% and 80% 24
21 Cumulative Damage Rule for Compression-Compression Loading 25
22 Split Length as a Function of Completed Block for Full and Modified Spectrum—Compression 26
23 Final Damage Difference Between Experimental and Prediction Results (Compression) 27
24 Final Damage Pattern After 15 Blocks of the Modified Spectrum for Three Different Flight Mean Loads 28
25 Damage by the Two Lowest Blocks 29
26 Split Length as a Function of Completed Block for Full and Modified Spectrum—Tension 30
27 Final Damage Difference Between Experimental and Prediction Results (Tension) 31
28 Split Length Growth of Test Results and Predicted Values of 27.5% Flight Mean Load 32
29 Split Length Growth of Test Results and Predicted Values of 30% Flight Mean Load 32
30 Split Length Growth of Test Results and Predicted Values of 32.5% Flight Mean Load 33
31 Stress Ratio Effect on Spectrum Fatigue Loading 34
32 Strain vs Compression Load for 4-Joules-Impacted Specimen 36
33 Strain vs Compression Load for 8-Joules-Impacted Specimen 36
34 Strain vs Compression Load for 15-Joules-Impacted Specimen 37
35 Damage by the Different Impacted Energy 38
36 Damage Growth in Constant Amplitude Compression-Compression Loading 39

vi
37 Damage Growth in Different Constant Amplitude and Stress Ratio Compression-Compression Loading 40
38 Damage Growth With 32.5% Flight Mean Load 43
39 Damage Growth With 30% Flight Mean Load 44
40 Damage Growth With 27.5% Flight Mean Load 44
41 Damage Length in the Loading Direction Under Modified Spectrum 45
42 Residual Strength After Constant Amplitude Fatigue 45
43 Residual Strength After Spectrum Loading 46
LIST OF TABLES Table Page 1 Transport Wing Standard Test Characteristics 6
2 Test Matrix for Constant Amplitude and Two-Level Block Loading 10
3 Test Matrix for Compression-Dominated Blocked TWIST Loading 11
4 Test Matrix for Constant Amplitude Tension-Tension 12
5 Test Matrix for Tension-Dominated Blocked TWIST Loading 12
6 Parameter of SLo for Each Loading (C.A. T-T) 19
7 Examples of C.A. C-C Prediction Model 25
8 Material Properties After Different Energy Impact 35
9 Test Matrix for Constant Amplitude Compression-Compression After 8-Joules Impact 38
10 Test Matrix for Compression-Dominated Blocked TWIST Loading 39
vii/viii
EXECUTIVE SUMMARY
This report is the fifth in a series of reports on the damage growth of notched and visible impact-damaged AS4/3501-6 graphite/epoxy quasi-isotropic laminates under long-term mechanical fatigue loading. The effects of load type, load level, load sequence, and spectrum modification are evaluated in this study. X-ray radiography is taken of the test specimens to monitor the fatigue damage, which are in the form of splitting and delamination around the center hole of a specimen. Modifying the compression-dominated loading spectrum by omitting the two lowest load levels has been found to have little effect on the propagation of damage while reducing testing time by 99.7%. Experimental results indicate that growth of split-induced delamination under constant amplitude tension-compression (T-C) fatigue occurs mostly between and along the splits in a narrow band. Under compression-compression (C-C) loading, the mode of damage growth changes from splitting to widthwise extension of delamination and fiber failure. None of the open-hole specimens failed after 106 cycles under constant amplitude tension-tension (T-T) loading. However, X-ray radiography showed that the specimens suffered very different damage at different load levels. The residual compressive strength (RCS) is influenced by the type of damage to varying degrees depending on the load levels. In spectrum fatigue loading, residual tensile strength (RTS) were relatively unaffected while RCS was affected significantly. Thus, it is difficult to identify a single damage parameter that could be correlated to changes in strength. However, there is enough data to propose a prediction model for open-hole specimens under constant amplitude loading, which matched well with collected data. The damage size appears to be independent of the constant amplitude and the spectrum load levels as far as visible damage is concerned. The damage area length increase after the first cycle, but with one exception, the length does not increase significantly with subsequent cycles.

1
1. INTRODUCTION.
Although the concept of composite materials have existed for a long time, they have only recently achieved a level of durability and strength to make them viable as construction materials in aircraft. With their high strength and low weight, they are ideal. However, being so new, there is not enough data to calculate their durability in a quantitative sense. They need to be certified under controlled tests to ensure that they are safe for public use. However, certification tests require a lot of time to complete. Therefore, it makes economic sense to modify the tests to reduce testing times as much as possible. This report addresses the effect of various loading parameters on damage growth during fatigue loading of composite laminates containing a stress raiser in the form of an open hole and visible impact damage. Once these effects are identified, durability tests can be designed to give the same results as traditional methods in significantly less time. The objective of the current study was to determine the influence of loading parameters on the damage growth of impact-induced and open-hole composites under fatigue loading. Specifically, the effects of load type, load level, load sequence, as well as the effects of spectrum modification were of interest. In the following sections, experimental results are presented and discussed. Damage growth prediction model studies were also tested to identify the governing damage growth parameters, with the aim of extending current experimental observations to different material systems and impact loading conditions. Based on experimental data and prediction models, a method to accelerate durability testing of composite laminates by selecting appropriate loading parameters is suggested. This report is the fifth and concluding report on this subject. The first report [1] investigated the effect of preloading on fatigue and residual strength of composites. The second report [2] primarily investigated fatigue of open-hole specimens, while the third report [3] was concerned with fatigue effects on specimens with barely visible impact damage. This report continues the work of reference 2 by investigating tension-dominated fatigue of open-hole specimens and the work of reference 3 by increasing impact damage to specimens from barely visible to clearly visible. The fourth report [4] describes the developed information system for damage tolerance and durability of composites that serves as a companion reference and as a research tool. 2. BACKGROUND.
In aircraft applications, composite panels are routinely subjected to both impacts and long-term mechanical loading (fatigue). These loading events cause damage to develop in the form of fiber breakage, matrix microcracking, and delaminations, which lead to material property degradation with the most severe being strength. This raises serious concerns about using composite components in critical locations of aircraft, and it represents one of the major hurdles to using composites in aircraft manufacture. An overview of the work done by other researchers, characterizing and predicting open-hole and impact-damage growth in composite materials during various loading scenarios, is presented in the following sections. Parameters that affect damage initiation and accumulation during impact and fatigue loading are examined together with the influence of various damage states on the residual mechanical properties and strength.

2
2.1 OPEN-HOLE COMPOSITE LAMINATES.
Fatigue behavior of notched composite laminates has been studied by a number of researchers on different materials, lay-ups, and for different loading conditions. Jen, et al. [5] investigated damage propagation in centrally notched T300/5208 graphite/epoxy composite laminates under constant amplitude tension-tension (T-T) loading. It was found that the residual tensile strength (RTS) first increased as the applied cycles increased and then decreased during fatigue tests, while the residual stiffness decreased monotonically throughout the test. Increase in tensile strength has also been reported by Bakis and Stinchcomb [6] who studied T-C fatigue of quasi-isotropic T300/5208 graphite/epoxy laminates. It was also indicated that the compressive stiffness degradation was much larger than the reduction in tensile properties. Furthermore, residual compressive strength (RCS) of notched specimen is reduced significantly by fatigue loading (Simonds, et al. [7]). The effect of stacking sequence on delamination growth and failure modes in notched composite laminates has been investigated by Ratwani and Kan [8] on several quasi-isotropic AS/3501-6 laminates under constant-amplitude tension-compression (T-C) and compression-compression (C-C) loading. The results suggest that damage may propagate along the loading direction or in a direction at some angle to the loading direction, depending on the stacking sequence. The start of delamination appears to coincide with the positions of high interlaminar stresses as predicted by finite element analysis. Razvan, et al. [9] indicate that the type of damage in T-C fatigue around the hole depended on the load level and suggest that it is difficult to define a unique damage concept that could be associated with the remaining strength of composite laminates. Compression-dominated spectrum loading of notched AS/3501-6 composite laminates was studied by Ratwani [10], and it was suggested that the damage growth under spectrum loading differed significantly from that under constant-amplitude loading. The effects of variations in compression-dominated spectrums on the fatigue life of AS/3501-6 laminates with a center hole was investigated by Badaliance, et al. [11]. The effect of each variation was determined by comparing life under the modified spectrum with baseline values. The greatest effect on life reduction was found when the frequency of occurrence and the magnitude of high loads was increased. Deletion of low loads was found to increase the overall life only to a smaller extent. Phillips [12] investigated the effect of modifying the compression-dominated spectrum loading on the life of notched T300/5208 quasi-isotropic laminates. It was found that the spectrum truncation at both high- and low-load ends of the spectrum produced longer fatigue lives when compared to the baseline spectrum, with the results being much more sensitive to truncations at the high-load end. 2.2 IMPACT DAMAGE AND RESIDUAL STRENGTH.
The Federal Aviation Administration (FAA) requires that composite structures containing barely visible impact damage (BVID) not fail under design ultimate load (DUL) levels (figure 1) (FAA Advisory Circular, AC 20-107A, 1984). However, unlike metals, an abrupt (up to 60%) decrease in residual compression strength may occur without any visible indication of the damage unlike metals (figure 2). This happens because composites react differently to initial cracks and damage.

3
FIGURE 1. COMPRESSIVE STRENGTH AFTER IMPACT VERSUS DAMAGE SIZE AND
DESIGN ULTIMATE AND LIMIT LOAD VALUES
FIGURE 2. COMPARISON OF COMPOSITE AND METAL
DAMAGE TOLERANCE BEHAVIOR During loading, a strong correlation arises between matrix cracking and delamination. Delamination starts at the tip of a matrix crack and grows quickly until another crack is formed, and then other delaminations start from the tips of newly formed cracks. The growth rate of the delamination decreases when approaching another matrix crack [13]. In general, once a delamination is initiated from a matrix crack, it grows mostly along the fiber direction of the bottom layer at the interface following the contours of interlaminar shear stresses σxz and σyz, which explains the characteristic “peanut” shape of delamination observed by different researchers [14].
Impact Energy= 2 Joules CSAI = 68.3 ksi
(25% strength reduction) Damage diameter 0.47″-0.55″
multiple delaminations through the thickness
Damage Size
Res
idua
l Str
engt
h DUL - Design Ultimate Load
DLL - Design Limit Load Design Load for FAR 25.571 (e)
Readily Detectable Damage
In-service Damage BVID
(BVID) (BVID) (VID) (VID)
Impact Energy= 8 Joules CSAI = 34 ksi
(63% strength reduction) Average damage diameter 1.41 inch
multiple delaminations through the thickness
Spectrum Fatigue Lifetimes
0.4
1.0
Composite w/ 100ft-lb k.e damage
Metal w/ 0.05 in. flaw
105
Max
. Spe
ctru
m lo
adU
ndam
aged
stat
ic st
reng
th

4
The residual strength of impacted composite plates can be reduced significantly, depending on the type and extent of damage. Influence of delamination on the degradation of residual compressive strength has been well documented [15-25]. However, delamination as the predominant impact damage pattern does not influence tensile strength significantly, although fiber breakage and associated stress concentration do. Cairns and Lagace [26] reported 50% reduction in the residual tensile strength for a 14 mm diameter of fiber breakage (for 70-mm-wide specimens). It was also concluded that the residual strength is not an explicit function of impact energy but solely a function of the damage present. Therefore, impact energy may not be an accurate parameter to predict residual properties. 2.3 POSTIMPACT FATIGUE BEHAVIOR.
Influence of impact damage on the fatigue behavior of AS4/3501-6 [+45/-45/0/0/+45/-45/0/0/+45/-45/0/90]2s laminates under the T-T, T-C, and C-C loading was studied by Ramkumar [8]. Two types of low-velocity impacts were investigated with ~5-cm delamination diameter, with (sharp impactor, type II) and without (blunt-tipped impactor, type I) visible damage on the outer surfaces of the laminates. Specimen gage lengths were 13 by 15 cm, requiring the use of antibuckling devices in the presence of compressive loads. Overall damage propagation was monitored by ultrasonic pulse-echo transducer and C-scan. Damage growth for compression-dominated loading was reported to be in the direction perpendicular to the loading direction. Type I damage caused 20% reduction in static tensile strength and 65% in compressive strength, while type II damage caused 42% reduction in the tensile strength and 67% in compressive strength. Fatigue testing was performed at stress levels above 60% of ultimate tension strength (UTS) ultimate compression strength (UCS), and while most of the specimens subjected to T-T loading survived 106 cycles, all specimens loaded in T-C and C-C failed well before. The author concluded that tensile loading, static or fatigue, represents the least threat to impact-damaged laminates. In another experimental study by Ramkumar [24], the effect of imbedded (idealized) delaminations on the compression behavior of three different stacking sequence of quasi-isotropic T300/5208 graphite/epoxy laminates was investigated. From the S-N data, it was concluded that the threshold value of the maximum compressive stress, at which failure is not expected to occur, depends on the location and shape of implanted delamination. Also, the occurrence of delamination growth and its direction was shown to be dependent on the laminate stacking sequence and its through-the-thickness location. Failures were induced predominantly by the propagation of imbedded delaminations to the tab region. The significance of the stacking sequence on delamination growth and failure modes in notched composite laminates was also pointed out by Ratwani and Kan [8]. It was shown that damage may propagate along the loading direction or in a direction at some angle to the loading direction, depending on the stacking sequence. The location of delamination appeared to coincide with positions of highest interlaminar shear or normal stresses as predicted by a finite element analysis. Blaricum, et al. [25] studied the compression-dominated loading based on the modified FALSTAFF flight sequence on a [+45/-45/0/0/]7s XAS-914C impacted specimens (300 by 100 mm). Fatigue testing was performed under the maximum compressive strain of 0.36%. It was reported that for this type of material and lay-up, the low load levels can be deleted from the testing sequence with no significant effect on fatigue life, and that the effect of the duration of

5
high-level loads (0.12 and 10 seconds) does not influence fatigue life significantly. Damage growth rate as a function of the initial damage width was monitored, and it appeared that the damage width was a major controlling factor in these tests. The authors suggested that consistent and clearly defined damage growth behavior could be derived with more tests. Some researchers also suggested that impacted composite panels have very flat compression S-N curves (Demuts, et al. [27]), and that although compression strength is greatly influenced by impact damage, any subsequent reduction under fatigue loading is minimal (O’Brien [28]). This contradicts the observations of Ramkumar [8], as discussed earlier, suggesting that more accurate characterization of damage tolerance for impact-damaged composite laminates is needed. 2.4 SUMMARY.
While the real service loads are usually kept much lower than the ultimate failure loads, most of the research work on fatigue of composite laminates has been focused on the final failure and not on damage evolution. It is also clear from previous studies that many different factors affect final failure. The objective of this research is to determine the influence of various loading parameters on damage growth during fatigue loading and the fatigue design limits (delamination growth thresholds) for composite laminates. Specifically, the effects of load type, load level, load sequence, and the effect of overloads, their magnitude and place in the load spectrum were of interest in this study. In section 4, experimental results which identify their effects are presented and discussed. 3. EXPERIMENTAL PROCEDURE.
Quasi-isotropic laminates made from an AS4/3501-6 graphite/epoxy material system were used in this study. Hercules AS4/3501-6 prepregs were cured in an autoclave according to the manufacturer’s recommended cure cycle to fabricate 24-ply [0/±45/90]s3 and a 32-ply [0/±45/90]s4 panels. Each panel was inspected using an ultrasonic C-scan system to ensure good quality. These subpanels were further cut into test specimens of various dimensions depending on the test condition. The 24-ply panels were tested under T-T fatigue while the 32-ply panels were tested under C-C. 3.1 STATIC AND FATIGUE TESTING.
Static compression tests were performed on a 500 kN Instron test frame. The specimens were loaded at a displacement rate of 0.05 inch/min, per ASTM D3410-75 standard. An end-loaded compression test fixture was used, which is similar to a National Aeronautics and Space Administration (NASA) short block compression test fixture (figure 3). A gage area of under 1.5 by 1.5 inches was chosen to prevent global buckling under compression.

6
FIGURE 3. STATIC COMPRESSION SETUP�
Fatigue testing was performed on a 100 kN and 489.5 kN capacity Instron test frame. Constant amplitude compression-compression (C.A. C-C), constant amplitude tension-tension (C.A. T-T), and block-loading tests were performed to determine the influence of different loading parameters on fatigue damage growth. Also, compression- and tension-dominated spectrum loading were investigated using the standardized Transport WIng Standard Test (TWIST) sequence. Damage progression was monitored periodically using x-ray radiography. Static compression and tension tests were performed on surviving specimens to assess the influence of fatigue damage on the residual strength. A block of TWIST sequence is 4,000 hours long and are identified as one of ten flight types (Philips [12]). Each flight type consists of ten stress levels ranging from 0.222 to 1.6 of flight mean load, so that each block of TWIST consists of 398,665 cycles at ten discrete stress levels (table 1). The occurrence of these load levels within one block of TWIST is completely random (figure 4). However, instead of this type of loading sequence, a blocked loading, in which the load levels are executed from the highest to the lowest one, was used in the current tests (see figure 4). All load excursions present in the randomly generated sequence were also included in the blocked-loading sequence. Each block was repeated ten times to simulate 40,000 flights so that the mix-loading effect was still preserved.
TABLE 1. TRANSPORT WING STANDARD TEST CHARACTERISTICS
Load Level Maximum Load Level N
(Number of Cycles) 1 1.6 * FM = FM 1 2 1.5 * FM = FM 2 3 1.3 * FM = FM 5 4 1.15 * FM = FM 18 5 0.99 * FM = FM 52 6 0.84 * FM = FM 152 7 0.68 * FM = FM 800 8 0.53 * FM = FM 4170 9 0.37 * FM = FM 34800
10 0.22 * FM = FM 358665 (FM: Flight mean load)
Modified NASA short block compression test fixture
Static Compression Evaluation
Spherical Seat
Test Fixture
Steel Plate Specimen

7
FIGURE 4. SCHEMATIC REPRESENTATION OF TWIST LOADING
The reason for studying this type of orderly loading sequence was that by monitoring the change in the damage area, one can clearly identify the influence of each load level on damage propagation. Most of the specimens in this study were inspected after the two highest load levels and before the two lowest load levels within each block. However, x-ray radiographs for some specimens were taken after completion of 2, 4, 6, 8, and all 10 load levels within one block of TWIST (see figure 4). 3.2 IMPACT LOADING.
Impact tests were performed on an Instron dynatup 8250 impact test machine with a 0.5-inch tup diameter and a 10.61-lb. impactor weight (crosshead and tup). A modified impact fixture was used to provide the necessary support for the specimens. Modifications were made to accommodate the dimensions of the specimens used in this study; 2- by 2-inch-square cutouts were used. An aluminum 4″ by 4″, 0.75-inch-thick support block was used. In conjunction with the Instron impact testing machine, the Instron model 930-I data acquisition and analysis system was used. This instrumentation system kept complete records of energy and force over time (GRC Instruction Manual). The energy calculations performed by the data acquisition system required the crosshead velocity at impact to be known. This was obtained by measuring the time it takes for a flag of known width to pass through a light beam. The model 930-I used a flag mounted on the crosshead and a photo-detector block on an adjustable bracket. The impact velocity was computed from the time the velocity detector light beam is blocked to the time the light beam re-establishes itself. The impact hammer (tup) was also used to measure the force at impact, i.e., load versus time. By integrating the force versus time curve and knowing the impact velocity, the energy history and the energy absorbed by the composite was calculated.
Compression-Dominated TWIST Spectrum Loading (flight mean load = 30% of NCS)
NLo
ad le
vel
[% o
f NC
S]
-80
-60
-40
-20
0
20
random
X-ray inspection points
orderly
-80
-60
-40
-20
0
20Lo
ad le
vel
[% o
f NC
S]
NLo
ad le
vel
[% o
f NC
S]
-80
-60
-40
-20
0
20
random
X-ray inspection points
orderly
-80
-60
-40
-20
0
20Lo
ad le
vel
[% o
f NC
S]

8
4. RESULTS AND DISCUSSION.
4.1 NOTCH COMPRESSIVE AND TENSION STRENGTH.
Initial static tests were performed to determine how a notch reduces the compressive strength of 32-ply laminates. In this study, the compressive strength of a specimen, whose hole diameter to specimen width ratio (d/w) was 0.167, was found to be 50 ksi, which represented a reduction of 44% from the unnotched strength. All specimen dimensions are shown in figure 5. The compression specimens failed by delamination of the outer plies and crushing of the inner sublaminates across the net section. Both the delamination and crushing were sudden. The final delamination took the form of a butterfly wing, each wing fanning out from the edge of the hole to the outer edge of the specimen. The d/w of the tension specimens was the same as the compression testing setup. The tension strength of notched specimens is 60 ksi, a reduction of 46% from the unnotched 24-ply laminates strength.
FIGURE 5. SPECIMEN DIMENSIONS
The strength reduction due to the notch reported in the literature varies depending on the type of loading, laminate stacking sequence, and the matrix system used. Chu and Sun [29] reported a 42% reduction in the tensile strength of a notched AS4/3501-6 [0/90/±45]s laminate with a d/w of 0.25. Bäcklund and Aronsson [30] reported a 58% tensile strength reduction in a notched Thornel 300/Hy-E-1034 [0/90/±45]2s laminate with a d/w = 0.143. Soutis and Fleck [31] observed a reduction of about 56% for [(±45/02)3]s a T800/924C laminate with d/w = 0.16. Sohi, et al. [32] studied the compressive behavior of quasi-isotropic graphite/epoxy laminates having
Open-Hole Specimens W = 1.5 inch
GL = 1.5 inch (T-C, C-C, and TWIST loading) GL = 2 inch (static tension)
GL = 3 inch (T-T loading and TWIST loading) L = 2.248 inch (static compression testing) L = 5.5 inch (T-C, C-C, and TWIST loading) L = 6 inch (static tension and T-T loading)
D = 0.25 inch
8-Joules-Impacted Specimens W = 3 inch
GL = 3 inch (C-C, and TWIST loading and static) L = 8 inch (static compression testing)
(C-C, and TWIST loading)
W
gage area
grip region
GL D

9
four resin systems: Narmco 5208, American Cyanamid BP907, Union Carbide 4901/MDA, and 4901/mPDA. They found that the 5208 system, being the most brittle, was the most notch sensitive while the BP907 system, being the toughest, was the least sensitive. The 5208 system saw nearly a 65% reduction in strength, while the BP907 saw a reduction of about 55% for d/w = 0.2. Hence, the notch sensitivity observed in this study is consistent. 4.2 NOTCH FATIGUE BEHAVIOR.
A total of 73 specimens were tested for fatigue under various loading conditions as indicated in tables 2 to 5. A summary of fatigue test parameters including the type of loading, load levels, and the number of cycles for each specimen are outlined, and the results are discussed in the following sections. 4.2.1 Constant Amplitude Tension-Compression and Compression-Compression Loading.
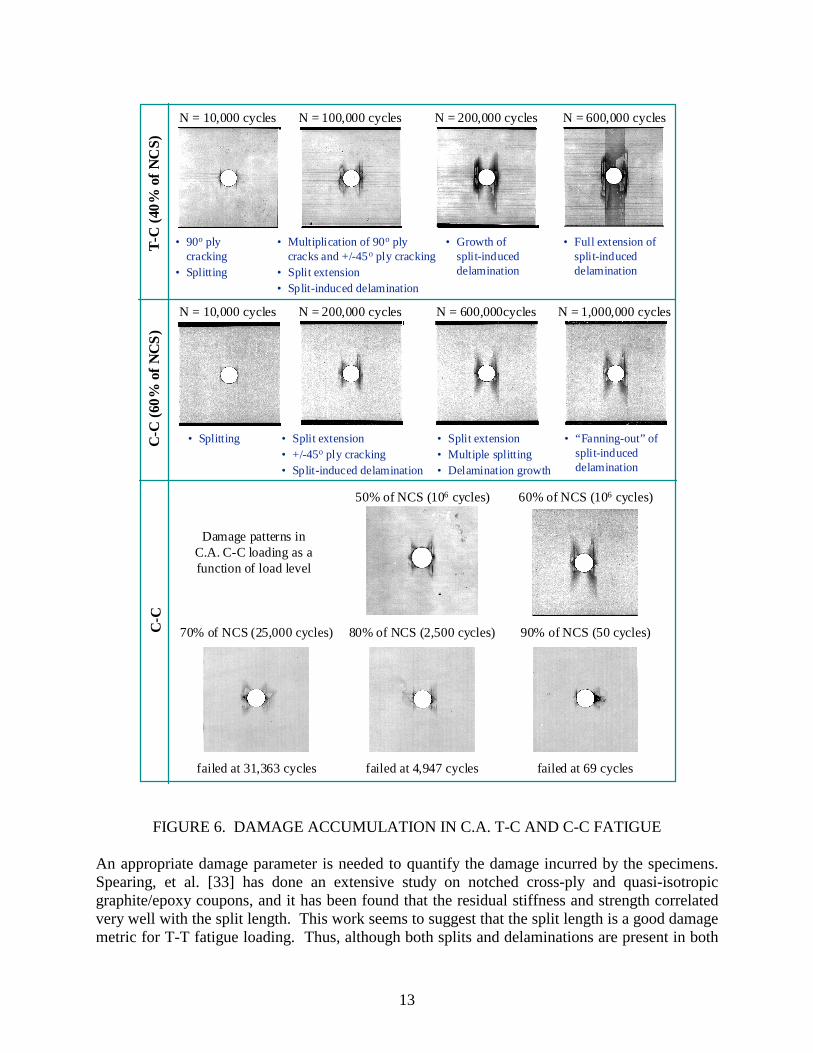
Typical fatigue damage accumulation under C.A. T-C and C-C loading, as observed by x-ray radiography, is presented in figure 6. Although these sample radiographs show similarities between observed damage modes for both loading cases, differences are found upon closer examination. The similarities and differences are described below.
a. Similarities
• All resulted in splitting. The first splits appeared at the horizontal edges of the hole, and their magnitude and extent was dependent on the loading type, load level, and number of cycles.
• All resulted in transverse ply cracking.
• All resulted in delamination around the notch, but the shape and progression differed slightly.
b. Differences
• Some of the plies did not crack under C-C fatigue while in T-C loading, 90° and ±45° plies cracked at about the time of split initiation. However, in C-C only, the ±45° plies cracked sometime after the splitting.
• Under T-C, the delamination grew between and lengthwise along the splits in a narrow band but also grew widthwise, away from the hole and towards the edges. The widthwise extension was limited by the extent of the multiple splits. In C-C, the narrow-band delamination is hardly seen, but the widthwise extension was more pronounced, fanning out into a “butterfly wing” shape.
• Under C-C loading, the mode of damage growth changed depending on the fatigue stress level. At 40% of notch compressive strength (NCS), only splitting is observed, while at 50% and 60% of NCS splitting is accompanied by delamination extension. At higher fatigue load levels (70%-90%) widthwise delamination extension and fiber failure in load-bearing plies became the dominant damage modes, retarding the growth of the split.

10
TABLE 2. TEST MATRIX FOR CONSTANT AMPLITUDE AND TWO-LEVEL BLOCK LOADING
Specimen Number
Load Level (% of NCS)
N (Number of Cycles)
Damage Characteristics
RCS (ksi)
Constant Amplitude Tension-Compression (R=-1) (f = 5 Hz) 32A5 ±30 1,000,000 Ply cracking and single splitting 48.8 31A2 ±40 1,000,000 - 34A4 ±40 1,000,000
Ply cracking, multiple splitting, and lengthwise delamination extension
49.1
31A4 ±50 >200,000 - 34A2 ±50 326,955* - 35A2 ±60 > 50,000
Multiple splitting and lengthwise and widthwise delamination extension -
Constant Amplitude Compression-Compression (R=10) (f = 10 Hz) 33D4 30 1,000,000 48.8 31C2 30 1,000,000 45.5 33A1 30 1,000,000
No damage
46.5 32E7 40 1,000,000 48.7 31C3 40 1,000,000 47.7 35F1 40 1,000,000
Single splitting around hole edges
51.0 32E2 50 1,000,000 47.5 32C2 50 1,000,000 48.7 35F2 50 1,000,000
Splitting and split-induced delamination
46.9 33D6 60 1,000,000 45.9 33A4 60 1,000,000 43.5 35F3 60 1,000,000
Multiple splitting and split-induced delamination
44.2 32E3 70 30,547* - 35F4 70 38,999* - 33A2 70 31,363*
Multiple splitting and widthwise delamination extension
- 33D2 80 1,326* - 35F5 80 4,947* - 32C3 80 3,854*
Widthwise delamination extension, splits, and fiber failure in 0° plies -
33D3 90 27* - 35F6 90 69* - 32C7 90 69*
Damage growth towards specimen edges and fiber failure in 0° plies -
Tension-Compression Two-Level Block Loading (R=-1) (f = 5 Hz) 32A2 ±40
±30 50,000
150,000
47.1 35A3 ±30
±40 150,000 50,000
51.0
31A3 ±50 ±30
5,000 800,000
49.3
32C4 ±30 ±50
800,000 5,000
Ply cracking, splitting, and split-induced delamination
48.3
* Indicates cycles to final failure

11
TABLE 3. TEST MATRIX FOR COMPRESSION-DOMINATED BLOCKED TWIST LOADING
Specimen Number
Flight Mean Load
(% of NCS)
Maximum Flight Load (% of NCS)
N Number of Blocks
(Number of Flights)
Damage characteristics
RCS (ksi)
Full Spectrum Test 35E5 32.5 85 10 (40,000) Widthwise delamination
growth 43.6
35D3 32.5 85% 4 (12,001)* Widthwise delamination growth
-
35C7 32.5% 85% 5 (16,001)* Widthwise delamination growth
-
35E3 30.0 78 10 (40,000) Splitting and split-induced delamination
46.5
35C5 30.0 78 10 (40,000) Multiple splitting and split-induced delamination
43.8
35D2 30.0 78 10 (40,000) Multiple splitting and split-induced delamination
44.6
35F7 27.5 72 10 (40,000) Splitting around hole edges 44.8 35C4 27.5 72 10 (40,000) Splitting around hole edges 42.0 35D1 27.5 72 10 (40,000) Splitting and split-induced
delamination 48.1
Modified Spectrum Test (Two lowest load levels omitted)
35E6 32.5 85 10 (40,000) Widthwise delamination growth
48.4
35C3 32.5 85 3 (12,001)* Widthwise delamination growth
-
35D7 32.5 85 9 (36,001)* Widthwise delamination growth
-
35E4 30.0 78 10 (40,000) Multiple splitting and split-induced delamination
46.2
35C2 30.0 78 10 (40,000) Multiple splitting and split-induced delamination
45.9
35D6 30.0 78 10 (40,000) Multiple splitting and split-induced delamination
44.1
35E7 27.5 72 10 (40,000) Splitting around hole edges 48.0 35C1 27.5 72 10 (40,000) Multiple splitting and split-
induced delamination 47.7
35D4 27.5 72 10 (40,000) Multiple splitting and split-induced delamination
45.9
* Indicates cycles to final failure

12
TABLE 4. TEST MATRIX FOR CONSTANT AMPLITUDE TENSION-TENSION
Specimen Number
Load level (% of NTS)
N (Number of Cycles)
Damage Characteristics
RTS (ksi)
Constant Amplitude Tension-Tension (R=10) (f = 0.1 to 10 Hz) 27B5 40% 1,000,000 67.1 27B1 40% 1,000,000 64.8 27B2 40% 1,000,000
Single splitting and ply cracking around hole edges
71.2 28E2 50% 1,000,000 68.3 28E6 50% 1,000,000 72.5 27B3 50% 1,000,000
Splitting and split-induced delamination ply cracking
65.1 28C2 60% 1,000,000 64.6 27C2 60% 1,000,000 69.7 27B4 60% 1,000,000
Splitting and split-induced delamination ply cracking
61.7 28C3 70% 800,000 67.6 28E3 70% 1,000,000 70.5 27B6 70% 1,000,000
Multiple splitting and delamination and peeling ply cracking 63.8
28C4 80% 600,000 59.8 27C5 80% 1,000,000 60.0 27B7 80% 1,000,000
Splitting and delamination edge delamination and peeling ply cracking 57.0
TABLE 5. TEST MATRIX FOR TENSION-DOMINATED BLOCKED TWIST LOADING
Specimen Number
Flight Mean Load
(% of NTS)
Maximum Flight Load (% of NTS)
N Number of Blocks
(Number of Flights)
Damage Characteristics
RCS (ksi)
Modified Spectrum Test (Two lowest load levels omitted) 28D1 27.5 72 15 (60,000) Ply cracking, delamination 57.2 27B8 27.5 72 15 (60,000) Ply cracking, delamination 56.5 28C7 27.5 72 15 (60,000) Ply cracking, delamination 59.2 28D2 30.0 78 15 (60,000) Splitting and ply cracking
delamination 59.3
27B9 30.0 78 15 (60,000) Splitting and ply cracking delamination
61.9
28C6 30.0 78 15 (60,000) Splitting and ply cracking delamination
59.0
28C8 32.5 85 15 (60,000) Splitting and ply cracking delamination
62.6
27B10 32.5 85 15 (60,000) Splitting and ply cracking delamination
56.5
28D3 32.5 85 15 (60,000) Splitting and ply cracking delamination
60.0
13
FIGURE 6. DAMAGE ACCUMULATION IN C.A. T-C AND C-C FATIGUE
An appropriate damage parameter is needed to quantify the damage incurred by the specimens. Spearing, et al. [33] has done an extensive study on notched cross-ply and quasi-isotropic graphite/epoxy coupons, and it has been found that the residual stiffness and strength correlated very well with the split length. This work seems to suggest that the split length is a good damage metric for T-T fatigue loading. Thus, although both splits and delaminations are present in both
• 90o plycracking
• Splitting
• Multiplication of 90o plycracks and +/-45o ply cracking
• Split extension• Split-induced delamination
• Growth ofsplit-induceddelamination
• Full extension ofsplit-induceddelamination
N = 10,000 cycles N = 100,000 cycles N = 200,000 cycles N = 600,000 cycles
• Splitting • Split extension• +/-45o ply cracking• Split-induced delamination
• Split extension• Multiple splitting• Delamination growth
• “Fanning-out” ofsplit-induceddelamination
N = 10,000 cycles N = 200,000 cycles N = 600,000cycles N = 1,000,000 cycles
C-C
(60%
of N
CS)
T-C
(40%
of N
CS)
failed at 4,947 cycles failed at 69 cycles
50% of NCS (106 cycles) 60% of NCS (106 cycles)
failed at 31,363 cycles
80% of NCS (2,500 cycles) 90% of NCS (50 cycles)70% of NCS (25,000 cycles)C-C
Damage patterns inC.A. C-C loading as afunction of load level

14
loading modes in this study, split length was selected as a preliminary damage parameter. The splits are measured in the following manner. The average split length is taken by averaging the lengths of the two longest splits on either side of the open hole. The average split length proved more effective in showing the difference between the damages caused by compression fatigue and tension fatigue. Normalized split lengths are used for the damage parameter of T-C fatigue. The normalized split length is measured in the following manner. The coupon is divided into four quadrants, with the center of the hole as the origin (see figure 7). Splits in each quadrant were measured with a ruler, then averaged, and normalized with respect to one-half of the gage length. In both T-C, additional splits quickly appeared, out-growing the “main” splits starting from the hole edges. Therefore, only the longest one was measured in each quadrant, as indicated in figure 7. The resulting normalized split length of T-C and the average split lengths of C.A. C-C are shown in figures 7 and 8. The best-fit curves of these figures are of the form: SL = A[log(N/B)]C (1)
where SL is the split length, N is the number of cycles, and A, B, and C are the best-fit parameters (parameter B represents the number of cycles that initiates a split). In C-C, parameter C is equal to 1. Parameter A represents the slope of the split growth curves on a logarithmic scale, and its value of 0.12 was determined as the average value of all load levels investigate (Smin = 40% to 90% of NCS). Parameter B represent the number of cycles that initiate split growth (Nf), and the values of this parameter are dependent on the fatigue stress level as indicated in figure 8a. Figure 8(b) shows the number of cycles at which specimens failed at various load levels; S is the minimum compression stress, and NCS is the average of five specimens. Although it is not obvious in the graph, three specimens were tested at each load level. For C-C fatigue at 70% to 90% of NCS, splitting and lengthwise delamination extension do not follow the observed failure curves. That is, fatigue failures occurred early at these high load levels, although very little splitting damage is observed before the final failure (see figure 8(a)).
FIGURE 7. NORMALIZED SPLIT LENGTH MEASUREMENT AND NORMALIZED SPLIT
LENGTH IN T-C LOADING
a1
b1
a2
b2
g/2L AVERAGE a b a b
N = ( , , , )1 1 2 2
LN = Normalized Split Lengthg = gage lengt h
30% of NCS40% of NCS50% of NCS60% of NCS
N [# of cycles]
Norm
aliz
ed S
plit
Leng
th
0.0
0.2
0.4
0.6
0.8
1.0
101 102 103 104 105 106100

15
(a) (b)
FIGURE 8. CONSTANT AMPLITUDE C-C (a) SPLIT LENGTH VS NUMBER OF CYCLES AND (b) S-N CURVE
In order to reduce the number of parameters that are dependent on loading conditions, another fitting of experimental data was done to establish a relationship between the fatigue stress level and the number of cycles that initiate split growth (Nf). This relationship is schematically represented in figure 9, and the resulting split length growth curves are outlined in figure 10. Split growth data obtained in this way is dependent only on the value of fatigue stress level (Smin) and can be easily extrapolated to other load levels (for material system and laminate configuration used in this study).
FIGURE 9. SPLIT INITIATION VS STRESS LEVEL
N [# of cycles]
S/N
CS
10 1 10 2 10 3 10 4 10 5 10 6
1.0
0.8
0.6
0.4
0.2
Number of cycles to split initiation
Fatig
ue S
tress
Lev
el
30%
40%
50%
60%
70%
80%
90%
100%
0.1 1 10 100 1000 104
Curve fit Smin = 77.2 - 11.02*log(N)
B (Number of cycles that initiate a split from Figure 8 a)
Bnew =10(Smin-77.2)/(-11.02)
���������������������������������������������������������
������������������������������������
���������������
���������������������������������������������������������
�������������������������������������
����������
�������������������������������������������
�������������������������������������
����������
���������������������������
����������������������������������������������
����������
���������������������������������������������������������
����������������������������������������������������������������������������������������
����������������������������������������������
����������
���������������������������������������������
����������
��������������������������
��� ����������������������������������������������� ����������������������������������
����������������������������������� �����������������������������
������������������������� �������������������������������
�������������������������������� ��������������������������
������������������� �����������������������������������������
���������������������������������������������������������������������
������������������������������������������������������
������������
�����������������������������������������
����������
�������������������������������������������������
��������
�������������������������������������������������������������������������������������
������������������������������������������������������������������������������������������������������������������������������������������������������������������������������������������������
����������������������������������������������������������������������������������������������������������������������������
����� ��� ����� ��� ����� ����������
��������
������ �������������
�������������������
��������������
����� ��� ��������
�������������
����������������
�����
�������������
�������������
�������������������
�����������
������
�������������
������
����������������������
����������������������
����������
��������
�������� �����
�����������������������
���������������
����������
�����
�����
����������
�����
�����������
�����
����������
������������
��������
������
�����������
������������
��������
0
0.5
1
1.5
1 10 100 1000 104 105 106
������������������������������������������������������������������������������������������������������������������������������������������������������������������������������������������������������������������������������������������������������������
������������������������������������������������������������������������������������������������������
������������
������������������������������������������������������������������������������������������������������������������������������������������������������������������������������������������������������������������������������������������������������������������
������� ��������40% of NCS��������������������50% of NCS�����������������������������60% of NCS�� �������������70% of NCS����������������������
�������� 80% of NCS��������������������� 90% of NCS
Number of cycles
Split
Len
gth
(inch
es)

16
FIGURE 10. SPLIT LENGTH GROWTH WITH NUMBER OF CYCLES
C.A. C-C (Using Bnew) Other damage modes and basic geometry must be kept in mind when considering the split growth data. As the splits approach the end grip regions, their growth will be affected by the boundary conditions. The second factor is the existence of other damage, i.e., delamination, which grows at a different rate (slower) than the splits, and its growth direction is dependent on the load level. Widthwise delamination extension and fiber failure in load-bearing plies are the dominant damage modes at high load levels. Thus, it is difficult to identify a single damage parameter that correlates to remaining life of a specimen under C-C loading. In T-C loading, the extension of damage more closely follows observed fatigue life, since larger split lengths (figure 7 and table 2) are associated with earlier fatigue failures at higher load levels. 4.2.2 Constant Amplitude Tension-Tension Loading.
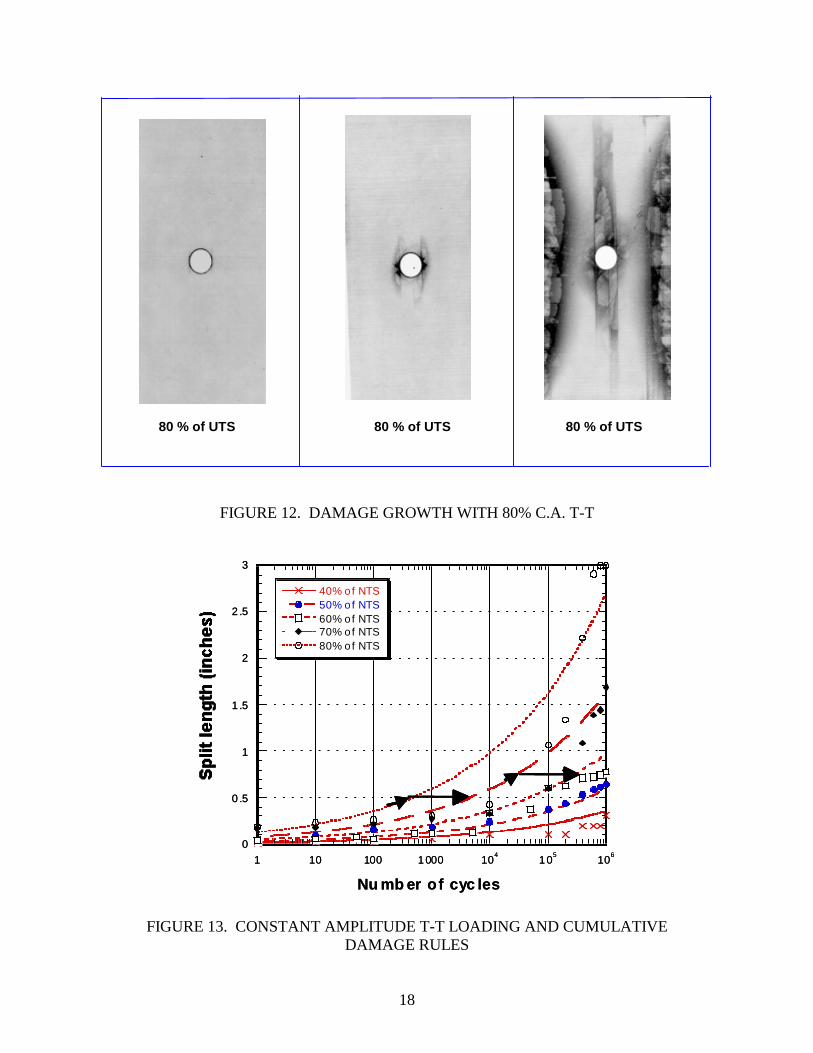
Fifteen notched specimens were tested under constant amplitude T-T loading (table 4). Typical fatigue damage accumulation for the five load levels (40% to 80% of notch tension strength (NTS)) were observed through x-ray radiography (see figure 11). For the specimen tested at 40% of NTS, there was only one x-ray picture available showing the final damage after all 106 cycles; the previous researcher did not take incremental x-ray pictures. For all other loading levels, incremental x-ray pictures were taken as indicated in the figures. For all of the tests, the stress ratio (Smax/Smin) was set to 0.1. As can be seen from the pictures, the damage sustained changed cumulatively with each higher stress level. At 40% of NTS, only splitting was observed. At 50% and 60% of NTS, delamination damage was observed. At 70% of NTS, a portion of the surface ply peeled away. At 80% of NTS, the specimens sustained delamination damage at its edges (see figure 12). The four lowest loads of the tension-dominated spectrum were less than the 40% NTS. The number of cycles below 40% NTS represents 99.44% of the total number of cycles. The
��������������������������������������������������
������������������ �������� �����
���������������������������������������������������������
�������������������������������������������
��������������������������������
���������������������������������������������������������
��������������������������������������������������
�������������������������������������������
����������
�������������������������������������
������������������������������������ ���������������������
����������������������
�������������������������������������������������������������������������� ������������������������������
���������
���������������������������������������������������������
�����������������������������������������������������������
������������������������
�����������������������������������������
����������������������������������������������������������������������������������������������������������������������������������������������������������������������������������������������������
��������������������������������������������������������������������������������������������������������������������������������������������������������������������������������������������
���������������������������������������������
��������������������������������������������������������������������������������������������������������������������������������������������������������
�����������������������������������������������������������������������������������������������������������
���� ��������� ����� �� �����
������
����
���� ���������
�� ��������������
��������������
���� ��������������
������������
������������
����
��������������
����� ���������
����������������
����
��������������
�����������
�������������������
��������
���������
�������� ������
����������������
�����������������
��������
������
����������
���
���������
����������
���� ����������
��������
����� �����
���������
��
0
0.5
1
1.5
1 10 100 1000 104 105 10 6
������������������������������������������������������������������������������������������������������������������������������������������������������������������������������������������������������������������������������������������
������������������������������������������������������������������������������������������������������������
������������������
������������������������������������������������������������������������������������������������������������������������������������������������������������������������������������������������������������������������������������������������
�������������40% of NCS
��������
����������������
��������
���������� 50% of NCS���������������������������������
60% of NCS��� ���������������70% of NCS���������������������������80% of NCS
����������������������� 90% of NCS
Number of cycles

17
resulting split length growth data, including the previous results, are shown in figure 13. The best-fit curves presented in these figures are of the form: SL = SLo*ND (2) where SL is the split length, N is the number of cycles, and SLo and D are best-fit parameters. Parameter SLo represents the initial split length. The values of SLo (table 6) for each load level investigated (Smax = 40-80% of NTS) are listed. The average value of D is 0.2 for all load levels.
FIGURE 11. DAMAGE ACCUMULATION IN C.A. T-T FATIGUE
40% of NTS 106 cycles
50% of NTS 106 cycles
60% of NTS 106 cycles
70% of NTS 106 cycles
50% of NTS 106 cycles
18
FIGURE 12. DAMAGE GROWTH WITH 80% C.A. T-T
FIGURE 13. CONSTANT AMPLITUDE T-T LOADING AND CUMULATIVE
DAMAGE RULES
80 % of UTS 80 % of UTS 80 % of UTS
������������������������������������������������������������������������������������������������������������������������������������������������������������������������������
����������������������������
����������������������������
������������������������������
���������������������������������������������������������������������������������������������������������������������������������������������������������������������������������
������������������
����������������������������������������������������������������������������
�������������������������������������������������������������
������������������������
��������
��������������������
����������������
����������������������� ������������������������ ���������������������� ������������������������� ����������
����������������������
��� ��������������������� ������������������������������
��� ������������������������������
������������������
������������������
��������������
����������������������
�������������������������������������������������������������������� ��������������������������� ���������������������������
������ ����������������������������������������������
���������������������������������
������������������������������
��������������������������
��������
�� ������������������������������� �������������������������������� ��������������������������� ��������������������������������������
����������
�������������������������������� �����������������������������
����������
�������������������������������������������������������������
��������������������������������
�����������������������������������
����������������������������������
����������������������������������������������������������������
������������������������������������������������������������������
��������
��������������������������������������������������������������
��������������������������
����������
���������������������
������������������������
����������
�����������������������
�������������������������������������
��������������������
��������������������������
��������������������
��������������������������������������
��������������������������������������������������������������������������������������������������������������������������������������������������������������������������������
������������������������������������������������������������������������������������������������������������������������������������������
�������������������
���� ���������������
����������
����������������
��������������
��������
��������������
������������
������������
����������
����� ��� ��������������
������������
����������
������������������
��������������
����������
��������
������� �������������
��� �����
�������
������
������������
�����
������
0
0 .5
1
1 .5
2
2 .5
3
1 10 100 1000 104 105 106
������������������������������������������������������������������������������������������������������������������������������������������������������������������������������������������������������������������������������������������������������������������������������������������������������
��������������������������������������������������������������������������������������������������������������������������������
������������������������������
������������������������������������������������������������������������������������������������������������������������������������������������������������������������������������������������������������������������������������������������������������������������������������������������������������
����������������40% of NTS���������������������50% of NTS�����������������������������60% of NTS�������������������������������70% of NTS���������������������������������80% of NTS
Nu mb er of cyc les
19
TABLE 6. PARAMETER OF SLo FOR EACH LOADING (C.A. T-T)
Load Level (% of NTS)
Parameter SLo
40 0.017 50 0.028 60 0.047 70 0.078 80 0.129
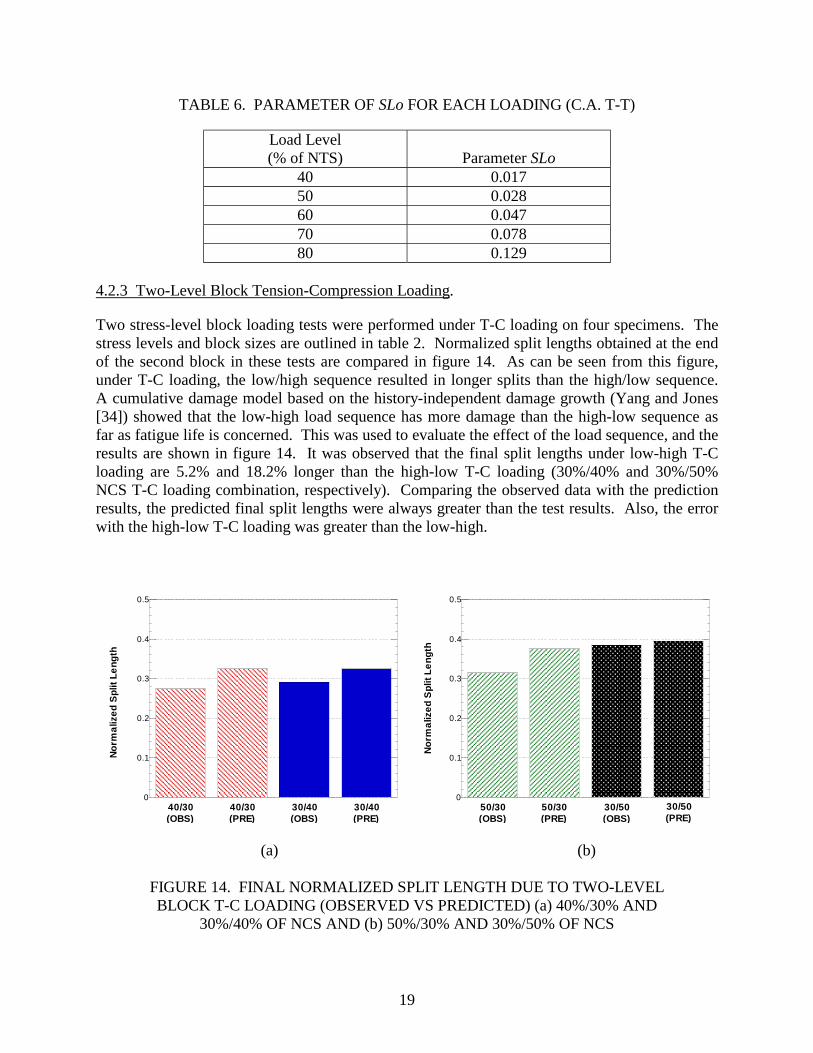
4.2.3 Two-Level Block Tension-Compression Loading.
Two stress-level block loading tests were performed under T-C loading on four specimens. The stress levels and block sizes are outlined in table 2. Normalized split lengths obtained at the end of the second block in these tests are compared in figure 14. As can be seen from this figure, under T-C loading, the low/high sequence resulted in longer splits than the high/low sequence. A cumulative damage model based on the history-independent damage growth (Yang and Jones [34]) showed that the low-high load sequence has more damage than the high-low sequence as far as fatigue life is concerned. This was used to evaluate the effect of the load sequence, and the results are shown in figure 14. It was observed that the final split lengths under low-high T-C loading are 5.2% and 18.2% longer than the high-low T-C loading (30%/40% and 30%/50% NCS T-C loading combination, respectively). Comparing the observed data with the prediction results, the predicted final split lengths were always greater than the test results. Also, the error with the high-low T-C loading was greater than the low-high.
(a) (b)
FIGURE 14. FINAL NORMALIZED SPLIT LENGTH DUE TO TWO-LEVEL BLOCK T-C LOADING (OBSERVED VS PREDICTED) (a) 40%/30% AND
30%/40% OF NCS AND (b) 50%/30% AND 30%/50% OF NCS
������������������������������������������������������������������������������������������������������������������������������������������������������������������������
������������������������������������������������������������������������������������������������������������������������������������������������������������������������������������������������������������������
���������������������������������������������������������������������������������������������������������������������������������������������������������������������������������������������
������������������������������������������������������������������������������������������������������������������������������������������������������������������������������������������������������������������
0
0.1
0.2
0.3
0.4
0.5
40/30(OBS)
40/30(PRE)
30/40(OBS)
30/40(PRE)
Norm
aliz
ed S
plit
Leng
th
���������������������������������������������������������������������������������������������������������������������������������������������������������������������������������������������������������������
�������������������������������������������������������������������������������������������������������������������������������������������������������������������������������������������������������������������������������������������������������������
�������������������������������������������������������������������������������������������������������������������������������������������������������������������������������������������������������������������������������������������������������������
����������������������������������������������������������������������������������������������������������������������������������������������������������������������������������������������������������������������������
0
0.1
0.2
0.3
0.4
0.5
50/30(OBS)
50/30(PRE)
30/50(OBS)
30/50(PRE)
Norm
aliz
ed S
plit
Leng
th

20
4.2.4 Compression-Dominated Spectrum Loading.
Results of constant amplitude C-C tests indicate that fatigue failure does not occur as long as the highest load levels are kept below 60% of NCS. Although high load levels represent less than 0.05% of the total number of cycles in the TWIST, their magnitude and sequence of occurrence is very important for the appropriate design of standardized certification procedures for notched composite materials. The flight mean load remains an important parameter since it determines the ten excursion load levels. In this study, the flight mean load levels were chosen to obtain an appreciable damage accumulation so that the maximum load levels within the TWIST spectrum are higher than 70% of NCS. The load levels of 72%, 78%, and 85% of NCS were investigated in this study. It should be noted that, although the spectrum load was compression dominated, some load excursions were high enough to produce tension loads up to +20% of NCS. A total of 18 specimens were tested under the “blocked” TWIST spectrum loading as indicated in table 3. Nine specimens were evaluated under the full spectrum conditions, while nine were tested in a modified spectrum in which two lowest load levels were omitted from the test sequence. Final damage patterns after completion of ten blocks of TWIST are presented in figures 15 through 17 for both full and modified loading. Although there were differences (figures 15 through 17), the small extent of displayed damage patterns made it difficult to reach a definite conclusion about the influence of spectrum modification on damage propagation.
FIGURE 15. FINAL DAMAGE PATTERNS AFTER TEN BLOCKS IN FULL AND
MODIFIED SPECTRUM FOR FLIGHT MEAN LOAD OF 27.5% NCS
FULL
SPEC
TRU
M
MO
DIF
IED
SPEC
TRU
M
FLIGHT MEAN LOAD = 27.5% of NCS Smax = 72% of NCS
6 SPECIMENS

21
FIGURE 16. FINAL DAMAGE PATTERNS AFTER TEN BLOCKS IN FULL AND
MODIFIED SPECTRUM FOR FLIGHT MEAN LOAD OF 30% NCS
FIGURE 17. FINAL DAMAGE PATTERNS AFTER TEN BLOCKS IN FULL AND
MODIFIED SPECTRUM FOR FLIGHT MEAN LOAD OF 32.5% NCS
FULL
SP
ECTR
UM
M
OD
IFIE
SP
ECTR
UM
FLIGHT MEAN LOAD = 30% of NCS Smax = 78% of NCS
6 SPECIMENS FU
LL
SPEC
TRU
M
MO
DIF
IED
SP
ECTR
UM
FLIGHT MEAN LOAD = 32.5% of NCS Smax = 85% of NCS
6 SPECIMENS
Failed after 3 blocks Failed after 9 blocks Finished 10 blocks
Failed after 3 blocks Failed after 4 blocks Finished 10 blocks
Specimen 35C3 Specimen 35D7 Specimen 35E6
Specimen 35C7 Specimen 35D3 Specimen 35E5

22
Damage observed during the tests were predominately splits and delaminations, so these have been measured to quantify the damage incurred by each specimen. The method by which splits were measured is explained in section 4.2.1. Delamination area was measured as the percentage of the total gauge area. The averaged results are shown in figures 18 and 19. It should be noted that of the six specimens tested at flight mean load level of 32.5% of NCS, three broke completely and could not complete all ten blocks. The average split length tends to reach a maximum value after six blocks while delamination area continues to increase after each block. This suggests that measuring damage by delamination area may more accurately represent fatigue damage growth.
FIGURE 18. SPLIT LENGTH IN FULL AND MODIFIED TWIST SPECTRUM
FIGURE 19. DELAMINATION AREA IN FULL AND MODIFIED TWIST SPECTRUM
����
�����
����������
����������
���� ��� ���������� ���
�������
����������
����������
������ ����� ��������������� ����
������
����������
��������
������
����������
������� ������ ����
0
0.1
0.2
0.3
0.4
0.5
0 2 4 6 8 10 12 14 16
������������������������������������������������������������������������������������������������������������������������������������������������������������������������������������������������������������������������������������������������������������������������
����������������������������������������������������������������������������������������������������������������
������������������������
������������������������������������������������������������������������������������������������������������������������������������������������������������������������������������������������������������������������������������������������������������������������������
����Ave M27.5%Ave F27.5%����Ave M30%Ave F30%
�������� Ave M32.5%
F32.5% (35E5)
Number of blocks
����
����� ��������� ���� ��� ����� ���� �� ����
������� ���
������������
���� �������������
��������
������������
����
����
��������
������������
�������
�����
����
��
0
0.5
1
1.5
2
2.5
3
3.5
4
0 2 4 6 8 10
������������������������������������������������������������������������������������������������������������������������������������������������������������������������������������������������������������������������������������
����������������������������������������������������������������������������������������
������������
������������������������������������������������������������������������������������������������������������������������������������������������������������������������������������������������������������������������������������������
��Ave M27.5Ave F27.5������Ave M30Ave F30�� Ave M32.535E5 (F32.5)
Number of blocks

23
It is difficult to note any significant differences between the modified and full spectrum loading. X-ray radiography indicates that the damage grows appreciably after the completion of high load levels but did not change much at the two lowest load levels (which represent 98.69% of the testing time). The two lowest load levels of the TWIST spectrum (with load amplitudes of less than 20% of NCS) may be omitted from the test sequence without any noticeable influence on fatigue damage propagation. Delamination damage is not visible enough to formulate a prediction model; however, there is enough data to suggest a relationship between the fatigue stress level and the number of cycles that initiate split growth (Nf). Using the results of the C-C loading tests (figures 8 through 10), a cumulative damage rule is formulated based on the history-independent damage growth model (Hwang and Han [35]), which predicts a linear cumulative damage growth. Figure 10 shows this rule graphically. The method involves matching the various linear growth lines (dependant on load levels only) to the number of cycles under that load level. Currently, this rule is only applied to spectrums where the load levels progressively decrease. Starting from the high load level, the split length growth follows that load level’s predicted curve. At the second load level, the split length grows by the number of cycles beyond the initial growth point. Figure 20 and table 7 show two simple cases to outline this damage growth rule. Figure 20(a) has only two load levels at 90% and 50% of NCS. The split length will grow following the 90% line up to ten cycles. However, since 100 cycles is not enough to initiate split growth under 50% of NCS, the split length will not grow any further under the second load level. Figure 20(b) also has two load levels at 90% and 80% of NCS. As in figure 20(a), the split length grows following the 90% line. Unlike figure 20(a), split growth is initiated after four cycles under 80% of NCS. Therefore, the split length is extended from the 90% of NCS line for 96 cycles under the 80% of NCS (see figure 20(b)). Split length growth predicted by this rule is dependant only on the value of the fatigue stress level (Smin) and can be easily extrapolated to other load levels (table 1 and figure 21). It should further be noted that the C-C loading tests all had a stress ration of 10, while under spectrum loading, the stress ratios changed for each load level. However, this cumulative damage rule (see figure 21) is fairly successful in predicting split length growth. Comparison of average split length growth between the experimental data and the cumulative prediction is shown in figure 22. There is a fairly good match between the model prediction and experiment data but with a little scatter in the 32.5% flight mean load data. The final split length differences between the experimental data and the prediction model are 4%, 4.8%, and 8.9%, respectively, at 27.5%, 30%, and 32.5% of flight mead load levels (see figure 23). Also, the monitored damage growth within the full spectrum (figure 22) clearly delineates the influence of certain load levels on the damage growth, suggesting that the two lowest load levels (which represent 98.69% of the whole spectrum cycles) can be deleted for the test sequence without significant effect.

24
(b)
FIGURE 20. CONSTANT AMPLITUDE C-C LOADING (a) 90% AND 50% (b) 90% AND 80%
���������������������������������������������������
�������������������������������������������������������������������������
�����������������������������������������������������������������������������������������
�����������������������������������������������������������������������������������
��������������������
��������������������������������������������������
��������������������������
��������������������������������������������������������������������������������������������������������������������������������������������
������������������������������������������������������������������������������������������������������������������������������������������������������������������������
����������������������������������������������������������������������������������������
������������������������������������������������������������������������
���������������������������������������������������������������������������������������������������������������������������������������������������������������������������������������������
���������������������������������������������������������������������������������������������������������������������������������������
����������
���������
�����
���������������
����������
��������
0
0.5
1
1.5
1 10 100 1000 104 105 106
������������������������������������������������������������������������������������������
������������������������������������������������������������������
������
���������������������������������������������������������������������������������������������������������������80%����������������������
���� 90%
Number of cycles
Split
leng
th (i
nche
s)
�������������������������������������������������������������
����������
�������������������������������������������
��������������������
���������������������������������������������������������������������������������������������
�������������������������������������������������������������������������������������������������������������������������������������������������������������������������������������������������������������������������������������������������������������
������������������������������
������������������������������������������������������������������������������������������������������������
���������������������������������������������������������
������������������������������������������������������������������������������������������������������������������������������������������������������������������������������������������������
���������������������������������������������������������������������������������������������������������������������������������������
���� ������
����������
��������
������������
�����
����
������������
�����
0
0.5
1
1.5
1 10 100 1000 104 105 106
���������������������������������������������������������������������������������������������
�����������������������������������������������������������������������
���������
������������������������������������������������������������������������������������������������
��������������50%�������������������90%
Number of cycles
���������Sp
lit le
ngth
(inc
hes)
(a)

25
TABLE 7. EXAMPLES OF C.A. C-C PREDICTION MODEL
(a)
90%
50% 100
10
Load Level
Number Cycles
(b)
90%
80% 100
10
Load Level
Number Cycles
FIGURE 21. CUMULATIVE DAMAGE RULE FOR
COMPRESSION-COMPRESSION LOADING
������������� ���������������������
������� ��������������������������
�������������������������
����������
������������������������������������������
���������������������������������������
������ ������������������������������
�������������������������
��������������
�������������������������������������������������������������������������
�������������������������������������
����������
��������������������������������������
�����������������������������������
��������
������������
������
����������������������������������������������������������������������
������������
��������������������������������������������������
������������������������������
������������ �������������������������������������������������
�����
���������������������������������������������������������
��������������������������������������������
���������������������������������������
������������������
����������������������������������������������������������
�������������������������������������������������������������������������������������������������������������������
�������������������������������������������������������������������������������������������������������������������������������
��������������������������������������������������������
��������������������������������������������������������������������������������������������������������������������������������
��������������������������������������������������������������������������������
��������������������������������������������������������������������������������������������������������������������������������������������������������������������������������������
����������������������������������������������������������������������������������������������������������������������������������������������
������������
������������
����������
����������
��������
����������
����������
����������
������������
�����
���� ���������������
��������������
������������
������������
����������
����������
��������
����������
�����������
������������
�������������������
�������������
�����������
����������
��������
����������
��������������
������
����������
���� ���������������
������������
��������������������
�����������
���� �����������
����������
����
������������������
������������
���
�������
������������
������
����������
��������
�������
������������
�������������
����
�����
������������
�����
��������
���
0
0.5
1
1.5
1 10 100 1000 10 4 10 5 10 6
������������������������������������������������������������������������������������������������������������������������������������������������������������������������������������������������������������������������������������������������������������������������������������������������������������������������������������������������
��������������������������������������������������������������������������������������������������������������
�������������������������������������������������������������������������������������������������������������������������������������������������������������������������������������������������������������������������������������������������������������������������������������������������������������������������������������������������������
����������������
������������
���������� 40% of NCS���
���������������
����������
����������
���������� 50% of NCS��������������������������������
60% of NCS�� ��������������
70% of NCS����������������������������������� 80% of NCS��������������������
90% of NCS
Number of cycles

26
FIGURE 22. SPLIT LENGTH AS A FUNCTION OF COMPLETED BLOCK FOR FULL AND MODIFIED SPECTRUM—COMPRESSION
(Comparison between cumulative damage model prediction and experiment data)
��������������������
������������������������
��������������������������������������������������������������
����������������������������
�����������������������
����������������������������������������������������������������
��������������������������������������������������������������������������������������������������������������������������������������������������
������������������������������������������������������������������������������������������������������������������
���������
����������
������������
������
���� ����� ������� ���� �����
������������
������
����� ������ ��� ���� �������������������
��������
����������������
�����������
������
����� ����
0
0.5
1
1.5
0 2 4 6 8 10 12
������������������������������������������������������������������������������������������������������������������������������������������������������������������������������������������������������������������������������������������������������������������������������������������������������������
���������������
��������������������
������������������������������������������������������������������������������������������������������������������������������������������������������������������������������������������������������������������������������������������������������������������������������������������������������������
������ Modified TWIST
Full TW IST���������������Cumulative damage rule
Number of blocks
����������������������������
�������������������������������������
�������������������������������������������������������������������������
����������������������������������������������������������������
��������������������������������������������������������������������������������������������������������������������������������������������������
������������������������������������������������������������������������������������������������������������������
������������
�����������
������������
��� ���� ����� ������ ���� �����������������
��� ����������������
������
���� ����� ��������������
����������
����������
������
����������
��������
0
0.5
1
1.5
0 2 4 6 8 10 12
������������������������������������������������������������������������������������������������������������������������������������������������������������������������������������������������������������������������������������������������������������������������������������������������������������������������������������������������������������������������������������
����������������������������������������������������������������������������������������������������������������������������������������������������������
������������
������������������������������������������������������������������������������������������������������������������������������������������������������������������������������������������������������������������������������������������������������������������������������������������������������������������������������������������������������������������������������������������
�����Modified TWIST
Full TWIST��������������
Cumulative damage rule
Number of blocks
������������������������������������
���������������������������������������������������������������������������
����������������������������
�����������
������������������������������������������������������������
������������������������������������������������������������������������������������������������������������������������������������������������
������������������������������������������������������������������������������������������������������������������
��������� ���� ����� �������
��������
����� ������ ��� ����������
��� ����������������
����
��������������
����������
������
0
0.5
1
1.5
0 2 4 6 8 10 12
������������������������������������������������������������������������������������������������������������������������������������������������������������������������������������������������������������������������������������������������������������������������������������������������������������������������������������������������������������������������
������������������������������������������������������������������������������������������������������������������������������������������
������������������������
������������������������������������������������������������������������������������������������������������������������������������������������������������������������������������������������������������������������������������������������������������������������������������������������������������������������������������������������������������������������������
����Modified TWIST
Full TWIST������������
Cumulative damage rule
Number of bloc ks
(a) Flight mean load: 27.5% NCS
(c) Flight mean load: 32.5% NCS
(b) Flight mean load: 30% NCS
Modified TWIST Full TWIST Cumulative damage rule
Modified TWIST Full TWIST Cumulative damage rule
Modified TWIST Full TWIST Cumulative damage rule

27
FIGURE 23. FINAL DAMAGE DIFFERENCE BETWEEN EXPERIMENTAL AND
PREDICTION RESULTS (Compression) 4.2.5 Tension-Dominated Spectrum Loading.
Nine specimens were tested under a tension-dominated modified spectrum (flight mean loads of 27.5%, 30%, and 32.5% NTS); as before, the two lowest load levels of the full spectrum were removed (see figure 24 and table 5). These loading spectrums were used in tests performed with 5 additional blocks, increasing the overall loading to 15 blocks. The new specimens were subjected to 15 blocks, which translates to 60,000 aircraft hours which represents the design goals of transport aircraft. With the experience gained from testing the full and modified spectrums under compression-dominated TWIST loading, the decision was made to forgo the full spectrum testing with the tension-dominated TWIST. Since the two lowest blocks (which are eliminated in the modified spectrum) represented nearly 165 hours per specimen, this decision led to significant time savings. Under compression-dominated TWIST loading, little difference was noted between the results of the full and modified spectrums. Furthermore, four specimens (two per each level) were tested under constant amplitude loading at the levels of the two lowest blocks to verify that they caused negligible amounts of damage. For each of these two levels, 15 blocks were conducted consecutively. However, since these 15 blocks were all identical, they did not require manual resetting after each TWIST block. Thus, these tests required less time to conduct.
0
0.1
0.2
0.3
0.4
0.5
27.5% Predict
27.5% Test
30% Predict
30% Test
32.5% Predict
32.5% Test
Split
Len
gth
(inch
)

28
FIGURE 24. FINAL DAMAGE PATTERN AFTER 15 BLOCKS OF THE MODIFIED
SPECTRUM FOR THREE DIFFERENT FLIGHT MEAN LOADS
FLIGHT MEAN LOAD = 27.5% of NTS Smax = 72% of NTS
FLIGHT MEAN LOAD = 30% of NTS Smax = 78% of NTS
FLIGHT MEAN LOAD = 32.5% of NTS Smax = 85% of NTS

29
For the first of these lowest blocks, two specimens were subjected to 15 blocks of 34,800 cycles at a stress ratio (Smax/Smin) of 2.17. The testing load ranged from 45% to 20% of NTS. Damage initiation was observed by x-ray radiography after five blocks. However, even after all 15 blocks (about 15 hours), there was only a single split to each edge of the hole and little ply cracking was observed (see figure 25). For the second of the lowest blocks, the stress ratio was 1.56. The testing load ranged from 40% to 25% of NTS. Each block consisted of 358,665 cycles. At this level, no damage was observed after all 15 blocks (about 150 hours). These results seemed to indicate that these two lowest load levels could be deleted without causing large influence on damage propagation. The specimens, under constant amplitude T-T loading, are observed to suffer progressively and significantly more damage at higher load levels. This suggests that, under spectrum loading, most of the damage is caused by the larger amplitude blocks. Coupled with the results of tests conducted at the two lowest blocks individually, it seems to be a safe assumption that the two lowest blocks added negligibly to the total damage.
FIGURE 25. DAMAGE BY THE TWO LOWEST BLOCKS (Tension)
The split lengths under spectrum fatigue were calculated using the same cumulative damage rule from the constant amplitude tension fatigue data. At 27.5% and 30% NTS of flight mean loads, there is a fairly good match with predicted split lengths (see figure 26(a) and (b)). However, the model predicts longer lengths for 32.5% NTS than what is measured. Both the predicted and
R = 2.17 Smax = 45% NTS Smin = 20% NTS
FML = 32.5% NTS after 522,000 cycles
R = 1.56 Smax = 40% NTS Smin = 25% NTS
FML = 32.5% NTS after 5,379,975 cycles

30
measured final split lengths are shown in figure 27. It should be noted that the T-T C.A. fatigue had a stress ratio of 0.1, while under spectrum loading, the stress ratio varied with the load level.
FIGURE 26. SPLIT LENGTH AS A FUNCTION OF COMPLETED BLOCK FOR
FULL AND MODIFIED SPECTRUM—TENSION (Comparison betweem cumulative damage model prediciton and experiment data)
������������������
����������������
��������������������
����������������
������������������������������������
�������������������������������������������������������������������������������
����������������������������������������������������������������
����������������������������������������������������������������������������������������������������������������������������������������������������������������������������
������������������������������������������������������������������������������������������������������������
������
������������
��������
������
��������������� ����� ��� ������ ���� ����� ������
���
������������
���� ��� �������������
������������
����� ��������� ���� ����� ������
���
������ ���� �������������
��������
������������
����� ��� ����������
����� ������
0
0.1
0.2
0.3
0.4
0.5
0 2 4 6 8 10 12 14 16
��������������������������������������������������������������������������������������������������������������������������������������������������������������������������������������������������������������������������������
����������������������������������������������������������������������������������������������������������������������������
����������������
������������������������������������������������������������������������������������������������������������������������������������������������������������������������������������������������������������������������������������
���Modifi ed TWIST�����������Cumulative damage rule
Number of blocks
������������������������������
������������������
����������������������
��������������������
�������������������������������������
��������������������������������������������������
�������������������������
���������������
����������������������������������������������������������������������������������������������������������������������������������������
����������������������������������������������������������������������������������������������������������
�������
����� ���� ������� ���
������������
��������
������
����������
��� ����
�������
����������
���� ������� ���
������������
���� ��� ����� ��� ����
�������
��������� ��
����� ��� ���������� ��� �����
������
����
0
0.1
0.2
0.3
0.4
0.5
0 2 4 6 8 10 12 14 16
����������������������������������������������������������������������������������������������������������������������������������������������������������������������������������������������������������������������������������������
������������������������������������������������������������������������������������������������������������������������������������
��������
��������������������������������������������������������������������������������������������������������������������������������������������������������������������������������������������������������������������������������������������
����Modified TWIST������������Cumulative damage rule
Number of blocks
����������������������
������������������
����������������
����������������������������
�������������������������������������
�������������������������������������������������������������������������
��������������������������������
�������������������������������������������������������������������������������������������������������������������������
���������������������������������������������������������������������������������������������������������
���������������
����� ��� ��������������
�� ����� ��� ����������
���
����������
����
������������
����������
������
��������������
����
����������
��������� �� ���
����������
���������� �����������
������������
��������
����� ��� �������� ���
0
0 .1
0 .2
0 .3
0 .4
0 .5
0 2 4 6 8 10 12 14 16
��������������������������������������������������������������������������������������������������������������������������������������������������������������������������������������������������������������������������������
������������������������������������������������������������������������������������������������������������������������
����������������
������������������������������������������������������������������������������������������������������������������������������������������������������������������������������������������������������������������������������������
������Modi fied TWIST��������������Cumulative damage rule
Number of blocks
(a) Flight mean load: 27.5% NTS
(c) Flight mean load: 32.5% NTS
(b) Flight mean load: 30% NTS
Split
Len
gth
(inch
)
Split
Len
gth
(inch
)
Split
Len
gth
(inch
)

31
FIGURE 27. FINAL DAMAGE DIFFERENCE BETWEEN EXPERIMENTAL AND
PREDICTION RESULTS (Tension) The growth of the split length in open-hole specimens under tension-dominated modified spectrum loading was measured and compared to the split length predicted by the cumulative damage rule. The predicted values were calculated using all load levels (modified spectrum has eight different load levels). However, there is a need to investigate which load level contributes the most to the predicted damage growth, and also to investigate how much effect each load level has on the damage growth. Figures 28 through 30 show the test results and predicted values of all three flight mean load levels. Using all load levels (eight load levels) and the eight highest load levels (modified spectrum which is deleting the two lowest load levels) for the cumulative damage rule, results in pretty good matches with the test results for 27.5% and 30% flight mean load level (see figures 28 and 29). At 30% flight mean load, the final split length difference between the predictions using all load levels, the seven highest load levels, and the six highest load levels, the test results were 6.52%, 0.95%, and 6.03%, respectively. Under 32.5% flight mean load, the predicted value using all load levels is 25% higher than the test results. The damage growth predicted using the two and three highest load levels most closely matches the actual test results. From all figures, it is obvious that the current cumulative damage rule is missing a key element in the way the composite laminates behave under tension fatigue. Somewhere between the 30% and 32.5% flight mean load levels, the higher load levels are causing some sort of irreversible damage to the laminate so that the lower load levels no longer cause much damage. This might be due to the stress relief effect. This would also explain why the simple cumulative damage rule works so well for predicting damage growth under compression-dominated spectrum, while it fails for the tension-dominated spectrum. Clearly, the cumulative damage rule will need to be modified to take into account this change in behavior under higher flight mean load levels.
Split
Len
gth
(inch
)
0
0.1
0.2
0.3
0.4
0.5
27.5% Predict
27.5% Test
30% Predict
30% Test
32.5% Predict
32.5% Test

32
FIGURE 28. SPLIT LENGTH GROWTH OF TEST RESULTS AND PREDICTED
VALUES OF 27.5% FLIGHT MEAN LOAD
FIGURE 29. SPLIT LENGTH GROWTH OF TEST RESULTS AND PREDICTED
VALUES OF 30% FLIGHT MEAN LOAD
������������������������������������������������������������
��������������������������������������������������
����������������������������������������������������������
��������������������
������������������������������������
����������������������������������
������������������������������
������������������������������������������������������������
��������������������������������������������������
������������������������
�������������������������������
�����������������������������������
��������������������������������������������������������������������
������������������������
�����������
��������������������������������������������
��������
������������ ������������������������������������������������������������
��������������������������� ���������� ����������
�����
����������
���� ��� ��������� ����� ����� ����
������
��� ����� ����
���������
��������
��� �� ����������������
���� ���� ��� �� ����������������
���� ����
����������
���� ����������
�� ������ ����� ���� ����������
����
������ ����� ���� ���
��������� ���� ���
����
������������
����� ���� ���� ��� �� ����������������
��������
��������
����� ���� ������� �� ������ ����� ���� ����
������
����
������ ����� ���� ����
0
0.1
0.2
0.3
0.4
0.5
0 2 4 6 8 10 12 14 16
������������������������������������������������������������������������������������������������������������������������������������������������������������������������������������������������������������������������������������������������������������������������������������������������������������������������������������������������������������������������������������������������������������������������������������������������������������������������������������������������������������������������������������������������������������������������������������������������������������������������������������������������
����������������������������������������������������������������������������������������������������������������������������������������������������������������������������
����������������
��������������������������������������������������������������������������������������������������������������������������������������������������������������������������������������������������������������������������������������������������������������������������������������������������������������������������������������������������������������������������������������������������������������������������������������������������������������������������������������������������������������������������������������������������������������������������������������������������������������������������������������������������������
���������������������� test results���������������
predicted by all loads (8) �����������������predicted by 7 highest loads �������������������predicted by 6 highest loadspredicted by 5 highest loadspredicted by 4 highest loads��predicted by 3 highest loads��predicted by 2 highest loads
���� predicted by the highest load only
Split
leng
ht (i
nche
s)
Number of blocks
������������������������������������
������������������������
������������������������
���������������������������������
������������������������������������������
���������������������������������������������������������
������������������������
������������������������
���������������������������������
������������������������������������������
��������������������
����������������������������������������������
������������������������
������������������������
������������������������
����������������������
��������������������������������������������
���������������������������������������������������������
���������������������������������
����������������������
���������������� �������������������
������������������������������������������������������ ������������ ����������������������������������
���������������
�����
����������
�������� ����
���� ���������
��� ������� ������ ������ �����
����������
��������
������������
���� ���������
��� �� ��������������
������ ����� ����� �����
����� �������� ����
��������
��� ��� �������
�� ������ ������ ����� ����� �����
����������
�������������
���� ����������
��� ��� ��� �� ������������������
����������
����� �����
����������
������������
���� ���� ���������
��� �� �� ������ ����������������
����������
�����
0
0.1
0.2
0.3
0.4
0.5
0 2 4 6 8 10 12 14 16
���������������������������������������������������������������������������������������������������������������������������������������������������������������������������������������������������������������������������������������������������������������������������������������������������������������������������������������������������������������������������������������������������������������������������������������������������������������������������������������������������������������������������������������������������������������������������������������������������������������������������������������������������������������������������������������������������������������������
�������������������������������������������������������������������������������������������������������������������������������������������������������������������������������������
���������
������������������������������������������������������������������������������������������������������������������������������������������������������������������������������������������������������������������������������������������������������������������������������������������������������������������������������������������������������������������������������������������������������������������������������������������������������������������������������������������������������������������������������������������������������������������������������������������������������������������������������������������������������������������������������������������������������������������������������
������������������������ test results�������������
predicted by all loads (8)�����������������predicted by 7 highest loads���������������������predicted by 6 highest loadspredicted by 5 highest loadspredicted by 4 highest loads����
���� predicted by 3 highest loads����predicted by 2 highest loads����predicted by the highest loads
Split
leng
th (i
nche
s)
Number of blocks
Split
Len
gth
(inch
)
Split
Len
gth
(inch
)

33
FIGURE 30. SPLIT LENGTH GROWTH OF TEST RESULTS AND PREDICTED VALUES
OF 32.5% FLIGHT MEAN LOAD 4.2.6 Stress Ratio Effect on Spectrum Fatigue Loading.
Figures 23 and 27 show that the predicted damage values are higher than the experimental ones (except 27.5% FML at compression TWIST); this discrepancy can be explained by the stress ratio effect. The preset stress ratios of the constant amplitude compression and tension fatigue load tests were 10 and 0.1, respectively. These values were used in the model to predict the damage growth. However, under actual test conditions, the specimens experienced ten different stress ratios at various points of the spectrum load levels. Figure 31(a) shows the stress ratios during the actual loading text and the values used to predict damage results. As the figures show, the prediction model never reaches tension load levels during the early cycles, but it has a greater load range than that experience during actual tests. Figure 31(b) shows the damage growth of specimens tested under different stress ratios but with the same minimum load levels. Specimens with larger preset stress ratios tend to suffer greater damage regardless of the minimum load level. This clearly indicates that stress ratios play a role in the damage growth of a specimen under spectrum loading. Since the prediction model assumed a constant stress ratio, this may explain why the predicted split lengths are shorter than the actual split length. Unfortunately, there is currently insufficient data to construct a prediction model that takes into account the variable stress ratios experienced during spectrum loading.
���������������������������������
���������������������������������
������������������������
�������������������������������������������������
�����������������������������������
��������������������������
����������������������������������������������������
���������������������
������������������������������
����������������������
��������������������������������������
��������������������������
��������������������
�����������������������������������
���������������������������������������������
�����������������������������������������������
��������������������
����������������������
������������������������
���������������������������������������
��������������������������������
��������������������������������������������������
���������������������������������������������
������������������������
������������
����������
������������������������
����������������������������� ���
������������
������������ �����������������
������������������������ ���������������������������������������� �����������
������������
������
��������
����� ������������������
��� ��������������
������ ���������� �����
���������
�������� �����
������ ������� ���� �����
������ ��� �����������
�����
������������
�����������
��������� ������
������
��� ��������������
������ ��� ��� ��������������
������
������
��������� �����
������������
��� ������������
����� ������ �����������
���� �����
���������
������������
����� ������������
���� ���� �����������������
��� ��� ���� �����
0
0.1
0.2
0.3
0.4
0.5
0 2 4 6 8 10 12 14 16
����������������������������������������������������������������������������������������������������������������������������������������������������������������������������������������������������������������������������������������������������������������������������������������������������������������������������������������������������������������������������������������������������������������������������������������������������������������������������������������������������������������������������������������������������������������������������������������������������������������������������������������������������������������������������������������������������������������������������������������������������������������������������������������������������������������������������������������������������������������������������������
������������������������������������������������������������������������������������������������������������������������������������������������������������������������������������������������������������������
����������
������������������������������������������������������������������������������������������������������������������������������������������������������������������������������������������������������������������������������������������������������������������������������������������������������������������������������������������������������������������������������������������������������������������������������������������������������������������������������������������������������������������������������������������������������������������������������������������������������������������������������������������������������������������������������������������������������������������������������������������������������������������������������������������������������������������������������������������������������������������������������������������������������
������������������������test results���������������� predicted by all loads (8)
�������������������� predicted by 7 highest loads����
����������
����������������
�������� predicted by 6 highest loads
predicted by 5 highest loadspredicted by 4 highest loads��predicted by 3 highest loads��predicted by 2 highest loads��predicted by the highest load
Split
leng
th (i
nche
s)
Number of blocks
Split
Len
gth
(inch
)

34
FIGURE 31. STRESS RATIO EFFECT ON SPECTRUM FATIGUE LOADING
4.3 COMPRESSIVE STRENGTH AFTER IMPACT (CSAI).
Figure 5 shows the specimen dimensions. The gage area was 3″ by 3″ and the impact point was at the center of the gage area. The impact energies used were 4, 8, and 15 Joules. Without any impact damage, the compression strength of the 32-ply panel was 71 ksi. This is a 21% reduction from the compression strength found through the short block static test. There was no buckling of the small specimens under compression tests. The reduction in strength of the large specimens is due to buckling. The theoretical buckling failure load is 38,334 lbs for a 32 ply, 3″ by 3″ undamaged composite laminate with compression modulus of elasticity (E) of 6000 ksi [2]
N
Load
leve
l (%
of N
CS)
0 20
-80 -60 -40 -20
0 20
Load
leve
l (%
of N
CS)
-80 -60 -40 -20
R=10
Various R
Compression-Dominated TWIST Spectrum Loading (flight mean load = 30% of NCS)
���������������������������������������������������������������������������������������������
��������������������������������������������������������������������������
������������������������������������������������������������������������������������������������������������
����������������������������
����������
�����������������
������������
����������������������
������������
�����������������
������������
��� ��������������
��������������������
����� �����
������������
��������� ������
�������������
���������������
����������������
������ ��������������������
������������
�����������������
0
0.5
1
1.5
1 10 100 1000 104 105 106
������������������������������������������������������������������������������������������������������������������������������������������������������������������������������������������������������������������������������������������������������������������������������������������������������������������������������������������������������������������������������������������������������������������������������������������������������������������������������������������������������������������������������������������������
��������������������������������������������������������������������������������������������������������������������������������������������������������������������
����������������
������������������������������������������������������������������������������������������������������������������������������������������������������������������������������������������������������������������������������������������������������������������������������������������������������������������������������������������������������������������������������������������������������������������������������������������������������������������������������������������������������������������������������������������������
����������������-50% to -5% of NCS: R=10and Curve fi t (Using for Model)
-50% to -15% of NCS: R=3.33�����-70% to -7% of NCS: R=10and Curve fi t (Using for Model)
-72% to 17% of NCS: R=-4.3
Number of cycles
(a) Sp
lit L
engt
h (in
ches
)
(b)
Number of cycles
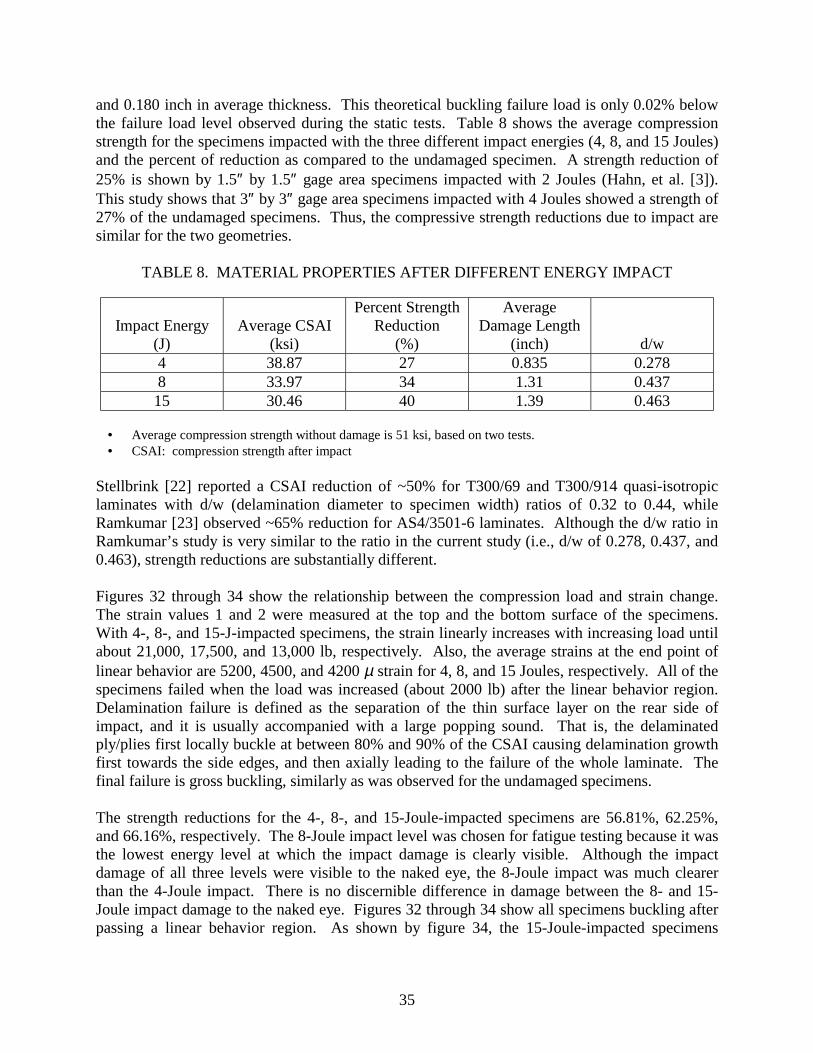
35
and 0.180 inch in average thickness. This theoretical buckling failure load is only 0.02% below the failure load level observed during the static tests. Table 8 shows the average compression strength for the specimens impacted with the three different impact energies (4, 8, and 15 Joules) and the percent of reduction as compared to the undamaged specimen. A strength reduction of 25% is shown by 1.5″ by 1.5″ gage area specimens impacted with 2 Joules (Hahn, et al. [3]). This study shows that 3″ by 3″ gage area specimens impacted with 4 Joules showed a strength of 27% of the undamaged specimens. Thus, the compressive strength reductions due to impact are similar for the two geometries.
TABLE 8. MATERIAL PROPERTIES AFTER DIFFERENT ENERGY IMPACT
Impact Energy
(J)
Average CSAI
(ksi)
Percent Strength Reduction
(%)
Average Damage Length
(inch)
d/w 4 38.87 27 0.835 0.278 8 33.97 34 1.31 0.437 15 30.46 40 1.39 0.463
• Average compression strength without damage is 51 ksi, based on two tests. • CSAI: compression strength after impact
Stellbrink [22] reported a CSAI reduction of ~50% for T300/69 and T300/914 quasi-isotropic laminates with d/w (delamination diameter to specimen width) ratios of 0.32 to 0.44, while Ramkumar [23] observed ~65% reduction for AS4/3501-6 laminates. Although the d/w ratio in Ramkumar’s study is very similar to the ratio in the current study (i.e., d/w of 0.278, 0.437, and 0.463), strength reductions are substantially different. Figures 32 through 34 show the relationship between the compression load and strain change. The strain values 1 and 2 were measured at the top and the bottom surface of the specimens. With 4-, 8-, and 15-J-impacted specimens, the strain linearly increases with increasing load until about 21,000, 17,500, and 13,000 lb, respectively. Also, the average strains at the end point of linear behavior are 5200, 4500, and 4200 µ strain for 4, 8, and 15 Joules, respectively. All of the specimens failed when the load was increased (about 2000 lb) after the linear behavior region. Delamination failure is defined as the separation of the thin surface layer on the rear side of impact, and it is usually accompanied with a large popping sound. That is, the delaminated ply/plies first locally buckle at between 80% and 90% of the CSAI causing delamination growth first towards the side edges, and then axially leading to the failure of the whole laminate. The final failure is gross buckling, similarly as was observed for the undamaged specimens. The strength reductions for the 4-, 8-, and 15-Joule-impacted specimens are 56.81%, 62.25%, and 66.16%, respectively. The 8-Joule impact level was chosen for fatigue testing because it was the lowest energy level at which the impact damage is clearly visible. Although the impact damage of all three levels were visible to the naked eye, the 8-Joule impact was much clearer than the 4-Joule impact. There is no discernible difference in damage between the 8- and 15-Joule impact damage to the naked eye. Figures 32 through 34 show all specimens buckling after passing a linear behavior region. As shown by figure 34, the 15-Joule-impacted specimens

36
buckled at 85% of buckling failure load. This means that under spectrum fatigue loading, the specimens will buckle before finishing a block and thus produce no useable data (beyond the fact that they buckle at 85%).
FIGURE 32. STRAIN VS COMPRESSION LOAD FOR 4-Joules-IMPACTED SPECIMEN
FIGURE 33. STRAIN VS COMPRESSION LOAD FOR 8-Joules-IMPACTED SPECIMEN
��������������������������������������������������������������������������������������������������������������������������������
����������������������������������������������������������������������������������������������������������
��������������
�����������������������������������������������������������������������������������������������������������������
����������������������������������������������������������������������������������������������������������������������
������������������������������������������������������������������������������������������������������������������������������������������������������������������������������������������������
�������������������������������������������������������������������������������������������������
������������������������������������������������������������������
���������������������������������������������������������������������������������
����������������������������������������������������������
�������������������������������������������������
��������������������������������
���������������������������������������������������������������������������������������������������������������������������
�������������������������������������������������������������������������������������������������������������
����������������������������������������������������������������������������������������������������������������������������������������
�������������������������������������������������������������������������������������������������������������������������
�����������������������������������������������������������������������������������������������������������������������������������������������������������������������������������������������������������������������������������������������������������������������������������������������������������������������
����������������������������������������������������
������������������������������
-1 104
-8000
-6000
-4000
-2000
0
2000
0 5000 1 104 1.5 104 2 104 2.5 104
4 Joules Impacted������������������������������������������������������������������������������������������
������������������������������������������������������������������
������
���������������������������������������������������������������������������������������������
��strain1��strain2
Compression Load (lb)
��������������������������������������
���������������������������������������������������������������������������������������������������������������������������������
���������������������������������������������������������������������������������������������������������������������������������������
������������������
�������������������������������������������������������������������������������������������������������
�����������������������������������������������������������������������������������������������������������������������
���������������������������������������������������������������������������������������������������������������������
��������������������������������������������������������������������������������������������������������������������
�����������������������������������������������������������������������������������������������������������������������������������������������
�������������������������������������������������������������
�����������������������������������
����������������������
�������������������������������������������������������������������������������������������������
������������������������������������������������������������������������������������������������������������������������������
��������������������������������������������������������������������������������������������������������
���������������������������������������������������������������������������������������������������������������������
����������������������������������������������������������������������������������������������������������������������������
�������������������������������������������������������������������������������������������������������������������������������������������������������
����������������������������������������������������������������������
�����������������������
�����
-1 104
-8000
-6000
-4000
-2000
0
2000
0 5000 1 104 1.5 104 2 104 2.5 104
8 Joules Impacted������������������������������������������������������������������������������������������������������
����������������������������������
����������������������������������
������
���������������������������������������������������������������������������������������������������������
���� strain1����strain2
Compression Load (lb)

37
FIGURE 34. STRAIN VS COMPRESSION LOAD FOR 15-Joules-IMPACTED SPECIMEN
The parameter used for damage assessment was the length of delamination in the loading direction. There are many different ways to choose the damage parameter. Other research has used damage area, average length in the 0- and 90-degree directions, average diameter of damage, and others as parameters. However, as the damage length measure was used in the previous FAA grant research, it was continued to be used. Table 8 shows the damage length in the loading direction for different impact energies. Figure 35 shows sample x-ray pictures of the damage suffered after impact for the different energy levels. All impacted specimens show circle shape damage whose diameter varies with the energy of impact. The loading direction impact damage caused by the 15-J impact was more than 40% longer than the one by 4-J impact. Additionally, even under the same impact energy, the exact shape of the damage varied; some were more oval while others were more circular.
�����������������������������������������������������������������������������������������������������������������������������������������������������������������
�����������������������������������������������������������������������������������������������������
������������������������������������������������������������������������������������������������������������������������������������������������������
�����������������������������������������������������������������������������������������������������������������������������������������������������������������������������������������������������
���������������������������������������������������������������
��������������������������������������������������������������������������������������������������
��������������������������������������������
��������������������������������������������������������������������������������������������������������������
��������������������������������������������������������������������������������������������������
���������������������������������������������������������������������������������������������������������
��������������������������������������������������������������������������������������������
�����������������������������������������������������������������������������������������������
����������������������������������������������������������������������������������������
����������������������������������������������������������������
�����������������������������������������������
��������������������������������������������������������������������������������������������������������������������������������������������������
-1 104
-8000
-6000
-4000
-2000
0
2000
0 5000 1 104 1.5 104 2 104 2.5 104
15 Joules impacted������������������������������������������������������������������������������������������������������
����������������������������������
����������������������������������
������
���������������������������������������������������������������������������������������������������������
����Strain 1
�������� Strain 2
Compression Load (lb)

38
FIGURE 35. DAMAGE BY THE DIFFERENT IMPACTED ENERGY
4.4 POSTIMPACT FATIGUE BEHAVIOR (8-Joules IMPACT).
A total of 13 impacted specimens were tested in fatigue under various loading conditions as indicated in tables 9 and 10 (one to three specimens were tested under each loading condition). 4.4.1 Constant Amplitude Compression-Compression Loading.
Constant amplitude compression-compression loading was performed on a total of six 32-ply specimens after being impacted with 8 Joules. Load levels and stress ratios are shown in table 9.
TABLE 9. TEST MATRIX FOR CONSTANT AMPLITUDE COMPRESSION-COMPRESSION AFTER 8-Joules IMPACT
Constant Amplitude Compression-Compression (f = 0.01 to 0.1 Hz)
Specimen Number
Load Level (% of CSAI &
stress ratio)
N (number of
cycles)
Damage Characteristics
RCS (ksi)
32S17 85% R= -4.3
3
Splitting, delamination, matrix cracking fiber failure
-
32S15 85% R= -4.3
3
Splitting, delamination, matrix cracking fiber failure
-
32S10 81% R= -5.0
851
Splitting, delamination, matrix cracking fiber failure
-
32s16 81% R=-5.0
2,334
Splitting, delamination, matrix cracking fiber failure
-
32S12 75% R= -7.7
20,000
Splitting, delamination, matrix cracking fiber failure
32.7
32S6 70% R= -14.3
30,000
Splitting, delamination, matrix cracking fiber failure
31.5
4-Joules Impact
8-Joules Impact
15-Joules Impact

39
TABLE 10. TEST MATRIX FOR COMPRESSION-DOMINATED BLOCKED TWIST LOADING
Specimen Number
Flight Mean Load
(% of CSAI)
Maximum Flight Load (% of CSAI)
N Number of Blocks
(Number of Flights)
Damage Characteristics
RCS (ksi)
Modified Spectrum Test (two lowest load levels omitted)
32S7
32.5
85 Failed at first load of
the 1st block Splitting, delamination, matrix cracking fiber failure
-
32S8
32.5
85
Failed at first load of the 8th block (36,400)
Splitting, delamination, matrix cracking fiber failure
-
32S11
32.5
85
Failed at first load of the 5th block (20,800)
Splitting, delamination, matrix cracking fiber failure
-
34D3
30.0
78
Completed 10 block (52,000)
Splitting, delamination, matrix cracking fiber failure
31.3
32S3
30.0
78
Failed at first load of the 3rd block (15,600)
Splitting, delamination, matrix cracking fiber failure
-
32S5
27.5
72
Completed 10 blocks (52,000)
Splitting, delamination, matrix cracking fiber failure
30.5
32S6
27.5
72
Completed 10 blocks (52,000)
Splitting, delamination, matrix cracking fiber failure
29.6
In a departure from previous tests, the constant amplitude tests were modified by matching the stress ratios encountered during spectrum loading. In previous tests, there was an effort made only to match load amplitudes and did not take into consideration the stress ratios. From the data collected, it is seen that after the first cycle of constant amplitude loading, the 0-degree length of the damage area does not change significantly (see figure 36). Overall damage growth is minimal; however, delamination does increase and intensify (see figure 37).
FIGURE 36. DAMAGE GROWTH IN CONSTANT AMPLITUDE COMPRESSION-
COMPRESSION LOADING
��������
��������
������������ ���� ����� ���� ���� �����
��������
��������
����������
��������
��������
����������
��������
������������
��������
��������
��������
����������
����������
��������
��������
��������
��������
��������
��������
��������
��������
��������
����������
����������
0
0.5
1
1.5
2
2.5
3
1 10 100 1000 104
����������������������������������������������������������������������������������������������������������������������������������������������������������������������������������������������������������������������������������������������������������������������������������������������������������������������������������������������������������������������������������������������������������������
��������������������������������������������������������������������������������������������������������������������������������������������
����������������
������������������������������������������������������������������������������������������������������������������������������������������������������������������������������������������������������������������������������������������������������������������������������������������������������������������������������������������������������������������������������������������������������������������������
�����32s17-85% CSAI�����32s15-85% CSAI�����32s10-81% CSAI�����32s16-81% CSAI�����32s12-75% CSAI32s4-70% CSAI
Number of cycles
Dam
age
Leng
th in
the
Load
ing
Dire
ctio
n
(inch
es)

40
FIGURE 37. DAMAGE GROWTH IN DIFFERENT CONSTANT AMPLITUDE AND
STRESS RATIO COMPRESSION-COMPRESSION LOADING
Flight m ean load =32.5% of CSA I & s tre ss ratio = -4.3Smax = -85%, Sm in = 20% of CSA I
32S 1532S 15after impactafter impact
32S 1732S 17after impactafter impact
32S 1532S 15after 1 cycleafter 1 cycle
32S 1532S 15after 2 cyclesafter 2 cycles
32S 1732S 17after 1 cycleafter 1 cycle
32S 1732S 17after 2 cyclesafter 2 cycles
32S 1032S 10after impactafter impact
32S 1632S 16after impactafter impact
32S 532S 5after 1 cycleafter 1 cycle
32S 532S 5after 100 cyclesafter 100 cycles
32S 1632S 16after 1 cycleafter 1 cycle
32S 1632S 16after 2 ,000 cyclesafter 2 ,000 cycles
Flight m ean load =32.5% of CSA I & s tre ss ratio = -5.0Smax = -81%, Sm in = 16% of CSA I

41
FIGURE 37. DAMAGE GROWTH IN DIFFERENT CONSTANT AMPLITUDE AND
STRESS RATIO COMPRESSION-COMPRESSION LOADING (Continued) In a previous barely visible impact damage fatigue study (Hahn, et al. [3]), the extent and mode of delamination growth under C-C fatigue varied significantly, depending on the applied load level. For specimens cycled at 40% and 50% CSAI, the impact-induced damage did not grow under cyclic loading up to a million cycles. Furthermore, residual compression tests of these specimens indicated that the postfatigue compressive strength was not influenced by these low loads. At 60%, CSAI impact damage grew slightly in one specimen up to one million cycles. At higher load levels, 70% and 80% CSAI, more severe damage growth was observed. Researchers (Blaricum, et al. [25] and Ramkumar [23]) suggested that the damage width is the major factor that governs fatigue delamination growth in impacted specimens. While different material systems were investigated in these two studies, laminate stacking sequences were similar with the same outer ply configuration [+45/-45/0/0...]S. In another study (Ramkumar [18]), delamination growth and its direction was shown to be dependent on the laminate stacking sequence and its through-the-thickness location. For laminates with a outer 0° ply, fatigue failure was induced predominantly by the propagation of delamination to the tab region (in the loading direction), similar to the observations in the current study.
32S 1232S 12after impactafter impact
32S 1232S 12after 1 cycleafter 1 cycle
32S 1232S 12after 10,000 cyclesafter 10,000 cycles
Flight m ean load =32.5% of CSA I & s tre ss ratio = -7.7Smax = -75%, Sm in = 10% of CSA I
32S 632S 6after impactafter impact
32S 632S 6after 1 cycleafter 1 cycle
32S 632S 6after 10,000 cyclesafter 10,000 cycles
Flight m ean load =32.5% of CSAI & s tre ss ratio = -14.3Smax = -70%, Sm in = 5% of CSAI

42
4.4.2 Compression-Dominated Blocked TWIST Loading.
A total of seven specimens (3″ by 3″ gage area) were tested under compression-dominated spectrum loading. Two specimens were tested at 27.5%, two at 30%, and three at 32.5% of CSAI under the modified spectrum load as indicated in table 10. The modified spectrum loading has the two lowest load levels omitted from the test sequence. This represents a savings of 412 hours in total testing time for each specimen. However, even using the modified spectrum, it takes 3 or 4 full days to complete one test due to the low-frequency testing cycles. Also, due to machine limitations, there is an initial transient in the load levels applied to the specimen. Final damage patterns, for all specimens, after the last blocks of TWIST with the modified spectrum is presented in figures 38 to 40. All specimens were impacted with 8 Joules with the Instron dynatup 8250 impact test machine with a 0.5-inch tup diameter and a 10.606-lb impactor weight (crosshead and tup). Figure 41 summarizes the 0-degree length of the damage area. The damage size appears to be independent of the spectrum load levels. The only consistent behavior is in the growth of the 0-degree damage area length. They all increase after the first block, but with only one exception, the lengths do not increase significantly with subsequent blocks. However, it should be noted that delamination and cracking damage do intensify even though the areas do not. The x-radiographs clearly show the increase of these types of damage. 4.5 RESIDUAL STRENGTH EVALUATION.
To determine the influence of fatigue cycling on residual strength, the static residual strengths of the specimens surviving the fatigue tests were measured in static strength according to the procedure outlined in tables 2 through 5 and 9 and 10. It should be noted that the specimens were cut into smaller coupons to determine their residual strengths. The smaller size was necessitated to prevent slipping. 4.5.1 Residual Strength of Open-Hole Specimens.
The RCS and RTS of the 27 specimens surviving the compression-dominated spectrum loading are shown in figure 42. Under C-C loading, reduction in residual compressive strength is observed. Strength reduction of more than 10% is measured for coupons cycled at 60% of NCS, which also displayed pronounced widthwise extension of split-induced delamination. For smaller fatigue load levels (50% of NCS), less than a 5% reduction in compressive strength is measured. In T-T loading, residual strength increased by 9.3%. Except under 80% C.A. T-T loading, all RTS values are greater than the average open-hole strength (60 ksi). The RTS and RCS of the 23 specimens surviving the tension-dominated spectrum loading are shown in figure 43. The average RTS (59.1 ksi) after 15 blocks is almost the same as the initial open-hole tension strength (60 ksi). Although the omission of the two lowest load levels from the spectrum fatigue had little effect on split length growth, the residual compressive strength seems quite sensitive. After 10 blocks of full compression-dominated spectrum loading, the RCS reduces by 10% from the static average NCS.

43
FIGURE 38. DAMAGE GROWTH WITH 32.5% FLIGHT MEAN LOAD
Flight mean load =32.5% of CSAISmax =85% of CSAI
32S732S7after impactafter impact
32S1132S11after impactafter impact
32S832S8after impactafter impact
Failed during
the highest load
in the first block
32S1132S11after 1st blockafter 1st block
32S1132S11after 4th blockafter 4th block
32S832S8after 1st blockafter 1st block
32S732S7after 7th blockafter 7th block

44
FIGURE 39. DAMAGE GROWTH WITH 30% FLIGHT MEAN LOAD
FIGURE 40. DAMAGE GROWTH WITH 27.5% FLIGHT MEAN LOAD
34D3 after impact
34D3 after 10 blocks
34D3 after 1 block
32S3 after impact
32S3 after 1 block
32S3 after 10 block
Flight mean load =30% of CSAI Smax =78% of CSAI
Resin
Flight mean load =27.5% of CSAI Smax =72% of CSAI
32S5 after impact
32S6 after impact
32S5 after 1 block
32S5 after 10 blocks
32S6 after 1 block
32S6 after 10 blocks
PVDF
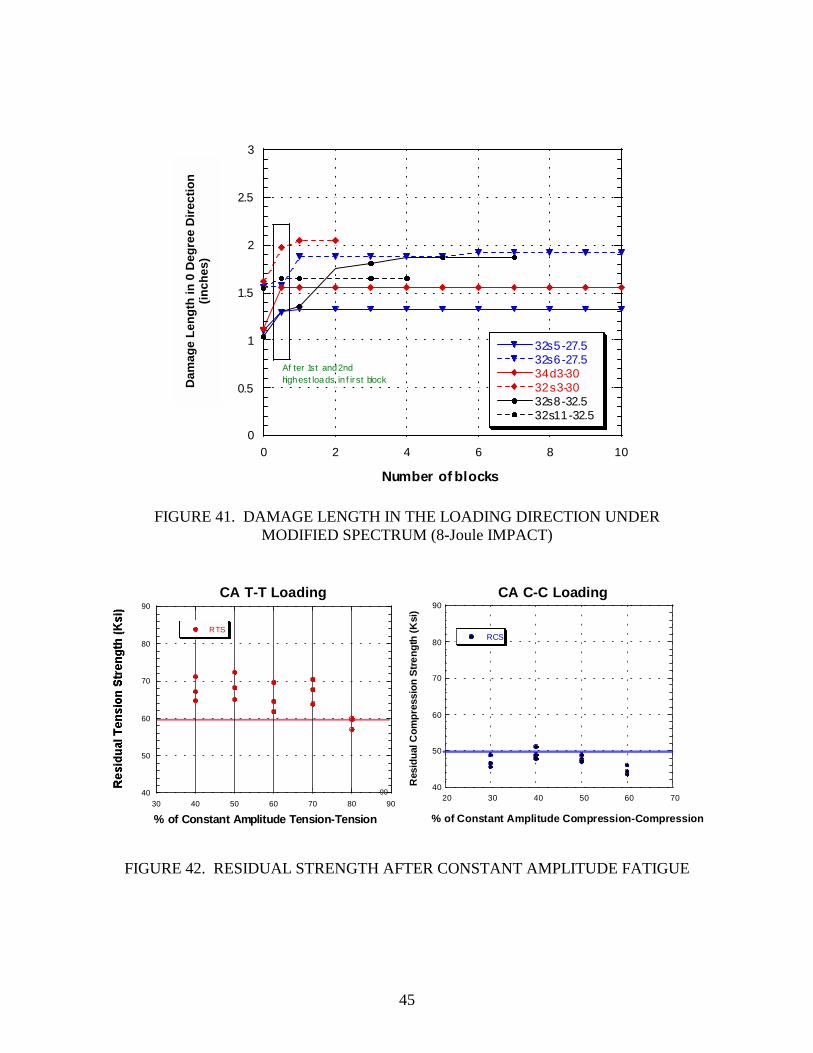
45
FIGURE 41. DAMAGE LENGTH IN THE LOADING DIRECTION UNDER
MODIFIED SPECTRUM (8-Joule IMPACT)
FIGURE 42. RESIDUAL STRENGTH AFTER CONSTANT AMPLITUDE FATIGUE
% of Constant Amplitude Compression-Compression
CA T-T Loading CA C-C Loading
Res
idua
l Com
pres
sion
Stre
ngth
(Ksi
)
90
��������������������
������������ ���������������
����� ���������
40
50
60
70
80
90
20 30 40 50 60 70
������������������������������������������������������������������������������������������������
����
����������������������������������������������
������RCS
����������
����������
��������
���
�����
���������
������������������������ �����
����� ����� ����
40
50
60
70
80
90
30 40 50 60 70 80 90
����������������������������������������������������������������������������������������������
����
���������������������������������������������������������������������
������RTS
% of Constant Amplitude Tension-Tension
����������
���� ��� ����� ��� ����� ��� ����� ��� ����� ��� �����
����������
��������
������
����������
������
����������
������
����� ��� ����� ��� �����
�����
��������
������
����������
������
����������
������
����������
������
����������
������
����������
�����
����������
����������
�����
���
���������
������
����������
���� ��� ��� �����
0
0.5
1
1.5
2
2.5
3
0 2 4 6 8 10
��������������������������������������������������������������������������������������������������������������������������������������������������������������������������������������������������������������������������������������������������������������������������������������������������������������������������������������������������������������������������������������������������������
����������������������������������������������������������������������������������������������������������������������������������
����������������������������������������
����������������������������������������������������������������������������������������������������������������������������������������������������������������������������������������������������������������������������������������������������������������������������������������������������������������������������������������������������������������������������������������������������������������
���32s5-27.5���32s6-27.5���34d3-30���32s3-30���32s8-32.5���32s11-32.5
Number of blocks
Af ter 1st and 2ndhighest loads in f irst blockD
amag
e Le
ngth
in 0
Deg
ree
Dire
ctio
n
(inch
es)

46
FIGURE 43. RESIDUAL STRENGTH AFTER SPECTRUM LOADING
4.5.2 Residual Strength of 8-Joules-Impacted Specimens.
A specimen impacted with 8 Joules (but not yet subjected to spectrum loading) was measured to have a residual compression strength of 34 ksi. The two specimens loaded under 27.5% of flight mean load were measured to have 30 ksi. The single specimen which survived its loading under 30% of flight mean load was measured to have 31 ksi. These represent little change from the static specimens, suggesting that spectrum loading has little affect on the residual compression strength of the specimens. 5. SUMMARY.
The long-term mechanical fatigue of quasi-isotropic graphite/epoxy laminates was investigated to determine the influence of loading parameters on impact-induced delamination growth during constant amplitude and spectrum fatigue loading. Based on the test results, the following observations for fatigue design of composite laminates in the presence of open hole and visible impact damage are made: • The results of this study indicate that the type and extent of damage depends on the type
of loading and load levels, and that the remaining residual compressive strengths are influenced by the type of fatigue damage. Therefore, it is difficult to identify a single damage parameter that could be used to correlate the changes in compressive strength.
• The observed damage growth and residual strength measurements suggest load levels be
limited to less than 50% of NCS for constant amplitude fatigue loading and below 70% of NCS for spectrum fatigue loading.
Res
idua
l Com
pres
sion
Stre
ngth
(Ksi
)
������������
������������
�����
40
50
60
70
80
90
27.5 30 32.5
������������������������������������������������������������������������������������������������������������������������������������������
��������������������������������������������������������������������������������������������������������
������
���������������������������������������������������������������������������������������������������������������������������������������������
���Modified SpectrumFull Spectrum
% of Flight Mean Load
��������
����������
��������
���������������
���� ����� �����
40
50
60
70
80
90
27.5 30 32.5
������������������������������������������������������������������������������������������������������������������������������������
������������������������������������������������������������������������������������������������������������������������������������������
��������
���������������������������������������������������������������������������������������������������������������������������������������
������Modified spectrum
% of Flight Mean Load

47
• In tension-tension (T-T) loading, residual strength increased by 9.3%. Except under 80% constant amplitude (C.A.) T-T loading, all residual tensile strength (RTS) values are greater than the average open-hole strength (60 ksi).
• The most significant finding is that omitting the two lowest levels of the loading
spectrum has no effect on the resulting damage growth. This is clearly indicated by the results. Since the two lowest levels represent 99.7% of the total testing time, their omission represents a significant savings in time without affecting the end results.
• In open-hole compression fatigue, predictions for split lengths under spectrum loading
match well with experimental results. • At 27.5% and 30% notch tension strength (NTS) of flight mean loads, there is a fairly
good match with predicted split lengths. However, the model predicts longer lengths for 32.5% NTS than what was measured.
• With visible damaged specimens under C.A. compression-compression (C-C) fatigue,
after the first cycle of C.A. loading, the length of the damage area in the longitudinal direction does not change significantly. Damage growth is minimal. However, the delamination area does intensify.
• For initially visible damage, the damage size appears to be independent of the spectrum
load levels as far as visible damage is concerned. The only consistent behavior is in the growth of the 0-degree ply damage length. The lengths all increase after the first block, but with only one exception, the lengths do not increase significantly with subsequent blocks.
It is apparent from the data collected in this study that visible damage cannot be used to predict fatigue life; once visible damage appears, the specimens fail very soon after the initial appearance of damage. Notched specimens demonstrate some predictability; however, further research would be needed to construct more accurate models. 6. REFERENCES.
1. Hahn, H. Thomas, et. al., “The Effect of Preloading on Fatigue Damage in Composite Structures: Part I,” DOT/FAA/AR-95/79, April 1996.
2. Hahn, H. Thomas, J.B. Cho, and S.G. Lim, “The Effect of Loading on Fatigue Damage in
Composite Structures: Part II,” DOT/FAA/AR-96/76, July 1997. 3. Hahn, H. Thomas, Milan Mitrovic, and Ozgur Turkgenc, “The Effect of Loading on
Fatigue Damage in Composite Structures: Part III,” DOT/FAA/AR-99/22, June 1999. 4. Hahn, H. Thomas and Ozgur Turkgenc, “The Effect of Loading on Fatigue Damage in
Composite Structures: Part IV Information Systems,” DOT/FAA/AR-00/48, December 2000.
48
5. Jen, M.-H.R., Y.S. Kau, and J.M. Hsu, “Initiation and Propagation of Delamination in a Centrally Notched Composite Laminate,” Journal of Composite Materials, 27 (3), 1993, pp. 272-302.
6. Bakis, Charles E. and W.W. Stinchcomb, “Response of Thick, Notched Laminates
Subject to Tension-Compression Cyclic Loads,” Composite Materials: Fatigue and Fracture, ASTM STP 907, ASTM, Philadelphia, PA, 1986, pp. 314-334.
7. Simonds, R.A., C.E. Bakis, and W.W. Stinchcomb, “Effect of Matrix Toughness on
Fatigue Response of Graphite Fiber Composite Laminates,” Composite Materials: Fatigue and Fracture, Second Volume, ASTM STP 1012, P.A. Lagace, ed., ASTM, 1989, pp. 5-18.
8. Ratwani, M.M. and H. P. Kan, “Effect of Stacking Sequence on Damage Propagation and
Failure Modes in Composite Laminate,” Damage in Composite Materials, ASTM STP 775, K.L. Reifsnider, ed., ASTM, 1982, pp. 211-228.
9. Razvan, A., C.E. Bakis, and K.L. Reifsnider, “Influence of Load Levels on Damage
Growth Mechanisms of Notched Composite Materials,” Composite Materials: Testing and Design (Ninth Volume), ASTM STP 1059, S.P. Garbo, ed., ASTM, 1990, pp. 371-389.
10. Ratwani, M.M., “Fatigue of Composites Under Spectrum Loading,” Proceedings of the
6th International Conference on Fracture (ICF6), New Delhi, India, Vol. 1, 1984, pp. 587-606.
11. Badaliance, R., H.D. Hill, and J.M. Potter, “Effects of Spectrum Variations on Fatigue
Life of Composites,” Composite Materials: Testing and Design (Sixth Conference), ASTM STP 787, I.M. Daniel, ed., ASTM, 1982, pp. 274-286.
12. Phillips, E.P., “Effects of Truncation of a Predominantly Compression Load Spectrum on
the Life of a Notched Graphite/Epoxy Laminate,” Fatigue of Fibrous Composite Materials, ASTM STP 723, K.N. Lauraitis, ed., ASTM, 1981, pp. 197-212.
13. Lammerant, L. and I. Verpoest, “The Interaction Between Matrix Cracks and
Delaminations During Quasi-Static Impact of Composites,” Composite Science and Technology, 51, 1994, pp. 505-516.
14. Choi, H.Y. and F.-K. Chang, “A Model for Predicting Damage in Graphite/Epoxy
Laminated Composites Resulting From Low-Velocity Point Impact,” Journal of Composite Materials, 26(14), 1992, pp. 2134-2169.
15. Baker, A.A., R. Jones, and R.J. Callinan, “Damage Tolerance of Graphite/Epoxy
Composites,” Composite Structures, 4, 1985, pp. 15-44.

49
16. Clark, G. and T.J. van Blaricum, “Load Spectrum Modification Effects on Fatigue of Impact Damaged Carbon Fibre Composite Coupons,” Composites, 18(3), July 1987, pp. 243-251.
17. Clark, G. and D.S. Saunders, “Morphology of Impact Damage Growth by Fatigue in
Carbon Fibre Composite Laminates,” Materials Forum, 15(1), 1991, pp. 333-342. 18. Konishi, D.Y. and W.R. Johnston, “Fatigue Effects on Delaminations and Strength
Degradation in Graphite/Epoxy Laminates,” Composite Materials: Testing and Design (Fifth Conference), ASTM STP 674, S.W. Tsai, ed., ASTM, 1979, pp. 597-619.
19. Ong, C.L., M.F. Sheu, Y.Y. Liou, and T.J. Hsiao, “The Study of the Fatigue
Characteristics of Composite After Impact,” 36th International SAMPE Symposium, Vol. 1, April 1991, pp. 912-923.
20. Portanova, M.A., C.C. Poe, and J.D. Whitcomb, “Open-Hole and Postimpact
Compressive Fatigue of Stitched and Unstitched Carbon-Epoxy Composites,” Composite Materials: Testing and Design (Tenth Volume), ASTM STP 1120, G.C. Grimes, ed., ASTM, 1992, pp. 37-53.
21. Saunders, D.S. and T.J. van Blaricum, “Effect of Load Duration on the Fatigue Behavior
of Graphite/Epoxy Laminates Containing Delaminations,” Composites, 19(3), May 1988, pp. 217-228.
22. Stellbrink, K.K.U., “Influence of Low-Velocity Impact on the Fatigue Behavior of CFRP
Laminates,” Fatigue and Creep of Composite Materials, Third International Symposium on Metallurgy and Material Science, 1982, pp. 319-327.
23. Ramkumar, R.L., “Effect of Low-Velocity Impact Damage on the Fatigue Behavior of
Graphite/Epoxy Laminates,” Long-Term Behavior of Composites, ASTM STP 813, T.K. O’Brien, ed., American Society for Testing and Materials, Philadelphia, PA, 1983, pp. 116-135.
24. Ramkumar, R.L., “Compression Fatigue Behavior of Composites in the Presence of
Delaminations,” Damage in Composite Materials, ASTM STP 775, K.L. Reifsnider, ed., American Society for Testing and Materials, 1982, pp. 184-210.
25. Van Blaricum, T.J., D.S. Saunders, G. Clark, and T.E. Preuss, “Damage Tolerance of
Impact Damaged Carbon Fibre Composite Wing Skin Laminates,” New Materials and Fatigue Resistant Aircraft Design, 14th Symposium of the International Committee on Aeronautical Fatigue, edited by D.L. Simpson, 1987, pp. 537-556.
26. Cairns, D.S. and P.A. Lagace, “Residual Tensile Strength of Graphite/Epoxy and
Kevlar/Epoxy Laminates with Impact Damage,” Composite Materials: Testing and Design (Ninth Volume), ASTM STP 1059, S.P. Garbo, ed., ASTM, Philadelphia, PA, 1990, pp. 48-63.
50
27. Demuts, E., R.S. Whitehead, and R.B. Deo, “Assessment of Damage Tolerance in Composites,” Composite Structures, Vol. 4, 1985, pp. 45-58.
28. O’Brien, T.K., “Towards a Damage Tolerance Philosophy for Composite Materials and
Structures,” Composite Materials: Testing and Design (Ninth Volume), ASTM STP 1059, S.P. Garbo, ed., ASTM, Philadelphia, PA, 1990, pp. 7-33.
29. Chu, G.D. and C. T. Sun, “Failure Initiation and Ultimate Strength of Composite
Laminates Containing a Center Hole,” Composite Materials: Fatigue and Fracture, Fourth Volume, ASTM STP 1156, ASTM, Philadelphia, PA, 1993, pp. 35-54.
30. Bäcklund, J. and C.-G. Aronsson, “Tensile Fracture of Laminates with Holes,” Journal of
Composite Materials, 20, 1986, pp. 259-286. 31. Soutis, C. and N. A. Fleck, “Static Compression Failure of Carbon Fibre T800/924C
Composite Plate With a Single Hole,” Journal of Composite Materials, 24, 1990, pp. 536-558.
32. Sohi, M.M., H. T. Hahn, and J. G. Williams, “The Effect of Resin Toughness and
Modulus on Compressive Failure Modes of Quasi-Isotropic Graphite/Epoxy Laminates,” Toughened Composites, ASTM STP 937, Norman J. Johnston, ed., ASTM, 1987.
33. Spearing, S.M., P.W.R. Beaumont, and M.F. Ashby, “Fatigue Damage Mechanics of
Notched Graphite-Epoxy Laminates,” Composite Materials: Fatigue and Fracture (Third Volume), ASTM STP 1110, T.K. O’Brien, ed., ASTM, Philadelphia, PA, 1991, pp. 617-637.
34. Yang, J.N. and D. L. Jones, “Load Sequence Effects on Graphite/Epoxy [±35]2S
Laminates,” Long-Term Behavior of Composites, ASTM STP 813, T.K. O’Brien, ed., American Society for Testing and Materials, Philadelphia, PA, 1983, pp. 246-262.
35. Hwang, W. and K.S. Han, “Cumulative Damage Models and Multi-Stress Fatigue Life
Prediction,” Journal of Composite Materials, 20, 1986, pp. 125-153.