Embed Size (px)
Citation preview

The Effect of Loading Conditions
on a Kennedy Class I Implant-Assisted
Removable Partial Denture
By
Reza Shahmiri
A thesis submitted for the degree of
Master of Dental Technology
University of Otago
Date: Tuesday, 1 Nov 2011

ii
iv
ABSTRACT
Objective: To evaluate the strain behaviour of the Kennedy Class I implant-
assisted removable partial denture (IARPD) distal extension area under various
loading conditions to better understand the strain pattern.
Method: A mandibular Kennedy Class I was selected with natural teeth from the
34 to 44. A duplicated model was made out of polyurethane and a conventional
removable partial denture was fabricated with a cobalt chromium metal
framework and acrylic base. Strain gauges were placed on the fitting side of the
acrylic and metal framework to measure the strain in the partial denture structure.
Two Straumann® implants were then placed in the second molar regions and the
removable partial denture was modified to accommodate ball attachments. The
model was loaded to 120N unilaterally and bilaterally, with three different loading
areas; premolar, molar and uniform.
Results: In all loading conditions the maximum micro-strains were in a bucco-
lingual direction. In all loading conditions tension micro-strains were most
common, except on the metal surface in the unilateral loading condition, which
showed mainly compression micro-strains.
Conclusions: This research highlights that lateral movement/displacement was
evident during bilateral and unilateral loading of the IARPD. Molar bilateral
loading showed favourable strain behaviour during bilateral loading conditions
whereas uniform unilateral loading showed less destructive strain behaviour
during the unilateral loading conditions.

v
ACKNOWLEDGMENTS
I would like to thank my primary supervisor, John Aarts, for his continuous
support throughout my research. His help, guidance and invaluable assistance in
writing never stopped despite his busy schedule. I would like to thank Dr. Vincent
Bennani for his vital advice in terms of the clinical aspect of my research. I would
like to extend the deepest debt of gratitude to Professor Michael Swain for his
unlimited support and utmost motivation and encouragement during my entire
research.
I would like to express my greatest appreciation to my family and friends for their
unbelievable encouragement. My sincere gratitude goes to my parents and brother
and sisters for their magnificent support throughout my Master study and
research.
I would like to thank John Aarts for providing the funding for my research from
his personal research fund. I would like to thank Peter Fleury for the strain gauge
set up, the Department of Oral Rehabilitation for a travel grant to the IADR
conference, Professor Jules Kieser for the testing equipment and Neil Waddell for
his assistance.
Last, but not least, I would like to thank Ms. Gretchen Kivell, Head of Abbey
College, Mr. John Seaton, Deputy Head of Abbey College, and Mrs. Suzanne
Schofield receptionist of Abbey College and all Abbey College residents for
providing the best environment, putting up with me and taking care of me.

vi
TABLE OF CONTENTS
ABSTRACT ...................................................................................................... iv
ACKNOWLEDGMENTS............................................................................................... v
LIST OF FIGURES .......................................................................................................ix
LIST OF TABLES .................................................................................................... xiii
Chapter One ........................................................................................................ 1
Introduction ........................................................................................................ 1
Chapter Two ........................................................................................................ 9
Literature review ........................................................................................................ 9
Non-clinical studies ................................................................................................. 13
Chapter Three ...................................................................................................... 17
Method and Materials .................................................................................................. 17
Method ...................................................................................................................... 17
Model fabrication ................................................................................................. 17
Strain gauges ......................................................................................................... 19
Strain measurement ............................................................................................. 23
Implant placement into model ............................................................................ 24
Loading of the prosthesis..................................................................................... 26
Converting the data to micro-strain values........................................................ 28
Materials ................................................................................................................... 32
Implants ................................................................................................................ 32
Model..................................................................................................................... 32
Alloy ...................................................................................................................... 33
Attachments .......................................................................................................... 34
Strain gauges ......................................................................................................... 34

vii
Silicone .................................................................................................................. 35
Acrylic ................................................................................................................... 35
Die stone ................................................................................................................ 35
Refractory material ............................................................................................... 36
Chapter Four ...................................................................................................... 37
Results ...................................................................................................... 37
Bilateral loading conditions..................................................................................... 38
Micro-strain measurements at the acrylic base...................................................... 38
Bilateral uniform loading..................................................................................... 38
Bilateral premolar loading ................................................................................... 39
Bilateral molar loading ........................................................................................ 40
Micro-strain measurements at the metal framework ............................................ 41
Bilateral uniform loading..................................................................................... 41
Bilateral premolar loading ................................................................................... 42
Bilateral molar loading ........................................................................................ 43
Unilateral loading conditions .................................................................................. 44
Micro-strain measurements at the acrylic base...................................................... 44
Unilateral uniform loading .................................................................................. 44
Unilateral premolar loading ................................................................................ 45
Unilateral molar loading ...................................................................................... 46
Micro-strain measurements at the metal framework ............................................ 47
Unilateral uniform loading .................................................................................. 47
Unilateral premolar loading ................................................................................ 48
Unilateral molar loading ...................................................................................... 49
viii
The differences in micro-strain values under different loading conditions ........ 50
Micro-strain behaviour of acrylic base
(bilateral loading conditions) .............................................................................. 51
Micro-strain behaviour of metal framework
(bilateral loading conditions) .............................................................................. 54
Micro-strain behaviour of acrylic base
(unilateral loading conditions) ............................................................................ 56
Micro-strain behaviour of metal framework
(unilateral loading conditions) ............................................................................ 59
Micro-strain behaviour of metal framework and acrylic base
(bilateral loading conditions) .............................................................................. 62
Micro-strain behaviour of metal framework and acrylic base
(unilateral loading conditions) ............................................................................ 63
Chapter Five ...................................................................................................... 64
Discussion ...................................................................................................... 64
Bilateral loading of metal and acrylic ..................................................................... 66
Unilateral loading of the metal and acrylic ............................................................ 79
Chapter Six ...................................................................................................... 86
Summary ...................................................................................................... 86
Conclusions ...................................................................................................... 88
Recommendations ...................................................................................................... 89
References ...................................................................................................... 90
Appendix 1 ...................................................................................................... 99
Appendix 2 .................................................................................................... 109
Appendix 3 .................................................................................................... 110
Appendix 4 .................................................................................................... 116 Appendix 5 .................................................................................................... 117
Appendix 6 .................................................................................................... 149
ix
LIST OF FIGURES
Figure 1: (a) Fabricated model of polyurethane resin (Easycast®)
(b) Soft tissue simulated with silicone (Deguform®)............................ 17
Figure 2: Fabricated metal framework .................................................................. 18
Figure 3: Numbered strain gauges and their placement ..................................... 19
Figure 4: Placement positions of the strain gauges in: (a) Radial orientation;
(b) Mesio-distal direction; (c) Mesio-distal bucco-lingual ................... 20
Figure 5: Strain gauges attached to the terminals and channel layout .............. 22
Figure 6: Placement of strain gauges on the acrylic surface. .............................. 23
Figure 7: Prepared holes in the model for implant placement ........................... 24
Figure 8: Completed RPD with retentive caps and strain gauges in place ....... 25
Figure 9: Colour coded wires attached to channels ............................................ 25
Figure 10: Bilateral loading; (a) Uniform (b) Premolar (c) Molar ......................... 26
Figure 11: Unilateral loading; (a) Uniform (b) Premolar (c) Molar ...................... 26
Figure 12: Bilateral loading of premolar region in
Instron universal testing machine ......................................................... 27
Figure 13: Wheatstone bridge arrangement. (R=resistors, V=voltage) ................ 30
Figure 14: Strain gauge placement .......................................................................... 37
Figure 15: Maximum mean micro-strain measured on the acrylic base
(bilateral uniform loading) ..................................................................... 38
Figure 16: Maximum mean micro-strain measured on the acrylic base
(bilateral premolar loading) .................................................................... 39
Figure 17: Maximum mean micro-strain measured on the acrylic base
(bilateral molar loading) ......................................................................... 40
Figure 18: Maximum mean micro-strain measured on the metal framework
(bilateral uniform loading) ..................................................................... 41
Figure 19: Maximum mean micro-strain measured on the metal framework
(bilateral premolar loading) .................................................................... 42

x
Figure 20: Maximum mean micro-strain measured on metal framework
(bilateral molar loading) ......................................................................... 43
Figure 21: Maximum mean micro-strain measured on the acrylic base
(unilateral uniform loading) ................................................................... 44
Figure 22: Maximum mean micro-strain measured on the acrylic base
(unilateral premolar loading) ................................................................. 45
Figure 23: Maximum mean micro-strain measured on the acrylic base
(unilateral molar loading) ....................................................................... 46
Figure 24: Maximum mean micro-strain measured on the metal framework
(unilateral uniform loading) ................................................................... 47
Figure 25: Maximum micro-strain measured on the metal framework
(unilateral premolar loading) ................................................................. 48
Figure 26: Maximum micro-strain measured on the metal framework
(unilateral molar loading) ....................................................................... 49
Figure 27: Micro-strain values for acrylic base
(bilateral loading conditions) ................................................................. 51
Figure 28: An inverse correlation between maximum micro-strain in
bucco-lingual direction in mesial area of the distal extension versus
around the implant as the loading point moves forward. ................... 53
Figure 29: Maximum mean micro-strain values of metal surface for all
three bilateral loading conditions .......................................................... 54
Figure 30: Maximum mean micro-strain values (gauge 6) of metal surface
for all three bilateral loading conditions ............................................... 55
Figure 31: Micro-strain values for acrylic base
(unilateral loading conditions) ............................................................... 56
Figure 32: Direct correlation between movement of the loading point
forward and location of maximum micro-strain .................................. 58
Figure 33: Micro-strain values for metal framework
(unilateral loading conditions) ............................................................... 59

xi
Figure 34: Direct correlation for the value and location of the maximum
micro-strain upon moving the loading point forward ......................... 61
Figure 35: Comparison of micro-strain values in both metal framework
and acrylic base (bilateral loading conditions) ..................................... 62
Figure 36: Comparison of micro-strain values in both metal framework
and acrylic base (unilateral loading conditions) ................................... 63
Figure 37: Cross-section illustration of the areas around the implants in
coronal plane, showing the locations of the micro-strain gauges
on the acrylic and metal structures ........................................................ 66
Figure 38: Highest micro-strain value acrylic base recorded on labial
side of left implant during bilateral uniform loading .......................... 67
Figure 39: Micro-strain-time plot of gauge 1 on buccal side of
right implant during bilateral uniform loading .................................... 68
Figure 40: Micro-strain-time plot of gauge 10 on buccal side of
left implant during bilateral uniform loading ....................................... 68
Figure 41: Micro-strain-time plot illustrating pre-loading, loading and
unloading micro-strain behaviour during a
bilateral uniform loading cycle............................................................... 69
Figure 42: Micro-strain value on acrylic base around the implant in
mesio-distal direction (bilateral uniform loading) ............................... 70
Figure 43: Implant acting as the primary load support point during
bilateral uniform loading ........................................................................ 71
Figure 44: A simplified schematic image of IARPD subjected to
bilateral uniform loading ........................................................................ 72
Figure 45: Simplified schematic illustrating the molar (broken) and premolar
(solid) loading conditions showing the loading forces are now
medially placed relative to the rigid implant support locations ......... 73
Figure 46: Schematic illustration indicating that premolar loading
generates greater off-axis lever arm distance from the
line between supporting structures ....................................................... 74

xii
Figure 47: Cross-sectional image of area around the mesial area of the
distal extension in coronal plane with bilateral premolar loading...... 75
Figure 48: Moving the loading point forward will increase the ratio of
the effort arm to resistance arm .............................................................. 76
Figure 49: Highest micro-strain values were recorded in the mesial area of the
distal extension on the acrylic base under
bilateral premolar loading ..................................................................... 77
Figure 50: Highest micro-strain values were recorded in the mesial area of the
distal extension on the metal framework for all three bilateral
loading condititions ................................................................................ 77
Figure 51: Bilateral molar loading; (a) Micro-strain values around the
implants and mesial areas of the distal extensions on acrylic base
(b) Micro-strain values around the mesial areas of the
distal extension on the metal framework .............................................. 78
Figure 52: A simplified schematic image of IARPD subjected to
unilateral uniform loading ...................................................................... 80
Figure 53: Highest micro-strain value in acrylic base;
(a) Unilateral uniform loading
(b) Unilateral molar loading
(c) Unilateral premolar loading .............................................................. 81
Figure 54: Simplified schematic illustrating the molar and
premolar loading condition showing the loading forces are
now medially positioned relative to the rigid implant support. ......... 82
Figure 55: Highest micro-strain value area on metal framework;
(a) Unilateral uniform loading
(b) Unilateral molar loading
(c) Unilateral premolar loading .............................................................. 82
Figure 56: Effect of unilateral loading conditions on metal framework ............... 83
Figure 57: Micro-strain values of unilateral molar loadings on;
(a) acrylic and (b) metal framework ........................................................ 84

xiii
LIST OF TABLES
Table 1: Chemical and mechanical properties of Straumann dental
implant………………………………………………………………………32
Table 2: Physical and handling properties of Easycast®…………………………33
Table 3: Composition, mechanical and physical properties of Wironit®………33
Table 4: Vishay strain gauge properties (Vishay technical manual)…………….34
Table 5: VertexTM Castapress technical specification
(VertexTM Dental webpage)………………………………………….……35
Table 6: Statistical comparison of maximum micro-strain values of
three loading conditions………………………………………………...….52
Table 7: Statistical analysis of gauge 6 maximum mean micro-strain values
for all three bilateral loading condition……………………………..…….55
Table 8: Statistical analysis of maximum mean micro-strain of all
three loading conditions………………………………………………...….57
Table 9: Significant differences in mean maximum micro-strain exhibited
between all three loading conditions…………………………………..…60

1
Chapter One
Introduction
The percentage of fully edentulous adults in the population has been reported to
be decreasing, so more people will have more teeth when they get older (Douglass
and Watson, 2002). As a result, demands for replacement of missing teeth, to serve
functional and social roles are increasing. The options to restore the partially
edentulous patients are fixed partial dentures, removable partial dentures and
implant-retained fixed prostheses. However, anatomical changes due to the loss of
teeth and supporting structures can present challenges and limitations to the fixed
prosthetic options. Loss of ridge volume is a major consequence of losing teeth. In
general, bone loss is greater in the mandible than the maxilla, and is more severe
in the posterior region. The mandibular arch broadens as it resorbs, while the
maxillary arch narrows. These anatomical changes can create many challenges for
implant-supported prostheses and removable partial dentures (RPD)(Carr et al.,
2011).
In a patient with no molar teeth, only RPD and implant-retained fixed prostheses
options are available as treatment modalities, since there is a lack of distal tooth
support (Carr et al., 2011). The ideal treatment for these patients, if possible, is an
implant-retained fixed prosthesis. When such treatment options are not possible
or are too expensive for the patient, a RPD is considered to be a cost effective
option to treat partially edentulous patients (Bergman et al., 1982; Douglass and
Watson, 2002). A well constructed RPD can be an adequate treatment option

2
(Kapur, 1991; Rissin et al., 1985). A distal extension RPD needs to be accurately
designed to provide dual support. Support should be provided by the framework
via teeth contact and by the distal extension base. Distal extension tissue provides
vertical and lateral support for the distal extension base of the RPD. However,
distal extension tissue support changes with time and can compromise support for
the prosthesis during function. In addition, distal extension tissue has a different
resiliency to abutment teeth. The differences in the characteristics of RPD
supporting structures (teeth and soft tissue) will cause rotation in relation to three
cranial planes (Carr et al., 2011).
Placing two implant abutments distally in the mandible has been recommended to
transform a bilateral distal extension (Kennedy Class I) RPD to a tooth and
implant-supported/assisted RPD (a pseudo Kennedy Class III) (Orr et al., 1992).
The pseudo Kennedy Class III design will improve the support, stability and
retention of a distal extension RPD (Mijiritsky, 2007; Tolstunov, 2007). This could
be seen as a cost effective alternative compared with implant-retained fixed
prosthetic options.
An implant in conjunction with an RPD was used in the treatment of the bilateral
distal extension for the first time in the early 1970s (Fields and Campfield, 1974)
and since then several clinical trials have shown good survival rates (Chikunov et
al., 2008; Grossmann et al., 2009; Mijiritsky et al., 2005). However, fracturing of the
acrylic base was reported when resilient attachments were used in this design
(Payne et al., 2006).

3
The type of resilient attachment usually used in implant-assisted removable
partial dentures (IARPD) is an extra-coronal resilient attachment (ERA), o-ring
system, or a similar attachment system. Locator® abutments have also been
recommended because they can be easily repaired or replaced and have good
resiliency and retention. They also have a straight profile and are available in
different heights, making them ideal for areas with limited space. The term IARPD
is used when resilient attachments are placed. Implants, incorporated into RPDs
provide support through the use of healing caps, hence the term implant-supported
RPD (ISRPD) (Shahmiri and Atieh, 2010).
The mandibular bilateral distal extension situation will be discussed to better
understand the limitations of conventional RPDs and how converting a RPD into
an IARPD/ISRPD improves its outcomes. Despite the RPD being a reasonable
option for the patient without molars, it has limited success and it is not easy to
achieve patient satisfaction (Jepson et al., 1995). A survey by Wetherell and Smales
(1980) showed that one RPD (bilateral distal extension) out of 150 survived over a
10-year period. The term “failure” was defined as partial dentures which had been
replaced or which could not be worn at all. The failures identified were; (1)
discarded by the patient, (2) need replacement regularly, (3) did not improve
eating, (4) had poor retention, and (5) had poor stability.
The distal extension area of the mandibular offers little support in comparison
with the distal extension area of the maxilla (Carr et al., 2011). In addition, the
mandibular bilateral distal extension RPD is supported by two different
structures, the edentulous ridges and abutment teeth. These two different

4
structures have different resiliency and viscoelastic responses to loading. The soft
tissue under loading has a displacement range of 350-500µm, whereas a sound
tooth (not periodontally compromised) has a displacement of 20µm under the
same load (Manderson et al., 1979). This mismatch of support will result in the
transmission of torque forces to the abutment teeth via a rotational movement of
the RPD (Monteith, 1984). In 1984 Watt and MacGregor linked tooth mobility to
the torque forces that are developed against the abutment teeth. In addition, the
rotational movement of the RPD is directed towards the underlying soft tissue,
and as a result the torque force in the soft tissue is then transmitted as a shearing
force, which progressively causes resorption of residual ridges (Witter et al., 1994).
It has been suggested that a specific clasp design for a mandibular bilateral distal
extension RPD must be incorporated to provide stress relief for the abutment
teeth. As a consequence various retentive units were designed that incorporate a
stress relief component. The RPI (R = mesial rest, P = proximal plate, I = I-bar
retentive arm), RPA (rest, proximal plate, Akers clasp), RPL clasp (mesial rest,
proximal plate, L-bar) and Equipoise back action clasp systems were designed to
compensate for the torque induced by the mismatch in different types of support
available to the RPD (Eliason, 1983; Goodman, 1963; Krol, 1973).
On the contrary, Igarashi et al., (1999) argued that flexible retainers can cause more
damage to the abutment than a more rigid design. They evaluated the mobility of
abutments when loading the distal extension of the RPDs. They assessed three
different types of retainers; wrought wire clasps, Akers cast clasps and conical
telescopic crowns. Maximum tooth mobility was observed with the wrought wire
5
clasps, which represented the least rigid retainer design in this study. However,
Mizuuchi et al., (2002) revealed that a distal rest produced greater distal torque on
the abutment tooth regardless of clasp design. They identified that the shorter the
distance from the occlusal rest to the loading point, the smaller the resistance arm
will be and as a result the magnitude of the distal torque on the abutment will
decrease.
Another issue related to the support provided by soft tissue is a lack of resiliency
throughout the mandibular distal extension. The tissue in the region of the
retromolar pad is much more resilient than the tissue immediately adjacent to the
last abutment tooth. The areas that are least resilient will bear most of the load.
This can cause tissue creep in the limited contact area under the load and
consequently damage to the underlying alveolar bone (Vahidi, 1978). Shortening
the dental arch in the distal extension to the first molar could be a possible
solution. A concern is that the potential loss of function may cause a temporo-
mandibular joint problem. Witter et al., (1994) compared shortened distal
extension RPDs with lengthened distal extension RPDs. These authors established
there was no significant difference in the oral functionality of either group.
A link between bone resorption and RPDs has been shown in a number of studies.
There was a considerable difference in residual bone resorption between patients
who had an RPD and those that did not wear one (Campbell, 1960; Imai et al.,
2002; Jozefowicz, 1970; Mijiritsky et al., 2007). Mori et al., (1997) and Ohara et al.,
(2001) evaluated the effect of continuous pressure on RPD’s support tissue. They
6
found that exceeding a threshold value range of 1.5KPa to 4.9KPa caused
irreversible bone resorption, even after the discontinuation of the pressure.
One of the recurrent problems associated with a mandibular bilateral distal
extension RPD stems from the loading of the edentulous ridge (Brudvik, 1999).
Vertical compressive forces applied to a mandibular ridge are well tolerated
(Kelly, 2003; Zarb, 1978). In the bilateral distal extension RPD, the situation of the
occlusal rests on the distal abutments affects transmission of the load to the
underlying tissue. The distal extension of the RPD can move freely which
transmits the full masticatory load via a rotational movement, which in turn is
transmitted to the distal end of the edentulous ridges as a shear force (Hindels,
2001; Monteith, 1984; Watt and MacGregor, 1984; Zarb, 1978). The shear force is
not well tolerated by the edentulous ridges and can contribute to bone loss (Kelly,
2003; Renner, 1990). Different methods such as functional impression, one-stage
impression, relining methods, mucostatic techniques and stress breakers have
been suggested as solutions to minimize the effects of different resiliency of the
two supporting structures (Hindels, 2001). Understanding how different designs
transmit an occlusal load to the underlying structures may help limit the
detrimental effects on the supporting tissues.
Another problem related to the mandibular bilateral distal extension RPD is
combination syndrome or Kelly syndrome. This occurs when the RPD opposes a
maxillary complete denture. It causes the downward growth of maxillary
tuberosities, papillary hyperplasia (severe oedema and eventual inflammatory
fibrosis of the connective tissue papillae between the rete processes of the palatal
7
epithelium), resorption of the pre-maxilla, over-eruption of the mandibular
anterior teeth, and resorption of the posterior mandibular ridge (Kelly, 2003).
However, there has been a lack of supporting evidence since the publication by
Kelly on this phenomenon 25 years ago (Carlsson, 1998). Palmqvist et al., (2003)
also concluded that there is a lack of epidemiological studies and publications to
be able to classify this combination syndrome as a medical syndrome. Salvador et
al., (2007) assessed the prevalence of combination syndrome and concluded an
overall prevalence of 25%. In the same year, Tolstunov (2007) proposed a
classification for combination syndrome and identified complications in each
classification. It was concluded that using implant rehabilitation was the most
promising treatment for these conditions.
Using roots to support a removable partial over-denture (RPOD) with bilateral
distal extensions is promising. Compressive forces from the denture are
transferred to tensile forces in the bone when passed through the roots and
periodontal ligaments (PDL), rather than the mucoperiosteum and residual ridge.
Therefore, hard and soft tissues under the distal extension area experience less
stress (Renner, 1990). In addition, the PDL proprioceptors generate a signal against
physiological overloading and prevent bone resorption (Crum and Rooney, 1978).
However, RPODs require additional time and cost more, as well as requiring more
sophisticated clinical and laboratory procedures (Renner and Boucher, 1987).
Patient oral hygiene must also be kept to a high standard, otherwise the patient is
susceptible to dental caries and periodontal disease which affect the overall
prognosis of the RPOD (Ettinger et al., 1984; Ettinger, 1988).
8
The mandibular bilateral distal extension RPDs have a number of complications.
Stability of such a prosthesis predominantly depends on the shape and anatomy of
the soft tissue on the distal extension area (Vahidi, 1978). The optimal type of
retentive clasp design to achieve adequate retention and desirable aesthetics is still
arguable (Igarashi et al., 1999; Mizuuchi et al., 2002). A link between bone
resorption and RPDs due to the effect of continuous pressure on the support tissue
was another identified complication of distal extension RPDs (Campbell, 1960;
Imai et al., 2002; Jozefowicz, 1970; Mijiritsky et al., 2007).
All of the above issues associated with mandibular bilateral distal extension RPDs
may be improved by implants. Placing two implant abutments distally in the
mandible has been recommended to transform a bilateral distal extension RPD to
a tooth-implant-supported/assisted RPD to help redistribute the heavy
masticatory load posteriorly and improve the conventional RPD design
(Mijiritsky, 2007; Orr et al., 1992; Tolstunov, 2007).

9
Chapter Two
Literature review
Oral implants placed in posterior sites modify the Kennedy Classification of
partially edentulous arches by converting a Class I (tooth- and tissue-supported)
to a pseudo Class III (tooth- and implant-supported). ISRPD and IARPD seem to
overcome the numerous problems associated with RPDs in addition to achieving a
higher level of patient satisfaction. An improvement in function and stability has
been demonstrated (Mijiritsky, 2007; Tolstunov, 2007). In addition, attachments
can be added chair-side to an existing RPD after implants have been placed,
reducing cost and simplifying the treatment (Shahmiri and Atieh, 2010). However,
there is still no evidence that validates the use of such a treatment modality in
managing bilateral distal partial edentulism, or supports the use of implants with
healing abutments or resilient attachments as a means of providing extra support
and retention to the RPD.
Placement of implants to stabilize and support the prosthesis can increase
maximum muscular effort and occlusal forces (Bakke et al., 2002; Ohkubo et al.,
2008; van Kampen et al., 2002). The bite force generated by an edentulous person is
approximately 11% of that of a dentate individual and a person with a RPD will
generate a bite force equivalent to 35% of a dentate individual. This has been
established to be in the range of 54N for the complete denture wearer and 173N
for the RPD wearer (Miyaura et al., 2000).

10
General bilateral balanced occlusion seems to be the most effective occlusal
scheme for distal extension IARPDs; this is because it evenly distributes forces
across the prosthesis. However, chewing patterns are unique to each individual
and mastication usually takes place either on the right or left side, regardless
(Pond et al., 1986). There currently are no studies available that have investigated
the influence of loading conditions on the RPD comparing bilateral with unilateral
loading.
Fields and Campfield (1974) were the first to report the use of an implant in
conjunction with a mandibular bilateral distal extension RPD. Although a 7-month
follow-up study showed promising results, a longer follow-up study on
ISRPD/IARPD was needed to determine the prognosis of this treatment modality.
Several review papers have been published on the use of the ISRPD/IARPD with
various recorded follow-up periods (Chikunov et al., 2008; Grossmann et al., 2009;
Mijiritsky et al., 2005; Payne et al., 2006). Currently the longest follow-up study is
published by Grossmann et al., (2009). They carried out a retrospective study of 35
patients treated with either unilateral or bilateral distal extension ISRPDs/IARPDs
with a survival rate of 97.1%.
The treatment paradigm of IARPD/ISRPD has been evaluated in terms of: bone
loss, combination syndrome, aesthetics, position of implant, maintenance, soft
tissue condition, chewing ability and patient satisfaction. An early study by Fields
and Campfield (1974) reported no bone loss was detected around the implants of
ISRPD cases during a 7-month follow-up period. However, Payne et al., (2006)
reported marginal bone loss with ISRPD/IARPD during a 12-month follow-up
11
period. A long term clinical study is required to evaluate bone condition around
IARPD/ISRPD.
When posterior tooth support is lost or reduced, pathological changes of occlusion
can happen in the form of loss of arch integrity, collapse of the occlusion or
combination syndrome (Stern and Brayer, 1975). A study using healing caps in
ISRPDs, showed a lower risk of occlusal collapse compared with RPDs
(Halterman et al., 1999). In the case of a mandibular bilateral distal extension RPD
functioning against a maxillary complete denture, an IARPD/ISRPD can offer
more even force distribution. The additional posterior support provided by
ISRPD/IARPD prevents the resorption of the anterior maxilla and reduces the risk
of combination syndrome (Keltjens et al., 1993).
The position of the implant can have a significant effect on force distribution.
Placement of implants in the second molar location provides the best support and
stability (Grossmann et al., 2009; Ohkubo et al., 2008). In the case where there is
insufficient bone in the second molar region, placement of the implant close to the
adjacent abutment is recommended. This provides a future option for a fixed
implant-supported prosthesis (Grossmann et al., 2009). Further clinical studies are
still needed to evaluate the most effective position of the implant (Shahmiri and
Atieh, 2010).
Healthy soft tissue surrounding a dental implant gives protection to the osseous
structure during the osseointegration of the implant (Geurs et al., 2010). Therefore,
it is important to evaluate the soft tissue condition around the implant in

12
IARPD/ISRPD. Fields and Campfield (1974) reported that tissue around the
ISRPD remained healthy during the 7-month follow-up period. Mitrani et al.,
(2003) evaluated peri-implant soft tissue conditions in both IARPD and ISRPD and
reported that the soft tissue remained stable during the 12-48 month follow-up
period. However, the complication of hyperplastic tissue was reported in the
ISRPD patients during the follow up period.
The longevity of IARPD/ISRPD depends on prosthetic maintenance requirements
as well as biological complications (Payne and Solomons, 2000). Fracturing of the
acrylic base was observed when ball attachments (IARPD) were incorporated into
existing partial dentures opposing a complete maxillary denture (Payne et al.,
2006). Several other studies also reported complications related to IARPD/ISRPD
such as adjustment of the acrylic base, implant failure, repeated relining, rest
rupture, pitting of the surface of the healing abutments, screw loosening,
framework fracture, hyper-plastic tissue formation, loosening of healing cap and
fracture of the acrylic denture base (Grossmann et al., 2009; Keltjens et al., 1993;
Mijiritsky et al., 2005; Mitrani et al., 2003; Payne et al., 2006).
Maintenance or renewal of attachments or healing caps was reported more
frequently than any other complication with IARPD/ISRPD (Mitrani et al., 2003;
Payne et al., 2006). Loosening of the healing cap (ISRPD) in 84% of cases was
reported in 24 patients after a 12-month period in a randomized controlled study
by Payne et al., (2006). In the second component of the same study, resilient
attachments were placed (IARPD) and 58.3% of patients reported complications.
13
Several clinical studies have reported improved chewing ability and patient
satisfaction for IARPDs/ISRPDs compared to RPDs (Mijiritsky et al., 2005; Mitrani
et al., 2003; Ohkubo et al., 2008). Mitrani et al., (2003) carried out a retrospective
study of both IARPD and ISRPD and concluded that IARPD/ISRPD improved
patient satisfaction. Mijiritsky et al., (2005) reported improved chewing ability and
patient satisfaction when wearing IARPD during a 24-48 month follow-up period.
Ohkubo et al., (2008) conducted a single blind randomized crossover study of five
partially edentulous patients (Kennedy Class I). The study was designed to
evaluate masticatory movements, occlusal forces and patient comfort following
placement of an ISRPD. The study showed that the occlusal force and contact
areas were greater and more distally located in the ISRPD than for a RPD.
The reviews of clinical studies and case reports on ISRPD/IARPD identified only
two randomized trials Ohkubo et al., (2008), Payne et al., (2006) and three
retrospective studies Grossmann et al., (2009), Mijiritsky, (2007) and Mitrani et al.,
(2003). All the studies had insufficient follow-up periods and were lacking in
statistical power.
Non-clinical studies
Cho, (2002) studied the load transfer characteristics of IARPDs and showed that
the use of resilient attachments with distal implants reduced the stress
concentration around implants and abutment teeth. Although only resilient
attachments (IARPD) were used in this study, the use of healing abutments
14
(ISRPD) in different studies showed a similar result. Itoh et al., (2007) used a
photo-elastic model of a mandibular bilateral distal extension implant-tooth borne
RPD and found that both healing abutments and ball attachments provided
support to the RPD with no difference in stress concentration.
Lacerda et al., (2005) compared different connection designs for an IARPD. They
compared various hinge and rigid connectors and evaluated the load on the
abutment, alveolar ridge and implant. They found that ball, ring and magnet
connectors behaved as hinges, preventing a bending moment on the implant.
However, such a flexibility in the connection between the implant and RPD
increased the load on the abutment teeth and IARPD structure. On the other hand,
a ball attachment with adjustable resilient matrix design can reduce the amount of
stress on the structure of the prosthesis (Shahmiri and Atieh, 2011). However,
there is currently no available evidence to recommend one design over another in
terms of retention and support.
With regard to implant location, Cunha et al., (2008) used finite element analysis
(FEA) to show that there is a greater tendency for displacement when implants are
placed in the second molar position, and suggested that a more mesial position in
the arch (i.e. first molar region) would reduce this. However, Ohkubo et al., (2007)
showed that implant placement in the second molar region reduced the distal
displacement. In addition, an increase of the implant angle increased displacement
and tension, which is considered harmful to the structure of the prosthesis (Santos
et al., 2006). Further studies are required to evaluate the most effective position of
the implant.

15
Dissipation of the occlusal forces over an abundant surface of an implant can help
maintain bone integrity (Lum, 1991). In a biomechanical study, Verri et al., (2007)
created six models and used FEA to evaluate the influence of length and diameter
of implants on the design of a RPD. The authors showed that increasing both the
length and diameter of implants was likely to reduce the tension values. Yet, it is
expected that the ISRPD can be shorter if the implants are used for vertical
support only (Brudvik, 1999). However, the optimal length and diameter of the
implants for use with RPDs have not been determined.
An increase in the masticatory forces will have an influence on the prosthesis
components and supporting structures. Rocha et al., (2003) carried out a FEA
study to evaluate behaviour of the support structure of a ISRPD compared to a
RPD with the same loading conditions. It was concluded that the presence of a
implant, supported the RPD and promoted smaller stress levels in alveolar bone.
The influence of the different loading conditions and retention systems were
studied in three separate FEA studies by Pellizzer et al., 2003, 2004 and 2010. In the
2003 study stress values were measured in an ISRPD support structure and
prosthesis under four different loading schemes, with gradual vertical forces
applied onto the first and second molars. It was concluded that stress values
exceeded the ultimate stress value of the acrylic and a material with more
resistance needed to be used for occlusal coverage (Pellizzer et al., 2003).
In 2004 they evaluated the effect of vertical and oblique loads on a distal extension
IARPD. Loads at 90 and 45 angles were applied in two directions, mesial to

16
distal and distal to mesial. It was found that 45 mesial to distal loading generated
less tension than distal to mesial. Nevertheless, the tendency for more
displacement and greater tension was observed for the 45 loads compared to the
90 loads (Pellizzer et al., 2004).
Pellizzer et al (2010) third study compared biomechanical behaviour of IARPD and
ISRPD with different retention systems. They evaluated the effect of axial and
oblique loads on a conventional RPD, ISRPD, IARPD with ERA attachments,
IARPD with O-ring attachments, single fixed implant (UCLA abutment)
supporting a RPD. It was concluded that IARPD with ERA attachments displayed
the best stress distribution in the supporting structure. The single fixed implant
(UCLA abutment) supporting a RPD was a nonviable treatment option.
IARPD/ISRPD places more stress on the prosthesis components than a RPD, due
to an increase in mastication forces (Cibirka et al., 1992; Ohkubo et al., 2008).
Fracture of the acrylic base was reported when an existing RPD was fitted with
implants in the distal of the distal extension, which was opposed by a maxillary
complete denture (Payne et al., 2006). Stability of the maxillary complete denture
can be promoted by developing balanced loading to minimize tipping stress when
the mandibular Kennedy Class I RPD is used (Carr et al., 2011). However, the
effect of the loading condition has not been investigated when an implant is retro
fitted into a RPD.

17
Chapter Three
Method and Materials
Method
Model fabrication
A human mandible was obtained from the Department of Anatomy and
Structural Biology at the University of Otago. A duplicate model was made using
a polyurethane (Easycast®) covered with a 2mm layer of silicone (Deguform,
DeguDent, Germany) (figure 1a & b).
Figure 1: (a) Fabricated model of polyurethane resin (Easycast®)
(b) Soft tissue simulated with silicone (Deguform®)
The edentulous ridge areas of the mandibular model were covered with 2 mm of
wax to simulate the maximum soft tissue thickness. A matrix was made with
condensation silicone putty (Sil-Tech® Ivoclar Vivadent AG,
Schaan/Liechtenstein). After removing the wax, Deguform® was injected into the
matrix and a uniform silicone layer was produced.
a (a) (b)

18
An alginate impression was taken of the mandibular model using a custom tray.
The impression was poured with type 4 stone (Fujirock® EP, GC Europe N.V.,
Leuven, Belgium) to make a master cast. A conventional Kennedy Class I RPD
with a lingual bar (0.5 mm), mesial rest and I bar was designed. The path of
insertion was determined, undercuts were blocked out and the distal extension
area was given a 1 mm spacer. The cast was then duplicated with Deguform® and
a refractory cast was poured (Wirovest®, BEGO, Bremer Goldschlägerei Wilh,
Germany). The refractory cast was waxed up according to conventional Kennedy
Class I RPD techniques. After investing, the framework was cast in a cobalt-
chrome molybdenum alloy (Wironit® BEGO, Bremer Goldschlägerei Wilh,
Germany). The framework was fitted and polished (figure 2).
Figure 2: Fabricated metal framework

19
Strain gauges
Strain gauges (Vishay Electronic GmbH, Germany) were placed on the fitting side
of the framework. Two strain gauges were placed perpendicular to each other in
the mesial areas of the bilateral distal extensions between the retention mesh and
lingual bar. A further four gauges were placed radially around each implant site
(figure 3).
Figure 3: Numbered strain gauges and their placement
Because an RPD is a complex structure and measurement of general body
displacement is almost impossible, so a novel research method utilizing strain
gauges to measure strain on the surfaces near the boundary conditions was used.
Biaxial and uniaxial strain fields are a determinant in choosing the type of strain
20
gauge used. In the case of a biaxial field, the question arises whether or not the
direction of the principal strain is known. If the direction of the principal strain is
unknown, three or four rosette strain gauges are required and if the direction of
the strain is known, two rosette strain gauges are sufficient. In the case of a
uniaxial strain field, a single gauge is enough to measure the strain (Dally and
Riley, 1965). In this study, static loading was applied to the materials. This made
the directions of the strains predictable and uniaxial. As only high strain areas
were to be identified, the strategy was taken to place the strain gauges close to
boundary conditions. In the area by the rests, gauges were placed to measure
strain in the x and y directions. Around the implants, it was necessary to place the
gauges radially to allow for the intended placement of the implant. The strain
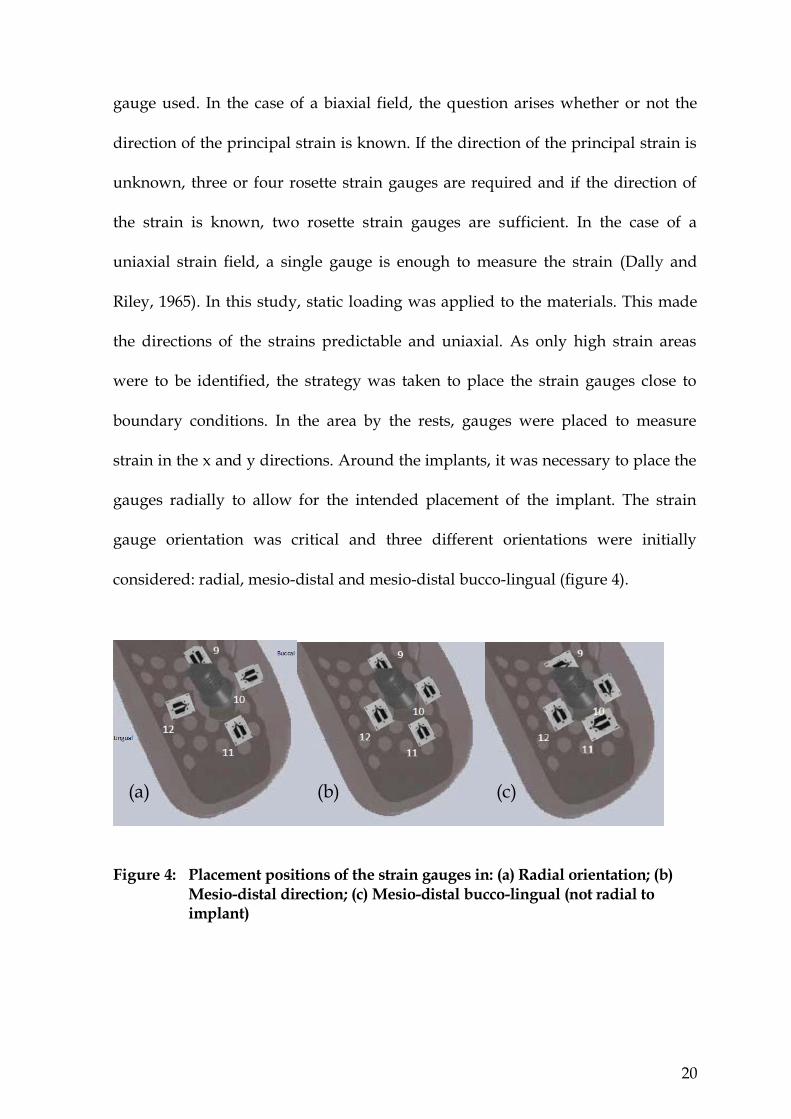
gauge orientation was critical and three different orientations were initially
considered: radial, mesio-distal and mesio-distal bucco-lingual (figure 4).
Figure 4: Placement positions of the strain gauges in: (a) Radial orientation; (b)
Mesio-distal direction; (c) Mesio-distal bucco-lingual (not radial to implant)
(a) (b) (c)

21
Out of three scenarios, the radial orientation of strain gauges was decided on. This
was because most of the strain would occur in the mesio-distal direction because
of the deflection of the saddle and bucco-lingual direction due to tissue response
to lateral displacement of the prosthesis.
Strain gauge length and width have an important role in the accuracy of a strain
measurement. The smaller the length of the strain gauge, the more accurate the
strain value at a given point (Dally and Riley, 1965). Therefore, small strain gauges
with a length of 0.15mm length were used. The strain gauges were trimmed to the
smallest size possible in order to accommodate them on the limited space the
mesh framework had available. After the strain gauges were trimmed, isopropyl
alcohol was used to clean the surface of framework. The strain gauges were then
attached to the framework with cyanoacrylate adhesive, and wiring procedures
were completed with 0.08 mm thickness copper based wires. The adhesion of the
gauges can influence the resistance to stress relaxation and gauge resistance. To
account for this, pressure is applied at temperature which helps minimize any
residual stresses in the adhesive. Adequate bonding was tested by tapping the
installed gauges with a soft rubber eraser and checking the strain readings (Dally
and Riley, 1965).
Terminals (CPF-50C M-Line accessories, Measurement Group, INC., Raleigh, NC)
were attached onto the model base and the strain gauge wires were attached to the
appropriate channel. The models were left for 24 hours to make sure the strain
gauges and terminals were secured, as heat introduced during the wire soldering
22
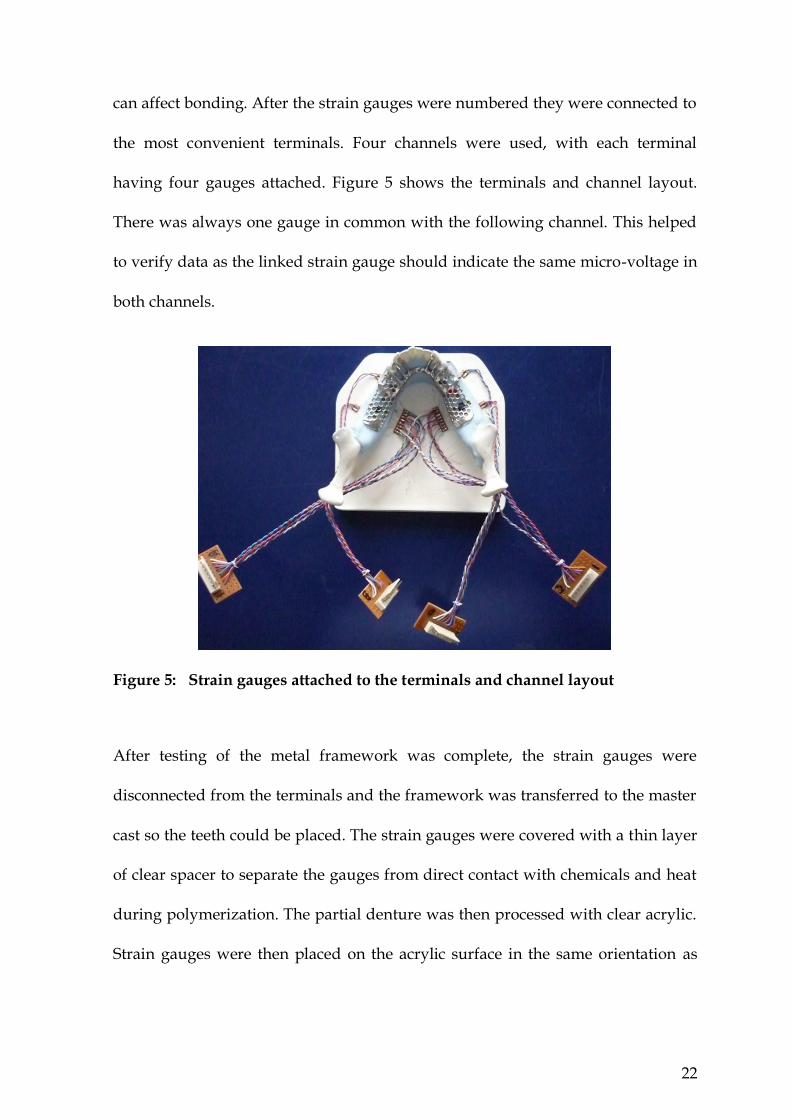
can affect bonding. After the strain gauges were numbered they were connected to
the most convenient terminals. Four channels were used, with each terminal
having four gauges attached. Figure 5 shows the terminals and channel layout.
There was always one gauge in common with the following channel. This helped
to verify data as the linked strain gauge should indicate the same micro-voltage in
both channels.
Figure 5: Strain gauges attached to the terminals and channel layout
After testing of the metal framework was complete, the strain gauges were
disconnected from the terminals and the framework was transferred to the master
cast so the teeth could be placed. The strain gauges were covered with a thin layer
of clear spacer to separate the gauges from direct contact with chemicals and heat
during polymerization. The partial denture was then processed with clear acrylic.
Strain gauges were then placed on the acrylic surface in the same orientation as

23
the metal framework. The clear acrylic enabled the gauges to be directly aligned
with the corresponding gauges placed on the metal framework (figure 6).
Figure 6: Placement of strain gauges on the acrylic surface
Strain measurement
Strain defined as change in the length divided by the initial length of a line
segment parallel to one of three associated principal directions is known as normal
strain (Dally and Riley, 1965). Consequently, slight changes in orientation of line
segments parallel to each of the axes x, y and z can occur and this is known as
shearing strain. In a two-dimensional state of strain, there are three cartesian strain
components: ℇxx, ℇyy and ℇxy where ℇxx and ℇyy are normal strain and ℇxy is shear
strain. Motion of the object can be translational/rotational or movement of points
of a body relative to each other. Translational or rotational movement is known as
rigid body motion and movement of the points of a body relative to each other is
known as deformation (Dally and Riley, 1965).
Strain can be measured with several methods such as strain gauge, photo-
elasticity, moiré fringe patterns, finite element analysis and holography. The strain

24
gauge method and finite element analysis are quantitative methods of strain
measurement, while other methods are predominantly qualitative methods. A
single measurement of displacement cannot accurately measure general body
displacement and as a result, the conversion of displacement to strain does not
reflect the general body strain. Therefore, it is recommended to utilize a strain
gauge to measure surface strain (Dally and Riley, 1965).
Implant placement into model
The holes for the implants were prepared on the model using a milling unit.
Drilling was performed parallel to the path of insertion of the partial denture. A
2.2 mm diameter pilot drill (number 044.211) (Straumann Group, SIX: STMN,
Basel, Switzerland) was used initially, followed by a 2.8 mm diameter drill
(number 044.216), and finally a 3.5 mm diameter drill (number 044.219) (figure 7).
Figure 7: Prepared holes in the model for implant placement

25
Easycast® resin based material was poured into the holes and the implants were
connected to the implant transfer screw and was screwed down and left for 72
hours to cure. Ball attachments were then placed on the implants and screwed
down.
Holes were prepared inside the acrylic base of the partial denture to accommodate
the retentive caps. The retentive caps (Straumann titanium matrix, reference
number 048.450) were placed on the ball attachments and the partial denture was
relined with self-cure acrylic to secure the retentive caps in place. After this, all the
strain gauges were connected to the appropriate terminals (figure 8).
Figure 8: Completed RPD with retentive caps and strain gauges in place
Colour coded wires were used for strain gauges to aid identification (figure 9).
Figure 9: Colour coded wires attached to channels

26
Loading of the prosthesis
A compressive load of 120N was applied at a crosshead speed of 0.05mm/sec
using a universal testing machine (Instron 3369, Norwood, MA, USA). It has a
rigid frame controlled by Instron® Bluehill Lite software. Each loading condition
was repeated eight times under the control of the software.
The output strain data were detected as µV and recorded with Chart 5 software
and Power Lab system (AD Instruments, Sydney, Australia). Data were presented
as a graph in the Chart 5 software and the highest strain point in each channel was
manually recorded.
The teeth, or tooth bearing areas were loaded, bilaterally (figure 10) and
unilaterally (figure 11). Each testing condition was loaded uniformly, in the
premolar area and in the molar area.
Figure 10: Bilateral loading; (a) Uniform (b) Premolar (c) Molar
Figure 11: Unilateral loading; (a) Uniform (b) Premolar (c) Molar
(a) (b) (c)
(a) (b) (c)

27
Two steel bars with different widths were used for the bilateral loading condition.
A wider bar that covered all the denture teeth was used for the uniform loading
and a narrower bar was used to cover only the selected premolar and molar teeth.
A thin silicone layer was placed between the bar and the teeth to distribute the
forces evenly. The silicone was placed on top of the teeth and a small amount of
load was applied with the loading machine to ensure that a level surface was
achieved. The embedding of the bar into the silicone also minimized displacement
of the steel bar during loading. A small V-shaped groove was created in the bar to
locate the tip of the loading point accurately (figure 12).
Figure 12: Bilateral loading of premolar region in Instron universal testing machine
For the uniform unilateral condition a smaller bar was used which also had
silicone between the teeth and the bar. Due to the small loading area, the
unilateral loading of the premolar and molar areas could be done directly using a
flat loading point attached to the Instron and with silicone between the load point
and the teeth.

28
Converting the data to micro-strain values
Strain gauges convert relative mechanical displacement into an electrical signal,
which is recorded as µV. The data then needs to be converted to µstrain (Watson,
2008). Electrical resistance change is the result of resistivity and dimensional
changes of the thin metal wire. In order to measure small changes in resistance,
strain gauges use a Wheatstone bridge arrangement with a voltage excitation. The
voltage recorded needs to be converted to a resistance change value and then
ultimately to a strain value. To find the resistance changes from voltage excitation
in the Wheatstone bridge, the gauge factor needs to be calculated first. To calculate
the gauge factor, the differential relationship between the area change and length
change needs to be found. To calculate the differential relationship, the resistance
needs to be calculated.
Resistance equation
Differential equation
R=resistance (Ω), P=resistivity (Ωcm), L=length (cm), A=area of cross-section (cm2)
Poisson’s ratio is then calculated which then can be inserted into the differential
equation which once combined gives the relative resistance change.
V is Poisson’s ratio

29
Relative resistance change to change of length equation
The relative resistance change to change of length equation shows the ratio of
electrical resistance change of a conductor to the change in length, which is known
as the gauge factor (GF).
Gauge factor equation
An accurate measurement of the change of resistance is essential as strain rarely
exceeds more than a few milli-strains or a few thousand micro-strains. In order to
measure small changes in resistance, strain gauges are used in a bridge
arrangement with a voltage excitation. A Wheatstone bridge is usually used to
measure relative resistance change (Dally and Riley, 1965). The Wheatstone bridge
consists of four resistors with output voltage difference at points B and D. Paths
ABC and ADC (figure 13) divide the voltage. In this way the voltages for B and D
can be calculated. This is calculated as
VB =Vin and VD =Vin giving
Vout= VD – VB = Vin

30
Figure 13: Wheatstone bridge arrangement. (R=resistors, V=voltage)
In a Wheatstone bridge R1, R2, R3 or R4 can record the strain and consequently a
quarter, half, or the full bridge system can be used. We assume at least a quarter of
the bridge is active with a changing resistance.
Output of the bridge is usually adjusted to zero before any strain application.
Therefore, VB will be equal to VD and R1R4 = R2R3 and since the bridge is in a
balanced condition R1=R2=R3=R4=R. When strain applies, the resistance value of
R1 will change slightly (R+dR) and the equations change too.
Since the resistance change is very small (2dR 4R) the term 2dR can be eliminated
and we calculate dVout as follows:

31
Then, the relative resistance change equation can be derived from the gauge factor
equation as follows:
By using the resistance change and the gauge factor, the strain can be calculated as follows:
For this study all values obtained from the strain gauges were placed in the
equation below to calculate micro-strain values. As the voltage excitation for the
Power Lab system is 2.5 volts (Vin = 2.5) the equation was modified to:
All strain gauges had a gauge factor of 2.07. Therefore, by placing the value of the
output voltage in the strain equation, the value of strain can be calculated.
32
Materials
Implants
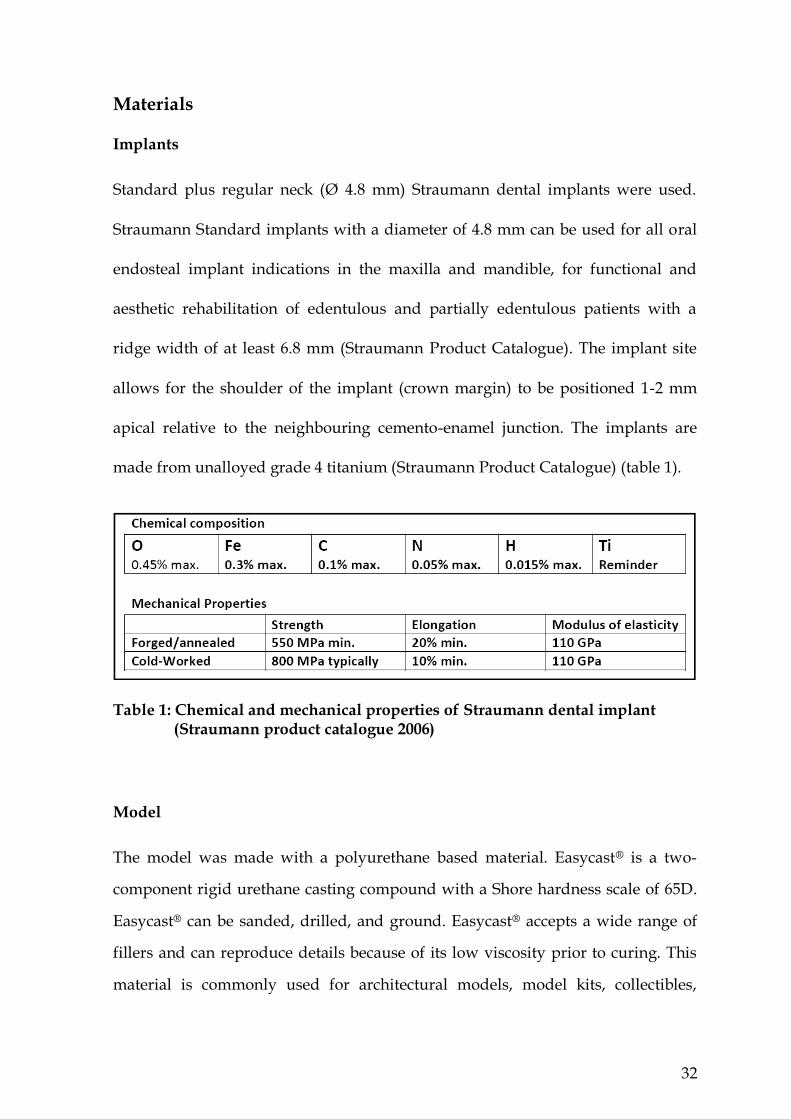
Standard plus regular neck (Ø 4.8 mm) Straumann dental implants were used.
Straumann Standard implants with a diameter of 4.8 mm can be used for all oral
endosteal implant indications in the maxilla and mandible, for functional and
aesthetic rehabilitation of edentulous and partially edentulous patients with a
ridge width of at least 6.8 mm (Straumann Product Catalogue). The implant site
allows for the shoulder of the implant (crown margin) to be positioned 1-2 mm
apical relative to the neighbouring cemento-enamel junction. The implants are
made from unalloyed grade 4 titanium (Straumann Product Catalogue) (table 1).
Table 1: Chemical and mechanical properties of Straumann dental implant (Straumann product catalogue 2006)
Model
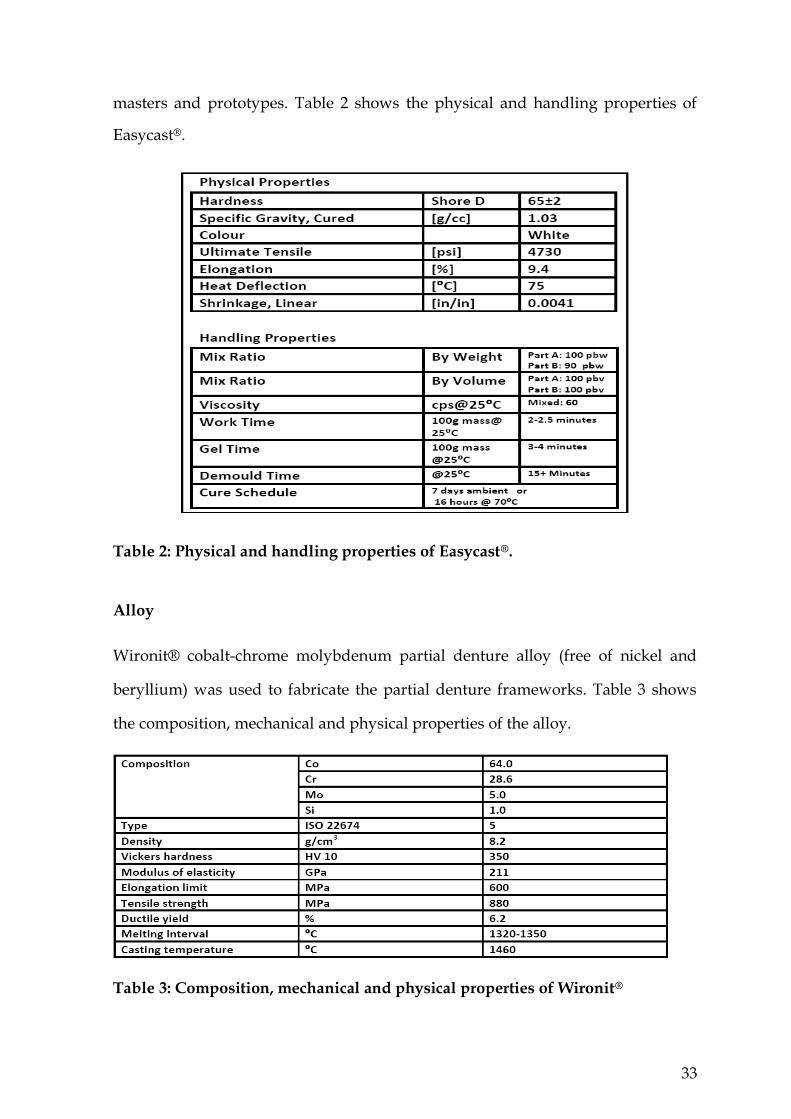
The model was made with a polyurethane based material. Easycast® is a two-
component rigid urethane casting compound with a Shore hardness scale of 65D.
Easycast® can be sanded, drilled, and ground. Easycast® accepts a wide range of
fillers and can reproduce details because of its low viscosity prior to curing. This
material is commonly used for architectural models, model kits, collectibles,
33
masters and prototypes. Table 2 shows the physical and handling properties of
Easycast®.
Table 2: Physical and handling properties of Easycast®.
Alloy
Wironit® cobalt-chrome molybdenum partial denture alloy (free of nickel and
beryllium) was used to fabricate the partial denture frameworks. Table 3 shows
the composition, mechanical and physical properties of the alloy.
Table 3: Composition, mechanical and physical properties of Wironit®
34
Attachments
Two Straumann retentive resilient ball attachments (Straumann, number 048.439)
were used with a height of 3.4 mm. Titanium retentive anchors (Straumann,
number 048.450) with a height of 3.1 mm were used. A torque driver (Straumann,
number 046.069) was used to torque down the ball abutments. Eighteen millimeter
transfer pins (Straumann, number 048.109) were used to transfer the exact
positions of the abutments to the master cast.
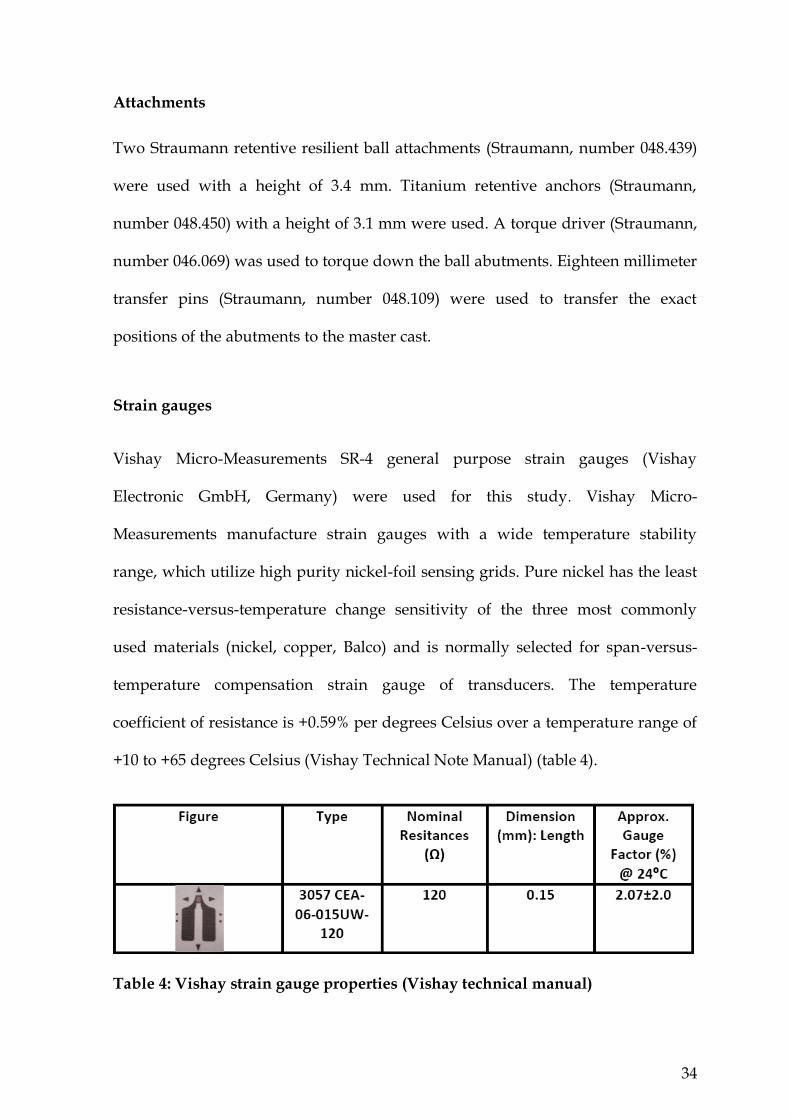
Strain gauges
Vishay Micro-Measurements SR-4 general purpose strain gauges (Vishay
Electronic GmbH, Germany) were used for this study. Vishay Micro-
Measurements manufacture strain gauges with a wide temperature stability
range, which utilize high purity nickel-foil sensing grids. Pure nickel has the least
resistance-versus-temperature change sensitivity of the three most commonly
used materials (nickel, copper, Balco) and is normally selected for span-versus-
temperature compensation strain gauge of transducers. The temperature
coefficient of resistance is +0.59% per degrees Celsius over a temperature range of
+10 to +65 degrees Celsius (Vishay Technical Note Manual) (table 4).
Table 4: Vishay strain gauge properties (Vishay technical manual)

35
Silicone
Deguform® was used to duplicate the models; Deguform® is an addition curing,
two component silicone. A ratio of 1:1 for the catalyst (white) and curing agent
(blue) was used. Deguform® has a Shore A hardness of 14-16 and linear
contraction of 0.08% (DeguDent product manual).
Acrylic
VertexTM Castapress Crystal Clear self-polymerizing pour denture base material
was used to make the denture base. Technical specifications of this material are
shown in table 5.
Table 5: VertexTM Castapress technical specification (VertexTM Dental webpage) (http://www.vertex-dental.com/castapressCrystalClear)
Die stone
GC Fujirock® EP (GC Europe N.V., Leuven, Belgium) was used to fabricate the
master cast. GC Fujirock® is a type 4 dental stone with a setting expansion of
0.08% and a compressive strength of 53 MPa. The recommended water/powder
ratio is 20 ml/100 g.

36
Refractory material
Wirovest® (BEGO, Bremer Goldschlägerei Wilh, Germany) investment material
was used to fabricate the refractory model. BegoSol® (BEGO, Bremer
Goldschlägerei Wilh, Germany) with 40% liquid concentration was mixed with
Wirovest® powder with a powder/liquid ratio of 100g/15ml.
37
Chapter Four
Results
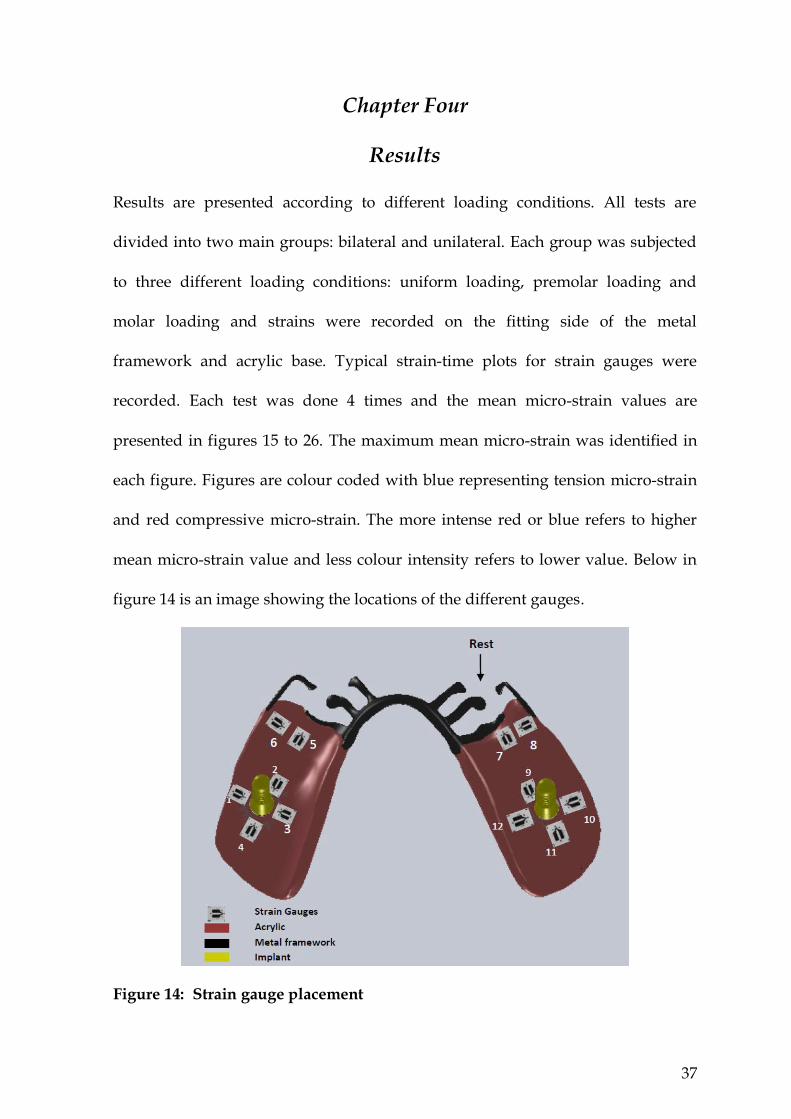
Results are presented according to different loading conditions. All tests are
divided into two main groups: bilateral and unilateral. Each group was subjected
to three different loading conditions: uniform loading, premolar loading and
molar loading and strains were recorded on the fitting side of the metal
framework and acrylic base. Typical strain-time plots for strain gauges were
recorded. Each test was done 4 times and the mean micro-strain values are
presented in figures 15 to 26. The maximum mean micro-strain was identified in
each figure. Figures are colour coded with blue representing tension micro-strain
and red compressive micro-strain. The more intense red or blue refers to higher
mean micro-strain value and less colour intensity refers to lower value. Below in
figure 14 is an image showing the locations of the different gauges.
Figure 14: Strain gauge placement

38
Bilateral loading conditions
Micro-strain measurements at the acrylic base
Bilateral uniform loading
The strain gauges around the implants recorded the highest tensile strains. Gauges
10 and 12 recorded high tensile micro-strains. Gauge 10 had the largest tensile
micro-strain value (figure 15). Blue outlines of increasing intensity were used on
bar charts to highlight the strain gauges with larger tension strains and red
outlines were used for larger compression strains.
Figure 15: Maximum mean micro-strain measured on the acrylic base (bilateral uniform loading)
Aro
un
d im
pla
nt
site
M
esia
l are
a o
f sa
dd
le

39
Bilateral premolar loading
In the bilateral premolar loading situation lower micro-strain values were
recorded around the implants compared with those in the mesial area of the distal
extension. All but one gauge showed tensile strain behaviour, with gauge 8
showing the largest value (figure 16).
Figure 16: Maximum mean micro-strain measured on the acrylic base (bilateral premolar loading)
Me
sia
l are
a
of
sad
dle
A
rou
nd
imp
lan
t si
te
40
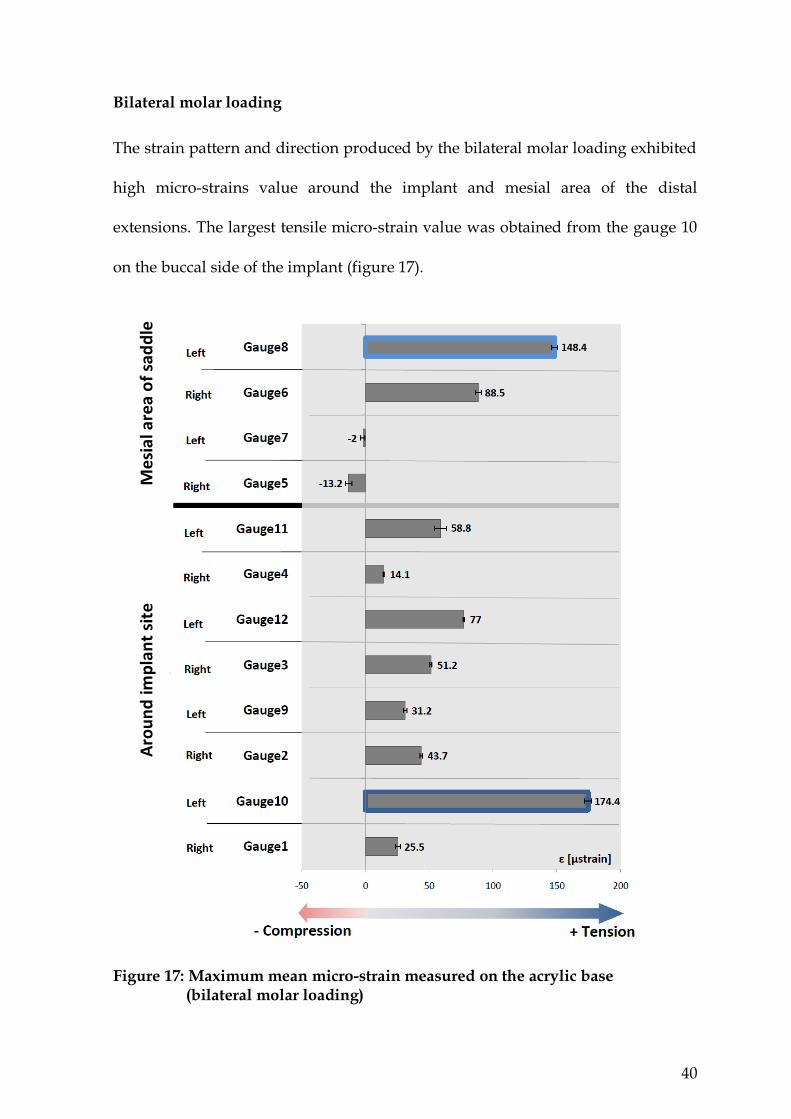
Bilateral molar loading
The strain pattern and direction produced by the bilateral molar loading exhibited
high micro-strains value around the implant and mesial area of the distal
extensions. The largest tensile micro-strain value was obtained from the gauge 10
on the buccal side of the implant (figure 17).
Figure 17: Maximum mean micro-strain measured on the acrylic base (bilateral molar loading)
Me
sial
are
a o
f sa
dd
le
Aro
un
d im
pla
nt
site

41
Micro-strain measurements at the metal framework
Bilateral uniform loading
Gauge 6 showed the largest tensile micro-strain of 109.5, the corresponding gauge
on the opposite side (gauge 8) also recorded a high tensile micro-strain of 59.5.
Smaller values were measured by the gauges in the implant areas (gauges 1, 2, 3,
4, 9, 10 and 11) as shown in figure 18.
Figure 18: Maximum mean micro-strain measured on the metal framework (bilateral uniform loading)
Aro
un
d im
pla
nt
site
M
esi
al a
rea
of
sad
dle

42
Bilateral premolar loading
Similar to uniform loading, gauges 6 and 8 showed tensile strain behaviour, with
gauge 6 showing the largest value (figure 19). Bilateral premolar loading produced
lower micro-strain values around the implants compared with those at the mesial
area of the distal extension.
Figure 19: Maximum mean micro-strain measured on the metal framework (bilateral premolar loading)
Aro
un
d im
pla
nt
site
M
esi
al a
rea
of
sad
dle
43
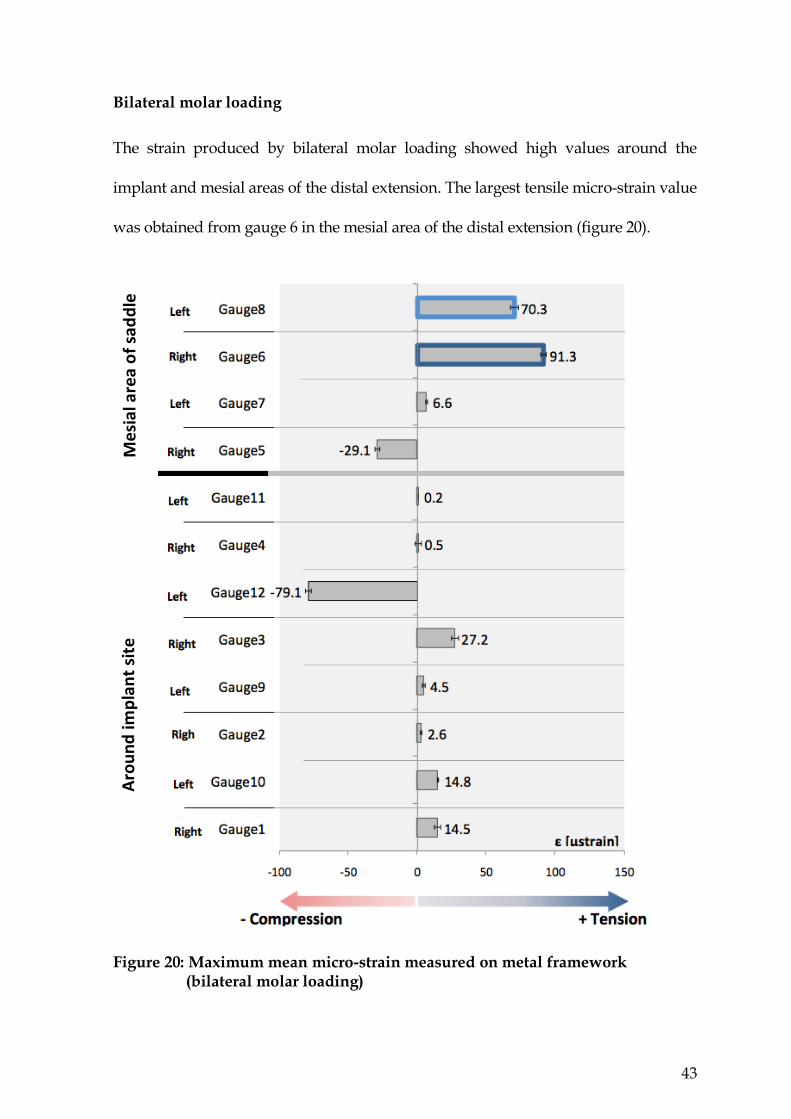
Bilateral molar loading
The strain produced by bilateral molar loading showed high values around the
implant and mesial areas of the distal extension. The largest tensile micro-strain value
was obtained from gauge 6 in the mesial area of the distal extension (figure 20).
Figure 20: Maximum mean micro-strain measured on metal framework (bilateral molar loading)
Aro
un
d im
pla
nt
site
M
esi
al a
rea
of
sad
dle

44
Unilateral loading conditions
Micro-strain measurements at the acrylic base
Unilateral uniform loading
Lower strain values were generated by the uniform unilateral loading condition
compared with bilateral loading. A tensile pattern of strain was observed around
the implants, with the highest value recorded on the lingual side (figure 21).
Gauge 6 recorded tensile mirco-strain in the bucco-lingual direction.
Figure 21: Maximum mean micro-strain measured on the acrylic base (unilateral uniform loading)
Aro
un
d im
pla
nt
site
M
esia
l are
a o
f sa
dd
le

45
Unilateral premolar loading
Similar to the bilateral premolar loading condition, the strain gauges in the mesial
area of the distal extension showed the highest deformation under unilateral
premolar loading. The micro-strain values around the implants were the lowest
among all the tested unilateral loading conditions. Both gauges number 4 and 2
showed small amounts of strain. This appears to be related to the forces directed
away from the long axis of the ridge (figure 22).
Figure 22: Maximum mean micro-strain measured on the acrylic base (unilateral premolar loading)
Aro
un
d im
pla
nt
site
M
esi
al a
rea
of
sad
dle

46
Unilateral molar loading
Under the molar loading condition, the largest micro-strain value was
concentrated around the mesial area of the distal extension. This is similar to the
unilateral premolar condition. However, the strain was more evenly distributed
around the implant area (figure 23).
Figure 23: Maximum mean micro-strain measured on the acrylic base (unilateral molar loading)
Aro
un
d im
pla
nt
site
M
esi
al a
rea
of
sad
dle

47
Micro-strain measurements at the metal framework
Unilateral uniform loading
Lower strain values were generated by the uniform unilateral loading condition
than the bilateral one on the metal surface. Compressive micro-strain was
recorded around the mesial area of the distal extension with the highest value
recorded on the buccal side (figure 24).
Figure 24: Maximum mean micro-strain measured on the metal framework (unilateral uniform loading)
Aro
un
d im
pla
nt
site
M
esi
al a
rea
of
sad
dle

48
Unilateral premolar loading
The unilateral loading condition recorded high compressive micro-strain around the
mesial area of the distal extension, this is in contrast to bilateral premolar loading,
where high tension micro-strain was recorded in the same area (figure 25).
Figure 25: Maximum mean micro-strain measured on the metal framework (unilateral premolar loading)
Aro
un
d im
pla
nt
site
M
esi
al a
rea
of
sad
dle

49
Unilateral molar loading
Under the molar loading condition, the largest compressive micro-strain value
was concentrated around the mesial area of the distal extension. This is similar to
the unilateral uniform loading condition. However, the strains were less evenly
distributed around the implant areas (figure 26).
Figure 26: Maximum mean micro-strain measured on the metal framework (unilateral molar loading)
Aro
un
d im
pla
nt
site
M
esi
al a
rea
of
sad
dle

50
The differences in micro-strain values under different loading
conditions
The differences in micro-strain values were analyzed in terms of the different
loading regimes (uniform, premolar and molar loading) for both bilateral and
unilateral loading conditions. Results of the largest mean micro-strain values are
presented according to the site and direction of strain.
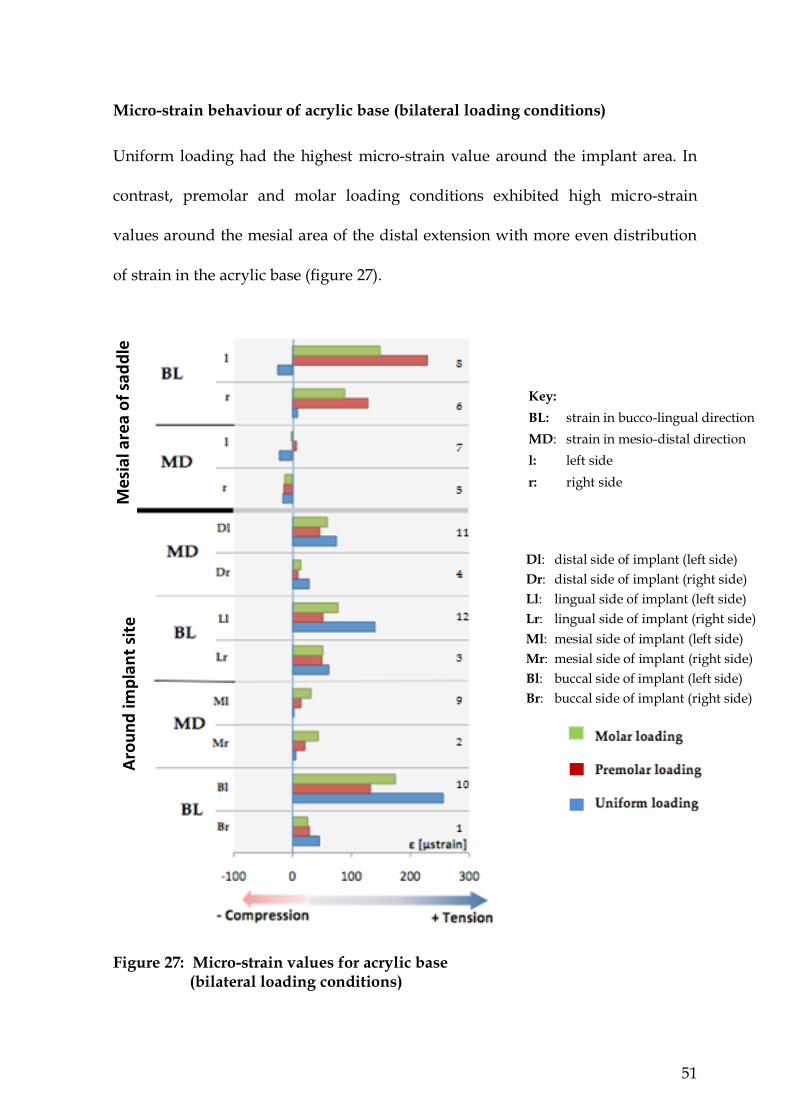
51
Micro-strain behaviour of acrylic base (bilateral loading conditions)
Uniform loading had the highest micro-strain value around the implant area. In
contrast, premolar and molar loading conditions exhibited high micro-strain
values around the mesial area of the distal extension with more even distribution
of strain in the acrylic base (figure 27).
Figure 27: Micro-strain values for acrylic base (bilateral loading conditions)
Key:
BL: strain in bucco-lingual direction
MD: strain in mesio-distal direction
l: left side
r: right side
Dl: distal side of implant (left side)
Dr: distal side of implant (right side)
Ll: lingual side of implant (left side)
Lr: lingual side of implant (right side)
Ml: mesial side of implant (left side)
Mr: mesial side of implant (right side)
Bl: buccal side of implant (left side)
Br: buccal side of implant (right side)
Aro
un
d im
pla
nt
site
M
esi
al a
rea
of
sad
dle

52
Because both implant and mesial areas of the distal extensions showed high
micro-strain values under different loading conditions, it was important to
identify whether the differences were statistically significant. Statistical analysis
was performed with SPSS 18.0 (SPSS, Inc., Chicago, IL, USA) to compare
maximum micro-strain values in all three loading conditions. ANOVA was used
to compare maximum mean micro-strain values identified in each loading
condition (table 6).
A comparison of the maximum mean micro-strain values between the three
different loading regimes showed a highly significant increase in the recorded
mean micro-strain value (p<0.001) around the mesial area of the distal extension in
the bucco-lingual direction as the loading point moved forward. In contrast, a
significant decrease of the mean micro-strain values (p<0.001) was observed in the
bucco-lingual direction around the implant area as the loading point moved
forward (table 6).
Table 6: Statistical comparison of maximum micro-strain values of three
loading conditions

53
A correlation analysis in figure 28 shows the reverse correlation when moving the
load forward with an increase in the maximum micro-strain value (R = - 0.985).
During the bilateral loading conditions, molar loading showed more even
distribution of micro-strain value around both the mesial of the distal extension
and implant areas on the acrylic surface.
Figure 28: An inverse correlation between maximum micro-strain in bucco-lingual direction in mesial area of the distal extension versus around the implant as the loading point moves forward
Max. micro-strain values around mesial area (gauge 8)
Max
. m
icro
-str
ain
val
ues
aro
un
d i
mp
lan
t si
te (
gau
ge
10)

54
Micro-strain behaviour of metal framework (bilateral loading conditions)
The bilateral loading showed the highest micro-strain value around the mesial area of
the distal extension on the metal surface. The highest micro-strain value remained in
the mesial area of the distal extension as the loading point moved forward. As the
loading point moved forward, the micro-strain values increased around the mesial
area of the distal extensions. The highest micro-strain value exhibited was in the
bucco-lingual direction around the mesial area of the distal extension (figure 29).
Figure 29: Micro-strain values for metal framework (bilateral loading conditions)
Key:
BL: strain in bucco-lingual direction
MD: strain in mesio-distal direction
l: left side
r: right side
Dl: distal side of implant (left side)
Dr: distal side of implant (right side)
Ll: lingual side of implant (left side)
Lr: lingual side of implant (right side)
Ml: mesial side of implant (left side)
Mr: mesial side of implant (right side)
Bl: buccal side of implant (left side)
Br: buccal side of implant (right side)
Aro
un
d im
pla
nt
site
M
esi
al a
rea
of
sad
dle

55
Statistical analysis of the highest micro-strain values of all three loading conditions
showed that there were significant differences (p<0.001) in the mesial area of the
distal extension in the bucco-lingual direction (table 7).
Table 7: Statistical analysis of gauge 6 maximum mean micro-strain values for
all three bilateral loading conditions
The maximum micro-strain values in the mesial area of the distal extension (gauge
6) are shown in figure 30 to illustrate consistency of data and enable comparisons
with similar areas on the acrylic surface. Among the three loading conditions,
molar loading showed the lowest micro-strain values (figure 30) which were a
better match than corresponding maximum micro-strain recorded on the acrylic
surface during uniform and premolar loading micro-strain (figure 28).
Figure 30: Maximum mean micro-strain values of metal surface for all three
bilateral loading conditions (gauge 6)
Max
. mic
ro-s
trai
n v
alu
es (
gau
ge
6)

56
Micro-strain behaviour of acrylic base (unilateral loading conditions)
Unlike bilateral loading, the recorded micro-strain values generated by the
unilateral loading, showed more consistency between uniform, premolar and
molar loadings. In the three loading conditions, the highest recorded values of
tension micro-strain were observed around the mesial area of the distal extension
in the bucco-lingual direction (figure 31).
Figure 31: Micro-strain values for acrylic base (unilateral loading conditions)
Key:
BL: strain in bucco-lingual direction
MD: strain in mesio-distal direction
Me
sial
are
a o
f sa
dd
le
Aro
un
d im
pla
nt
site
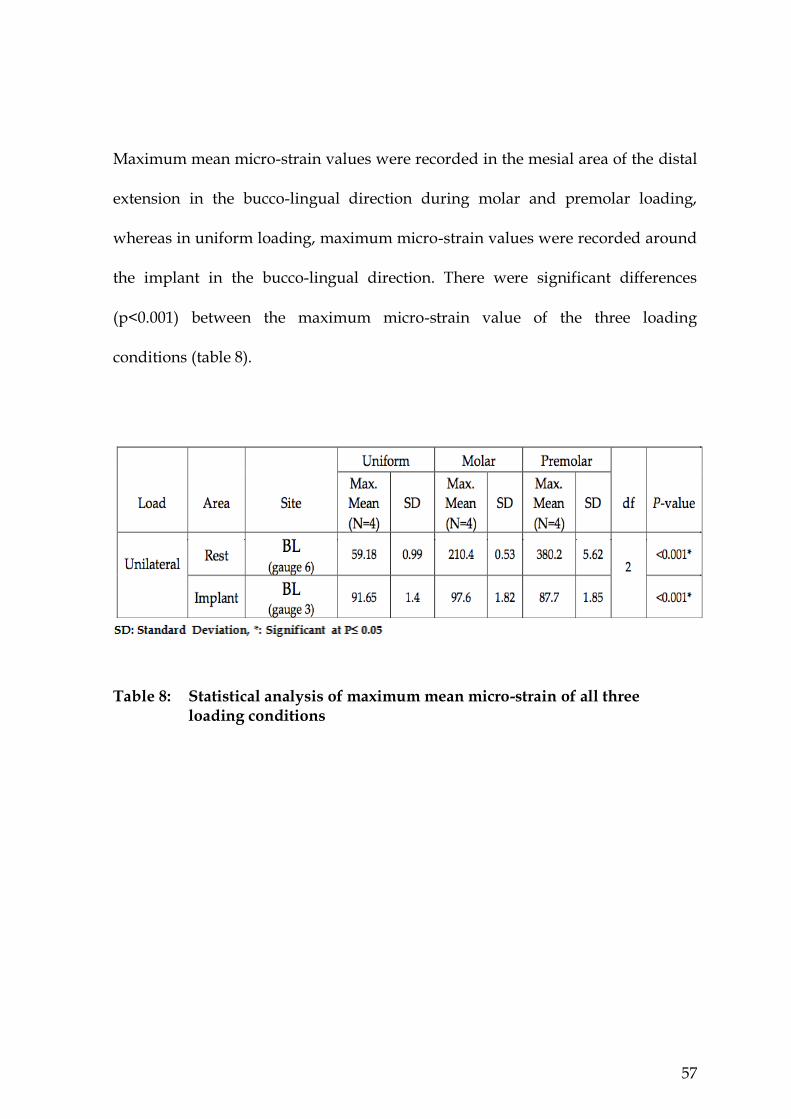
57
Maximum mean micro-strain values were recorded in the mesial area of the distal
extension in the bucco-lingual direction during molar and premolar loading,
whereas in uniform loading, maximum micro-strain values were recorded around
the implant in the bucco-lingual direction. There were significant differences
(p<0.001) between the maximum micro-strain value of the three loading
conditions (table 8).
Table 8: Statistical analysis of maximum mean micro-strain of all three loading conditions

58
A correlation analysis was carried out between the maximum micro-strain of two
areas around the implant and mesial areas of the distal extension as the loading
point moved forward. This indicated the maximum micro-strain moved to the
mesial area of the distal extension and continued to increase in the same area. The
micro-strain was more evenly distributed in both areas in uniform loading and
showed a lower micro-strain value compared with the other two loading
conditions (figure 32).
Figure 32: Direct correlation between movement of the loading point forward and location of maximum micro-strain
Max
. m
icro
-str
ain
val
ues
aro
un
d i
mp
lan
t si
te (
gau
ge
3)
Max. micro-strain values around mesial area of saddle (gauge 6)
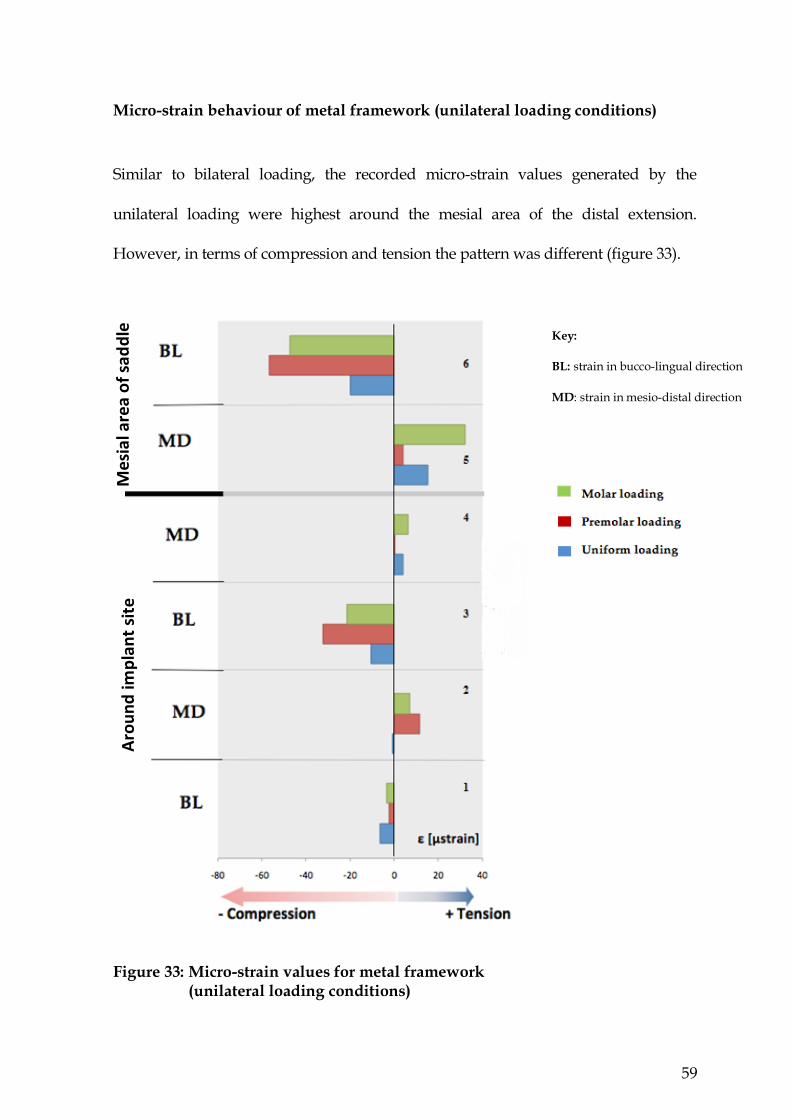
59
Micro-strain behaviour of metal framework (unilateral loading conditions)
Similar to bilateral loading, the recorded micro-strain values generated by the
unilateral loading were highest around the mesial area of the distal extension.
However, in terms of compression and tension the pattern was different (figure 33).
Figure 33: Micro-strain values for metal framework (unilateral loading conditions)
Key:
BL: strain in bucco-lingual direction
MD: strain in mesio-distal direction
Aro
un
d im
pla
nt
site
M
esi
al a
rea
of
sad
dle

60
In the three loading conditions, the highest micro-strain values were recorded
around the mesial area of the distal extension. There were a significant differences
(p<0.001) between the maximum micro-strain values of all three loading
conditions, and as the loading point moved forward there was a significant
increase in the compression micro-strain (table 9).
Table 9: Significant differences in mean maximum micro-strain exhibited
between all three loading conditions

61
Uniform loading resulted in less micro-strain in the area around the implant and
mesial area of the distal extension, with more evenly distributed micro-strain in
both areas (figure 34). Uniform loading created more favourable micro-strain
distribution in both framework and acrylic base.
Figure 34: Direct correlation for the value and location of the maximum micro-strain upon moving the loading point forward
Max
. m
icro
-str
ain
val
ues
(g
aug
e 6)
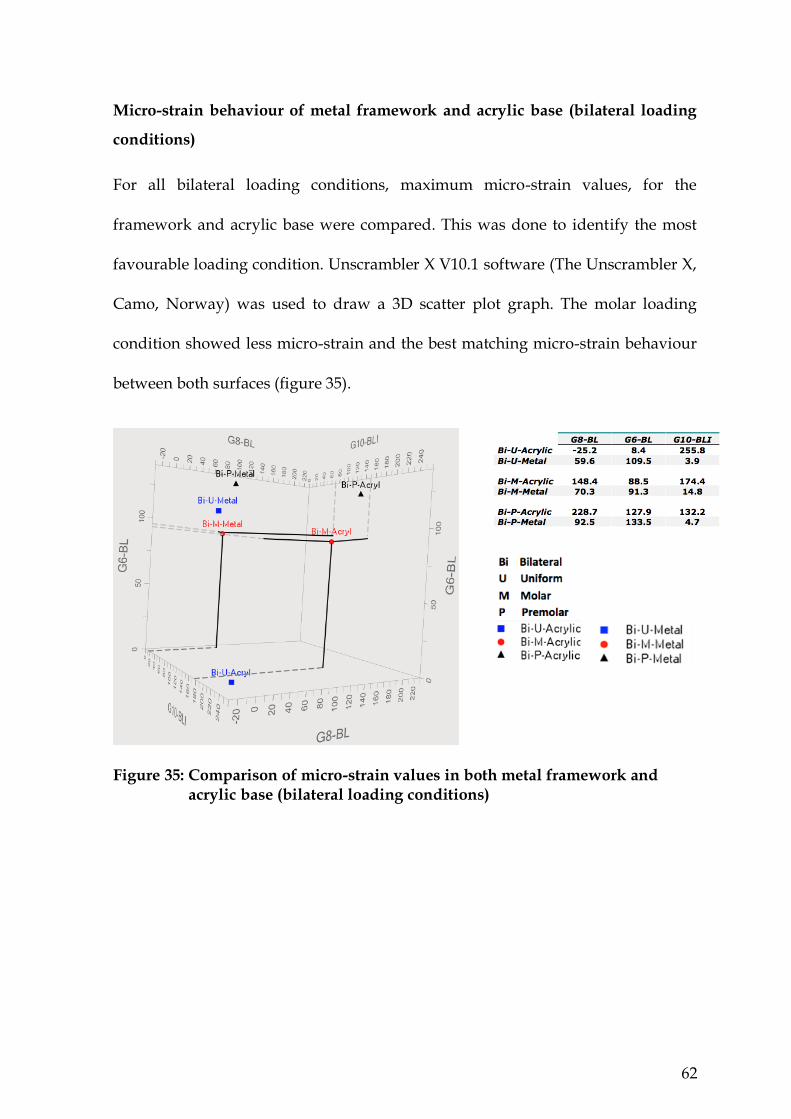
62
Micro-strain behaviour of metal framework and acrylic base (bilateral loading
conditions)
For all bilateral loading conditions, maximum micro-strain values, for the
framework and acrylic base were compared. This was done to identify the most
favourable loading condition. Unscrambler X V10.1 software (The Unscrambler X,
Camo, Norway) was used to draw a 3D scatter plot graph. The molar loading
condition showed less micro-strain and the best matching micro-strain behaviour
between both surfaces (figure 35).
Figure 35: Comparison of micro-strain values in both metal framework and acrylic base (bilateral loading conditions)
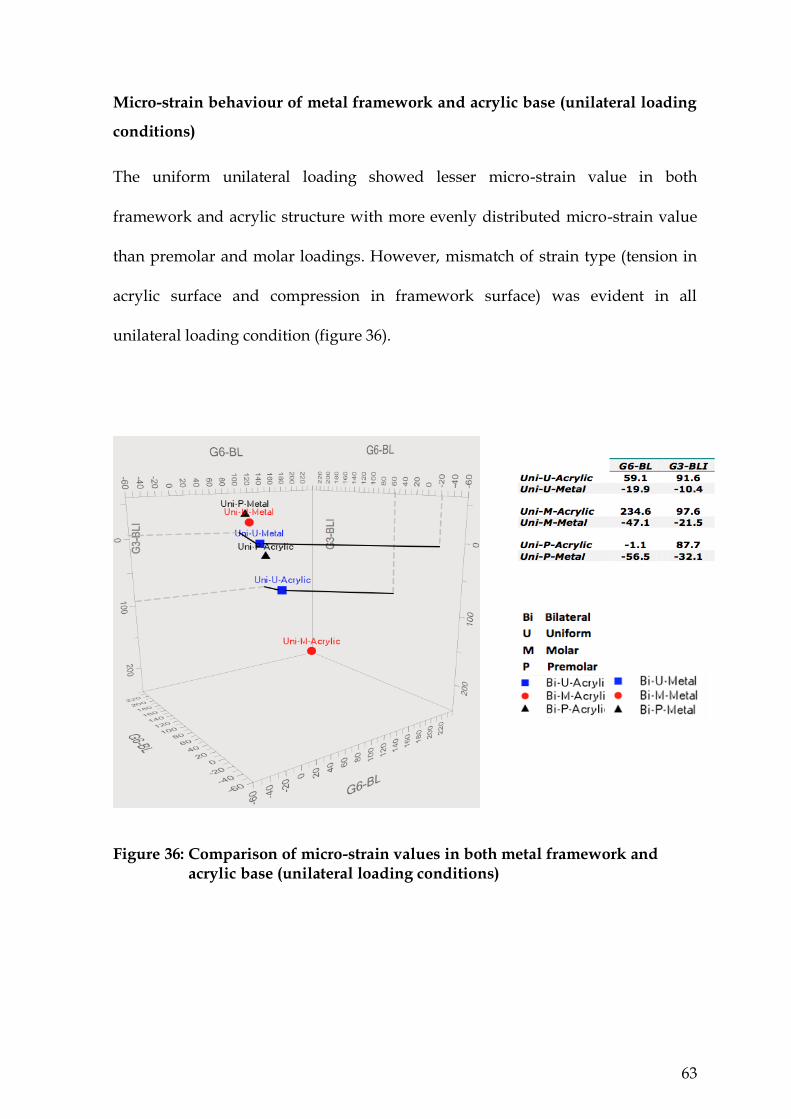
63
Micro-strain behaviour of metal framework and acrylic base (unilateral loading
conditions)
The uniform unilateral loading showed lesser micro-strain value in both
framework and acrylic structure with more evenly distributed micro-strain value
than premolar and molar loadings. However, mismatch of strain type (tension in
acrylic surface and compression in framework surface) was evident in all
unilateral loading condition (figure 36).
Figure 36: Comparison of micro-strain values in both metal framework and acrylic base (unilateral loading conditions)

64
Chapter Five
Discussion
Fracture of acrylic denture bases has been reported as a complication of the
mandibular bilateral distal extension IARPD where oral implants are incorporated
into an existing RPD opposing a maxillary complete denture (Payne et al., 2006).
Although the implant-tooth borne RPD and the conventional designs are
subjected to similar masticatory movements, the occlusal forces are greater and
more distally located in the former design (Ohkubo et al., 2008).
A bilateral balanced occlusion engages contacts on the non-working side to
prevent the prosthesis from being dislodged during function (Jambhekar et al.,
2010). Although the placement of implants in the posterior area of a distal
extension will limit the prosthesis dislodgment, the general balanced occlusion
concept may still be appropriate for a mandibular IARPD when the opposing
maxillary arch is fully edentulous or the maxillary opposing arch is a Kennedy
Class I/II (Wismeijer et al., 1995).
This study used different loading conditions, unilateral and bilateral, with three
different loading areas; premolar, molar and uniform. These loading conditions
were used because the prosthesis can be subjected to similar situations during
function. However mastication is more complex and it was not the aim of this
study to simulate masticatory function. It would not have been possible to
simulate the masticatory situation due to the complexity of loading, and the many

65
different loading combinations that would have been required. This investigation
aimed to identify the influence of the premolar, molar and uniform loading
conditions to give an understanding of the general strain developed in the IARPD
structure.
This study has certain limitations: (1) the strain gauges used measured only the
surface micro-strain at one point and in one direction; (2) the micro-strain patterns
developed in IARPDs are complex; (3) the implant osseointegration and the
physiological mobility of the abutment teeth was not considered; (4) The implant
fixture on one side was placed more towards the buccal and this could have
influenced the magnitude of micro-strain generated on that side. However, it had
no effect on the direction of micro-strain as both sides showed a similar direction
of micro-strain.
The IARPD has raised concerns with regard to stresses on bone, implant
components and restorative materials (Cibirka et al., 1992). This research was
conducted to better understand the influence of the loading conditions of
mandibular distal extension IARPD by directly measuring the micro-strain at the
metal framework level and the acrylic base level. Micro-strain was measured in
two main areas, around the implant and in the mesial area of the distal extension.
It was evident that the highest micro-strain values in the acrylic base followed the
loading point as it moved forward. In contrast, the metal framework behaved
differently as the highest micro-strain values remained in the mesial area of the
distal extension, regardless of the loading condition. Figures 21 to 23 in the

66
previous chapter show that the micro-strain values on the acrylic base increased
by up to six times in the unilateral loading groups as the loading point moved
forward. In this chapter the bilateral loading condition will be discussed first,
followed by unilateral loading.
Bilateral loading of metal and acrylic
For the uniform bilateral loading condition, the highest micro-strain value was
identified in the labial area around the left implant on the acrylic surface in the
bucco-lingual direction. Figure 37 is an illustration of a cross-section of the implant
areas of the prosthesis.
Figure 37: Cross-section illustration of the areas around the implants in coronal plane, showing the locations of the micro-strain gauges on the acrylic and metal structures.

67
The lingual side of the left implant showed the next highest micro-strain value in a
similar direction. The areas and directions of micro-strain on the acrylic surface
around the implant during the bilateral uniform loading are shown in figure 38.
Blue represents tension micro-strain and the intensity of the blue is representative
of a higher micro-strain value.
Figure 38: Highest micro-strain value acrylic base recorded on labial side of left implant during bilateral uniform loading
Although areas around both implants showed tension micro-strain in the bucco-
lingual direction, on the right side of the prosthesis the higher micro-strain value
was recorded on the lingual side of the implant. The position of the implant might
have contributed to the change in the micro-strain. However, the area of
maximum micro-strain remains in the bucco-lingual direction on both sides of the
prosthesis, regardless of the position of the implant.
Placing the implant more buccally or more lingually resulted in the placement of
the micro-strain gauges slightly further down the ridge incline on one side. Thus,
one side of the denture came in contact with the soft tissue earlier than the other
side. This is more evident from the graphical output for each of the micro-strain

68
gauges (figure 39 & 40). The micro-strain-time graphs show a change in the slope
of the loading curve at different time points. In the case of gauge 1, contact
occurred after 12 seconds, whereas for gauge 10 this took place after 19 seconds.
This change of slope at initial commencement of loading occurs because of the
contact between the acrylic denture and the underlying soft supporting tissue
which takes place at different times.
Figure 39: Micro-strain-time plot of gauge 1 on buccal side of right implant during bilateral uniform loading
Figure 40: Micro-strain-time plot of gauge 10 on buccal side of left implant during bilateral uniform loading

69
The micro-strain-time plot for gauge 1 shown in figure 41 provides further
information about the micro-strain behaviour during loading, and unloading, as
well as the maximum micro-strain value developed.
Figure 41: Micro-strain-time plot of gauge 1 illustrating pre-loading, loading and unloading micro-strain behaviour during a bilateral uniform loading cycle
The micro-strain is in the bucco-lingual direction around the implant during the
bilateral loading condition. During the loading phase, the micro-strain-time curve
changed its slope just prior to reaching a maximum value during the loading
phase. The contacting of the supporting tissue during the loading phase limited
the flexure of the denture and thereby reduced the gradient of micro-strain with
further increase in load. A possible explanation is that as the load continued to
increase, the prosthesis was in contact with the silicone, and further increase in
load deflected both the acrylic and also the underlying soft tissue resulting in a
lower rate of micro-strain increase.

70
During the unloading phase there was an unusual interruption of micro-strain
identified in the plot graph. A gradual decline of micro-strain values was observed
during the initial unloading stage due to the recovery of the structure as the load
was released. However, an interruption was noted during the unloading stage.
This is consistent with an apparent partial reload during the unloading process.
As indicated above, the acrylic made contact with tissue, so during unloading,
initially the acrylic will recover, and the adhesion of the tissue will add additional
force (the slight rise) before it releases and the flexure of the acrylic is reduced.
In the distal area adjacent to the implant, low micro-strain developed during
bilateral uniform loading, but this area is subjected to higher micro-strain
compared with the mesial area of the distal extension (figure 42).
Figure 42: Micro-strain value on acrylic base around the implant in mesio-distal direction (bilateral uniform loading)

71
Also, when bilateral loading is uniformly applied to the prosthetic posterior teeth,
the material above the implants acts as a load barrier, and as the loading force
increases, this area is subjected to higher micro-strain compared with the mesial
area of the distal extension (figure 43). Since the material above the implant acts as
the primary load support, the distal region to the implant does not develop micro-
strain.
Figure 43: Implant acting as the primary load support point during bilateral uniform loading

72
A simplified schematic illustration of the prosthesis structure is shown in figure 44
to better appreciate the effect of the loading conditions. Rest arms are depicted as
springs, because they can elastically deflect during loading without breaking or
becoming permanently deformed. Vertical displacement is restrained by the two
virtually rigid implants and therefore, the areas around the implants will be
subjected to the most micro-strain. This finding was only evident for bilateral
uniform loading. Micro-strain did occur in the distal area adjacent to the implant
when the bilateral loading was applied to the molar and premolar regions (figure
16 & 17).
Figure 44: A simplified schematic image of IARPD subjected to bilateral uniform loading
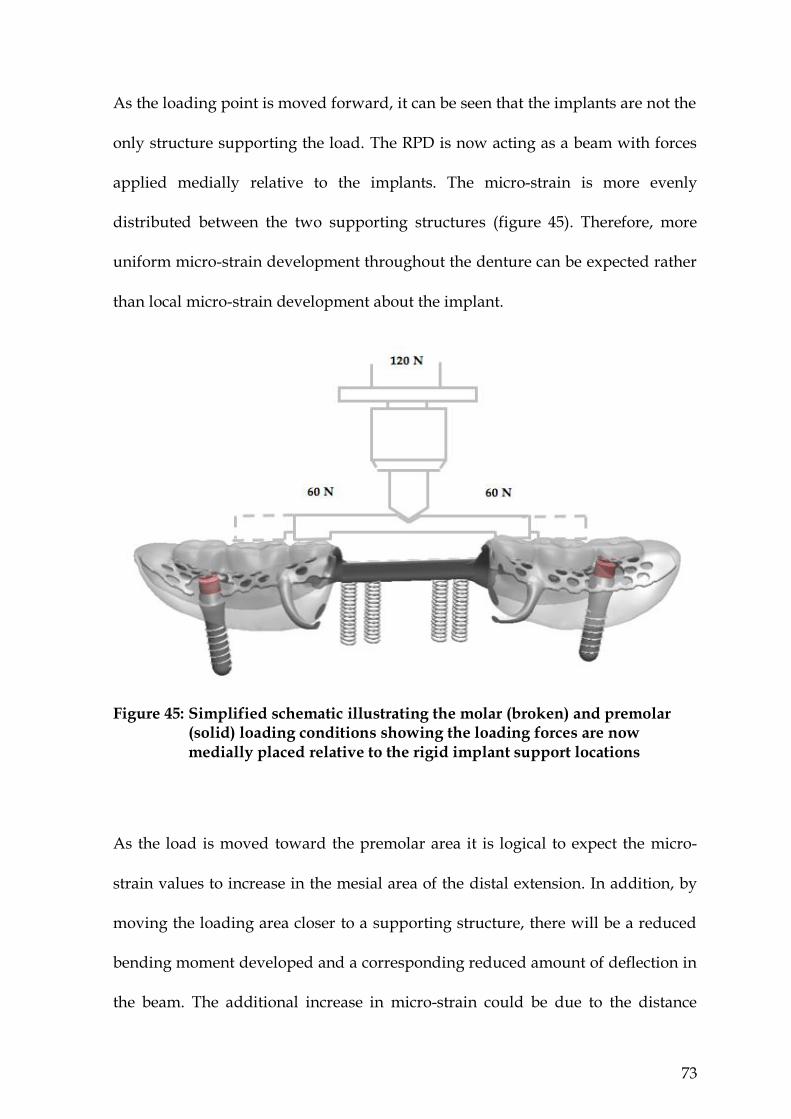
73
As the loading point is moved forward, it can be seen that the implants are not the
only structure supporting the load. The RPD is now acting as a beam with forces
applied medially relative to the implants. The micro-strain is more evenly
distributed between the two supporting structures (figure 45). Therefore, more
uniform micro-strain development throughout the denture can be expected rather
than local micro-strain development about the implant.
Figure 45: Simplified schematic illustrating the molar (broken) and premolar (solid) loading conditions showing the loading forces are now medially placed relative to the rigid implant support locations
As the load is moved toward the premolar area it is logical to expect the micro-
strain values to increase in the mesial area of the distal extension. In addition, by
moving the loading area closer to a supporting structure, there will be a reduced
bending moment developed and a corresponding reduced amount of deflection in
the beam. The additional increase in micro-strain could be due to the distance

74
between the location of the load and the supporting structure and the associated
curvature which creates a greater off-axis lever arm. This lever arm may create
lateral movement, resulting in deflection during the premolar loading in the
bucco-lingual direction (figure 46). Micro-strain values could also be influenced
because of the locations of the micro-strain gauges directly under the premolar
loading areas.
Figure 46: Schematic illustration indicating that premolar loading generates greater off-axis lever arm distance from the line between supporting structures
The direction of the micro-strain in the prosthesis forms in the buccal lingual
direction, which does fit with the beam deflection situation suggested above. If we
assume that the prosthesis is a typical beam because both the implant, and to a
lesser extent the rest, restrain the prosthesis from vertical movement, this should
result in most of the micro-strain expected to develop due to a bending of the
structure in the mesio-distal direction.

75
The reason the typical beam behaviour is not seen is because the acrylic surface is
in contact, especially adjacent to the premolar area, with soft tissue resulting in
micro-strain development due to the additional resistance the tissue presents. The
larger the tissue displacement during loading, the greater the flexural resistance,
and consequently, the higher micro-strains developed about the premolar area of
the acrylic. Figure 47 shows the shape of the cross-sectional area of the prosthesis
in the mesial area of the distal extension.
Figure 47: Cross-sectional image of area around the mesial area of the distal extension in coronal plane with bilateral premolar loading
All high micro-strain values were recorded in the bucco-lingual direction. Bucco-
lingual micro-strain requires a lateral movement of the prosthesis. Since the load is
applied on the acrylic teeth along both sides of the prosthesis, it is expected that
most of the micro-strain develops in the same direction (i.e. mesio-distal
direction). However, the line between the implant and rest (resistance arm) is not

76
in alignment with the loading area (effort arm). Misalignment between the
resistance arm and effort arm could possibly be the cause of lateral movement.
Bilateral loading minimizes lateral displacement through the rest arms, whereas
moving the loading point forward increases the length of effort arm and as a
result, generates greater mechanical advantage (figure 48). As a consequence, less
force is required to displace the prosthesis. Since the loading force is unchanged in
all loading conditions, therefore, the most forward loading condition will cause
the greatest displacement. More displacement will result in larger tissue response
and consequently, greater micro-strain on the acrylic surface. This series of events
leads to having higher micro-strain values in the bucco-lingual direction, which
move in a more anterior direction as the load moves forward.
Figure 48: Moving the loading point forward will increase the ratio of the effort arm to resistance arm
For bilateral premolar loading, on the other hand, as the load was moved forward
the micro-strain also increased anteriorly, while the micro-strain values around
the implant decreased to almost half of their values under similar loading

77
conditions. Thus, a considerable amount of micro-strain still developed around
the area of the implants in the bucco-lingual direction, despite the forward
movement of the loading condition (figure 49).
Figure 49: Highest micro-strain values were recorded in mesial area of the distal extension on the acrylic base under bilateral premolar loading
The micro-strain measured on the metal surface showed a somewhat different
behaviour when bilaterally loaded. Under all of the three loading conditions
investigated, the highest micro-strain values were evident around the mesial area
of the distal extension in the bucco-lingual direction (figure 50).
Figure 50: Highest micro-strain values were recorded in the mesial area of the distal extension in the metal framework for all three bilateral loading conditions

78
Moving the loading area forward did not influence the micro-strain in the metal
surface around the implant. This is understandable as the metal structure did not
have direct contact with the implant but did have support from contact via the
rests placed on the abutment teeth. Hence, the rest arms supported the metal
structure and upon loading, the areas close to the rest arm were subjected to a
high level of micro-strain.
The micro-strain values recorded in the molar loading condition were more evenly
distributed between the metal and acrylic surfaces with the tensile micro-strain
values being similar for both (figure 51 a & b).
Figure 51: Bilateral molar loading; (a) Micro-strain values around the implants and
mesial areas of the distal extensions on acrylic base (b) Micro-strain values around the mesial areas of the distal extension on the metal framework
The metal and acrylic surfaces are in very close contact and thus act as if they are
bonded together. Acrylic is thus reinforced by the metal structure, which is placed
1 mm above the lower face of the acrylic, when the acrylic beam is subjected to a
positive bending moment. As acrylic is weak in tension and has low elastic
modulus, most of the flexural tensile forces are preferably carried by the metal
structure, while the upper part of the acrylic beam will be exposed to the
compressive load. Therefore, the neutral axis of the saddle will be influenced by
(b) (b)
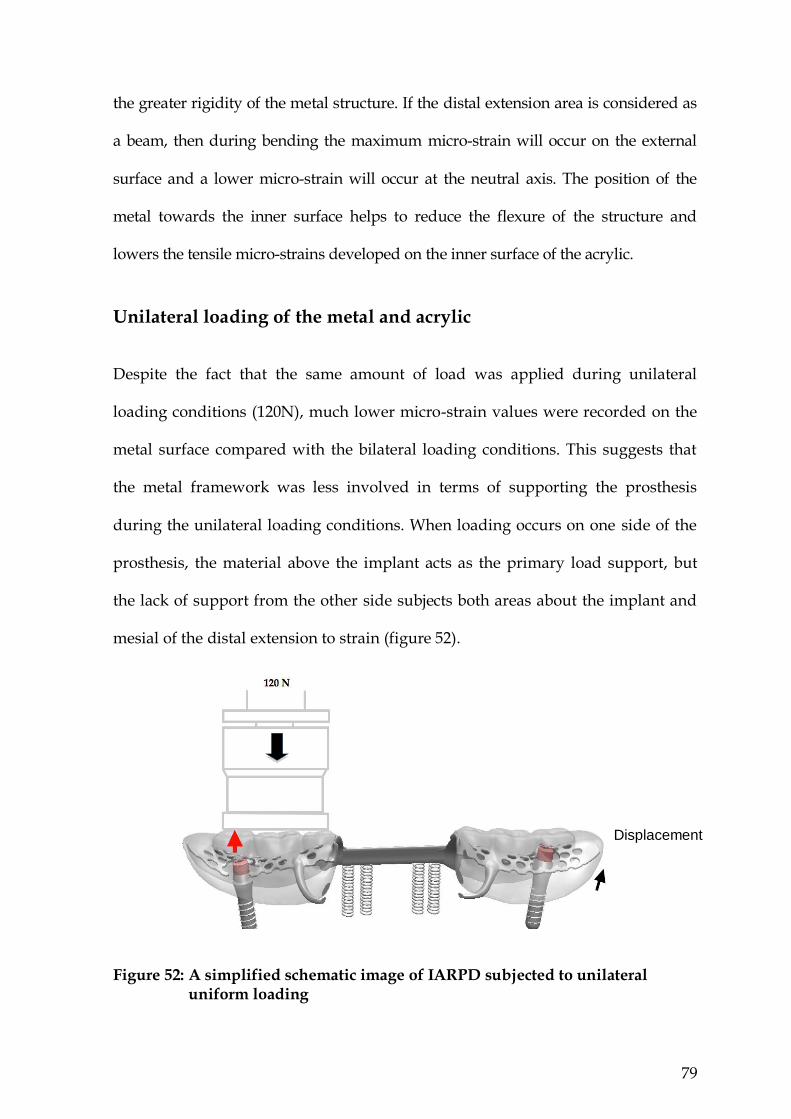
79
the greater rigidity of the metal structure. If the distal extension area is considered as
a beam, then during bending the maximum micro-strain will occur on the external
surface and a lower micro-strain will occur at the neutral axis. The position of the
metal towards the inner surface helps to reduce the flexure of the structure and
lowers the tensile micro-strains developed on the inner surface of the acrylic.
Unilateral loading of the metal and acrylic
Despite the fact that the same amount of load was applied during unilateral
loading conditions (120N), much lower micro-strain values were recorded on the
metal surface compared with the bilateral loading conditions. This suggests that
the metal framework was less involved in terms of supporting the prosthesis
during the unilateral loading conditions. When loading occurs on one side of the
prosthesis, the material above the implant acts as the primary load support, but
the lack of support from the other side subjects both areas about the implant and
mesial of the distal extension to strain (figure 52).
Figure 52: A simplified schematic image of IARPD subjected to unilateral
uniform loading
Displacement
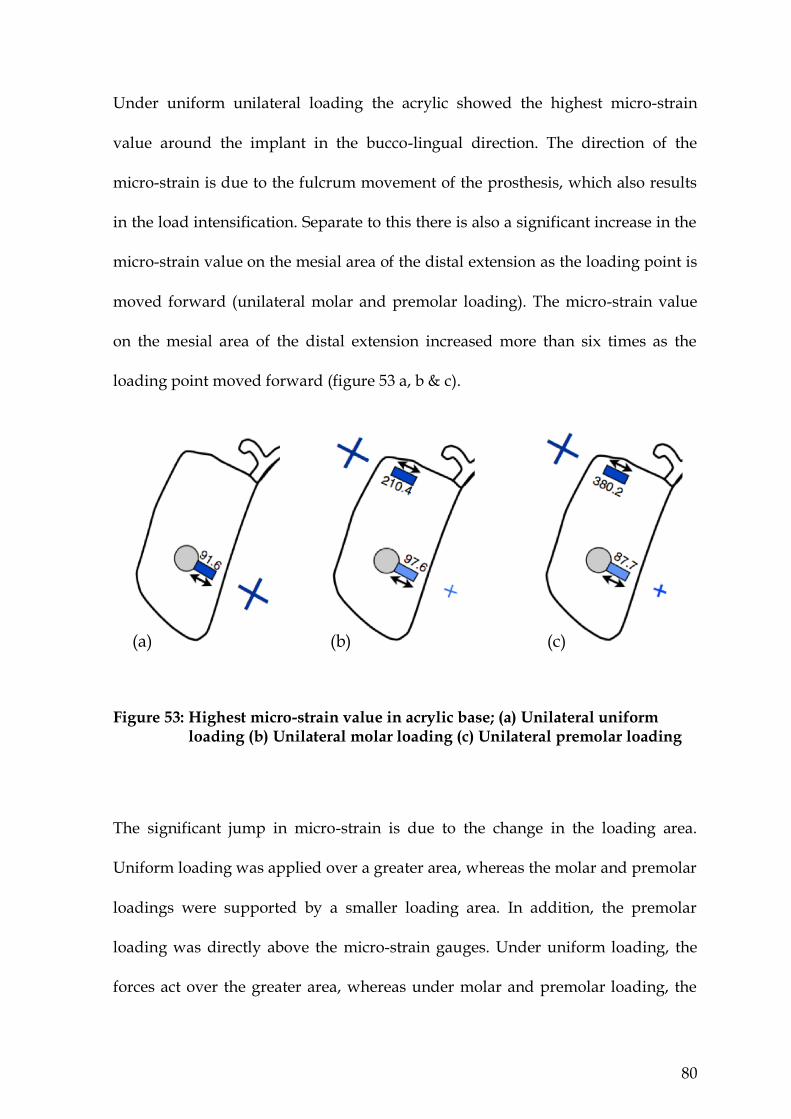
80
Under uniform unilateral loading the acrylic showed the highest micro-strain
value around the implant in the bucco-lingual direction. The direction of the
micro-strain is due to the fulcrum movement of the prosthesis, which also results
in the load intensification. Separate to this there is also a significant increase in the
micro-strain value on the mesial area of the distal extension as the loading point is
moved forward (unilateral molar and premolar loading). The micro-strain value
on the mesial area of the distal extension increased more than six times as the
loading point moved forward (figure 53 a, b & c).
Figure 53: Highest micro-strain value in acrylic base; (a) Unilateral uniform loading (b) Unilateral molar loading (c) Unilateral premolar loading
The significant jump in micro-strain is due to the change in the loading area.
Uniform loading was applied over a greater area, whereas the molar and premolar
loadings were supported by a smaller loading area. In addition, the premolar
loading was directly above the micro-strain gauges. Under uniform loading, the
forces act over the greater area, whereas under molar and premolar loading, the
(a) (b) (c)

81
forces act over smaller areas and for the premolar loading condition the load is
directly above the micro-strain gauges. This is very similar to the bilateral loading
with the only difference being that the implant and the rest on one side act as the
primary support structures (figure 54).
Figure 54: Simplified schematic illustrating the molar and premolar loading condition showing the loading forces are now medially positioned relative to the rigid implant support.
The micro-strain in the metal surface exhibited a different behaviour during
unilateral premolar loading. As the loading point moved forward, the location of
the highest micro-strain remained in the mesial area of the distal extension, similar
to bilateral loading but with a different micro-strain outcome. This may be related
to the lateral movement of the prosthesis causing more micro-strains on the
implant as the rest is displaced away from the tooth. This lateral movement may

82
have contributed to the type of micro-strain that was recorded on the metal
surface, which was compression rather than tension (figure 55 a, b & c).
Figure 55: Highest micro-strain value area on metal framework; (a) Unilateral
uniform loading (b) Unilateral molar loading (c) Unilateral premolar loading
A combination of lateral movement and vertical displacement may possibly be
responsible for the different micro-strain behaviour on the metal structure during
unilateral loading compared with bilateral loading. The nature of bilateral loading
gives the prosthesis more vertical stability despite lateral movement, whereas
unilateral loading can induce vertical and lateral displacement at the same time.
Figure 56 illustrates such a different effect of unilateral versus bilateral loading.
The distance between the location of the load and supporting structure and the
curvature associated with the dental arch may create lateral movement. This
indicates that premolar loading generates a greater off-axis lever arm distance
from the line between supporting structures for both bilateral and unilateral
loading. However, simultaneous loading of both sides in the case of bilateral
loading gives more stability and consequently generates more micro-strain to the
area about the rest arm, whereas during unilateral loading the load response can
displace the whole prosthesis laterally as well as vertically. Since ball attachments
(b) (b) (c)

83
provide retention and lateral resiliency, loading one side displaces the whole
prosthesis, especially the rear portion of the prosthesis on the non-loaded side.
Therefore, the rest arm on the loaded side will no longer act as a vertical support
but rather act as a fulcrum point during displacement and allow twisting or
torsion of the metal structure. Since the attachment remains the major structure
that provides retention and in addition resists displacement, it is expected most
micro-strain will be developed around the implant during the twisting effect.
However, the metal structure is not in contact with the implant and twisting of the
very rigid lingual bar will have an influence, resulting in a compressive micro-
strain being developed on the metal surface. In contrast twisting will increase the
tissue response against the acrylic and result in much greater tension on the
external surface of the acrylic, as mentioned previously. Therefore, as the load
moves forward, the effect of twisting becomes greater and results in greater
compressive micro-strains occurring around the mesial area of the distal
extension.
Figure 56: Effect of unilateral loading conditions on metal framework
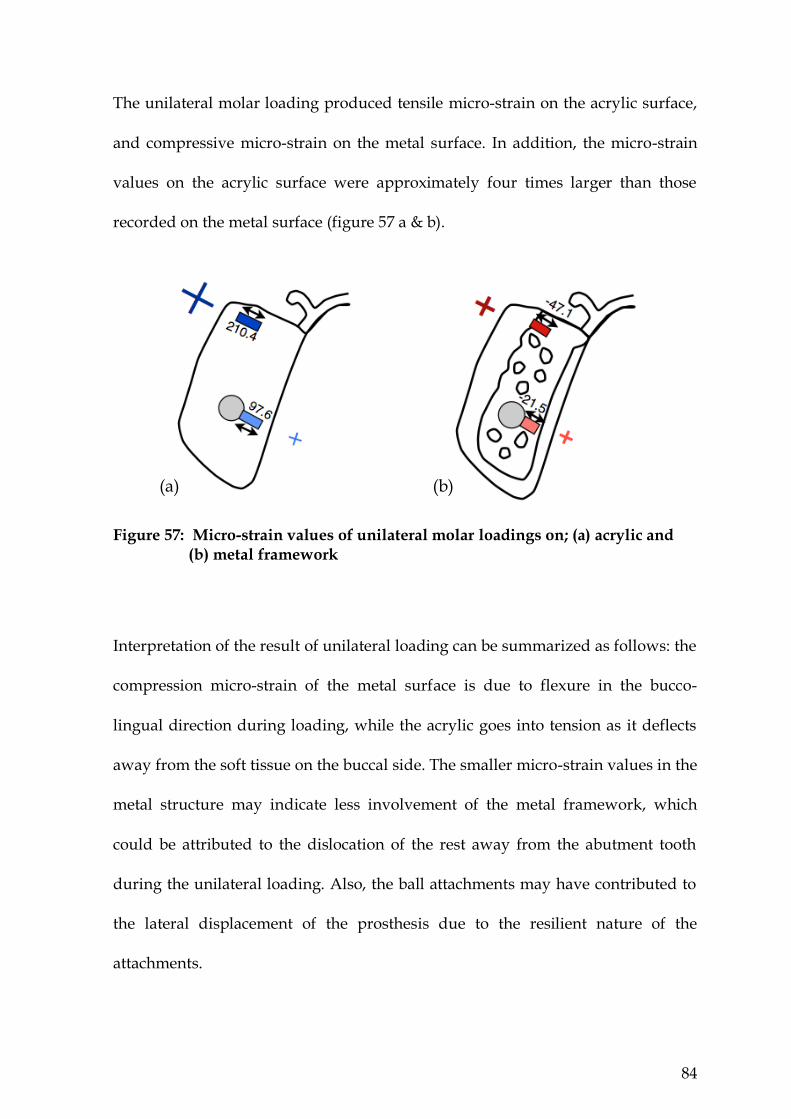
84
The unilateral molar loading produced tensile micro-strain on the acrylic surface,
and compressive micro-strain on the metal surface. In addition, the micro-strain
values on the acrylic surface were approximately four times larger than those
recorded on the metal surface (figure 57 a & b).
Figure 57: Micro-strain values of unilateral molar loadings on; (a) acrylic and
(b) metal framework
Interpretation of the result of unilateral loading can be summarized as follows: the
compression micro-strain of the metal surface is due to flexure in the bucco-
lingual direction during loading, while the acrylic goes into tension as it deflects
away from the soft tissue on the buccal side. The smaller micro-strain values in the
metal structure may indicate less involvement of the metal framework, which
could be attributed to the dislocation of the rest away from the abutment tooth
during the unilateral loading. Also, the ball attachments may have contributed to
the lateral displacement of the prosthesis due to the resilient nature of the
attachments.
(a) (b)
85
The fact that the metal framework had no contact with the implant could also
explain the different response of the materials to load. This may play a part in the
lateral displacement of the prosthesis during unilateral loading.
A combination of all three planes of rotation; sagittal, coronal and horizontal in
tooth-tissue supported a distal extension RPD cause dynamic movement of RPD
(Carr et al., 2011). The IARPD showed a small micro-strain generated in the mesio-
distal direction that indicates small movement of IARPD in the sagittal plane.
However, high micro-strain values were generated in the bucco-lingual directions
that indicate that rotation in the coronal plane still exists. Combinations of rotation
in the frontal (rotation around a longitudinal axis) and horizontal (rotation around
a vertical axis near the centre of the arch) planes are identified in unilateral
loading conditions.

86
Chapter Six
Summary
The IARPD showed small micro-strain generation in the mesio-distal direction.
However, high micro-strain values were generated in the bucco-lingual direction,
highlighting rotation in the coronal plane (longitudinal axis).
Bilateral loading showed more favourable micro-strain on the IARPD structure.
As acrylic is weak in tension and has a low elastic modulus, most of the flexural
tensile forces are preferably carried by the metal structure, while the upper part of
the acrylic beam will be exposed to the compressive load. Therefore, the neutral
axis of the saddle is influenced by the greater rigidity of the metal structure.
During loading, the metal framework helps reduce the flexure of the structure and
lowers the tensile micro-strain developed on the inner surface of the acrylic.
Bilateral loading also provides more stability and consequently generates more
micro-strain on the rest arms.
During unilateral loading of an IARPD the curvature of the dental arch created
displacement laterally as well as vertically. When the premolar region is loaded an
off-axis lever arm is created. Therefore, the rest arm on the same side as the
loading became a fulcrum point during displacement and caused twisting/torsion
of the metal structure. As the load moved toward the mesial of the distal
extension, the effect of twisting became greater. Since the implant attachment
provides retention and additional resistance to displacement, most of the micro-
strain was transferred to the areas surrounding the mesial of distal extension. The

87
twisting also increased the tissue response against the acrylic and resulted in
greater tension on the external surface of the acrylic. The metal structure is not in
contact with the implant and twisting of the rigid lingual bar resulted in
compressive micro-strain being developed on the metal surface.
In both unilateral and bilateral loading conditions, as the loading point moved
forward the maximum micro-strain value moved forward in the acrylic base,
whereas maximum micro-strain values remained in mesial area of the distal
extension on the metal framework regardless of the loading condition.
88
Conclusions
Lateral movement/displacement was evident during bilateral and unilateral
loading of the IARPD and this resulted in high micro-strains values in the bucco-
lingual direction and small micro-strain in the mesio-distal direction.
When looking at the maximum micro-strain values of the IARPD molar bilateral
loading produced the lowest value on both metal framework and acrylic base,
with a less destructive micro-strain dynamic developed between the metal
framework and acrylic base (both acrylic base and metal framework in tension).
When looking at the maximum micro-strain values of the IARPD uniform
unilateral loading produced the lowest value on both metal framework and acrylic
base. However, a destructive micro-strain dynamic developed between the
framework and acrylic base (acrylic base in tension and metal framework in
compression).
89
Recommendations
1) When considering that an implant may be incorporated into a RPD at a
later stage, consideration should be given to the rigidity of the appliance.
2) The micro-strain patterns indicated in this research draws attention to the
need for further studies to properly determine the ideal design of a RPD
that is converted to a IARPD
90
References
Bakke M, Holm B, Gotfredsen K (2002). Masticatory function and patient
satisfaction with implant-supported mandibular overdentures: a prospective 5-
year study. International Journal of Prosthodontics 15(6):575-581.
Bergman B, Hugoson A, Olsson CO (1982). Caries, periodontal and prosthetic
findings in patients with removable partial dentures: a ten-year longitudinal
study. Journal of Prosthetic Dentistry 48(5):506-514.
Brudvik JS (1999). Advanced removable partial dentures. Chicago: Quintessence
Pub. Co.
Campbell RL (1960). A comparative study of the resorption of the alveolar ridges
in denture-wearers and non-denture-wearers. Journal of American Dental
Association 60(Feb):143-153.
Carlsson GE (1998). Clinical morbidity and sequelae of treatment with complete
dentures. Journal of Prosthetic Dentistry 79(1):17-23.
Carr AB, Brown DT, McGivney GP (2011). McCracken`s removable
prosthodontics. 12th ed. St. Louis: Elsevier Mosby.
Chikunov I, Doan P, Vahidi F (2008). Implant-retained partial overdenture with
resilient attachments. Journal of Prosthodontics 17(2):141-148.
Cho HW (2002). Load transfer by distal extension RPD with implant assisted
support. Journal of Dental Research 81 (Special Issue A):A-156.
91
Cibirka R, Razzoog M, Lang B, Stohler C (1992). Determining the force absorption
quotient for restorative materials used in implant occlusal surfaces. Journal of
Prosthetic Dentistry 67(3):361- 364.
Crum RJ, Rooney JR (1978). Alveolar bone loss in overdentures: A 5 year study.
Journal of Prosthetic Dentistry 40(6):610-613.
Cunha LD, Pellizzer EP, Verri FR, Pereira JA (2008). Evaluation of the influence of
location of osseointegrated implants associated with mandibular removable
partial dentures. Implant Dentistry 17(3):278-287.
Dally JW, Riley WF (1965). Experimental stress analysis New York: McGraw-Hill,
Inc.
Douglass CW, Watson AJ (2002). Future needs for fixed and removable partial
dentures in the United States. Journal of Prosthetic Dentistry 87(1):9-14.
Eliason CM (1983). RPA clasp design for distal-extension removable partial
dentures. Journal of Prosthetic Dentistry 49(1):25-27.
Ettinger RL, Taylor TD, Scandrett FR (1984). Treatment needs of overdenture
patients in a longitudinal study: five-year results. Journal of Prosthetic Dentistry
52(4):532-537.
Ettinger RL (1988). Tooth loss in an overdenture population. Journal of Prosthetic
Dentistry 60(4):459-462.
Fields H, Jr., Campfield RW, Jr. (1974). Removable partial prosthesis partially
supported by an endosseous blade implant. Journal of Prosthetic Dentistry 31(3):273-
278.
92
Geurs NC, Vassilopoulos PJ, Reddy MS (2010). Soft tissue considerations in
implant site development. Oral and Maxillofacial Surgery Clinics of North America
22(3):387-405.
Goodman JJ (1963). Balance of force in precision free-end restorations. Journal of
Prosthetic Dentistry 13 (2):302-308.
Grossmann Y, Nissan J, Levin L (2009). Clinical effectiveness of implant-supported
removable partial dentures - a review of the literature and retrospective case
evaluation. Journal of Oral and Maxillofacial Surgery 67(9):1941-1946.
Halterman S, Rivers J, Keith J, Nelson D (1999). Implant support for removable
partial overdentures: A case report. Implant Dentistry 8(1):74-78.
Hindels GW (2001). Load distribution in extension saddle partial dentures. Journal
of Prosthetic Dentistry 85(4):324-329.
Igarashi Y, Ogata A, Kuroiwa A, Wang CH (1999). Stress distribution and
abutment tooth mobility of distal-extension removable partial dentures with
different retainers: an in vivo study. Journal of Oral Rehabilitation 26(2):111-116.
Imai Y, Sato T, Mori S, Okamoto M (2002). A histomorphometric analysis on bone
dynamics in denture supporting tissue under continuous pressure. Journal of Oral
Rehabilitation 29(1):72-79.
Itoh H, Sasaki T, Nakahara H, Katsube T, Satoh M, Matyas J et al. (2007). Load
transmission by distal extension RPD with implant assisted support. Journal of
Dental Research 86 (Special Issue A):1476
93
Jambhekar S, Kheur M, Kothavade M, Dugal R (2010). Occlusion and occlusal
consideration in implantology. Indian Journal of Dental Advancements 2(1):125-130.
Jepson NJ, Thomason JM, Steele JG (1995). The influence of denture design on
patient acceptance of partial dentures. British Dental Journal 178(8):296-300.
Jozefowicz W (1970). The influence of wearing dentures on residual ridges: A
comparative study. Journal of Prosthetic Dentistry 24(2):137-144.
Kapur KK (1991). Veterans Administration Cooperative Dental Implant Study-
comparisons between fixed partial dentures supported by blade-vent implants
and removable partial dentures. Part IV: Comparisons of patient satisfaction
between two treatment modalities. Journal of Prosthetic Dentistry 66(4):517-530.
Kelly E (2003). Changes caused by a mandibular removable partial denture
opposing a maxillary complete denture. Journal of Prosthetic Dentistry 90(3):213-
219.
Keltjens HM, Kayser AF, Hertel R, Battistuzzi PG (1993). Distal extension
removable partial dentures supported by implants and residual teeth:
considerations and case reports. International Journal of Oral & Maxillofacial Implants
8(2):208-213.
Krol AJ (1973). Clasp design for extension-base removable partial dentures. Journal
of Prosthetic Dentistry 29(4):408-415.
Lacerda TESP, Lagana DC, Gonzalez-Lima R, Zanetti AL (2005). Contribution to
the planning of implant-supported RPD in the distal region. Revista de Pos-
Graduaco 12(3):293-300.
94
Lum LB (1991). A biomechanical rationale for the use of short implants. Journal of
Oral Implantology 17(2):126-131.
Manderson RD, Wills DJ, Picton DCA Biomechanics of denture-supporting
tissues. Proceedings of the Second International Prosthodontic Congress, 1979, St.
Louis: The C. V. Mosby Co.
Mijiritsky E, Ormianer Z, Klinger A, Mardinger O (2005). Use of dental implants to
improve unfavorable removable partial denture design. Compendium of Continuing
Education in Dentistry 26(10):744-746.
Mijiritsky E (2007). Implants in conjunction with removable partial dentures: a
literature review. Implant Dentistry 16(2):146-154.
Mijiritsky E, Ben Ur Z, Shershevsky A, Brosh T (2007). Mechanical behavior of
major connectors part 2: influence of denture teeth height and loading direction.
Refuat Hapeh Vehashinayim 24(2):27-31, 70.
Mitrani R, Brudvik JS, Phillips KM (2003). Posterior implants for distal extension
removable prostheses: a retrospective study. International Journal of Periodontics and
Restorative Dentistry 23(4):353-359.
Miyaura K, Morita M, Matsuka Y, Yamashita A, Watanabe T (2000). Rehabilitation
of biting abilities in patients with different types of dental prostheses. Journal of
Oral Rehabilitation 27(12):1073-1076.
Mizuuchi W, Yatabe M, Sato M, Nishiyama A, Ohyama T (2002). The effects of
loading locations and direct retainers on the movements of the abutment tooth
and denture base of removable partial dentures. Journal of Medical and Dental
Sciences 49(1):11-18.

95
Monteith BD (1984). Management of loading forces on mandibular distal-
extension prostheses. Part I: Evaluation of concepts for design. Journal of Prosthetic
Dentistry 52(5):673-681.
Mori S, Sato T, Hara T, Nakashima K, Minagi S (1997). Effect of continuous
pressure on histopathological changes in denture-supporting tissues. Journal of
Oral Rehabilitation 24(1):37-46.
Ohara K, Sato T, Imai Y, Hara T (2001). Histomorphometric analysis on bone
dynamics in denture supporting tissue under masticatory pressure in rat. Journal of
Oral Rehabilitation 28(7):695-701.
Ohkubo C, Kurihara D, Shimpo H, Suzuki Y, Kokubo Y, Hosoi T (2007). Effect of
implant support on distal extension removable partial dentures: in vitro
assessment. Journal of Oral Rehabilitation 34(1):52-56.
Ohkubo C, Kobayashi M, Suzuki Y, Hosoi T (2008). Effect of implant support on
distal-extension removable partial dentures: in vivo assessment. International
Journal of Oral & Maxillofacial Implants 23(6):1095-1101.
Orr S, Linden GJ, Newman HN (1992). The effect of partial denture connectors on
gingival health. Journal of Clinical Periodontology 19(8):589-594.
Palmqvist S, Carlsson GE, Owall B (2003). The combination syndrome: A literature
review. Journal of Prosthetic Dentistry 90(3):270-275.
Payne A, Solomons YF (2000). The prosthodontic maintenance requirements of
mandibular mucosa-and implant-supported overdentures: A review of the
literature. International Journal of Prosthodontics 13(3):238-243.
96
Payne A, Kuzmanovic DV, De Silva KR, van Staden IP (2006). Mandibular
removable partial dentures supported by implants: One-year prosthodontic
outcomes. Jornal of Dental Research 85 (Special Issue B):Poster 2570.
Pellizzer EP, Luersen MA, Rocha EP (2003). Finite element analysis of masticatory
force in distal-extension removable partial denture associated with a implant.
Journal of Dental Research 82 (Special Issue B):B-254.
Pellizzer EP, Lucas LVM, Rocha EP, Verri FR, Pereira JR, Braz DB (2004). Influence
of bite force in RPD associated with osseointegrated implant. Journal of Dental
Research 83 (Suppl 1):124-128.
Pellizzer EP, Verri FR, Falcon-Antenucci RM, Goiato MC, Gennari Filho H (2010).
Evaluation of different retention systems on a distal extension removable partial
denture associated with an osseointegrated implant. Journal of Craniofacial Surgery
21(3):727-734.
Pond LH, Barghi N, Barnwell GM (1986). Occlusion and chewing side preference.
Journal of Prosthetic Dentistry 55(4):498-500.
Renner RP, Boucher LJ (1987). Removable partial dentures. Chicago: Quintessence
Pub. Co.
Renner RP (1990). Removable partial overdentures. Dental Clinics of North America
34(4):593-606.
Rissin L, Feldman RS, Kapur KK, Chauncey HH (1985). Six-year report of the
periodontal health of fixed and removable partial denture abutment teeth. Journal
of Prosthetic Dentistry 54(4):461-467.

97
Rocha EP, Luersen MA, Pellizzer EP (2003). Distal extension removable partial
denture associated with an osseointegrated implant. Study by the finite element
method. Journal of Dental Research 82 (Special Issue B):B-254.
Salvador MCG, Valle AL, Ribeiro MCM, Pereira JR (2007). Assessment of the
prevalence index on designs of combination syndrome in patients treated at Bauru
School of Dentistry, University of Sao Paulo. Journal of Applied Oral Science 15(1):9-
13.
Santos CMDF, Pellizzer EP, Rocha EP (2006). Influence of osseointegrated implant
angulation associated with mandibular RPD. Journal of Dental Research 85 (Special
Issue B):0017.
Shahmiri RA, Atieh MA (2010). Mandibular Kennedy Class I implant-tooth-borne
removable partial denture: a systematic review. Journal of Oral Rehabilitation
37(3):225-234.
Shahmiri RA, Atieh MA (2011). Attachments in implant-assisted removable partial
dentures: A design dilemma. International Poster Journal of Dental Oral Medicine
13(1):Poster 515.
Stern N, Brayer L (1975). Collapse of the occlusion-aetiology, symptomatology and
treatment. Journal of Oral Rehabilitation 2(1):1-19.
Tolstunov L (2007). Combination syndrome: classification and case report. Journal
of Oral Implantology 33(3):139-151.
Vahidi F (1978). Vertical displacement of distal-extension ridges by different
impression techniques. Journal of Prosthetic Dentistry 40(4):374-377.

98
van Kampen FM, van der Bilt A, Cune MS, Bosman F (2002). The influence of
various attachment types in mandibular implant-retained overdentures on
maximum bite force and EMG. Journal of Dental Research 81(3):170-173.
Verri FR, Pellizzer EP, Rocha EP, Pereira JA (2007). Influence of length and
diameter of implants associated with distal extension removable partial dentures.
Implant Dentistry 16(3):270-280.
Watson BW (2008). Bonded electrical resistance strain gages. In: Springer
handbook of experimental solid mechanics. New York: Springer Science.
Watt DM, MacGregor AR (1984). Designing partial dentures. Bristol: Wright.
Wetherell JD, Smales RJ (1980). Partial denture failures: a long-term clinical
survey. Journal of Dentistry 8(4):333-340.
Wismeijer D, van Waas MAJ, Kalk W (1995). Factors to consider in selecting an
occlusal concept for patients with implants in the edentulous mandible. Journal of
Prosthetic Dentistry 74(4):380-384.
Witter DJ, De Haan AF, Kayser AF, Van Rossum GM (1994). A 6-year follow-up
study of oral function in shortened dental arches. Part II: Craniomandibular
dysfunction and oral comfort. Journal of Oral Rehabilitation 21(4):353-366.
Zarb GA (1978). Prosthodontic treatment for partially edentulous patients St.
Louis: Mosby.

99
Appendix 1

100

101

102
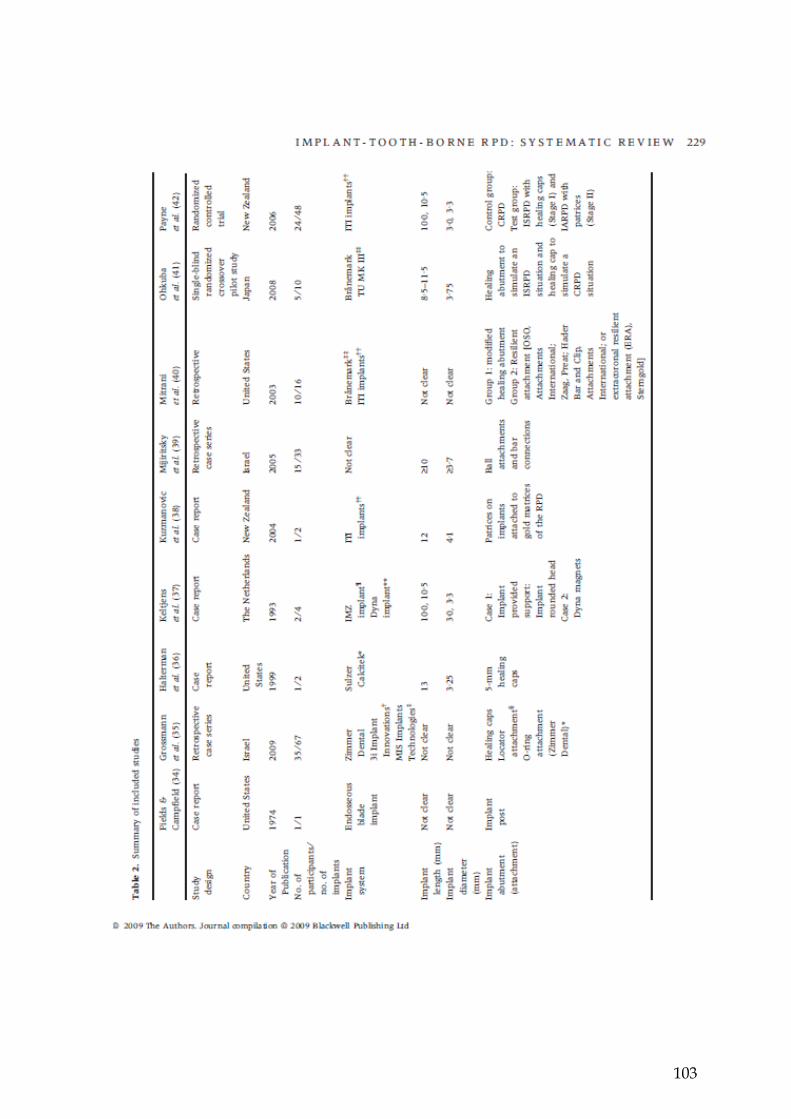
103

104
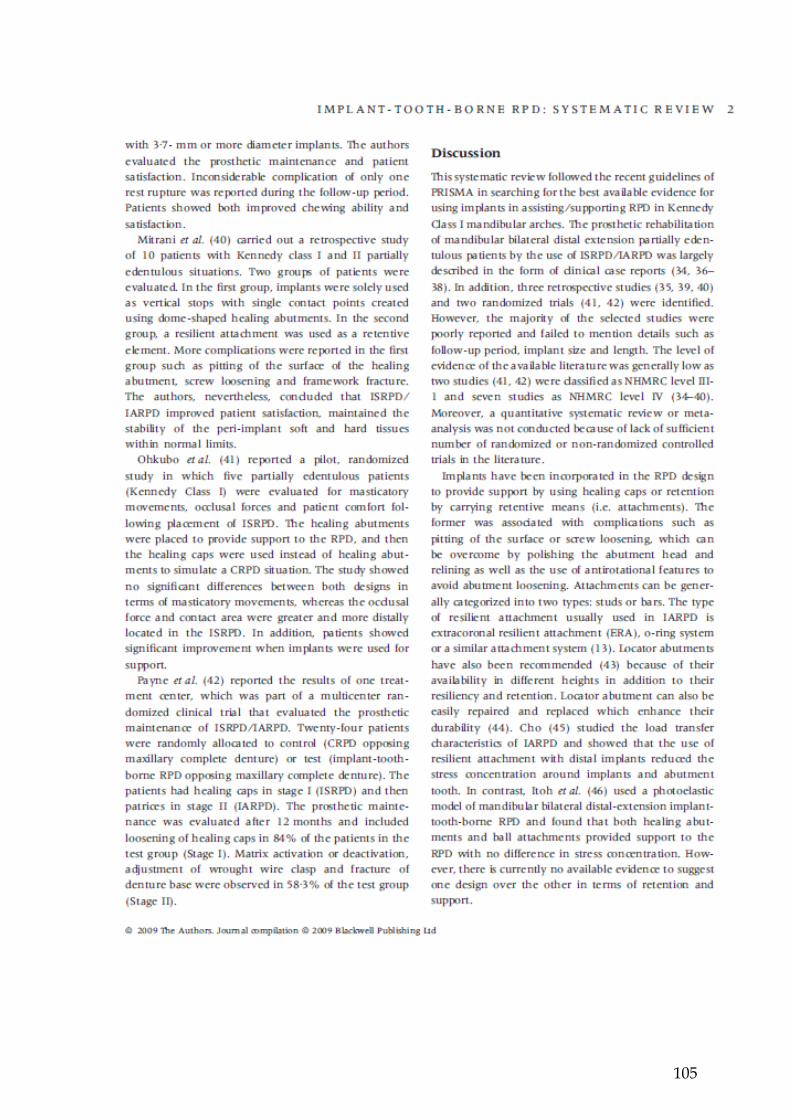
105

106

107

108

109
Appendix 2
Appendix 3
Int Poster J Dent Oral Med • ISSN 1612-7749
International Poster Journal of Dentistry and Oral Medicine
International Poster Journal of Dentistry and Oral Medicine
Int Poster J Dent Oral Med 13 (2011), No. 1 (15.03.2011)
Int Poster J Dent Oral Med 2011, Vol 13 No 1, Poster 515
Attachments in Implant-Assisted Removable
Partial Dentures: A Design Dilemma
Authors: Reza A. Shahmiri, Dr Momen A. Atieh,
Sir John Walsh Research Institute, School of dentistry, University of Otago, New Zealand
Date/Event/Venue: 15-17 April 2010
ITI World Symposium
Geneva, Switzerland
110
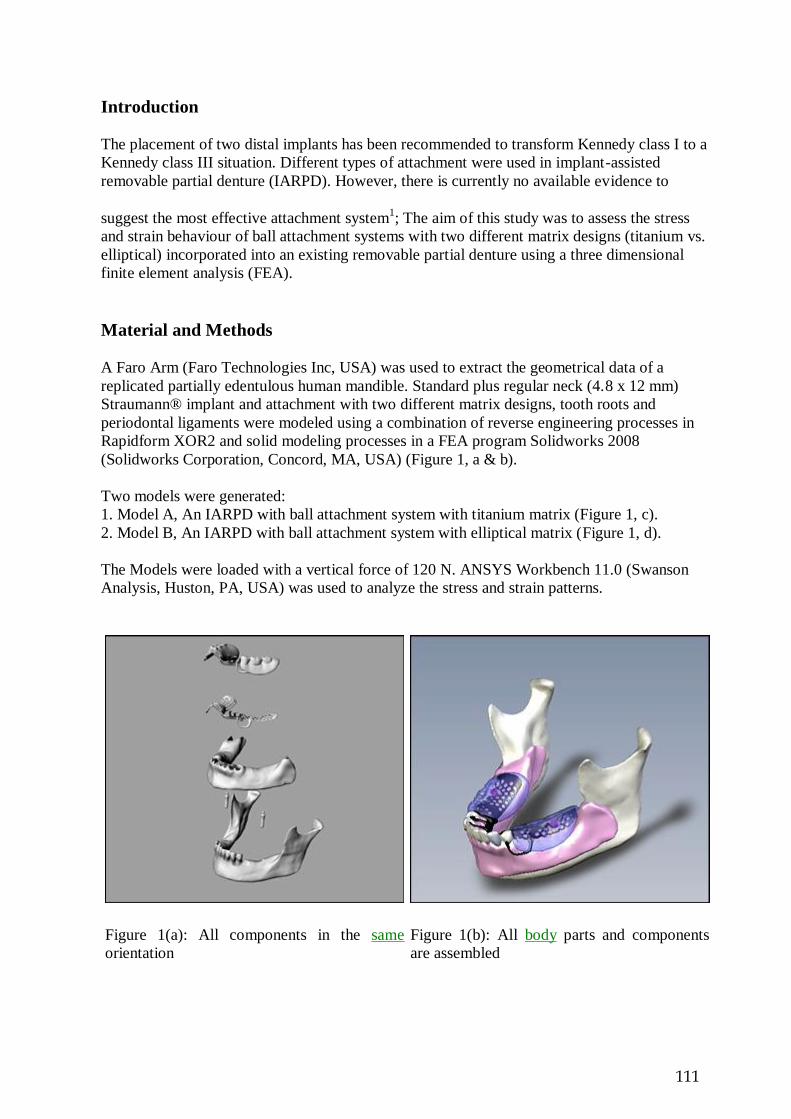
Introduction
The placement of two distal implants has been recommended to transform Kennedy class I to a
Kennedy class III situation. Different types of attachment were used in implant-assisted
removable partial denture (IARPD). However, there is currently no available evidence to
suggest the most effective attachment system1; The aim of this study was to assess the stress
and strain behaviour of ball attachment systems with two different matrix designs (titanium vs.
elliptical) incorporated into an existing removable partial denture using a three dimensional
finite element analysis (FEA).
Material and Methods
A Faro Arm (Faro Technologies Inc, USA) was used to extract the geometrical data of a
replicated partially edentulous human mandible. Standard plus regular neck (4.8 x 12 mm)
Straumann® implant and attachment with two different matrix designs, tooth roots and
periodontal ligaments were modeled using a combination of reverse engineering processes in
Rapidform XOR2 and solid modeling processes in a FEA program Solidworks 2008
(Solidworks Corporation, Concord, MA, USA) (Figure 1, a & b).
Two models were generated:
1. Model A, An IARPD with ball attachment system with titanium matrix (Figure 1, c).
2. Model B, An IARPD with ball attachment system with elliptical matrix (Figure 1, d).
The Models were loaded with a vertical force of 120 N. ANSYS Workbench 11.0 (Swanson
Analysis, Huston, PA, USA) was used to analyze the stress and strain patterns.
Figure 1(a): All components in the same
orientation
Figure 1(b): All body parts and components
are assembled
111
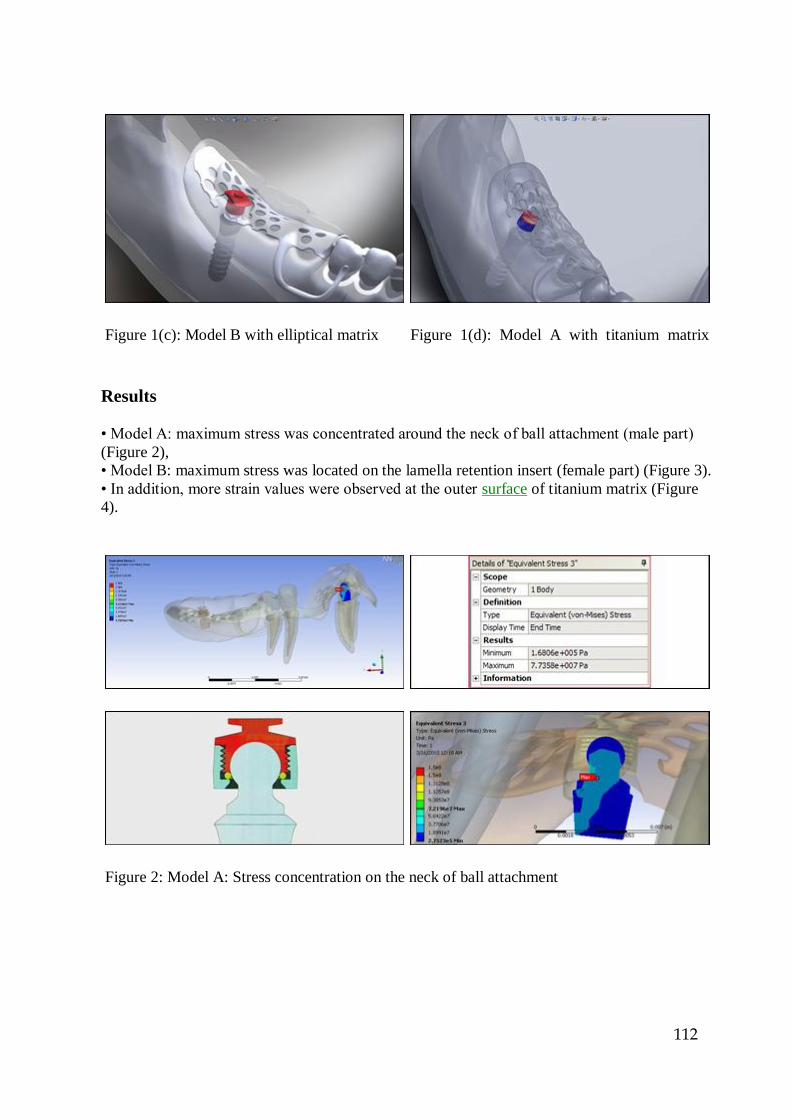
Figure 1(c): Model B with elliptical matrix Figure 1(d): Model A with titanium matrix
Results
• Model A: maximum stress was concentrated around the neck of ball attachment (male part)
(Figure 2),
• Model B: maximum stress was located on the lamella retention insert (female part) (Figure 3).
• In addition, more strain values were observed at the outer surface of titanium matrix (Figure
4).
Figure 2: Model A: Stress concentration on the neck of ball attachment
112

Figure 3: Model B: Stress concentration on the lamella retention insert
Figure 4: Higher strain value were observed on Ti matrix (Model A)
Discussion
Ball attachments has been used to provide retention and support of IARPD2 as well as reducing
stress concentration around implants and abutment teeth. However, acrylic fracture of IARPD
bases was one of the most commonly reported complications3. In this study, FEA was used to
evaluate the stress-strain patterns of two matrix designs incorporated into the same acrylic base.
Elliptical matrix showed a more favourable stress-strain behaviour compared to the titanium
matrix. The maximum stress concentration of the elliptical matrix was located on the lamella
retention insert, which acted as a stress breaker. Hence, the stress transfer to the ball attachment
113
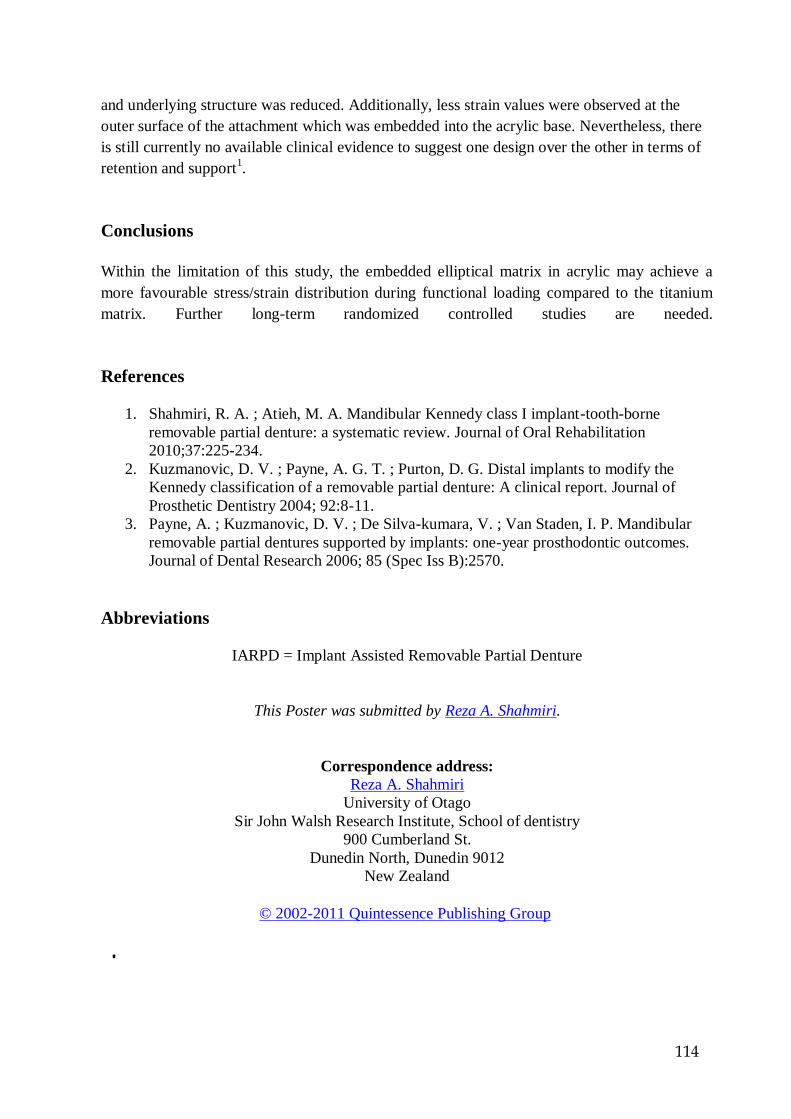
and underlying structure was reduced. Additionally, less strain values were observed at the
outer surface of the attachment which was embedded into the acrylic base. Nevertheless, there
is still currently no available clinical evidence to suggest one design over the other in terms of
retention and support1.
Conclusions
Within the limitation of this study, the embedded elliptical matrix in acrylic may achieve a
more favourable stress/strain distribution during functional loading compared to the titanium
matrix. Further long-term randomized controlled studies are needed.
References
1. Shahmiri, R. A. ; Atieh, M. A. Mandibular Kennedy class I implant-tooth-borne
removable partial denture: a systematic review. Journal of Oral Rehabilitation
2010;37:225-234.
2. Kuzmanovic, D. V. ; Payne, A. G. T. ; Purton, D. G. Distal implants to modify the
Kennedy classification of a removable partial denture: A clinical report. Journal of
Prosthetic Dentistry 2004; 92:8-11.
3. Payne, A. ; Kuzmanovic, D. V. ; De Silva-kumara, V. ; Van Staden, I. P. Mandibular
removable partial dentures supported by implants: one-year prosthodontic outcomes.
Journal of Dental Research 2006; 85 (Spec Iss B):2570.
Abbreviations
IARPD = Implant Assisted Removable Partial Denture
This Poster was submitted by Reza A. Shahmiri.
Correspondence address:
Reza A. Shahmiri
University of Otago
Sir John Walsh Research Institute, School of dentistry
900 Cumberland St.
Dunedin North, Dunedin 9012
New Zealand
© 2002-2011 Quintessence Publishing Group
114

Appendix 4
115
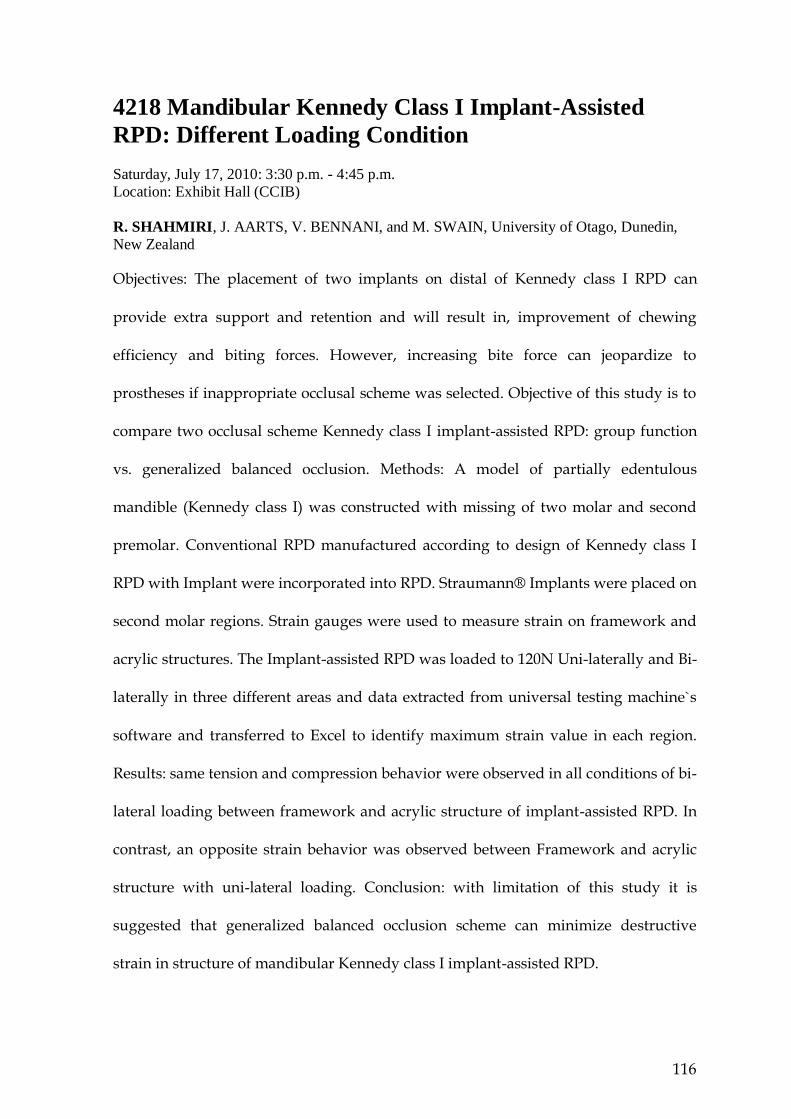
4218 Mandibular Kennedy Class I Implant-Assisted
RPD: Different Loading Condition
Saturday, July 17, 2010: 3:30 p.m. - 4:45 p.m.
Location: Exhibit Hall (CCIB)
R. SHAHMIRI, J. AARTS, V. BENNANI, and M. SWAIN, University of Otago, Dunedin,
New Zealand
Objectives: The placement of two implants on distal of Kennedy class I RPD can
provide extra support and retention and will result in, improvement of chewing
efficiency and biting forces. However, increasing bite force can jeopardize to
prostheses if inappropriate occlusal scheme was selected. Objective of this study is to
compare two occlusal scheme Kennedy class I implant-assisted RPD: group function
vs. generalized balanced occlusion. Methods: A model of partially edentulous
mandible (Kennedy class I) was constructed with missing of two molar and second
premolar. Conventional RPD manufactured according to design of Kennedy class I
RPD with Implant were incorporated into RPD. Straumann® Implants were placed on
second molar regions. Strain gauges were used to measure strain on framework and
acrylic structures. The Implant-assisted RPD was loaded to 120N Uni-laterally and Bi-
laterally in three different areas and data extracted from universal testing machine`s
software and transferred to Excel to identify maximum strain value in each region.
Results: same tension and compression behavior were observed in all conditions of bi-
lateral loading between framework and acrylic structure of implant-assisted RPD. In
contrast, an opposite strain behavior was observed between Framework and acrylic
structure with uni-lateral loading. Conclusion: with limitation of this study it is
suggested that generalized balanced occlusion scheme can minimize destructive
strain in structure of mandibular Kennedy class I implant-assisted RPD.
116
Appendix 5
Journal of Oral Implantology
The evaluation of optimal taper of immediately loaded wide-
diameter implants: A finite element analysis
Manuscript Number: AAID-JOI-D-11-00104R1
Full Title: The evaluation of optimal taper of immediately loaded wide-diameter implants:
A finite element analysis
Short Title: Taper angle of immediately loaded wide implants
Article Type: Research
Keywords: oral implants, finite element analysis, immediate loading, stress distribution,
tapering angle
Corresponding Author: Momen Atieh, BDS, MSc
Sir John Walsh Research Institute
Dunedin, Otago NEW ZEALAND
Corresponding Author Secondary
Information:
Corresponding Author's Institution: Sir John Walsh Research Institute
Corresponding Author's Secondary
Institution:
First Author: Momen Atieh, BDS, MSc
First Author Secondary Information:
All Authors: Momen Atieh, BDS, MSc
Reza A Shahmiri
All Authors
117

Abstract:
Objectives:
The study aimed at evaluating the effects of different tapering angles of an immediately
loaded wide-diameter implant on the stress/strain distribution in bone and implant
following implant insertion in either healed or fresh molar extraction sockets.
Methods:
A total of 10 finite element (FE) implant-bone models, including 8.1 mm diameter implant,
superstructure and mandibular molar segment, were created to investigate the
biomechanical behaviour of different implant taper angles in both immediate and delayed
placement conditions. The degrees of implant taper ranged from 2° to 14° and the contact
conditions between the immediately loaded implants and bone were set with frictional
coefficients (μ) of 0.3 in the healed models and 0.1 in the extracted models. Vertical and
lateral loading forces of 189.5 N were applied in all models.
Results:
Regardless of the degree of implant tapering, immediate loading of wide-diameter implants
placed in molar extraction sockets generated higher stress/strain levels than implants
placed in healed sockets. In all models, the von-Mises stresses and strains at the implant
surfaces, cortical and cancellous bone have increased with increasing the taper angle of the
implant body, except for the buccal cancellous bone in the healed models. The maximum
von-Mises strains were highly concentrated on the buccal cortical struts in the extracted
models and around the implant neck in the healed models. The maximum von-Mises
stresses on the implant threads were more concentrated in the non-tapered coronal part of
the 11° and 14° tapered implants particularly in the healed models, while the stresses were
more evenly dissipated along the implant threads in other models.
Conclusions:
Under immediate loading conditions, the present study indicates that minimally tapered
implants generated the most favourable stress and strain distribution patterns in both
extracted and healed molar sites.
Powered by Editorial Manager® and Preprint Manager® from Aries
Systems Corporation
118
The evaluation of optimal taper of immediately loaded
widediameter
implants: A finite element analysis
Momen A. Atieh1*
Reza A. Shahmiri1
1Sir John Walsh Research Institute, School of Dentistry, University of Otago, Dunedin,
New
Zealand.
Short title: Taper angle of immediately loaded wide implants
*Correspondence to:
Dr. Momen A. Atieh
Sir John Walsh Research institute
School of Dentistry, University of Otago
310 Great King Street
Dunedin 9016
New Zealand
Email: [email protected]
Keywords: oral implants, finite element analysis, immediate loading, stress distribution,
tapering
angle
*Article File
119
The evaluation of optimal taper of immediately loaded wide-diameter
implants: A finite element analysis
Introduction
Over the last decade, the primary stability of implants was tremendously improved through
modifying the surgical protocol, implant surface characteristics and design. The ability to
achieve and maintain a high primary stability has caused a paradigm shift in the way
implants were traditionally placed and loaded. Shortening the treatment time have
introduced new terms in the oral implant vocabulary. Terms such as “Immediate” or
“Early” placement and loading were used to describe the different treatment modalities
that attempted to meet the patients’ demands for a shorter period of intervention.1-4 One of
the most popular protocols is the one that combines the immediate implant placement with
immediate restoration/loading (the “bimodal” approach, Fig 1).3 The immediate placement
was defined as placing the implant in fresh extraction socket on the same day of surgery,1
while the immediate restoration/loading referred to placing the implant restoration within
the first 48 hours following implant placement.4 The bimodal approach offered the shortest
treatment time, optimal soft tissue outcomes, and high short-term success rates.5-11
However, meta-analytic studies showed a higher failure risk associated with immediate
placement/loading of single implants compared with the conventional protocol and advised
practitioners to remain cautious in embracing the “immediate” concept.2,3
Implant design is one of the factors that may influence the biomechanical behaviour of an
oral implant and hence its primary implant.12 The earliest traditional implant was
cylindrically parallel in design. The paralleled shape was, however, not applicable in all
clinical situations.
Therefore, other implant designs and thread geometries were introduced to achieve a better
120

stability in different anatomical and bone conditions. The tapered (root-analogue) implant
was initially marketed by Friatec Corporation to be inserted immediately into an extraction
socket.13,14 The tapered implant design has a wide diameter coronally and a tapered implant
body resembling the shape of an extraction socket. Such design may enhance the
immediate placement by offering an implant surface that engages the walls of the tapered
socket and minimizes the need for bone graft. In addition, tapered implants can be placed
in nonextraction sites where wide-diameter implants offer a more favourable distribution
of loading forces.15 Moreover, it has been suggested that tapered implants may improve
aesthetics, allow implant insertion between two adjacent teeth,16 and avoid the risk of
perforation due to anatomical concavities.17
The tapered design was modelled to enhance the primary implant stability in poor bone
quality by transferring the compressive forces to the cortical bone, as the cortical bone is
expected to handle higher stress/strain values than cancellous bone.18,19 Likewise, wide
implants have also been reported to improve the primary stability by increasing the surface
area of contact between the bone and the implant.20 However, the surgical technique of
placing tapered wide implant can be sensitive and mainly influenced by the degree of
implant taper and bone density as excessive compression of bone can be created during
implant insertion. Such compressive forces, if exceeded the physiological limits of bone,
can lead to osseous necrosis and compromised stability.21,22
The tapering angle can be one of the basic design features that differentiate between the
increasing number of commercially available tapered implants in the market. From a
biomechanical point of view, the optimal design for immediate loading is the one that has a
tapering angle that can enhance the primary stability by allowing an even bone
compaction, favourable magnitude and distribution of strains along the cortical and
cancellous bone levels, and uniform stresses at the implant surface, without any
121
detrimental compressive or wedging effects. It is now well accepted that a certain level of
intraosseous strain can enhance early osteogenesis at the bone-implant interface.23-25 Thus,
an implant configuration that can achieve the desired level of microstrains may have a
profound influence on the early phase of periimplant osteogenesis, which is crucial for the
long-term success of immediately loaded implants. In implant biomechanics, finite element
(FE) method has been extensively used to simulate clinical scenarios that would be more
complicated to examine using other methods. The majority of the previous FE studies have
extensively evaluated implant design parameters in a fully osseointegrated implant
model.26-28 However, the biomechanical role of these parameters in immediate/early
placement and loading scenarios has not been adequately studied in the literature. The aim
of this study was therefore to analyse, using a non-linear FE approach, the influence of the
implant tapering angle on the strain values in the cortical and cancellous bone and the
stress distribution in immediately loaded wide-diameter implants placed in the molar sites
under two different placement protocols (healed ridges versus extraction sockets).
Materials and Methods
FE model design
Three-dimensional models of posterior mandibular segment with wide-diameter implant
and superstructure were created using a personal computer (AMD Athlon 64 x2 processor)
and a computer aided design program (SolidWorks 2009, SolidWorks Corporation,
Concord, MA). The dimensions of the mandibular bone segment were 27 mm in height
and 12 mm in buccolingual width, and consisted of a spongy centre of cancellous bone
surrounded by a 2 mm layer of cortical bone.29 A molar extraction socket was modelled to
simulate the immediate placement protocol. The socket dimensions were based on the
anatomy and geometry of the roots of mandibular molars. The bone-implant models were
122
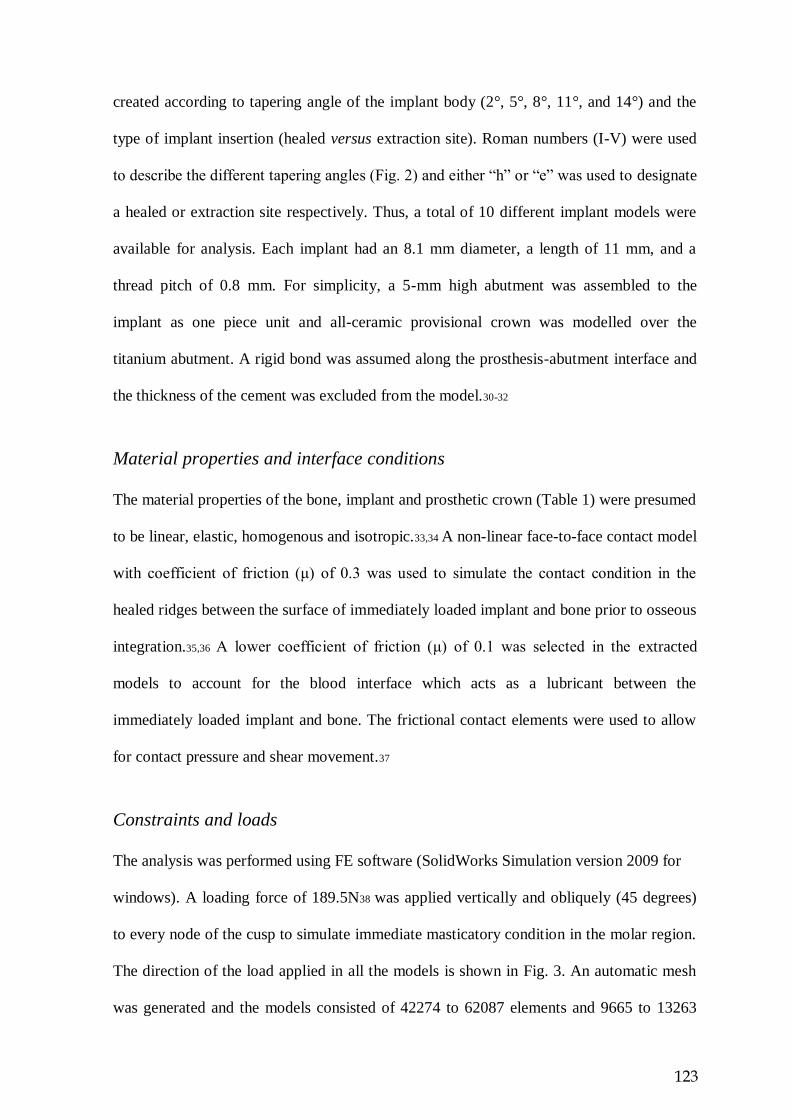
created according to tapering angle of the implant body (2°, 5°, 8°, 11°, and 14°) and the
type of implant insertion (healed versus extraction site). Roman numbers (I-V) were used
to describe the different tapering angles (Fig. 2) and either “h” or “e” was used to designate
a healed or extraction site respectively. Thus, a total of 10 different implant models were
available for analysis. Each implant had an 8.1 mm diameter, a length of 11 mm, and a
thread pitch of 0.8 mm. For simplicity, a 5-mm high abutment was assembled to the
implant as one piece unit and all-ceramic provisional crown was modelled over the
titanium abutment. A rigid bond was assumed along the prosthesis-abutment interface and
the thickness of the cement was excluded from the model.30-32
Material properties and interface conditions
The material properties of the bone, implant and prosthetic crown (Table 1) were presumed
to be linear, elastic, homogenous and isotropic.33,34 A non-linear face-to-face contact model
with coefficient of friction (μ) of 0.3 was used to simulate the contact condition in the
healed ridges between the surface of immediately loaded implant and bone prior to osseous
integration.35,36 A lower coefficient of friction (μ) of 0.1 was selected in the extracted
models to account for the blood interface which acts as a lubricant between the
immediately loaded implant and bone. The frictional contact elements were used to allow
for contact pressure and shear movement.37
Constraints and loads
The analysis was performed using FE software (SolidWorks Simulation version 2009 for
windows). A loading force of 189.5N38 was applied vertically and obliquely (45 degrees)
to every node of the cusp to simulate immediate masticatory condition in the molar region.
The direction of the load applied in all the models is shown in Fig. 3. An automatic mesh
was generated and the models consisted of 42274 to 62087 elements and 9665 to 13263
123

nodes, depending on the implant taper and placement protocol. The boundary conditions
were applied by constraining the three degrees of freedom at each node located at the
mesial and distal aspects of the bone segment. The maximum von-Mises stress at the
implant and the maximum displacement in bone were reported. All the stress/strain
distribution patterns were illustrated using contour maps.
Results
The influence of the tapering design of an immediately loaded oral implant inserted in
either a healed or extracted molar models was evaluated by calculating the maximum von-
Mises stresses at the implant and the maximum von-Mises strains on the adjacent bone.
The maximum von- Mises stress/strain values at the implant, cortical and cancellous levels
are summarized in Table 2.
The tapered implants generated more stress/strain values at the implant, cortical and
cancellous bone in the simulated extracted sites than the healed sites. At each tapering
angle, the maximum von-Mises stress values at the immediately loaded implants in the
extracted models were almost doubled compared to those in the healed models. Moreover,
the increase in the implant taper angle resulted in higher stress values in both the extraction
and non-extraction models. Hence, the lowest stress value was recorded in the 2° tapered
implant in the healed model (9.9 MPa; Fig. 4, a), while the highest stress value was
recorded in the most tapered implant in the extracted model (35.3 MPa; Fig. 4, b). At the
abutment-implant interface, the maximum von-Mises stress values were considerably high
when the taper angle was more than 8°. In the healed model, the peak values of von-Mises
stresses occurred at the first three threads of the tapered implants in models IV and V,
while the stress values were more evenly distributed along the implant threads in other
models. In the cortical bone, the maximum von-Mises strains were generated at the cortical
124

bone around the implant neck in the healed model V (0.0003679ε; Fig. 5, a) and at the
cortical buccal strut adjacent to the implant neck in the extracted model V (0.003383ε; Fig.
5, b). In the cancellous bone, the healed models showed a different behaviour in the strain
distribution, as the highest von-Mises strain value occurred in the buccal side of the
cancellous bone around the least tapered implant (0.001654ε; Fig. 6, a), while the strain
distribution in the cancellous bone in the extracted models followed the stress/strain
patterns along the implant surface and the cortical bone, with the highest von-Mises strain
value being generated around the apical part of the most tapered implant (0.007120ε; Fig.
6, b).
In the healed models, reducing the tapering angle from 14° to 2° decreased both the
maximum von-Mises stress at the oral implant and the maximum von-Mises strain at the
cortical bone around the implant by 50.7% and 32.2% respectively. Alternatively, the
value of maximum von- Mises strain at the cancellous bone decreased by 54.2% by
increasing the tapering angle to 14° (Fig. 7, a). In the extracted models, the reduction in
maximum von-Mises stress at the implant was less with only 39.1% reduction as the
implant taper angle decreased to 2°, whereas the strain values along cortical and cancellous
bone were reduced by 68.9% and 55.2% respectively (Fig. 7, b). Thus, the degree of
implant tapering may have more influence on the strain patterns along the simulated
extracted sockets than the healed sites. The plotting of the maximum von-Mises stress
values at the implant threads for each model showed that the maximum values were more
located in the coronal parallel-sided part of the implant. The first three threads of the
tapered implants in the healed models IV and V showed a considerably higher stress values
than the rest of the implant threads (Fig. 8, a). A similar pattern was observed in the
extracted models. However, the difference between the stress values along the threads was
small with more gradual change between the coronal and apical (Fig. 8, b).
125
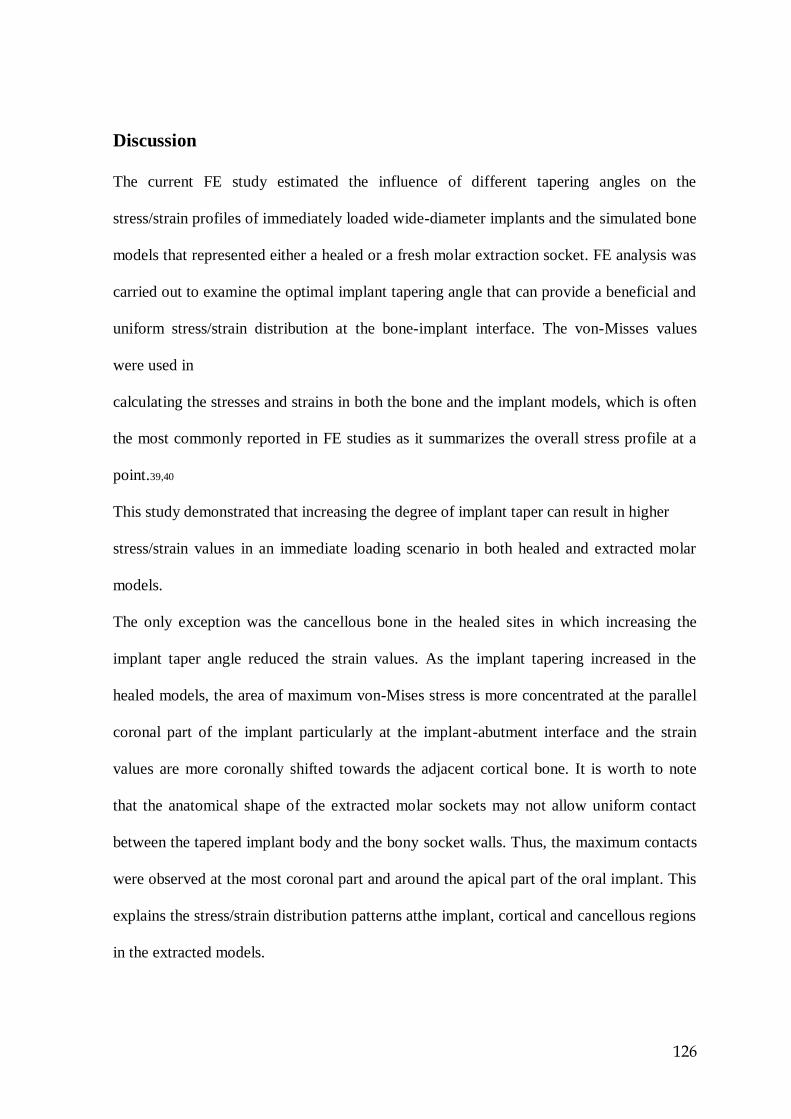
Discussion
The current FE study estimated the influence of different tapering angles on the
stress/strain profiles of immediately loaded wide-diameter implants and the simulated bone
models that represented either a healed or a fresh molar extraction socket. FE analysis was
carried out to examine the optimal implant tapering angle that can provide a beneficial and
uniform stress/strain distribution at the bone-implant interface. The von-Misses values
were used in
calculating the stresses and strains in both the bone and the implant models, which is often
the most commonly reported in FE studies as it summarizes the overall stress profile at a
point.39,40
This study demonstrated that increasing the degree of implant taper can result in higher
stress/strain values in an immediate loading scenario in both healed and extracted molar
models.
The only exception was the cancellous bone in the healed sites in which increasing the
implant taper angle reduced the strain values. As the implant tapering increased in the
healed models, the area of maximum von-Mises stress is more concentrated at the parallel
coronal part of the implant particularly at the implant-abutment interface and the strain
values are more coronally shifted towards the adjacent cortical bone. It is worth to note
that the anatomical shape of the extracted molar sockets may not allow uniform contact
between the tapered implant body and the bony socket walls. Thus, the maximum contacts
were observed at the most coronal part and around the apical part of the oral implant. This
explains the stress/strain distribution patterns atthe implant, cortical and cancellous regions
in the extracted models.
126
115

The results of the current analysis suggest that a tapering angle of 2° can provide a
significantly lower strain level at the cortical and cancellous bone in the extraction site
indicating a better biomechanical behaviour of minimally tapered implants inserted in
molar extraction sockets (Fig. 7, a), while in the healed socket, a tapering angle of 8° can
result in more favourable strain distribution in both cortical and cancellous bone (Fig. 7, b).
The high stress/strain patterns caused by use of high tapered implants can be attributed to
the increased wedging effect that may ultimately lead to micro-cracks and bone damage.41
The use of a relatively small tapered angle (≤ 108°) may direct the maximum stress levels
away from the abutment-implant interface, which is the most susceptible area to loading as
excessive loading forces can cause joint opening, and thus jeopardizing implant survival
regardless of the implant diameter.42
Although an optimal implant taper angle under immediate loading condition has not been
proposed in the literature, Previous FE studies27,43 have investigated the effect of implant
taper in models where complete osseointegration and fully bonded bone-implant interface
were assumed.
Petrie and Williams27 created 16 FE models to examine the influence of three implant
parameters (implant diameter, length and taper). The implant tapering angles employed in
the models ranged from 0-14°. The authors predicted that wide, long and non-tapered
implants can provide the most favourable strain patterns at the peri-implant crestal bone.
Siegele and Soltesz 43 evaluated four implant shapes (cylindrical, tapered, screw and
conical). The FE analysis suggested that conical or tapered implant design produced higher
crestal stresses than the cylindrical one. Likewise, this study showed that implants with
small tapered angles have also offered a favourable stress distribution along the implant
threads and reduced displacement of the surrounding bone in an immediate placement
loading scenario. It has been suggested that wide implants increase the contacted surfaces
127
115

between implant and adjacent bone and thus minimize the micromovements and enhance
the implant stability.
Nevertheless, wide-diameter tapered implants are not necessarily the optimal choice in
certain anatomical sites such as molar extraction sockets, where bone may be damaged due
to the high degree of compression that take place on the buccal strut during insertion and
subsequent immediate loading. This is evident in the high insertion torque generated as
tapered implants engage the cortical bone layer. The resultant compressive forces may lead
to osseous necrosis and bone resorption limited to the cortical bone layer.21,22
The FE analyses have been extensively used to assist both researchers and clinicians in
modifying implant designs and solving complicated problems. However, there are several
limitations of the FE study that need to be acknowledged: (1) Homogenous and isotropic
material properties were assumed. (2) The complicated geometry of implant and bone was
difficult to be accurately modelled. Hence an arbitrary model was created based on actual
dimensions of mandibular bone cross-section. (3) The study was limited to one tapering
design in which the implant had a coronal non-tapered part and an apical tapered part with
different tapering angles. There was no attempt to study an opposite geometry of a
coronally tapered implant with parallel-sided apical part. (4) The effect of implant tapering
angle in immediate protocols was analysed independently of other factors (i.e. bone
quality, implant length and diameter). Nevertheless it provided more insight analysis on a
particular design parameter in an immediate loading model. (5) A time-dependent model44
of immediate loading was not considered. The current FE analysis, however, offered
several advantages including the use of three-dimensional FE models instead of two-
dimensional models to represent two common modalities of implant placement (extracted
versus healed sites) and the adoption of non-linear contact analysis to simulate the
128
115

complicated relationship between the prepared osteotomy and the oral implant under
immediate loading.
Conclusions
Despite the limitations due to the assumptions used in the FE models, the following
clinically relevant conclusions can still be drawn from this analysis:
- The von-Mises strains caused by immediate loading of immediately placed wide tapered
implants were mainly concentrated in the cortical buccal strut around the implant neck
where bone is at high risk of resorption.
- An approximately 8° and less tapered implants may provide the most favourable choice
in the healed molar sites in terms of minimizing stresses around the implant neck and
strains in the peri-implant alveolar bone.
- An implant taper angle of 2° allowed the maximum anatomical contact between the
implant threads and the molar extraction socket walls and showed the lowest stress and
strain levels among all tapered implant designs.
- In immediate implant placement, tapered implant was designed to duplicate the shape of
natural single rooted anterior tooth. However, a strongly tapered implant may not be
biomechanically advantageous in multi-rooted extraction socket even when a wide
diameter is considered. Therefore, it would seem advisable to avoid the use of strongly
tapered implants for immediate placement/loading in molar sites.
- Further studies are still needed to evaluate other implant geometries that allow even and
129
115

minimal stress/strain distribution along the implant surface and adjacent bone in different
implant placement and loading protocols.
Conflict of interest
None.
References
1. Hammerle CH, Chen ST, Wilson TG, Jr. Consensus statements and recommended
clinical procedures regarding the placement of implants in extraction sockets. Int J Oral
Maxillofac Implants 2004;19 Suppl:26-8.
2. Atieh MA, Atieh AH, Payne AG, Duncan WJ. Immediate loading with single implant
crowns: a systematic review and meta-analysis. Int J Prosthodont 2009;22(4):378-87.
3. Atieh MA, Payne AG, Duncan WJ, Cullinan MP. Immediate restoration/loading of
immediately placed single implants: is it an effective bimodal approach? Clin Oral
Implants Res 2009;20(7):645-59.
4. Cochran DL, Morton D, Weber HP. Consensus statements and recommended clinical
procedures regarding loading protocols for endosseous dental implants. Int J Oral
Maxillofac Implants 2004;19 Suppl:109-13.
5. Schnitman PA, Wohrle PS, Rubenstein JE, DaSilva JD, Wang NH. Ten-year results for
Branemark implants immediately loaded with fixed prostheses at implant placement. Int J
Oral Maxillofac Implants 1997;12(4):495-503.
6. Chiapasco M, Gatti C, Rossi E, Haefliger W, Markwalder TH. Implant-retained
mandibular overdentures with immediate loading. A retrospective multicenter study on 226
consecutive cases. Clin Oral Implants Res 1997;8(1):48-57.
7. Kan JY, Rungcharassaeng K, Liddelow G, Henry P, Goodacre CJ. Periimplant tissue
response following immediate provisional restoration of scalloped implants in the esthetic
130
115

zone: a one-year pilot prospective multicenter study. J Prosthet Dent 2007;97(6
Suppl):S109-18.
8. Andersen E, Haanaes HR, Knutsen BM. Immediate loading of single-tooth ITI implants
in the anterior maxilla: a prospective 5-year pilot study. Clin Oral Implants Res
2002;13(3):281-7.
9. Drago CJ, Lazzara RJ. Immediate provisional restoration of Osseotite implants: a
clinical report of 18-month results. Int J Oral Maxillofac Implants 2004;19(4):534-41.
10. Degidi M, Piattelli A. Immediate functional and non-functional loading of dental
implants: a 2- to 60-month follow-up study of 646 titanium implants. J Periodontol
2003;74(2):225-41.
11. Ribeiro FS, Pontes AE, Marcantonio E, Piattelli A, Neto RJ, Marcantonio E, Jr.
Success rate of immediate nonfunctional loaded single-tooth implants: immediate versus
delayed implantation. Implant Dent 2008;17(1):109-17.
12. Meredith N. Assessment of implant stability as a prognostic determinant. Int J
Prosthodont 1998;11(5):491-501.
13. Schulte W. [Tubingen implant made of Frialit: 5 years of experience]. Dtsch Zahnarztl
Z 1981;36(9):544-50.
14. d'Hoedt B, Lukas D, Schulte W. [The Tubingen implant as immediate and late implant,
a statistical comparison]. Dtsch Zahnarztl Z 1986;41(10):1068-72. 15. Pilliar RM,
Deporter DA, Watson PA, Valiquette N. Dental implant design--effect on bone
remodeling. J Biomed Mater Res 1991;25(4):467-83.
16. Shapoff CA. Clinical advantages of tapered root form dental implants. Compend
Contin Educ Dent 2002;23(1):42-4, 46, 48 passim.
17. Garber DA, Salama H, Salama MA. Two-stage versus one-stage--is there really a
controversy? J Periodontol 2001;72(3):417-21.
131
115

18. Misch CE. Density of bone: effect on treatment plans, surgical approach, healing, and
progressive boen loading. Int J Oral Implantol 1990;6(2):23-31.
19. Martinez H, Davarpanah M, Missika P, Celletti R, Lazzara R. Optimal implant
stabilization in low density bone. Clin Oral Implants Res 2001;12(5):423-32.
20. Ivanoff CJ, Sennerby L, Johansson C, Rangert B, Lekholm U. Influence of implant
diameters on the integration of screw implants. An experimental study in rabbits. Int J Oral
Maxillofac Surg 1997;26(2):141-8.
21. Bashutski JD, D'Silva NJ, Wang HL. Implant compression necrosis: current
understanding and case report. Journal of Periodontology 2009;80(4):700-4.
22. Piattelli A, Scarano A, Balleri P, Favero GA. Clinical and histologic evaluation of an
active "implant periapical lesion": a case report. The International journal of oral &
maxillofacial implants 1998;13(5):713-6.
23. Simmons CA, Meguid SA, Pilliar RM. Mechanical regulation of localized and
appositional bone formation around bone-interfacing implants. J Biomed Mater Res
2001;55(1):63-71.
24. Meyer U, Joos U, Mythili J, Stamm T, Hohoff A, Fillies T, Stratmann U, Wiesmann
HP. Ultrastructural characterization of the implant/bone interface of immediately loaded
dental implants. Biomaterials 2004;25(10):1959-67.
25. Degidi M, Scarano A, Piattelli M, Perrotti V, Piattelli A. Bone remodeling in
immediately loaded and unloaded titanium dental implants: a histologic and
histomorphometric study in humans. J Oral Implantol 2005;31(1):18-24.
26. Anitua E, Tapia R, Luzuriaga F, Orive G. Influence of implant length, diameter, and
geometry on stress distribution: a finite element analysis. Int J Periodontics Restorative
Dent 2010;30(1):89-95.
132
115

27. Petrie CS, Williams JL. Comparative evaluation of implant designs: influence of
diameter, length, and taper on strains in the alveolar crest. A three-dimensional
finiteelement analysis. Clin Oral Implants Res 2005;16(4):486-94.
28. Himmlova L, Dostalova T, Kacovsky A, Konvickova S. Influence of implant length
and diameter on stress distribution: a finite element analysis. J Prosthet Dent
2004;91(1):20-5.
29. Schwartz-Dabney CL, Dechow PC. Edentulation alters material properties of cortical
bone in the human mandible. J Dent Res 2002;81(9):613-7.
30. Brunski JB. Biomechanical factors affecting the bone-dental implant interface. Clin
Mater 1992;10(3):153-201.
31. Simsek B, Erkmen E, Yilmaz D, Eser A. Effects of different inter-implant distances on
the stress distribution around endosseous implants in posterior mandible: a 3D finite
element analysis. Med Eng Phys 2006;28(3):199-213.
32. Hojjatie B, Anusavice KJ. Three-dimensional finite element analysis of glass-ceramic
dental crowns. J Biomech 1990;23(11):1157-66.
33. Albakry M, Guazzato M, Swain MV. Biaxial flexural strength, elastic moduli, and x-
ray diffraction characterization of three pressable all-ceramic materials. J Prosthet Dent
2003;89(4):374-80.
34. Ciftci Y, Canay S. The effect of veneering materials on stress distribution in
implantsupported fixed prosthetic restorations. Int J Oral Maxillofac Implants
2000;15(4):571-82.
35. Rubin PJ, Rakotomanana RL, Leyvraz PF, Zysset PK, Curnier A, Heegaard JH.
Frictional interface micromotions and anisotropic stress distribution in a femoral total hip
component. J Biomech 1993;26(6):725-39.
133
115
36. Alkan I, Sertgoz A, Ekici B. Influence of occlusal forces on stress distribution in
preloaded dental implant screws. J Prosthet Dent 2004;91(4):319-25.
37. Viceconti M, Muccini R, Bernakiewicz M, Baleani M, Cristofolini L. Large-sliding
contact elements accurately predict levels of bone-implant micromotion relevant to
osseointegration. J Biomech 2000;33(12):1611-8.
38. Mericske-Stern R, Assal P, Mericske E, Burgin W. Occlusal force and oral tactile
sensibility measured in partially edentulous patients with ITI implants. Int J Oral
Maxillofac Implants 1995;10(3):345-53.
39. Papavasiliou G, Kamposiora P, Bayne SC, Felton DA. Three-dimensional finite
element analysis of stress-distribution around single tooth implants as a function of bony
support, prosthesis type, and loading during function. J Prosthet Dent 1996;76(6):633-40.
40. Holmes DC, Loftus JT. Influence of bone quality on stress distribution for endosseous
implants. J Oral Implantol 1997;23(3):104-11.
41. O'Sullivan D, Sennerby L, Meredith N. Influence of implant taper on the primary and
secondary stability of osseointegrated titanium implants. Clin Oral Implants Res
2004;15(4):474-80.
42. Hoyer SA, Stanford CM, Buranadham S, Fridrich T, Wagner J, Gratton D. Dynamic
fatigue properties of the dental implant-abutment interface: joint opening in widediameter
versus standard-diameter hex-type implants. J Prosthet Dent 2001;85(6):599-607.
43. Siegele D, Soltesz U. Numerical investigations of the influence of implant shape on
stressdistribution in the jaw bone. Int J Oral Maxillofac Implants 1989;4(4):333-40.
44. Winter W, Heckmann SM, Weber HP. A time-dependent healing function for
immediate loaded implants. J Biomech 2004;37(12):1861-7.
134
115
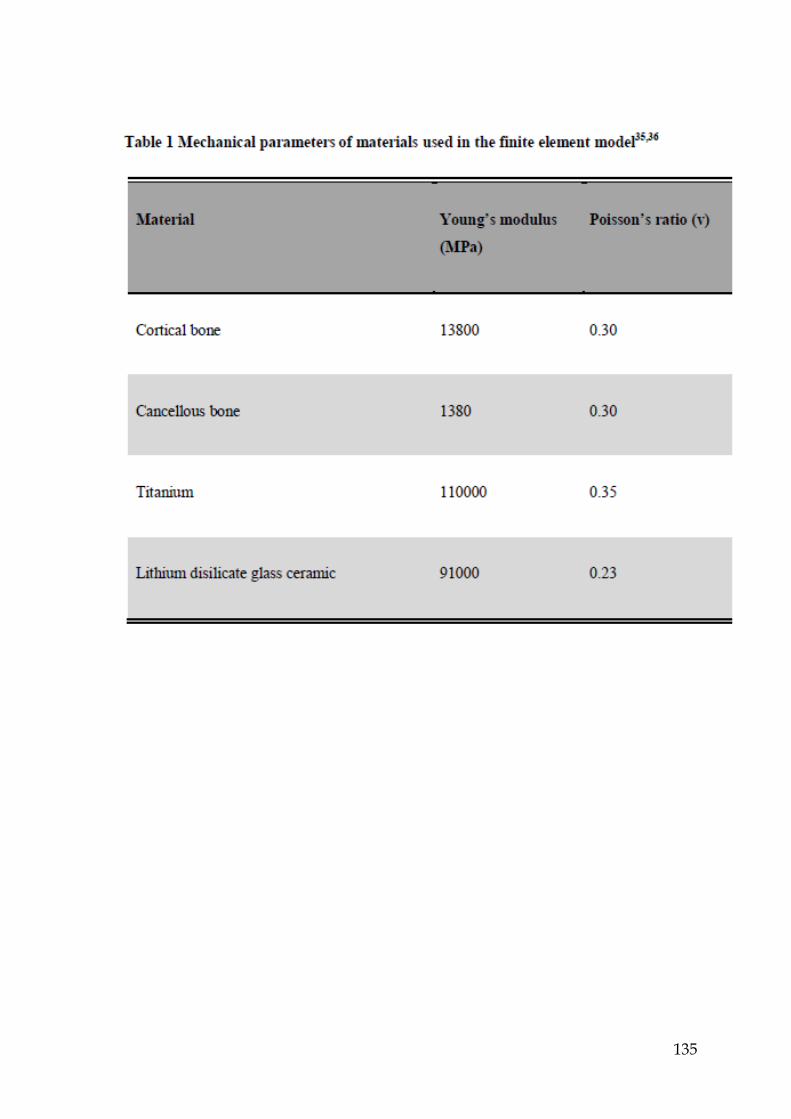
135
115

136
115

137
115

138
115

139
115
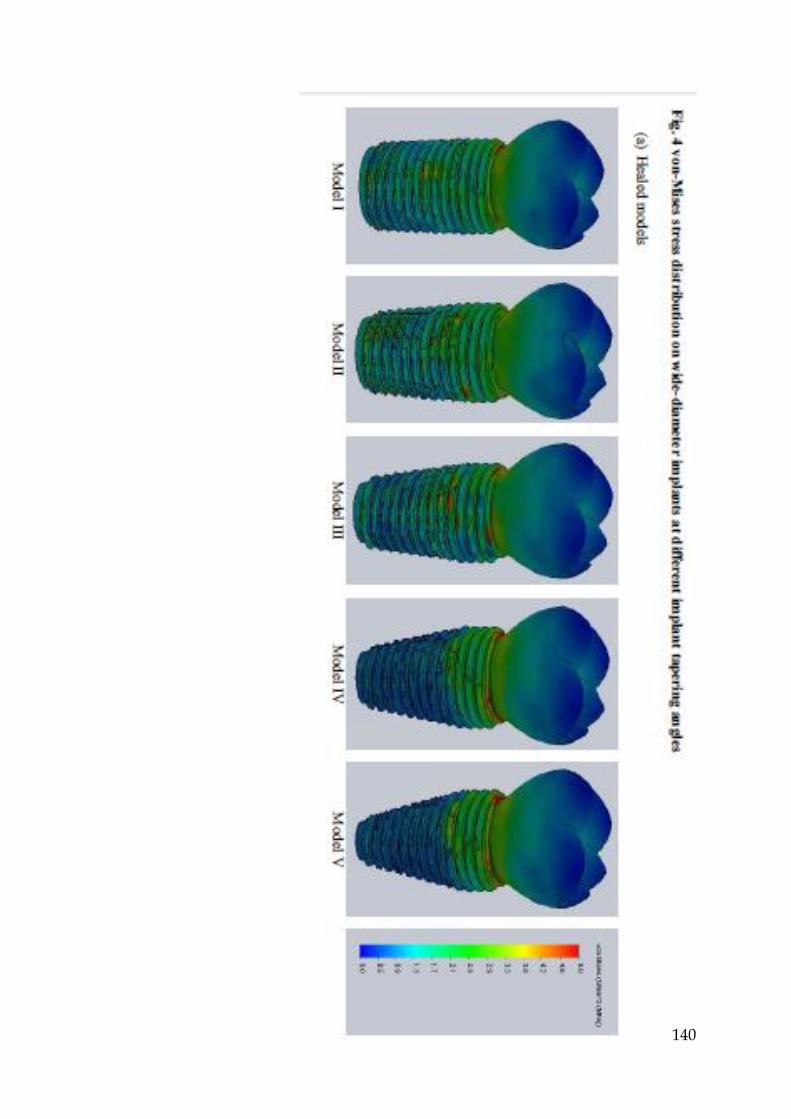
140
115

141
115
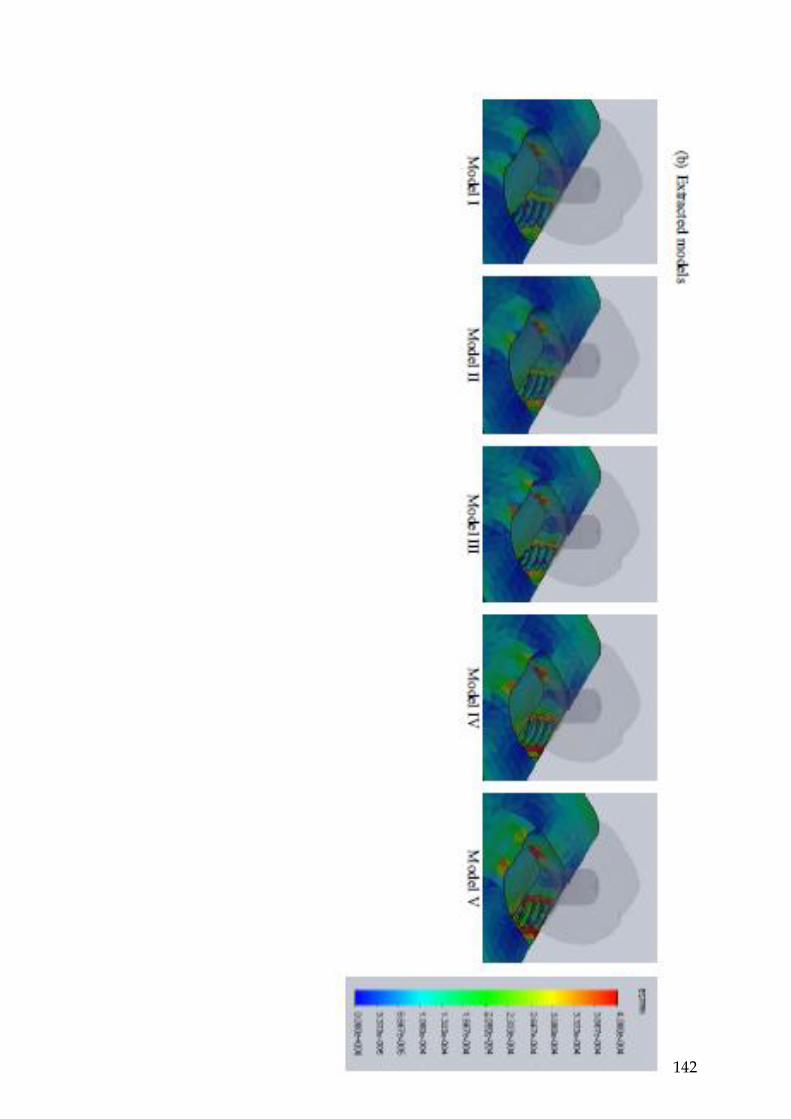
142
115

143
115
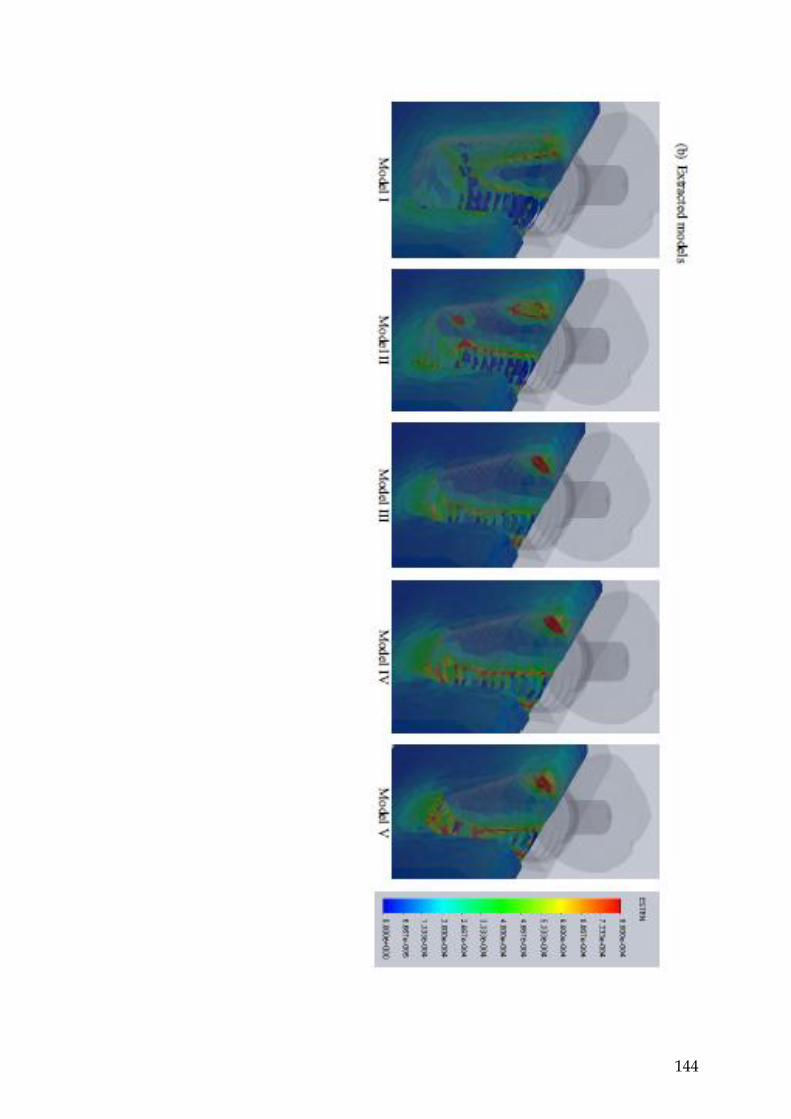
144
115

145
115

146
115
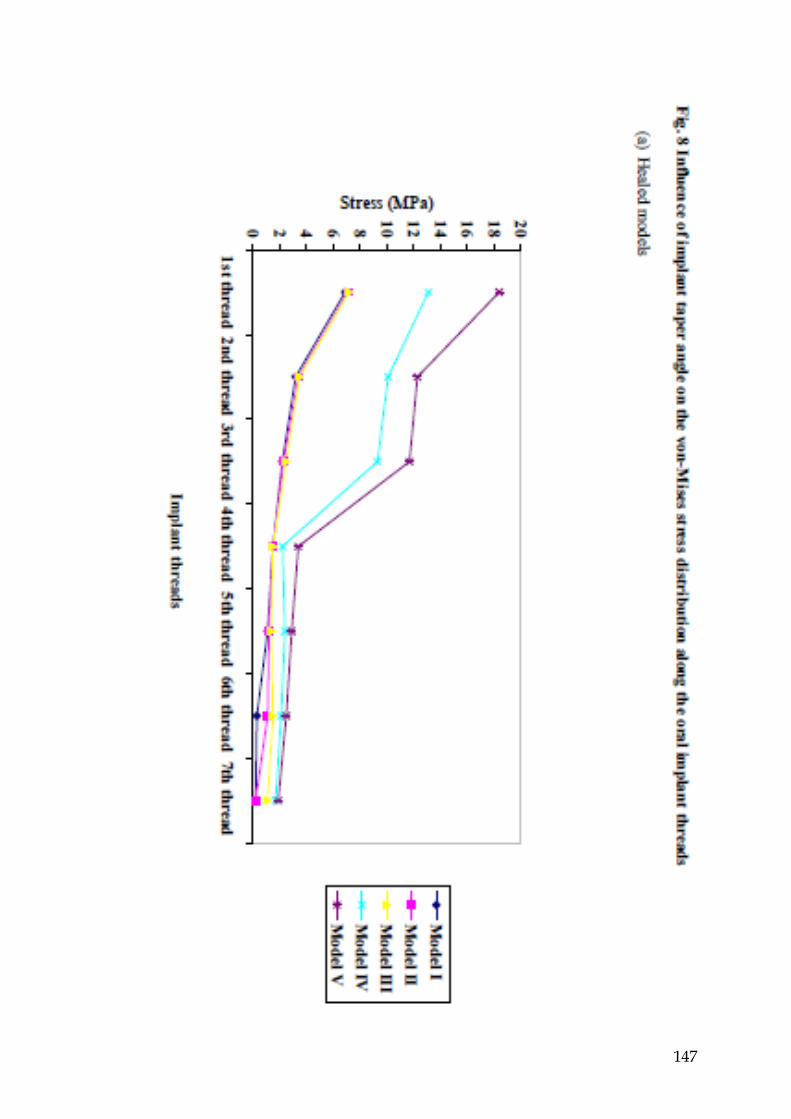
147
115

148
115

G8-BL
G6-BL
G7-MD
G5-MD
G11-MDI
G4-MDI
G12-BLI G3-BLI G9-MDI G2-MDI G10-BLI G1-BLI
Bi-U-Acrylic
-25.4 11.5 -21 -28.8 72.8 34.6 138.2 83.1 6.2 4.2 281.5 74
-24.9 3.2 -14.5 -10.3 37.6 138.3 72.2 2.7 5 245.1 51.6
-22.6 6.6 -13.1 -20.4 75.9 35.7 140.7 75.5 3.8 10.5 247.9 50.8
-27.7 12.1 -23.6 -6.4 69.6 28.4 142.6 74.9 -3.3 4.6 248.8 49.6
Ave -25.2 8.4 -22.6 -16.5 74.5 28.1 140 61.7 2.4 5.3 255.8 45.4
SD 2.09 4.23 6.87 10.1 4.36 3.98 2.11 4.68 4.04 2.76 15.19 11.7
Bi-M-Acrylic
152.7 88.8 -2.4 -13.3 55.5 12.2 80 50.6 31.4 42.3 176.5 23.5
Ap
pen
dix
4
149
Micro-strain value of all strain gauges
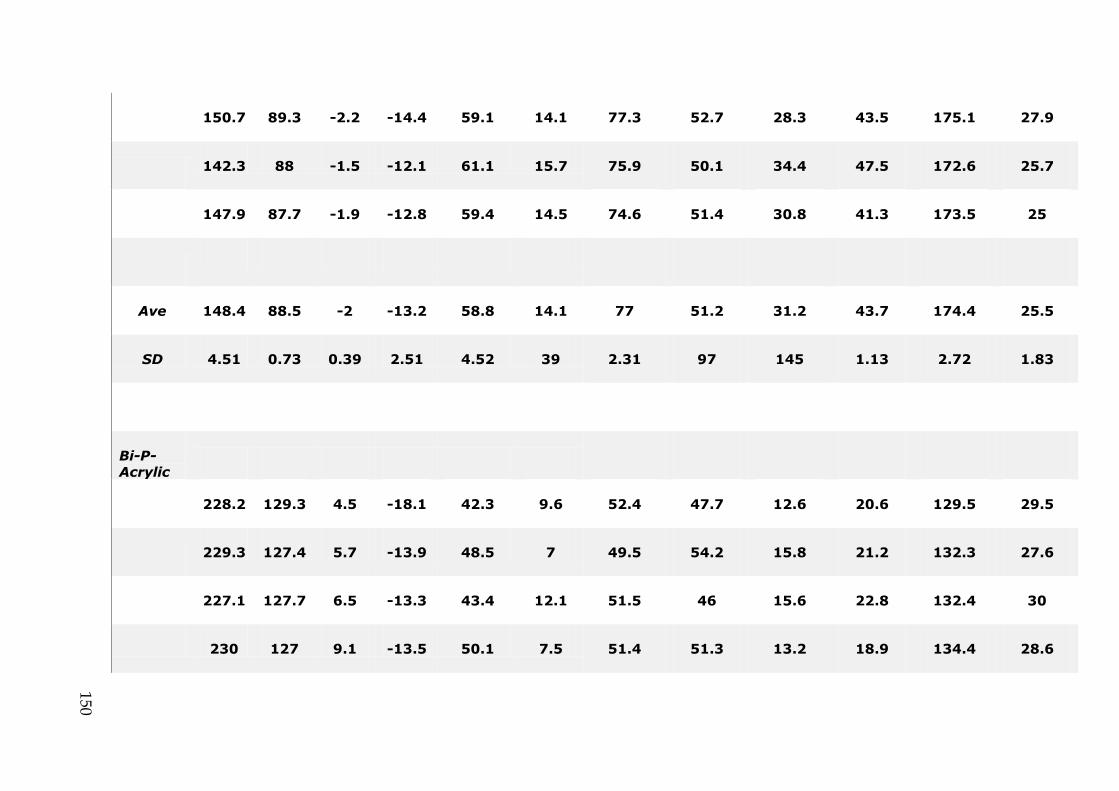
150.7 89.3 -2.2 -14.4 59.1 14.1 77.3 52.7 28.3 43.5 175.1 27.9
142.3 88 -1.5 -12.1 61.1 15.7 75.9 50.1 34.4 47.5 172.6 25.7
147.9 87.7 -1.9 -12.8 59.4 14.5 74.6 51.4 30.8 41.3 173.5 25
Ave 148.4 88.5 -2 -13.2 58.8 14.1 77 51.2 31.2 43.7 174.4 25.5
SD 4.51 0.73 0.39 2.51 4.52 39 2.31 97 145 1.13 2.72 1.83
Bi-P-Acrylic
228.2 129.3 4.5 -18.1 42.3 9.6 52.4 47.7 12.6 20.6 129.5 29.5
229.3 127.4 5.7 -13.9 48.5 7 49.5 54.2 15.8 21.2 132.3 27.6
227.1 127.7 6.5 -13.3 43.4 12.1 51.5 46 15.6 22.8 132.4 30
230 127 9.1 -13.5 50.1 7.5 51.4 51.3 13.2 18.9 134.4 28.6
150
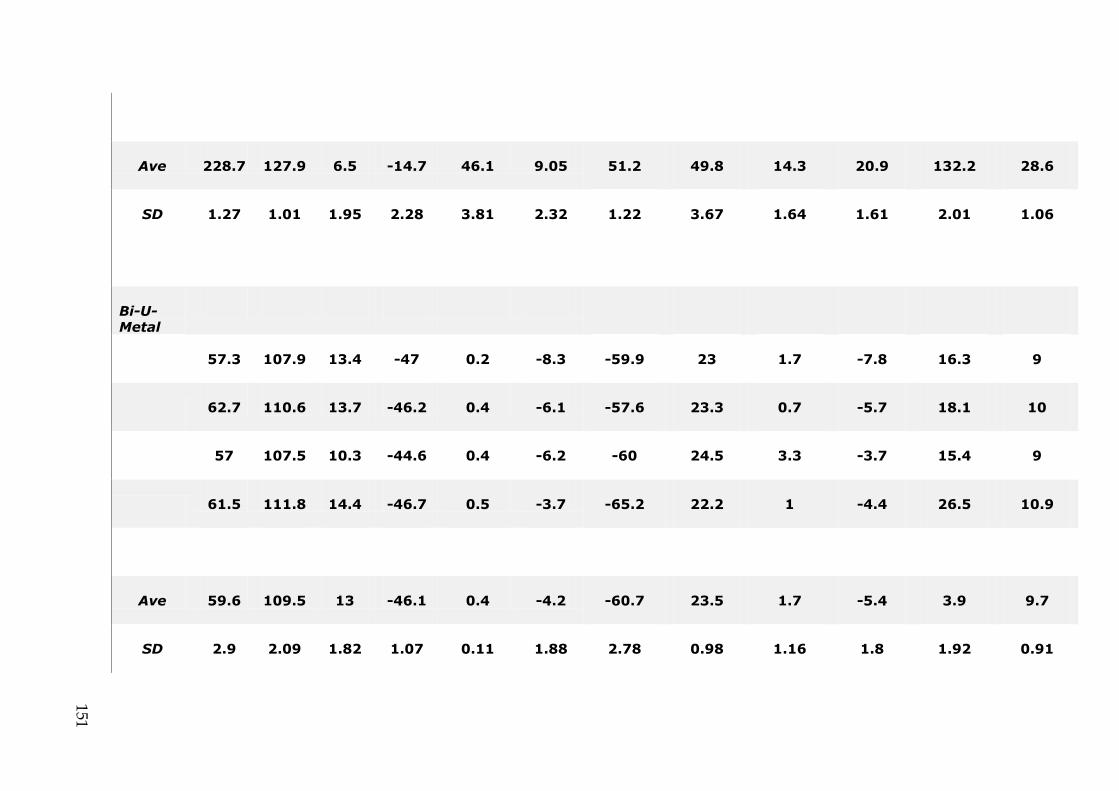
Ave 228.7 127.9 6.5 -14.7 46.1 9.05 51.2 49.8 14.3 20.9 132.2 28.6
SD 1.27 1.01 1.95 2.28 3.81 2.32 1.22 3.67 1.64 1.61 2.01 1.06
Bi-U-Metal
57.3 107.9 13.4 -47 0.2 -8.3 -59.9 23 1.7 -7.8 16.3 9
62.7 110.6 13.7 -46.2 0.4 -6.1 -57.6 23.3 0.7 -5.7 18.1 10
57 107.5 10.3 -44.6 0.4 -6.2 -60 24.5 3.3 -3.7 15.4 9
61.5 111.8 14.4 -46.7 0.5 -3.7 -65.2 22.2 1 -4.4 26.5 10.9
Ave 59.6 109.5 13 -46.1 0.4 -4.2 -60.7 23.5 1.7 -5.4 3.9 9.7
SD 2.9 2.09 1.82 1.07 0.11 1.88 2.78 0.98 1.16 1.8 1.92 0.91
151

Bi-M-Metal
66.8 88.1 6 -31.4 0.3 -3.3 -72.1 26.6 4.5 25 15.1 15.8
68.8 91.6 5.9 -29.9 0.1 1.3 -71.8 31.5 6 31.5 14.8 17.5
74.4 92.1 7.6 -26.9 0.2 1.9 -68.9 25.8 3.1 25.8 14.1 11.9
71 93.4 6.7 -28.3 0 2 -74.9 25 4.2 25 15 12.8
Ave 70.3 91.3 6.6 -29.1 0.2 2.1 -79.1 27.2 4.5 26 14.8 14.5
SD 2.82 1.96 0.68 1.69 0.11 2.2 2.12 2.53 1.04 47 0.39 2.25
Bi-P-Metal
152

92.9 132.2 12.6 -32.1 -0.3 -1.6 -75.6 13.4 -0.4 -22.9 4.6 2.9
90.2 132.3 10.9 -34 0.9 -1.1 -76.7 16.5 -1.5 -20.9 5 4.2
95.5 138.6 12 -36.7 1.6 -2.9 -74.8 18.5 0.4 -24.5 4.8 1.1
91.2 131 9.9 -29.9 1.8 -5.3 -79.1 15.9 1.4 -25.9 4.2 3.1
Ave 92.5 133.5 11.4 -33.2 1 -2.7 -76.6 16.1 -0.03 -23.6 4.7 2.8
SD 2.32 3.43 1.2 2.89 0.95 1.88 1.87 2.1 1.23 2.15 0.34 1.28
Uni-U-Acrylic
58 -12.6 35.3 93.6 50 53.4
59.6 -5 39.1 91.5 46 53.2
153

60.3 -7.9 37.8 91.2 46.8 50.9
58.8 -7 37.6 90.3 42.5 51
Ave 59.1 -8.13 37.4 91.6 46.3 52.1
SD 0.99 3.22 1.58 1.4 3.08 1.36
Uni-M-Acrylic
234 -36 16.3 95.3 71.8 33.4
233.1 -36.7 20.4 97.1 75.3 38
232.9 -36.6 22.7 98.2 79 37.9
238.4 -29.1 24.6 99.6 79.9 41.2
154
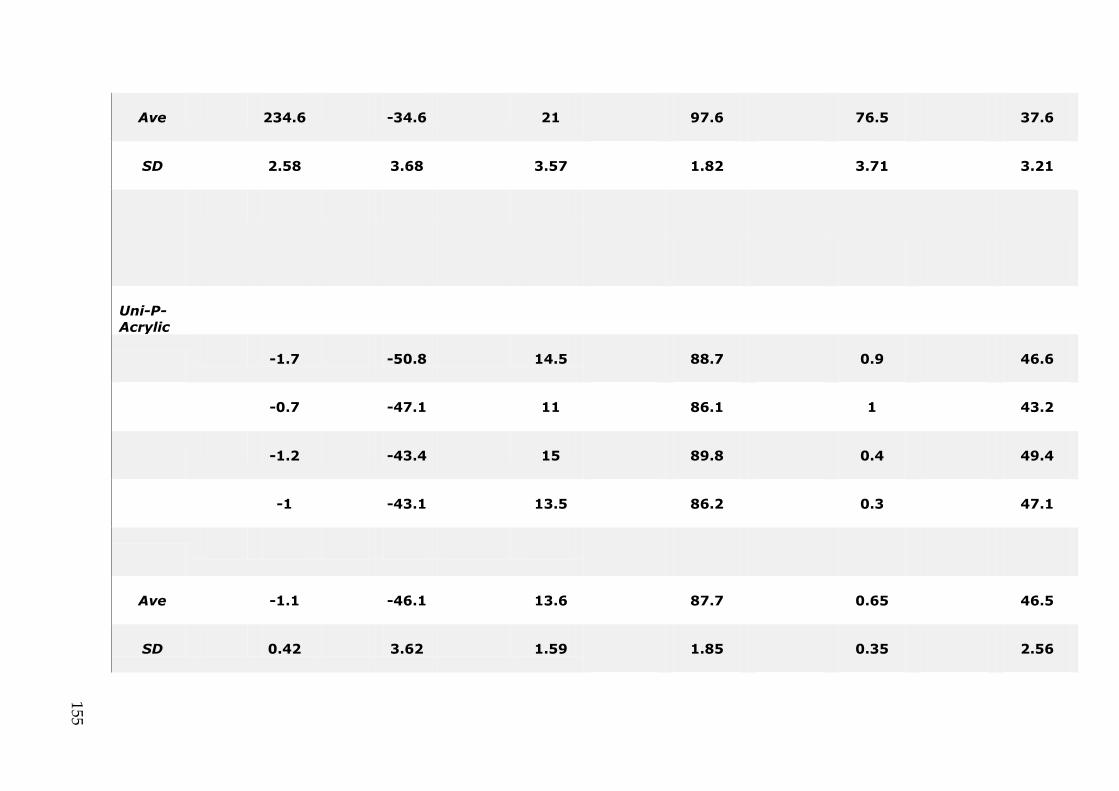
Ave 234.6 -34.6 21 97.6 76.5 37.6
SD 2.58 3.68 3.57 1.82 3.71 3.21
Uni-P-Acrylic
-1.7 -50.8 14.5 88.7 0.9 46.6
-0.7 -47.1 11 86.1 1 43.2
-1.2 -43.4 15 89.8 0.4 49.4
-1 -43.1 13.5 86.2 0.3 47.1
Ave -1.1 -46.1 13.6 87.7 0.65 46.5
SD 0.42 3.62 1.59 1.85 0.35 2.56
155

Uni-U-Metal
-17.8 14.9 6.5 -11.9 -1.2 -6.6
-24.1 12.3 4 -12 -0.6 -8.3
-18.8 17.7 3.6 -10.3 -2.2 -5.6
-18.7 16.5 1.7 -7.3 1.1 -4.3
Ave -19.9 15.4 4 -10.4 0.7 -6.2
SD 2.87 2.33 1.97 2.19 1.38 1.69
Uni-M-Metal
156
112

-47.6 32.4 5.8 -22.2 7.8 -3.5
-45.4 33.9 7.6 -19.7 6.2 -2.3
-48.8 30.5 7.2 -21 7.4 -3.5
-46.4 32.8 4.4 -23.2 6.6 -3.3
Ave -47.1 32.4 6.3 -21.5 7 -3.2
SD 1.47 1.42 1.45 1.51 0.73 0.57
Uni-P-Metal
-55.5 37.8 9.3 -32.4 11.1 -3.5
-56.7 44.8 9.4 -33.9 11.9 -2.1
-56.3 47.8 10.3 -32.6 11 -1.7
157
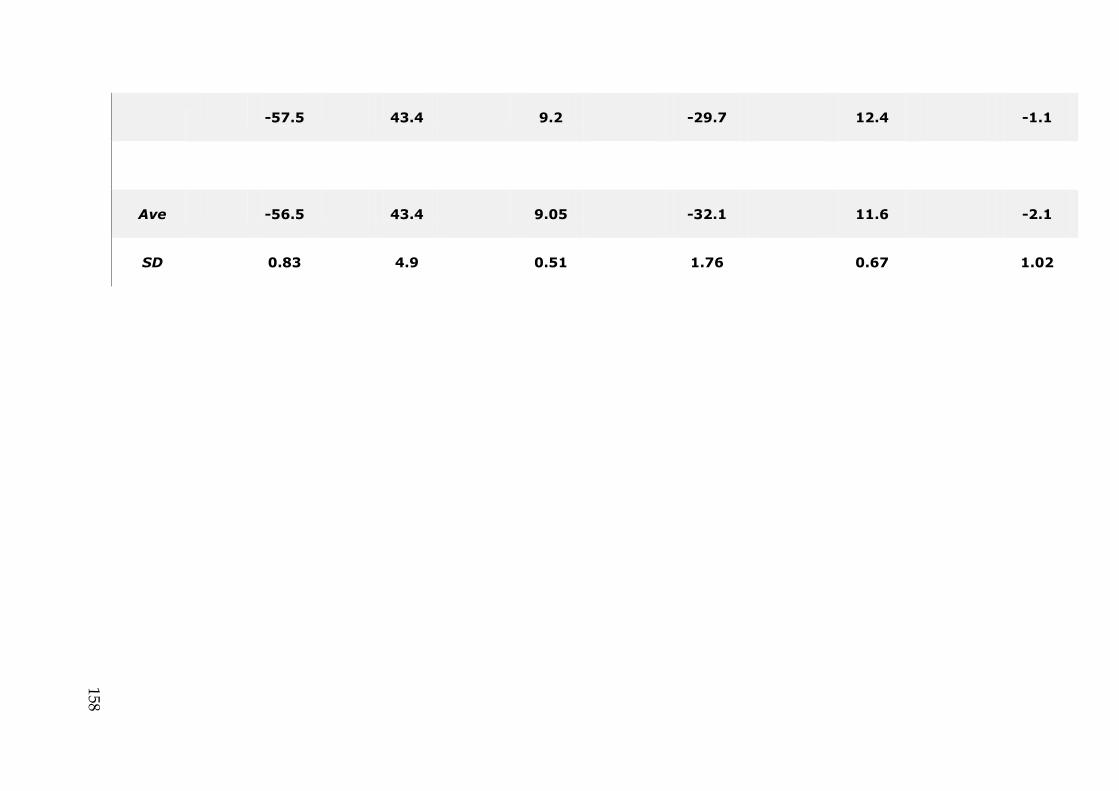
-57.5 43.4 9.2 -29.7 12.4 -1.1
Ave -56.5 43.4 9.05 -32.1 11.6 -2.1
SD 0.83 4.9 0.51 1.76 0.67 1.02
158