Embed Size (px)
Citation preview

Submitted 9 January 2015Accepted 18 February 2015Published 12 March 2015
Corresponding authorIrma Jarvela,[email protected]
Academic editorKeith Crandall
Additional Information andDeclarations can be found onpage 12
DOI 10.7717/peerj.830
Copyright2015 Kanduri et al.
Distributed underCreative Commons CC-BY 4.0
OPEN ACCESS
The effect of listening to music on humantranscriptomeChakravarthi Kanduri1, Pirre Raijas2, Minna Ahvenainen1,Anju K. Philips1, Liisa Ukkola-Vuoti1, Harri Lahdesmaki3 andIrma Jarvela1
1 Department of Medical Genetics, University of Helsinki, Finland2 DocMus Department, University of the Arts Helsinki, Helsinki, Finland3 Department of Information and Computer Science, Aalto University, AALTO, Finland
ABSTRACTAlthough brain imaging studies have demonstrated that listening to music altershuman brain structure and function, the molecular mechanisms mediatingthose effects remain unknown. With the advent of genomics and bioinformaticsapproaches, these effects of music can now be studied in a more detailed fashion. Toverify whether listening to classical music has any effect on human transcriptome,we performed genome-wide transcriptional profiling from the peripheral bloodof participants after listening to classical music (n = 48), and after a control studywithout music exposure (n = 15). As musical experience is known to influencethe responses to music, we compared the transcriptional responses of musicallyexperienced and inexperienced participants separately with those of the controls.Comparisons were made based on two subphenotypes of musical experience: musicalaptitude and music education. In musically experiencd participants, we observedthe differential expression of 45 genes (27 up- and 18 down-regulated) and 97 genes(75 up- and 22 down-regulated) respectively based on subphenotype comparisons(rank product non-parametric statistics, pfp 0.05, >1.2-fold change over timeacross conditions). Gene ontological overrepresentation analysis (hypergeometrictest, FDR < 0.05) revealed that the up-regulated genes are primarily known to beinvolved in the secretion and transport of dopamine, neuron projection, proteinsumoylation, long-term potentiation and dephosphorylation. Down-regulated genesare known to be involved in ATP synthase-coupled proton transport, cytolysis, andpositive regulation of caspase, peptidase and endopeptidase activities. One of themost up-regulated genes, alpha-synuclein (SNCA), is located in the best linkageregion of musical aptitude on chromosome 4q22.1 and is regulated by GATA2, whichis known to be associated with musical aptitude. Several genes reported to regulatesong perception and production in songbirds displayed altered activities, suggestinga possible evolutionary conservation of sound perception between species. Weobserved no significant findings in musically inexperienced participants.
Subjects Genetics, GenomicsKeywords Music, RNA, Gene expression profiling, Dopamine, Long-term potentiation,Genomics, Peripheral blood, SNCA
How to cite this article Kanduri et al. (2015), The effect of listening to music on human transcriptome. PeerJ 3:e830;DOI 10.7717/peerj.830

INTRODUCTIONListening to music is common in all societies. A plethora of neurophysiological studies
have demonstrated that listening to and/or playing music has multiple measurable effects
on human brain structure and function (Elbert et al., 1995; Blood & Zatorre, 2001; Sutoo
& Akiyama, 2004; Koelsch, 2011; Salimpoor et al., 2011; Salimpoor et al., 2013; Herholz
& Zatorre, 2012; Chanda & Levitin, 2013). In investigations using positron emission
tomography (PET), music listening has been reported to cause physiological changes
in cerebral blood flow, cardiovascular and muscle function, and enhanced dopamine
secretion in the human brain (Sutoo & Akiyama, 2004; Angelucci et al., 2007; Salimpoor
et al., 2011). Music has been demonstrated to regulate emotions and evoke pleasure,
primarily through its action on the brain’s reward centres like the limbic and mesolimbic
structures including the nucleus accumbens, hypothalamus, subcallosal cingulate gyrus,
pre-frontal anterior cingulate, and hippocampus (Brown, Martinez & Parsons, 2004;
Koelsch, 2011; Koelsch, 2014; Salimpoor et al., 2011; Salimpoor et al., 2013). Music has
also been used as a therapeutic tool in clinical settings (AMTA, 2014; Conrad, 2010; Holmes,
2012). However, the molecular mechanisms and biological pathways mediating the effects
of music remain unknown.
Genomics and bioinformatics offer methods (Lander, 2011) to explore the biology and
evolution of music and sounds at the molecular level. To date, few genome-wide scans have
been performed in musical traits in humans (Asher et al., 2008; Pulli et al., 2008; Park et
al., 2012; Oikkonen et al., 2014). Genome-wide expression analysis can be applied to study
human traits in an unbiased, hypothesis-free fashion based on their molecular properties,
rather than anatomic regions. Here, we have utilized a combination of genomic and bioin-
formatic methods to analyze the effect of classical music on the peripheral whole blood
transcriptome. Peripheral blood was used, as brain samples are inaccessible in humans.
MATERIALS AND METHODSEthics statementThe Ethics Committee of Helsinki University Central Hospital approved this study. Written
informed consent was obtained from all the participants.
Participants and phenotypesA total of 48 individuals (aged 18–73; mean 42.5) participated in the study (Table S1). All
the 48 participants were characterized for musical aptitude and music education. Musical
aptitude was measured using three tests: the auditory structuring ability test (Karma
music test) (Karma, 2007), and the Seashore tests for pitch and for time (Seashore, Lewis
& Saetveit, 1960). Details of the tests have been described in Oikkonen et al. (2014). A
combined score of the three tests (COMB score; range 0–150) was used to define musical
aptitude. COMB scores were classified as either high or low based on the upper and
lower quartiles of score distribution. Data on music education were collected using a
questionnaire. The self-reported levels of music education (referred to as edu classes 1–4),
received through studies or degrees from music schools, institutes, or universities, were
Kanduri et al. (2015), PeerJ, DOI 10.7717/peerj.830 2/17
Table 1 Phenotype characteristics of the sample set (total n = 48).
Phenotype n*
Edu classes 1–2 19
Edu classes 3–4 29
Low COMB scores 12
High COMB scores 12
Male 22
Female 26
Notes.* n represents the number of participants within each category.
classified as follows: 1 represents no music education; 2 represents music education of less
than two years; 3 represents music education of more than ten years; and 4 represents a
professional musician. The approximate time of systematic music education and training
was 21.42 years on average, in participants of edu classes 3–4. Table 1 shows the sample’s
phenotype characteristics.
Exposure to musicTo our knowledge, no previous studies have systematically studied the effect of listening
to music on genome-wide transcriptional profiles of humans. We have previously shown
that music-listening habits vary a lot among listeners (Ukkola-Vuoti et al., 2011). To start
with, we chose to study the effect of classical music, Wolfgang Amadeus Mozart’s Violin
Concerto No. 3 in G major, K.216 because it is relatively familiar in the western culture.
As the human brain perceives complex sounds in a millisecond-level time frame (Wang et
al., 2009; Kayser, Logothetis & Panzeri, 2010), we expected that the 20 min-listening session
(duration that the concerto lasts) will induce an effect of music on human transcriptome.
In studies on the effect of pain in humans, very short durations of pain induction (8
to 150 s) have been used (Hubbard et al., 2011). The participants were unaware of the
type of music that was intended for the listening session. Peripheral blood samples were
collected from all the 48 participants just before and after the listening session. From here
on, participants who listened to music are referred to as listeners throughout the text.
Control studyThe same 48 participants were invited to a control study. Of these, 15 participants could
attend. The participants were advised to avoid listening to music and hard exercise the day
before the control study. The control study was performed in a ‘music-free’ environment,
where the participants had an opportunity to converse, read a magazine, or take a walk
outside (no exercise) during the session. Peripheral blood samples were collected from the
participants just before and after 20 min in the control session (the same duration as in
the listening session). From here on, participants of the control session are referred to as
controls throughout the text.
Kanduri et al. (2015), PeerJ, DOI 10.7717/peerj.830 3/17
Genome-wide expression profilingFor this procedure, 2 × 2.5 ml samples of peripheral blood were drawn into PAXgene
blood RNA tubes (PreAnalytiX GmbH, Hombrechtikon, Switzerland) as per the kit
instructions, in both of the sessions. Total RNA was isolated using the PAXgene blood
miRNA Kit (PreAnalytiX GmbH, Hombrechtikon, Switzerland) as per the kit manual.
Purified RNA samples were measured for concentration and purity on the NanoDrop
1000 v.3.7 (Thermo Fisher Scientific, Waltham, Massachusetts, USA). Globin mRNA
was depleted from our samples using Ambion’s Human GLOBINclearTM kit (Applied
Biosystems, Carlsbad, California, USA) as per the kit insert. The samples were measured on
the NanoDrop 1000 to determine the sample concentration and purity and for integrity on
the 2100 Bioanalyzer (Agilent Technologies, Waldbronn, Germany) before being diluted
to 50 ng/µl using RNase-free water. A total of 2 µg of RNA was assayed on the Illumina
HumanHT-12 v4 bead array (Illumina Inc., San Diego, California, USA), which targets
more than 47,000 probes. The gene expression profiling assays for the listening and
control sessions were conducted in two separate batches. To account for the batch effect
corrections, six samples from the listening session were assayed together with the control
session samples. Intensity data were exported through Bead Studio software. The data
reported in this article have been deposited in the Gene Expression Omnibus database,
www.ncbi.nlm.nih.gov/geo (accession no. GSE48624).
Data preprocessingThe Lumi package was used to read and preprocess the signal intensity data. Specifically,
pre-processing included background correction, variance stabilizing transformation,
and quantile normalization. Data from both the listening (n = 48) and control (n = 15)
sessions were normalized separately. Five samples from the control session were excluded
from further analyses owing to data quality. In addition, we used the ComBat method
(Johnson, Li & Rabinovic, 2007) to adjust for batch effects and determine if this correction
affected the pre-post fold-changes across conditions. However, we did not find significant
differences between the fold-changes of corrected and uncorrected data over time across
conditions. Therefore, we chose to proceed with the uncorrected data owing to the
strengths of our analysis methods as described below. After normalization, duplicate
and un-annotated probes were excluded using the genefilter package (R package version
1.40.0). Before extracting the expression values from the normalized data, Illumina’s
detection p-values (threshold: 0.01) were used to filter out probes with low intensities
corresponding to the background signal. Finally, only those probes that were expressed in
at least half of all of the arrays (listening and control sessions) were chosen for the study.
Differential expression analysisThe choice of an appropriate statistical test for the identification of differentially expressed
genes depends upon several aspects of the data including the underlying distribution,
homogeneity, and the sample size. As the statistical tests for normality are known to be
sensitive to sample size, we used a normal Q-Q plot to get a glimpse of the distribution of
Kanduri et al. (2015), PeerJ, DOI 10.7717/peerj.830 4/17

the data. For this, we randomly visualized the distribution of transcriptional responses of
control samples (n = 10) for several transcripts (Fig. S1) using normal Q-Q plots. We ob-
served that the data appeared to deviate from normality in several instances. As the central
limit theorem does not always hold true for small sample sizes, a cautious approach here
would be to employ a non-parametric test (better being safe than sorry). Non-parametric
tests are deemed to be appropriate analysis tools when the distribution of data is difficult
to characterize, because they make less stringent distributional assumptions. Therefore, we
chose to use the rank product (Breitling et al., 2004) non-parametric test statistic, which is
relatively powerful especially for small sample sizes, and when the data is heterogeneous
and does not meet normality. Rank product-based methods outperformed several other
methods including empirical Bayes statistic (limma) and SAM, when the sample size
is small and when the data is non-homogeneous (Jeffery, Higgins & Culhane, 2006).
Also, a comparison of eight gene ranking methods using Microarray Quality Control
datasets (golden-standard) has demonstrated the high sensitivity and specificity of the
rank product method (Kadota & Shimizu, 2011).
To identify the differentially expressed genes, we compared the magnitude of pre-post
changes in gene expression across conditions using the rank product method implemented
in the RankProd Bioconductor package. Based on the estimated percentage of false predic-
tions (pfp), RankProd employs a non-parametric statistic to identify genes that are consis-
tently ranked high among the most up- or down-regulated genes in replicate experiments.
Instead of analyzing the actual expression value, this method utilizes the ranks of genes
in each sample. The strength of rank product method allows us to compare and combine
the datasets of the listening and control studies. After the identification of differentially
expressed genes using a pfp of 0.05 in RankProd, we selected only those genes that exceeded
an effect-size cut-off (>1.2-fold change over time across conditions, and at least a pre-post
change of 10% in gene expression in the listening session). Here, we would like to point
out a couple of aspects of these selection criteria. First, pfp employed by RankProd is
equivalent to the standard false discovery rate (FDR). Second, there exists a widespread
misconception that only two-fold changes are significant (Hoheisel, 2006) and that false
notion is based on the very initial publications of microarray studies, which used a two-
fold change criteria for a particular group of experiments because of biological relevance.
Fold-change thresholds are completely arbitrary and in the majority of the cases they
depend upon the underlying biological question. For example, studies that investigated
the effect of gene-environment interactions (socio-environmental effect (Cole et al., 2007),
yogic meditation effect (Black et al., 2012)) used unorthodox fold-change thresholds.
We further performed successive functional annotation analyses using GeneTrail
(http://genetrail.bioinf.uni-sb.de/) and IPA (Ingenuity® Systems, www.ingenuity.com).
The gene ontological overrepresentation analysis in GeneTrail uses a hypergeometric
distribution test along with a conservative multiple testing correction method (FDR
< 0.05) to assess whether genes belonging to certain functional categories are enriched
in the dataset. In addition to the standard gene ontology analyses, we performed upstream
transcription regulator analysis, which essentially predicts all the upstream transcription
Kanduri et al. (2015), PeerJ, DOI 10.7717/peerj.830 5/17

regulators (transcription factors, receptors, cytokines, microRNA, and kinases) that could
have possibly mediated the observed differential expression. Based on the overlap between
known targets of a transcription regulator and the set of differentially expressed genes, an
overlap p-value is computed using Fisher’s exact test (p < 0.01). Further, the activation
states of the predicted transcription regulators are also inferred using an activation Z-score,
which is based on literature-derived knowledge on the direction of regulation (either
activating or inhibiting).
RESULTSTranscriptional responses after a control sessionFirst we assessed the homogeneity of transcriptional responses in the control session.
For this, we analyzed whether the transcriptional responses of participants belonging
to edu classes 3–4 (n = 4) and edu classes 1–2 (n = 6) differed in the control session.
Only 4 genes were found to be differentially expressed, suggesting no major differences
in the transcriptional responses between groups to a ‘non-musical activity.’ Therefore,
we used the expression data of the whole ‘music-free’ control group as a reference for the
comparative analyses.
We used Spearman’s rank-based correlation to check for each gene, whether the
transcriptional responses correlated with the age or sex of the participants in either
the listening session (n = 48) or the control sessions (n = 10). After multiple testing
corrections, we found no significant effects of age or sex on the transcriptional responses.
Transcriptional response after listening to musicBased on neuroscientific studies, the brains of musicians and non-musicians differ
structurally and functionally (Elbert et al., 1995; Gaser & Schlaug, 2003). This led us to ask
whether the transcriptional responses of musically experienced participants would differ
from those of musically inexperienced participants when listening to music. Therefore,
we compared the transcriptional responses of listening to music separately for musically
experienced and inexperienced participants vs controls. Comparisons were made based on
two subphenotypes of musical experience: musical aptitude and music education.
First, we compared the magnitude of pre-post fold-changes in the genome-wide
transcriptional profiles of listeners of edu classes 3–4 (n = 29) and controls (n = 10).
Using RankProd non-parametric statistics and stringent selection criteria, we identified
45 differentially expressed genes (27 up-regulated and 18 down-regulated). Next, we
compared the genome-wide transcriptional profiles of listeners with high COMB scores
(n = 12) and controls (n = 10). Similar statistical analysis identified 97 differentially
expressed genes (75 up-regulated and 22 down-regulated). The differentially expressed
genes from both the comparisons are listed in Table S2, and a comparison of the pre-post
changes in both conditions is shown in Fig. 1.
Functional annotationBased on gene ontology analyses (Table S3), the genes up-regulated in the listeners of
edu classes 3–4 are known to be primarily involved in the regulation, secretion and
Kanduri et al. (2015), PeerJ, DOI 10.7717/peerj.830 6/17
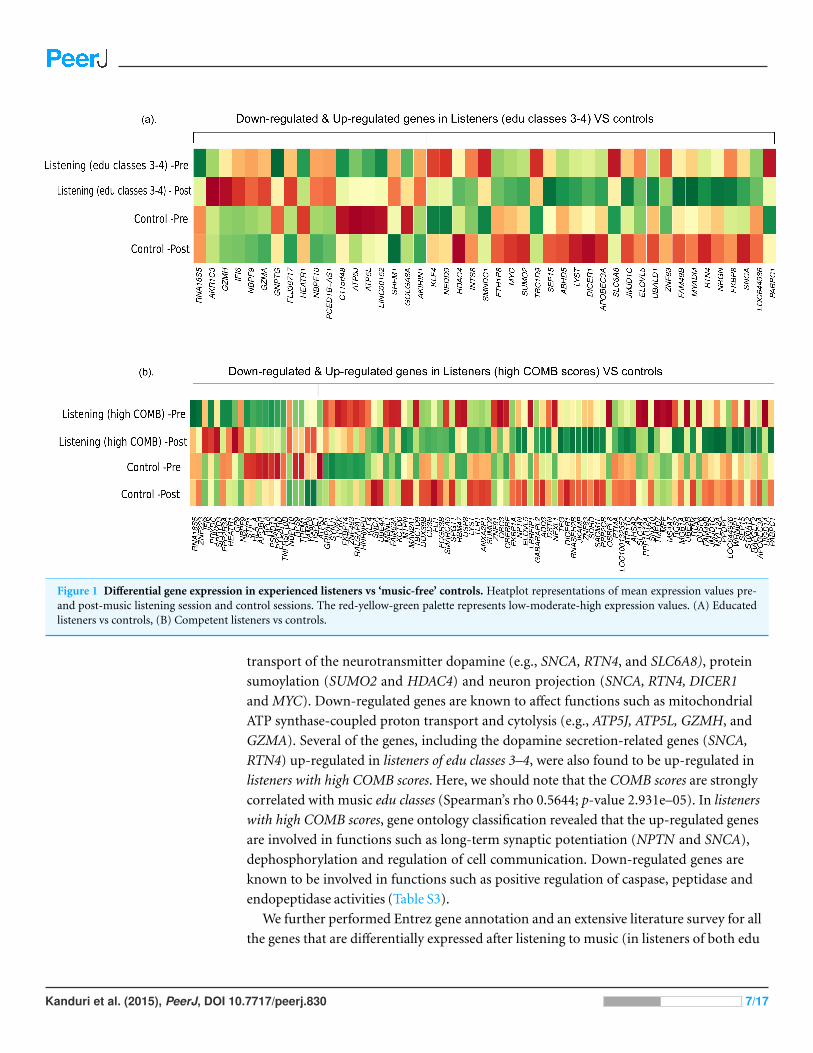
Figure 1 Differential gene expression in experienced listeners vs ‘music-free’ controls. Heatplot representations of mean expression values pre-and post-music listening session and control sessions. The red-yellow-green palette represents low-moderate-high expression values. (A) Educatedlisteners vs controls, (B) Competent listeners vs controls.
transport of the neurotransmitter dopamine (e.g., SNCA, RTN4, and SLC6A8), protein
sumoylation (SUMO2 and HDAC4) and neuron projection (SNCA, RTN4, DICER1
and MYC). Down-regulated genes are known to affect functions such as mitochondrial
ATP synthase-coupled proton transport and cytolysis (e.g., ATP5J, ATP5L, GZMH, and
GZMA). Several of the genes, including the dopamine secretion-related genes (SNCA,
RTN4) up-regulated in listeners of edu classes 3–4, were also found to be up-regulated in
listeners with high COMB scores. Here, we should note that the COMB scores are strongly
correlated with music edu classes (Spearman’s rho 0.5644; p-value 2.931e–05). In listeners
with high COMB scores, gene ontology classification revealed that the up-regulated genes
are involved in functions such as long-term synaptic potentiation (NPTN and SNCA),
dephosphorylation and regulation of cell communication. Down-regulated genes are
known to be involved in functions such as positive regulation of caspase, peptidase and
endopeptidase activities (Table S3).
We further performed Entrez gene annotation and an extensive literature survey for all
the genes that are differentially expressed after listening to music (in listeners of both edu
Kanduri et al. (2015), PeerJ, DOI 10.7717/peerj.830 7/17
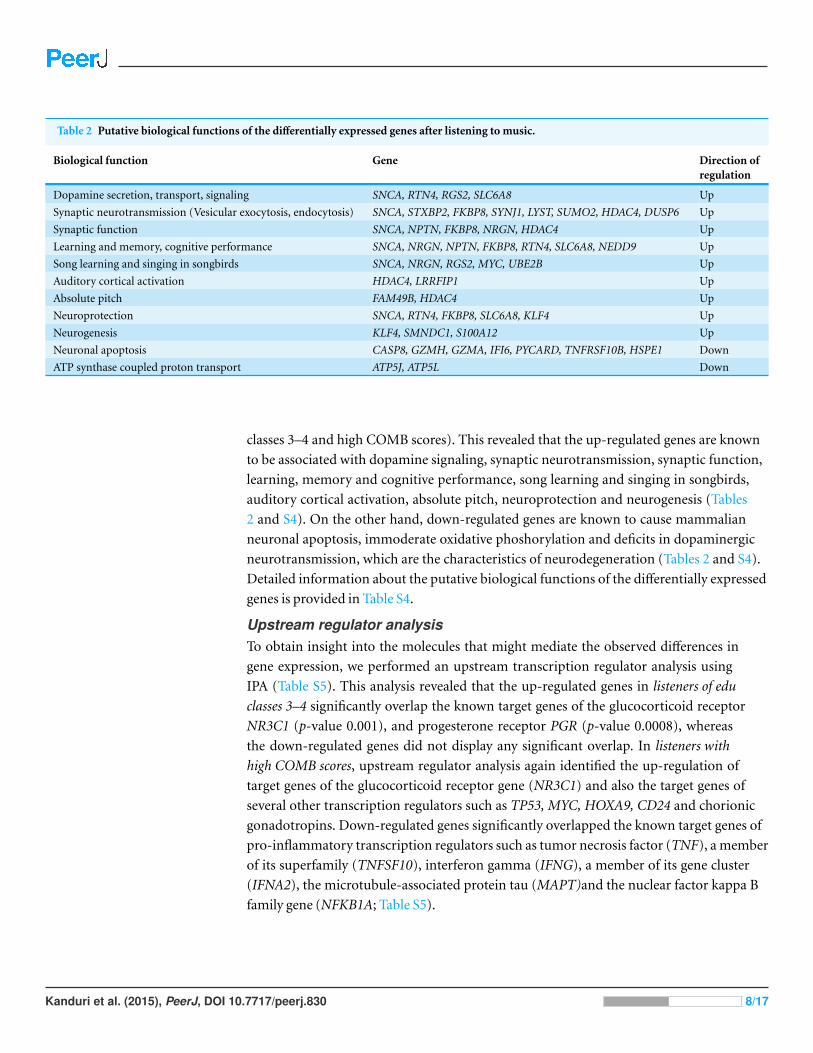
Table 2 Putative biological functions of the differentially expressed genes after listening to music.
Biological function Gene Direction ofregulation
Dopamine secretion, transport, signaling SNCA, RTN4, RGS2, SLC6A8 Up
Synaptic neurotransmission (Vesicular exocytosis, endocytosis) SNCA, STXBP2, FKBP8, SYNJ1, LYST, SUMO2, HDAC4, DUSP6 Up
Synaptic function SNCA, NPTN, FKBP8, NRGN, HDAC4 Up
Learning and memory, cognitive performance SNCA, NRGN, NPTN, FKBP8, RTN4, SLC6A8, NEDD9 Up
Song learning and singing in songbirds SNCA, NRGN, RGS2, MYC, UBE2B Up
Auditory cortical activation HDAC4, LRRFIP1 Up
Absolute pitch FAM49B, HDAC4 Up
Neuroprotection SNCA, RTN4, FKBP8, SLC6A8, KLF4 Up
Neurogenesis KLF4, SMNDC1, S100A12 Up
Neuronal apoptosis CASP8, GZMH, GZMA, IFI6, PYCARD, TNFRSF10B, HSPE1 Down
ATP synthase coupled proton transport ATP5J, ATP5L Down
classes 3–4 and high COMB scores). This revealed that the up-regulated genes are known
to be associated with dopamine signaling, synaptic neurotransmission, synaptic function,
learning, memory and cognitive performance, song learning and singing in songbirds,
auditory cortical activation, absolute pitch, neuroprotection and neurogenesis (Tables
2 and S4). On the other hand, down-regulated genes are known to cause mammalian
neuronal apoptosis, immoderate oxidative phoshorylation and deficits in dopaminergic
neurotransmission, which are the characteristics of neurodegeneration (Tables 2 and S4).
Detailed information about the putative biological functions of the differentially expressed
genes is provided in Table S4.
Upstream regulator analysisTo obtain insight into the molecules that might mediate the observed differences in
gene expression, we performed an upstream transcription regulator analysis using
IPA (Table S5). This analysis revealed that the up-regulated genes in listeners of edu
classes 3–4 significantly overlap the known target genes of the glucocorticoid receptor
NR3C1 (p-value 0.001), and progesterone receptor PGR (p-value 0.0008), whereas
the down-regulated genes did not display any significant overlap. In listeners with
high COMB scores, upstream regulator analysis again identified the up-regulation of
target genes of the glucocorticoid receptor gene (NR3C1) and also the target genes of
several other transcription regulators such as TP53, MYC, HOXA9, CD24 and chorionic
gonadotropins. Down-regulated genes significantly overlapped the known target genes of
pro-inflammatory transcription regulators such as tumor necrosis factor (TNF), a member
of its superfamily (TNFSF10), interferon gamma (IFNG), a member of its gene cluster
(IFNA2), the microtubule-associated protein tau (MAPT)and the nuclear factor kappa B
family gene (NFKB1A; Table S5).
Kanduri et al. (2015), PeerJ, DOI 10.7717/peerj.830 8/17
Transcriptional responses of participants with no significant experienceFurthermore, we repeated similar analyses to compare the magnitude of pre-post
fold-changes over time in listeners of edu classes 1–2 vs controls and listeners with low
COMB scores vs controls. Using the same analysis methods and selection criteria to identify
the differentially expressed genes, we identified 8 and 22 differentially expressed genes,
respectively in the comparisons. However, functional characterization of those genes did
not reveal any significant findings.
DISCUSSIONThe findings of this study suggest that listening to classical music has an effect on human
transcriptome. The up-regulation of genes related to dopamine secretion and signaling is
in agreement with the previous neuroimaging-based evidences (Salimpoor et al., 2011).
Particularly, alpha-synuclein (α-synuclein; SNCA), one of the most up-regulated genes, is
involved in dopamine (DA) neuronal homeostasis (Murphy et al., 2000; Oczkowska et al.,
2013). Interestingly, SNCA is located on chromosome 4q22.1, the most significant region
of linkage for musical aptitude (Pulli et al., 2008; Oikkonen et al., 2014) and regulated
by GATA2 (Scherzer et al., 2008), which is associated with musical aptitude (Oikkonen
et al., 2014) (Fig. 2). These data provide convergent evidence about the molecular basis
of musical traits from both DNA and RNA studies. Another finding from the upstream
regulator analysis suggests that listening to music primarily increased the expression of the
target genes of the glucocorticoid receptor (NR3C1). Notably, dopaminoceptive neuronal
glucocorticoid receptor has been described as a key molecule in the regulation of addictive
behavior. By reducing dopamine re-uptake, NR3C1 increases the synaptic concentration
of dopamine, which leads to rewarding and reinforcing properties (Ambroggi et al., 2009)
that have previously been linked to listening to music (Blood & Zatorre, 2001; Koelsch,
2011; Koelsch, 2014; Salimpoor et al., 2011; Salimpoor et al., 2013).
The up-regulation of genes related to synaptic vesicular exocytosis, endocytosis,
neurotransmission and plasticity seems perfectly rational here because the majority of
these biological processes are essential for the secretion and signaling of neurotransmitters
(Sudhof & Rizo, 2011; Saheki & De Camilli, 2012). As listening to music has been known
to induce the secretion and signaling of a neurotransmitter, dopamine (Sutoo & Akiyama,
2004; Salimpoor et al., 2011), we can speculate the role of these up-regulated genes in
facilitating dopaminergic neurotransmission after listening to music. Moreover, some of
the up-regulated genes have evident roles in enhancing cognitive functions like long-term
potentiation (LTP) and memory. In previous behavioral studies, music education and
training have proven to have beneficial effects on cognitive development, cognitive
performance, verbal and long-term memories (Rammsayer & Brandler, 2003; Schlaug et
al., 2005; Sluming et al., 2007; Wong et al., 2007; Roden, Kreutz & Bongard, 2012; Rodrigues,
Loureiro & Caramelli, 2013).
Several of the differentially expressed genes have been demonstrated to be responsible
for song learning and singing in songbirds (Wada et al., 2006), which suggests a possible
evolutionary conservation in biological processes related to sound perception. Further-
Kanduri et al. (2015), PeerJ, DOI 10.7717/peerj.830 9/17

Figure 2 Schematic representation of chromosome 4. The α-synuclein gene (SNCA) that was foundto be up-regulated after music perception in this study is located in the best linkage region of musicalaptitude as shown by Pulli et al. (2008), Park et al. (2012) and Oikkonen et al. (2014). GATA2, whichis located in the best genome-wide association region of musical aptitude (Oikkonen et al., 2014) andregulates the SNCA, is also shown.
more, the up-regulation of genes associated with human auditory cortical activation
(Renvall et al., 2012) and absolute pitch (Theusch, Basu & Gitschier, 2009; Gervain et al.,
2013) are logical, because listening to music involves both of those auditory phenomena.
Auditory perception processes have been known to exhibit convergent evolution across
species. Notably, the human auditory center is identical to those of the first primates who
inhabited the planet millions of years ago (Langner , 1992; Montealegre-Z et al., 2012). In
addition, widespread adaptive convergent sequence evolution has been found recently in
hearing-related genes in echolocating bats and dolphins (Parker et al., 2013). Similarly,
convergent sequence evolution has also been identified in vocal-learning birds and
mammals (Zhang et al., 2014). More recently, convergent gene expression specializations
have been detected in songbirds and humans in the regions of brain that are essential
for auditory perception and speech production (Pfenning et al., 2014). Thus, the genes
detected by Pfenning et al. (2014), in general, represent the genes belonging to auditory
perception pathway in both songbirds and humans. Here, genes belonging to the auditory
perception pathway (∼2-fold enrichment; p-value: 0.028; two-sided Fisher’s exact test)
were found to be enriched among the genes that are differentially expressed after listening
to music. This suggests that our results serve as a relevant molecular background for music
perception in humans.
The widely-documented neuroprotective role of some of the up-regulated genes and
the down-regulation of several neurodegeneration-inducing genes support the notion of a
neuroprotective role for music and may provide a working mechanism for the use of music
therapy, especially in treating neurodegenerative diseases (AMTA, 2014; Conrad, 2010;
Holmes, 2012).
Kanduri et al. (2015), PeerJ, DOI 10.7717/peerj.830 10/17
In this study, significant transcriptional responses were observed only in individuals
who either have substantial periods of music education/training or have relatively
higher musical aptitude scores. This suggests that certain musical abilities (either innate
or acquired through music education) may influence the transcriptional responses of
listening to music. Previous works have shown that the familiarity of music attained
through music education or repeated music exposure is known to largely influence the
rewarding aspects of listening to music (Sarkamo et al., 2008; Salimpoor et al., 2009;
Van den Bosch, Salimpoor & Zatorre, 2013; Schubert, Hargreaves & North, 2014). Here,
we acknowledge that the effect of music exposure on human gene expression could be very
subjective and may vary depending on several factors such as age, sex, culture, previous
listening habits, music education and training and personal liking of music, as recently
discussed (Wong et al., 2007; Salimpoor et al., 2009; Van den Bosch, Salimpoor & Zatorre,
2013; Mikutta et al., 2014). To be able to comprehensively characterize the transcriptomic
alterations of music-listening, further studies are required to assess the effect of listening to
different genres of music, at different ages, in different ethnicities and in individuals with
varying music education levels and listening habits, with varying durations of listening.
The participants, who listened to music in this study, were unaware of the type of music
that was intended for the listening session. Similarly, without further details about the
intended activity, the participants were invited to attend a ‘music-free’ control session.
Here, it is crucial to discuss the association between ‘anticipation’ and ‘listening to
music.’ Anticipation is always involved in listening to music (Salimpoor et al., 2011). The
unveiling of series of tones with time evokes anticipatory responses because of the cognitive
expectations and prediction cues (Huron, 2006; Meyer, 2008). Functional neuroimaging
studies have successfully distinguished the anatomical regions that respond to anticipation
and consumption of music (Salimpoor et al., 2011). However, distinguishing the human
gene expression signatures of anticipatory and consummatory responses of music is not yet
feasible. Therefore, even if we perform a blinded experiment here, we might not be able to
exclude the effect of anticipation or expectation.
As brain samples are inacesssibile in this type of study, we used peripheral blood as a
window to the study the effects of listening to music. Peripheral blood is known to share
more than 80% of the transciptome and significant gene expression similarities with
other tissues including multiple regions of brain (Liew et al., 2006; Sullivan, Fan & Perou,
2006; Tylee, Kawaguchi & Glatt, 2013). Thus, peripheral blood could certainly provide
surrogate information concerning gene expression in brain tissue for a subset of genes
(Davies et al., 2009). For instance, the molecular alterations in dopamine metabolism and
mitochondrial function, which are the potential hallmarks of Parkinson’s disease, have
been detected in peripheral blood (Scherzer et al., 2007). Notably, genes that are responsive
to physiological stimuli (which are earlier thought to be tissue-specific) and genes involved
in neuroendocrine pathways (e.g., hormone receptors, neurotransmitter receptors) are
expressed in the peripheral blood. Because of these characteristics, peripheral blood has
been used as a proxy in several studies when a specific tissue is not available (e.g., human
brain), especially in behavioral and neurodegenerative studies (Mohr & Liew, 2007). In
Kanduri et al. (2015), PeerJ, DOI 10.7717/peerj.830 11/17
the wake of all these findings, a subset of the molecular mechanisms identified here may
legitimately reflect the transcriptomic alterations in brain after listening to music.
ACKNOWLEDGEMENTSWe thank all of the participants for their generous cooperation. We thank Paivi Onkamo
for her constructive comments about the manuscript. We are grateful to Petri Myllynen,
Sanna Pyy, Laura Salmela, Sonja Suhonen, Jaana Oikkonen and Kai Karma for expert
technical help. We thank the High-Throughput Genomics Group at the Wellcome Trust
Centre for Human Genetics for the generation of the Gene Expression data.
ADDITIONAL INFORMATION AND DECLARATIONS
FundingThe Academy of Finland (grant reference #13371) and the Biocentrum Helsinki Founda-
tion supported this work. The funders had no role in study design, data collection and
analysis, decision to publish, or preparation of the manuscript.
Grant DisclosuresThe following grant information was disclosed by the authors:
The Academy of Finland: #13371.
Biocentrum Helsinki Foundation.
Competing InterestsThe authors declare there are no competing interests.
Author Contributions• Chakravarthi Kanduri analyzed the data, wrote the paper, prepared figures and/or tables,
reviewed drafts of the paper.
• Pirre Raijas and Liisa Ukkola-Vuoti contributed reagents/materials/analysis tools,
reviewed drafts of the paper.
• Minna Ahvenainen and Anju K. Philips performed the experiments, reviewed drafts of
the paper.
• Harri Lahdesmaki conceived and designed the experiments, reviewed drafts of the
paper.
• Irma Jarvela conceived and designed the experiments, wrote the paper, reviewed drafts
of the paper.
Human EthicsThe following information was supplied relating to ethical approvals (i.e., approving body
and any reference numbers):
The Ethics Committee of Helsinki University Central Hospital approved this study
(permission number 233/13/03/2013). Written informed consent was obtained from all
the participants.
Kanduri et al. (2015), PeerJ, DOI 10.7717/peerj.830 12/17
Microarray Data DepositionThe following information was supplied regarding the deposition of microarray data:
The data reported in this paper have been deposited in the Gene Expression Omnibus
(GEO) database, www.ncbi.nlm.nih.gov/geo (accession no. GSE48624).
Supplemental InformationSupplemental information for this article can be found online at http://dx.doi.org/
10.7717/peerj.830#supplemental-information.
REFERENCESAmbroggi F, Turiault M, Milet A, Deroche-Gamonet V, Parnaudeau S, Balado E, Barik J,
Van der Veen R, Maroteaux G, Lemberger T, Schutz G, Lazar M, Marinelli M, Piazza PV,Tronche F. 2009. Stress and addiction: glucocorticoid receptor in dopaminoceptive neuronsfacilitates cocaine seeking. Nature Neuroscience 12:247–249 DOI 10.1038/nn.2282.
AMTA. 2014. Music therapy fact sheets & bibliographies. Silver Spring: American Music TherapyAssociation (AMTA).
Angelucci F, Ricci E, Padua L, Sabino A, Tonali PA. 2007. Music exposure differentially alters thelevels of brain-derived neurotrophic factor and nerve growth factor in the mouse hypothalamus.Neuroscience Letters 429:152–155 DOI 10.1016/j.neulet.2007.10.005.
Asher JE, Lamb JA, Brocklebank D, Cazier JB, Maestrini E, Addis L, Sen M, Baron-Cohen S,Monaco AP. 2008. A whole-genome scan and fine-mapping linkage study of auditory-visualsynesthesia reveals rvidence of linkage to chromosomes 2q24, 5q33, 6p12, and 12p12. AmericanJournal of Human Genetics 84:279–285 DOI 10.1016/j.ajhg.2009.01.012.
Black DS, Cole SW, Irwin MR, Breen E, St Cyr NM, Nazarian N, Khalsa DS, Lavretsky H. 2012.Yogic meditation reverses NF-κB and IRF-related transcriptome dynamics in leukocytesof family dementia caregivers in a randomized controlled trial. Psychoneuroendocrinology38:348–355 DOI 10.1016/j.psyneuen.2012.06.011.
Blood AJ, Zatorre RJ. 2001. Intensely pleasurable responses to music correlate with activity inbrain regions implicated in reward and emotion. Proceedings of the National Academy of Sciencesof the United States of America 98:11818–11823 DOI 10.1073/pnas.191355898.
Breitling R, Armengaud P, Amtmann A, Herzyk P. 2004. Rank products: a simple, yet powerful,new method to detect differentially regulated genes in replicated microarray experiments. FEBSLetters 573:83–92 DOI 10.1016/j.febslet.2004.07.055.
Brown S, Martinez MJ, Parsons LM. 2004. Passive music listening spontaneously engages limbicand paralimbic systems. NeuroReport 15:2033–2037 DOI 10.1097/00001756-200409150-00008.
Chanda ML, Levitin DJ. 2013. The neurochemistry of music. Trends in Cognitive Sciences17:179–193 DOI 10.1016/j.tics.2013.02.007.
Cole SW, Hawkley LC, Arevalo JM, Sung CY, Rose RM, Cacioppo JT. 2007. Social regulation ofgene expression in human leukocytes. Genome Biology 8:R189 DOI 10.1186/gb-2007-8-9-r189.
Conrad C. 2010. Music for healing: from magic to medicine. Lancet 376:1980–1981DOI 10.1016/S0140-6736(10)62251-9.
Davies MN, Lawn S, Whatley S, Fernandes C, Williams RW, Schalkwyk LC. 2009. To what extentis blood a reasonable surrogate for brain in gene expression studies: estimation from mousehippocampus and spleen. Frontiers in Neuroscience 3:54.
Kanduri et al. (2015), PeerJ, DOI 10.7717/peerj.830 13/17

Elbert T, Pantev C, Wienbruch C, Rockstroh B, Taub E. 1995. Increased cortical representation ofthe fingers of the left hand in string players. Science 270:305–307DOI 10.1126/science.270.5234.305.
Gaser C, Schlaug G. 2003. Brain structures differ between musicians and non-musicians. TheJournal of Neuroscience 23:9240–9245.
Gervain J, Vines BW, Chen LM, Seo RJ, Hensch TK, Werker JF, Young AH. 2013. Valproatereopens critical-period learning of absolute pitch. Frontiers in Systems Neuroscience7:102 DOI 10.3389/fnsys.2013.00102.
Herholz SC, Zatorre RJ. 2012. Musical training as a framework for brain plasticity: behavior,function, and structure. Neuron 76:486–502 DOI 10.1016/j.neuron.2012.10.011.
Hoheisel JD. 2006. Microarray technology: beyond transcript profiling and genotype analysis.Nature Reviews. Genetics 7:200–210.
Holmes D. 2012. Music therapy’s breakthrough act. Lancet Neurology 11:486–487DOI 10.1016/S1474-4422(12)70126-6.
Hubbard CS, Ornitz E, Gaspar JX, Smith S, Amin J, Labus JS, Kilpatrick LA, Rhudy JL,Mayer EA, Naliboff BD. 2011. Modulation of nociceptive and acoustic startle responses to anunpredictable threat in men and women. Pain 152:1632–1640 DOI 10.1016/j.pain.2011.03.001.
Huron DB. 2006. Sweet anticipation: music and the psychology of expectation. Cambridge: MITPress.
Jeffery IB, Higgins DG, Culhane AC. 2006. Comparison and evaluation of methods forgenerating differentially expressed gene lists from microarray data. BMC Bioinformatics7:359 DOI 10.1186/1471-2105-7-359.
Johnson WE, Li C, Rabinovic A. 2007. Adjusting batch effects in microarray expression data usingempirical Bayes methods. Biostatistics 8:118–127 DOI 10.1093/biostatistics/kxj037.
Kadota K, Shimizu K. 2011. Evaluating methods for ranking differentially expressed genes appliedto microArray quality control data. BMC Bioinformatics 12:227DOI 10.1186/1471-2105-12-227.
Karma K. 2007. Musical aptitude definition and measure validation: ecological validity canendanger the construct validity of musical aptitude tests. Psychomusicology: A Journal ofResearch in Music Cognition 19:79–90 DOI 10.1037/h0094033.
Kayser C, Logothetis NK, Panzeri S. 2010. Millisecond encoding precision of auditory cortexneurons. Proceedings of the National Academy of Sciences of the United States of America107:16976–16981 DOI 10.1073/pnas.1012656107.
Koelsch S. 2011. Toward a neural basis of music perception—a review and updated model.Frontiers in Psychology 2:110 DOI 10.3389/fpsyg.2011.00110.
Koelsch S. 2014. Brain correlates of music-evoked emotions. Nature Reviews Neuroscience15:170–180 DOI 10.1038/nrn3666.
Lander ES. 2011. Initial impact of the sequencing of the human genome. Nature 470:187–197DOI 10.1038/nature09792.
Langner G. 1992. Periodicity coding in the auditory system. Hearing Research 60:115–142DOI 10.1016/0378-5955(92)90015-F.
Liew CC, Ma J, Tang HC, Zheng R, Dempsey AA. 2006. The peripheral blood transcriptomedynamically reflects system wide biology: a potential diagnostic tool. Journal of Laboratoryand Clinical Medicine 147:126–132 DOI 10.1016/j.lab.2005.10.005.
Meyer LB. 2008. Emotion and meaning in music. Chicago: University of Chicago Press.
Kanduri et al. (2015), PeerJ, DOI 10.7717/peerj.830 14/17

Mikutta C, Maissen G, Altorfer A, Strik W, Koenig T. 2014. Professional musicians listendifferently to music. Neuroscience 268C:102–111 DOI 10.1016/j.neuroscience.2014.03.007.
Mohr S, Liew CC. 2007. The peripheral-blood transcriptome: new insights into disease and riskassessment. Trends in Molecular Medicine 13:422–432 DOI 10.1016/j.molmed.2007.08.003.
Montealegre-Z F, Jonsson T, Robson-Brown KA, Postles M, Robert D. 2012. Convergentevolution between insect and mammalian audition. Science 338:968–971DOI 10.1126/science.1225271.
Murphy DD, Rueter SM, Trojanowski JQ, Lee VM. 2000. Synucleins are developmentallyexpressed, and alpha-synuclein regulates the size of the presynaptic vesicular pool in primaryhippocampal neurons. The Journal of Neuroscience 20:3214–3220.
Oczkowska A, Kozubski W, Lianeri M, Dorszewska J. 2013. Mutations in PRKN and SNCAgenes important for the progress of Parkinson’s disease. Current Genomics 14:502–517DOI 10.2174/1389202914666131210205839.
Oikkonen J, Huang Y, Onkamo P, Ukkola-Vuoti L, Raijas P, Karma K, Vieland VJ, Jarvela I.2014. A genome-wide linkage and association study of musical aptitude identifies locicontaining genes related to inner ear development and neurocognitive functions. MolecularPsychiatry 20(2):275–282 DOI 10.1038/mp.2014.8.
Parker J, Tsagkogeorga G, Cotton J, a, Liu Y, Provero P, Stupka E, Rossiter SJ. 2013.Genome-wide signatures of convergent evolution in echolocating mammals. Nature502:228–231 DOI 10.1038/nature12511.
Park H, Lee S, Kim H-J, Ju YS, Shin J-Y, Hong D, Von Grotthuss M, Lee D-S, Park C, Kim JH,Kim B, Yoo YJ, Cho SI, Sung J, Lee C, Kim JI, Seo JS. 2012. Comprehensive genomic analysesassociate UGT8 variants with musical ability in a Mongolian population. Journal of MedicalGenetics 49(12):747–752 DOI 10.1136/jmedgenet-2012-101209.
Pfenning AR, Hara E, Whitney O, Rivas MV, Wang R, Roulhac PL, Howard JT, Wirthlin M,Lovell PV, Ganapathy G, Mountcastle J, Moseley MA, Thompson JW, Soderblom EJ, Iriki A,Kato M, Gilbert MTP, Zhang G, Bakken T, Bongaarts A, Bernard A, Lein E, Mello CV,Hartemink AJ, Jarvis ED. 2014. Convergent transcriptional specializations in the brains ofhumans and song-learning birds. Science 346:1256846–1256846 DOI 10.1126/science.1256846.
Pulli K, Karma K, Norio R, Sistonen P, Goring HH, Jarvela I. 2008. Genome-wide linkage scanfor loci of musical aptitude in Finnish families: evidence for a major locus at 4q22. Journal ofMedical Genetics 45:451–456 DOI 10.1136/jmg.2007.056366.
Rammsayer TH, Brandler S. 2003. Differences in mental abilities between musicians andnon-musicians. Psychology of Music 31:123–138 DOI 10.1177/0305735603031002290.
Renvall H, Salmela E, Vihla M, Illman M, Leinonen E, Kere J, Salmelin R. 2012. Genome-widelinkage analysis of human auditory cortical activation suggests distinct loci on chromosomes 2,3, and 8. The Journal of Neuroscience 32:14511–14518 DOI 10.1523/JNEUROSCI.1483-12.2012.
Roden I, Kreutz G, Bongard S. 2012. Effects of a school-based instrumental music programon verbal and visual memory in primary school children: a longitudinal study. Frontiers inPsychology 3:572 DOI 10.3389/fpsyg.2012.00572.
Rodrigues AC, Loureiro MA, Caramelli P. 2013. Long-term musical training mayimprove different forms of visual attention ability. Brain and Cognition 82:229–235DOI 10.1016/j.bandc.2013.04.009.
Saheki Y, De Camilli P. 2012. Synaptic vesicle endocytosis. Cold Spring Harbor Perspectives inBiology 4:a005645 DOI 10.1101/cshperspect.a005645.
Kanduri et al. (2015), PeerJ, DOI 10.7717/peerj.830 15/17

Salimpoor VN, Benovoy M, Larcher K, Dagher A, Zatorre RJ. 2011. Anatomically distinctdopamine release during anticipation and experience of peak emotion to music. NatureNeuroscience 14:257–262 DOI 10.1038/nn.2726.
Salimpoor VN, Benovoy M, Longo G, Cooperstock JR, Zatorre RJ. 2009. The rewardingaspects of music listening are related to degree of emotional arousal. PLoS ONE 4:e7487DOI 10.1371/journal.pone.0007487.
Salimpoor VN, Van den Bosch I, Kovacevic N, McIntosh AR, Dagher A, Zatorre RJ. 2013.Interactions between the nucleus accumbens and auditory cortices predict music reward value.Science 340:216–219 DOI 10.1126/science.1231059.
Sarkamo T, Tervaniemi M, Laitinen S, Forsblom A, Soinila S, Mikkonen M, Autti T,Silvennoinen HM, Erkkila J, Laine M, Peretz I, Hietanen M. 2008. Music listening enhancescognitive recovery and mood after middle cerebral artery stroke. Brain 131:866–876DOI 10.1093/brain/awn013.
Scherzer CR, Eklund AC, Morse LJ, Liao Z, Locascio JJ, Fefer D, Schwarzschild MA,Schlossmacher MG, Hauser MA, Vance JM, Sudarsky LR, Standaert DG, Growdon JH,Jensen RV, Gullans SR. 2007. Molecular markers of early Parkinson’s disease based on geneexpression in blood. Proceedings of the National Academy of Sciences of the United States ofAmerica 104:955–960 DOI 10.1073/pnas.0610204104.
Scherzer CR, Grass JA, Liao Z, Pepivani I, Zheng B, Eklund AC, Ney PA, Ng J, McGoldrick M,Mollenhauer B, Bresnick EH, Schlossmacher MG. 2008. GATA transcription factors directlyregulate the Parkinson’s disease-linked gene alpha-synuclein. Proceedings of the NationalAcademy of Sciences of the United States of America 105:10907–10912DOI 10.1073/pnas.0802437105.
Schlaug G, Norton A, Overy K, Winner E. 2005. Effects of music training on the child’s brainand cognitive development. Annals of the New York Academy of Sciences 1060:219–230DOI 10.1196/annals.1360.015.
Schubert E, Hargreaves DJ, North AC. 2014. A dynamically minimalist cognitive explanation ofmusical preference: is familiarity everything? Frontiers in Psychology 5:38DOI 10.3389/fpsyg.2014.00038.
Seashore CE, Lewis D, Saetveit JG. 1960. Seashores measures of musical talents. Manual.New York: The Psychological Corp.
Sluming V, Brooks J, Howard M, Downes JJ, Roberts N. 2007. Broca’s area supports enhancedvisuospatial cognition in orchestral musicians. The Journal of Neuroscience 27:3799–3806DOI 10.1523/JNEUROSCI.0147-07.2007.
Sudhof TC, Rizo J. 2011. Synaptic vesicle exocytosis. Cold Spring Harbor Perspectives in Biology3(12):a005637 DOI 10.1101/cshperspect.a005637.
Sullivan PF, Fan C, Perou CM. 2006. Evaluating the comparability of gene expression in blood andbrain. American Journal of Medical Genetics. Part B, Neuropsychiatric Genetics 141B:261–268DOI 10.1002/ajmg.b.30272.
Sutoo D, Akiyama K. 2004. Music improves dopaminergic neurotransmission: demonstrationbased on the effect of music on blood pressure regulation. Brain Research 1016:255–262DOI 10.1016/j.brainres.2004.05.018.
Theusch E, Basu A, Gitschier J. 2009. Genome-wide study of families with absolute pitch revealslinkage to 8q24.21 and locus heterogeneity. American Journal of Human Genetics 85:112–119DOI 10.1016/j.ajhg.2009.06.010.
Kanduri et al. (2015), PeerJ, DOI 10.7717/peerj.830 16/17
Tylee DS, Kawaguchi DM, Glatt SJ. 2013. On the outside, looking in: a review and evaluationof the comparability of blood and brain “omes.” American Journal of Medical Genetics, Part B:Neuropsychiatric Genetics 162:595–603 DOI 10.1002/ajmg.b.32150.
Ukkola-Vuoti L, Oikkonen J, Onkamo P, Karma K, Raijas P, Jarvela I. 2011. Association of thearginine vasopressin receptor 1A (AVPR1A) haplotypes with listening to music. Journal ofHuman Genetics 56:324–329 DOI 10.1038/jhg.2011.13.
Van den Bosch I, Salimpoor VN, Zatorre RJ. 2013. Familiarity mediates the relationship betweenemotional arousal and pleasure during music listening. Frontiers in Human Neuroscience7:534 DOI 10.3389/fnhum.2013.00534.
Wada K, Howard JT, McConnell P, Whitney O, Lints T, Rivas MV, Horita H, Patterson MA,White SA, Scharff C, Haesler S, Zhao S, Sakaguchi H, Hagiwara M, Shiraki T,Hirozane-Kishikawa T, Skene P, Hayashizaki Y, Carninci P, Jarvis ED. 2006. A molecularneuroethological approach for identifying and characterizing a cascade of behaviorallyregulated genes. Proceedings of the National Academy of Sciences of the United States of America103:15212–15217 DOI 10.1073/pnas.0607098103.
Wang J, Nicol T, Skoe E, Sams M, Kraus N. 2009. Emotion modulates early auditory response tospeech. Journal of Cognitive Neuroscience 21:2121–2128 DOI 10.1162/jocn.2008.21147.
Wong PCM, Skoe E, Russo NM, Dees T, Kraus N. 2007. Musical experience shapes humanbrainstem encoding of linguistic pitch patterns. Nature Neuroscience 10:420–422DOI 10.1038/nn1872.
Zhang G, Li C, Li Q, Li B, Larkin DM, Lee C, Storz JF, Antunes A, Greenwold MJ, Meredith RW,Odeen A, Cui J, Zhou Q, Xu L, Pan H, Wang Z, Jin L, Zhang P, Hu H, Yang W, Hu J, Xiao J,Yang Z, Liu Y, Xie Q, Yu H, Lian J, Wen P, Zhang F, Li H, Zeng Y, Xiong Z, Liu S, Zhou L,Huang Z, An N, Wang J, Zheng Q, Xiong Y, Wang G, Wang B, Wang J, Fan Y, da Fonseca RR,Alfaro-Nunez A, Schubert M, Orlando L, Mourier T, Howard JT, Ganapathy G, Pfenning A,Whitney O, Rivas MV, Hara E, Smith J, Farre M, Narayan J, Slavov G, Romanov MN,Borges R, Machado JP, Khan I, Springer MS, Gatesy J, Hoffmann FG, Opazo JC, Hastad O,Sawyer RH, Kim H, Kim K-W, Kim HJ, Cho S, Li N, Huang Y, Bruford MW, Zhan X,Dixon A, Bertelsen MF, Derryberry E, Warren W, Wilson RK, Li S, Ray DA, Green RE,O’Brien SJ, Griffin D, Johnson WE, Haussler D, Ryder OA, Willerslev E, Graves GR,Alstrom P, Fjeldsa J, Mindell DP, Edwards SV, Braun EL, Rahbek C, Burt DW, Houde P,Zhang Y, Yang H, Wang J, Jarvis ED, Gilbert MTP, Wang J, Ye C, Liang S, Yan Z, Zepeda ML,Campos PF, Velazquez AMV, Samaniego JA, Avila-Arcos M, Martin MD, Barnett R,Ribeiro AM, Mello CV, Lovell PV, Almeida D, Maldonado E, Pereira J, Sunagar K, Philip S,Dominguez-Bello MG, Bunce M, Lambert D, Brumfield RT, Sheldon FH, Holmes EC,Gardner PP, Steeves TE, Stadler PF, Burge SW, Lyons E, Smith J, McCarthy F, Pitel F,Rhoads D, Froman DP. 2014. Comparative genomics reveals insights into avian genomeevolution and adaptation. Science 346:1311–1320 DOI 10.1126/science.1251385.
Kanduri et al. (2015), PeerJ, DOI 10.7717/peerj.830 17/17

![Robotic experience companionship in music listening and ...music listening happens alone, compared to 69 % in the 1980s [41]. While apparent that music listening is often a social](https://img.pdfslide.us/doc/110x75/60eb12020011e26a7a4772fa/robotic-experience-companionship-in-music-listening-and-music-listening-happens.jpg)