Embed Size (px)
Citation preview
THE EFFECT OF JOB ROTATION AND SINGLE-PIECE FLOW IN A HUMAN-
BASED ASSEMBLY SYSTEM
by
Priyanka Basavaraj, B.E.
A thesis submitted to the Graduate Council of Texas State University in partial fulfillment
of the requirements for the degree of Master of Science
with a Major in Engineering May 2020
Committee Members:
Jesus A. Jimenez, Chair
Eduardo Perez
Tongdan Jin

COPYRIGHT
by
Priyanka Basavaraj
2020
iii
FAIR USE AND AUTHOR’S PERMISSION STATEMENT
Fair Use
This work is protected by the Copyright Laws of the United States (Public Law 94-553, section 107). Consistent with fair use as defined in the Copyright Laws, brief quotations from this material are allowed with proper acknowledgement. Use of this material for financial gain without the author’s express written permission is not allowed.
Duplication Permission
As the copyright holder of this work I, Priyanka Basavaraj, authorize duplication of this work, in whole or in part, for educational or scholarly purposes only.

iv
DEDICATION
I would like to dedicate this thesis to my family for the inspiration, encouragement and
guidance throughout my life.
v
ACKNOWLEDGEMENTS
I would like to express my sincere gratitude to Dr. Jesus A. Jimenez for his support and
guidance throughout the thesis execution. I would like to thank my committee members:
Drs. Tongdan Jin and Eduardo Perez for their valuable insights and suggestions. Texas State
University faculty members and staff for supporting in my research directly or indirectly. I
would like to sincerely thank my friends and colleagues for the encouragement to pursue my
goals. Finally, I would like to thank my parents and family for their unconditional love, trust
and support.
vi
TABLE OF CONTENTS
Page ACKNOWLEDGEMENTS ............................................................................................................. v LIST OF TABLES ............................................................................................................................. vii LIST OF FIGURES ........................................................................................................................... ix LIST OF ABBREVIATIONS ......................................................................................................... xii ABSTRACT ....................................................................................................................................... xiii CHAPTER
1. INTRODUCTION ........................................................................................................... 1
1.1. Motivation and Problem Description .................................................................... 1 1.2. Research Objectives .................................................................................................. 3 1.3. Organization of Thesis ............................................................................................. 4
2. LITERATURE REVIEW ................................................................................................ 5
2.1. Job Rotation .............................................................................................................. 5 2.2. Single-Piece Flow ..................................................................................................... 9 2.3. Fatigue Factor ......................................................................................................... 13
3. METHODOLOGY ........................................................................................................ 19
3.1. System Configuration............................................................................................. 22 3.2. Establishment of Time Standards ........................................................................ 23 3.3 Fatigue Models ......................................................................................................... 29
3.4. Discrete Event Simulation Model ........................................................................ 36
4. DESIGN AND ANALYSIS OF SIMULATION EXPERIMENTS ..................... 39
4.1. Design of Simulation Experiments ..................................................................... 39 4.2. Statistical Analysis of Simulation Results ............................................................ 42 4.3. Operational Expense Analysis.............................................................................. 72
vii
5. CONCLUSION AND FUTURE DIRECTION ....................................................... 73
5.1. Conclusion .............................................................................................................. 73 5.2. Future Direction ..................................................................................................... 74
REFERENCES .................................................................................................................................. 75
vii
LIST OF TABLES Table Page 1. LITERATURE REVIEW SUMMARY .................................................................................... 18 2. DERIVATION OF NUMBER OF STATIONS AND OPERATORS.............................. 23
3. CHARACTERISTICS OF THE MODEL ............................................................................... 23
4. CYCLE TIME STUDY FOR ASSEMBLY OPERATION USING BASIC MOST ........ 25
5. CYCLE TIME STUDY FOR SPF USING BASIC MOST ................................................... 26
6. OVERALL CYCLE TIME OF SPF PROCESS ...................................................................... 27
7. OVERALL CYCLE TIME OF BP ............................................................................................ 28
8. TABLE SHOWING PFD ALLOWANCES FOR STANDARD OPERATIONS .......... 31
9. TABLE SHOWING STANDARD CYCLE TIME FOR SPF BASED ON PFD ............ 32
10. TABLE SHOWING STANDARD CYCLE TIME FOR BP BASED ON PFD ........... 32
11. TABLE SHOWING SI PARAMETERS AND MULTIPLIERS ....................................... 34
12. TABLE SHOWING STANDARD CYCLE TIME FOR SPF BASED ON SI .............. 34
13. TABLE SHOWING STANDARD CYCLE TIME FOR BP BASED ON SI ................ 35
14. AVOIDABLE DELAYS FOR JOB-ROTATION ANALYSIS ......................................... 35
15. FATIGUE BASED ON VARIOUS ROTATION INTERVALS ..................................... 36
16. SPF DOE SUMMARY FOR VARIOUS FATIGUE MODELS ....................................... 40
17. BP DOE SUMMARY FOR VARIOUS FATIGUE MODELS ......................................... 40
18. SUMMARY OF DESIGN OF SIMULATION EXPERIMENTS .................................... 41 19. TWO-SAMPLE T-TEST SUMMARY .................................................................................... 65
viii
20. DOE SUMMARY FOR VARIOUS FATIGUE MODELS ................................................ 67
21. REGRESSION ANALYSIS SUMMARY ................................................................................. 70
22. SUMMARY OF THROUGHPUT VS JOB ROTATION FREQUENCY ...................... 71 23. SUMMARY OF COST IMPACT BETWEEN SPF AND BP ........................................... 72
ix
LIST OF FIGURES Figure Page 1. High-level summary of the approach .......................................................................................... 21 2. Process flow of the single-piece flow operation ........................................................................ 37
3. Layout of single-piece flow operation ......................................................................................... 37 4. Process flow of batch processing ................................................................................................ 38 5. Layout of batch processing operation ......................................................................................... 38
6. SPF operator utilization with PFD .............................................................................................. 42 7. SPF stay time with PFD ................................................................................................................ 43 8. BP stay time with PFD .................................................................................................................. 43
9. SPF operator utilization with SI .................................................................................................. 44 10. SPF stay time with SI .................................................................................................................. 45 11. BP stay time with SI .................................................................................................................... 45
12. SPF operator utilization without fatigue .................................................................................. 46 13. SPF stay time without fatigue .................................................................................................... 46 14. BP stay time without fatigue ...................................................................................................... 47
15. SPF operator utilization with +10% PFD ............................................................................... 48 16. SPF stay time with +10% PFD ................................................................................................. 48 17. BP stay time with +10% PFD ................................................................................................... 49
18. SPF operator utilization with -10% PFD ................................................................................. 50 19. SPF stay time with -10% PFD ................................................................................................... 50
x
20. BP stay time with -10% PFD ..................................................................................................... 51
21. SPF operator utilization with +10% SI .................................................................................... 52 22. SPF stay time with +10% SI ...................................................................................................... 52 23. BP stay time with +10% SI ........................................................................................................ 53 24. SPF operator utilization with -10% SI ...................................................................................... 54 25. SPF stay time with -10% SI ........................................................................................................ 54 26. BP stay time with -10% SI .......................................................................................................... 55 27. Throughput analysis of SPF vs BP ............................................................................................ 56
28. Operator utilization at 2-hour rotation ..................................................................................... 57 29. Stay time at 2-hour rotation........................................................................................................ 57 30. Operator utilization at 3-hour rotation ..................................................................................... 58 31. Stay time at 3-hour rotation........................................................................................................ 58 32. Operator utilization at 4-hour rotation ..................................................................................... 59 33. Stay time at 4-hour rotation........................................................................................................ 59 34. Operator utilization at 6-hour rotation ..................................................................................... 60 35. Stay time at 6-hour rotation........................................................................................................ 60 36. Operator utilization at 8-hour rotation ..................................................................................... 61 37. Stay time at 8-hour rotation........................................................................................................ 61
38. Operator utilization at 10-hour rotation ................................................................................... 62 39. Stay time at 10-hour rotation ..................................................................................................... 62 40. Operator utilization at 12-hour rotation ................................................................................... 63
xi
41. Stay time at 12-hour rotation ..................................................................................................... 63 42. Box plot of SPF stay time vs various fatigue models ............................................................. 66 43. Box plot of BP stay time vs various fatigue models .................................................................. 66 44. Interval plot of SPF throughput vs job rotation frequency ................................................... 68 45. Box plot of SPF stay time vs job rotation frequency ............................................................ 69 46. Contour plot of throughput/hr with ratio of takt time and job rotation ............................ 70 47. Surface plot of throughput/hr with ratio of takt time and job rotation .............................. 71
xii
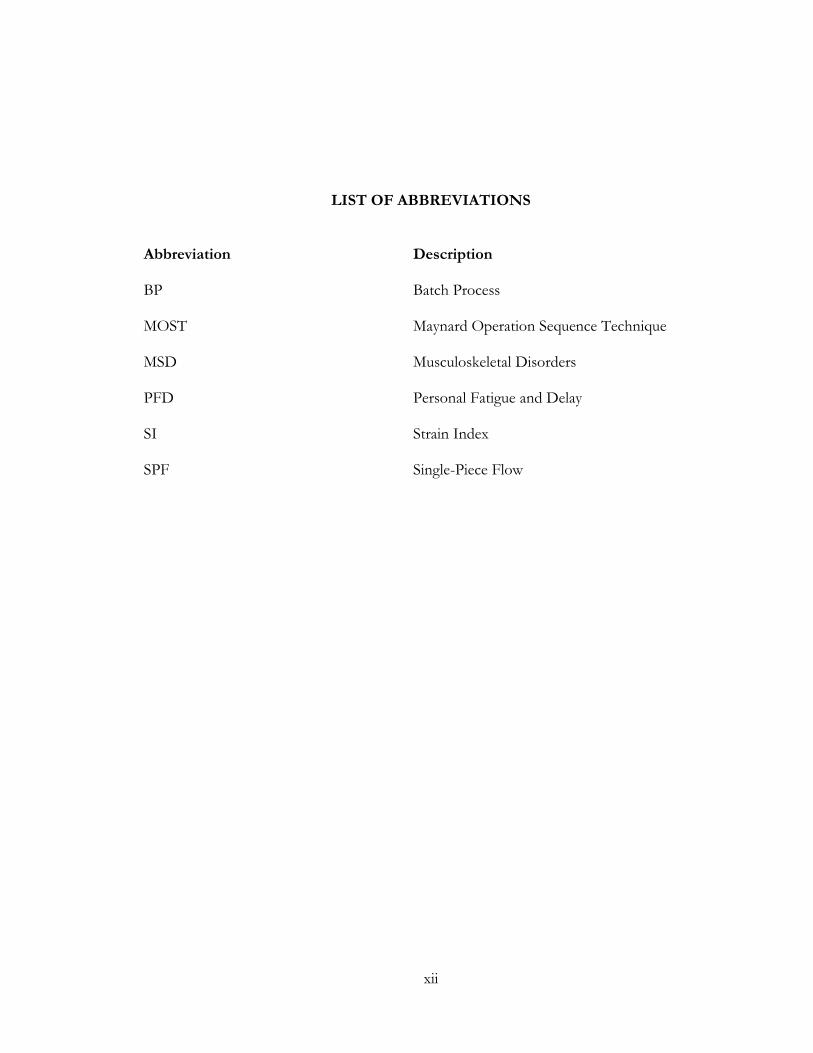
LIST OF ABBREVIATIONS Abbreviation Description BP Batch Process MOST Maynard Operation Sequence Technique MSD Musculoskeletal Disorders PFD Personal Fatigue and Delay SI Strain Index SPF Single-Piece Flow
xiii
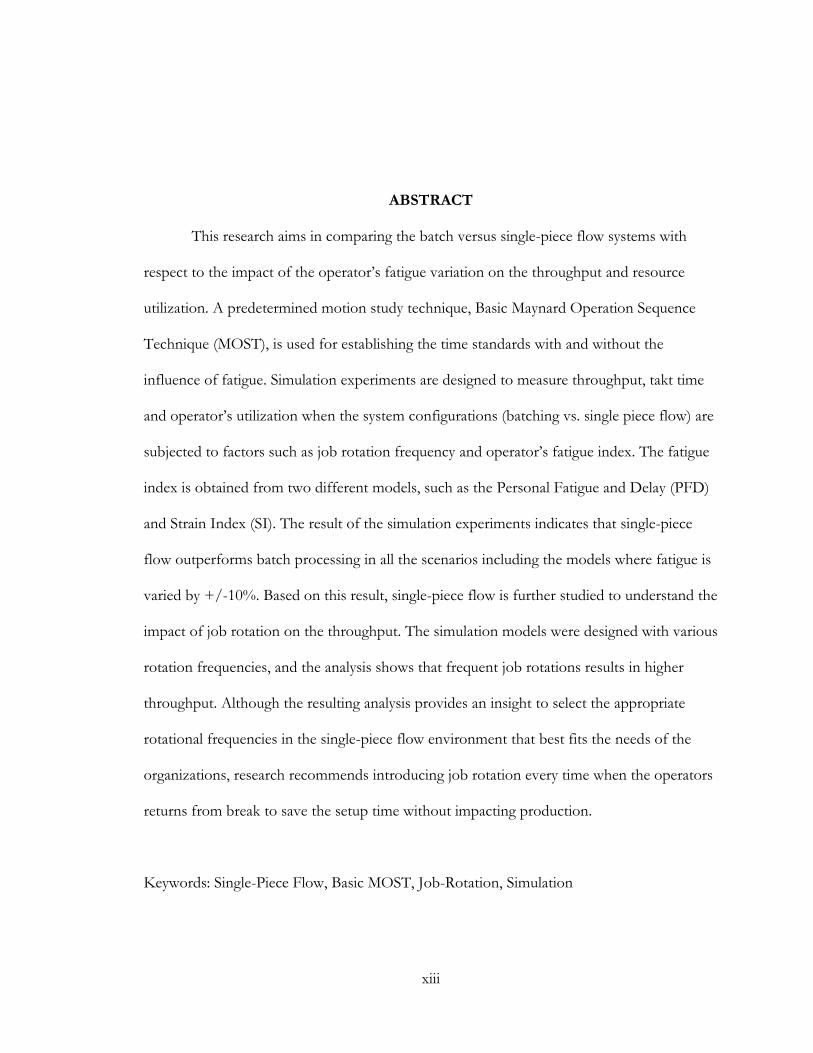
ABSTRACT
This research aims in comparing the batch versus single-piece flow systems with
respect to the impact of the operator’s fatigue variation on the throughput and resource
utilization. A predetermined motion study technique, Basic Maynard Operation Sequence
Technique (MOST), is used for establishing the time standards with and without the
influence of fatigue. Simulation experiments are designed to measure throughput, takt time
and operator’s utilization when the system configurations (batching vs. single piece flow) are
subjected to factors such as job rotation frequency and operator’s fatigue index. The fatigue
index is obtained from two different models, such as the Personal Fatigue and Delay (PFD)
and Strain Index (SI). The result of the simulation experiments indicates that single-piece
flow outperforms batch processing in all the scenarios including the models where fatigue is
varied by +/-10%. Based on this result, single-piece flow is further studied to understand the
impact of job rotation on the throughput. The simulation models were designed with various
rotation frequencies, and the analysis shows that frequent job rotations results in higher
throughput. Although the resulting analysis provides an insight to select the appropriate
rotational frequencies in the single-piece flow environment that best fits the needs of the
organizations, research recommends introducing job rotation every time when the operators
returns from break to save the setup time without impacting production.
Keywords: Single-Piece Flow, Basic MOST, Job-Rotation, Simulation
1
1. INTRODUCTION 1.1 Motivation and Problem Description
Lean practices in manufacturing attempt to reduce production costs and increase
productivity by eliminating waste [1] . Single-piece flow (SPF) is a fundamental element of
lean manufacturing. In SPF, operators process one part at a time without interruption [2].
SPF reduces inventory levels, reduces manufacturing lead times and improves customer
service levels [3]. SPF also facilitates defect detection [4], improves scalability and production
[5] simplifies the material replenishment process, frees up floor space [6], and increases
productivity as well as operator’s efficiency [7].
In contrast, Batch Processing (BP) processes parts in groups rather than in a
continuous stream [8]. BP is believed to cause a high level of WIP and increase the risk of
producing defective parts [4]. BP has other disadvantages, such as:
Downtimes: Manufactures may have to shut down the machines and reconfigure them
for every new batch, causing the productivity to stop completely in which case, the
operators sit idle. In case of higher frequency of failures and lower repair rate, system
efficiency can be very poor and under-utilized.
Space: Norzaimi [3] mentions that batches need space to keep the inventory and hold
incomplete and batched orders, also the employee potential is wasted in stacking and
restacking the order. To process large batches manufactures normally tend to buy big
equipment and hence face space constraints.
Fatigue: Fatigue is the state of feeling very tired, weary or sleepy resulting from
insufficient sleep, prolonged mental and physical work, extended periods of stress or
anxiety. The Occupational Safety and Health Administration (OSHA) states that
employers can reduce the risk of operator fatigue in the workplace by examining staffing
2
issues such as workload, work hours, understaffing and operator absences, scheduled
and unscheduled, which can contribute to operator fatigue. Padula [9] studies that
employee potential can be used to the maximum level when they are not affected by
fatigue/repeated load conditions.
Due to high product demand, manufacturers often lean towards traditional batch
processing. The perception is that running large batches is economically feasible particularly
when the equipment capital costs are high. While SPF addresses capacity loss factors such as
rework and poor quality, research indicates that the impact is measured only through the
company’s production rates [9]. In assembly lines where there is significant human
involvement, the processing methodologies need to be defined carefully considering the
fatigue impact on the physical and mental health of the production operators. Yung [10]
explains that fatigue is a result of the prolonged activity and is directly associated with
psychological, socioeconomic and environmental factors. Mossa [1] discusses that in the
assembly operations, operators are often exposed to repetitive tasks, and hence fatigue
causes musculoskeletal risks, and it leads to less attention from the operators in performing
the task resulting in poor quality.
Employers and supervisors should be considering factors causing operational fatigue
in the workplace. Moore [11] discusses that in any assembly line operation, exertion factors,
posture, speed and duration of work are crucial in defining the strain index, and this is
derived based on physiological, biomechanical and epidemiological principles. One of the
ways to reduce fatigue is to incorporate a job rotation program where operators rotate
between the jobs at the same business performing each job for a relatively short time. The
literature shows that job-rotation improves product quality [4], reduces musculoskeletal
disorders [6], [10] , and creates healthy working environments. The operational fatigue
3
experienced by the operator increases the risk of accidents as it includes both mental and
physical fatigue [10].
1.2 Research Objectives
The objectives of this research are defined below:
1. Develop a discrete-event simulation model to simulate the workflow of a manual
assembly operation for both single-piece flow and batch processing.
2. Design and analyze an experiment and evaluate the hypothesis that single-piece
flow produces lower processing times than batch processing techniques with respect to
various fatigue factors.
3. Analyze the various job rotation intervals in the single-piece flow environment and
its impact on production rate.
Research Hypothesis
This thesis fills the gap in understanding the impact of single-piece flow in
manufacturing with respect to fatigue contributing factors. To achieve this objective, we are
going to address the following questions;
1. How is SPF achieving higher productivity in comparison to batch processing,
but with a reduced workforce?
2. How does the fatigue factor impact the productivity?
3. How does the job rotation impact throughput of the system?
In order to test the hypothesis, batch processing and single-piece flow are studied on
a small set of operations. In batch processing, a single operator has to perform all operations
on the job from start to finish, whereas in the single-piece flow with a small assembly line,
each operation is performed by an operator. The first phase of the research focuses on
comparing the throughputs of SPF and BP under various fatigue conditions, and the second
4
phase focuses more on SPF validating the hypothesis on the impact of job rotation
frequencies on the throughput.
1.3 Organization of Thesis
The organization of this thesis is as follows: Section 2 gives a review of the literature
of single-piece flow, personal fatigue and delay, and job rotation. Section 3, the
methodology, proposes a model using the discrete-event simulation for the iterative
framework to measure the impact of job rotation in a single-piece flow manufacturing
environment. Section 4 shows the simulation experiments and result analysis. Section 5
states the conclusion and future work.
5
2. LITERATURE REVIEW
Ergonomics is the key to worksite design. This research focuses on improving the
productivity of the manufacturing industries through the implementation of single-piece
flow, thereby involving job rotation to meet the organization’s safety needs. The fatigue
factor is one of the main deciding factors to schedule job rotation. Hence, this research is
based on three main pillars: job rotation, single-piece flow, and personal fatigue and delay.
2.1 Job Rotation
Yung [10] studies in detail the temporal development of fatigue in various workload
conditions. The reliability and sensitivity for these measures are observed and evaluated in a
controlled laboratory setting for contraction, intensity, and body segment. Based on all these
detailed evaluations, the pattern of fatigue development and responsive measures were
defined and finally, the measures were evaluated over an eight-hour task concerning
responsive measures and fatigue development.
Moore [11] discusses the “safe” and “hazardous” types of the working environment
and identifies that a combination of physiology, epidemiology, and biomechanics are the
guiding principles to understand and define the distal upper extremity disorders. The study is
based on multiplicative interactions between six task variables: the intensity of exertion,
duration of exertion per cycle, efforts per minute, wrist posture, speed of exertion, and
duration of task per day. A Strain Index (SI) score is defined as the product of all six
variables, and only one task type throughout the day is considered. As an outcome of the
detailed experimentation applied to 25 relatively simple jobs from the same type of work, it
is observed that professionals and ergonomists can use the SI score to assess the distal upper
extremity disorders as the preliminary analysis indicates that strain can be measured to define
the hazard potential.
6
Otto [12] investigates the storage-based assignment problem in the picker-to-part
manual operation and considers order picking time and the human energy expenditure factor
to define a bi-objective analysis. The popularity of the product, the order profile and the
dimensions of the shelf are varied to compare the two algorithms- time-based storage
assignment and the energy-based one. Pareto charts are developed to assess the impact on
the objective function. Based on the outcome of the quantitative study, it introduces the rest
allowance to integrate the energy expenditure and time to define a general order picking
process.
Mossa [1] develops a mixed integer non-linear programming model to evaluate the
performance of the operators based on training and skillset in high-low load manual tasks.
The problem and solution show great flexibility in maximizing production under ergonomic
constraints. With the job rotation model, the production-oriented formulation maximizes
productivity while assigning the most suitable operator to the work. Results indicate that
operator training helps develop a flexible workforce, increase productivity, and improve
ergonomic standards.
Michalos [4] takes a slightly different approach in addressing the requirement of job
rotation by bringing in the quality of the product, whereas most of the other studies use the
traditional approach based on the operator’s musculoskeletal issues. Human Error
Probability (HEP) index and Fatigue scorecard are considered. This research study shows
that fatigue distribution and enrichment of the working environment can lead to the
reduction of assembly errors. In the HEP modelling, various human factors such as operator
competence, task repetitiveness, and fatigue are evaluated in detail. Two scenarios are
considered: work plan with and without job rotation. Results have indicated that job rotation
reduces fatigue and task monotony. In one of the cases presented, it’s observed that the
7
error rate reduces from 64% to 14%. Padula [9] conducts a systematic review of job rotation
design to prevent musculoskeletal disorders and to understand the associated psychosocial
elements. The paper shows that there is a positive correlation between job rotation and
higher job satisfaction. The effect of job rotation is studied with regards to Musculoskeletal
Disorders (MSD), exposure to physical factors and psychosocial work factors.
Michalos [13] takes the traditional approach in discussing the job rotation approach
to balance the work in a human-based assembly system. The paper discusses the job rotation
criteria as: competence, operator’s fatigue accumulation, distance traveled, cost, and
repetitiveness of tasks. Algorithm and modeling are applied to all the rotation criteria and
fatigue risk level is analyzed. Further Matlab is used to program and generate all the possible
alternatives. Mamana [14] discusses that physical fatigue is hard to deal with since it lowers
productivity and increases ergonomic and safety issues. The objective of the study is to
examine the wearable sensors to measure physical fatigue, and accordingly, estimate the
fatigue level over time. The study is based on Borg’s scale with rankings of perceived
exertions, and a Least Absolute Shrinkage and Selection Operator (LASSO) penalized
logistic regression model with Random Under Sampling (RUS) sampling is developed to
detect the fatigue; a LASSO multiple linear regression model is developed to estimate fatigue
level. Results show that the wrist, torso and hip sensors are dominant and required to detect
the fatigue and the working hours for critical workers need to be divided into short intervals.
Gunesoglu [15] conducts the observations in a garment industry based on a work
sampling technique. In this study, details are laid out on the number of observations, the
number of observers, and the flow of the process. A binomial distribution is considered as
along with a 99% confidence interval and +/-1% accuracy. Various productive and non-
productive activities are grouped for better analysis. In total, 13500 observations are made
8
for productive activities, unavoidable delays, personal activities, and avoidable delays. As a
result, the non-productive activities are observed in detail and suggested necessary actions to
improve the productivity of the system.
RuizTorres [16] discusses the association of workers satisfaction and on-time
deliveries through a job scheduling model. In this study, the operators are assigned jobs
based on the preferences and the performance is estimated based on the on-time deliveries.
Here the objective is to maximize the percentage of on-time deliveries and maximize worker
satisfaction, and a prototype tool is developed using Excel and Visual Basics for
demonstration. The computational experiments considers several factors such as job type to
satisfaction scores, job types and number of workers. The results of some of the heuristics
shown constant values however had limitations of finding the feasible solution.
Asensio-Cuesta [17] discusses the importance of job-rotation in the manufacturing
systems and develops a multi-criteria genetic algorithm to design the job-rotation schedules
to prevent MSD. In this research, an Ergonomic and Competent Rotation (ECR) model is
developed which has two objectives; first is to evaluate the quality of job-rotation schedules
and second is to improve the worker performance. The model is validated through a case
study in an assembly line. The results indicate that the ECR model provides an opportunity
for the planners to select the solutions, which are less time consuming and less repetitive, by
maximizing the workers performance and competence.
Gonzalez-Cruz [18] discusses a preventive strategy to reduce MSD in the operators
who are working at a very highly repetitive environment. In this study, the model is genetic
developed to identify the operations that are highly repeated and has an impact on MSD,
and those operators are rotated to a less exerted job which supports their recovery. The
genetic algorithm is evaluated through a case study at an automobile parts assembly line,
9
which has five critical jobs with highly repeated movements. The results of the model
indicates the risk of highly repeated job profiles in a short computing time, and provides
solution by defining the sequence of job-rotation for those critical jobs to avoid MSD. It is
emphasized in the research that although the job rotation significantly reduces the MSD risk,
the organizations should consider redesigning the critical jobs. Azizi [19] discusses the
importance of workforce flexibility and the ways to achieve it through cross training. With
the varied product demands and the labor resources, it is difficult for the manufacturing
industries to keep up for an unplanned event; hence, a flexible workforce could potentially
save the organization. In order to prove the hypothesis, an objective model is developed
with constructive-search heuristic to minimize the total costs incurred for training, flexibility
and productivity loss costs. The results of the research presented a model that assigns the
workers to tasks, schedules the job rotation events, and determines the training schedule.
Tharmmaphornphilas [20] develops a heuristic model to implement job-rotation with
the objective to reduce the low back injury possibilities due to lifting operation. The research
is based on the job severity index and the number of days the operators were absent because
of the injuries. The results proves that the by using the central limit theorem of sums with
heuristic interchange models, rotations can be scheduled to avoid the lower back injuries,
and hence the absenteeism of the operators. The study can be applied to maximize the
productivity at the manufacturing line. This research provides a platform to further study the
factors affecting job rotation such as, employee satisfaction, willingness of workers for job
rotation, etc.
2.2 Single-Piece Flow
Li [2] studies single-piece flow to adopt just-in-time production by using
straightforward schedule policies, relaxing the Takt time and reducing the risk of machine
10
failures and operator mistakes. The single-piece flow system is evaluated based on five
different factors using a multi-objective design model aiming to reduce cycle time,
changeover count, cell load variation, cell count and the extent to which items are completed
in a cell. Several experiments are run and compared with different approaches like Genetic
Algorithm, Compact Genetic Algorithm, Particle Swarm Optimization, Ant Colony
Optimization, Fuzzy Ant Colony Optimization-1 and Ant Colony Optimization-2, and
results indicate that Fuzzy Ant Colony Optimization-2 is better than any other approach.
Norzaimi [3] discuss the effectiveness and impacts of a single-piece flow manufacturing
technique detailing out the basics of single-piece flow activities. The paper compares the
batch processing and single-piece flow. The authors explain that single-piece flow strongly
promotes teamwork, is fast in responding, creates a sense of ownership and easy to
implement 5S.
Zadin [21] indicates work measurement is very critical in defining the health of the
manufacturing line as it measures the time and effort required for an operator to perform the
task. One of the several ways of estimating the time standards is using the MOST technique.
Studies have indicated that MOST is preferred over other time study methodologies to
establish baseline process time standards using pre-defined industry metrics rather than
capturing cycle times from the highly subjective manual environments. MOST analysis can
be applied to the processes with both shorter and longer repetitive cycles. Depending on the
type of move and frequency of operation, indexes are assigned, and the normal cycle time is
estimated for each process step breakdowns. Black [8] discusses the primary principles of
Toyota Production Systems with “make one, check one, and move one on” basis. It
elaborates on the potential benefits of single-piece flow production and emphasizes the pull
system in the assembly operations. Kanban links are introduced in this paper as the linkage
11
between various sub-processes and thereby suggests the WIP inventory control methods.
The overall conclusion indicates that through lean implementation the organization will
experience increased productivity, elimination of wastes, on-time delivery of quality goods,
and maximum utilization of resources.
Oduza [22] discusses the lean thinking constraints in a traditional batch
manufacturing environment detailing how scheduling and planning work. The paper
emphasizes the fact that defect prevention is better than rectification and details the
differences between Push and Pull systems. The case study considers the voice of operators
and indicates that lean production creates teamwork and results in flexible operations. A
detailed documentation is prepared based on the survey and supports strongly with five of
the key lean concepts: value to the customer, value stream operations, and the flow of
creating operations with minimal waiting time for batching and constant machine utilization,
pull concept and waste minimization. Results indicate that 80% of the waste was caused by
20% of the deviations.
Dotoli [23] proposes a novel lean manufacturing approach to systematically and
dynamically model the warehouse management by using integrated and iterative frameworks
such as- Unified Modeling Language (UML) to draw the sequence of operations, Value
Stream Mapping (VSM) to understand the anomalies in the system and Genba Shikumi
philosophy to prioritize the top contributing anomalies and plan necessary actions. The case
study conducted through this paper explains the simplicity and effectiveness of using the
warehouse management tools to increase the yield at an Italian interior design production
unit.
Botti [7] discusses the impact of integrating hybrid assembly line with ergonomics
and lean manufacturing principles for safe assembly work. The paper aims at providing an
12
effective, efficient line design based on physical work on the operators (OCRA index is
referred) as well as various cost factors incorporated by both the automated and manual lines
such as labor cost, programming cost, utility cost, defect cost and installation cost. A bi-
objective integer linear programming model drives the choice between manual and assembly
workstations which is based on human-paced work principle. In this model, machine pace is
set by manual workstations in an optimal layout with various design options. The
effectiveness of the model was validated through a case study, and the results indicate that
worker ergonomics is a key parameter of the assembly process design. Ganorkar [24]
discusses the implementation of time-based activity driven costing using MOST approach.
MOST combines work study and time study at a granular level, thus it is easy to identify the
time-consuming activities and take necessary actions. A case study is conducted in the
manufacturing industry to assess the cost impact based on the MOST equations and
concludes that the study not only streamlines the process, but it also identifies the
improvement areas.
Battini [25] defines a novel approach to integrate ergonomic and economic
objectives in manual material handling based on Energy Expenditure Rates and Rest
Allowance. This paper declines the traditional approach of reducing the number of trips to
save the overall operational cost. The authors also consider the ergonomic issues of the
operator. Various cost factors such as picking, traveling, storing and resting costs are
considered as a part of the mathematical model. Saurin [6] discusses a case study of a
harvester assembly line using lean production tools to enhance the working conditions. The
author provides detail discussions regarding the impacts of lean production on Push and Pull
systems.
Abdulmalek [26] discusses implementation issues of the lean tools in discrete and
13
continuous manufacturing, with focus on their feasibility in real case applications. The
author also uses a simulation model using ARENA to evaluate work-in process inventory
and lead time. Simulation results indicate that using a hybrid production system and Total
Productive Maintenance (TPM) leads to almost 70% reduction in lead-time. Satoglu [27]
discusses the sequential approach to facilitate one-piece flow environment where the model
comprises of a mathematical model and a heuristic approach. This approach is studied for
the design of a Hybrid Cellular Manufacturing System. The objective of the mathematical
model is to minimize the inter-cell travels. In this research, a NP integer model is developed
using GAMS Cplex solver to find an optimal solution to implement one-piece flow for a
medium-sized problem. However, the proposed model cannot solve for the larger size
problems.
Santos [5] discusses the outcome of lean manufacturing and ergonomic working
conditions in the automotive system, and this study is based on the Toyota Production
System. A detailed analysis of the production layout is conducted using Value Stream
Mapping, and the voice of the operators is considered. The paper emphasizes that repetitive
stress injuries play a vital role in the health and safety of the operators as well as the
organization. The degree of importance is assessed based on the survey outcome: reducing
absenteeism, increased quality product, operating time, increased productivity, and
elimination of accidents.
2.3 Fatigue Factor
Margaret [28] discusses the importance of optimizing the work between humans and
robots. To reduce the physical stress where the operator is exposed to repetitive motion and
fatigue, careful distribution of work is very important. In this study, both time and
ergonomics are considered in computing and scheduling the tasks. Strain Index (SI) is
14
introduced to quantify the ergonomics risk which is measured based on rating six factors on
a scale of 1-5: intensity of exertion(IE), duration of exertion (DE), efforts per minute (EM),
hand/wrist posture (HWP), speed of work (SW), and duration per day (DD).
Moore [29] indicates that one of the many ways of assessing the issues related to the
operator’s musculoskeletal disorder is using the Strain Index (SI). Fifteen raters are given 61
video segments to first individually assess the risk of exposure, followed by the group
assessment. Results indicated that the reliability factor was slightly better for teams than for
individuals. This tool enhances the chances of predicting the risk associated with the
operation in an early life cycle and is best assessed when used by multiple safety and health
practitioners.
Neibel [30], in his book “Motion and Time Study,” considers allowances in standard
time to account for ergonomic issues. There are three main categories of allowances:
Personal, Fatigue, and Unavoidable Delays. The allowance factors include general fatigue,
rest periods, the time required to discuss and learn from supervisors, unavoidable delays,
personal needs, setup time, and irregular operations. In this context, a detailed analysis of
their design of experiments results in rating the operation-specific fatigue factors.
Radwin [31] measures physical stress associated mainly with manual and highly
repetitive workloads by using biomechanical data measured from sensors. This paper aims at
establishing a quantifiable metric by categorizing the datasets based on the frequency of
repetitiveness, duration and exertion domain. Based on psychophysical data resulting from
repetitive movements of different amplitudes and frequencies, this model helps easily assess
the fatigue impact on the worker, and identifies the areas highly impacted with repeated
motion. The analysis concludes that the frequency-weighted filters based on various
frequency responses helps to establish the quantitative limits. Brown [32] discusses the
15
performance issues related to batch processing, and hence, the smooth transfer to lean
manufacturing. Standard formulations and mathematical equations related to lean
production factors are proposed.
Yazdani [33] discusses the main factors that act as a barrier to the prevention of
musculoskeletal disorders in the workplace. There are other several factors that are
contributors, including the lack of time resources, communication, management, support
commitment, and participation, knowledge and training, resistance to change; changing work
environment, scope of activities, lack of trust, fear of job loss, or loss of authority, process
deficiencies, and the difficulty of implementing controls. To mitigate these factors, the
research identifies and proposed three facilitators: training, knowledge and ergonomist’s
support; communication, participation and support; and effective implementation of the
process using the management system approach.
Paulsen [34] discusses qualitative and semi-quantitative assessment tools to measure
the impact of physical strain on the operators. This study characterizes the most commonly
used physical exposure assessment methods of the upper extremity: The Strain Index (SI)
and Occupational Repetitive Actions (OCRA) Checklist. A case study is conducted in the
cheese manufacturing industry. The outcomes of the study indicate that the reliability of the
OCRA Checklist assessments was higher than the SI assessments. However, the time
required to conduct a study was longer for the OCRA Checklist.
Eliasson [35] provides an extensive survey of the research with regards to the
optimization models developed on physical ergonomic risks in the assembly line balancing
and job scheduling problems. The study details out how the assembly line balancing through
job rotation helps reduce the ergonomic risks and provides strong evidence to support the
claim. .In this study, 21 OHS ergonomists participated and used their knowledge and
16
experience to categorize the risk levels as low, moderate and high; and intra-observer
reliability was carried out by asking 9 of the ergonomists to repeat the procedure at least for
three weeks after the first assessment. The outcome of the study for inter-reliability shows
the global risk was 53% with a corresponding 0.32 kappa value indicating fair reliability; for
intra-reliability, the global risk and kappa factors were 61% and 0.41 respectively indicating
that an explicit observational method is recommended. Overall, the paper emphasizes the
fact that researchers, production managers and ergonomists should consider incorporating
the ergonomic factors in the very early stage of the assembly line design.
Ferguson [36] discusses the 8-hour and 12-hour shift patterns. The factors deriving
the shift lengths can be the shift start times, shift pattern, associated overtime, demographics
and characteristics of the workforce. In this study, 8-hour and 12-hour shifts are also studied
in detail to understand the impact of the domestic life of the operators. The model
developed consists of independent variables such as shift timing, shift length, break
frequencies and the mediating variables such as work tasks, gender and age, domestic
circumstance of the operator. Based on the intensive study of the literatures and the shift
systems, set of dependent variables are formulated which has an effect on the outcome such
as productivity, satisfaction, morale, physical and psychological health etc. Susan [37] studies
the fatigue impact on the operators in the manufacturing facility in detail through the Strain
Index method. The Strain Index tool developed by Moore [11] is used to categorize the risks
as safe and hazardous based on the six different Strain Index scores on a scale of 5.0. The
real case study is conducted to assess the Strain Index factors in the participants. The
intensity of exertion task variable influenced the SI score. The study indicates to further
extensively study the subjective variables, as they should be promptly reported as and when
the pain occurs in the operator. The manufacturing environments where there are complex
17
multi-faceted jobs and longer cycles must be evaluated to study the behavior in the Strain
Index.
Smith [38] compares the two manufacturing shifts of duration 8-hours and 12-hours.
In the research, the two systems are studied to understand the impact on fatigue and job
performance, safety, physical and psychological health of the workers. An extensive manual
and electronic search is conducted to gain the information to compare these systems. The
results are equivocal; however, the factors such as quality, physical and psychological health
of the operators are good in case of 12-hour shifts. On the other hand, 8-hour shifts are
preferred when it comes to fatigue and safety. Hence, the research has to be studied and
analyzed in different situations to draw more conclusions that are robust. Tiwari [39] takes a
different approach at the work scheduling methods by assessing the break times for the
operators during the shifts. With the objective to reduce the time-integrated workload on the
operator, a suitable rest-time model is developed. To calculate the impact on the operator, a
computerized heart rate monitor is used to record the variation of the heart rate data. The
experimental results indicated that the rest-time had an impact on the physiological and
psychological health of the operator. The study concludes that a minimum of 15 mins
should be the resting time with more than 45 mins of lunch break and a preferred break time
between 13:00-14:00 h during maximum ambient temperatures.
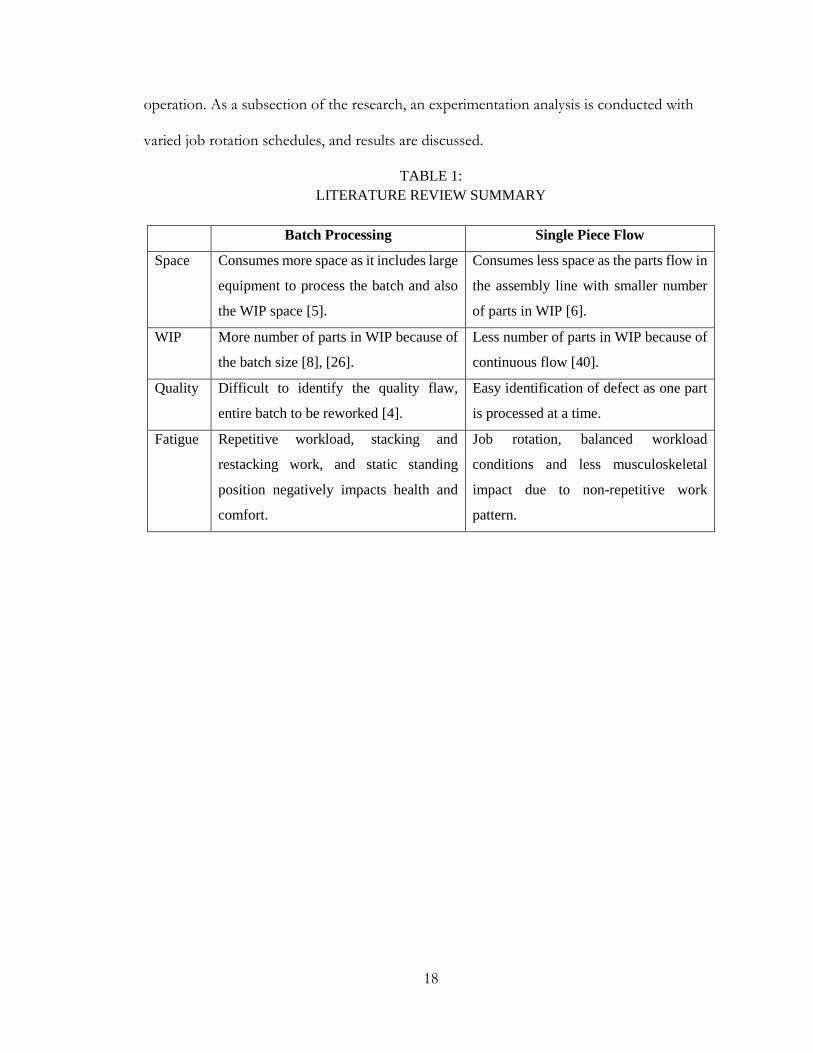
Table 1 presents a summary of papers classified by critical factors and by processing
methodology, i.e. single-piece flow and batch processing. This table shows a lack of studies
conducted on assessing batch processing and single-piece flow concerning fatigue. This
research fills the gap by conducting the study in the manufacturing set-up with the manual
and semi-automated assembly line. A discrete-event simulation is developed to define the
product flow and the associated operator’s fatigue during material handling and assembly
18
operation. As a subsection of the research, an experimentation analysis is conducted with
varied job rotation schedules, and results are discussed.
TABLE 1:
LITERATURE REVIEW SUMMARY
Batch Processing Single Piece Flow
Space Consumes more space as it includes large
equipment to process the batch and also
the WIP space [5].
Consumes less space as the parts flow in
the assembly line with smaller number
of parts in WIP [6].
WIP More number of parts in WIP because of
the batch size [8], [26].
Less number of parts in WIP because of
continuous flow [40].
Quality Difficult to identify the quality flaw,
entire batch to be reworked [4].
Easy identification of defect as one part
is processed at a time.
Fatigue Repetitive workload, stacking and
restacking work, and static standing
position negatively impacts health and
comfort.
Job rotation, balanced workload
conditions and less musculoskeletal
impact due to non-repetitive work
pattern.
19
3. METHODOLOGY
This section presents a simulation framework to evaluate single-piece flow and batch
processing, two critical production configurations. What makes this study unique is the
incorporation of modeling constructs to represent the operator’s fatigue in the simulation
model. It has been well documented that single-piece flow is more efficient than batch
processing. Nonetheless, from the operator’s perspective, single-piece flow may be more
challenging. This study would like to uncover any tradeoffs between productivity versus
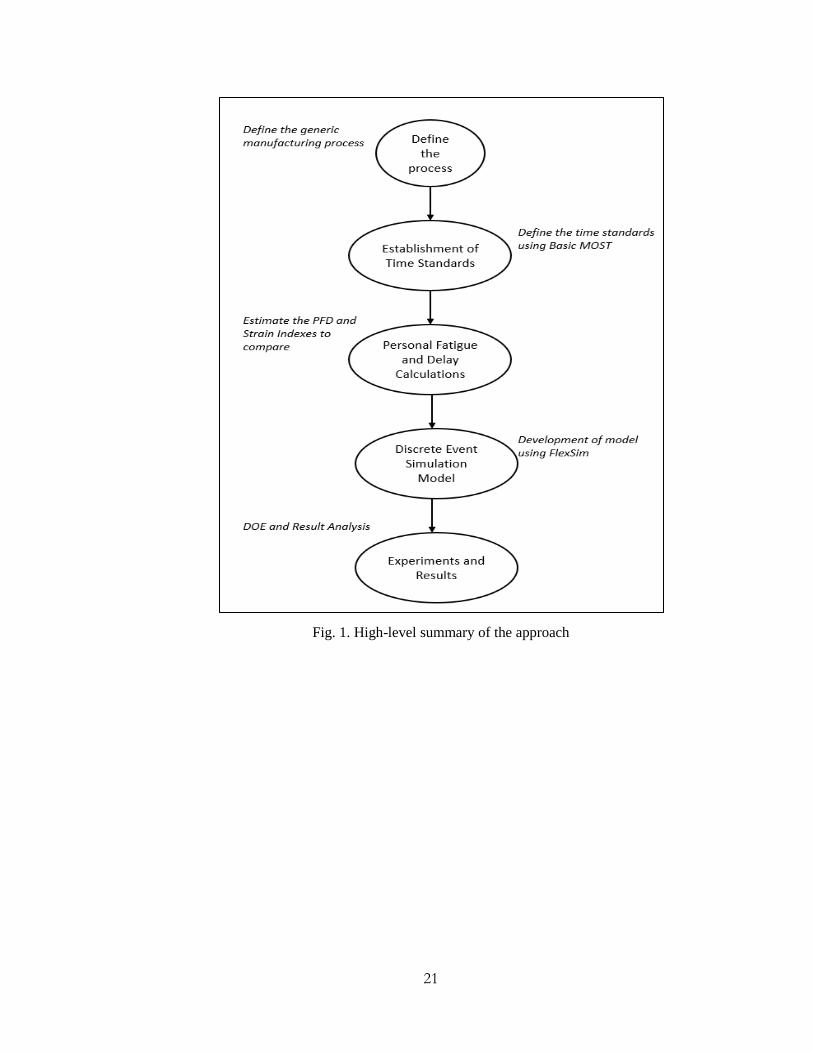
operator’s fatigue in these two production configurations. The framework is summarized in
Figure 1, and its description is provided below.
Phase 1: Define the process and operations. In this study, we consider basic manual
operations which include assembly, drilling, grinding, and painting. In section 3.1, the
system configuration is discussed in detail for both SPF and BP.
Phase 2: Establishment of time standards. A standard time estimation tool, Basic MOST,
is used to split operations into granular tasks. The summation of the individual normal
times for the tasks gives the total normal time (in seconds) required for an operator to
perform the tasks. Section 3.2 discusses in detail how Basic MOST is applied.
Phase 3: Personal Fatigue and Delay Calculations. To calculate the standard time of an
operation, it is required to know the normal cycle time and the allowance factors. Since
the operations are driven by humans, there’s an associated fatigue that they develop,
which has to be considered while designing the line for a target Takt time. Here,
appropriate fatigue allowances are considered. The two main approaches studied here are
the Personal Fatigue Delay (PFD) Index and the Strain Index(SI). Section 3.3 discusses
the fatigue allowances in detail where various fatigue factors are studied through the
20
simulation model for both single-piece flow and batch processing. Further in the single-
piece flow analysis, job rotation frequency is studied to understand its impact on
throughput.
Phase 4: Discrete-Event Simulation Model: The discrete-event simulation model
attempts to represent the operations of a configurable manufacturing assembly
operation. Based on the operations and the estimated cycle times including fatigue
factors, a FlexSim simulation model is developed to test the hypothesis for both
configurations- SPF and BP.
Phase 5: Experiments and Results. A Design of Experiments is developed where the
throughput of both SPF and BP are assessed with various simulation models. These
factors include fatigue, job rotation, and production configuration. Chapter 4 discusses
these elements in detail.
21
Fig. 1. High-level summary of the approach
22
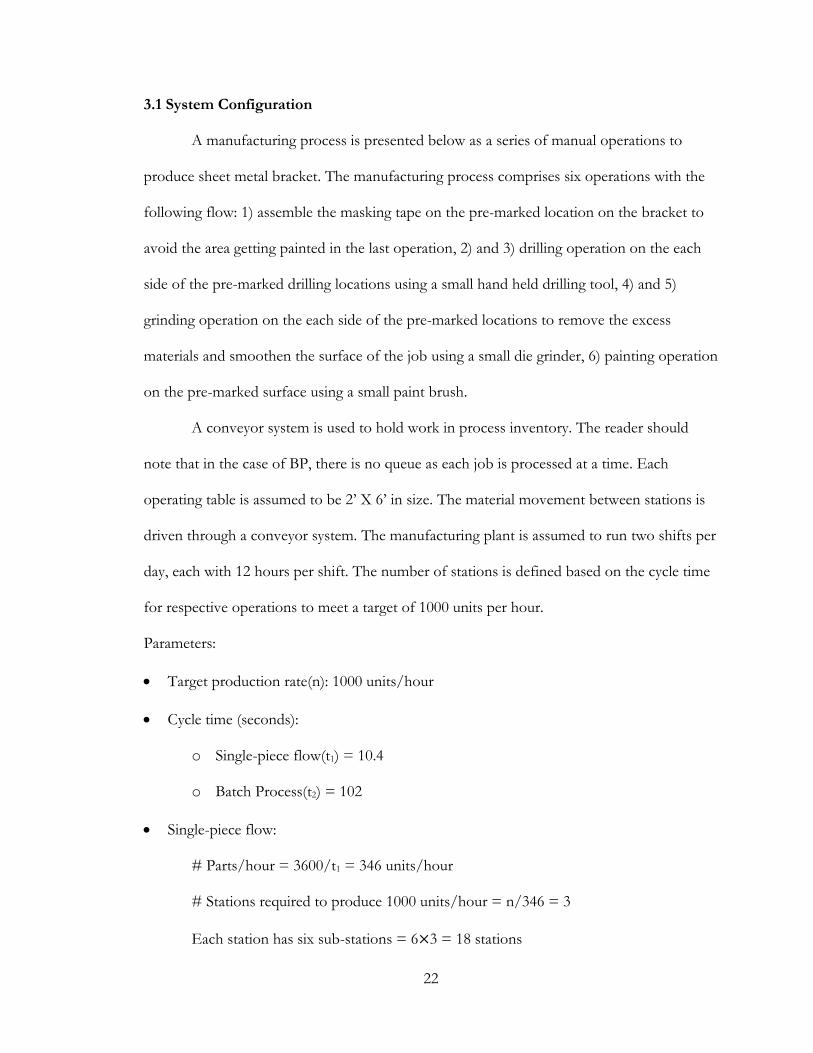
3.1 System Configuration
A manufacturing process is presented below as a series of manual operations to
produce sheet metal bracket. The manufacturing process comprises six operations with the
following flow: 1) assemble the masking tape on the pre-marked location on the bracket to
avoid the area getting painted in the last operation, 2) and 3) drilling operation on the each
side of the pre-marked drilling locations using a small hand held drilling tool, 4) and 5)
grinding operation on the each side of the pre-marked locations to remove the excess
materials and smoothen the surface of the job using a small die grinder, 6) painting operation
on the pre-marked surface using a small paint brush.
A conveyor system is used to hold work in process inventory. The reader should
note that in the case of BP, there is no queue as each job is processed at a time. Each
operating table is assumed to be 2’ X 6’ in size. The material movement between stations is
driven through a conveyor system. The manufacturing plant is assumed to run two shifts per
day, each with 12 hours per shift. The number of stations is defined based on the cycle time
for respective operations to meet a target of 1000 units per hour.
Parameters:
Target production rate(n): 1000 units/hour
Cycle time (seconds):
o Single-piece flow(t1) = 10.4
o Batch Process(t2) = 102
Single-piece flow:
# Parts/hour = 3600/t1 = 346 units/hour
# Stations required to produce 1000 units/hour = n/346 = 3
Each station has six sub-stations = 6×3 = 18 stations
23
Each sub-station has an operator = 6×3 =18 operators
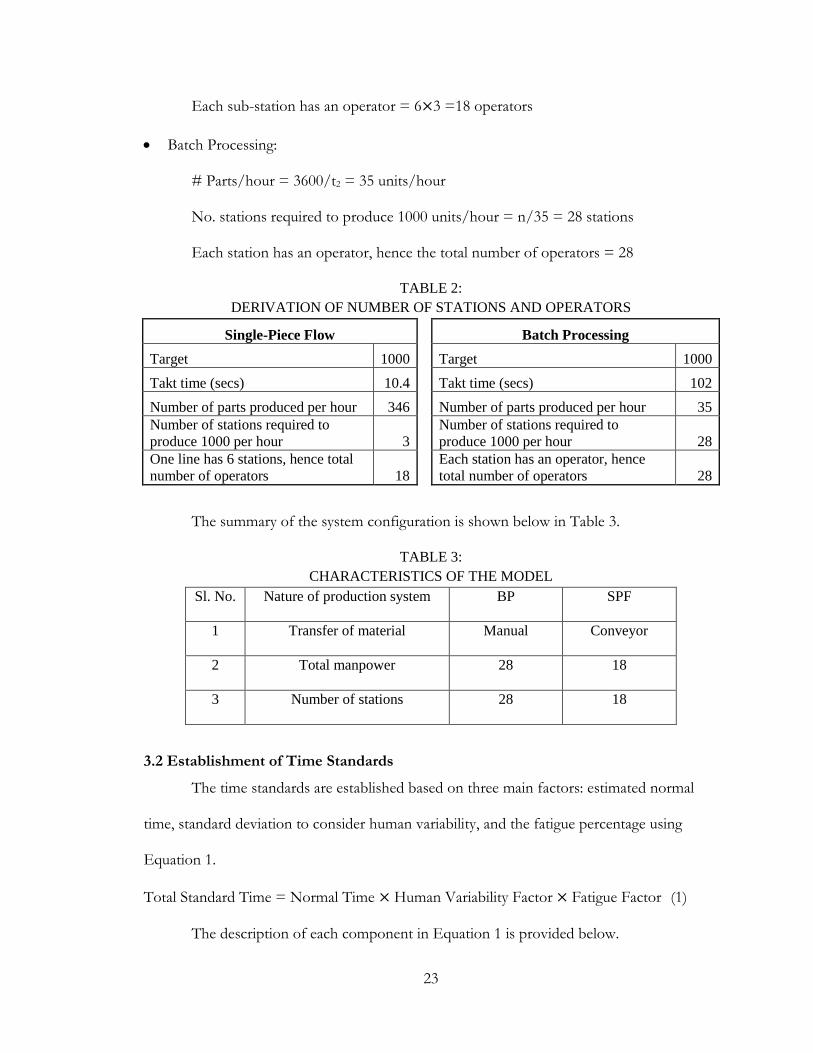
Batch Processing:
# Parts/hour = 3600/t2 = 35 units/hour
No. stations required to produce 1000 units/hour = n/35 = 28 stations
Each station has an operator, hence the total number of operators = 28
TABLE 2:
DERIVATION OF NUMBER OF STATIONS AND OPERATORS
Single-Piece Flow Batch Processing
Target 1000 Target 1000
Takt time (secs) 10.4 Takt time (secs) 102
Number of parts produced per hour 346 Number of parts produced per hour 35
Number of stations required to
produce 1000 per hour 3
Number of stations required to
produce 1000 per hour 28
One line has 6 stations, hence total
number of operators 18
Each station has an operator, hence
total number of operators 28
The summary of the system configuration is shown below in Table 3.
TABLE 3:
CHARACTERISTICS OF THE MODEL
Sl. No. Nature of production system BP SPF
1 Transfer of material Manual Conveyor
2 Total manpower 28 18
3 Number of stations 28 18
3.2 Establishment of Time Standards
The time standards are established based on three main factors: estimated normal
time, standard deviation to consider human variability, and the fatigue percentage using
Equation 1.
Total Standard Time = Normal Time × Human Variability Factor × Fatigue Factor (1)
The description of each component in Equation 1 is provided below.
24
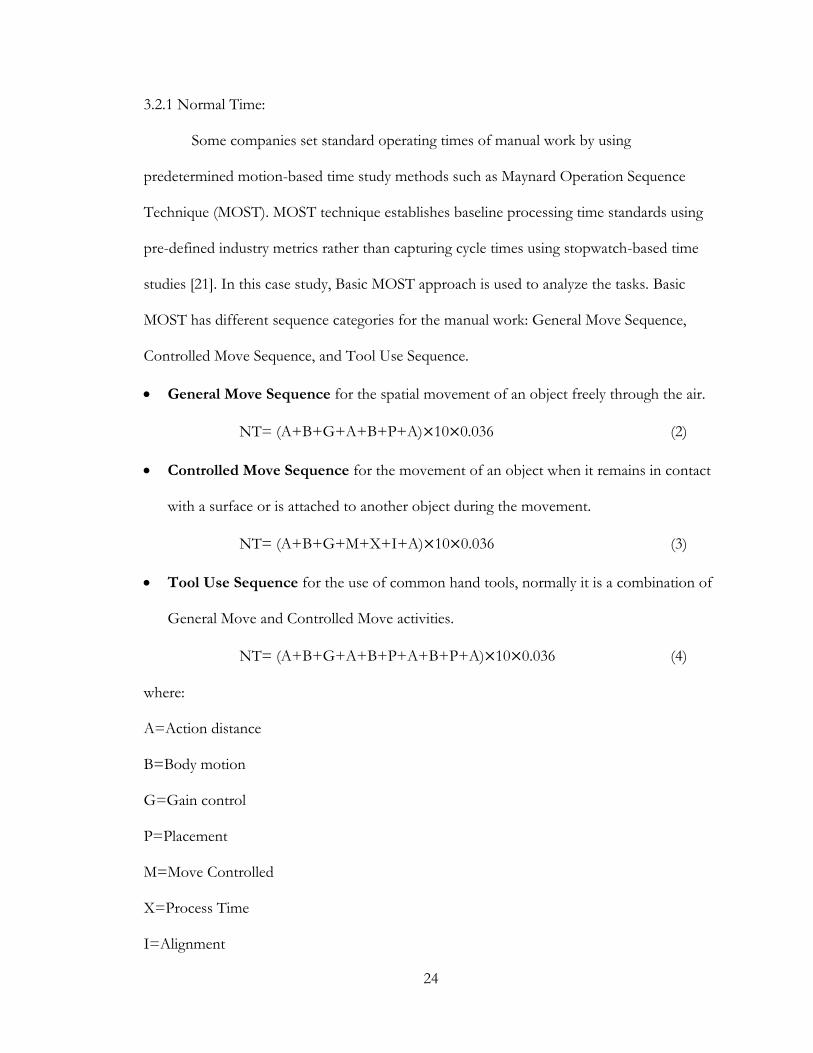
3.2.1 Normal Time:
Some companies set standard operating times of manual work by using
predetermined motion-based time study methods such as Maynard Operation Sequence
Technique (MOST). MOST technique establishes baseline processing time standards using
pre-defined industry metrics rather than capturing cycle times using stopwatch-based time
studies [21]. In this case study, Basic MOST approach is used to analyze the tasks. Basic
MOST has different sequence categories for the manual work: General Move Sequence,
Controlled Move Sequence, and Tool Use Sequence.
General Move Sequence for the spatial movement of an object freely through the air.
NT= (A+B+G+A+B+P+A)×10×0.036 (2)
Controlled Move Sequence for the movement of an object when it remains in contact
with a surface or is attached to another object during the movement.
NT= (A+B+G+M+X+I+A)×10×0.036 (3)
Tool Use Sequence for the use of common hand tools, normally it is a combination of
General Move and Controlled Move activities.
NT= (A+B+G+A+B+P+A+B+P+A)×10×0.036 (4)
where:
A=Action distance
B=Body motion
G=Gain control
P=Placement
M=Move Controlled
X=Process Time
I=Alignment
25
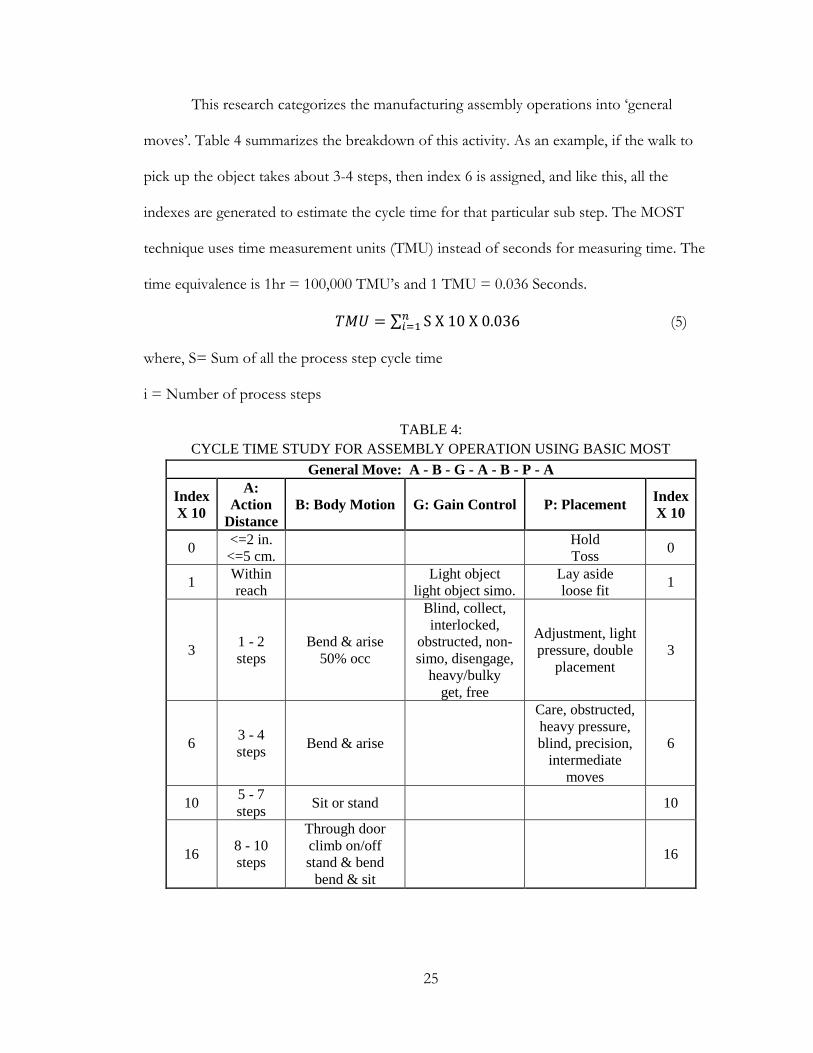
This research categorizes the manufacturing assembly operations into ‘general
moves’. Table 4 summarizes the breakdown of this activity. As an example, if the walk to
pick up the object takes about 3-4 steps, then index 6 is assigned, and like this, all the
indexes are generated to estimate the cycle time for that particular sub step. The MOST
technique uses time measurement units (TMU) instead of seconds for measuring time. The
time equivalence is 1hr = 100,000 TMU’s and 1 TMU = 0.036 Seconds.
𝑇𝑀𝑈 = ∑ S X 10 X 0.036𝑛𝑖=1 (5)
where, S= Sum of all the process step cycle time
i = Number of process steps
TABLE 4:
CYCLE TIME STUDY FOR ASSEMBLY OPERATION USING BASIC MOST
General Move: A - B - G - A - B - P - A
Index
X 10
A:
Action
Distance
B: Body Motion G: Gain Control P: Placement Index
X 10
0 <=2 in.
<=5 cm.
Hold
Toss 0
1 Within
reach
Light object
light object simo.
Lay aside
loose fit 1
3 1 - 2
steps
Bend & arise
50% occ
Blind, collect,
interlocked,
obstructed, non-
simo, disengage,
heavy/bulky
get, free
Adjustment, light
pressure, double
placement
3
6 3 - 4
steps Bend & arise
Care, obstructed,
heavy pressure,
blind, precision,
intermediate
moves
6
10 5 - 7
steps Sit or stand 10
16 8 - 10
steps
Through door
climb on/off
stand & bend
bend & sit
16
26
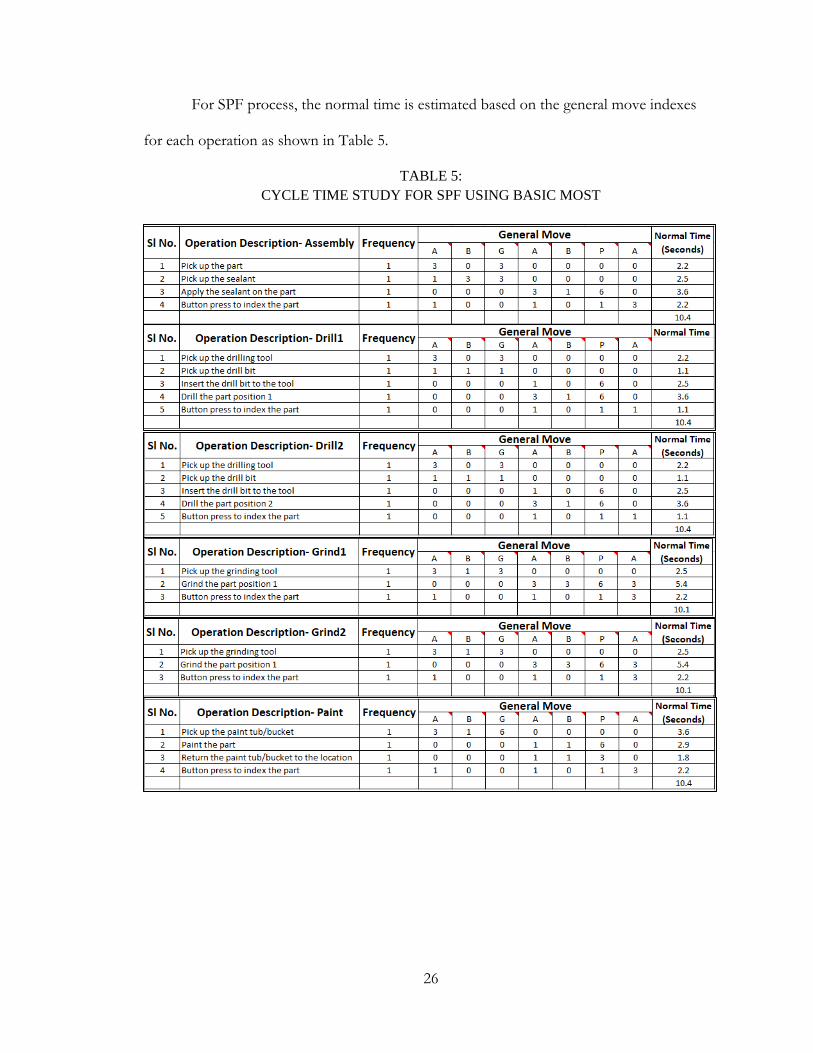
For SPF process, the normal time is estimated based on the general move indexes
for each operation as shown in Table 5.
TABLE 5:
CYCLE TIME STUDY FOR SPF USING BASIC MOST
27
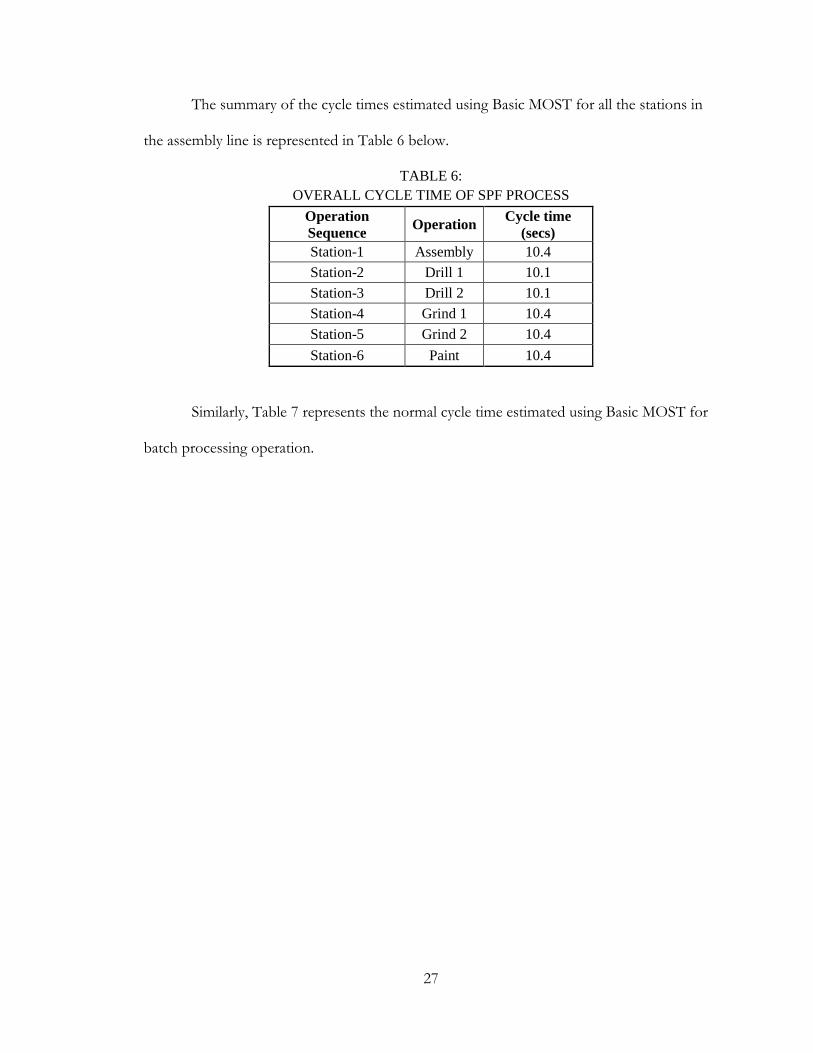
The summary of the cycle times estimated using Basic MOST for all the stations in
the assembly line is represented in Table 6 below.
TABLE 6:
OVERALL CYCLE TIME OF SPF PROCESS
Operation
Sequence Operation
Cycle time
(secs)
Station-1 Assembly 10.4
Station-2 Drill 1 10.1
Station-3 Drill 2 10.1
Station-4 Grind 1 10.4
Station-5 Grind 2 10.4
Station-6 Paint 10.4
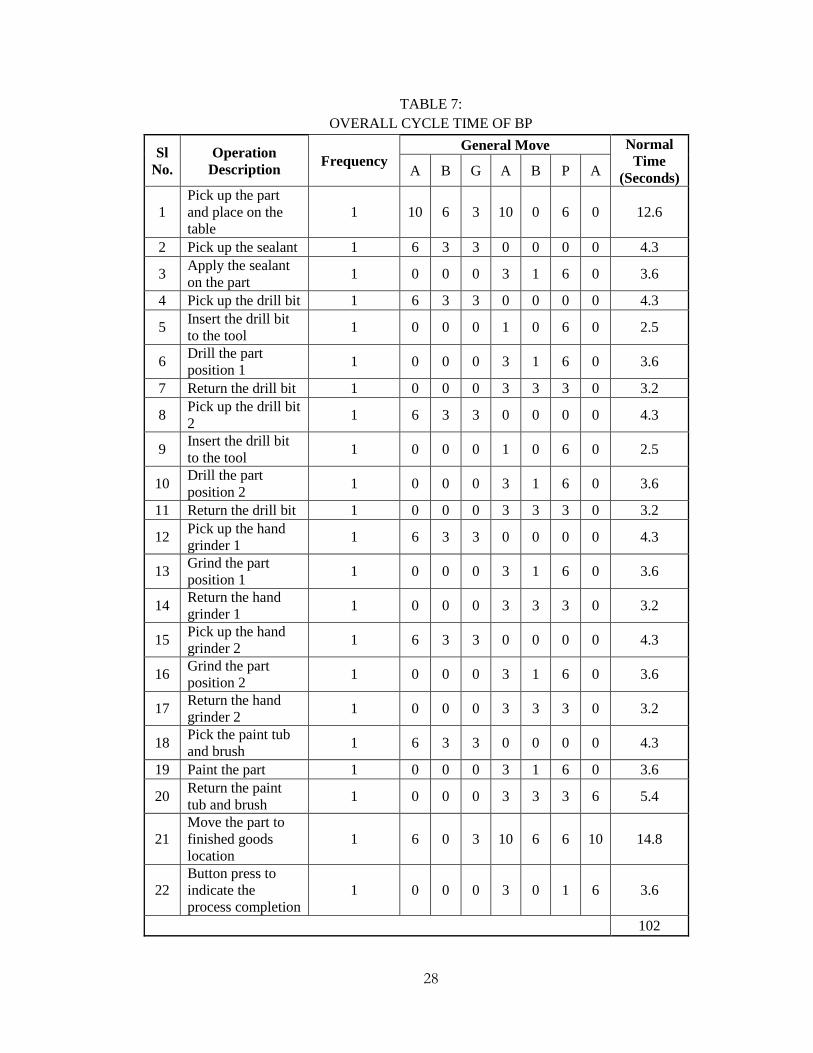
Similarly, Table 7 represents the normal cycle time estimated using Basic MOST for
batch processing operation.
28
TABLE 7:
OVERALL CYCLE TIME OF BP
Sl
No.
Operation
Description Frequency
General Move Normal
Time
(Seconds) A B G A B P A
1
Pick up the part
and place on the
table
1 10 6 3 10 0 6 0 12.6
2 Pick up the sealant 1 6 3 3 0 0 0 0 4.3
3 Apply the sealant
on the part 1 0 0 0 3 1 6 0 3.6
4 Pick up the drill bit 1 6 3 3 0 0 0 0 4.3
5 Insert the drill bit
to the tool 1 0 0 0 1 0 6 0 2.5
6 Drill the part
position 1 1 0 0 0 3 1 6 0 3.6
7 Return the drill bit 1 0 0 0 3 3 3 0 3.2
8 Pick up the drill bit
2 1 6 3 3 0 0 0 0 4.3
9 Insert the drill bit
to the tool 1 0 0 0 1 0 6 0 2.5
10 Drill the part
position 2 1 0 0 0 3 1 6 0 3.6
11 Return the drill bit 1 0 0 0 3 3 3 0 3.2
12 Pick up the hand
grinder 1 1 6 3 3 0 0 0 0 4.3
13 Grind the part
position 1 1 0 0 0 3 1 6 0 3.6
14 Return the hand
grinder 1 1 0 0 0 3 3 3 0 3.2
15 Pick up the hand
grinder 2 1 6 3 3 0 0 0 0 4.3
16 Grind the part
position 2 1 0 0 0 3 1 6 0 3.6
17 Return the hand
grinder 2 1 0 0 0 3 3 3 0 3.2
18 Pick the paint tub
and brush 1 6 3 3 0 0 0 0 4.3
19 Paint the part 1 0 0 0 3 1 6 0 3.6
20 Return the paint
tub and brush 1 0 0 0 3 3 3 6 5.4
21
Move the part to
finished goods
location
1 6 0 3 10 6 6 10 14.8
22
Button press to
indicate the
process completion
1 0 0 0 3 0 1 6 3.6
102
29
3.2.2. Fatigue Factor:
Fatigue factor is associated with the allowance that is given to the operator while the
task is being performed. This is comprised of personal, fatigue and delay factors. As an
example, restroom breaks, operator stepping aside for a phone call, operator receiving
instructions from supervisor, etc. are considered. The details on various types of fatigue
factors are discussed in Section 3.3. However, the fatigue factors are multiplied to the
normal cycle time to contribute to the calculation of standard process time.
3.2.3 Human Variability:
Work performed by humans is highly stochastic, thus in this category, human
variability is considered as a contributing factor to estimate the standard process time. As an
example, in case of SPF, the assembly operation is estimated to be performed by the
operator in 10.4 seconds. However, since this operation is not automated and involves
human element, there is some variation associated always. It is not always possible for an
operator to hit the same cycle time every time during the operation. In order to consider that
variation in the cycle time, a 20% standard deviation factor is multiplied to the normal time
[25]. This processing time is thus assumed Normally Distributed with a 20% deviation.
3.3 Fatigue Models
There are two types of fatigue factor methods considered in the study: Personal
Fatigue and Delay (PFD) and Strain Index (SI). These factors are described below.
3.3.1 Personal Fatigue and Delay (PFD):
In a manual manufacturing system, an additional allowance must be considered to
the normal operating time so as to recover the loss in production due to the interruptions an
operator receives while performing the task:
Personal: This is the allowance for the operator’s personal needs, such as the restroom
30
breaks, attending a phone call, etc.
Fatigue: This is the allowance given to the operator for getting affected by the working
environment, such as the concerns like standing/bending, eye strain, poor lighting, noise,
etc.
Unavoidable Delays: This is allocated to deal with the unavoidable interruptions like
machine breakdown, part unavailability, etc.
Neibel [30] discusses the applications of these allowances. An allowance is a
multiplier to the normal time. It is always based on the daily production time. An industrial
survey is conducted for 42 different plants for various standard operations, and the average
allowance for all the plants is 17.7%. The allowances are assigned based on the different
subcategories such as personal time, unavoidable delays and fatigue, time for cleaning the
workstation, time for oiling the machines, planned and unplanned shutdowns, and tool
maintenance time. The respective indexes are added to get the total effort time and is
segregated between the machine and operators time.
Table 8 shown below represents the survey summary on the indexes for personal
fatigue and delay are based on the standard operations in the plants.
31
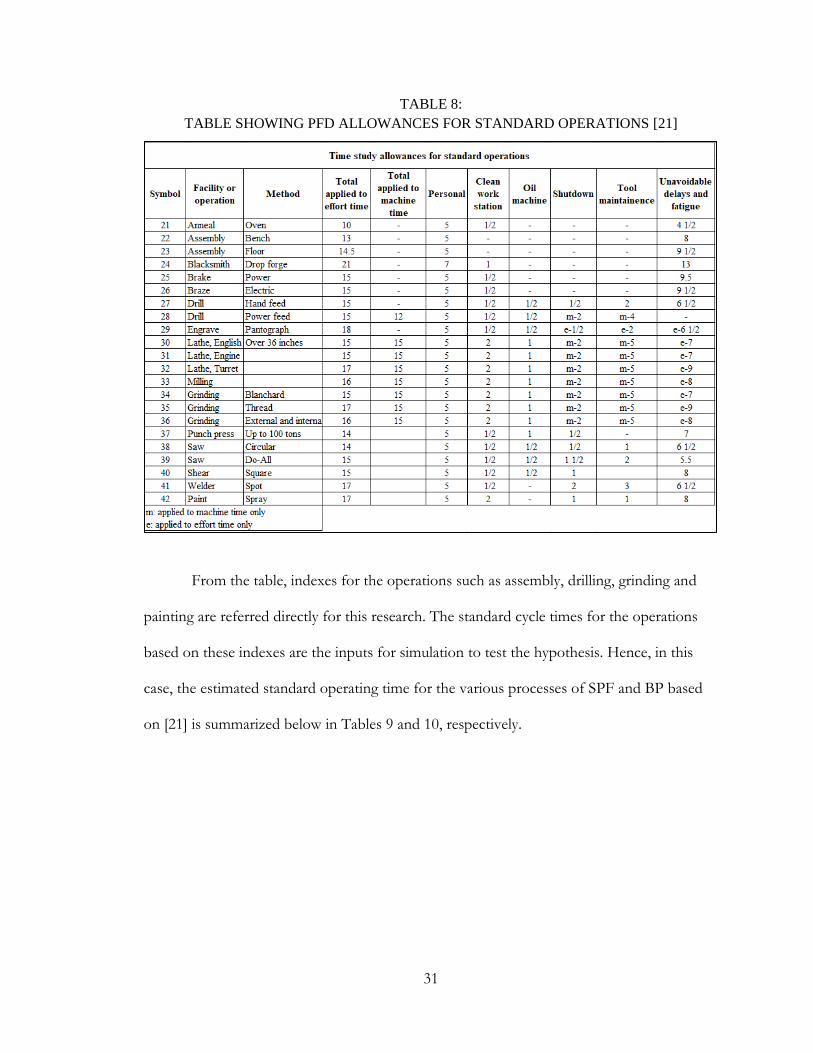
TABLE 8:
TABLE SHOWING PFD ALLOWANCES FOR STANDARD OPERATIONS [21]
From the table, indexes for the operations such as assembly, drilling, grinding and
painting are referred directly for this research. The standard cycle times for the operations
based on these indexes are the inputs for simulation to test the hypothesis. Hence, in this
case, the estimated standard operating time for the various processes of SPF and BP based
on [21] is summarized below in Tables 9 and 10, respectively.
32
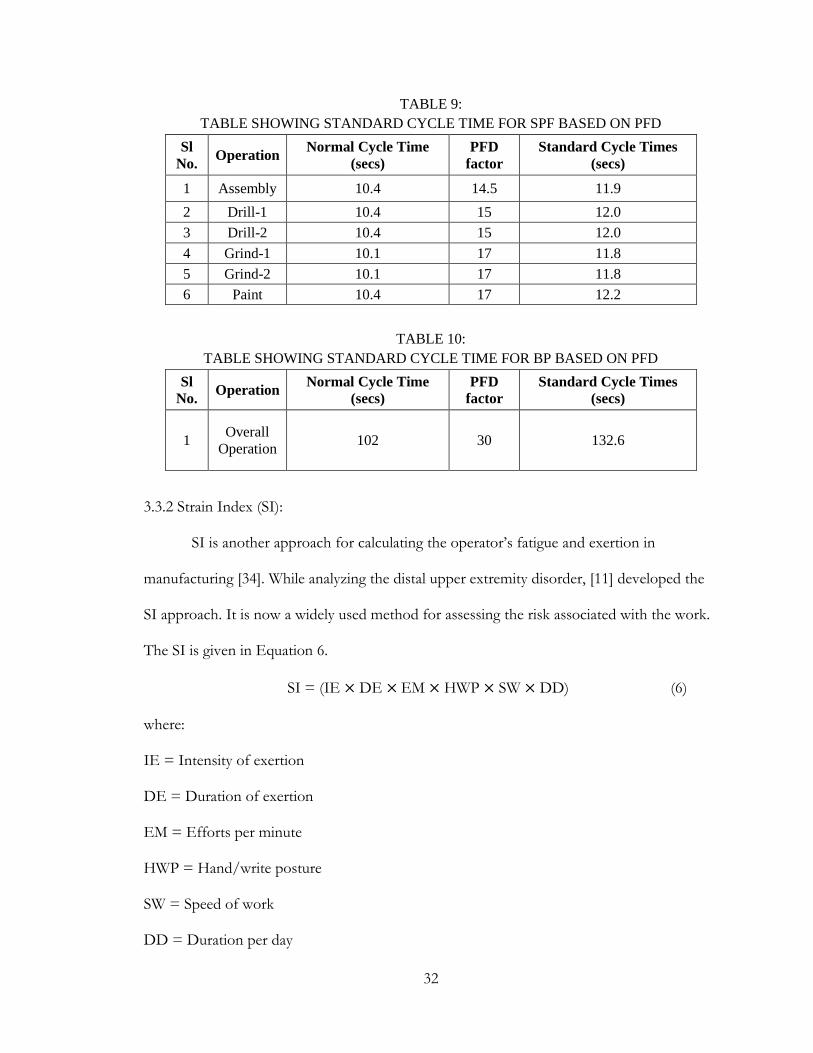
TABLE 9:
TABLE SHOWING STANDARD CYCLE TIME FOR SPF BASED ON PFD
Sl
No. Operation
Normal Cycle Time
(secs)
PFD
factor
Standard Cycle Times
(secs)
1 Assembly 10.4 14.5 11.9
2 Drill-1 10.4 15 12.0
3 Drill-2 10.4 15 12.0
4 Grind-1 10.1 17 11.8
5 Grind-2 10.1 17 11.8
6 Paint 10.4 17 12.2
TABLE 10:
TABLE SHOWING STANDARD CYCLE TIME FOR BP BASED ON PFD
Sl
No. Operation
Normal Cycle Time
(secs)
PFD
factor
Standard Cycle Times
(secs)
1 Overall
Operation 102 30 132.6
3.3.2 Strain Index (SI):
SI is another approach for calculating the operator’s fatigue and exertion in
manufacturing [34]. While analyzing the distal upper extremity disorder, [11] developed the
SI approach. It is now a widely used method for assessing the risk associated with the work.
The SI is given in Equation 6.
SI = (IE × DE × EM × HWP × SW × DD) (6)
where:
IE = Intensity of exertion
DE = Duration of exertion
EM = Efforts per minute
HWP = Hand/write posture
SW = Speed of work
DD = Duration per day
33
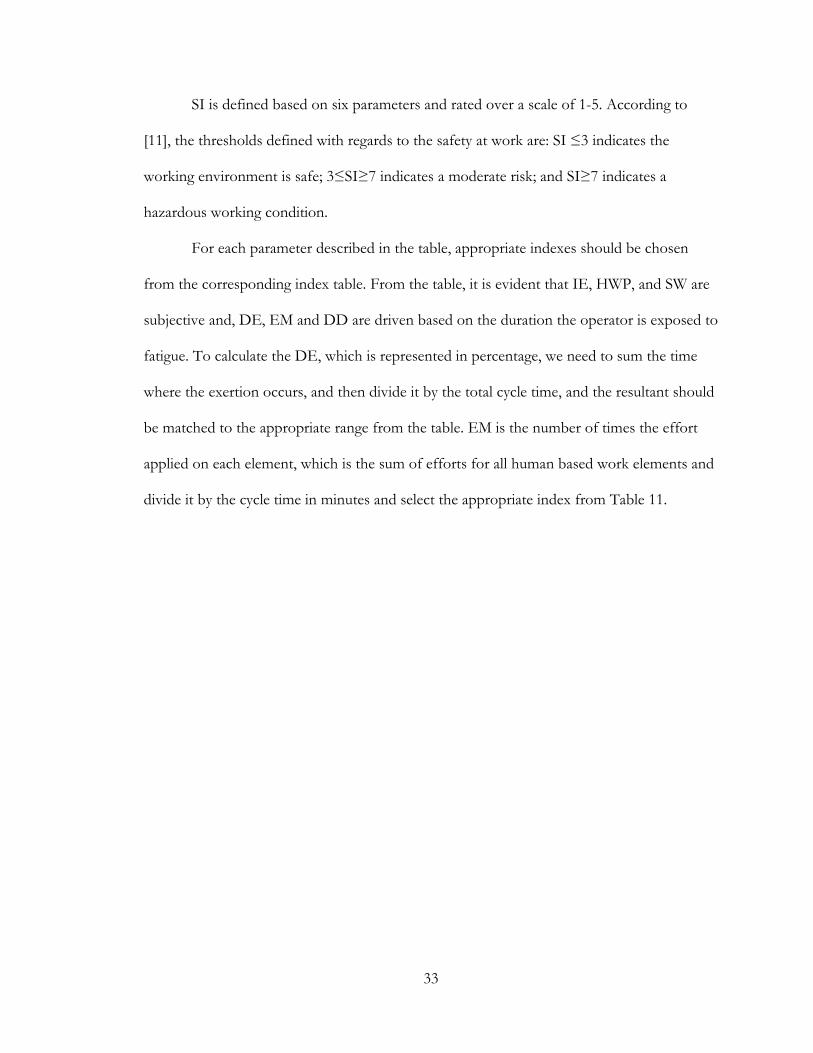
SI is defined based on six parameters and rated over a scale of 1-5. According to
[11], the thresholds defined with regards to the safety at work are: SI ≤3 indicates the
working environment is safe; 3≤SI≥7 indicates a moderate risk; and SI≥7 indicates a
hazardous working condition.
For each parameter described in the table, appropriate indexes should be chosen
from the corresponding index table. From the table, it is evident that IE, HWP, and SW are
subjective and, DE, EM and DD are driven based on the duration the operator is exposed to
fatigue. To calculate the DE, which is represented in percentage, we need to sum the time
where the exertion occurs, and then divide it by the total cycle time, and the resultant should
be matched to the appropriate range from the table. EM is the number of times the effort
applied on each element, which is the sum of efforts for all human based work elements and
divide it by the cycle time in minutes and select the appropriate index from Table 11.
34
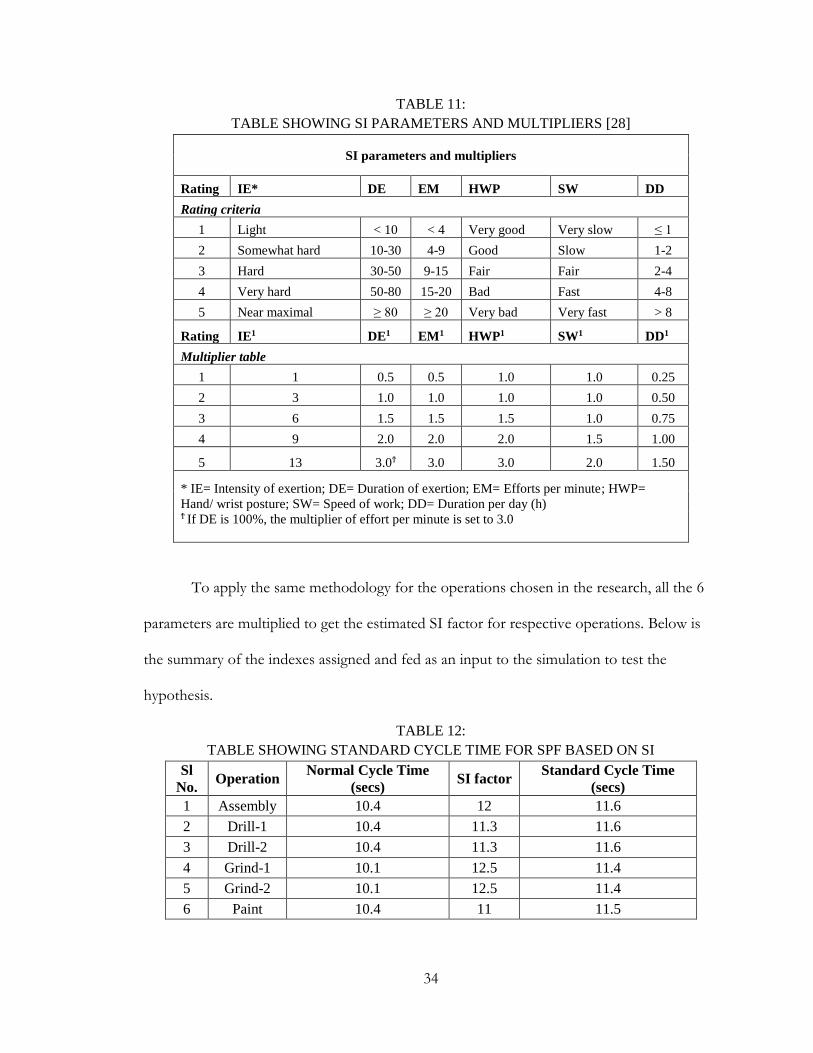
TABLE 11:
TABLE SHOWING SI PARAMETERS AND MULTIPLIERS [28]
SI parameters and multipliers
Rating IE* DE EM HWP SW DD
Rating criteria
1 Light < 10 < 4 Very good Very slow ≤ 1
2 Somewhat hard 10-30 4-9 Good Slow 1-2
3 Hard 30-50 9-15 Fair Fair 2-4
4 Very hard 50-80 15-20 Bad Fast 4-8
5 Near maximal ≥ 80 ≥ 20 Very bad Very fast > 8
Rating IE1 DE1 EM1 HWP1 SW1 DD1
Multiplier table
1 1 0.5 0.5 1.0 1.0 0.25
2 3 1.0 1.0 1.0 1.0 0.50
3 6 1.5 1.5 1.5 1.0 0.75
4 9 2.0 2.0 2.0 1.5 1.00
5 13 3.0Ϯ 3.0 3.0 2.0 1.50
* IE= Intensity of exertion; DE= Duration of exertion; EM= Efforts per minute; HWP=
Hand/ wrist posture; SW= Speed of work; DD= Duration per day (h) Ϯ If DE is 100%, the multiplier of effort per minute is set to 3.0
To apply the same methodology for the operations chosen in the research, all the 6
parameters are multiplied to get the estimated SI factor for respective operations. Below is
the summary of the indexes assigned and fed as an input to the simulation to test the
hypothesis.
TABLE 12:
TABLE SHOWING STANDARD CYCLE TIME FOR SPF BASED ON SI
Sl
No. Operation
Normal Cycle Time
(secs) SI factor
Standard Cycle Time
(secs)
1 Assembly 10.4 12 11.6
2 Drill-1 10.4 11.3 11.6
3 Drill-2 10.4 11.3 11.6
4 Grind-1 10.1 12.5 11.4
5 Grind-2 10.1 12.5 11.4
6 Paint 10.4 11 11.5
35
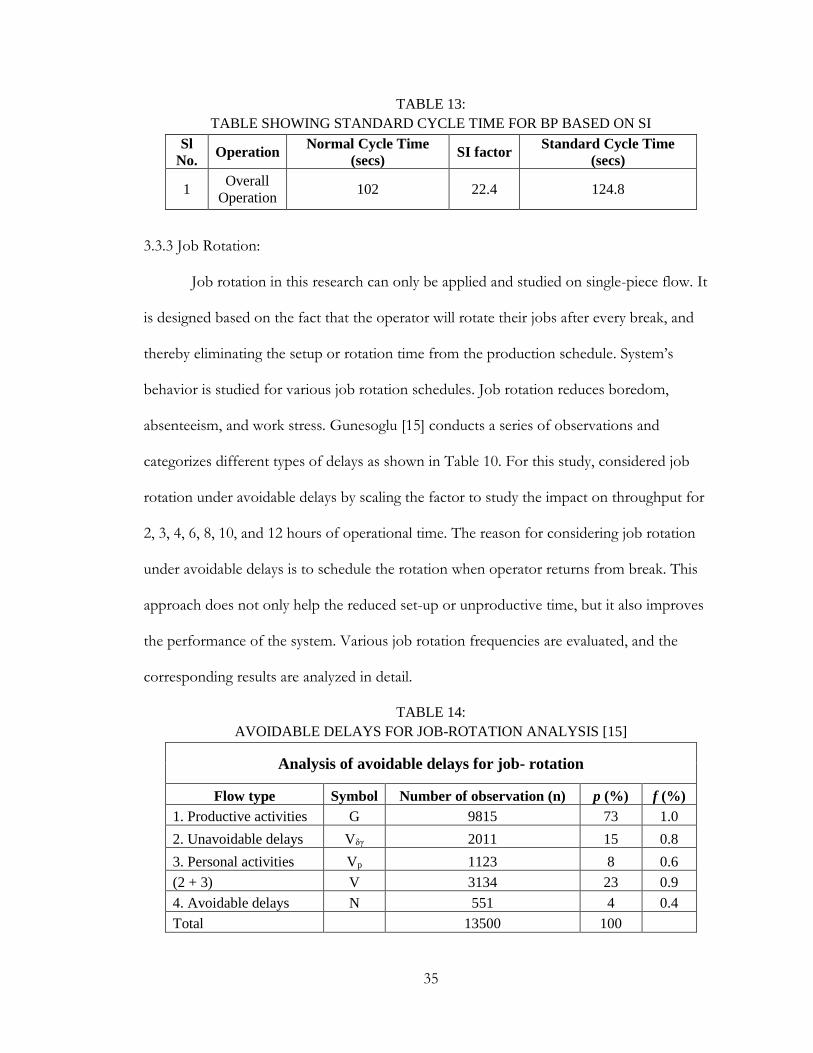
TABLE 13:
TABLE SHOWING STANDARD CYCLE TIME FOR BP BASED ON SI
Sl
No. Operation
Normal Cycle Time
(secs) SI factor
Standard Cycle Time
(secs)
1 Overall
Operation 102 22.4 124.8
3.3.3 Job Rotation:
Job rotation in this research can only be applied and studied on single-piece flow. It
is designed based on the fact that the operator will rotate their jobs after every break, and
thereby eliminating the setup or rotation time from the production schedule. System’s
behavior is studied for various job rotation schedules. Job rotation reduces boredom,
absenteeism, and work stress. Gunesoglu [15] conducts a series of observations and
categorizes different types of delays as shown in Table 10. For this study, considered job
rotation under avoidable delays by scaling the factor to study the impact on throughput for
2, 3, 4, 6, 8, 10, and 12 hours of operational time. The reason for considering job rotation
under avoidable delays is to schedule the rotation when operator returns from break. This
approach does not only help the reduced set-up or unproductive time, but it also improves
the performance of the system. Various job rotation frequencies are evaluated, and the
corresponding results are analyzed in detail.
TABLE 14:
AVOIDABLE DELAYS FOR JOB-ROTATION ANALYSIS [15]
Analysis of avoidable delays for job- rotation
Flow type Symbol Number of observation (n) p (%) f (%)
1. Productive activities G 9815 73 1.0
2. Unavoidable delays Vδγ 2011 15 0.8
3. Personal activities Vp 1123 8 0.6
(2 + 3) V 3134 23 0.9
4. Avoidable delays N 551 4 0.4
Total 13500 100

36
Job-rotation factor, R, is calculated as: R= (t× (n/p))/3600 (7)
where:
R= Job rotation factor
t= Takt time in seconds
n= Number of observations
p= Avoidable delay percent
The fatigue factor F is estimated as follows: F = f * (p/R) (8)
where
F = Fatigue Factor
f = Frequency of job rotation
p = Avoidable delay percent
R = Job rotation factor.
For example, suppose t=10.4 secs, n=551 and p=4.08 percent, job rotation factor R
is 1.59, as computed by Equation 7. The fatigue factors for various rotation models is shown
in Table 15, which are calculated by using Equation 8.
TABLE 15:
FATIGUE BASED ON VARIOUS ROTATION INTERVALS
Rotation Intervals (Hrs)
Job Rotation Frequency 2 3 4 6 8 10 12
Fatigue (%) 5.1 7.7 10.3 15.4 20.5 25.6 30.8
3.4 Discrete Event Simulation Model
A discrete-event simulation model is developed by using FlexSim software. The
purpose of using simulation in this study is to analyze the impact on throughput under
37
various design points. A simulation model is built for each process configuration, i.e. SPF
and BP. The overall environment for simulation in both the systems is maintained the same
for comparison, except the main driving values such as cycle time and fatigue factors.
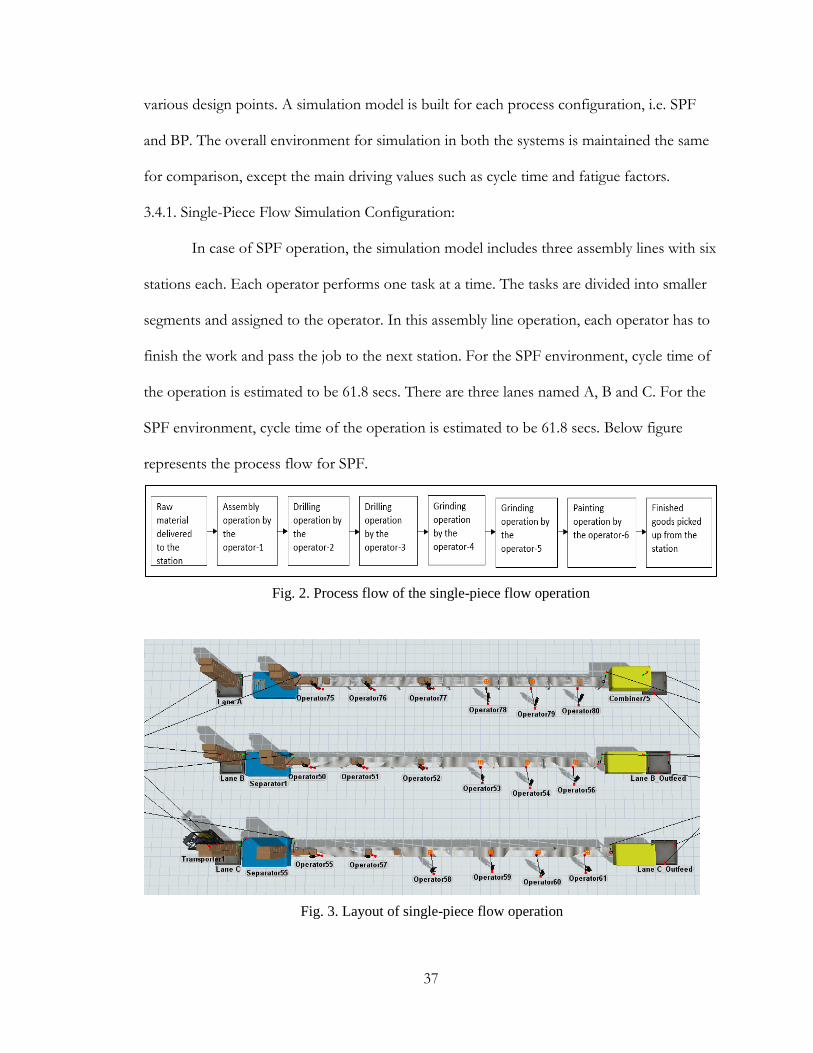
3.4.1. Single-Piece Flow Simulation Configuration:
In case of SPF operation, the simulation model includes three assembly lines with six
stations each. Each operator performs one task at a time. The tasks are divided into smaller
segments and assigned to the operator. In this assembly line operation, each operator has to
finish the work and pass the job to the next station. For the SPF environment, cycle time of
the operation is estimated to be 61.8 secs. There are three lanes named A, B and C. For the
SPF environment, cycle time of the operation is estimated to be 61.8 secs. Below figure
represents the process flow for SPF.
Fig. 3. Layout of single-piece flow operation
Fig. 2. Process flow of the single-piece flow operation
38
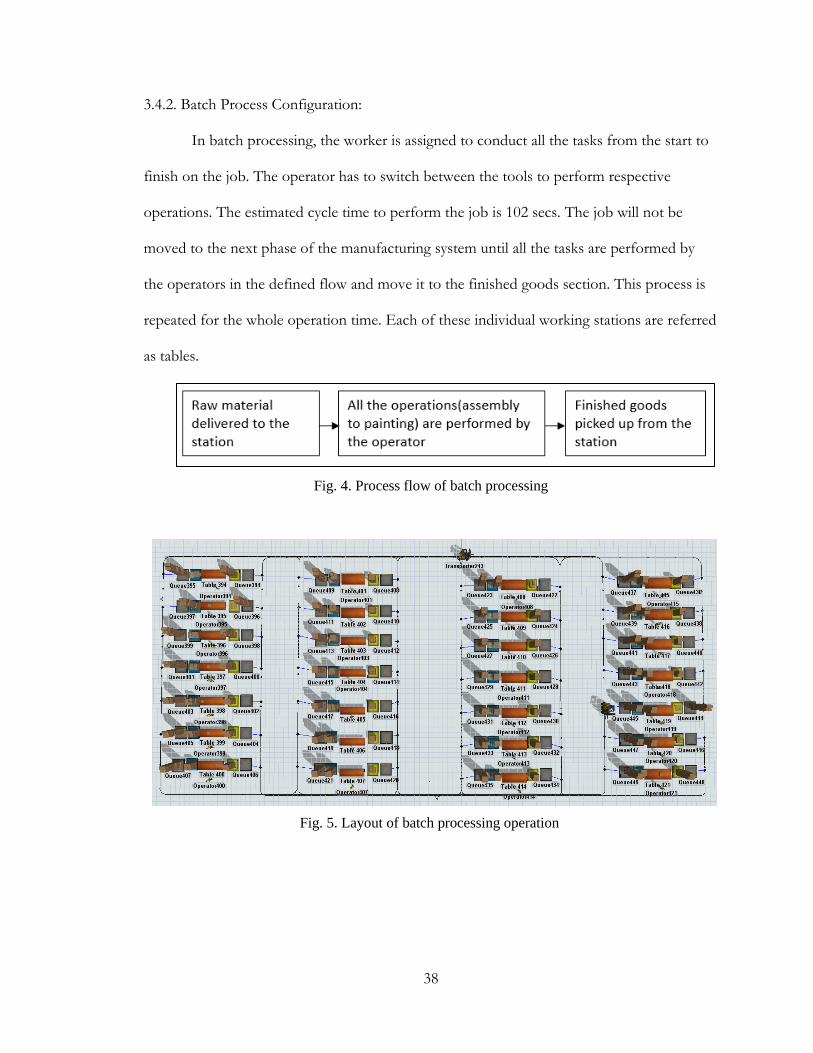
3.4.2. Batch Process Configuration:
In batch processing, the worker is assigned to conduct all the tasks from the start to
finish on the job. The operator has to switch between the tools to perform respective
operations. The estimated cycle time to perform the job is 102 secs. The job will not be
moved to the next phase of the manufacturing system until all the tasks are performed by
the operators in the defined flow and move it to the finished goods section. This process is
repeated for the whole operation time. Each of these individual working stations are referred
as tables.
Fig. 5. Layout of batch processing operation
Fig. 4. Process flow of batch processing
39
4. DESIGN AND ANALYSIS OF SIMULATION EXPERIMENTS
In this chapter, a detailed analysis of the proposed methodology is discussed. The
main elements of this chapter are divided into three categories:
Design of Simulation Experiments
Statistical Analysis of Simulation Results
Operational Expense Analysis
To compare the two manufacturing systems- single-piece flow and batch processing,
the simulation experiments are designed based on with fatigue and without-fatigue inputs.
Under analysis with fatigue, the response in terms of throughput is assessed based on two
different fatigue indexes: Personal Fatigue and Delay, and Strain Index units. Job rotation
analysis is considered for single-piece flow. Using Minitab, statistical experimentation is
designed, and lastly, the overall operational expense for both the manufacturing systems is
studied and compared.
4.1 Design of Simulation Experiments
4.1.1. Simulation runs:
Each simulation is run for 20 simulation days along with 10 simulation days for
warm-up period. Simulations were run as independent runs. Common random numbers
were not used in these experiments. To maintain the continuous flow of the parts in the
system, input and output stations are designed to receive and deliver 50 units per batch.
Model Verification and validation:
The simulation models are developed to visualize and verify the process based on the
input given to the model for various scenarios. Through the software output, we verify the
model is running as expected. The model should then be validated to understand if the
simulation results replicate the system under study. In this research, we verify and validate
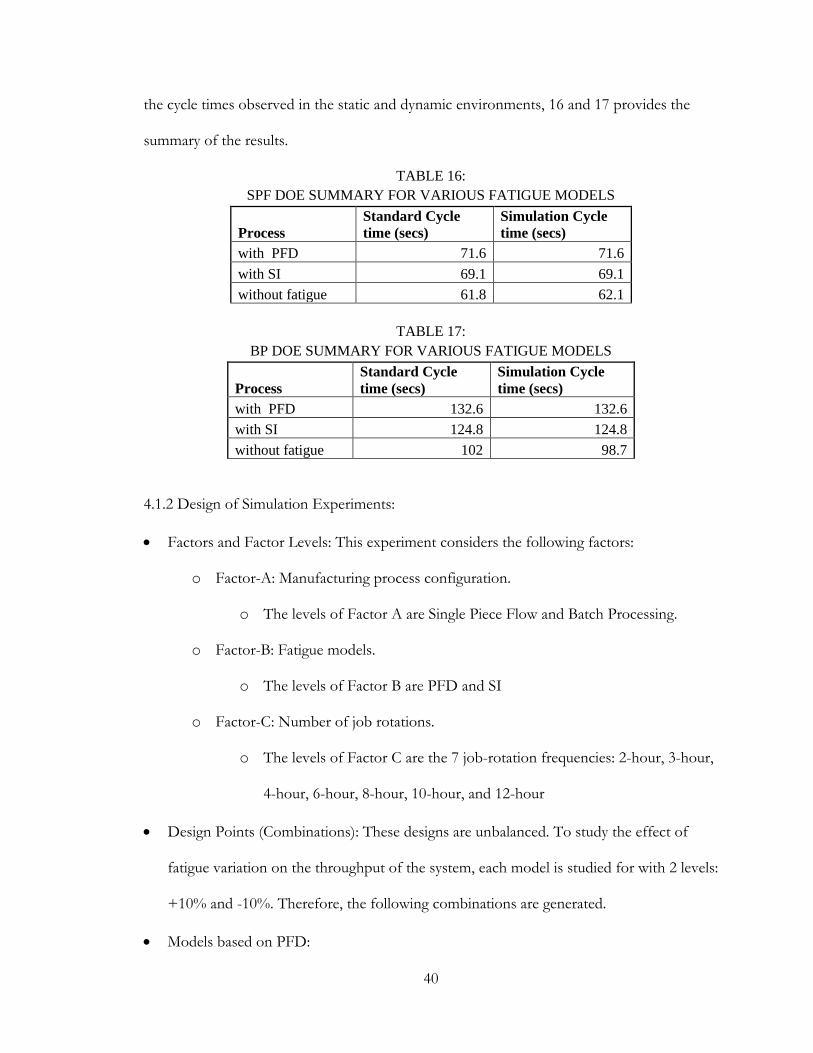
40
the cycle times observed in the static and dynamic environments, 16 and 17 provides the
summary of the results.
TABLE 16:
SPF DOE SUMMARY FOR VARIOUS FATIGUE MODELS
Process
Standard Cycle
time (secs)
Simulation Cycle
time (secs)
with PFD 71.6 71.6
with SI 69.1 69.1
without fatigue 61.8 62.1
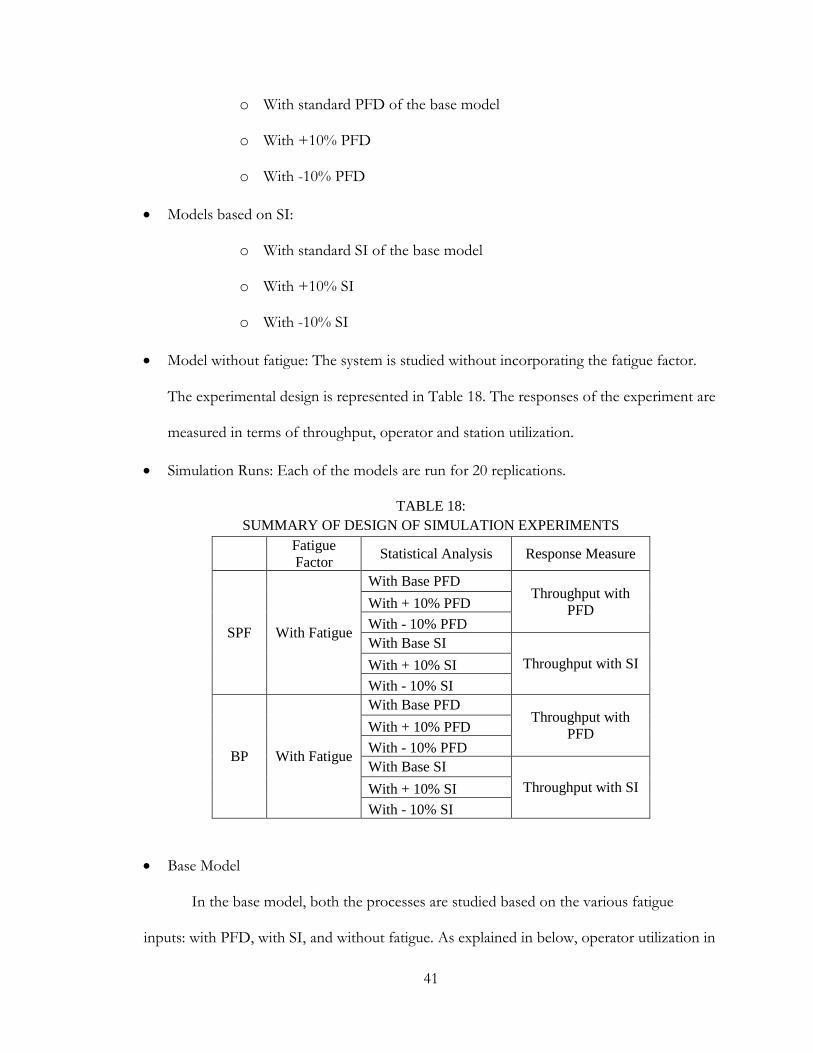
TABLE 17:
BP DOE SUMMARY FOR VARIOUS FATIGUE MODELS
Process
Standard Cycle
time (secs)
Simulation Cycle
time (secs)
with PFD 132.6 132.6
with SI 124.8 124.8
without fatigue 102 98.7
4.1.2 Design of Simulation Experiments:
Factors and Factor Levels: This experiment considers the following factors:
o Factor-A: Manufacturing process configuration.
o The levels of Factor A are Single Piece Flow and Batch Processing.
o Factor-B: Fatigue models.
o The levels of Factor B are PFD and SI
o Factor-C: Number of job rotations.
o The levels of Factor C are the 7 job-rotation frequencies: 2-hour, 3-hour,
4-hour, 6-hour, 8-hour, 10-hour, and 12-hour
Design Points (Combinations): These designs are unbalanced. To study the effect of
fatigue variation on the throughput of the system, each model is studied for with 2 levels:
+10% and -10%. Therefore, the following combinations are generated.
Models based on PFD:
41
o With standard PFD of the base model
o With +10% PFD
o With -10% PFD
Models based on SI:
o With standard SI of the base model
o With +10% SI
o With -10% SI
Model without fatigue: The system is studied without incorporating the fatigue factor.
The experimental design is represented in Table 18. The responses of the experiment are
measured in terms of throughput, operator and station utilization.
Simulation Runs: Each of the models are run for 20 replications.
TABLE 18:
SUMMARY OF DESIGN OF SIMULATION EXPERIMENTS
Fatigue
Factor Statistical Analysis Response Measure
SPF With Fatigue
With Base PFD Throughput with
PFD With + 10% PFD
With - 10% PFD
With Base SI
Throughput with SI With + 10% SI
With - 10% SI
BP With Fatigue
With Base PFD Throughput with
PFD With + 10% PFD
With - 10% PFD
With Base SI
Throughput with SI With + 10% SI
With - 10% SI
Base Model
In the base model, both the processes are studied based on the various fatigue
inputs: with PFD, with SI, and without fatigue. As explained in below, operator utilization in
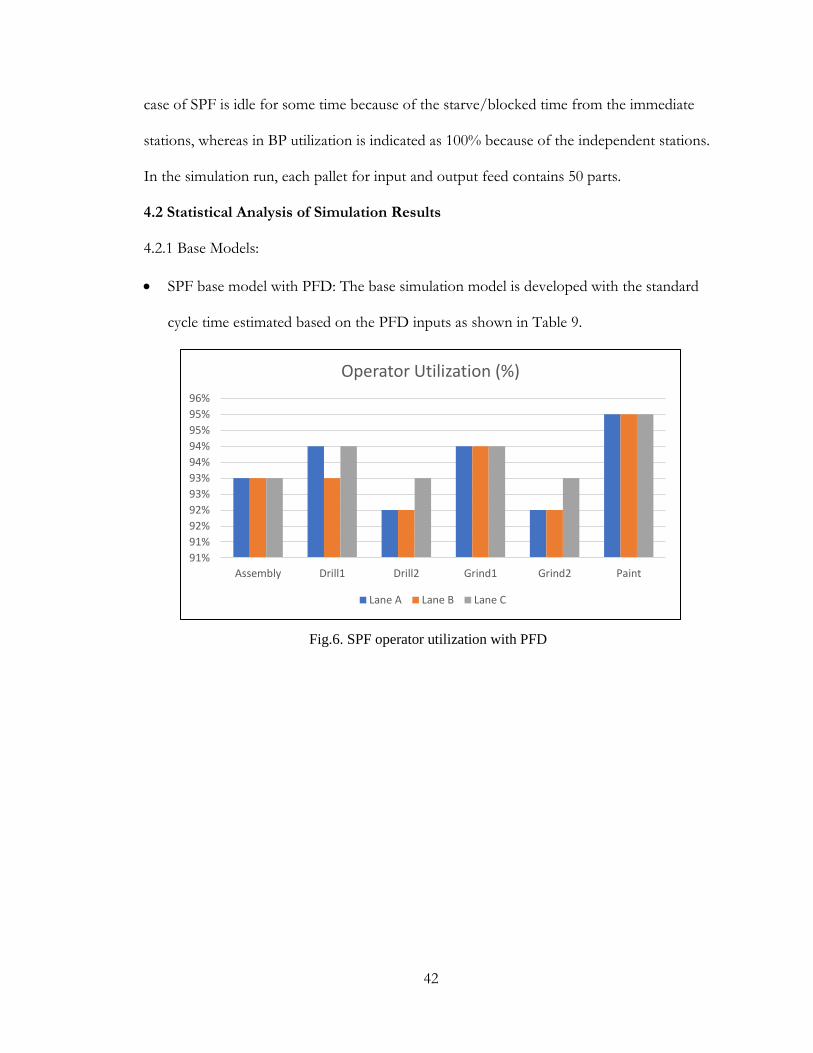
42
case of SPF is idle for some time because of the starve/blocked time from the immediate
stations, whereas in BP utilization is indicated as 100% because of the independent stations.
In the simulation run, each pallet for input and output feed contains 50 parts.
4.2 Statistical Analysis of Simulation Results
4.2.1 Base Models:
SPF base model with PFD: The base simulation model is developed with the standard
cycle time estimated based on the PFD inputs as shown in Table 9.
91%
91%
92%
92%
93%
93%
94%
94%
95%
95%
96%
Assembly Drill1 Drill2 Grind1 Grind2 Paint
Operator Utilization (%)
Lane A Lane B Lane C
Fig.6. SPF operator utilization with PFD
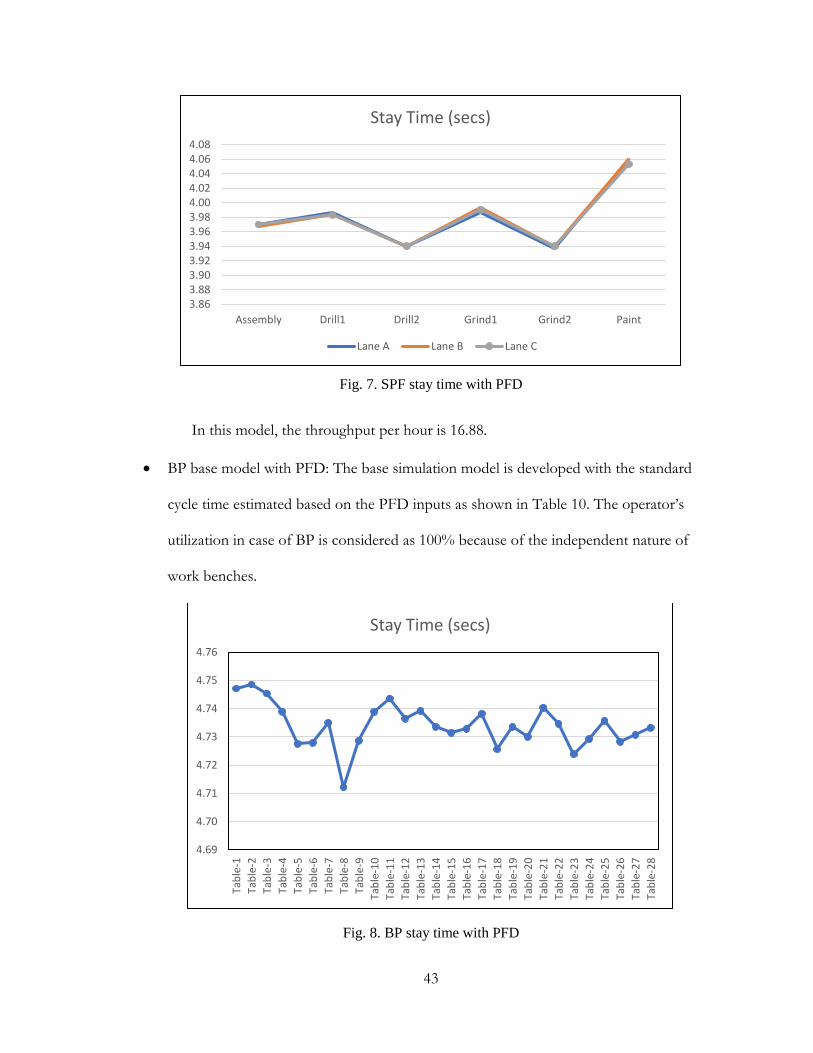
43
In this model, the throughput per hour is 16.88.
BP base model with PFD: The base simulation model is developed with the standard
cycle time estimated based on the PFD inputs as shown in Table 10. The operator’s
utilization in case of BP is considered as 100% because of the independent nature of
work benches.
3.863.883.903.923.943.963.984.004.024.044.064.08
Assembly Drill1 Drill2 Grind1 Grind2 Paint
Stay Time (secs)
Lane A Lane B Lane C
4.69
4.70
4.71
4.72
4.73
4.74
4.75
4.76
Tab
le-1
Tab
le-2
Tab
le-3
Tab
le-4
Tab
le-5
Tab
le-6
Tab
le-7
Tab
le-8
Tab
le-9
Tab
le-1
0
Tab
le-1
1
Tab
le-1
2
Tab
le-1
3
Tab
le-1
4
Tab
le-1
5
Tab
le-1
6
Tab
le-1
7
Tab
le-1
8
Tab
le-1
9
Tab
le-2
0
Tab
le-2
1
Tab
le-2
2
Tab
le-2
3
Tab
le-2
4
Tab
le-2
5
Tab
le-2
6
Tab
le-2
7
Tab
le-2
8
Stay Time (secs)
Fig. 7. SPF stay time with PFD
Fig. 8. BP stay time with PFD
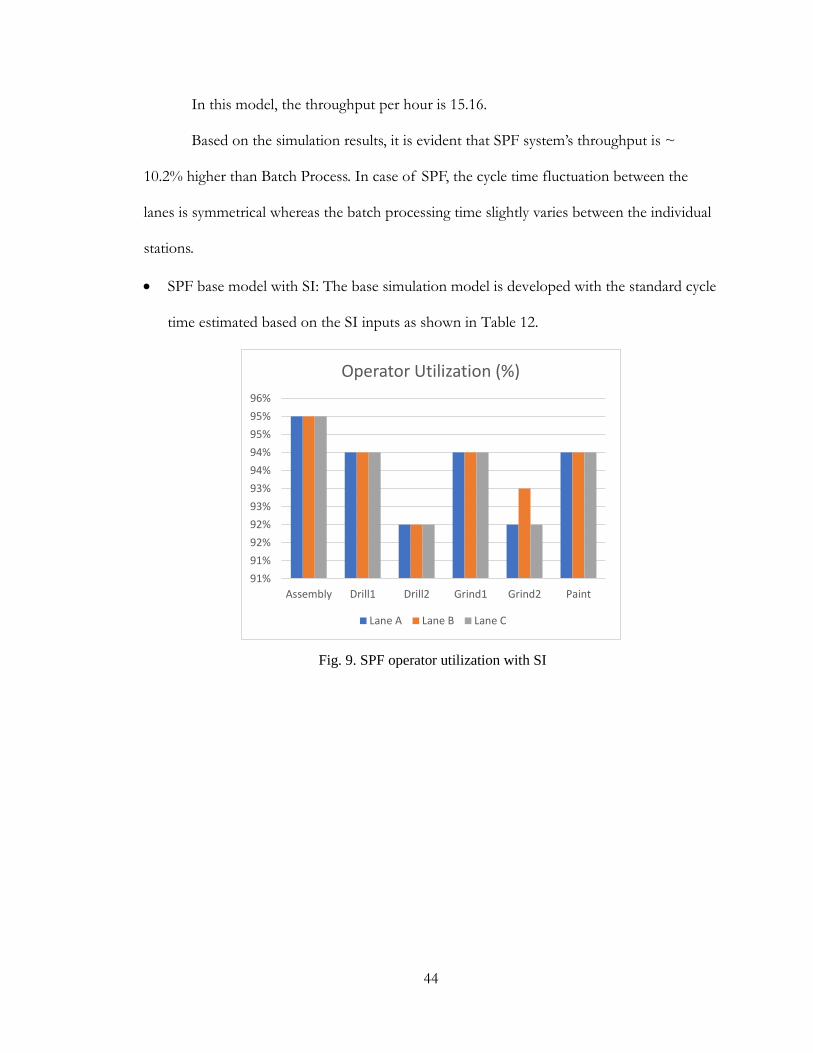
44
In this model, the throughput per hour is 15.16.
Based on the simulation results, it is evident that SPF system’s throughput is ~
10.2% higher than Batch Process. In case of SPF, the cycle time fluctuation between the
lanes is symmetrical whereas the batch processing time slightly varies between the individual
stations.
SPF base model with SI: The base simulation model is developed with the standard cycle
time estimated based on the SI inputs as shown in Table 12.
91%
91%
92%
92%
93%
93%
94%
94%
95%
95%
96%
Assembly Drill1 Drill2 Grind1 Grind2 Paint
Operator Utilization (%)
Lane A Lane B Lane C
Fig. 9. SPF operator utilization with SI
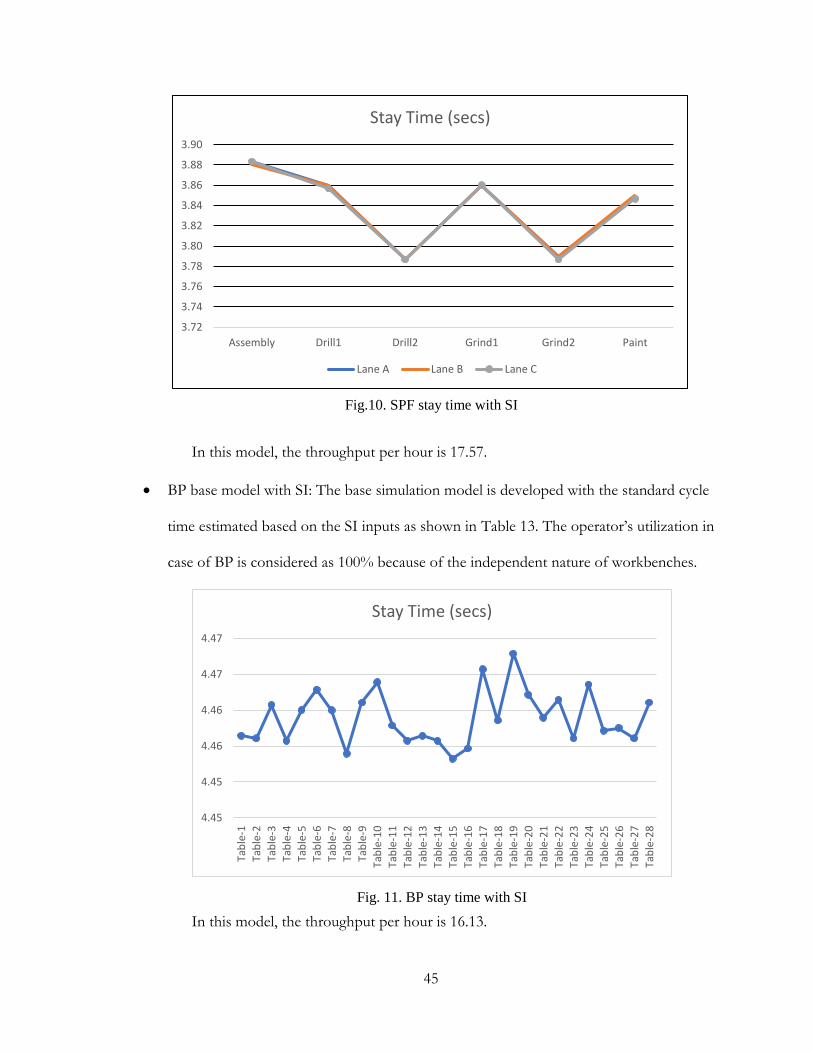
45
In this model, the throughput per hour is 17.57.
BP base model with SI: The base simulation model is developed with the standard cycle
time estimated based on the SI inputs as shown in Table 13. The operator’s utilization in
case of BP is considered as 100% because of the independent nature of workbenches.
In this model, the throughput per hour is 16.13.
3.72
3.74
3.76
3.78
3.80
3.82
3.84
3.86
3.88
3.90
Assembly Drill1 Drill2 Grind1 Grind2 Paint
Stay Time (secs)
Lane A Lane B Lane C
Fig.10. SPF stay time with SI
4.45
4.45
4.46
4.46
4.47
4.47
Tab
le-1
Tab
le-2
Tab
le-3
Tab
le-4
Tab
le-5
Tab
le-6
Tab
le-7
Tab
le-8
Tab
le-9
Tab
le-1
0
Tab
le-1
1
Tab
le-1
2
Tab
le-1
3
Tab
le-1
4
Tab
le-1
5
Tab
le-1
6
Tab
le-1
7
Tab
le-1
8
Tab
le-1
9
Tab
le-2
0
Tab
le-2
1
Tab
le-2
2
Tab
le-2
3
Tab
le-2
4
Tab
le-2
5
Tab
le-2
6
Tab
le-2
7
Tab
le-2
8
Stay Time (secs)
Fig. 11. BP stay time with SI
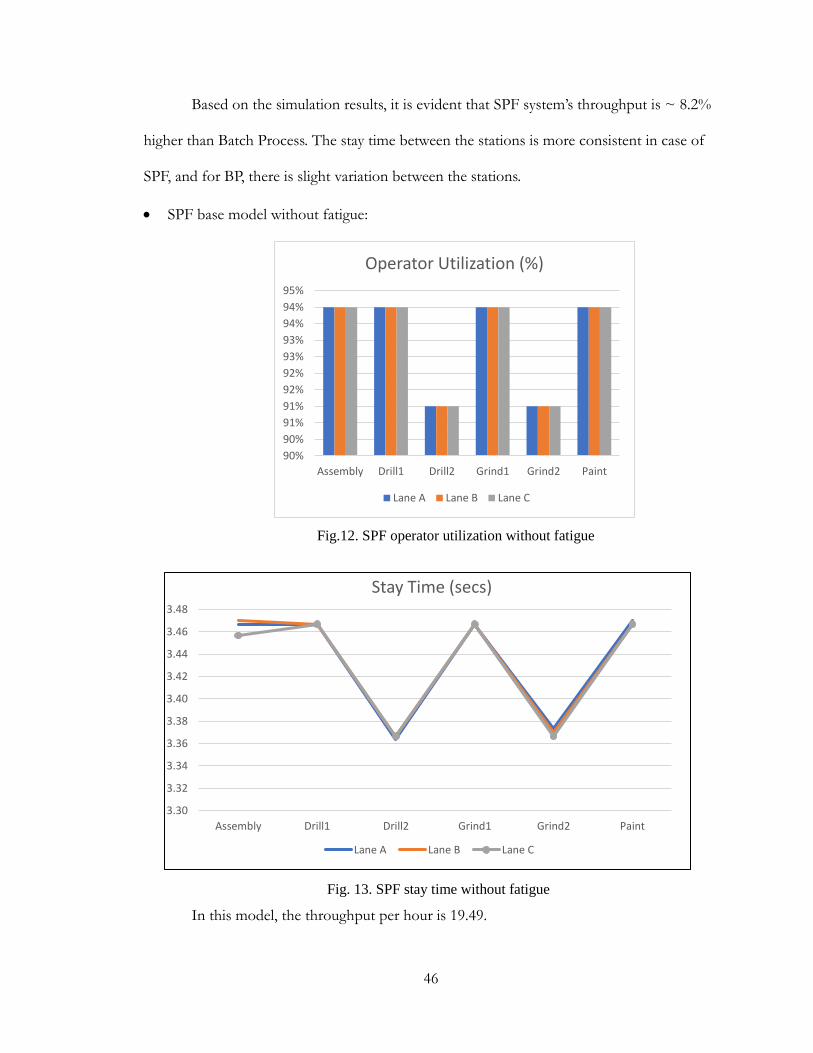
46
Based on the simulation results, it is evident that SPF system’s throughput is ~ 8.2%
higher than Batch Process. The stay time between the stations is more consistent in case of
SPF, and for BP, there is slight variation between the stations.
SPF base model without fatigue:
In this model, the throughput per hour is 19.49.
90%
90%
91%
91%
92%
92%
93%
93%
94%
94%
95%
Assembly Drill1 Drill2 Grind1 Grind2 Paint
Operator Utilization (%)
Lane A Lane B Lane C
Fig.12. SPF operator utilization without fatigue
3.30
3.32
3.34
3.36
3.38
3.40
3.42
3.44
3.46
3.48
Assembly Drill1 Drill2 Grind1 Grind2 Paint
Stay Time (secs)
Lane A Lane B Lane C
Fig. 13. SPF stay time without fatigue
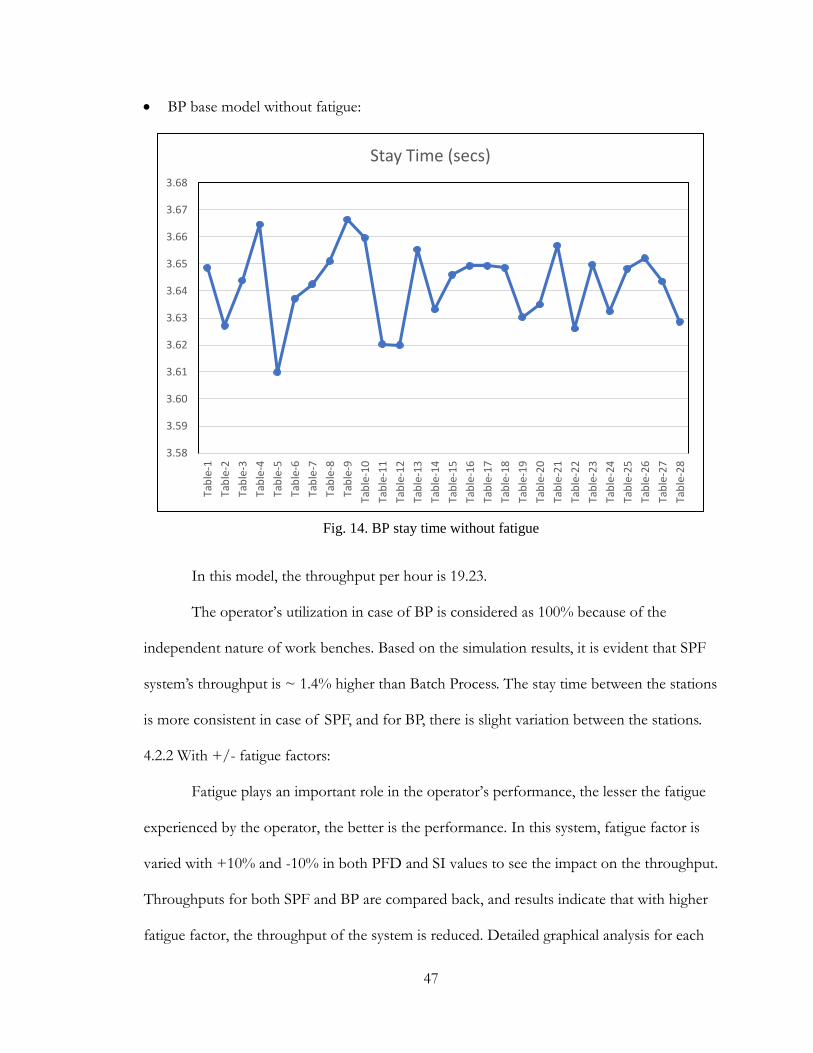
47
BP base model without fatigue:
In this model, the throughput per hour is 19.23.
The operator’s utilization in case of BP is considered as 100% because of the
independent nature of work benches. Based on the simulation results, it is evident that SPF
system’s throughput is ~ 1.4% higher than Batch Process. The stay time between the stations
is more consistent in case of SPF, and for BP, there is slight variation between the stations.
4.2.2 With +/- fatigue factors:
Fatigue plays an important role in the operator’s performance, the lesser the fatigue
experienced by the operator, the better is the performance. In this system, fatigue factor is
varied with +10% and -10% in both PFD and SI values to see the impact on the throughput.
Throughputs for both SPF and BP are compared back, and results indicate that with higher
fatigue factor, the throughput of the system is reduced. Detailed graphical analysis for each
3.58
3.59
3.60
3.61
3.62
3.63
3.64
3.65
3.66
3.67
3.68
Tab
le-1
Tab
le-2
Tab
le-3
Tab
le-4
Tab
le-5
Tab
le-6
Tab
le-7
Tab
le-8
Tab
le-9
Tab
le-1
0
Tab
le-1
1
Tab
le-1
2
Tab
le-1
3
Tab
le-1
4
Tab
le-1
5
Tab
le-1
6
Tab
le-1
7
Tab
le-1
8
Tab
le-1
9
Tab
le-2
0
Tab
le-2
1
Tab
le-2
2
Tab
le-2
3
Tab
le-2
4
Tab
le-2
5
Tab
le-2
6
Tab
le-2
7
Tab
le-2
8
Stay Time (secs)
Fig. 14. BP stay time without fatigue
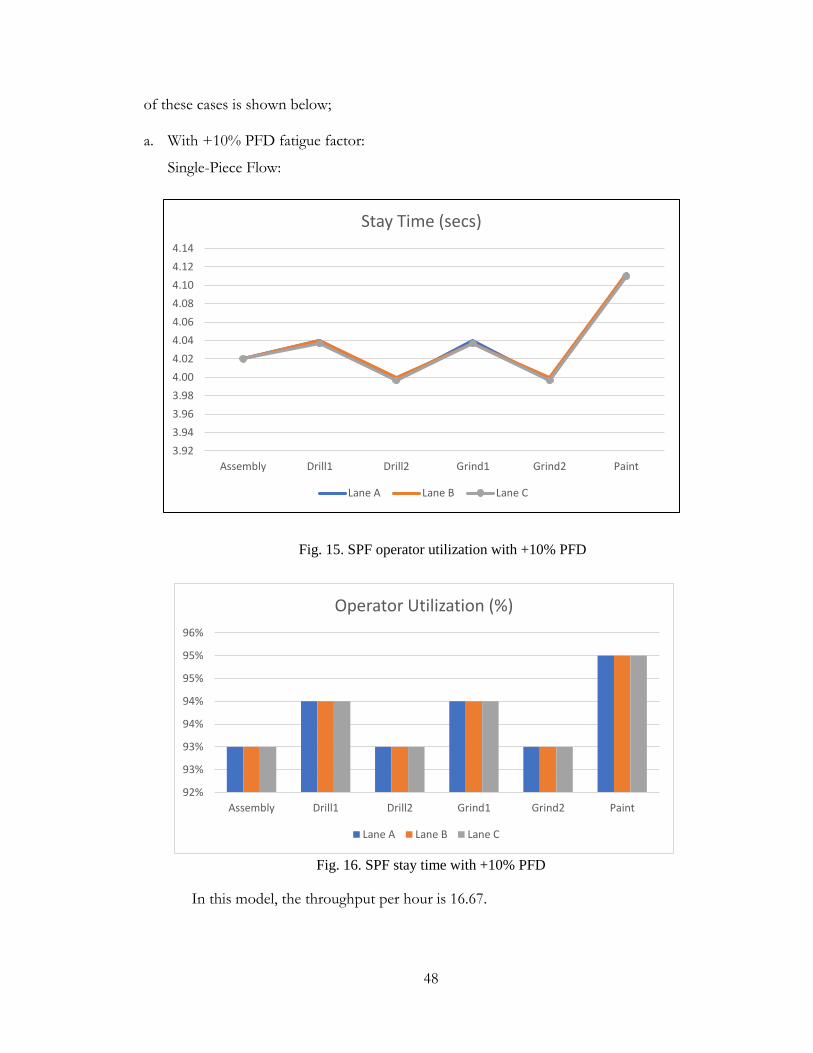
48
of these cases is shown below;
a. With +10% PFD fatigue factor:
Single-Piece Flow:
In this model, the throughput per hour is 16.67.
Fig. 15. SPF operator utilization with +10% PFD
Fig. 16. SPF stay time with +10% PFD
3.92
3.94
3.96
3.98
4.00
4.02
4.04
4.06
4.08
4.10
4.12
4.14
Assembly Drill1 Drill2 Grind1 Grind2 Paint
Stay Time (secs)
Lane A Lane B Lane C
92%
93%
93%
94%
94%
95%
95%
96%
Assembly Drill1 Drill2 Grind1 Grind2 Paint
Operator Utilization (%)
Lane A Lane B Lane C
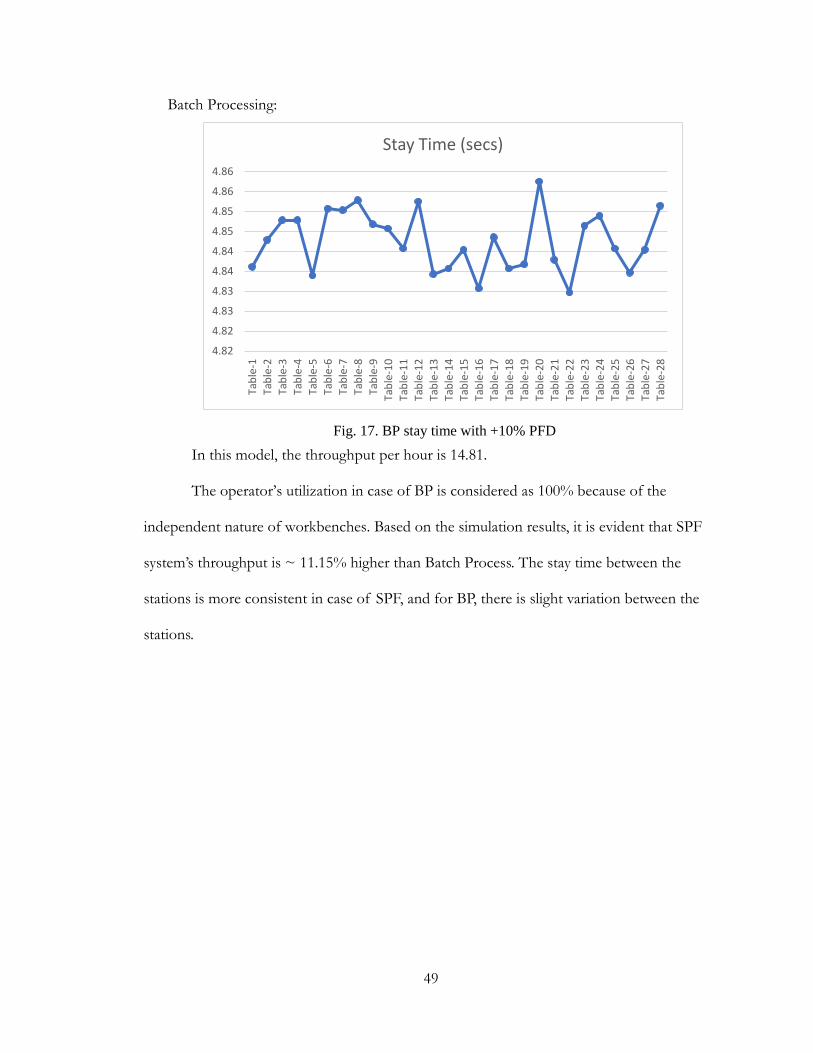
49
Batch Processing:
In this model, the throughput per hour is 14.81.
The operator’s utilization in case of BP is considered as 100% because of the
independent nature of workbenches. Based on the simulation results, it is evident that SPF
system’s throughput is ~ 11.15% higher than Batch Process. The stay time between the
stations is more consistent in case of SPF, and for BP, there is slight variation between the
stations.
4.82
4.82
4.83
4.83
4.84
4.84
4.85
4.85
4.86
4.86
Tab
le-1
Tab
le-2
Tab
le-3
Tab
le-4
Tab
le-5
Tab
le-6
Tab
le-7
Tab
le-8
Tab
le-9
Tab
le-1
0
Tab
le-1
1
Tab
le-1
2
Tab
le-1
3
Tab
le-1
4
Tab
le-1
5
Tab
le-1
6
Tab
le-1
7
Tab
le-1
8
Tab
le-1
9
Tab
le-2
0
Tab
le-2
1
Tab
le-2
2
Tab
le-2
3
Tab
le-2
4
Tab
le-2
5
Tab
le-2
6
Tab
le-2
7
Tab
le-2
8
Stay Time (secs)
Fig. 17. BP stay time with +10% PFD
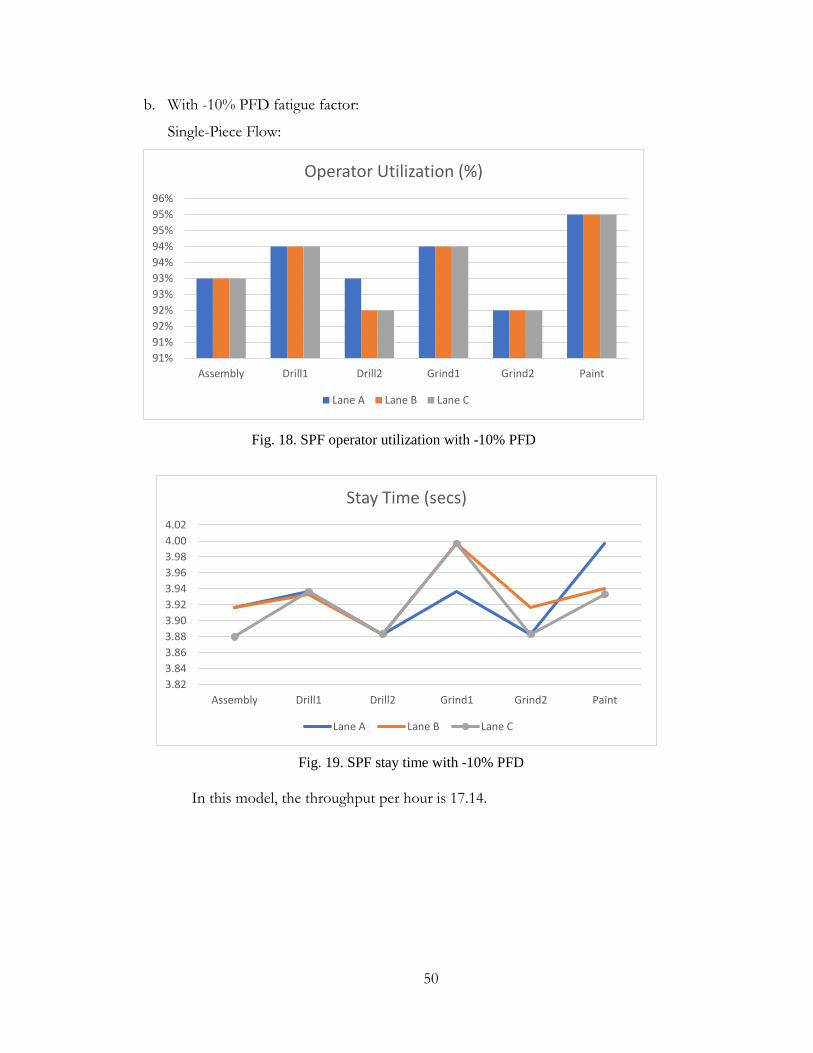
50
b. With -10% PFD fatigue factor:
Single-Piece Flow:
In this model, the throughput per hour is 17.14.
91%
91%
92%
92%
93%
93%
94%
94%
95%
95%
96%
Assembly Drill1 Drill2 Grind1 Grind2 Paint
Operator Utilization (%)
Lane A Lane B Lane C
Fig. 19. SPF stay time with -10% PFD
3.82
3.84
3.86
3.88
3.90
3.92
3.94
3.96
3.98
4.00
4.02
Assembly Drill1 Drill2 Grind1 Grind2 Paint
Stay Time (secs)
Lane A Lane B Lane C
Fig. 18. SPF operator utilization with -10% PFD
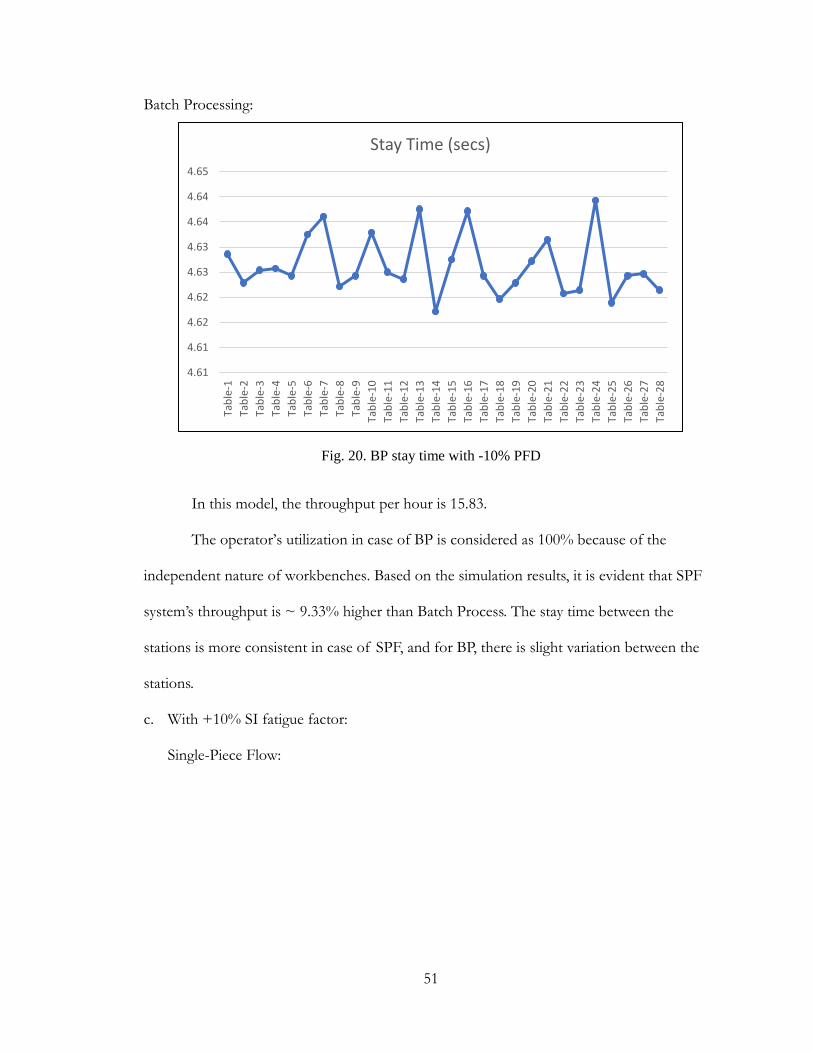
51
Batch Processing:
In this model, the throughput per hour is 15.83.
The operator’s utilization in case of BP is considered as 100% because of the
independent nature of workbenches. Based on the simulation results, it is evident that SPF
system’s throughput is ~ 9.33% higher than Batch Process. The stay time between the
stations is more consistent in case of SPF, and for BP, there is slight variation between the
stations.
c. With +10% SI fatigue factor:
Single-Piece Flow:
4.61
4.61
4.62
4.62
4.63
4.63
4.64
4.64
4.65
Tab
le-1
Tab
le-2
Tab
le-3
Tab
le-4
Tab
le-5
Tab
le-6
Tab
le-7
Tab
le-8
Tab
le-9
Tab
le-1
0
Tab
le-1
1
Tab
le-1
2
Tab
le-1
3
Tab
le-1
4
Tab
le-1
5
Tab
le-1
6
Tab
le-1
7
Tab
le-1
8
Tab
le-1
9
Tab
le-2
0
Tab
le-2
1
Tab
le-2
2
Tab
le-2
3
Tab
le-2
4
Tab
le-2
5
Tab
le-2
6
Tab
le-2
7
Tab
le-2
8
Stay Time (secs)
Fig. 20. BP stay time with -10% PFD
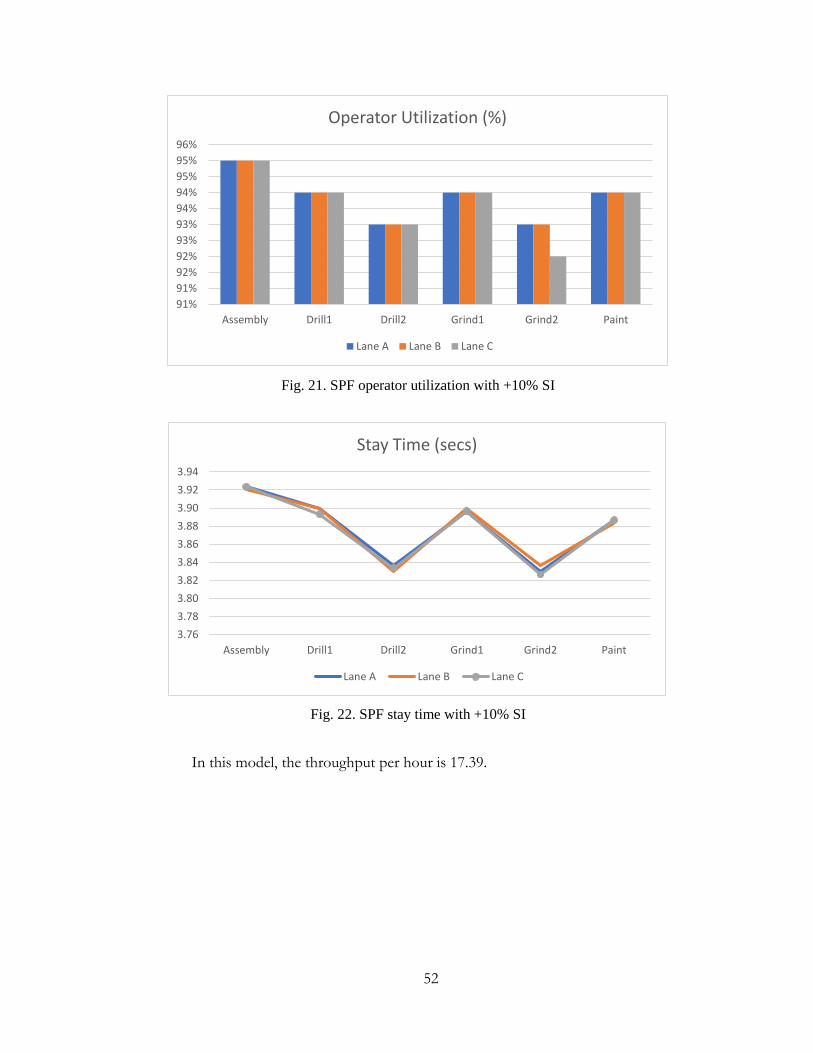
52
In this model, the throughput per hour is 17.39.
91%
91%
92%
92%
93%
93%
94%
94%
95%
95%
96%
Assembly Drill1 Drill2 Grind1 Grind2 Paint
Operator Utilization (%)
Lane A Lane B Lane C
Fig. 21. SPF operator utilization with +10% SI
Fig. 22. SPF stay time with +10% SI
3.76
3.78
3.80
3.82
3.84
3.86
3.88
3.90
3.92
3.94
Assembly Drill1 Drill2 Grind1 Grind2 Paint
Stay Time (secs)
Lane A Lane B Lane C
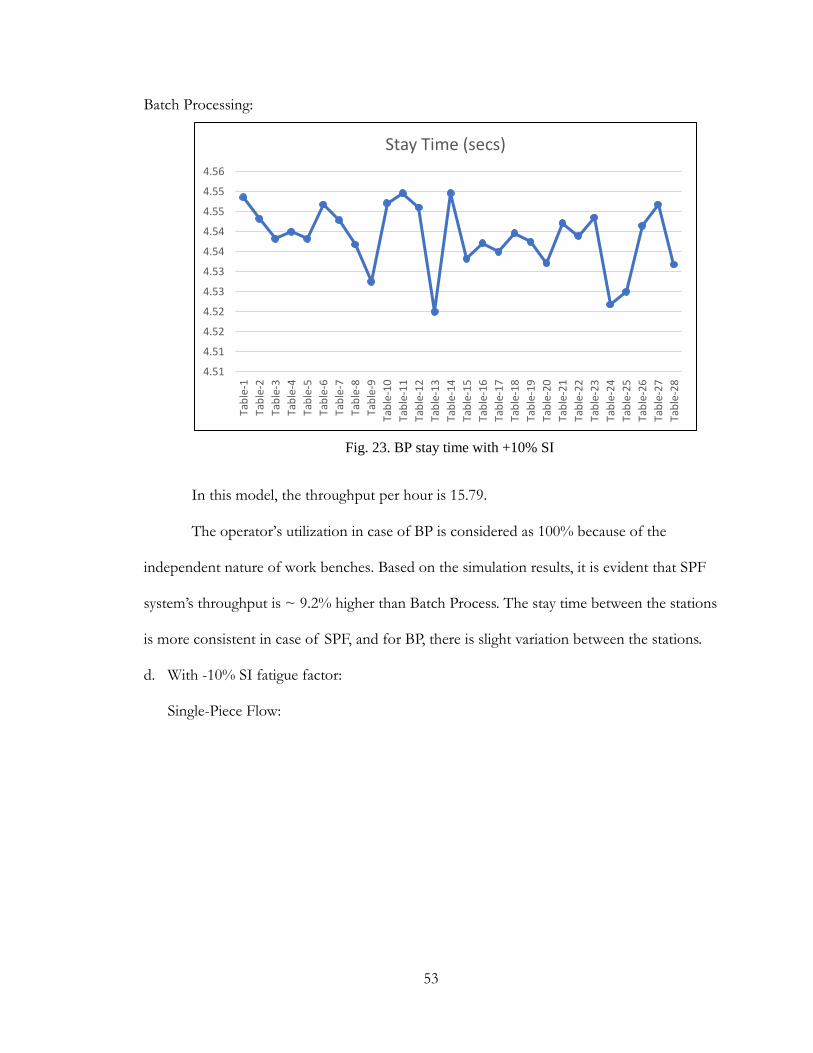
53
Batch Processing:
In this model, the throughput per hour is 15.79.
The operator’s utilization in case of BP is considered as 100% because of the
independent nature of work benches. Based on the simulation results, it is evident that SPF
system’s throughput is ~ 9.2% higher than Batch Process. The stay time between the stations
is more consistent in case of SPF, and for BP, there is slight variation between the stations.
d. With -10% SI fatigue factor:
Single-Piece Flow:
4.51
4.51
4.52
4.52
4.53
4.53
4.54
4.54
4.55
4.55
4.56
Tab
le-1
Tab
le-2
Tab
le-3
Tab
le-4
Tab
le-5
Tab
le-6
Tab
le-7
Tab
le-8
Tab
le-9
Tab
le-1
0
Tab
le-1
1
Tab
le-1
2
Tab
le-1
3
Tab
le-1
4
Tab
le-1
5
Tab
le-1
6
Tab
le-1
7
Tab
le-1
8
Tab
le-1
9
Tab
le-2
0
Tab
le-2
1
Tab
le-2
2
Tab
le-2
3
Tab
le-2
4
Tab
le-2
5
Tab
le-2
6
Tab
le-2
7
Tab
le-2
8
Stay Time (secs)
Fig. 23. BP stay time with +10% SI
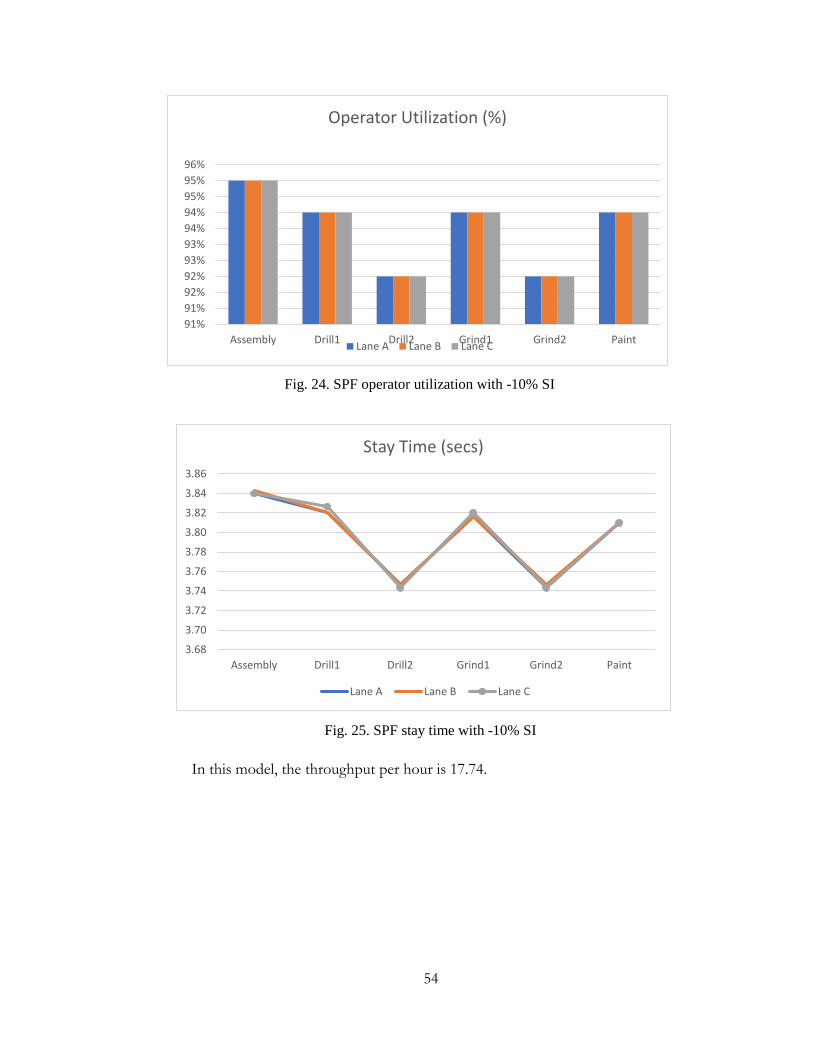
54
In this model, the throughput per hour is 17.74.
91%
91%
92%
92%
93%
93%
94%
94%
95%
95%
96%
Assembly Drill1 Drill2 Grind1 Grind2 Paint
Operator Utilization (%)
Lane A Lane B Lane C
Fig. 24. SPF operator utilization with -10% SI
3.68
3.70
3.72
3.74
3.76
3.78
3.80
3.82
3.84
3.86
Assembly Drill1 Drill2 Grind1 Grind2 Paint
Stay Time (secs)
Lane A Lane B Lane C
Fig. 25. SPF stay time with -10% SI
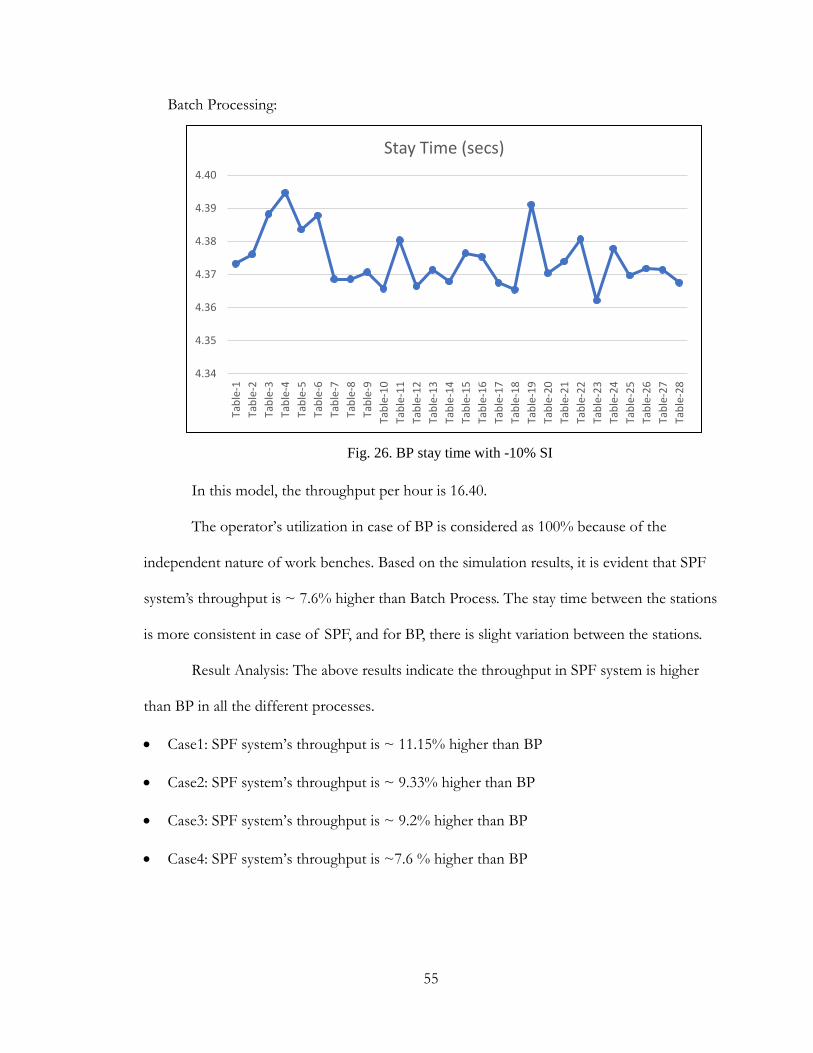
55
Batch Processing:
In this model, the throughput per hour is 16.40.
The operator’s utilization in case of BP is considered as 100% because of the
independent nature of work benches. Based on the simulation results, it is evident that SPF
system’s throughput is ~ 7.6% higher than Batch Process. The stay time between the stations
is more consistent in case of SPF, and for BP, there is slight variation between the stations.
Result Analysis: The above results indicate the throughput in SPF system is higher
than BP in all the different processes.
Case1: SPF system’s throughput is ~ 11.15% higher than BP
Case2: SPF system’s throughput is ~ 9.33% higher than BP
Case3: SPF system’s throughput is ~ 9.2% higher than BP
Case4: SPF system’s throughput is ~7.6 % higher than BP
Fig. 26. BP stay time with -10% SI
4.34
4.35
4.36
4.37
4.38
4.39
4.40
Tab
le-1
Tab
le-2
Tab
le-3
Tab
le-4
Tab
le-5
Tab
le-6
Tab
le-7
Tab
le-8
Tab
le-9
Tab
le-1
0
Tab
le-1
1
Tab
le-1
2
Tab
le-1
3
Tab
le-1
4
Tab
le-1
5
Tab
le-1
6
Tab
le-1
7
Tab
le-1
8
Tab
le-1
9
Tab
le-2
0
Tab
le-2
1
Tab
le-2
2
Tab
le-2
3
Tab
le-2
4
Tab
le-2
5
Tab
le-2
6
Tab
le-2
7
Tab
le-2
8
Stay Time (secs)
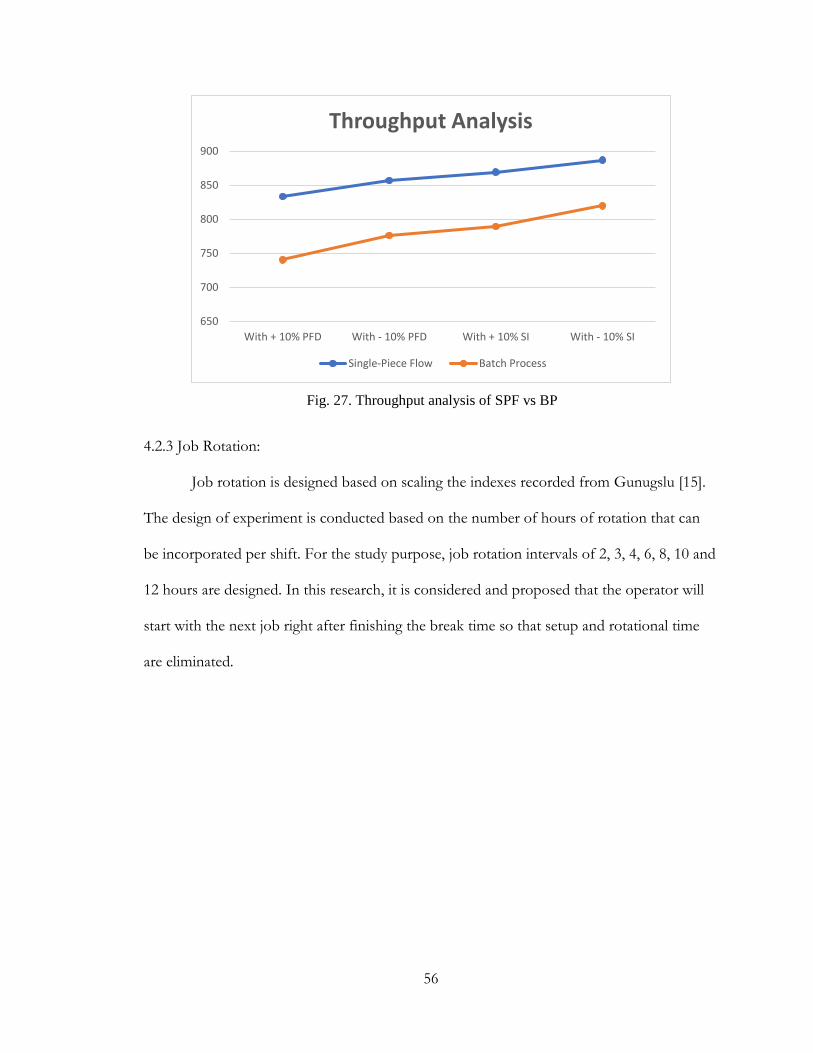
56
4.2.3 Job Rotation:
Job rotation is designed based on scaling the indexes recorded from Gunugslu [15].
The design of experiment is conducted based on the number of hours of rotation that can
be incorporated per shift. For the study purpose, job rotation intervals of 2, 3, 4, 6, 8, 10 and
12 hours are designed. In this research, it is considered and proposed that the operator will
start with the next job right after finishing the break time so that setup and rotational time
are eliminated.
650
700
750
800
850
900
With + 10% PFD With - 10% PFD With + 10% SI With - 10% SI
Throughput Analysis
Single-Piece Flow Batch Process
Fig. 27. Throughput analysis of SPF vs BP
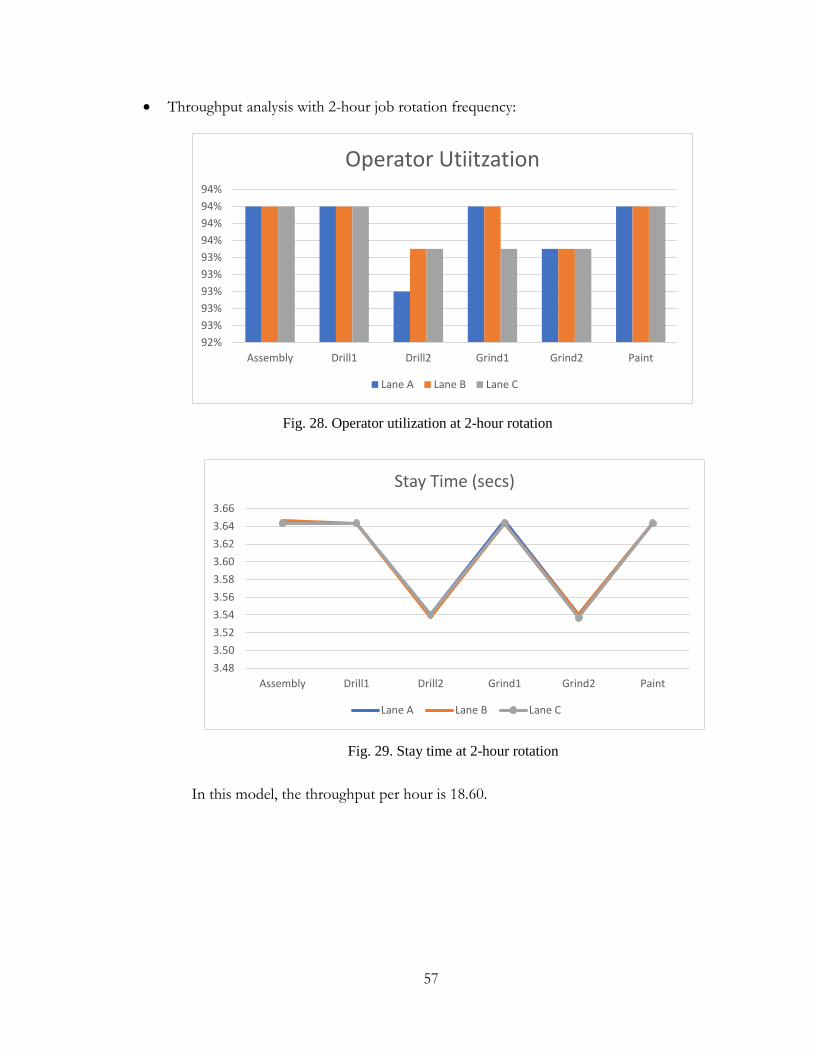
57
Throughput analysis with 2-hour job rotation frequency:
In this model, the throughput per hour is 18.60.
92%
93%
93%
93%
93%
93%
94%
94%
94%
94%
Assembly Drill1 Drill2 Grind1 Grind2 Paint
Operator Utiitzation
Lane A Lane B Lane C
3.48
3.50
3.52
3.54
3.56
3.58
3.60
3.62
3.64
3.66
Assembly Drill1 Drill2 Grind1 Grind2 Paint
Stay Time (secs)
Lane A Lane B Lane C
Fig. 28. Operator utilization at 2-hour rotation
Fig. 29. Stay time at 2-hour rotation

58
Throughput analysis with 3-hour job rotation frequency:
In this model, the throughput per hour is 18.16.
92%
93%
93%
93%
93%
93%
94%
94%
94%
94%
Assembly Drill1 Drill2 Grind1 Grind2 Paint
Operator Utiitzation
Lane A Lane B Lane C
3.56
3.58
3.60
3.62
3.64
3.66
3.68
3.70
3.72
3.74
3.76
Assembly Drill1 Drill2 Grind1 Grind2 Paint
Stay Time (secs)
Lane A Lane B Lane C
Fig. 30. Operator utilization at 3-hour rotation
Fig. 31. Stay time at 3-hour rotation
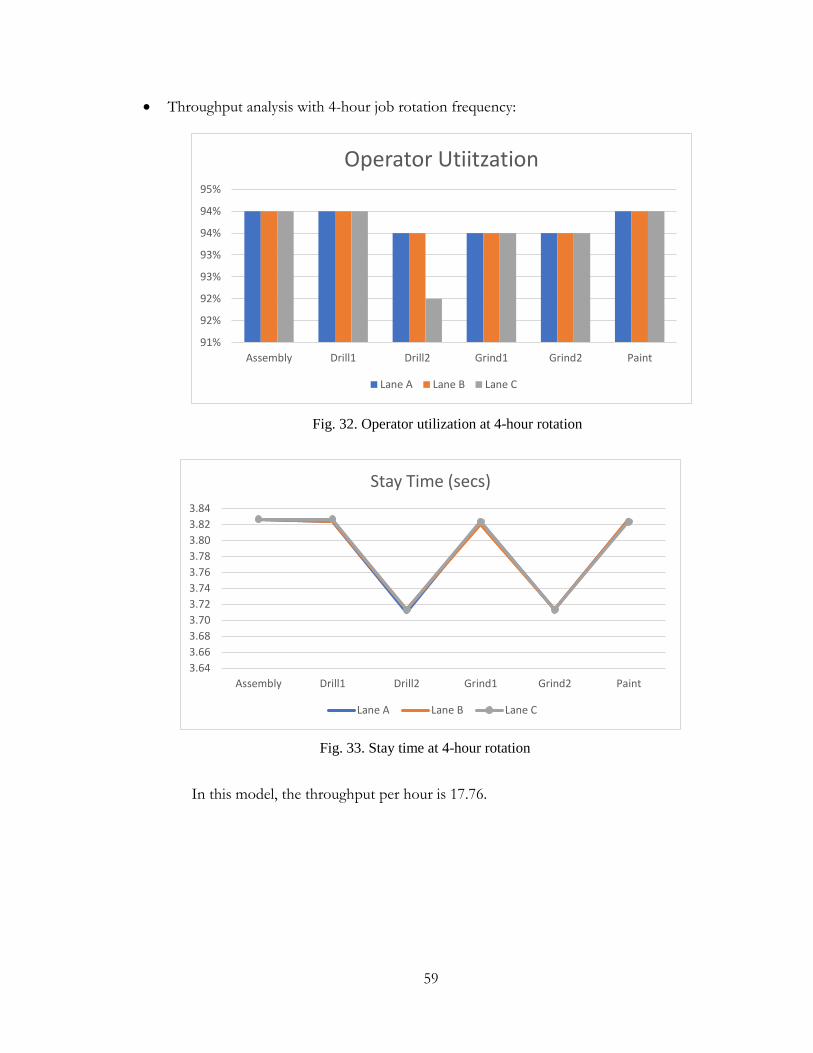
59
Throughput analysis with 4-hour job rotation frequency:
In this model, the throughput per hour is 17.76.
91%
92%
92%
93%
93%
94%
94%
95%
Assembly Drill1 Drill2 Grind1 Grind2 Paint
Operator Utiitzation
Lane A Lane B Lane C
3.64
3.66
3.68
3.70
3.72
3.74
3.76
3.78
3.80
3.82
3.84
Assembly Drill1 Drill2 Grind1 Grind2 Paint
Stay Time (secs)
Lane A Lane B Lane C
Fig. 32. Operator utilization at 4-hour rotation
Fig. 33. Stay time at 4-hour rotation
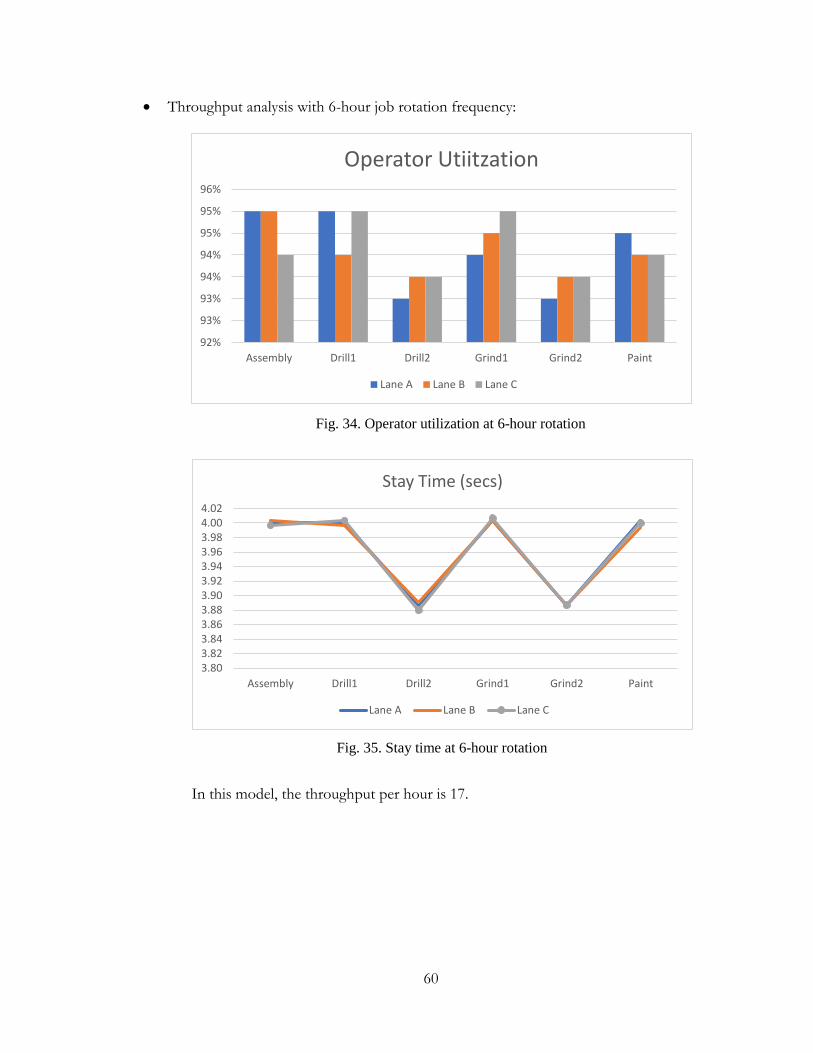
60
Throughput analysis with 6-hour job rotation frequency:
In this model, the throughput per hour is 17.
92%
93%
93%
94%
94%
95%
95%
96%
Assembly Drill1 Drill2 Grind1 Grind2 Paint
Operator Utiitzation
Lane A Lane B Lane C
3.803.823.843.863.883.903.923.943.963.984.004.02
Assembly Drill1 Drill2 Grind1 Grind2 Paint
Stay Time (secs)
Lane A Lane B Lane C
Fig. 34. Operator utilization at 6-hour rotation
Fig. 35. Stay time at 6-hour rotation
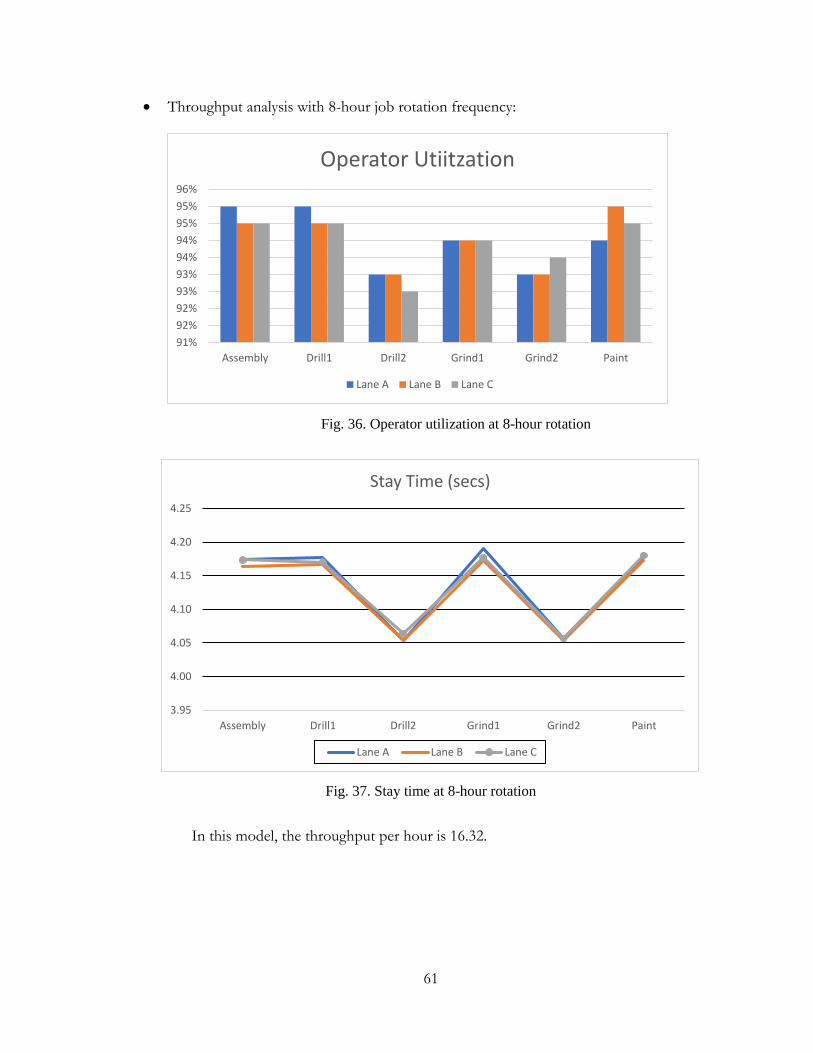
61
Throughput analysis with 8-hour job rotation frequency:
In this model, the throughput per hour is 16.32.
91%
92%
92%
93%
93%
94%
94%
95%
95%
96%
Assembly Drill1 Drill2 Grind1 Grind2 Paint
Operator Utiitzation
Lane A Lane B Lane C
3.95
4.00
4.05
4.10
4.15
4.20
4.25
Assembly Drill1 Drill2 Grind1 Grind2 Paint
Stay Time (secs)
Lane A Lane B Lane C
Fig. 36. Operator utilization at 8-hour rotation
Fig. 37. Stay time at 8-hour rotation
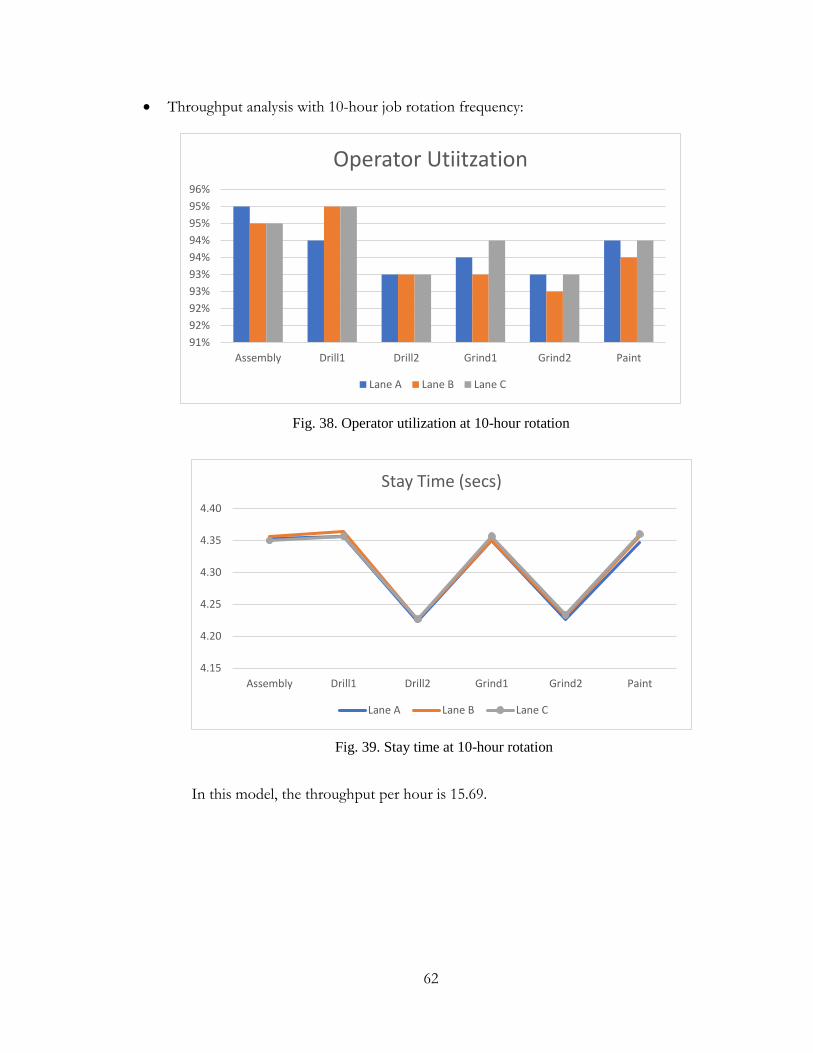
62
Throughput analysis with 10-hour job rotation frequency:
In this model, the throughput per hour is 15.69.
91%
92%
92%
93%
93%
94%
94%
95%
95%
96%
Assembly Drill1 Drill2 Grind1 Grind2 Paint
Operator Utiitzation
Lane A Lane B Lane C
4.15
4.20
4.25
4.30
4.35
4.40
Assembly Drill1 Drill2 Grind1 Grind2 Paint
Stay Time (secs)
Lane A Lane B Lane C
Fig. 38. Operator utilization at 10-hour rotation
Fig. 39. Stay time at 10-hour rotation

63
Throughput analysis with 12-hour job rotation frequency:
In this model, the throughput per hour is 15.09.
Job rotation is one of the preferred ways to avoid MSDs. In this analysis, we studied
the different job rotation frequencies against throughput. Higher the frequency of rotation,
less is the fatigue factor, but throughput reduces proportionally. As the job rotation involves
91%
91%
92%
92%
93%
93%
94%
94%
95%
95%
96%
Assembly Drill1 Drill2 Grind1 Grind2 Paint
Operator Utiitzation
Lane A Lane B Lane C
4.30
4.35
4.40
4.45
4.50
4.55
4.60
Assembly Drill1 Drill2 Grind1 Grind2 Paint
Stay Time (secs)
Lane A Lane B Lane C
Fig. 40. Operator utilization at 12-hour rotation
Fig. 41. Stay time at 12-hour rotation
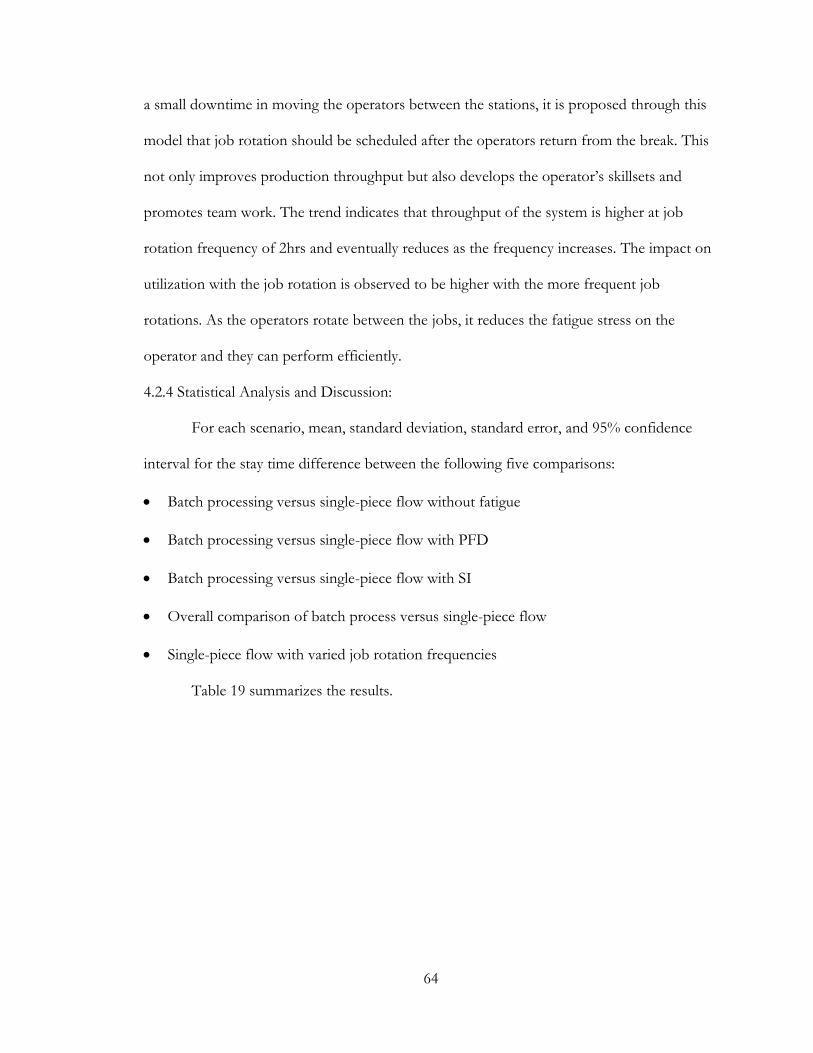
64
a small downtime in moving the operators between the stations, it is proposed through this
model that job rotation should be scheduled after the operators return from the break. This
not only improves production throughput but also develops the operator’s skillsets and
promotes team work. The trend indicates that throughput of the system is higher at job
rotation frequency of 2hrs and eventually reduces as the frequency increases. The impact on
utilization with the job rotation is observed to be higher with the more frequent job
rotations. As the operators rotate between the jobs, it reduces the fatigue stress on the
operator and they can perform efficiently.
4.2.4 Statistical Analysis and Discussion:
For each scenario, mean, standard deviation, standard error, and 95% confidence
interval for the stay time difference between the following five comparisons:
Batch processing versus single-piece flow without fatigue
Batch processing versus single-piece flow with PFD
Batch processing versus single-piece flow with SI
Overall comparison of batch process versus single-piece flow
Single-piece flow with varied job rotation frequencies
Table 19 summarizes the results.
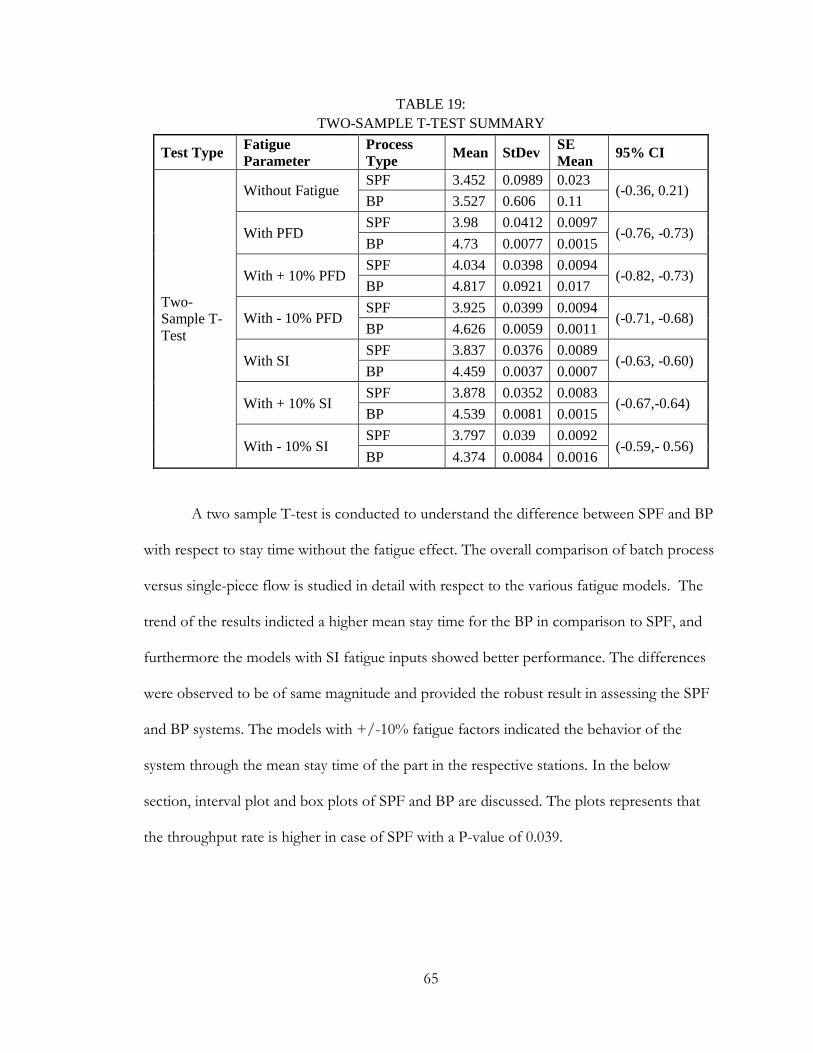
65
TABLE 19:
TWO-SAMPLE T-TEST SUMMARY
Test Type Fatigue
Parameter
Process
Type Mean StDev
SE
Mean 95% CI
Two-
Sample T-
Test
Without Fatigue SPF 3.452 0.0989 0.023
(-0.36, 0.21) BP 3.527 0.606 0.11
With PFD SPF 3.98 0.0412 0.0097
(-0.76, -0.73) BP 4.73 0.0077 0.0015
With + 10% PFD SPF 4.034 0.0398 0.0094
(-0.82, -0.73) BP 4.817 0.0921 0.017
With - 10% PFD SPF 3.925 0.0399 0.0094
(-0.71, -0.68) BP 4.626 0.0059 0.0011
With SI SPF 3.837 0.0376 0.0089
(-0.63, -0.60) BP 4.459 0.0037 0.0007
With + 10% SI SPF 3.878 0.0352 0.0083
(-0.67,-0.64) BP 4.539 0.0081 0.0015
With - 10% SI SPF 3.797 0.039 0.0092
(-0.59,- 0.56) BP 4.374 0.0084 0.0016
A two sample T-test is conducted to understand the difference between SPF and BP
with respect to stay time without the fatigue effect. The overall comparison of batch process
versus single-piece flow is studied in detail with respect to the various fatigue models. The
trend of the results indicted a higher mean stay time for the BP in comparison to SPF, and
furthermore the models with SI fatigue inputs showed better performance. The differences
were observed to be of same magnitude and provided the robust result in assessing the SPF
and BP systems. The models with +/-10% fatigue factors indicated the behavior of the
system through the mean stay time of the part in the respective stations. In the below
section, interval plot and box plots of SPF and BP are discussed. The plots represents that
the throughput rate is higher in case of SPF with a P-value of 0.039.
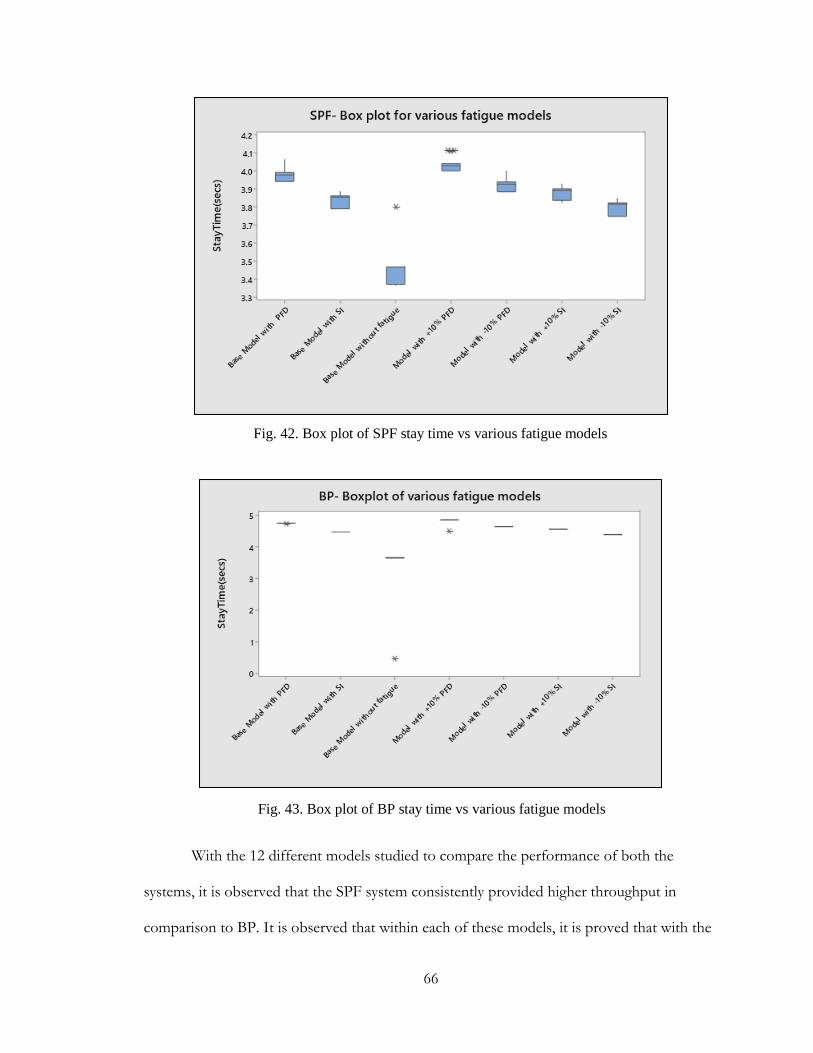
66
With the 12 different models studied to compare the performance of both the
systems, it is observed that the SPF system consistently provided higher throughput in
comparison to BP. It is observed that within each of these models, it is proved that with the
Fig. 42. Box plot of SPF stay time vs various fatigue models
Fig. 43. Box plot of BP stay time vs various fatigue models
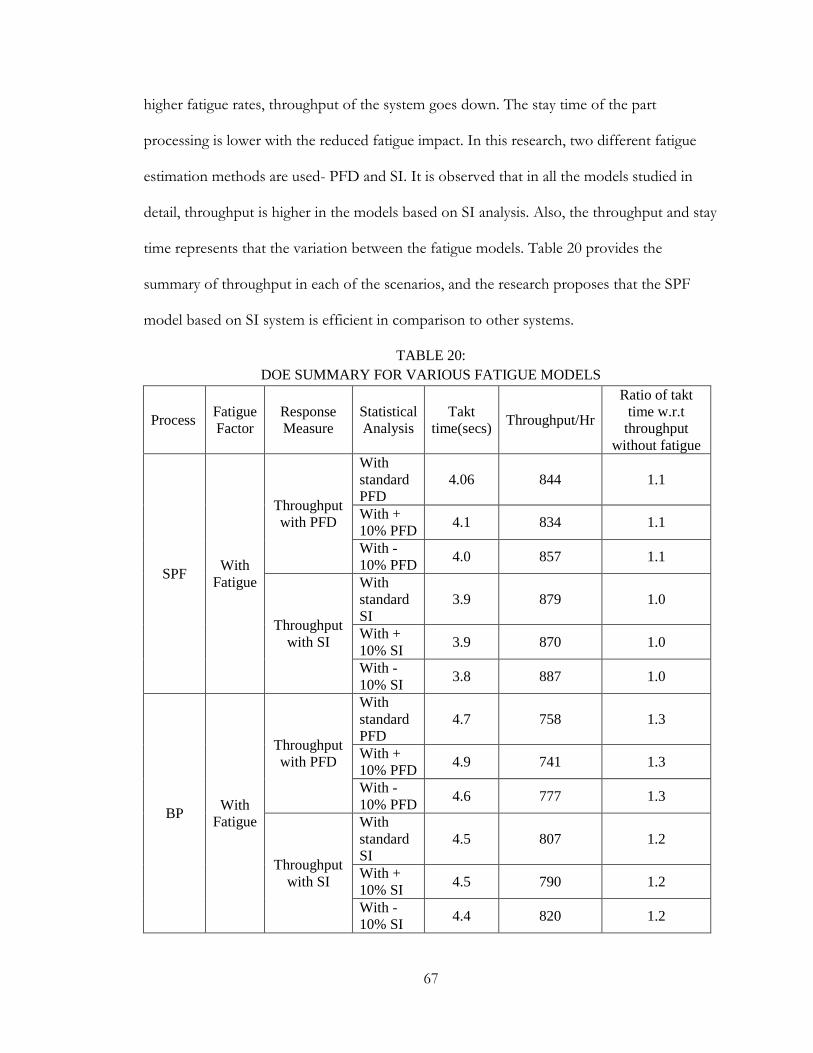
67
higher fatigue rates, throughput of the system goes down. The stay time of the part
processing is lower with the reduced fatigue impact. In this research, two different fatigue
estimation methods are used- PFD and SI. It is observed that in all the models studied in
detail, throughput is higher in the models based on SI analysis. Also, the throughput and stay
time represents that the variation between the fatigue models. Table 20 provides the
summary of throughput in each of the scenarios, and the research proposes that the SPF
model based on SI system is efficient in comparison to other systems.
TABLE 20:
DOE SUMMARY FOR VARIOUS FATIGUE MODELS
Process Fatigue
Factor
Response
Measure
Statistical
Analysis
Takt
time(secs) Throughput/Hr
Ratio of takt
time w.r.t
throughput
without fatigue
SPF With
Fatigue
Throughput
with PFD
With
standard
PFD
4.06 844 1.1
With +
10% PFD 4.1 834 1.1
With -
10% PFD 4.0 857 1.1
Throughput
with SI
With
standard
SI
3.9 879 1.0
With +
10% SI 3.9 870 1.0
With -
10% SI 3.8 887 1.0
BP With
Fatigue
Throughput
with PFD
With
standard
PFD
4.7 758 1.3
With +
10% PFD 4.9 741 1.3
With -
10% PFD 4.6 777 1.3
Throughput
with SI
With
standard
SI
4.5 807 1.2
With +
10% SI 4.5 790 1.2
With -
10% SI 4.4 820 1.2
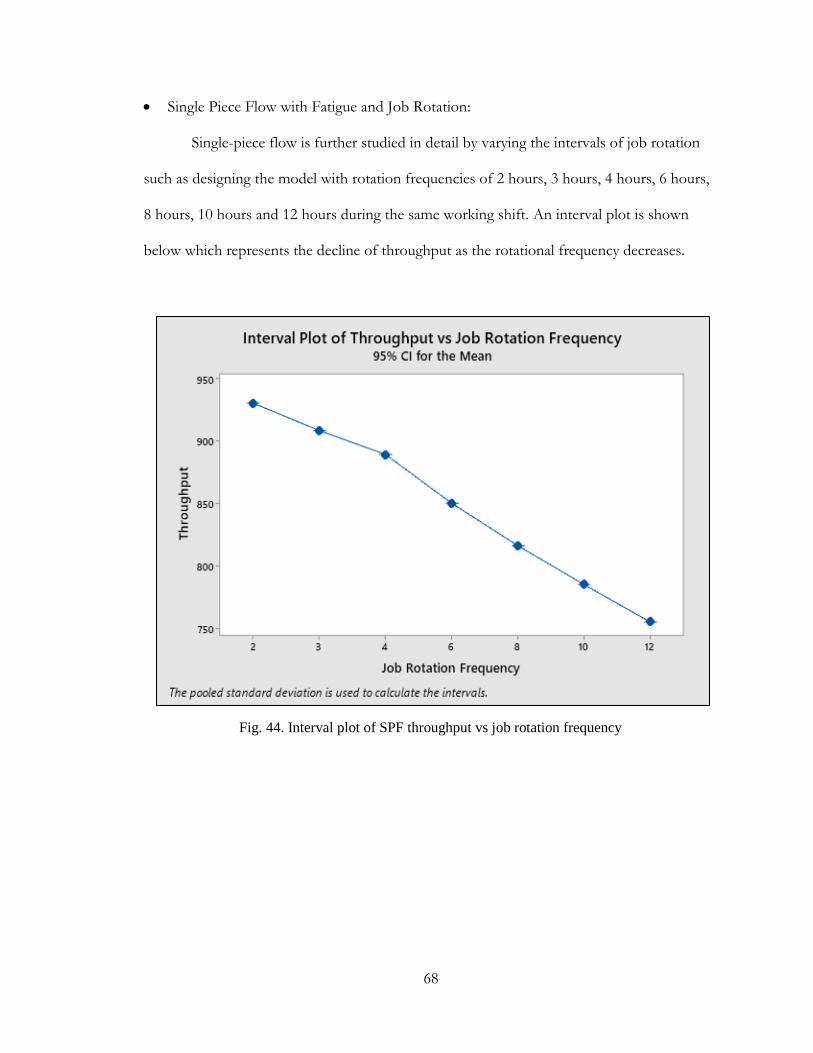
68
Single Piece Flow with Fatigue and Job Rotation:
Single-piece flow is further studied in detail by varying the intervals of job rotation
such as designing the model with rotation frequencies of 2 hours, 3 hours, 4 hours, 6 hours,
8 hours, 10 hours and 12 hours during the same working shift. An interval plot is shown
below which represents the decline of throughput as the rotational frequency decreases.
Fig. 44. Interval plot of SPF throughput vs job rotation frequency
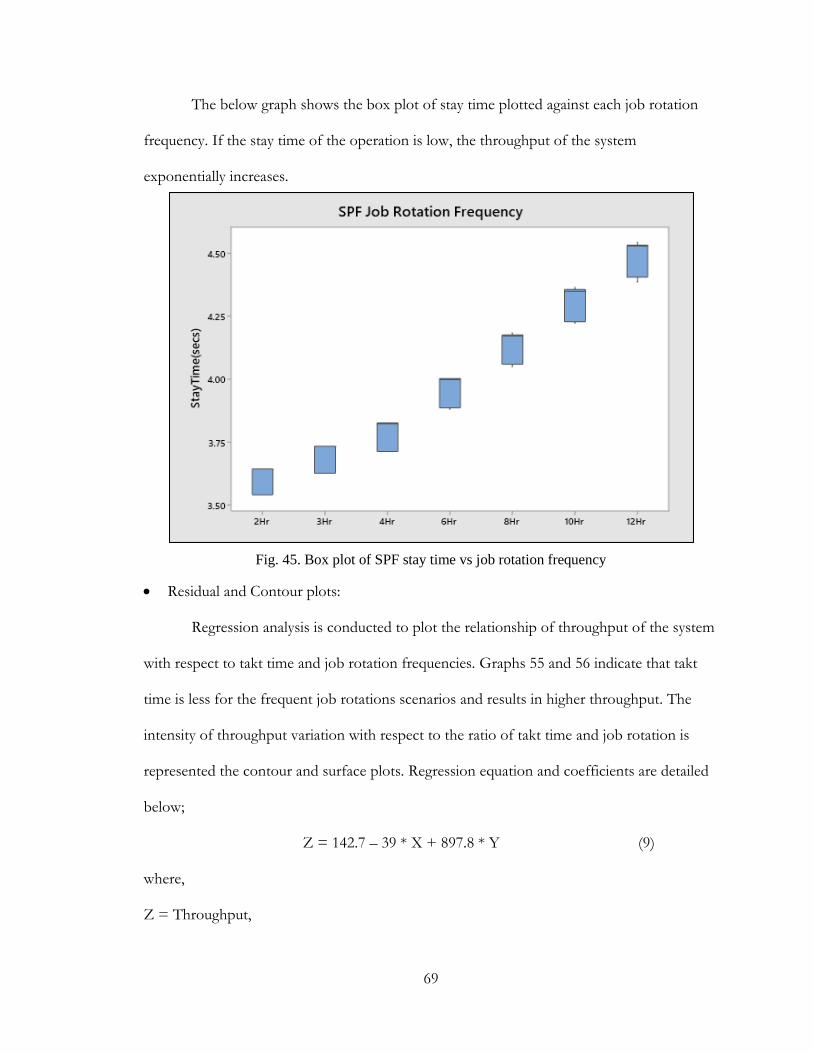
69
The below graph shows the box plot of stay time plotted against each job rotation
frequency. If the stay time of the operation is low, the throughput of the system
exponentially increases.
Residual and Contour plots:
Regression analysis is conducted to plot the relationship of throughput of the system
with respect to takt time and job rotation frequencies. Graphs 55 and 56 indicate that takt
time is less for the frequent job rotations scenarios and results in higher throughput. The
intensity of throughput variation with respect to the ratio of takt time and job rotation is
represented the contour and surface plots. Regression equation and coefficients are detailed
below;
Z = 142.7 – 39 * X + 897.8 * Y (9)
where,
Z = Throughput,
Fig. 45. Box plot of SPF stay time vs job rotation frequency
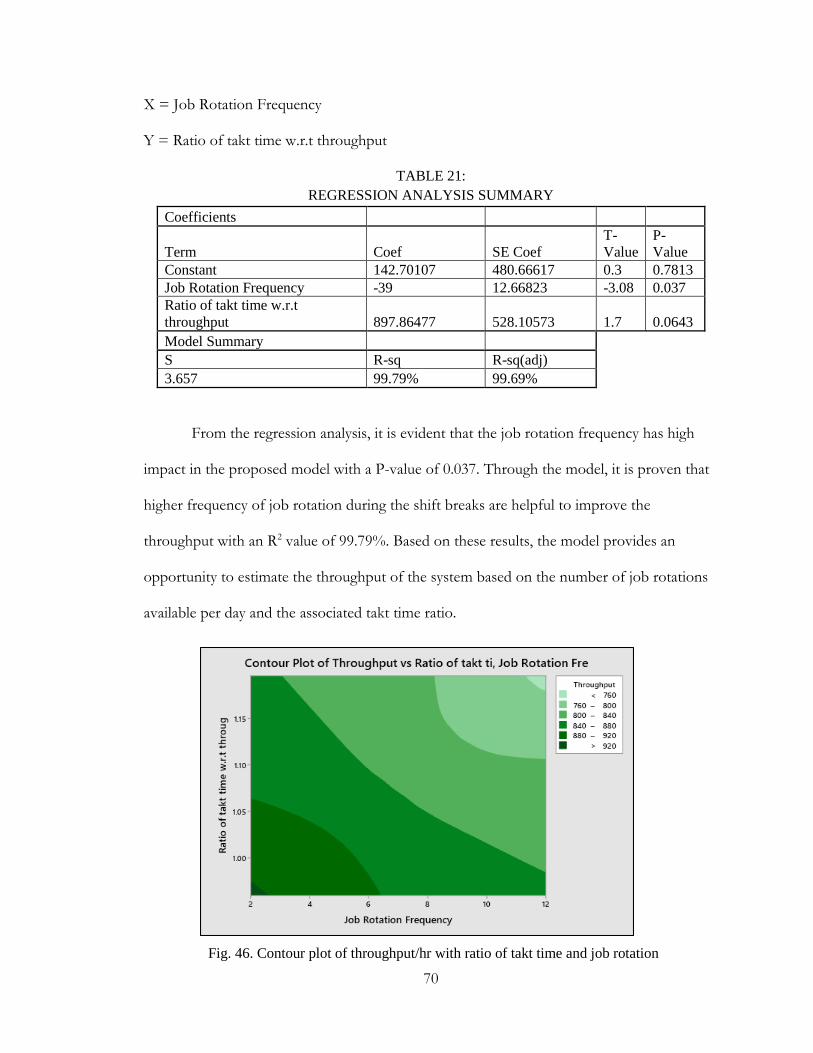
70
X = Job Rotation Frequency
Y = Ratio of takt time w.r.t throughput
TABLE 21:
REGRESSION ANALYSIS SUMMARY
Coefficients
Term Coef SE Coef
T-
Value
P-
Value
Constant 142.70107 480.66617 0.3 0.7813
Job Rotation Frequency -39 12.66823 -3.08 0.037
Ratio of takt time w.r.t
throughput 897.86477 528.10573 1.7 0.0643
Model Summary S R-sq R-sq(adj)
3.657 99.79% 99.69%
From the regression analysis, it is evident that the job rotation frequency has high
impact in the proposed model with a P-value of 0.037. Through the model, it is proven that
higher frequency of job rotation during the shift breaks are helpful to improve the
throughput with an R2 value of 99.79%. Based on these results, the model provides an
opportunity to estimate the throughput of the system based on the number of job rotations
available per day and the associated takt time ratio.
Fig. 46. Contour plot of throughput/hr with ratio of takt time and job rotation
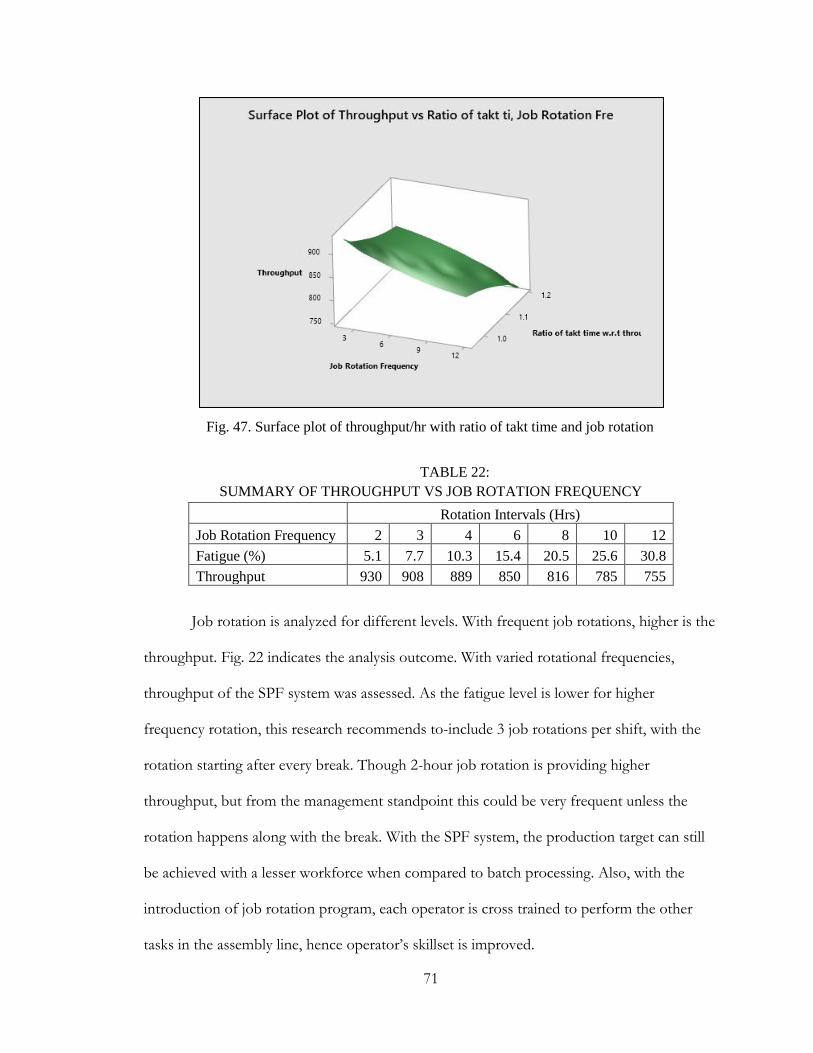
71
TABLE 22:
SUMMARY OF THROUGHPUT VS JOB ROTATION FREQUENCY
Rotation Intervals (Hrs)
Job Rotation Frequency 2 3 4 6 8 10 12
Fatigue (%) 5.1 7.7 10.3 15.4 20.5 25.6 30.8
Throughput 930 908 889 850 816 785 755
Job rotation is analyzed for different levels. With frequent job rotations, higher is the
throughput. Fig. 22 indicates the analysis outcome. With varied rotational frequencies,
throughput of the SPF system was assessed. As the fatigue level is lower for higher
frequency rotation, this research recommends to-include 3 job rotations per shift, with the
rotation starting after every break. Though 2-hour job rotation is providing higher
throughput, but from the management standpoint this could be very frequent unless the
rotation happens along with the break. With the SPF system, the production target can still
be achieved with a lesser workforce when compared to batch processing. Also, with the
introduction of job rotation program, each operator is cross trained to perform the other
tasks in the assembly line, hence operator’s skillset is improved.
Fig. 47. Surface plot of throughput/hr with ratio of takt time and job rotation
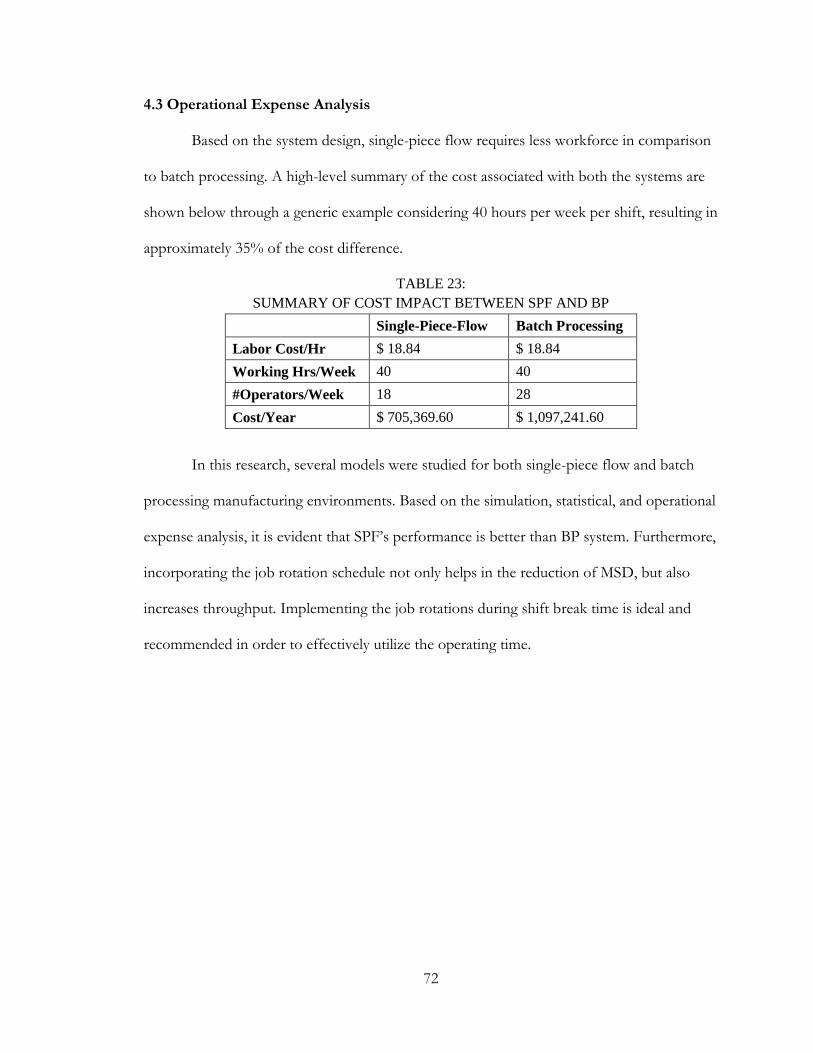
72
4.3 Operational Expense Analysis
Based on the system design, single-piece flow requires less workforce in comparison
to batch processing. A high-level summary of the cost associated with both the systems are
shown below through a generic example considering 40 hours per week per shift, resulting in
approximately 35% of the cost difference.
TABLE 23:
SUMMARY OF COST IMPACT BETWEEN SPF AND BP
Single-Piece-Flow Batch Processing
Labor Cost/Hr $ 18.84 $ 18.84
Working Hrs/Week 40 40
#Operators/Week 18 28
Cost/Year $ 705,369.60 $ 1,097,241.60
In this research, several models were studied for both single-piece flow and batch
processing manufacturing environments. Based on the simulation, statistical, and operational
expense analysis, it is evident that SPF’s performance is better than BP system. Furthermore,
incorporating the job rotation schedule not only helps in the reduction of MSD, but also
increases throughput. Implementing the job rotations during shift break time is ideal and
recommended in order to effectively utilize the operating time.
73
5. CONCLUSION AND FUTURE RESEARCH
5.1 Conclusion
As defined in the objective section 1.2, this research provides a comparison of batch
processing and single-piece flow based on fatigue and job rotation factors. Using Basic
MOST technique, normal times are estimated within which an operator has to perform the
job, and FlexSim software is used to build and assess the model. Various fatigue factors are
discussed and analyzed as a response measure. Environments of both the SPF and BP
models are kept the same expect the cycle time and associated fatigue factors for each type
of operation. The number of stations and operators were carefully calculated, and using PFD
and SI indexes, fatigue is measured for each operator performing different operations.
Normal distribution of the cycle time is considered in the study to simulate the actual
working environments. In SPF, as the takt time is lower compared to the BP, the throughput
of the system is higher, and also the job is divided into small tasks with a properly balanced
cycle time for each station with the main lines leading to less fatigue accumulation on the
operator. In the case of batch processing, the same operator has to perform all the tasks
from start to end, and hence fatigue accumulation is high, and the performance factor is
affected.
Based on the results of the experimentation, SPF has better performance compared
to BP. Further analysis of SPF was carried out to introduce the job-rotation factor in the
process. Job rotation elements are referred from the literature and based on the number of
observations for avoidable delays, the factors are scaled-down appropriately to fit into the
SPF regression model. In this research, it is emphasized that the job rotation schedules are
introduced in such a way that the job change happens when the operator comes back from
the breaks. High-frequency job rotation schedules may not be efficient from the production
74
standpoint, as it consumes the rotation or setup times out of production hours. Very less
frequent rotation can result in MSD concerns. Hence this research proposes to have a 3-
hour job rotation that matches 2 short breaks and 1 meal break per shift. This research
recommends adopting single-piece flow with 3-hour job rotation per shift.
5.2 Future Direction
Due to limited time, this research focused on comparing the batch and single-piece
flow manufacturing systems based on fatigue and job rotation techniques. The future
research can be focused on analyzing the various other factors affecting job rotation. This
can include opertor’s job satisfaction based on the job type such as operator prefers a
different role whereas he is enforced to follow another work. The impact of different break
time schedules for the operator on the throughput can be assessed to understand if there is
an opportunity to improve productivity: this can be varying the number of breaks per shift,
to varying the break duration. Another interesting factor to measure would be voice of
opeators in assessing the skillset gain through job rotation in single-piece flow versus the
same job throughout the shift in batch processing.
The implemention of this new methodology of designing the single-piece flow into a
real case study is beneficial. The future study can also compare the different fatigue
estimation methods. Also, the study can be further taken into consideration to quantify the
quality related issues in job rotation in single-piece flow environment, as well as in batch
production. In addition, the future study should focus on the link between the injury rate of
batch and single-piece flow, and furthermore extending the same analysis on to various job
rotation frequencies. This study can be further taken to assess the economic impact of
injuries and opertor’s error.
75
REFERENCES
[1] G. Mossa, F. Boenzi, S. Digiesi, G. Mummolo, V. Romano, "Productivity and ergonomic risk in human-based production systems: A job-rotation scheduling model," Int. J. Production Economics, vol. 171, pp. 471-477, 2016.
[2] S.G. Li, Y. Rong, "The reliable design of one-piece flow production system using fuzzy ant colony optimization," Computers & Operations Research, vol. 36, pp. 1656- 1663, 2009.
[3] C. A. M. Norzaimi, "The effectiveness and impacts of one piece flow manufacturing technique into manufacturing industries," International Conference on Engineering and ICT, pp. 1-6, 2012.
[4] G. Michalos, G. Chryssolouris, S. Makris, "The effect of job rotation during assembly on the quality of final product," CIRP Journal of Manufacturing Science and Technology, vol. 6, pp. 187-197, 2013.
[5] Z. G. D. Santos, L. Vieira, G. Balbinotti, "Lean Manufacturing and ergonomic working conditions in the automotive industry," 6th International Conference on Applied Human Factors and Ergonomics (AHFE 2015) and the Affiliated Conferences, AHFE 2015, pp. 5947-5954, 2015.
[6] T. A. Saurin, C. F. Ferreira, "The impacts of lean production on working conditions: A case study of a harvester assembly line in Brazil," International Journal of Industrial Ergonomics, vol. 39, pp. 403-412, 2009.
[7] L. Botti, C. Mora. A. Regattieri, "Integrating ergonomics and lean manufacturing principles in a hybrid assembly line," Computers and Industrial Engineering, pp. 481-491, 2017.
[8] J. BLACK, "Design rules for implementing the Toyota Production System," International Journal of Production Research, vol. 45, pp. 3639-3664, 2007.
[9] R. S. Padula, M. L. C. Comper, E. H. Sparer. J. T. Dennerlein, "Job rotation designed to prevent musculoskeletal disorders and control risk in manufacturing industries: A systematic review," Applied Ergonomics, vol. 58, pp. 386-397, 2017.
[10] M. Yung, "Fatigue at the Workplace: Measurement and Temporal Development," Waterloo, Canada, 2016.
[11] A. Garg, J. S. Moore, "The strain index: A proposed method to analyze jobs for risk of distal upper extremity disorders," AM. IND. HYG. ASSOC, vol. 56, p. 443=458, 1995.
76
[12] A. Otto, O. Battaia, "Reducing physical ergonomic risks at assembly lines by line balancing and job rotation: A survey," Computers & Industrial Engineering, vol. 111, pp. 467-480, 2017.
[13] G. Michalos, G. Chryssolouris, S. Makris, "Dynamic job rotation for workload balancing in human based assembly system," CIRP Journal of Manufacturing Science and Technology, vol. 2, pp. 153-160, 2010.
[14] Z. S. Mamana, M. A. Y. L. Alamdar, Cavuoto, M. Megahad, "A data-driven approach to modeling physical fatigue in the workplace using wearable sensors," Applied Ergonomics, vol. 65, pp. 515-529, 2016.
[15] S. Gunesoglu, B. M. Kaplangiray, "The analysis of personal and delay allowances using work sampling technique in the sewing room of a clothing manufacturer," International Journal of Clothing Science and Technology, pp. 145-150, 2007.
[16] N. Alomoto, G. Paletta, E. Perez, A. J. Ruiz-Torresa, "Scheduling to maximise worker satisfaction and on-time orders," International Journal of Production Research, vol. 53, no. 9, p. 2836–2852, 2015.
[17] S. Asensio-Cuesta, J. A. Diego-Mas, L. Canós-Darós, "A genetic algorithm for the design of job rotation schedules considering ergonomic and competence criteria," International Journal of Advanced Manufacturing Technology, vol. 60, pp. 1161-1174, 2012.
[18] S. Asensio-Cuestaa, J.A. Diego-Masa, L.V. Cremades-Oliverb, M.C. Gonza´ lez-Cruza, "A method to design job rotation schedules to prevent work-related musculoskeletal disorders in repetitive work," International Journal of Production Research, vol. 50, pp. 7467-7478, 2012.
[19] N Azizi, M. Liang, "An integrated approach to worker assignment, workforce flexibility acquisition, and task rotation," The Journal of the Operational Research Society, vol. 64, no. 2, pp. 260-275, 2013.
[20] B. A. Norman, W. Tharmmaphornphilas, "A methodology to create robust job rotation schedules," Annual Operations Research, pp. 339-360, 2007.
[21] K. B. Zandin, MOST work measurement systems, New York City: Marcel Dekker, 2003.
[22] C.F. Oduza, "Lean thinking constraints in traditional batch manufacturing environments," Advances in Production Engineering and Management, vol. 3, pp. 181-192, 2008.
[23] M. Dotoli, N. Epicoco, M. Falagario, N. Costantino, "An integrated approach for warehouse analysis and optimization: A case study," Computers in Industry, pp. 56-69, 2015.
77
[24] A.B. Ganorkar, R. R. Lakhe, K. N. Agrawal, "Methodology for application of Maynard Operation Sequence Technique (MOST) for time-driven activity-based costing (TDABC)," International Journal of Productivity and Performance Management, vol. 68, 2018.
[25] D. Battini, C. H. Glock, E. H. Grosse, A. Persona, F. Sgarbossa, "Human energy expernditure in order picking storage assignment: A bi-objective method," Computers & Industrial Engineering, vol. 94, pp. 147-157, 2016.
[26] J. Rajgopal, F. A. Abdulmalek, "Analyzing the benefits of lean manufacturing and value streammapping via simulation: A process sector case study," International Journal of Production Economics, vol. 107, pp. 223-236, 2006.
[27] S.I. Satoglu, M. B. Durmusoglu,T. Ertay, "A mathematical model and a heuristic approach for design of the hybrid manufacturing systems to facilitate one-piece flow," International Journal of Production Research, vol. 48, pp. 5195-5220, 2010.
[28] M. Pearce, B. Mutlu, J. Shah, R. Radwin, "Optimizing Makespan and Ergonomics in Integrating Collaborative Robots Into Manufacturing Processes," Ieee Transactions on Automation Science and Engineering, vol. 15, pp. 1772-1784, 2018.
[29] J. S. Moore, G. A. Vos, J. P. Stephens, E. M. Stevens Jr, "Inter-Rater Reliability of the Strain Index," Journal of Occupational and Environmental Hygiene, pp. 745-751, 2004.
[30] B. W. Neibel, Motion and time study, Richard d Irwin, 1992.
[31] R. G. Radwin, M. N. Lin, T. Y. Yen, "Rapid Communication. Exposure assessment of biomechanical stress in repetitive manual work using frequency-weighted filters," Ergonomics, vol. 37, no. 12, pp. 1984-1998, 2007.
[32] C. B. Brown, T. R. Collins, E. L. McCombs, "Tranformation From Batch to Lean Manufacturing: The Performance Issues," Engineering Management Journal, vol. 18, pp. 1-13, 2006.
[33] A. Yazdani, R. Wells, "Barriers for implementation of successful chnage to prevent musculoskeletal disorders and how to systematically address them," Applied Ergonomics, vol. 73, pp. 122-140, 2018.
[34] R. Paulsen, T. Gallu, D. Gileky, R. Reiser, L. Murgia, J. Rosecrance, "The inter-rater reliability of Strain Index and OCRA Checklist task assessments in cheese processing," Applied Ergonomics, vol. 51, pp. 199-204, 2015.
[35] K. Eliasson, P. Palm, T. Nyman, M. Forsman, "Inter- and intra- observer reliability of risk assessment of repetitive work without an explicit method," Applied Ergonomics, vol. 62, pp. 1-8, 2017.
78
[36] S. A. Ferguson, D. Dawson, "12-h or 8-h shifts? It depends," Sleep Medicine Reviews, vol. 16, pp. 519-528, 2012.
[37] S. E. Wands, "validation of the strain index in a window manufacttjring facility," 2001.
[38] L. Smith, S. Folkard, P. Tucker, I. Macdonald, "Work shift duration: a review comparing eight hour and 12 hour shift systems," Occupational Environment Med, vol. 55, pp. 217-229, 1998.
[39] P.S. Tiwari, L. Gite, "Evaluation of work-rest schedules during operation of a rotary power tiller," International Journal of Industrial Ergonomics, vol. 36, pp. 203-210, 2006.
[40] A. Persona, C. H. Glock, E. H. Grosse, F. Sgarbossa, D. Battini, "Ergo-lot-sizing: An approach to integrate ergonomic and economic objectives in manual materials handling," Int. J. Production Economics, vol. 185, pp. 230-239, 2017.