Embed Size (px)
Citation preview

1
The Effect of Investor Origin on Firm Performance: Domestic and Foreign Direct Investment in
the United States*
Wenjie Chen†
George Washington University 2201 G St, NW
Washington, D.C. 20052 Tel.: 1-202-994-3275, [email protected]
November 3, 2010
Abstract
This paper evaluates the causal relationship between the source of origin of FDI and the performance of the target firm. The empirical analysis uses new data on a comprehensive sample of public U.S. firms that
received FDI between 1979 − 2006. To account for the possibility that performance differences arise due to the selection of superior target firm rather than the change in ownership, I use propensity score matching to create similar comparison groups of target firms prior to acquisitions. The analysis reveals three major findings. First, acquiring firms from industrialized countries lead to labor productivity increases of 13% in the target firm three years after the acquisition compared to targets acquired by domestic firms. Firms that received developing country firm acquisitions, on the other hand, exhibit lower labor productivity gains four years after acquisition, compared to targets acquired by domestic firms. Second, targets receiving FDI by firms from industrial and developing countries also experience increases in profits, compared with firms receiving acquisition by domestic firms from the United States. Third, compared with domestic acquisitions, foreign industrial firm acquisition FDI tends to increase their targets' employment and sales, whereas targets acquired by firms located in developing countries experience a decrease in both revenues and total number of employees. These findings suggest that target firms are subject to significantly different restructuring processes depending on the origin of the acquiring firm. Key words: Foreign direct investment, acquisitions, firm performance, capital flows, emerging markets JEL Classification: F23, D24, O33
* The previous circulation was under the title:"Does the Country of Origin of FDI Impact Firm Performance?"
† Assistant Professor, International Business Department, George Washington University, School of Business. This
paper is the first chapter of my dissertation while at the University of Michigan. I would like to thank Kathryn Dominguez, Paolo Pasquariello, Jeff Smith, and Linda Tesar for their guidance and support. Conversations with and comments from Raj Arunachalam, Rüdiger Bachmann, Anusha Chari, Taryn Dinkelman, Osborne Jackson, Andrei Levchenko, David Lam, Stephan Lindner, Francesc Ortega, Neviana Petkova, and Jing Zhang improved the paper. I also thank seminar participants at the University of Michigan, IMF Research Department, College of Holy Cross, Middlebury College, Mount Holyoke College, George Washington University (International Business Department and Economics Department), Georgetown (SFS), Johns Hopkins University (SAIS), Pomona College, Swiss National Bank, University of Zurich (IEW), IE Business School, IESE Business School, Bank of France, Bonn University (IIW), and the Hong Kong University of Science and Technology for their valuable input. Financial support from the International Policy Center at the University of Michigan Gerald R. Ford School of Public Policy is gratefully acknowledged. All errors are my own.

2
1. Introduction
Historically, the majority of Foreign Direct Investment (FDI)1 flows has taken place
predominantly between industrialized countries and from developed to developing countries. In recent
years, however, developing country firms started engaging in outward FDI activity. The recent upsurge in
cross-border mergers and acquisitions (M&As) from emerging countries such as China's Lenovo purchase
of IBM Thinkpad and India's Tata Motor's acquisition of Ford's Jaguar and Landrover have raised great
attention in policy circles, but yet, little is known about how these emerging market acquisitions are
different from acquisitions by acquirers from developed countries.
Traditionally, the business rationale for M&A is that the new combination of assets will be more
productive than the sum of its parts (Dunning (1981), Hymer (1976)). Theories for FDI have relied on
differences in relative input costs and market access as motivations for developed-market investment
flows to emerging markets (Yeaple (2003)). Helpman, Melitz, and Yeaple (2004) suggest that firms that
invest abroad have to overcome larger fixed costs and barriers. As a result, foreign acquiring firms have
to be more productive than their peers. In addition to technology transfer, industrial country acquirers
often seek lower labor costs in emerging markets. For emerging market acquirers, the rationale for cross-
border M&A might be different. Endowed with a relatively larger and cheaper labor force, it is likely that
emerging-market acquirers may relocate (or insource) manufacturing activity while keeping existing
distribution networks in the host country of the acquired business (Chari, Chen, and Dominguez (2009)).
Therefore, the changing composition in acquirers raises the question whether heterogeneity among
acquirers has consequences for target selection, implementation of M&As, and, therefore, post-
acquisition target performance. Although existing studies have shown superior performance in foreign-
owned firms compared with domestically owned firms (e.g., Harris and Ravenscraft (1991), Swenson
(1993), Doms and Jensen (1995), and Haskel, Pereira and Ruback (2007)), little is known about
differences in performance within the group of acquired firms and whether the act of acquisition improves
target firm performance. This paper fills this gap by estimating the causal effects of acquirer origin
heterogeneity on target firm performance.
I use a newly-constructed data set to examine whether the post-acquisition performance of U.S.
target firms differs when the buyer is either a U.S. domestic firm, an industrial country firm, or a
developing country firm. I assemble a comprehensive sample of acquired U.S. public firms by linking
daily M&A transaction information from SDC Thomson to each target firm's financial statement in
Compustat. The U.S. provides a particularly suitable setting in which to study M&As given its role as the
1 FDI includes “Greenfield” investment in new assets in a foreign country and acquisition of pre-existing foreign
assets, also termed “Brownfield” FDI. In this paper, I concentrate exclusively on brownfield FDI into the United States.
3
world's most sought after target country, with a combined value of cross-border and domestic M&A deals
of $1.47 trillion in 2007.2
When comparing the impact of domestic and various foreign acquisitions on U.S. target firm
performance, there are two main empirical challenges. First, the issue of selection arises in that better
post-acquisition performance might be a result of more skillful selection (also referred to as “cherry
picking” of targets) rather than the change in ownership per se. Second, one would ideally compare the
performance of a target firm that is acquired by a domestic firm with the performance of the same target
had it been acquired by a non-U.S. industrial country firm or a developing country firm.3 However, these
counterfactuals are not observable because at any given point in time a target firm experiences only one
of three events − it is acquired by either (1) a domestic firm, (2) an industrial country firm, or (3) a
developing country firm. This creates a missing data problem. To solve these issues, I use propensity
score matching to construct a comparison group of domestically acquired target firms that is similar on a
set of important observable characteristics to the group of targets acquired by industrial country firms or
developing country firms. In evaluating the target firm performance after the acquisition, I use measures
of labor productivity, profits, sales, and employment as outcome variables.
I find that over a period of five years following acquisition, compared to U.S. domestically
acquired targets, targets acquired by industrial country firms experience a significantly higher growth rate
in labor productivity of up to 13 percent, whereas for targets acquired by developing country firms, the
growth rate in labor productivity is 23 percent lower. Moreover, targets acquired by industrial country
firms and by developing country firms exhibit higher average profits compared with acquisitions by U.S.
firms − by ten and nine percentage points, respectively. The data show that compared with domestic
acquisitions, sales also tend to increase in industrial country firm acquisitions − by up to 29 percent
compared to a similar group of domestically acquired firms, whereas sales decline by up to 20 percent for
targets acquired by developing country firms compared to a similar group of domestically acquired firms.
Finally, whereas industrial country firm acquisitions lead to an increase in employment of 24 percent in
their targets, targets of developing country firm acquisitions reduce their total number of employees by up
to 26 percent.
Several sensitivity analyses are performed to assess the validity of the findings. I first show that
the results are robust to different propensity score specifications. Additionally, I use a small sample of
announced deals that were subsequently withdrawn and find no differences in target performance between
domestic withdrawn and foreign withdrawn deals. To illustrate the importance of controlling for selection
2 Source: SDC Thomson. 3 The same can be said of comparisons between target firms that are acquired by industrial country firms and by developing country firms.

4
and creating appropriate comparison groups, I redo the analysis without propensity score matching and
show that the results are different. Lastly, I perform robustness checks on various subsamples of the data
to make sure that the results are not specific to one particular feature of the data.
This paper provides some of the first findings on the differences in various aspects of target post-
acquisition performance as a result of acquirer origin heterogeneity. Previous studies do not differentiate
between the investor origin, since the comparison is conducted only between foreign-acquired and non-
foreign-acquired firms.4 Therefore, average effects estimated across groups could mask differences in
performance between each of the groups.
Examining the impacts of foreign and domestic acquisitions on target firms also reveal important
policy implications. The U.S. government has sometimes taken a hostile attitude toward foreign acquirers
of U.S. target firms.5 Another source of concern about foreign acquisitions is the potential loss of
American jobs. Domestic M&A transactions do not provoke the same sort of concerns as their cross-
border counterparts.6 Understanding the impacts of cross-border M&As sheds light on whether these
political concerns are validated by the post-acquisition economic performance of the different types of
acquisitions.
I begin with a theoretical and empirical background on why investor origin impacts target firm
performance based on existing literature. Section 3 provides a description of the data. Section 4 outlines
the details of the identification strategy using multiple treatment propensity score matching combined
with a difference-in-differences estimator. Section 5 presents the empirical results and discusses the
different ways in which gains are realized among the varying types of acquirers. Section 6 provides
robustness checks, and Section 7 concludes with a discussion of the implications of these results for both
future research on FDI and economic policy.
2. Empirical and Theoretical Background
A burgeoning literature in international economics has conducted causal analyses on foreign
ownership and firm performance (Djankov and Hoekman (2000), Conyon et al. (2001, 2002), Harris and
Robinson (2003), Bertrand and Zitouna (2005), Girma (2005), Benfratello and Sembenelli (2006), Fukao
et al. (2006), Girma and Görg (2007a, b), Heymann et al. (2007), and Arnold and Javorcik (2009), just to
name a few). These papers focus on ex-post performance changes in the target firm after foreign takeover.
This literature has found mixed evidence on whether foreign-owned firms perform better than domestic-
owned firms. To disentangle correlation from causality, Arnold and Javorcik (2009), for instance, create a
4 A notable exception is Girma and Görg (2007b). 5 See the article “Love me, love me not” in the July 2008 issue of The Economist. 6 For instance, Whirlpool's bid to buy Maytag in 2005 was received with enthusiasm, while a potential buyout of the same company by a Chinese-owned firm was perceived with concern by both American politicians and media.

5
carefully selected group of non-acquired firms using a propensity score matching technique combined
with a difference-in-differences estimator.
Essentially, previous studies have treated all foreign acquirers as homogeneous when exploring
the question of whether foreign acquisition leads to higher productivity.7 In contrast, the present paper
regroups acquired target firms by acquirer firm origin. This study asks the following: Are there
differences in the target firm performance after the acquisition? And if so, how do these effects differ
within the group of all acquired firms? To answer this question, I also take into account the domestically
acquired targets which are usually buried in the comparison group of all non-foreign-acquired targets in
other studies. Since domestic acquisitions play a dominant role, especially in the United States, previous
papers might have overlooked important insights into M&As by not comparing domestic acquisitions
directly with foreign acquisitions.
Broadly, acquiring additional capital may increase profits via two channels. First, the industrial
organization theory of multinational firms suggests that multinationals have access to firm specific assets
(Markusen, 2002) that can translate into operating with superior technology or better management
strategy and know-how. Helpman, Melitz, and Yeaple (2004) propose that firms that invest abroad have
to overcome larger fixed costs and barriers. As a result, foreign acquiring firms have to be more
productive. The superior technology from the foreign acquirer coupled with the new market access made
possible by the domestic target will increase profitability through cost reduction and increased sales.
Empirical evidence has indeed confirmed these theories and associate foreign ownership with
improvements in plant productivity (Harris and Ravenscraft (1991), Caves (1996), Swenson (1993),
Doms and Jensen (1995), Aitken and Harrison (1999), Haskel, Pereira and Ruback (2007), and Arnold
and Javorcik (2009)). By comparison, acquirers that purchase a target firm at home do not have to
overcome barriers that foreign acquisition would require. Therefore, unlike foreign acquirers, domestic
acquirers do not have such superior technology advantages. In fact, Spearot (2010) shows in his model
that foreign acquirers tend to be more productive than domestic acquiring firms.
The second channel of profit increase comes through decrease in production costs. Yeaple (2003)
suggests differences in relative input and production costs as motivations for FDI. The merged firm can
choose to reallocate production amongst the best assets of both firms (Spearot (2010)). This process
might involve reducing output at more costly production sites, firing more expensive workers, and
shifting production to plant locations that provide cheaper labor and inputs.
7 Notable exceptions are Girma and Görg (2007b) who differentiate acquirers by country groups in their
investigation on wage premia and recent work by Javorcik and Spatareanu (2010) that examines the impact of investor origin on vertical spillovers from foreign direct investment.

6
Given these various channels of profit increases through M&A, there are at least two reasons why
one would expect investor origin to affect target post-acquisition performance. First, in terms of
productivity improvements through M&A, most theoretical models and empirical work are restricted to
FDI flows that have taken place between industrialized countries and from industrialized countries to
developing countries. In those instances, technology transfers are more likely to happen from the foreign
acquirer to its target firms. If the acquiring firm is from a developing country, however, and the target is a
U.S. firm, transfer of technology from the acquirer to that target firm becomes less likely (Javorcik and
Spateareanu (2010)). Foreign acquiring firms from industrialized countries, on the other hand, have much
closer average productivity levels to U.S. firms to begin with, and because they have to overcome larger
barriers than U.S. domestic acquirers, they are more likely to transfer superior technology to their targets.
Therefore, compared to U.S. domestic acquisitions, foreign industrial acquisitions improve productivity in
their targets, while developing country acquisitions are likely to fail in achieving productivity gains in
their targets. Also, compared to developing country acquisitions, foreign industrial acquisitions lead to
bigger productivity gains in their targets.
The second reason for investor origin effects is the relative input cost argument. In particular,
emerging market acquirers are endowed with a relatively larger and cheaper labor force than acquirers in
the U.S. or from industrialized countries. Therefore, emerging-market acquirers are likely to relocate (or
insource) manufacturing activity while keeping existing distribution networks in the host country of the
acquired business (Chari, Chen, and Dominguez (2009)). Hence, compared to U.S. domestic acquisitions
and acquisitions by industrialized country firms, developing country acquisitions decrease employment in
their U.S. target firms.
These different investor origin effects have further implications on other measures of target firm
performance. As a result of productivity increases in targets acquired by foreign industrialized country
firms compared to other targets, those are likely to experience increases in sales, a closely related measure
of productivity. Targets acquired by developing country firms, on the other hand, experience sales
decreases as well employment decreases compared to the other targets. By relocating production from the
more expensive target site in the U.S. to the parent home site located in a developing country, the target
firm is being cut in size and as a result, all revenues that were previously attributed to the target are also
being reduced.
There are also impacts on target profits. Compared to U.S. domestic acquisitions, acquirers from
foreign industrialized countries increase profits in their targets due to better technology that in turn
increase sales and reduce costs. Profits behave more ambiguously in targets acquired by developing
country firms. Compared to U.S. domestic acquisitions, targets acquired by developing country firms
might experience a reduction in profits due to lower productivity and lower sales, but on the other hand,
7
these targets also enjoy decreases in costs due to reallocation of labor. Thus, depending on which effect
dominates, profits could either increase or decrease as a result of the M&A by a developing country firm.
It is possible to divide by investor origin in many ways.8 An obvious method would be to
differentiate by individual acquirer firm country. The problem with this approach is that the density of
various countries represented in the data is much lower than others. Given that productivity levels are
more uniform within industrialized countries and within developing countries, I have grouped the foreign
acquirers into OECD countries for the first group and non-OECD countries for the second group.9 The
third group is the group of U.S. domestic acquirers. I conduct robustness checks within these foreign
acquirer groups to show that target performances do not vary much when compared within each group,
but that the variation is mostly when comparison is done across these groups.
3. Data Description The data sample contains M&As involving all acquisitions of public U.S. target firms that were
announced and completed between January 1, 1979, and December 31, 2006, and are reported by SDC
Thomson. For each transaction, the SDC database provides information about the date on which the
transaction was announced and the date on which the transaction became effective or was withdrawn. The
database also provides some characteristics of the target and acquiring firms such as name, nation,
industry sector, North American Industry Classification System (NAICS) code and for some of the
transactions, SDC also reports the percentage of shares acquired, the value of the transaction, the number
of bidders, the method of payment, and whether the target firm is delisted as a result of acquisition.
Over the sample period 1979 − 2006, SDC reports a total of 2,074 M&A transactions between
foreign firms and public U.S. targets and 22,971 between U.S. acquirers and U.S. public target firms (see
Table 1). Out of the 2,074 foreign takeovers of public U.S. firms, 1,768 (85 percent) are undertaken by
industrial country firms (ICFs) and the rest by developing country firms (DCFs).
8 The existing literature has often compared foreign acquired to non-acquired target performance as supposed to comparing performance within a group of all acquired target firm. Chari, Chen and Dominguez (2009) compared DCF acquisitions to non-acquired firms. I also conduct robustness checks between ICF-acquired vs. non-acquired target firms. The results are in line with the existing literature that has found superior performance in foreign owned firms compared to domestic companies. 9 The OECD countries in the group of ICF acquirers are: Australia, Austria, Belgium, Canada, Denmark, France, Germany, Italy, Japan, Netherlands, New Zealand, Norway, Spain, Sweden, Switzerland, United Kingdom. The non-OECD countries in the group of DCF acquirers are: Algeria, Argentina, Brazil, China, Costa Rica, Ecuador, Hong Kong, India, Indonesia, Kuwait, Malaysia, Mexico, Nigeria, Papua New Guinea, Russia, Saudi Arabia, Singapore, South Africa, South Korea, Taiwan, Thailand, Uganda, Uzbekistan, and Venezuela.

8
The summary statistics of the acquisitions are also presented in Table 1. Among the ICF
acquisitions, the top five acquirer nations make up about 75 percent of all ICF public acquisitions and the
top five DCF acquirers make up 67 percent of all DCF public acquisitions. The top three industries for
each type of acquisition are manufacturing, finance, and real estate. The fraction of majority acquisitions
are similar for ICF and U.S. domestic public acquisitions (40 percent), but lower for DCF public
acquisitions (25 percent).
The financial statement data for the U.S. target firms come from Compustat North America.10 In
order to match the public U.S. target firms from SDC Thomson with the firms' financial statements in
Compustat, several identifiers are used. Using the CUSIP11, ticker symbol, target name, and industry
provided in SDC, each public U.S. target is matched by hand with the same firm listed in the Compustat
database. During this process, some firms in SDC cannot be found in Compustat. The two main reasons
are that (1) the firm has been delisted, or (2) the firm is not listed on a stock exchange that is covered by
Compustat. SDC indicates that 5 percent of each type of acquisition results in the delisting of a target firm
in the year of the acquisition. If a firm is delisted in the years after the acquisition, Compustat will change
the status of the firm from active to inactive. For ICF public acquisitions, U.S. public targets from 1,209
transactions (68 percent) were matched into Compustat and 205 transactions (67 percent) were matched
for DCF public acquisitions. Among U.S. domestic M&As, 14,577 transactions (63 percent) are matched
into Compustat. This matched sample consists of a total of 15,991 M&A deals.
The majority of ICF and domestic acquirers are publicly listed companies, which is not the case
for acquirers from developing countries. In fact, ten percent of DCF acquirers are government entities, a
share that is substantially larger than those for ICF and domestic acquiring firms. The price of acquisition
and payment methods across the three different groups of acquirers are also interesting. An overwhelming
majority of deals are financed purely with cash when the acquirer is from a developing country, whereas
the share of purely stock financed deals is the largest for U.S. domestic acquirers. The data on average
price of acquisition indicates that foreign acquirers from industrialized countries pay the most, followed
closely by domestic acquirers. DCF acquirers, on the other hand, pay the lowest amount.12
10 Compustat North America is compiled by Standard & Poor's and provides the annual and quarterly Income Statement, Balance Sheet, Statement of Cash Flows, and supplemental data items on over 24,000 publicly held companies in North America. 11 The CUSIP is a six-character code consisting of numbers in the first three positions and either an alpha or numeric character in the fourth, fifth, and/or sixth positions. CUSIP numbers and target names can often change due to splits, mergers, and delistings and relistings. Furthermore, depending on what stock exchange a firm is listed on, the ticker symbol is generally not unique, and one firm can also have several ticker symbols. Thus, it takes several identifiers to make sure that the U.S. target firm from SDC is indeed linked to the correct one in Compustat. 12 Unfortunately, SDC only reports the value of the acquisition for half of the deals, although, it does seem to be random for which deal it is reported (DiGiovanni (2005)). Therefore, this trend should be considered with caution.

9
The availability of financial data in Compustat varies strongly by firm, by year and by variable.
For instance, the employment variable is reported on a voluntary basis in Compustat, which leads to
spottiness in the availability. Although individual variables might be available on their own, several
variables have to be available for a given year to do the analysis. This collective lack of data shrinks the
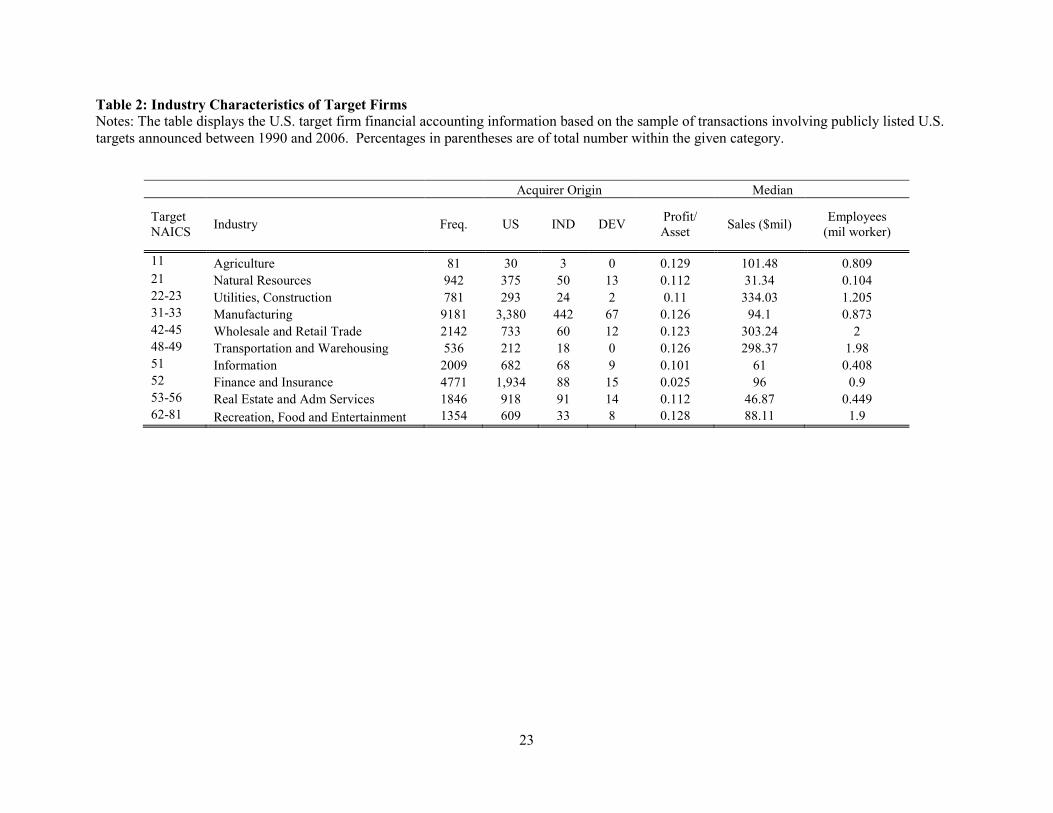
sample size. I correct for this problem by using multiple imputations for several missing variables.13 Table
2 lists the median values of financial characteristics of acquired public U.S. firms based on Compustat by
2-digit NAICS codes. There is considerable variation in sales and number of worker across different 2-
digit NAICS industries, whereas median return on assets (profit/assets) seems to be fairly consistent
across industries.
Lastly, there are target firms that have been acquired more than once by both U.S. acquirers and
foreign firms. Of the 15,991 completed deals for all three types of acquirers that are matched into
Compustat, about 20 percent of target firms have been acquired more than once. For the main results, I
include only the first occurrence of a transaction of each target firm in the data set, and in the case of a
target firm acquired by a U.S. firm and by either an ICF or DCF, the first acquisition is included in the
data set only if the subsequent transaction is at least five years after the first transaction.14
4. Econometric Strategy
In order to conduct a meaningful comparison of performance between U.S. public firms acquired
by foreign investors and those acquired by domestic firms, it is necessary to establish a missing
counterfactual capturing the performance of the foreign-acquired firms had they been acquired by
domestic firms. The case here is complicated by the fact that foreign acquirers are from different country
groups, industrial countries and developing countries. In previous studies, it has been common to use
binary choice models, since there are two acquisition states, e.g., foreign-acquired or not foreign-
acquired. In this paper, there are more than two possible treatments for a target firm: (1) acquisition by a
domestic firm, (2) acquisition by an industrial country firm (ICF) other than U.S., and (3) acquisition by a
developing country firm (DCF).
For tractability and interpretation, it is assumed that each target firm receives only one of the
above treatments. Given the multiple treatment alternatives, the analysis focuses on pairwise average
treatment effects following Gerfin and Lechner (2002) and Imbens (2000). For each pair of comparison, I
13 In particular, I use imputation by chained equations method to impute missing values for the year prior to acquisition on three variables: number of employees, debt and cash. The main results remain robust without imputation. 14
In another method, all transactions are kept in the data set, and each transaction regardless of reoccurrence of the
same target is regarded as a unique observation. A third method is to take out all targets that have been acquired multiple times. I conduct the same study using data from the second and third methods as a robustness check.

10
could run a binary logit to estimate the propensity scores and then proceed to matching. With three
treatments, however, a better way is to use a multinomial logit to estimate the propensity scores. Multiple
treatment matching has several advantages. First, it allows me to estimate a number of parameters
simultaneously. Another one is that I can impose a support condition that is common to all analyses.15
The three main outcome variables of interest are log of sales divided by number of employees, a
proxy for labor productivity,16 log sales, log employment, and profits − profits being operating income
before depreciation (OIBD) scaled by total assets, also referred to as return on assets (ROA). The reason
to use these four measures as outcome variables is that they are all closely related to productivity. In the
Helpman, Melitz, Yeaple (2004) model, sales and profits are correlated since both are determined solely
by productivity. This correlation has been generally confirmed in the data (Bernard et al. 2005). In
addition, studies also find that higher productivity firms employ more workers.
Propensity score matching alone eliminates differences between the treatment and control groups
based on observable characteristics included in X. In addition to the observable characteristics, there
might be other systematic differences between the two groups that are due to unobservables. The
difference-in-differences matching (DDM) estimator alleviates this issue by eliminating unobservable
time-invariant differences between the treatment and control groups.
The comparison group is created on the basis of observable plant characteristics and the vector of
control variables in X should include all factors that affect both treatment and outcome (Rosenbaum and
Rubin, 1983). The three types of potential acquirers choose targets based on specific criteria that might be
systematically different. All potential investors rely heavily on basic observable characteristics of firms,
such as their age, size, employment, and machinery and equipment available. Future performance
measures of a target firm ought to be of particular interest to potential investors. The literature has used
price earnings ratios as indicators of future performance. Another variable is Tobin's Q,17 since it is a
proxy for growth opportunities for a firm (e.g. Servaes, 1991, and Wernerfelt and Montgomery, 1988).
The level of a target firm's income and sales is an indication of its profitability and market power. Some
acquirers prefer more technology intensive industries, thus requiring the use of industry-fixed effects. By
using year-fixed effects, I control for time dependent macro factors such as the exchange rate (Froot and
Stein, 1991). Lastly, since targets are located in different states that might have state-specific factors
affecting the acquisition status, such as tax benefits, state-fixed effects are also included.
15
A detailed matching protocol is provided in the online Appendix. 16 Sales over employees is a crude measure of labor productivity. Ideally, one would measure labor productivity using output per worker-hour, which is not available in this dataset. 17
I follow the approach in Himmelberg et al. (1999) by calculating the market value of the firm as the sum of total liabilities, the value of the common stocks, and the estimated value of preferred stocks.

11
There are various matching methods available. Each scheme involves the definition of a closeness
criterion, a neighborhood, and the selection of an appropriate weighting function to assign to the set of
comparison observations with each treated firm. The choice relies on the trade-off between variance and
bias associated with each type of matching performed. In general, increasing the neighborhood or
bandwidth to construct the comparison units will reduce the variance and increase the bias resulting from
using on average more, but lower quality matches. In this case, kernel matching is applied to the
comparison group.18 More specifically, kernel matching assigns positive weight to comparison
observations with propensity scores similar to that of each treated observation, where the weights
decrease with the propensity score distance. The mean of the comparison group is calculated based on a
kernel weighting function.19
To assess how well the propensity score matching does at balancing the conditioning variables, I
calculate the standardized differences (SDiff) for the covariates. More specifically, for each covariate, I
take the average difference between the treated units and the matched (or reweighted) comparison units
and normalize it by the pooled standard deviation of the covariate in the treated and comparison
samples.20 As the balancing test results indicate in Table 3,21 some covariates that have significant
differences in means between the treated and the comparison groups do not differ significantly after being
matched along the set of observables. These balancing results are an indication that this approach is
capable of grouping together relatively homogeneous firms.
5. Results
5.1 Matching Results Based on Sample of Completed Deals
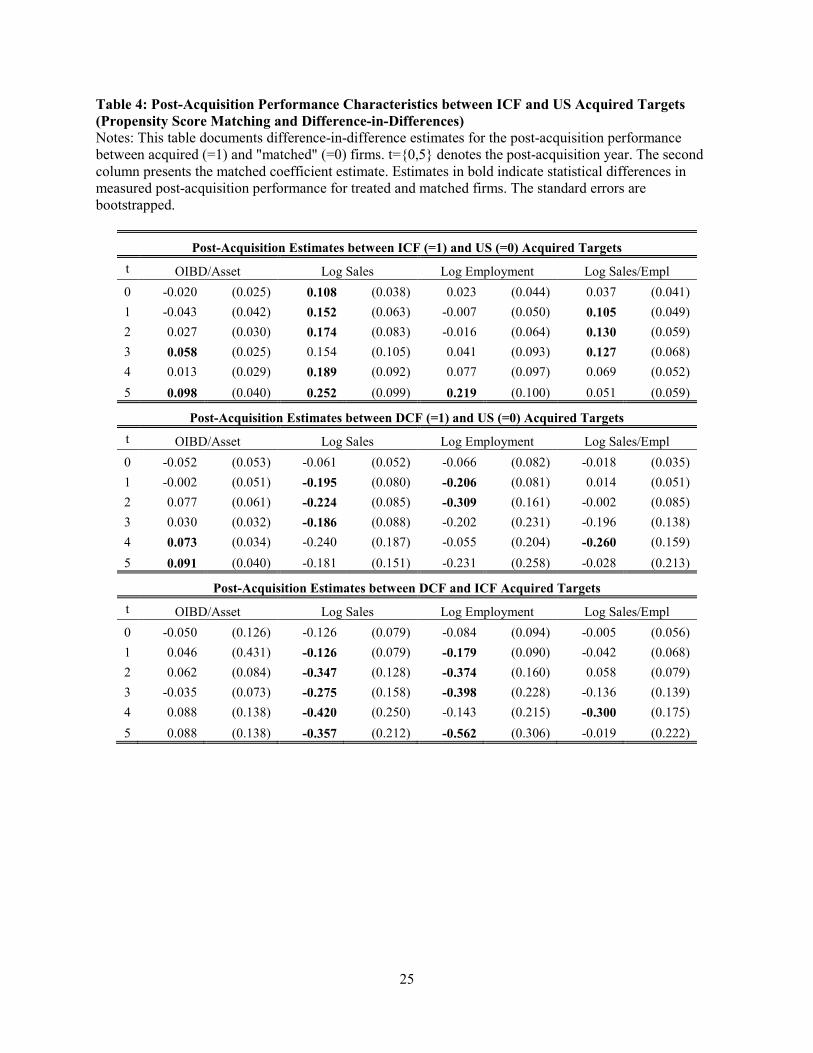
The matching estimate indicates that on average ICF-acquired firms compared with U.S.-acquired
firms that have been matched on the set of observable covariates experience a significant increase in labor
productivity of up to 13 percent in five years following acquisition. Moreover, compared to the group of
matched U.S. domestic firms, targets acquired by industrialized country firms also gain up to 10-
percentage-point in their profits in year five following the acquisition relative to the year preceding the
acquisition. In addition, ICF-acquired firms also experience statistically significant increases in log sales
relative to the year before acquisition and compared with the matched group of domestically acquired
U.S. target firms. On average, this increase in sales is about 19 percent. For example, if domestically
18
I also impose a common support restriction in which observations were considered off support if the treated firm's propensity score lay above the maximum value or below the minimum value for the control firms. 19
The function also involves the selection of a bandwidth in which I implement the “leave one out” cross-validation method following Plesca and Smith (2007). The cross-validation procedure are listed in the online Appendix. 20 See Girma and Görg (2007b) for a detailed description. 21
Balancing tests between DCF and US, and DCF and ICF are available upon request.

12
acquired target firms were to increase their sales by $10 million from the year before the acquisition, the
matched group of ICF-acquired firms would experience a $11.9 million increase in their sales relative to
the year before the acquisition. Finally, when comparing ICF-acquired firms with U.S. domestically
acquired target firms, the two groups do not differ significantly in terms of post-acquisition employment
for the first four years after acquisition. In the fifth year, however, ICF-acquired firms show a 24-percent
employment increase compared with U.S. domestically acquired targets and relative to the year before
acquisition. Difference-in-differences matching estimation results are presented in Table 4 and the effects
are plotted in Figures 1.
Developing country targets tend to experience lower labor productivity gains, albeit at low level
of statistical significance, compared to U.S. domestically acquired firms. In year four after the acquisition,
DCF targets experience 22.9% lower growth in labor productivity compared to the matched domestic
target firms and relative to the year prior to acquisition. In terms of profits, however, targets acquired by
developing country firms tend to experience statistically significant increases compared to the matched
US domestic targets. The average increase in profits in year four and five after the acquisition for DCF
compared with U.S.-acquired firms and to the year prior to acquisition is about 8.2 percentage points. In
contrast to the industrial-country-acquired firms, sales decrease significantly for DCF-acquired firms in
years one to three following acquisition. On average, sales decrease by 18 percent during those three
years when firms are acquired by DCFs compared with U.S.-acquired firms. Employment declines by 23
percent for DCF-acquired firms in the first and second year after acquisition when compared with U.S.
domestically acquired firms.22 DCF-acquired firms and ICF-acquired firms also differ in labor
productivity gains. In year four after acquisition, DCF-acquired firms experience a 26 percent lower
growth rate in labor productivity compared to the matched group of ICF-acquired firms. However, they
do not show significant differences in post-acquisition return on assets. They differ in sales and
employment patterns after the acquisition. Firms acquired by DCFs experience on average 26 percent
lower sales in years one to five after the acquisition than firms acquired by ICFs and relative to the year
before acquisition. Moreover, DCF-acquired firms decrease employment by 31 percent compared to firms
acquired by ICFs and relative to the year before acquisition.
Figure 1 summarizes the dynamics of the effects by pinning down their development over time
starting with the acquisition year. Each panel in the figure presents the pairwise effects on each of the four
outcome variables--profits, log sales, log employment and log labor productivity − of DCF and ICF
acquisition relative to the base scenario of being acquired by a U.S. domestic firm. A value larger than
22
Note as the average treatment effect of treatments of being acquired by an industrial country firm and of being acquired by a domestic firm is calculated for the log of labor productivity, log of employment and log of sales, the percentages reported in the test are obtained by taking the exponent of the average treatment effects, i.e. the estimated differences in the outcome variables between treatment group and matched control group.

13
zero indicates that target firms by a particular acquirer type (DCF or ICF) would show an increase in the
performance value compared with an acquisition by a US domestic acquirer and relative to the year
before acquisition. Overall, the findings suggest the following: Compared to U.S. domestic acquisitions,
ICF acquired target firms dominate in labor productivity, profits and sales, while DCF acquired firms
experience smaller labor productivity gains and employment and sales decreases.
5.2 Matching Results Based on Sample with all Foreign Deals Combined
Instead of differentiating between acquiring firms from developing and industrialized countries,
earlier studies have generally lumped the two groups of acquirers into one. The matching estimates (Table
5) based on targets acquired by all foreign firms compared to the group of targets bought by domestic
acquirers indicates that foreign acquisitions lead to statistically significant increases in labor productivity
one year after the acquisition and also increases in profits in years three and five after the acquisition
relative to the targets acquired by U.S. domestic firms. The estimates on sales and employment are not
statistically significant except for an increase in foreign-bought target sales in year five after the
acquisition. The coefficients on the estimates are also much smaller than those when performing the
analysis using separate groupings of targets bought by firms from developing countries and industrialized
countries. Since the ICF acquisitions outweigh the DCF acquisitions in number, the combined results are
more similar to those with only ICF acquirers. The reason for the lack of statistical significance and the
smaller magnitude of the coefficient estimates might be due to the fact that the two groups of acquirers
have such opposing results on their own. As previous studies have combined these two types of acquirers,
it would not have been possible to identify the opposite restructuring effects on the target firms.
5.3 Matching Results Based on Sample of Withdrawn Deals
Along with the list of all completed M&A transactions, SDC Thomson also provides information
on announced deals that are withdrawn during the course of the sample period. Over the sample period of
1979 − 2006, ICFs withdrew 195 deals with US firms, and US firms withdrew 2,993 deals with other US
companies. The number of failed acquisitions for DCFs that have financial statement data is only 18, and
therefore, too small to conduct inference on its own, therefore, I have combined the group of foreign
withdrawn deals. Using this sample of failed foreign and US domestic transaction deals, I can test how
domestically targeted firms compare with foreign targeted firms. If it is the change of foreign ownership
that affects the target firm's post-acquisition performance relative to a change of domestic ownership, then
after controlling for selection, one would expect no performance differences between foreign targeted
firms and domestically targeted firms within the group of withdrawn deals. I use binary treatment
propensity score matching to control for selection and compare the performance between withdrawn

14
foreign targeted firms and withdrawn U.S. targeted firms. Results indicate that there are hardly any
significant differences in their performances over a five-year period following the announcement date
(Table 6), except for a decrease in profits in year five after the acquisition for the group of foreign
targeted firms compared to those that were targeted by US domestic firms. Also, employment in the year
of acquisition announcement tends to be higher in foreign targeted firms than in domestic targets. There
are no significant differences in labor productivity and sales. This finding contrasts with the results
obtained in a comparison between ICF and domestic acquisitions and also between all foreign acquired
(DCF and ICF combined) and domestic acquisitions where the deals are executed. Thus, this result is a
strong indication that the differences in post-acquisition performance between actual foreign-acquired and
domestic-acquired targets are caused by the respective changes in ownership status.
5.4 Simple Difference-in-Differences Results
To illustrate the importance of creating the appropriate comparison group in order to control for
selection, I redo the analysis with a simple difference-in-differences (DiD) approach without propensity
score matching, but using similar covariates as control variables in the multinomial logit.23 The
underlying assumption is that the three different groups of acquirers are choosing their targets in the same
random pattern. Table 7 shows that the results based on the simple DiD estimates are different from
results obtained when controlling for selection by applying propensity score matching. In fact, without
creating the appropriate control groups, one might draw the misleading conclusion that there is no
significant difference in the post-acquisition performance between the DCF and US domestic targets in
terms of profits (OIBD/total assets).
For labor productivity, employment and sales, however, the DiD estimates are larger in
magnitude and statistically significant for more periods than the matching estimates, especially when
comparing DCF to ICF targets. Essentially, the DiD estimation uses all acquired firms within each treated
group with the same weight. The reasons why the simple difference-in-differences estimates differ from
those found in propensity score matching are the following: 1) the underlying functional form is assumed
to be linear, whereas the propensity score method is semi-parametric, thus not putting restrictions on
functional form, and 2) they do not address the support problem. In fact, simple difference-in-differences
estimation includes the full set of unmatched control firms, whereas propensity score matching ensures
that far lying outliers are excluded.
23 For more details on the difference-in-difference estimation method, see the online Appendix.
15
5.5 Discussion
The results in the study confirm the hypotheses that within the three acquirer type groups (U.S.,
ICF, and DCF), change in ownership by ICF compared to the other two types improves target firm
performance. As expected, compared to the other two types of targets, for ICF-acquired firms, the
increase in profits, scaled by total assets, is accompanied by large increases in sales, employment as well
as labor productivity. These results strongly indicate that ICF acquirers increase profits through increased
market share and through increased labor productivity. A potential explanation of this result can be found
by using the implications of the Helpman, Melitz, and Yeaple (2004) model. Within their framework,
foreign acquirers − i.e., ICF acquirers − have lower marginal costs due to their higher productivity levels;
they therefore set prices lower. Lower prices in turn make them more competitive and more able to
increase output and total revenue. These predicted output and revenue increases are reflected in the data
by the jump in sales in target firms after acquisition. Within a few years, these sales increases translate
into higher profits. Moreover, ICF acquirers do not have significant wage differential advantages over US
domestic acquirers and are therefore not likely to change employment in the target firm post-acquisition
compared with U.S.-acquired targets. In fact, through sales increases in the target firm, ICF acquirers are
more likely in need of more workers within the target firm, which is reflected by increased employment
numbers in later years after the acquisition.
DCF-acquired firms experience increases in profits compared with U.S.-acquired firms, but not in
comparison with ICF-acquired firms. Target firms that are acquired by DCFs suffer large decreases in
sales as well as decreases in number of workers compared with the other two types of acquired firms
following M&A. Furthermore, DCF-acquired target firms exhibit lower growth rate in labor productivity
than domestically acquired firms. Some of these performance patterns are puzzling and at odds with the
simple insourcing story, in which DCF-acquired firms exploit wage differences by outsourcing some of
the work in the U.S. target firm back to the acquirer's home country.
As hypothesized earlier, DCF-acquired targets are likely to suffer decreases in employment
compared with domestically and ICF-acquired targets. Thus, when employment decreases in DCF-
acquired targets, the firm itself becomes smaller. The downsizing in the target firm leads to decrease in
sales activities, and thus explains the lower sales growth in DCF-acquired targets compared to the other
acquired targets. The lower growth rate in labor productivity implies that sales fall more than
employment. This pattern contradicts the insourcing story, since the latter would imply a greater fall in
employment than sales. Thus, alternative explanations are needed for this puzzling productivity result in
DCF-acquired targets. One possibility is to look in the literature on divestment. For instance, Conyon et
al. (2001) suggest, that divestment following M&As need not be beneficial for the target firm, although it
might increase the merged firm's overall efficiency. However, limited data on the acquiring firms makes it

16
difficult in this paper to assess the restructuring and efficiency effects on the combined firm, future work
will hopefully shed more light on the various performance patterns uncovered in this paper.
6. Robustness Checks
In the five years after acquisition, the sample size decreases from year to year by about 15 percent
on average. Part of the attrition is due to the long period of investigation. In particular, firms acquired
after 2001 do not have the full five-year period after the acquisition, since the current acquisition data is
available only through December 2006. Another reason for the attrition that affects a smaller portion of
the firms is delisting of the firm or even bankruptcy. Once the firm leaves Compustat it is not possible to
track its financial statement data, and the reasons for delistings are generally not specified. Thus, an
alternative way to analyze the data is to concentrate only on the sample of firms that are listed in
Compustat for at least the five years following their acquisition. In the online Appendix, Table A.4.1
presents the matching estimates using this sample without firm attrition, and the results are similar in
magnitude to those using the whole sample.
As mentioned in the background section, there are multiple ways to order the various groups of
acquirers. The existing grouping is largely based on data availability and country rankings by technology
measures as well as firm rankings by using performance measures.24 Regardless of the groupings,
however, the goal should be to ensure that performance differences are limited to across group
comparisons rather than within groups. For instance, within the group of ICF acquirers, the sample
divides almost evenly between acquirer firms from EU and non-EU countries. For the group of DCF
acquirers, the sample divides into acquiring firms from East Asia and non-East Asia. Using these natural
divides within the groups, I conduct within group comparisons for ICF and DCF acquirers. The results for
comparisons between firms in non-EU vs EU countries that make up the group of ICF acquirers as well as
those for comparisons between acquirer firms in East Asia vs non-East Asia that make up the group of
DCF acquirers are shown in Table A.4.2 of the online Appendix. They indicate that differences in target
post-acquisition performance between the split samples are generally not statistically significant.
Further robustness checks using the following samples can be found in the online Appendix:
horizontal M&A in which the target and acquiring firms are in the same industry, majority or minority
acquisitions, U.S. acquiring firms with and without foreign affiliations, and acquisitions where target
firms are never acquired more than once throughout the sample period. The results remain qualitatively
the same when using these various samples.
7. Conclusion
24 These rankings are available upon request.

17
This paper measures the performance of U.S. target firms after acquisition by firms from a broad
range of countries over a five year period using daily announced M&A information and firm-level
financial statement data between 1979 − 2006. In contrast to previous studies that lump all acquisitions by
foreign firms together, I differentiate those acquisitions made by industrial country firms from those made
by firms from developing countries. In order to control for non-random selection, I use multiple treatment
propensity scores to match similar firms between comparison groups.
Consistent with the predictions of the Helpman, Melitz, and Yeaple (2004) model, targets
acquired by firms from industrial countries exhibit the best post-acquisition performance. Targets
acquired by non-U.S. firms from industrialized countries experience an increase in labor productivity of
up to 13% and an increase in profitability that is greater by 10 percentage points compared with targets
acquired by domestic firms. This improvement in performance is driven by increases in sales. Acquirers
from developing countries experience 23 percent lower labor productivity gains compared to target
acquired by domestic firms, but they improve the post-acquisition profit of their targets by 8 percentage
points more than U.S. domestic acquirers do. In contrast to acquisitions by non-U.S. industrial country
firms, acquisitions by developing country firms tend to result in lower labor productivity gains and
decreases in employment and sales in U.S. targets. These results are robust to different propensity score
specifications as well as to sample classifications.
The study provides some of the first evidence that acquirer origin matters both for target post-
acquisition performance. The findings also highlight how accounting for heterogeneity in acquirer types
reveals different channels by which post-acquisition performance is improved. The use of multiple
treatment propensity score matching and detailed firm level data in this paper provides a methodology for
controlling possible selection issues that could be employed in other studies of acquisition types where
selection is non-random. In fact, I show that when not controlling for selection, the estimation yields
different results that do not separate causality from correlation. Finally, even though an overall welfare
assessment is not possible here due to the lack of data on the acquirers, the results suggest that U.S. public
target firms benefit more from foreign acquisitions than from domestic M&As in terms of overall
performance measured as profitability, with the largest improvements stemming from non-U.S. industrial
country firms. If assessing performance using labor productivity, however, being acquired by a non-U.S.
industrial country firm has positive effects on the target's productivity, whereas being acquired by a
developing country firm results in lower productivity gains, when compared with domestic acquisition. At
the same time, workers in U.S. public target firms that are acquired by developing country firms are more
likely to lose their jobs, whereas there are employment gains in acquisitions made by non-U.S. industrial
country firms, compared to US domestic acquisitions.

18
These findings provide new insights into the workings and consequences of domestic and cross-
border M&As. In particular, for governments that are devising policies toward FDI, these results suggest
that not all types of foreign investments should be treated in the same way. By building on this paper’s
approach to differentiating acquirer types, future studies can use more detailed data on the acquirer firms
to help evaluate the overall impact of M&A deals. For instance, do acquirers perform differently after
purchasing target firms? Do productivity, revenue and employment also change differently in the
acquirers depending on the type of target? The methodology in this paper allows for the study of the
effect on acquirers by differentiating the types of targets. Specifically, it enables us to identify how post-
acquisition performance changes when targets are located in different parts of the world. Complementing
the results in this paper, such future studies will increase our general understanding of the effect of M&As
on both acquirers and targets in a variety of locations around the globe.
References
Aitken, B. and Harrison, A. 1999. Do domestic firms benefit from direct foreign investment? Evidence from Venezuela. American Economic Review, 89(3): 605-618. Arnold, J. M., and Javorcik, B. S. 2009. Gifted Kids or Pushy Parents? Foreign Acquisitions and Plant Performance in Indonesia. Journal of International Economics, 79, 42-53. Benfratello, L and Sembenelli, A. 2006. Foreign Ownership and Productivity: Is the Direction of the Causality so Obvious? International Journal of Industrial Organization, 24 (4), 733-751. Bertrand, O. and Zitouna, H. 2005. Domestic versus Cross-Border Acquisitions: Which Impact on the Target Firm's Performance? The Research Institute of Industrial Economics Working Paper 647. Caves, R. 1996. Multinational Enterprise and Economic Analysis, Cambridge, UK: Cambridge University Press. Chari, A., Chen, W. and Dominguez, K. M. 2009. Foreign Ownership and Corporate Restructuring: Direct Investment by Emerging-Market Firms in the United States. mimeo. University of Michigan. Conyon, M. J., Girma, S., Thompson, S. and Wright, P. 2001. The impact of mergers and acquisitions on company employment in the United Kingdom. European Economic Review 46: 31 - 49. Conyon, M. J., Girma, S., Thompson, S. and Wright, P. 2002. The Productivity and Wage Effects of Foreign Acquisition in the United Kingdom. Journal of Industrial Economics, 50: 85-102. Djankov, S. and Hoekman, B. 2000. Foreign Investment and Productivity Growth in Czech Enterprises. World Bank Economics Review, 14 (1), 49-64. Dehejia, R. H., and Wahba, S. 2002. Propensity score matching methods for nonexperimental causal studies. Review of Economics and Statistics 84, 1, 151–161.

19
DiGiovanni, J. 2005. What Drives Capital Flows? The Case of Cross-Border M&A Activity and Financial Deepening. Journal of International Economics, 65, 1, 127–149. Doms, M. E., Jensen, J.N. 1995. Geography and Ownership as Bases for Economics Accounting. The University of Chicago Press, Ch. Comparing wages, skills, and productivity between domestically and foreign-owned manufacturing establishments in the United States, pp. 235-258. Dunning, J. 1981. International Production and the Multinational Enterprise. George Allen and Unwin, London. Froot, K., and Stein, J. 1991. “Exchange Rates and Foreign Direct Investment: An Imperfect Capital Markets Approach,” Quarterly Journal of Economics, 106:4, pp. 1191-1217. Fukao, K., Ito, K., Kwon, H., and Takizawa, M. 2006. Cross-Border Acquisitions and Target Firms' Performance: Evidence From Japanese Firm-Level Data. NBER Working Papers 12422. Gerfin, M. and Lechner, M. 2002. A Microeconometric Evaluation of the Active Labour Market Policy in Switzerland, The Economic Journal, 112 (October), 854-893. Girma, S., 2005. Technology transfer from acquisition FDI and the absorptive capacity of domestic firms: An empirical investigation. Open Economics Review 16, 175-187. Girma, S. and Görg, H. 2007a. Multinationals‘ Productivity Advantage: Scale or Technology? Economic Inquiry 45: 350-362. Girma, S., Görg, H. 2007b. Evaluating foreign ownership wage premium using a difference-differences matching approach. Journal of International Economics 72, 97-112 Harris, R. and Ravenscraft, D. 1991. The Role of Acquisitions in Foreign Direct Investment: Evidence from the U.S. Stock Market. The Journal of Finance, Vol. 46, 1022-1035. Harris, R., and Robinson, C. 2003. Foreign ownership and productivity in the United Kingdom: Estimates for U.K. manufacturing using the ARD. Review of Industrial Organization 22 (3), 207–223. Haskel, J., Pereira, S., and Slaughter, M. 2007. Does Inward Foreign Direct Investment Boost the Productivity of Domestic Firms? Review of Economics and Statistics 89(3), 482-496. Helpman, E., Melitz, M., and Yeaple S. 2004. Export versus FDI with Heterogeneous Firms. American Economic Review 91(4), 300-316. Heymann, F., Sjöholm, F., and Tingvall, P. G. 2007. Is there really a foreign ownership wage premium? Evidence from matched employer–employee data. Journal of International Economics 73: 355-376 Himmelberg, C.P., Hubbard, R. G., Palia, D. 1991. Understanding the determinants of managerial ownership and the link between ownership and performance. Journal of Financial Economics 53, 353-384. Hymer, S. 1976. International Operations of National Firms: A Study of Direct Investment. MIT Press.

20
Imbens, G. W. 2000. The role of the propensity score in estimating dose-response functions. Biometrika, vol. 87, pp. 706-10. Javorcik, B, S. and Spatareanu, M. 2010. Does it matter where you come from? Vertical spillovers from foreign direct investment and the origin of investors. Journal of Development Economics, forthcoming. Lechner, M., 2002. Some practical issues in the evaluation of heterogeneous labour market programmes by matching methods. Journal of the Royal Statistical Society, Series A, 165, 59-82. Love me, love me not. 2008, July 10. The Economist. Leuven, E. and Sianesi, B. 2003. "PSMATCH2: Stata module to perform full Mahalanobis and propensity score matching, common support graphing, and covariate imbalance testing." http://ideas.repec.org/c/boc/bocode/s432001.html. Version 1.2.3. Markusen, J.R., 2002. Multinational Firms and the Theory of International Trade. MIT Press, Cambridge MA. McGuckin, R. H. and Nguyen, S. V. 2001. The impact of ownership changes: a view from labor markets. International Journal of Industrial Organization 19: 739 - 762. Multiple Imputation in Stata, UCLA: Academic Technology Services, Statistical Consulting Group. from http://www.ats.ucla.edu/stat/stata/library/ice.htm (accessed September 10, 2010). Plesca, M. and Smith, J. 2007. Evaluating multi-treatment programs: theory and evidence from the U.S. Job Training Partnership Act experiment. Empirical Economics 32, 491-528. Rosenbaum, P., Rubin, D. 1983. The central role of the propensity score in observational studies for causal effects. Biometrika 70, 41–55. Servaes, H. 1991. Tobin's Q and the Gains from Takeovers. Journal of Finance, Vol. 46, No. 1, pp. 409-419 Smith, J., and Todd, R.E. 2005. Does matching overcome Lalonde's critique of nonexperimental estimators. Journal of Econometrics 125, 305-353. Spearot, A. C. 2010. Productivity and the Role of the Global Acquisition Market. mimeo. University of California, Santa Cruz. Swenson, D. 1993. Foreign Mergers and Acquisitions in the United States. in K. Froot, Foreign Direct Investment, University of Chicago Press, 255-281. Wernerfelt, B. and Montgomery, C. A. 1988. Tobin’s Q and the Importance of Focus in Firm Performance. American Economic Review, Vol. 78, No. 1, 246-250.
Yeaple, S. 2003. The complex integration strategies of multinationals and cross country dependencies in the structure of foreign direct investment. Journal of International Economics 60(2), 293-314.

21
Figures and Tables
Figure 1: Dynamics of Average Effects on Performance
Notes: The average effects on performance are for target firms in year t following acquisition relative to the year before acquisition and relative to US domestic acquisitions as base case. The 95% confidence band around the point estimates are based on bootstrapped standard errors. Operating income before depreciation (OIBD) is the most basic level of profit measure in Compustat.
-.1
-.05
0.05
.1.15
0 1 2 3 4 5year (t = 0 acquisition year)
ICFDCF
DCF 95% C. I. ICF 95% C. I.
OIBD/Assets
-.1
-.05
0.05
.1.15
0 1 2 3 4 5year (t = 0 acquisition year)
OIBD/Assets
-.4
-.2
0.2
.4
0 1 2 3 4 5year (t = 0 acquisition year)
Log Sales
-.6
-.4
-.2
0.2
.4
0 1 2 3 4 5year (t = 0 acquisition year)
Log Employment-.4
-.2
0.2
0 1 2 3 4 5year (t = 0 acquisition year)
Log Labor Productivity

22
Table 1: 2umber of Observations for each Type of Acquisition and Transactions Details
Notes: The table summarizes the sample of transactions involving publicly listed U.S. targets announced between 1990 and 2006.
US to US ICF to US DCF to US
Completed M&As (publicly listed target firm)
22,971 1,768 306
Involved in multiple acquistions
4874 388 73
Number of Withdrawn Deals
3,976 256 25
Top 5 Acquiring Nations
UK Hong Kong
Canada Singapore
Japan Mexico
France South Korea
Germany Taiwan
Majority Control (>50%) 9,206 786 76
Matched to Compustat 14,577 1,209 205
Avg Acq Value $100.6 mil $130.5 mil $69.2 mil
Top 2 Industry Finance,
Manufacturing Manufacturing,
Finance Finance,
Manufacturing
Financed with Cash 10,231 943 203
Financed with Stock 1,916 42 5
23
Table 2: Industry Characteristics of Target Firms
Notes: The table displays the U.S. target firm financial accounting information based on the sample of transactions involving publicly listed U.S. targets announced between 1990 and 2006. Percentages in parentheses are of total number within the given category.
Acquirer Origin Median
Target NAICS
Industry Freq. US IND DEV Profit/ Asset
Sales ($mil) Employees (mil worker)
11 Agriculture 81 30 3 0 0.129 101.48 0.809 21 Natural Resources 942 375 50 13 0.112 31.34 0.104 22-23 Utilities, Construction 781 293 24 2 0.11 334.03 1.205 31-33 Manufacturing 9181 3,380 442 67 0.126 94.1 0.873 42-45 Wholesale and Retail Trade 2142 733 60 12 0.123 303.24 2 48-49 Transportation and Warehousing 536 212 18 0 0.126 298.37 1.98 51 Information 2009 682 68 9 0.101 61 0.408 52 Finance and Insurance 4771 1,934 88 15 0.025 96 0.9 53-56 Real Estate and Adm Services 1846 918 91 14 0.112 46.87 0.449 62-81 Recreation, Food and Entertainment 1354 609 33 8 0.128 88.11 1.9

24
Table 3: Balancing Tests Notes: These tests check whether the matching approach is capable of grouping together relatively similar firms. The table presents the average difference in each of the covariates between the: (1) treated firms and the unmatched control firms, and (2) the treated firms and the matched (reweighted) control firms. Differences are normalized by a pooled standard deviation of the covariate in the two samples.
ICF-Acquired (=1) and U.S.-Acquired (=0)
Mean %reduct t-test
Variable Sample Treated Control %Diff in Diff t p>|t|
Age Unmatched 22.807 24.135 -11.6 -1.78 0.076
Matched 22.807 24.239 -12.5 -7.8 -1.43 0.153
PE ratio Unmatched 10.702 12.924 -2 -0.33 0.744
Matched 10.702 13.921 -2.8 -44.9 -0.33 0.742
Tobin's Q Unmatched 2.252 1.873 14.8 2.75 0.006
Matched 2.252 1.925 12.8 13.6 1.44 0.151
OIBD/Asset Unmatched 0.031 0.074 -20.9 -3.23 0.001
Matched 0.031 0.065 -16.6 20.6 -1.75 0.081
log Cash Unmatched 1.742 1.935 -8.3 -1.32 0.188
Matched 1.742 1.938 -8.4 -1.5 -0.96 0.335
log Sales Unmatched 4.767 4.987 -10.4 -1.68 0.094
Matched 4.767 5.063 -13.9 -34.7 -1.58 0.116
log Assets Unmatched 5.095 5.334 -11.1 -1.78 0.075
Matched 5.095 5.337 -11.3 -1.2 -1.28 0.199
log Employment Unmatched 0.040 0.263 -11.3 -1.8 0.072
Matched 0.040 0.315 -14 -23.6 -1.59 0.112
log Debt Unmatched 2.951 3.103 -5.4 -0.85 0.394
Matched 2.951 3.127 -6.2 -16.3 -0.71 0.479
Net Income/Asset Unmatched -0.062 -0.028 -11.7 -1.56 0.119
Matched -0.062 -0.034 -9.4 19.6 -1.04 0.297
log Net PPE Unmatched 3.534 3.611 -3.3 -0.53 0.598
Matched 3.534 3.703 -7.2 -120.3 -0.82 0.413
25
Table 4: Post-Acquisition Performance Characteristics between ICF and US Acquired Targets
(Propensity Score Matching and Difference-in-Differences)
Notes: This table documents difference-in-difference estimates for the post-acquisition performance between acquired (=1) and "matched" (=0) firms. t={0,5} denotes the post-acquisition year. The second column presents the matched coefficient estimate. Estimates in bold indicate statistical differences in measured post-acquisition performance for treated and matched firms. The standard errors are bootstrapped.
Post-Acquisition Estimates between ICF (=1) and US (=0) Acquired Targets
t OIBD/Asset Log Sales Log Employment Log Sales/Empl
0 -0.020 (0.025) 0.108 (0.038) 0.023 (0.044) 0.037 (0.041)
1 -0.043 (0.042) 0.152 (0.063) -0.007 (0.050) 0.105 (0.049)
2 0.027 (0.030) 0.174 (0.083) -0.016 (0.064) 0.130 (0.059)
3 0.058 (0.025) 0.154 (0.105) 0.041 (0.093) 0.127 (0.068)
4 0.013 (0.029) 0.189 (0.092) 0.077 (0.097) 0.069 (0.052)
5 0.098 (0.040) 0.252 (0.099) 0.219 (0.100) 0.051 (0.059)
Post-Acquisition Estimates between DCF (=1) and US (=0) Acquired Targets
t OIBD/Asset Log Sales Log Employment Log Sales/Empl
0 -0.052 (0.053) -0.061 (0.052) -0.066 (0.082) -0.018 (0.035)
1 -0.002 (0.051) -0.195 (0.080) -0.206 (0.081) 0.014 (0.051)
2 0.077 (0.061) -0.224 (0.085) -0.309 (0.161) -0.002 (0.085)
3 0.030 (0.032) -0.186 (0.088) -0.202 (0.231) -0.196 (0.138)
4 0.073 (0.034) -0.240 (0.187) -0.055 (0.204) -0.260 (0.159)
5 0.091 (0.040) -0.181 (0.151) -0.231 (0.258) -0.028 (0.213)
Post-Acquisition Estimates between DCF and ICF Acquired Targets
t OIBD/Asset Log Sales Log Employment Log Sales/Empl
0 -0.050 (0.126) -0.126 (0.079) -0.084 (0.094) -0.005 (0.056)
1 0.046 (0.431) -0.126 (0.079) -0.179 (0.090) -0.042 (0.068)
2 0.062 (0.084) -0.347 (0.128) -0.374 (0.160) 0.058 (0.079)
3 -0.035 (0.073) -0.275 (0.158) -0.398 (0.228) -0.136 (0.139)
4 0.088 (0.138) -0.420 (0.250) -0.143 (0.215) -0.300 (0.175)
5 0.088 (0.138) -0.357 (0.212) -0.562 (0.306) -0.019 (0.222)

26
Table 5: Post-Acquisition Performance Characteristics between Foreign (ICF and DCF combined)
and U.S.- Acquired Targets (Propensity Score Matching and Difference-in-Differences)
Notes: This table summarizes the difference-in-difference estimates for the post-acquisition performance between foreign-acquired (DCF and ICF) and "matched" U.S.-acquired firms. t={0,5} denotes the post-acquisition year. Estimates in bold indicate statistical differences in measured post-acquisition performance for treated and matched firms. Bootstrapped standard errors are in parentheses.
Foreign (=1) and U.S. (=0)
(Bootstrapped standard errors based on reps=100 in parenthesis)
t OIBD/Asset Log Sales Log Employment Log Sales/Empl
0 -0.032 (0.027) 0.042 (0.026) -0.004 (0.036) -0.011 (0.024)
1 -0.028 (0.035) 0.050 (0.045) -0.063 (0.043) 0.054 (0.029)
2 0.022 (0.024) 0.022 (0.060) -0.087 (0.067) 0.032 (0.035)
3 0.043 (0.017) 0.022 (0.071) -0.011 (0.089) -0.026 (0.054)
4 0.045 (0.028) 0.102 (0.069) 0.078 (0.094) -0.029 (0.055)
5 0.065 (0.026) 0.144 (0.083) 0.153 (0.107) 0.006 (0.057)
Table 6: Post-Acquisition Performance Characteristics between Failed U.S. Deals and Failed
Foreign (ICF and DCF) Deals (Propensity Score Matching and Difference-in-Differences)
Notes: This table summarizes the difference-in-difference estimates for the post-acquisition performance between foreign-acquired and "matched" U.S.-acquired firms, for which the deal was withdrawn. t={0,5} denotes the post-acquisition year. Estimates in bold indicate statistical differences in measured post-acquisition performance for treated and matched firms. Bootstrapped standard errors are in parentheses.
Failed Foreign (=1) and Failed U.S. (=0)
(Bootstrapped standard errors based on reps=100 in parenthesis)
t OIBD/Asset Log Sales Log Employment Log Sales/Empl
0 -0.017 (0.011) 0.017 (0.026) 0.062 (0.028) -0.034 (0.026)
1 0.023 (0.016) -0.003 (0.038) 0.060 (0.043) -0.033 (0.035)
2 0.014 (0.011) 0.005 (0.052) 0.080 (0.062) -0.017 (0.042)
3 0.009 (0.015) 0.035 (0.063) 0.062 (0.063) -0.004 (0.047)
4 -0.020 (0.018) 0.033 (0.078) 0.061 (0.082) -0.013 (0.057)
5 -0.018 (0.011) 0.014 (0.092) 0.010 (0.081) -0.010 (0.059)

27
Table 7: Post-Acquisition Performance Characteristics (Simple Difference-in-Differences)
Notes: This table summarizes the simple difference-in-difference estimates without propensity score matching for the post-acquisition performance between treated and "matched" firms. t={0,5} denotes the post-acquisition year. Estimates in bold indicate statistical differences in measured post-acquisition performance for treated and matched firms.
ICF (=1) and U.S. (=0)
t OIBD/Asset Log Sales Log Employment Log Sales/Empl
0 0.043 (0.122) 0.101 (0.030) 0.004 (0.026) 0.050 (0.029)
1 -0.013 (0.033) 0.115 (0.039) -0.047 (0.034) 0.127 (0.031)
2 0.874 (1.790) 0.087 (0.044) -0.043 (0.041) 0.133 (0.031)
3 0.057 (0.020) 0.027 (0.048) -0.017 (0.048) 0.124 (0.033)
4 0.061 (0.048) 0.136 (0.052) 0.022 (0.049) 0.039 (0.032)
5 0.102 (0.051) 0.191 (0.060) 0.192 (0.056) 0.003 (0.031)
DCF (=1) and U.S. (=0)
t OIBD/Asset Log Sales Log Employment Log Sales/Empl
0 -0.011 (0.251) -0.056 (0.058) -0.079 (0.050) 0.007 (0.057)
1 0.012 (0.060) -0.217 (0.073) -0.194 (0.063) -0.029 (0.058)
2 0.978 (3.472) -0.303 (0.080) -0.346 (0.077) -0.032 (0.057)
3 0.027 (0.038) -0.285 (0.087) -0.243 (0.089) -0.243 (0.061)
4 0.101 (0.093) -0.389 (0.099) -0.086 (0.093) -0.438 (0.064)
5 0.132 (0.094) -0.272 (0.109) -0.261 (0.105) -0.167 (0.060)
DCF (=1) and ICF (=0)
t OIBD/Asset Log Sales Log Employment Log Sales/Empl
0 -0.047 (0.065) -0.149 (0.070) -0.084 (0.082) -0.036 (0.056)
1 0.033 (0.071) -0.316 (0.091) -0.147 (0.072) -0.141 (0.068)
2 0.067 (0.034) -0.383 (0.108) -0.296 (0.096) -0.152 (0.079)
3 -0.027 (0.031) -0.316 (0.131) -0.231 (0.137) -0.346 (0.094)
4 0.042 (0.042) -0.524 (0.129) -0.119 (0.124) -0.467 (0.083)
5 0.042 (0.031) -0.462 (0.121) -0.455 (0.131) -0.165 (0.081)