Embed Size (px)
Citation preview

International Journal of Modern Engineering Research (IJMER)
www.ijmer.com Vol.1, Issue.2, pp-371-384 ISSN: 2249-6645
www.ijmer.com 371 | P a g e
Dr. Mohammed W. Khadim Mechanical Engineering Dept.
Iraq Karbalaa University
Abstract: The effect of internal acoustic excitation on the aerodynamic characteristics of NACA 23015
airfoil have been investigated experimentally and numerically (computational and ready package
Fluent (6.1)) in the present work, as a function of excitation frequency and excitation location from the
leading edge. The solution of the flow equations are presented for an angle of attack range (14, 16, 18,
20 and 24) degrees, at excitation frequency values (100, 150 and 200) Hz, with the two-excitation
location from the leading edge (6.5% and 11.5%) of chord, at Reynolds number based on chord of
3.4x10⁵. The experimental tests are separately conducted in two suction, open-typed wind tunnels at the
Reynolds number based on chord of 3.4x10⁵ for the measurements and 1x10
4 for the visualization. The
results indicate that the excitation frequency and location are the key parameters for controlling the
separated flow, and the acoustic excitation technique is able to alter the flow properties and thus to
improve the aerodynamic performance. The most effective excitation frequency is found to be equal
150 Hz, which leads to increase the lift coefficient at 45% at the excitation location 6.5% chord and
35% at the excitation location of 11.5% chord, especially at the poststall region of angle of attack (16-
20) degree, with 10% increasing for the Lift/Drag coefficient.
THE EFFECT OF INTERNAL ACOUSTIC EXCITATION ON
THE AERODYNAMIC CHARACTERISTICS OF AIRFOIL AT
HIGH ANGLE OF ATTACKE
International Journal of Modern Engineering Research (IJMER)
www.ijmer.com Vol.1, Issue.2, pp-371-384 ISSN: 2249-6645
www.ijmer.com 372 | P a g e
Nomenclatures
Units Description Character
m2
Area A
Coefficients in Discretized Equations a snwe ,,,
M Chord Length C
m/s Speed of Sound C
Pressure Coefficient Cp
Non-Dimensional Coefficient for the Axial Force Ca
1/s modelk Constants in ,,,, 21 kCCC
W.s/m3
Sound Energy Density E
Hz Sound Frequency F
Metric Tensor Element ijg
Contraveriant Velocity Components G1,G2,G3
Geometric Quantities h1,h2
W/m2
Sound Intensity I
m2/s
2 Turbulent Kinetic Energy K
N/m2
Pressure P
Watt Sound Power Pac
Production Rate of Turbulent Kinetic Energy kP
Source Term S
Ucf Strouhal number = St
Linearized Source Term for S
Viscous Stress Tensor ijt
m/s Mean Velocity Components U,V
m/s Free-Stream Velocity U
m/s Cartesian Velocity Components u,v
m/s Velocity Vector u
m/s Velocity in Tensor Notation iu
m/s Covariant Velocity Components uu ,
Cartesian Coordinate x, y
Upper Surface Camber Line Coordinates in X-Y
Axis
xu, yu
Lower Surface Camber Line Coordinates in X-Y
Axis
xl, yl
N.s/m3
Acoustic Impedance Z
Subscripts
Faces of the control volume e, w, n, s
Free stream condition Dependent variable
Covariant components i=1, 2, 3, ..... I
Derivative with respect to curvilinear components ,
equation Refers to the source term of
equationk Refers to the source term of k

International Journal of Modern Engineering Research (IJMER)
www.ijmer.com Vol.1, Issue.2, pp-371-384 ISSN: 2249-6645
www.ijmer.com 373 | P a g e
Introduction: During the course of combat, take- off and landing of an aircraft, a wing- stall phenomenon
may occur when the aircraft is flying at a high angle of attack (AOA). This is due primarily to the
occurrence of flow separation over a large portion of the wing surface. As a result, the aerodynamic lift
is lost and the drag is increased dramatically. In order to keep the flow attached to the surface, the
boundary layer must have sufficient energy to overcome the adverse pressure gradients when it
occurred. Thus, the basic idea of the flow control herewith is to energize the boundary layer and
therefore suppress the flow separation.
The goal is to be able to control the separated flow over an airfoil. For that matter, are should
clarify the difference between separated flow control (strong) and flow separation control (weak). Both
imply the condition of a detached flow, but in a different flow scale. [1] makes a clear distinction
between these two flow fields as shown in figure (1):-
Fig. (1) Flow Field Classification
Summarized below are some ideas and experiments proven to be effective on suppressing the
massive separation [2].
- Airfoil Performance: flaps +Slats,
- Standford airfoils,
- Wall transpiration/ suction,
- Momentum injection,
- Moving Walls,
- Turbulators, and
- Wall heating/ cooling.
It was found that sound at particular frequencies and intensities could change the transition
process of boundary layer [3]. The flow field exhibits different characteristics, and the momentum
exchange is enhanced due to the introduction of the acoustic waves. In accordance with this
observation, the control of flow with vertical structures using acoustic excitation techniques has been
studied extensively in recent years.
One of the techniques is called the external acoustic excitation, in which the sound is radiated
onto the wall from a source outside the flow system. This technique has been applied by several
Separating/ separated flow
Weak Separation Strong Separation
Separated Flow control Separation Flow control
Passive Active
- Optimal shape
- Vortex generators
- Vibrating flaps
- Acoustic excitation
- Suction and / or Blowing
(steady or periodic)

International Journal of Modern Engineering Research (IJMER)
www.ijmer.com Vol.1, Issue.2, pp-371-384 ISSN: 2249-6645
www.ijmer.com 374 | P a g e
researchers, first observed that the application of the external acoustic excitation could change the lift
on the airfoil. Further studies of the interaction between the external acoustics and the separated flow
were carried out, they pointed out that the entrainment was enhanced by the sound-induced velocity
rather than the sound pressure.
However, it was found that the external excitation became effective only when the excitation
frequency was close to the tunnel resonance frequency. Furthermore, the external excitation requires
high sound pressure levels in order to achieve satisfactory results [4]. Hence, the external acoustic
excitation appears impractical for actual applications.
To overcome those drawbacks, an internal excitation technique is used, in which the sound is
emanated from a narrow opening on the wall surface. Some researchers mentioned the use of sound
emission from small holes on the suction surface, but no quantitative results were presented.
Peterka, J.A., and Peter, P.D. [5] using a circular cylinder in cross – flow with a transverse
standing demonstrated the first practical application of the external acoustic excitation for the boundary
layer control, sound field imposed simultaneously. In the presence of sound field having its frequency
matched sufficiently closely to that occurring naturally in the shear layer, the growth of the instability
in the shear layer is enhanced, and the heat transfer from a body under separated flow can be increased.
Ahuja and Jones 1983 studied the effects of the external acoustic excitation on the turbulent
boundary layer characteristics over an airfoil as a function of excitation frequency and level and flow
velocity. The experiments successfully demonstrated that separation of turbulent boundary layer flows
can be controlled by sound in both pre- and post- stall regions.
Zaman, et.al, [4] carried out wind- tunnel measurements of lift, drag and wake velocity spectra
under external acoustic excitation for a smooth symmetrical (airfoil) at Reynolds numbers based on
chord range of (4*104 – 1.4*105). Excitation frequencies in the range St ≤5 are found to be effective at
Rec= 4*104. Amplitudes only a few dB above the background level being sufficient to produce the
effect. For α≥ 18°, during post- stall, significant increase in CL (and CL/ CD) is also achieved.
Ahmed, N. A. and Archer, R. D., [6] studies experimentally the post stall behavior of a wing
under externally imposed sound. At α = 19 degree, the affect of sound is observed at a smaller
frequency range of 200 <f < 1200Hz, and the improvement are less pronounced with up to 15%
increase in lift and 10% decrease in drag being observed.
Ishii, et.al, [7] studied the effect of acoustic waves with different frequencies on the flow over
a wing with a NACA 0012 section at angle of attack = 12◦ for two Reynolds numbers Re = 5 ×
104 and 1 × 10⁵. For these Reynolds numbers the flow separates from the leading edge. It is shown that
the acoustic waves with appropriate frequencies make time-averaged lift coefficients higher. In the
effective frequency range, the maximum vorticity in the laminar boundary layer of the airfoil becomes
larger.
Yarusevych, et.al, [8] studied experimentally the boundary layer separation and wake
structure of a NACA 0025 airfoil and the effect of external excitations in presence of structural
vibrations on airfoil performance. The results establish that external acoustic excitation at a particular
frequency and appropriate amplitude suppresses or reduces the separation region and decreases the
airfoil wake. The acoustic excitation also alters characteristics of the vertical structures in the wake,
decreasing the vortex length scale and coherency.
For the internal acoustic excitation technique, Collins, F. G., [9] examined experimentally the
effect of sound emitted from periodically spaced holes near the wing leading edge, upon the flow over
two low- speed wings, with camber (NACA 2142) and (NACA 0015). This technique found to have a
beneficial effect upon the aerodynamic properties of these airfoils. It could be used to improve the low-
speed lift and stall performance of light aircraft during take off and landing and could be used for stall/
flutter suppression on rotor and propeller blades.
Hsiao, F. B., and Shyu, R. N., [10] explored the control of a wall- separated flow on a five-
digit NACA airfoil and a circular cylinder by using the internal acoustic excitation technique.
Throughout the experiments, the sound pressure level was always kept at the value of 95dB measured
at the slot exit with the effective frequencies ranging from 100 to 400 Hz. Data indicated that the
excitation frequency and the forcing location are the key parameters for controlling the separated flow,
and the forcing level is the least- effective parameter.
Hsiao, F. B., and Shyu, J. Y., [11] studied the separated flow properties and corresponding
aerodynamic behaviors of a high AOA, 63- 018 NACA airfoil under internal acoustically pulsing
excitation in a subsonic wind tunnel. The experimental results show the following.
1. The shear layer instability frequency, which, increases with increasing Reynolds number,
is easily excited by a periodic pulsing fluctuation at the same frequency.
2. For the low post- stall angle airfoil performance (AOA= 18- 24), the leading edge flow
separation is suppressed by excitation of a frequency near the shear layer instability.

International Journal of Modern Engineering Research (IJMER)
www.ijmer.com Vol.1, Issue.2, pp-371-384 ISSN: 2249-6645
www.ijmer.com 375 | P a g e
3. The most effective forcing frequency for improving the aerodynamics properties is to
match the vortex shedding frequency in the wake.
Khuder, N. A., [12] studied experimentally the influence of internal acoustic excitation with
changing the excitation position on the aerodynamic coefficients for the five digit (NACA 23015)
airfoil. For the two-excitation position (6% chord and 11.5% chord) and a certain value of Reynolds
number (3x10⁵), at angles of attack values (3
o, 6
o, 9
o and 12
o) tests were done. The tests showed that
the internal acoustic excitation at a certain frequency (150 Hz) improving aerodynamic performance.
The present study investigates the effectiveness of the internal acoustic excitation technique
and the position of the excitation on the separated flow properties and its relevant aerodynamic
performance on an airfoil. NACA 23015 airfoil have been investigated experimentally and
numerically. The solution of the flow equations are presented for an angle of attack range (14, 16, 18,
20 and 24) degrees, at excitation frequency values (100, 150 and 200) Hz, with the two-excitation
location from the leading edge (6.5% and 11.5%) of chord, at Reynolds number based on chord of
3.4x10⁵.
Mathematical and Numerical Formulation: In order to analyze the flow field around airfoils with acoustic excitation, a solution of Navier-
stokes equations is required. Because of the complexity of airfoils configurations and the strong
viscous effects, it is impossible to obtain an analytical solution of the Navier- stokes equation for
practical configurations. Thus, numerical techniques have to be used to solve those equations. The need
for the full Navier- stokes simulation of complex fluid flows arises in numerous engineering problems.
The five digits NACA, which is used in the present work (see figure (4)) is defined completely by the
formula below; the thickness distribution is:-
432
5075.04215.17580.16300.04845.1)(c
x
c
x
c
x
c
x
c
xcxT ...(1)
Where, c is the airfoil chord and x is the distance along the chord line from the leading edge. The
parameter is the thickness ratio of the airfoil (maximum thickness/chord).
Flow equations (momentum, continuity and turbulence model equations) for steady two-
dimensional flow are solved at the present work for the NACA 23015 airfoil model with the effect of
internal acoustic excitation.
-Assumptions:
In the present work, the working fluid is air and the flow characteristics are assumed to be as
follows,
Steady state,
Newtonian,
Incompressible,
Two dimensional and
Isentropic flow.
The general partial differential equation (i.e. sometimes called transport equations) for
continuity, momentum and ( ) model, have the form [13]:-
S yxyyxx
yx vu,
….. (2)
The arrangement (
) identifies the dependent variable, ( ) is the exchange coefficient for
variable (
) and (S yx, ) is the source term.
In order to solve the governing equations of motion in the computational space, a
transformation of the equation (2) expressed in the Cartesian coordinate system (x,y) from physical
space into computational space ( , ) is required, which can be written as :-
S newaJaJGG
2121 ..... (3)
Computational solutions are obtained in the present work on staggered grid. This implies that
different dependent variables are evaluated at different grid points. Peyret, R. and Taylor, T. D., [14]
compare various staggered grid for the treatment of the pressure.
International Journal of Modern Engineering Research (IJMER)
www.ijmer.com Vol.1, Issue.2, pp-371-384 ISSN: 2249-6645
www.ijmer.com 376 | P a g e
The simplest grid generation technique is the algebraic method which is used in the FLUENT
6.1 for the present work.
-Implementation of Boundary Conditions:
-Inlet Boundary Conditions:
An approximation for the inlet distribution for and can be obtained from turbulent
intensity (Ti), typically 1-6 %, and a characteristic length (L) by means of the following simple
assumed forms.
2
2
3uTi
... (4)
l
kC 23
93
... (5)
Ll 07.0 ... (6)
The fluid properties at the inlet were the atmospheric air properties with Reynolds number
value based on the chord of (3.4x10⁵).
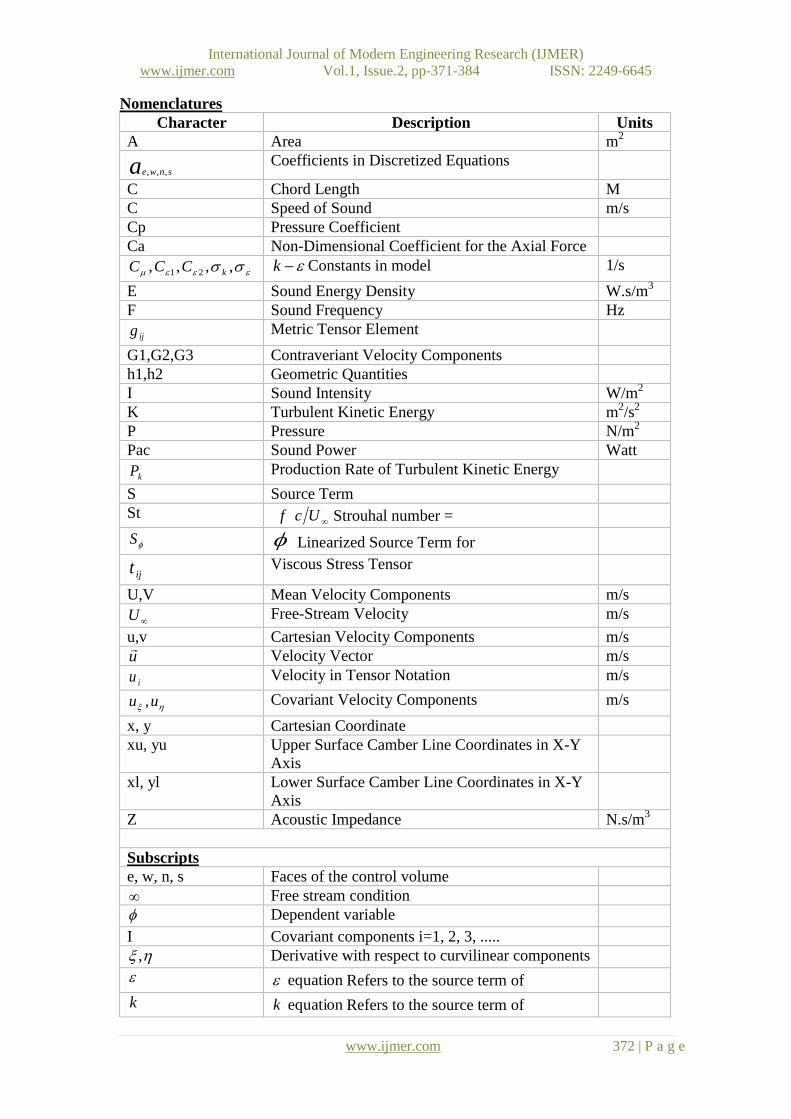
-The Boundary Conditions at the Wall:
The sound pressure is the input condition at the wall for the present work,
which is calculated according to the corresponding acoustic excitation frequency
used. See table (1)
Table (1) Sound Pressure Values According To Sound Frequencies
Apparatus, Experimental Set up and Method of Investigation: -Experimental Apparatus:
Subsonic Wind tunnel
Smoke Wind tunnel -Instrumentations of local flow:
Pitot - static tube
Static Tube
Multi-Tube Manometer
-Sound Excitation Cycle (see figure (2)):
Function Generator
Power Amplifier
Microphone
Frequency Meter
Speaker in an Isolated Wood Box.
See figure (3).
Fig. (2) Excitation Cycle
Frequency
(Hz)
Pressure
(Pa)
50 0.14278
100 0.14278
150 0.14266
200 0.14253
250 0.14227
300 0.14227
350 0.14266
400 0.14253
450 0.14189
500 0.14227

International Journal of Modern Engineering Research (IJMER)
www.ijmer.com Vol.1, Issue.2, pp-371-384 ISSN: 2249-6645
www.ijmer.com 377 | P a g e
Fig. (3) Excitation box
The experimental work is performed on models A and B for the open loop wind tunnel tests,
and on models C and D for the flow visualization tests see figure (4).
MODEL (A)
MODEL (B)
MODEL (D) MODEL (C)
Fig. (4) Model A, B, C, and D Airfoils.

International Journal of Modern Engineering Research (IJMER)
www.ijmer.com Vol.1, Issue.2, pp-371-384 ISSN: 2249-6645
www.ijmer.com 378 | P a g e
For the wind tunnel tests the experiments are conducted to measure the pressure distribution at
the (16) upper and (8) lower taps of the models A and B.
First, the sound pressure level (SPL) was measured at the exit of the forcing slot by a CEL-254
digital sound level meter, with no flow blowing. SPL is always kept at the value of (78) dB measured at
the slot exit (it is found that the variation of the pressure distribution due to the sound pressure level
change is not so significant when compared to that of the frequency changes [10]).
There are three main testing conditions:
(1) Taped slot and no excitation.
(2) Open slot with no excitation.
(3) Open slot with different excitation frequencies.
The first two cases provided a baseline for comparisons.
For the above three testing conditions wind tunnel tests are carried out at Reynolds number
(3.4x10⁵)
based on chord. Over models A and B, the angle of attack was varied from 14o to 24
o, by a
step 3o, and the excitation frequency for each angle was varied from 50 Hz to 500 Hz, by a step 50 Hz.
The flow visualization was done for the three conditions mentioned with model C and D, and
the flow pattern was photographed. Tests are done for a certain value of Reynolds number (1 x 10⁴
)
based on the chord, and constant sound pressure level (78 dB).
Results and Discussions:
- Experimental Results: The comparison of the surface pressure coefficients distributions without excitation and with
excitation at frequencies (50, 150, and 300) Hz for the excitation locations (11.5%, and 6.5%) of chord
are presented in figures (5a-5b) and (6a-6b), respectively.
(5a) (6a)
(5b) (6b)
(5c) (6c)
-1.5
-1
-0.5
0
0.5
1
1.5
2
2.5
0 0.2 0.4 0.6 0.8 1
X/C (Percent Chord)
Cp
(P
res
su
re C
oe
ffic
ien
t)
-1
-0.5
0
0.5
1
1.5
2
2.5
3
0 0.2 0.4 0.6 0.8 1
X/C (Percent Chord)
Cp
(P
res
su
re C
oe
ffic
ien
t)
-1.5
-1
-0.5
0
0.5
1
1.5
2
2.5
3
0 0.2 0.4 0.6 0.8 1
X/C (Percent Chord)
Cp
(P
res
su
re C
oe
ffic
ien
t)
-1.2
-0.8
-0.4
0
0.4
0.8
1.2
1.6
0 0.2 0.4 0.6 0.8 1
X/C (Percent Chord)
Cp
(P
res
su
re C
oe
ffic
ien
t)
-1.2
-0.8
-0.4
0
0.4
0.8
1.2
1.6
0 0.2 0.4 0.6 0.8 1
X/C (Percent Chord)
Cp
(P
res
su
re C
oe
ffic
ien
t)
-1.2
-0.8
-0.4
0
0.4
0.8
1.2
1.6
0 0.2 0.4 0.6 0.8 1
X/C (Percent Chord)
Cp
(P
res
su
re C
oe
ffic
ien
t)
Fig. (5)
Experimental Pressure Coefficients
Distribution 11.5% chord 14 Deg.
Fig. (6)
Experimental Pressure Coefficients
Distribution
6.5% chord 14 Deg.
International Journal of Modern Engineering Research (IJMER)
www.ijmer.com Vol.1, Issue.2, pp-371-384 ISSN: 2249-6645
www.ijmer.com 379 | P a g e
The larger suction peak area will result in a substantial contribution to the lift for the
enhancement of the flow mixing and momentum transport due to internal excitation produces a suction
peak at the leading edge of the upper surface of the airfoil. The suction peaks results in an increase of
lift.
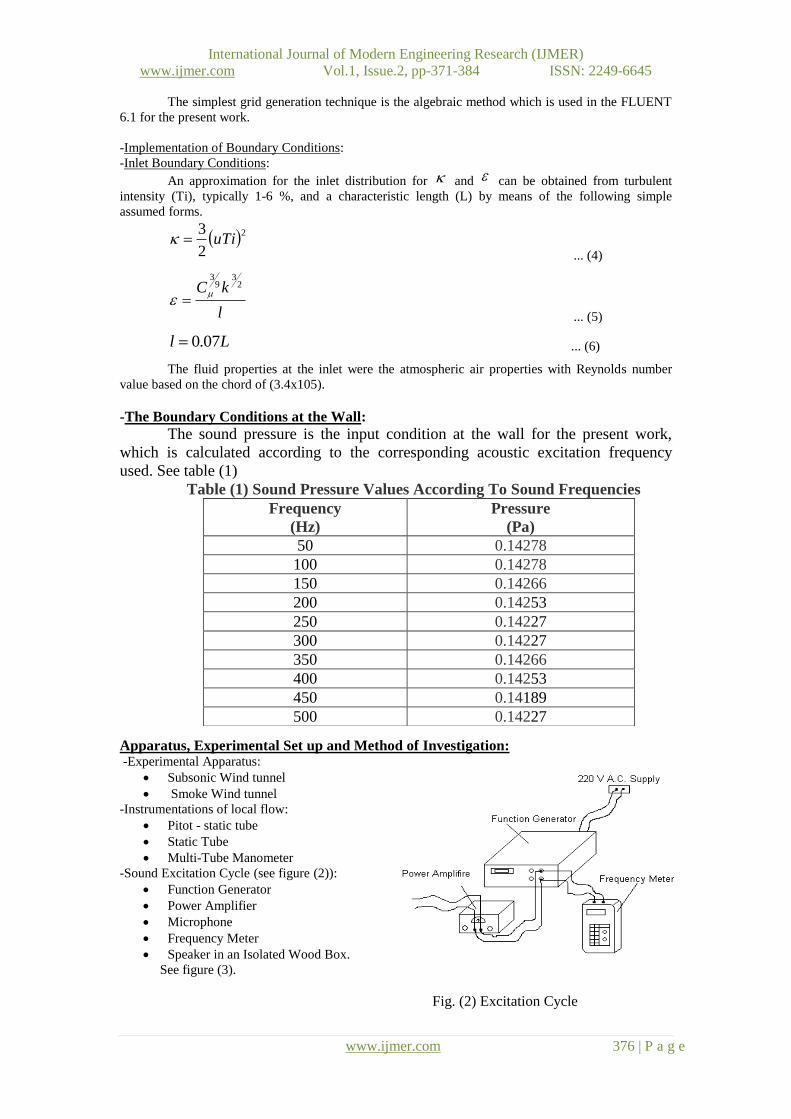
Figure (7) depicts the dependence of lift on the
excitation location at angle of attack range (0-24) degrees
It can be seen that effectiveness of the boundary
layer control with internal excitation strongly depends on the
excitation location, and excitation at a location close to the
separation point is the most effective, especially
in the post stalled region.
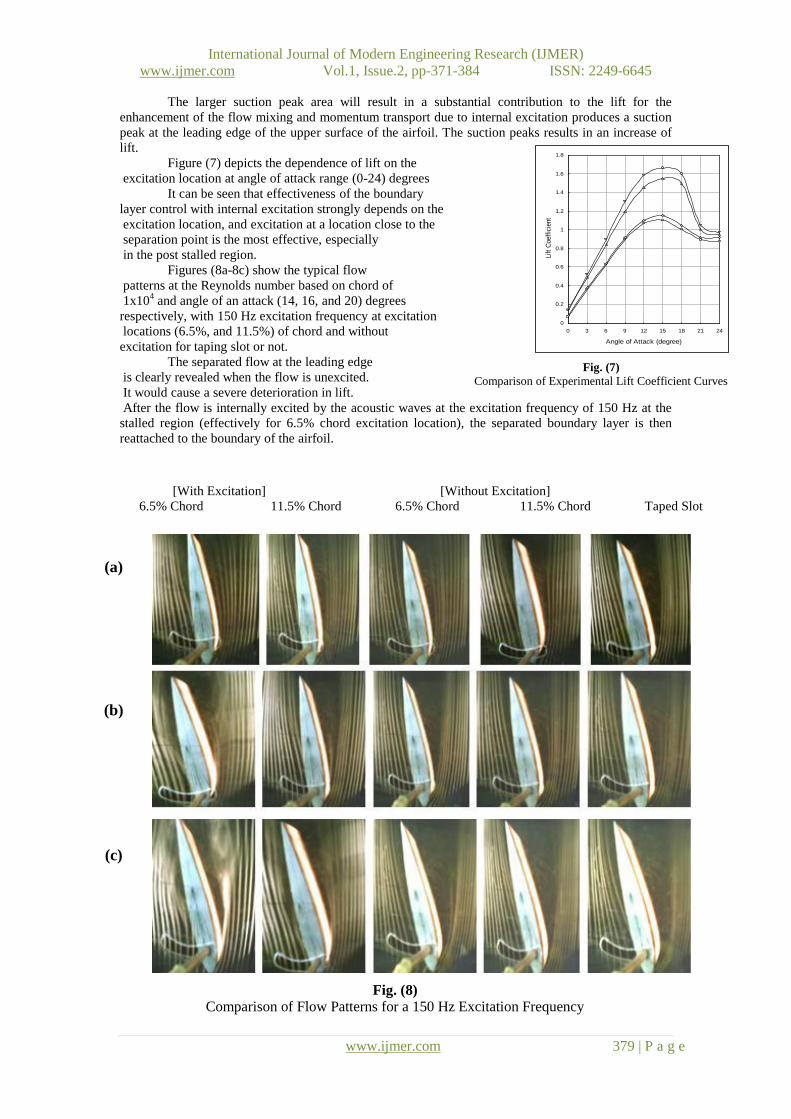
Figures (8a-8c) show the typical flow
patterns at the Reynolds number based on chord of
1x10⁴ and angle of an attack (14, 16, and 20) degrees
respectively, with 150 Hz excitation frequency at excitation
locations (6.5%, and 11.5%) of chord and without
excitation for taping slot or not.
The separated flow at the leading edge
is clearly revealed when the flow is unexcited.
It would cause a severe deterioration in lift.
After the flow is internally excited by the acoustic waves at the excitation frequency of 150 Hz at the
stalled region (effectively for 6.5% chord excitation location), the separated boundary layer is then
reattached to the boundary of the airfoil.
0
0.2
0.4
0.6
0.8
1
1.2
1.4
1.6
1.8
0 3 6 9 12 15 18 21 24
Angle of Attack (degree)
Lift
Coeff
icie
nt
Fig. (7)
Comparison of Experimental Lift Coefficient Curves
[With Excitation] [Without Excitation]
6.5% Chord 11.5% Chord 6.5% Chord 11.5% Chord Taped Slot
Fig. (8)
Comparison of Flow Patterns for a 150 Hz Excitation Frequency
(a)
(b)
(c)

International Journal of Modern Engineering Research (IJMER)
www.ijmer.com Vol.1, Issue.2, pp-371-384 ISSN: 2249-6645
www.ijmer.com 380 | P a g e
The separated flow at the leading edge is clearly revealed when the flow is unexcited. It would
cause a severe deterioration in lift. After the flow is internally excited by the acoustic waves at the
excitation frequency of 150 Hz at the stalled region (effectively for 6.5% chord excitation location), the
separated boundary layer is then reattached to the boundary of the airfoil. The reattached boundary
layer will certainly ensure the lift recovery. In addition, since the wake region is narrowed due to the
boundary-layer reattachment, the drag will be reduced accordingly. A narrower wake with a smaller
profile defect indicates a less momentum loss, which insures a smaller drag coefficient.
The typical patterns of velocity vector and streamlines are presented in figure (9) for the case
of without excitation and with excitation for two excitation locations (6.5%, and 11.5%) of chord at
excitation frequency 150 Hz.. At the prestalled region, the boundary layer remains attached over the
entire lower surface of the airfoil but it separates somewhere near the rear surface of the upper surface.
At the poststalled region, the fluid particles are forced outwards from the wall and form a separated
region. In general the fluid particles behind the point of separation follow the pressure gradient and
move against the direction of the main flow (the appearance of vorticity in fluids). The flow separation
occurs over a major portion of the upper surface of the airfoil which is around (60-70) percentage of
the chord (high wake region). Therefore, controlling of the boundary layer is the supplying of
additional energy to the boundary layer by an effective excitation frequency (150 Hz), thus enabling
the boundary layer to proceed further against an adverse pressure gradient (delay of separation point).
Narrower wake region can be seen at excitation location (6.5% of chord).
6.5%Chord
11.5%Chord
Taped slot
Fig. (9) Numerical Flow Patterns (Velocity Vectors and Streamlines) for 23015 NACA Airfoil at
Angle of Attack 21o without Excitation and at 150 Hz Excitation Frequency for (11.5%,
6.5%) Chord Excitation Location
International Journal of Modern Engineering Research (IJMER)
www.ijmer.com Vol.1, Issue.2, pp-371-384 ISSN: 2249-6645
www.ijmer.com 381 | P a g e
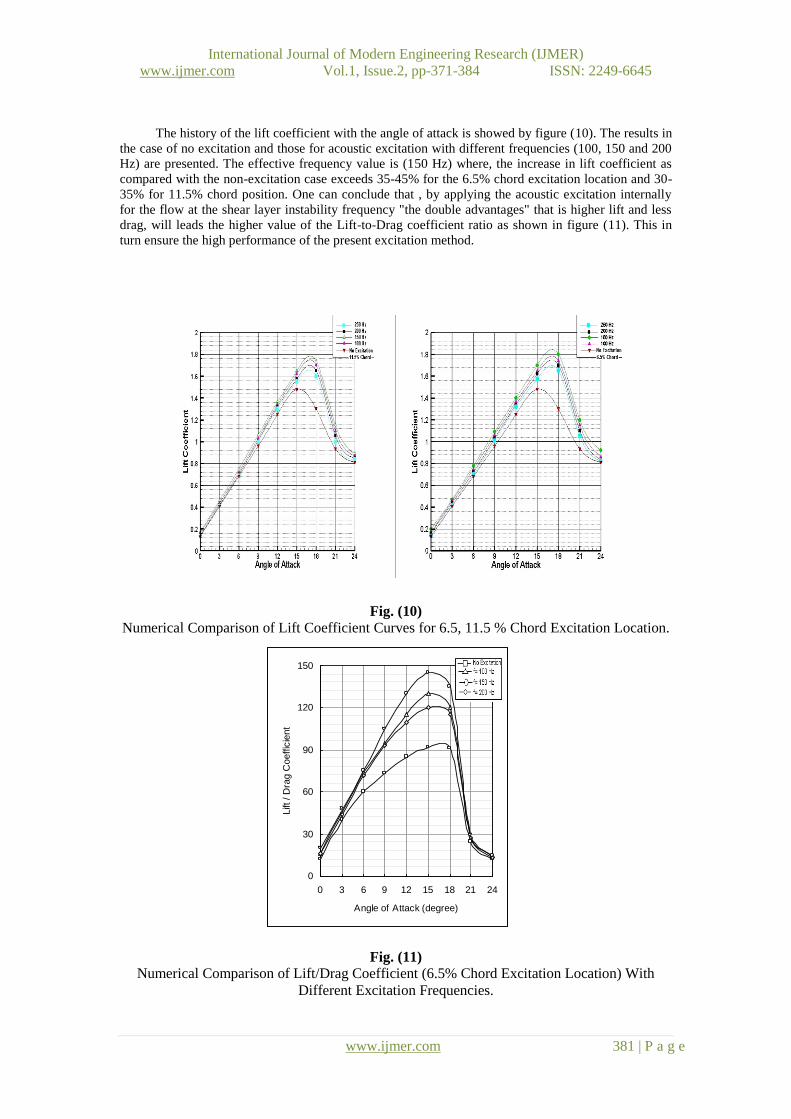
The history of the lift coefficient with the angle of attack is showed by figure (10). The results in
the case of no excitation and those for acoustic excitation with different frequencies (100, 150 and 200
Hz) are presented. The effective frequency value is (150 Hz) where, the increase in lift coefficient as
compared with the non-excitation case exceeds 35-45% for the 6.5% chord excitation location and 30-
35% for 11.5% chord position. One can conclude that , by applying the acoustic excitation internally
for the flow at the shear layer instability frequency "the double advantages" that is higher lift and less
drag, will leads the higher value of the Lift-to-Drag coefficient ratio as shown in figure (11). This in
turn ensure the high performance of the present excitation method.
Fig. (10)
Numerical Comparison of Lift Coefficient Curves for 6.5, 11.5 % Chord Excitation Location.
Fig. (11)
Numerical Comparison of Lift/Drag Coefficient (6.5% Chord Excitation Location) With
Different Excitation Frequencies.
0
30
60
90
120
150
0 3 6 9 12 15 18 21 24
Angle of Attack (degree)
Lift
/ D
rag C
oeffic
ient

International Journal of Modern Engineering Research (IJMER)
www.ijmer.com Vol.1, Issue.2, pp-371-384 ISSN: 2249-6645
www.ijmer.com 382 | P a g e
There are two factors of flow affecting separation, the adverse pressure gradient and viscosity.
The control of separation can be achieved by changing or maintaining the structure of viscous flow so
that these two governing factors prevent or delay the separation. Figure (12) shows the effect of the
internal acoustic excitation on the boundary layer growth where, it causes the reattachment to move the
suction peak at the leading edge downstream, thus reducing the pressure gradient.
Fig. (12)
Turbulent Viscosity Contours for 23015 NACA Airfoil at Angle of Attack 21o and 150 Hz
Excitation Frequency
11.5% chord
6.5% chord
Taped Slot

International Journal of Modern Engineering Research (IJMER)
www.ijmer.com Vol.1, Issue.2, pp-371-384 ISSN: 2249-6645
www.ijmer.com 383 | P a g e
Comparisons between the results of the experimental, numerical and Fluent (6.1), of lift and
drag coefficients for the case of 6.5% and 11.5% of chord excitation location with (150 Hz) excitation
frequency are shown in figures (13) and (14). It is found that the results of computational work agree
well with the results obtained by Fluent (6.1), but the experimental results are around 20% lower than
the numerical results at the maximum lift point. This difference may be due to errors in measurements
and the environmental conditions at the libratory (temperature, humidity, air movement and noise),
they all change continuously during the test time and this should affect the results. In addition, the
numerical work has been done for the free stream conditions while; the experimental work was
bounded by the wind tunnel conditions.
0
0.2
0.4
0.6
0.8
1
1.2
1.4
1.6
1.8
0 3 6 9 12 15 18 21 24
Angle of Attack (degree)
Lift
Coeffic
ient
0
0.2
0.4
0.6
0.8
1
1.2
1.4
1.6
1.8
2
0 3 6 9 12 15 18 21 24
Angle of attack (degree)
Lift
Coeffic
ient
0
0.05
0.1
0.15
0.2
0.25
0.3
0.35
0 3 6 9 12 15 18 21 24
Angle of attack (degree)
Dra
g C
oeffic
ient
0
0.05
0.1
0.15
0.2
0.25
0.3
0 3 6 9 12 15 18 21 24
Angle of Attack (degree)
Dra
g C
oeffic
ient
Fig. (13)
Comparison of Lift Coefficient for 6.5%
Chord Excitation Location and 150 Hz
Excitation Frequency for Numerical,
Fluent (6.1) and Experimental Results
Fig. (14)
Comparison of Lift Coefficient for 6.5%
Chord Excitation Location and 150 Hz
Excitation Frequency for Numerical,
Fluent (6.1) and Experimental Results
International Journal of Modern Engineering Research (IJMER)
www.ijmer.com Vol.1, Issue.2, pp-371-384 ISSN: 2249-6645
www.ijmer.com 384 | P a g e
Conclusions and Suggestions:
1. The enhancement of the flow mixing and momentum transport due to internal acoustic
excitation produces a suction peak at the leading edge of the upper surface of the airfoil. The
suction peak results in an increase of lift and narrower wake.
2. By the flow visualization, it is found that the locally introduced unsteady vorticity causes the
separated boundary layer to be reattached to the surface.
3. The internal acoustic excitation energizes the boundary layer, this leads to decrease the
turbulent kinetic energy at the upper surface of the airfoil.
4. The results suggested that there is a critical excitation frequency (150 Hz).
5. The excitation location is the most affected parameter on the internal acoustic excitation
technique and the results indicated that, the excitation location close to the leading edge is the
more efficient. Internal acoustic excitation at 6.5% of chord lead to increase lift by 45% while,
the 11.5% of chord excitation location gives only 35% increase.
References: 1- Miranda, S., "Active control of separated flow over a circular-arc airfoil," M. Sc.
Theses, Blacksburg, Virginia, May 8, 2000.
2- Thomas, T. G., and Tutty, O. R., "Flow Control," AA407/SE603 Flow Control 24 Lectures
in Semester 1, 2003.
3- Schubauer, G. B., and Skramstad, H. K., "Laminar boundary layer transition on a flat
plate," NACA report, 909, 1948.
4- Zaman, K. B. M. Q., Bar-Sever, A., and Mangalarn, S. M., "Effect of acoustic excitation
on the flow over a low-Re airfoil," J. Fluid Mech., vol. 182, pp. 127-148. , 1987
5- Peterka, J.A., and Peter, P.D., "Effect of sound on separated flows," J. Fluid mech., vol.
37, part 2, pp.265-287, (1968).
6- Ahmed, N. A. and Archer, R. D., " Poststall behavior of a wing under externally
imposed sound, " J. Aircraft, vol. 38, No. 5, pp.961, (2001).
7- Ishii, K., Suzuki, S., and Adachi, S., "Effect of weak sound on separated flow over
airfoil," Fluid Dynamic Research 33, 357-371, (2003).
8- Yarusevych, S., Kawall, J. G., and Sullivan, P. E., "Airfoil performance at low Reynolds
numbers in the presence of periodic disturbances," Journal of fluids engineering, vol.
128/587, May (2006).
9- Collins, F. G., "Boundary-Layer control on wings using sound and leading-edge
serrations," AIAA Journal, vol. 19, No. 2, pp. 129. 1981.
10- Hsiao, F. B., and shyu, R. N., "The effect of acoustic on flow passing a high-AOA
airfoil," Journal of sound and vibration 199 (2), 177-188, (1997).
11- Hsiao, F. B., and Shyu, J. Y., "Control of wall-separated flow by internal acoustic
excitation," AIAA Journal, vol.28, No.8, pp.1440, 1989.
12- Khuder, N. A., "Improvement of the aerodynamic performances using the internal
acoustic excitation," M. Sc. Theses, Mechanical Department, Univ. of Tech., Iraq (2009).
13- Roache, P. J., "Computational Fluid Dynamics," Hermosa Publishers, Albuquerque,
1972.
14- Peyret, R. and Taylor, T. D., "Computational methods for fluid flow," Springer, New
York, 1983.