Embed Size (px)
Citation preview
1
The Effect of Insulin Dysregulation and Breed on HPA Axis Function and
Plasma Cortisol Binding Dynamics in Ponies and Horses
Hart KA, Vaughn S, Norton NA
Department of Large Animal Internal Medicine, University of Georgia College of
Veterinary Medicine, Athens, GA
Mechanisms resulting in breed predispositions to insulin dysregulation (ID) and
endocrinopathic laminitis are poorly characterized. The adrenal steroid cortisol
antagonizes insulin, and free, biologically active cortisol can be increased in ID.
Breed-related differences in serum free cortisol fraction (FCF) could contribute to ID
in pre-disposed breeds such as ponies, but FCF has not been quantified in ID-
predisposed-breeds. The objective of this study was to compare FCF between
horses and ponies during health and ID. We hypothesized: 1) in health, FCF is
higher in ponies than horses; and 2) FCF is further increased in ponies with ID.
Serum total cortisol (TC), ACTH, FCF and insulin were measured in 36 horses (age
1-24 years) and 31 mixed-breed ponies (age 4-27 years). Animals were sampled
before morning feeding in their normal routine, and ID defined as fasted insulin >
20 μIU/ml or non-fasted insulin > 60 μIU/ml for animals sampled on pasture. Data
were compared with Mann-Whitney tests and Spearman correlation analysis
(P<0.05). TC and FCF were comparable in healthy horses and ponies, but ACTH and
insulin concentrations were 1.3-1.6-fold higher in ponies (P=0.001-0.041). In
animals with ID, TC was similar but FCF and insulin were increased 1.6-fold and
3.2-fold respectively in ponies (n=9) compared to horses (n=11, P=0.01-0.049),
and FCF and insulin were positively correlated (P=0.04, r=0.45, 95%C.I=0.014-
0.746). These data demonstrate differences in hypothalamic-pituitary-adrenal axis
function during health and ID between ponies and horses. Further study is needed
to determine if and how such alterations impact insulin regulation and, ultimately,
laminitis risk.
2
Pro-Hormone Processing in PPID
Carmalt JL, Mortazavi S, McOnie R and Unniappan S
Department of Veterinary Biomedical Sciences , Western College of Veterinary
Medicine, University of Saskatchewan, Saskatoon, S7N5B4, CANADA
PPID is characterized by proliferation of melanotropes within the pars intermedia
(PI) of the pituitary gland and increased production of pro-opiomelanocortin
(POMC). POMC is cleaved by pro-hormone convertases (PC1 and PC2) to produce
its derivatives, including adrenocorticotropic hormone (ACTH). Dysregulation of PC1
and PC2 occurs in the absence of dopamine inhibition and results in overabundance
of ACTH, along with impairment in conversion of ACTH to αMSH and CLIP in mice.
The main objective of this study was to determine whether mRNAs encoding POMC,
PC1 and PC2 in the pituitary gland are altered in PPID horses.
Pituitaries of 6 PPID and 6 normal horses were collected immediately postmortem
and snap frozen. Total RNA was extracted and cDNAs were synthesized. PCRs were
conducted using validated primers for POMC, PC1 and PC2 obtained using GenBank
predicted sequences. Nine internal control genes were tested and the most stable
(18s) was used as the internal control gene. Quantification of POMC, PC1 and PC2
mRNAs were performed using RT-qPCR. Results showed that horses with PPID had
a significantly increased expression of POMC, PC1 and PC2 mRNAs. There was not a
significant difference between the degree of upregulation between PC1 and PC2. In
conclusion, upregulation of POMC, PC1 and PC2 in equine PPID appears to
contribute to the elevated ACTH concentrations in the diseased state.
3
The Effect of Geographic Location on Circannual Adrenocorticotropic
Hormone Plasma Concentrations in Australian Horses
Secombe CJa, Tan RHHb, Perara DIa, Byrne DPa, Watts SPb, Wearn Jb.
Murdoch University, Perth, WA, AUSa;James Cook University,Townsville, QLD, AUSb.
Northern hemisphere research has documented lower, quiescent, endogenous ACTH
levels from mid-July to mid-November with dynamic changes in the alternate half of
the year, peaking at the autumn equinox. Longitudinal evaluation of individual
horses in the southern hemisphere has not been undertaken to establish if similar
reference intervals (RI) and circannual rhythm occurs.
This study involved 40 normal horses at each of two locations 31°57’S, 115°52’E
(Perth, southern Australia) and 19°26’S, 146°81E (Townsville, northern Australia).
ACTH was measured at approximately the same time of day/month for 12
consecutive months and monthly and grouped RI generated.
A quiescent period of ACTH was observed at both sites, with the southern Australia
location having a shorter period with lower upper reference limits compared to the
northern Australian location. However, upper reference limits at both locations
during this period were higher than those previously reported (43pg/ml Perth,
67pg/ml Townsville). The duration of the dynamic phase differed at each location,
but peaked at the autumn equinox with upper reference limits similar between both
Australian locations and northern hemisphere studies (100pg/ml). During the
dynamic phase, ACTH was more variable in normal horses compared to the
quiescent phase and, occasionally, spurious elevations occurred.
It was concluded that, similar to the Northern Hemisphere, circannual ACTH
rhythmicity is associated with changing day length. Quiescent ACTH levels in
normal horses appear to be higher in Australia with smaller differences between
quiescent and dynamic phases the closer the location to the equator, the latter
possibly reflecting reduced circannual day length variation.
4
Is Equine Pars Intermedia Activity Subdued in the Spring?
Andy Durham
Liphook Equine Hospital, UK
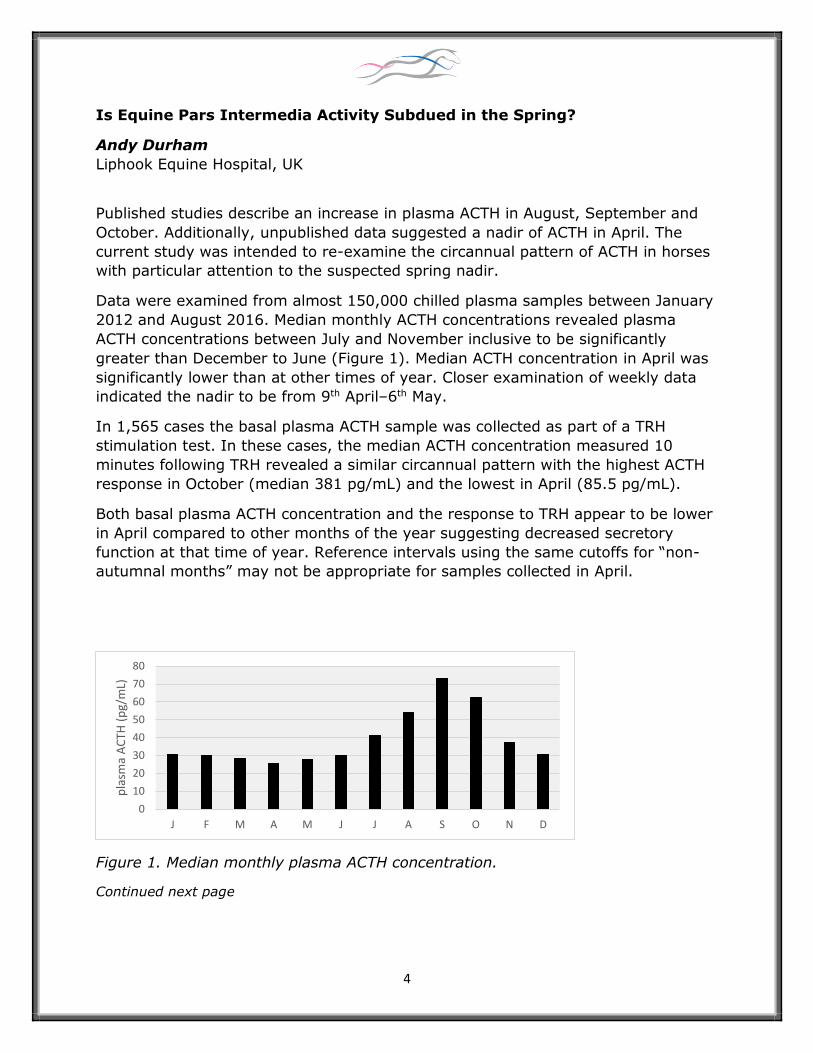
Published studies describe an increase in plasma ACTH in August, September and
October. Additionally, unpublished data suggested a nadir of ACTH in April. The
current study was intended to re-examine the circannual pattern of ACTH in horses
with particular attention to the suspected spring nadir.
Data were examined from almost 150,000 chilled plasma samples between January
2012 and August 2016. Median monthly ACTH concentrations revealed plasma
ACTH concentrations between July and November inclusive to be significantly
greater than December to June (Figure 1). Median ACTH concentration in April was
significantly lower than at other times of year. Closer examination of weekly data
indicated the nadir to be from 9th April–6th May.
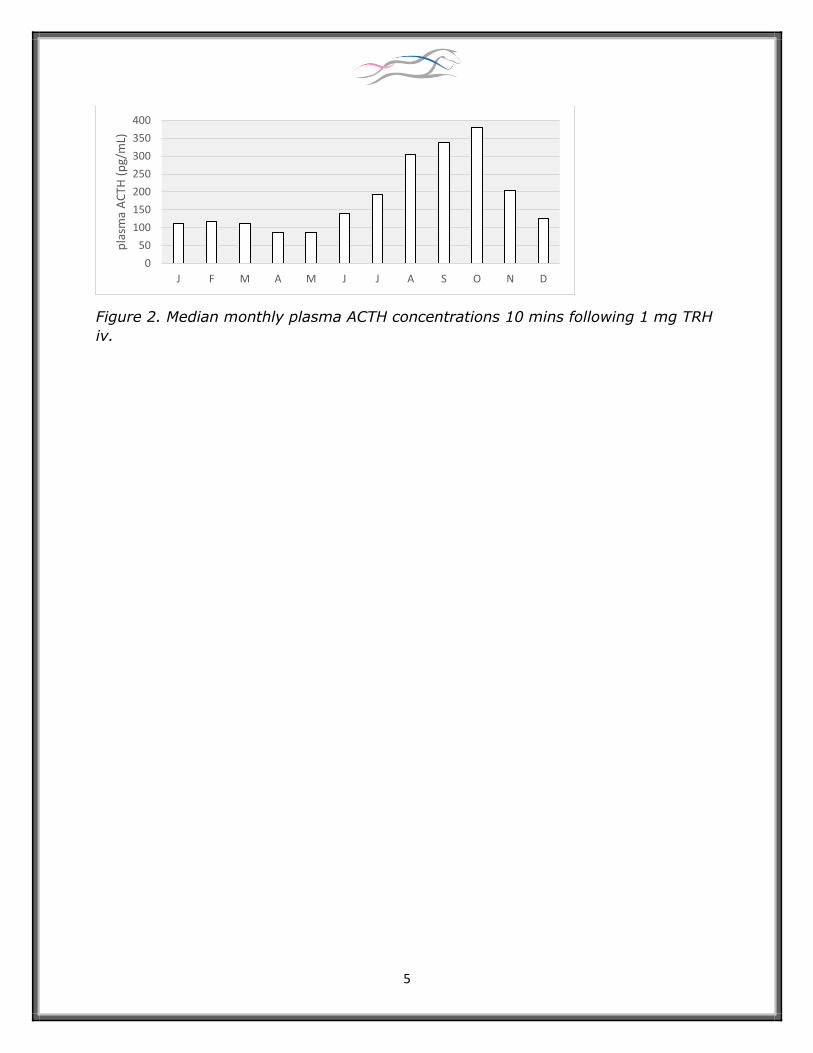
In 1,565 cases the basal plasma ACTH sample was collected as part of a TRH
stimulation test. In these cases, the median ACTH concentration measured 10
minutes following TRH revealed a similar circannual pattern with the highest ACTH
response in October (median 381 pg/mL) and the lowest in April (85.5 pg/mL).
Both basal plasma ACTH concentration and the response to TRH appear to be lower
in April compared to other months of the year suggesting decreased secretory
function at that time of year. Reference intervals using the same cutoffs for “non-
autumnal months” may not be appropriate for samples collected in April.
Figure 1. Median monthly plasma ACTH concentration.
Continued next page
0
10
20
30
40
50
60
70
80
J F M A M J J A S O N D
pla
sma
AC
TH (
pg/
mL)
5
Figure 2. Median monthly plasma ACTH concentrations 10 mins following 1 mg TRH
iv.
0
50
100
150
200
250
300
350
400
J F M A M J J A S O N D
pla
sma
AC
TH (
pg/
mL)
6
Comparison of Plasma ACTH Assays in Ponies Suggests Seasonally
Dependent Assay Cross-Reactivity
Knowles, E.J.1,2, Moreton-Clack2, M.C, Shaw, S.3, Harris, P.A.4, Elliott, J.1 and
Menzies-Gow, N.J.1
1The Royal Veterinary College,2Bell Equine Veterinary Clinic, Mereworth, Kent, UK 3Tosoh Bioscience UK, 4WALTHAM Centre for Pet Nutrition, UK
Aims: To compare plasma [ACTH] measured by validated chemiluminescent and
immunofluorescent assays in spring and fall samples and to determine whether the
assays provide similar binary results.
Methods: Plasma [ACTH] was measured using chemiluminescent and
immunoflorescent methods in EDTA-plasma from ponies, with no known history of
laminitis, in the spring and fall. Assay cross-reactivity to human synthetic
corticotropin-like intermediate peptide (CLIP) was assessed by spiked recovery.
Diagnostic thresholds for the immunofluorescent method were derived to
correspond with common chemiluminescent thresholds for PPID diagnosis.
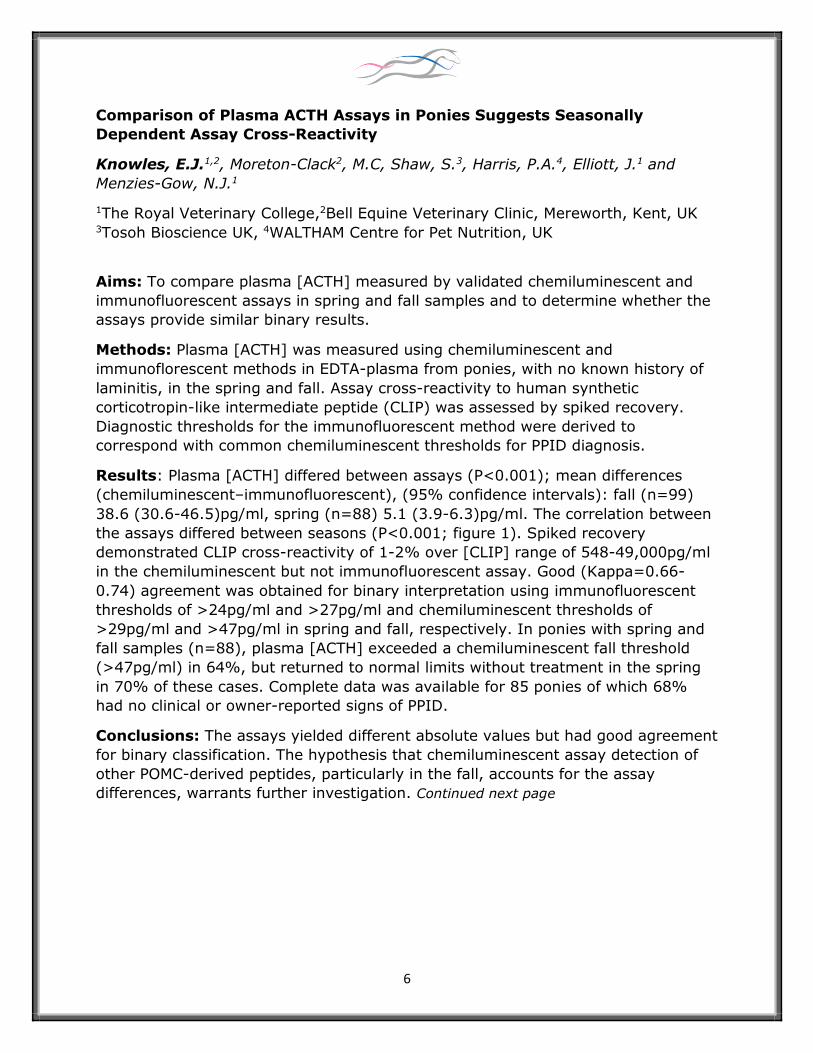
Results: Plasma [ACTH] differed between assays (P<0.001); mean differences
(chemiluminescent–immunofluorescent), (95% confidence intervals): fall (n=99)
38.6 (30.6-46.5)pg/ml, spring (n=88) 5.1 (3.9-6.3)pg/ml. The correlation between
the assays differed between seasons (P<0.001; figure 1). Spiked recovery
demonstrated CLIP cross-reactivity of 1-2% over [CLIP] range of 548-49,000pg/ml
in the chemiluminescent but not immunofluorescent assay. Good (Kappa=0.66-
0.74) agreement was obtained for binary interpretation using immunofluorescent
thresholds of >24pg/ml and >27pg/ml and chemiluminescent thresholds of
>29pg/ml and >47pg/ml in spring and fall, respectively. In ponies with spring and
fall samples (n=88), plasma [ACTH] exceeded a chemiluminescent fall threshold
(>47pg/ml) in 64%, but returned to normal limits without treatment in the spring
in 70% of these cases. Complete data was available for 85 ponies of which 68%
had no clinical or owner-reported signs of PPID.
Conclusions: The assays yielded different absolute values but had good agreement
for binary classification. The hypothesis that chemiluminescent assay detection of
other POMC-derived peptides, particularly in the fall, accounts for the assay
differences, warrants further investigation. Continued next page
7
Figure 1: The association between ACTH concentrations measured by
chemiluminescent and immunoflorescent assays in the spring and fall.
0 5 0 1 0 0
0
2 0
4 0
6 0
8 0
C h e m ilu m in e s c e n t
A C T H p g /m l
Imm
un
ofl
ore
sc
en
t
AC
TH
pg
/ml
B
S p r in g
F a ll
8
Assessment of Prolactin Concentration as a Screening Test for PPID
H.C. Schott II, 1 B. Norby,1 D.L. Thompson.2
1. Michigan State University, 2. Louisiana State University
Aims: To assess measurement of prolactin (PRL) concentration as a screening test
for PPID.
Methods: PRL concentration was compared between 31 horses that were enrolled
in and 26 horses that failed inclusion criteria for the clinical efficacy study for
pergolide. Enrollment required horses to have a hypertrichosis score >1 and either
an elevated plasma ACTH concentration (>50 pg/mL) or abnormal overnight
dexamethasone suppression test results. PRL was measured again after 3 and 6
months of treatment with pergolide in the horses enrolled in the study. PRL
concentrations were compared by rank sum analysis and an ANOVA on ranks for
repeated measures. A ROC curve was constructed to assess sensitivity and
specificity of PRL at various cut-off values as a screening test for PPID.
Results: PRL was greater (p=0.02) in enrolled (7.0 ± 8.2 ng/mL, mean ± SD) as
compared to excluded (4.3 ± 2.6 ng/mL) horses. Area under the ROC curve was
0.68 (95% CI: 0.55-0.80). Using cut-off values of >3.5 and >4.0 ng/mL, sensitivity
and specificity were 77 and 54% and 65 and 54%, respectively. Curiously, PRL
tended to decrease after 3 months of pergolide treatment (3.8 ± 1.8 ng/mL) but
the only significant difference was a higher (p<0.01) PRL after 180 days of
pergolide treatment (9.7 ± 6.4 ng/mL) as compared to the 90 day treatment value.
Conclusion: In this cohort of horses, measurement of PRL did not appear to be a
useful screening tool for PPID. Further, treatment of PPID-affected horses with
pergolide did not decrease PRL.
Acknowledgements: Supported by the Michigan Animal Health Foundation.
9
Development and Application of a Novel Diagnostic Test for PPID using
MALDI-TOF proteomics
Dianne McFarlane, DVM, PhD, DACVIM; Akhilesh Ramachandran, PhD;
Center for Veterinary Health Sciences, Oklahoma State University, Stillwater OK
Introduction: Current diagnostic tests for pituitary pars intermedia dysfunction
(PPID) fail to accurately identify early cases. Physiological stimulation of the
pituitary pars intermedia (PI) cannot be differentiated from pathologic loss of
inhibition of the PI. As a result, horses not infrequently are being misdiagnosed and
lifelong treatment of PPID ensues. A new, more discriminating diagnostic test is
needed. POMC peptide production and processing has been shown to be altered in
horses with PPID. Enzymes that post translationally modify POMC peptides are
regulated by dopamine, thus their activity changes in PPID due to the loss of
dopamine in the PI. Based on this observation we hypothesize that plasma peptide
signatures might provide a sensitive assay for PPID.
Methods: Plasma samples were collected from >250 horses with accompanying
clinical and histological findings. Samples were processed using extraction with
organic solvents followed by purification through C18 filter tips to remove abundant
proteins (e.g., albumin and globulin) to prevent masking less abundant peptides.
Samples were analyzed by MALDI-TOF following extraction. An equine plasma
sample spiked with β-endorphin was used to test the extraction protocol. Using 10
PPID and 10 control samples an initial peptide signature for PPID was formulated as
proof of principal.
Results: A profile with 91 peptides was generated. When the 20 samples were run
as blinded unknowns there was 100% recognition and an 80% cross validation
using a profile generated with software without further refinement to the algorithm.
Discussion: MALDI-TOF generated plasma POMC peptide signatures might prove
to be an effective diagnostic test for PPID. Additional modifications to the sample
preparation protocol are underway to enhance repeatability and ease of processing.
Following optimization of the sample preparation protocol, the full sample set will
be tested to calculate the accuracy of this method for diagnosis of early PPID.
10
Evaluation of Diagnostic Tests for Pituitary Pars Intermedia Dysfunction in
Donkeys
Mejia-Moreira LSa, Mendoza FJa, Buchanan Bc, Toribio REb, Perez-Ecija RAa
aDepartment of Animal medicine and Surgery, University of Cordoba, Spain, bCollege of Veterinary Medicine, The Ohio State University, USA cBrazos Valley Equine Hospital, Navasota, Texas, USA
Clinical experience indicates that pituitary pars intermedia dysfunction (PPID) is a
frequent endocrine disorder in geriatric donkeys. However, endocrine testing is
based on criteria for horses and ponies, but information on this species is lacking.
Evaluation of other endocrine systems (thyroid, energy) in donkeys has shown that
extrapolation can be misleading. The goal of this pilot study was to evaluate
different accepted diagnostic methods for PPID in a group of geriatric donkeys.
Six mix-breed adult donkeys (range:13-30 years-old), 1 jack and 5 jennets from a
donkey sanctuary suspect of PPID (age, hypertrichosis, laminitis, regional adiposity,
lethargy, increased ACTH concentrations) were selected. Testing was carried out in
August and included the dexamethasone suppression test (DST; 40 µg/kg, IM),
thyrotropin-releasing hormone (TRH) stimulation test (1 mg, IV), and the combined
DST-TRH performed on every donkey with 7 day washout periods.
Marked discrepancies were observed between tests. All donkeys were considered
positive for PPID based on basal ACTH concentrations (range: 56-424 pg/ml) and
TRH stimulation test (>100 pg/ml 10 min post-TRH), but only four animals were
positive with the DST-TRH (66% cortisol increase at 195 min post-dexamethasone
and 10 min post-TRH) and three with the DST (cortisol >1 µg/dl at 19 h post-
dexamethasone).
Results are in agreement with PPID guidelines for horses, support the use of
baseline ACTH and TRH-stimulation, but discourage the DST and DST-TRH (false
negatives) for PPID diagnosis in donkeys. Evaluation of these tests in a larger
population of healthy and PPID donkeys will validate these findings.
11
Adrenocorticotropin Hormone Response to Varying Dosages of Thyrotropin
Releasing Hormone in Normal Horses
Chapman, A.M., Sarah Ainsworth, Mike Keowen, Jon Fletcher, Chin-Chi Liu
Veterinary Clinical Sciences Department, School of Veterinary Medicine, Louisiana
State University, Baton Rouge, LA
Background: The thyrotropin-releasing hormone (TRH) response test has become
the diagnostic test of choice for identifying horses and ponies with pituitary pars
intermedia dysfunction (PPID). Current testing protocol recommends administration
of a standard dosage of 1 mg TRH in any size equid. It is unknown whether a
relationship exists between dosage of TRH and pituitary hormone response.
Objective: To evaluate the adrenocorticotropic hormone (ACTH) response to
administration of 3 different doses of TRH in normal adult horses.
Methods: Using a randomized crossover trial, 12 clinically normal adult horses
were assigned to receive 0.5 mg, 1 mg, or 2 mg TRH. Endogenous plasma ACTH
was measured at 0, 5, 10, 15 and 30 minutes after IV administration of TRH. The
test was repeated after two-week washout periods in order that individual horses
received each TRH dosage during the testing period.
Results: Mean plasma ACTH concentration after TRH administration was not
significantly different among the three dosages. A significant effect was noted in
both endogenous and TRH-stimulated ACTH concentration by month. A difference
in endogenous ACTH was noted while testing during inclement weather, but this
was not significant.
Conclusions: It may be a possible to perform a TRH response testing using a lower
dose of 0.5 mg for economic reasons, however further studies examining horses
with PPID would be necessary before making this recommendation. Season and
external stressors could affect TRH response testing even when a lower dosage is
administered. Therefore, environmental stress should be minimized where possible
when performing this test.
12
Evaluating Seasonal Influences on Hormone Responses to a Diagnostic
Test (Thyrotropin-Releasing Hormone Stimulation) Advocated for Early
Diagnosis of Pituitary Pars Intermedia Dysfunction (PPID).
Adams, AA1, MH Siard1, SE Reedy1, D Barker1, S Elzinga1, MG Sanz1, F Cesar1, C
Lawson1, C Tucker1, M Mulholland1, DW, Horohov1, K Urschel2 and J L Ireland3.
1. Gluck Equine Research Center, Department of Veterinary Science, University of
Kentucky, Lexington, KY. 2. Department of Animal and Food Sciences, University
of Kentucky, Lexington, KY. 3. The Animal Health Trust, Newmarket, Suffolk, UK.
Horses with early PPID may fail to test positive using basal endocrine diagnostic
tests. Thus, the TRH stimulation test is currently recommended where early PPID is
suspected. Effects of season on the hormone responses to this dynamic test have
not been fully evaluated in similarly managed groups of non-PPID, subclinical and
clinical PPID horses over a 12-month period. The TRH stimulation test (T0, T10 and
T30 min blood collections) and clinical evaluations were performed each month for
a 12-month period using the same group of horses, under the same management,
characterized as non-PPID (n=17), subclinical PPID (no hirsutism and 1 abnormal
endocrine test) (n=21), and clinical PPID (hirsutism and 2 or more abnormal
endocrine tests) (n=25). EDTA plasma ACTH was measured by Cornell. Within
non-PPID, subclinical PPID and clinical PPID groups, RM ANOVAs demonstrated
basal, T10 and T30 ACTH values all varied significantly between months (P<0.001).
Two-way RM ANOVA demonstrated basal, T10 and T30 ACTH values all varied
significantly with both PPID status and season (P<0.001). Youden indexes were
used to determine seasonal and monthly cut-off values for basal, T10 and T30
ACTH concentrations which should be considered when diagnosing PPID.
13
Highly Variable Autumnal TRH-Stimulation Tests in Normal Horses at two
Australian Locations
Byrne DPa, Secombe CJa, Tan RHHb, Perara DIa, Watts SPb, Wearn Jb.
aMurdoch University, Perth, WA, AUS; bJames Cook University, Townsville, AUS
The TRH stimulation test is widely used as an additional diagnostic test for PPID.
Testing is recommended at times when ACTH is quiescent, between the winter and
summer solstices. Current research in the northern hemisphere recommends a cut-
off of 110 pg/ml ACTH at 10 minutes and 65 pg/ml at 30 minutes post-TRH
administration. It is unclear whether TRH-stimulation testing when ACTH is
dynamically changing is appropriate or whether similar cut-offs are applicable in the
southern hemisphere.
Thirteen normal horses at Perth and 32 at Townsville were identified by clinical
parameters and normal monthly endogenous ACTH. TRH-stimulation tests were
performed during the ACTH quiescent phase on the Perth cohort in September and
during the dynamic phase at both sites (March, Perth; April, Townsville).
In the Perth cohort, post-TRH ACTH concentrations were significantly different
between March and September (p=0.001). The mean ACTH concentration pre-TRH
and 10 minutes post-TRH in autumn was 51 pg/ml (95% CI 46-57) and 249 pg/ml
(95% CI 170-327) respectively. In the Townsville cohort, the mean ACTH
concentration pre-TRH and 30 minutes post-TRH in autumn was 44 pg/ml (95% CI
38-52) and 100 pg/ml (95% CI 82-120).
The ACTH cutoff for TRH-stimulation testing during the quiescent period in Perth
appears similar to the northern hemisphere. However, TRH-stimulation testing in
normal horses, when ACTH is dynamically changing between summer and winter
solstices, was extremely variable at both locations. During this period, there may
be considerable overlap between normal and PPID-affected horses and further
research is required to avoid erroneous diagnosis.
14
ACTH Responses after Application of two TRH Doses in Healthy Horses
L. Stallenberger1, K. Failing2, K. Fey1
1 Equine Clinic, Internal Medicine, 2 Unit for Biomathematics and Data Processing,
both at the Justus Liebig University Giessen, Germany
Introduction: Usually 1mg TRH per horse (2.0µg/kg in a 500kg horse) is used to
stimulate ACTH secretion from the pituitary gland in order to detect PPID. The
purpose of this study was to evaluate 1.0 and 2.0 µg TRH/kg bodyweight for its
ability to stimulate ACTH secretion in healthy horses.
Methods: A randomised cross-over trial with horses and ponies without clinical
disease and normal basal ACTH was planned. Equines ≥ 15 years were included if
they showed normal DST within three weeks before the study. 1.0 and 2.0µg/kg
TRH (Ferring Arzneimittel GmbH, Kiel/Germany) was given in a randomised order
with a wash-out period of 6 days. Paired t-tests were used to detect significant
differences between TRH doses at the different time points.
Results: 8 horses are tested so far. Statistically, no significant differences between
TRH doses were detectable.
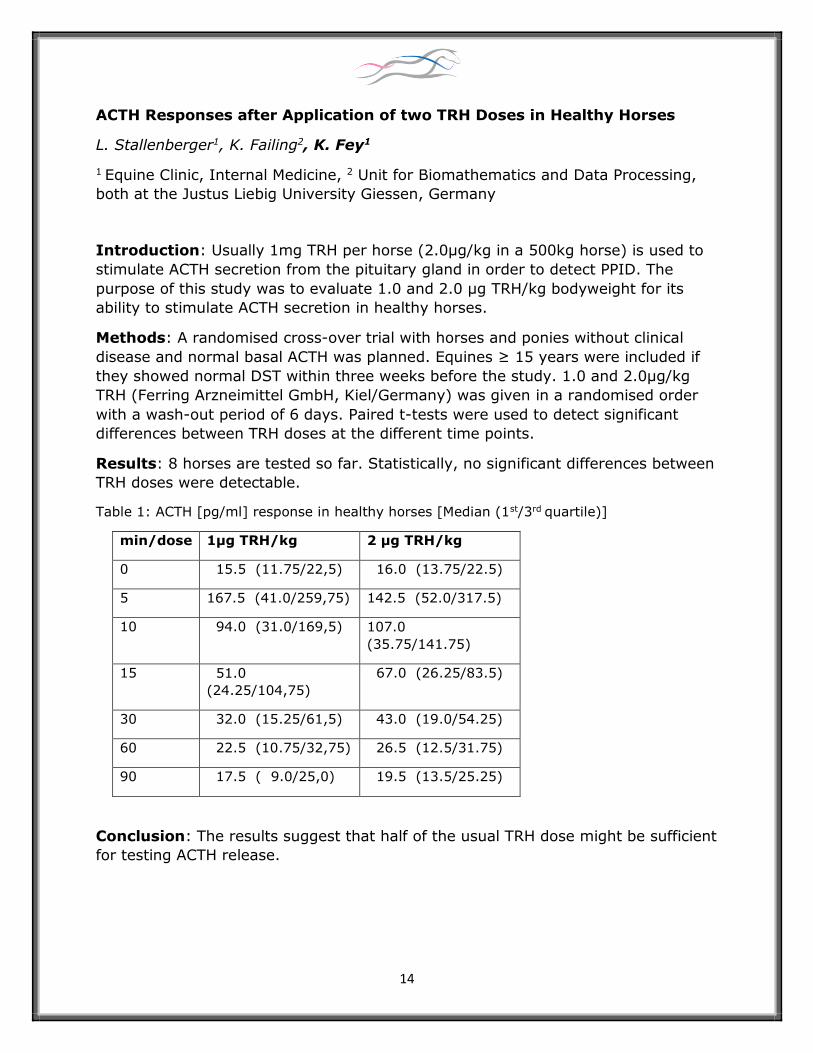
Table 1: ACTH [pg/ml] response in healthy horses [Median (1st/3rd quartile)]
min/dose 1µg TRH/kg 2 µg TRH/kg
0 15.5 (11.75/22,5) 16.0 (13.75/22.5)
5 167.5 (41.0/259,75) 142.5 (52.0/317.5)
10 94.0 (31.0/169,5) 107.0
(35.75/141.75)
15 51.0
(24.25/104,75)
67.0 (26.25/83.5)
30 32.0 (15.25/61,5) 43.0 (19.0/54.25)
60 22.5 (10.75/32,75) 26.5 (12.5/31.75)
90 17.5 ( 9.0/25,0) 19.5 (13.5/25.25)
Conclusion: The results suggest that half of the usual TRH dose might be sufficient
for testing ACTH release.
15
Reliability of a Clinical Scoring System for PPID
H.C Schott II,1 J.V. Marteniuk,1 R. Miller,1 J.B. Kaneene,1 D. McFarlane,2 A.M.
Stokes,3 F.M. Andrews.3
1Michigan State University, 2Oklahoma State University, 3Louisiana State
University
Aims: To assess reliability of a clinical scoring system as a predictor of PPID.
Methods: Five signs (hypertrichosis, hyperhidrosis, polyuria/polydipsia [PU/PD],
abnormal fat deposition, and muscle wasting) were scored 0-3 during evaluation of
horses for enrollment in the clinical efficacy study for pergolide. Enrollment required
horses to have a hypertrichosis score >1 and either an elevated ACTH
concentration (>50 pg/mL) or abnormal overnight dexamethasone suppression test
results. Differences in individual and composite (minimum 0, maximum 15) scores
between 29 enrolled horses and 25 excluded horses were assessed by Wilcoxon
rank sum analysis and associations between scores and PPID status were evaluated
using logistic regression. In addition, several weighted scoring systems were
developed and assessed.
Results: There were no significant differences in age, gender, or weight between
enrolled and excluded horses. Hypertrichosis scores were different (p<0.01)
between enrolled (2.3 ± 1.7, mean ± SD) and excluded (1.7 ± 1.6) horses.
However, composite clinical scores in enrolled (range 2-12, 5.9 ± 2.3) and excluded
(range 3-10, 5.1 ± 1.8) horses were not different (p=0.21) and there was a
difference (p<0.01) in composite scores between study sites, largely attributable to
differences in scoring of hyperhidrosis and PU/PD. A weighted score, excluding
muscle wasting and PU/PD, was a better predictor for PPID (R2 = 55.3%) than the
unweighted score (R2 = 26.7%).
Conclusion: Hypertrichosis was a valid clinical parameter to differentiate PPID
from non-PPID horses. A more detailed, weighted clinical scoring system, using
larger numbers of PPID-positive and negative horses, warrants further
investigation.
16
Comparison of Seasonal TRH Stimulation Test Results in Horses with PPID
Treated with Prascend® or placebo Banse H1, McFarlane D2
1Department of Veterinary Clinical and Diagnostic Sciences, Faculty of Veterinary
Medicine, University of Calgary, Calgary, AB,2Department of Physiological Sciences, Center for Veterinary Health Sciences, Oklahoma State University, Stillwater, OK
In horses with PPID, altering pergolide dose in response to seasonal changes in ACTH concentrations (ie, increasing dose in fall) has been recommended. However,
little is known about the impact of treatment on resting ACTH and TRH stimulation results across seasons. The objective of this study was to compare resting ACTH
concentrations and TRH stimulation test results between PPID horses treated with pergolide or placebo for twelve weeks (May-August).
Thirteen horses with PPID were enrolled based upon an ACTH 30 minutes post-TRH of >65 pg/ml (non-fall) or a resting ACTH >50 pg/ml (non-fall) or >100 pg/ml
(fall). Horses were randomly assigned to treatment (n=6) or placebo (n=7) groups. Horses were treated with Prascend (1 mg/horse) or placebo for twelve weeks. Resting ACTH and response to TRH was measured at Week 0 (prior to treatment)
and at 4, 8, and 12 weeks after initiation of treatment. Treatment with Prascend was increased (by 1 mg/day) in horses at Week 5 and/or Week 9 if resting ACTH
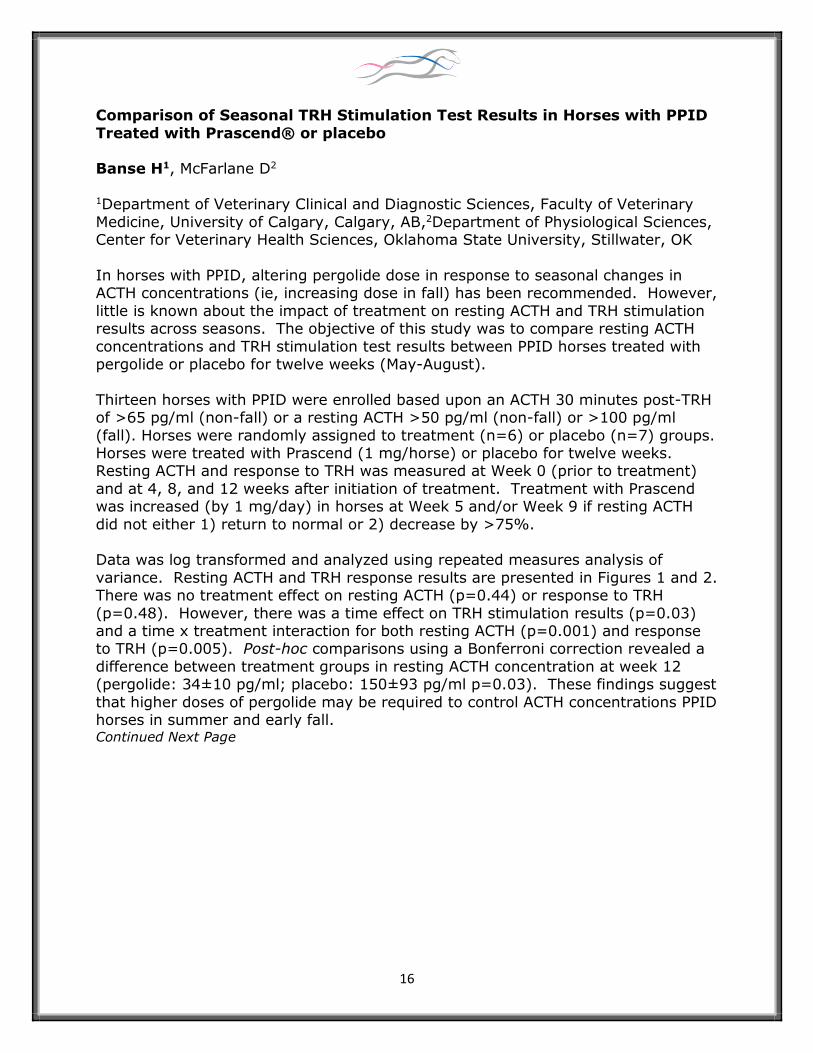
did not either 1) return to normal or 2) decrease by >75%. Data was log transformed and analyzed using repeated measures analysis of
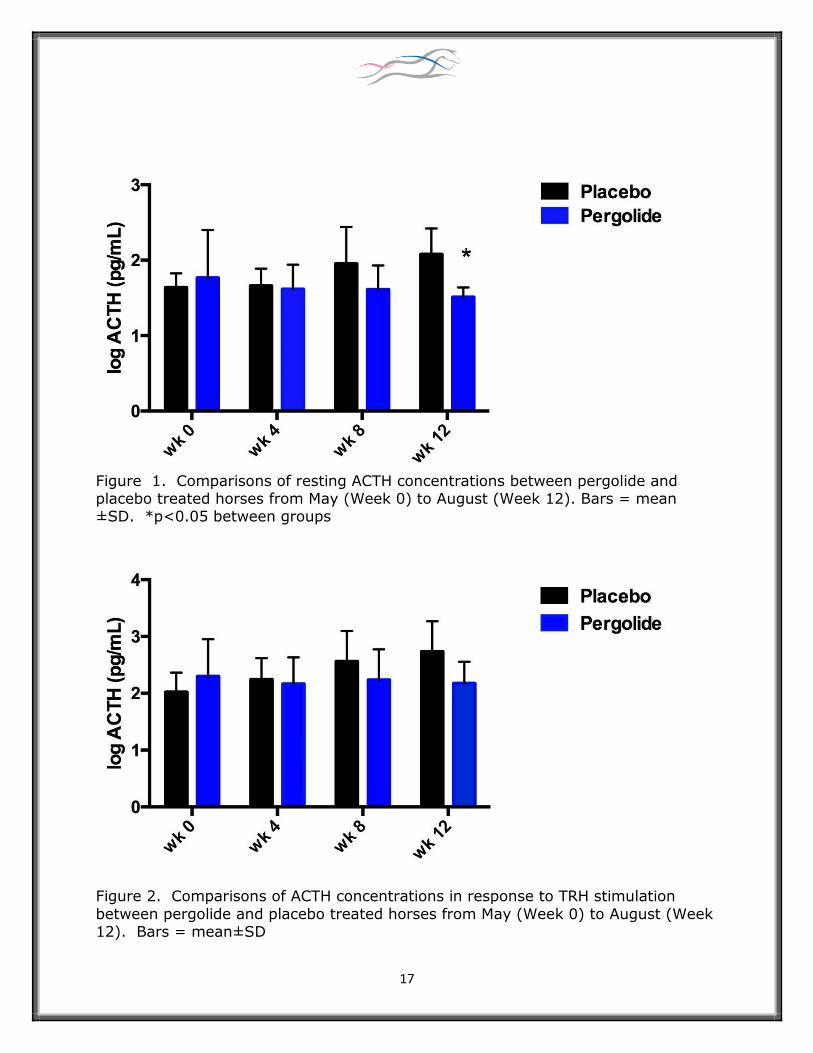
variance. Resting ACTH and TRH response results are presented in Figures 1 and 2. There was no treatment effect on resting ACTH (p=0.44) or response to TRH
(p=0.48). However, there was a time effect on TRH stimulation results (p=0.03) and a time x treatment interaction for both resting ACTH (p=0.001) and response to TRH (p=0.005). Post-hoc comparisons using a Bonferroni correction revealed a
difference between treatment groups in resting ACTH concentration at week 12 (pergolide: 34±10 pg/ml; placebo: 150±93 pg/ml p=0.03). These findings suggest
that higher doses of pergolide may be required to control ACTH concentrations PPID horses in summer and early fall. Continued Next Page
17
Figure 1. Comparisons of resting ACTH concentrations between pergolide and placebo treated horses from May (Week 0) to August (Week 12). Bars = mean ±SD. *p<0.05 between groups
Figure 2. Comparisons of ACTH concentrations in response to TRH stimulation
between pergolide and placebo treated horses from May (Week 0) to August (Week 12). Bars = mean±SD
18
Establishment of a Reference Interval for Plasma ACTH Concentration in
Aged Horses
Dianne McFarlane, DVM, PhD, DACVIM; Lara K Maxwell, DVM, PhD, DACVCP;
Dept of Physiological Sciences, Center for Veterinary Health Sciences, Oklahoma
State University, Stillwater, OK
Introduction and Rationale: Measurement of plasma ACTH concentration is
commonly used in practice to diagnosis PPID. The population at greatest risk for
PPID is aged horses or ponies of any breed. Therefore, a reference interval for
PPID was determined using samples from horses 20 years or older, confirmed free
of PPID by postmortem examination of the pituitary.
Methods: Plasma samples were collected from 77 horses 20 years or older with
normal hair coats that were scheduled for euthanasia for other reasons. All
samples were collected between Nov and July. The pituitary gland was collected
and a mid-saggital section was graded 1-5, using the scale of Miller et al. Horses
with a PI grade > 3 were excluded. ACTH concentration was determined in
remaining samples by chemiluminescence. Mean ACTH concentration plus 2 SD
was calculated.
Results: Mean ACTH concentration in horses >20 years of age was 26.4 ± 11.7.
The upper reference interval cutoff suggested by this data is 50 pg/ml.
Discussion: The upper reference interval cutoff in this study is higher than
suggested in other studies. Reasons for discordance among the studies may
include the animal age, breed differences, health status of the horses or
geographical location of the animals sampled. Similar methods of ACTH
measurements were used and therefore do not explain the differences observed.
Significance: A resting plasma ACTH concentration < 50 pg/ml would be
considered normal in aged horses, according to the present study.
19
Plasma Concentrations of Adrenocorticotropic Hormone in Samples
Obtained from the Cavernous Sinus of Normal Horses and Horses with
Pituitary Pars Intermedia Dysfunction.
JH van der Kolk, 1, PPCA Menheere2, E Smiet3,4, JAP Bons2, JL Carmalt5, J
Patterson6 and HC Schott 2nd7.
1 Swiss Institute for Equine Medicine (ISME), Vetsuisse Faculty, University of Bern
and Agroscope, Bern, Switzerland; 2Central Diagnostic Laboratory, Maastricht
University Medical Center, Maastricht, the Netherlands; 3Lingehoeve
Diergeneeskunde, Lienden, the Netherlands; 4Evidensia Specialisthästsjukhuset,
Strömsholm, Sweden; 5Department of Large Animal Clinical Sciences, Western
College of Veterinary Medicine, University of Saskatchewan, Saskatoon, Canada; 6Diagnostic Center for Population and Animal Health, Michigan State University,
East Lansing, Michigan, USA; 7Department of Large Animal Clinical Sciences,
Michigan State University, East Lansing, Michigan, USA
We aimed to compare central ACTH concentration and pulsatility in normal and
PPID horses. Samples were collected at 5 minute intervals for one hour starting at
9 am using a catheter inserted into the pituitary intercavernous sinus in four control
horse mares (7.0±4.1 [SD] years) and three PPID horses (a 19-year-old
Warmblood gelding, a 25-year-old Quarterhorse gelding and a 30-year-old mixed
breed mare). PPID horses had generalized hypertrichosis and positive overnight
dexamethasone suppression test results in contrast to control horses. ACTH was
assessed using chemiluminescence detection (Nichols). PULSE4 analysis revealed
one ACTH concentration peak hourly in all horses. Mean basal central ACTH
concentration was significantly greater in PPID horses as compared to controls
(4577±2143 and 278±388 pg/ml, respectively). The jugular ACTH concentration
measured 3-15% of the central concentration in PPID horses (without significant
correlation). Deconvolution analysis showed a secretion peak in two PPID horses of
13060 (t½=1.2s) and 7888 (t½=4.3s) compared to 411 pg/ml (t½=15s) in a
control horse. One mg TRH IV increased central ACTH concentration from 7174 to
72049 and from 5224 to 17150 pg/ml over 10 minutes in two PPID horses with
central concentrations increasing more than peripherally (10 versus 3 times). Two
dosages of pergolide (3 mg) decreased central ACTH concentration by 80%
(peripherally by 77%) and TRH test results by 57 and 91%, respectively in a 25-
year-old QH. In conclusion, adenomas in PPID horses might show pulsatile ACTH
secretion leading to very high ACTH concentrations in peripheral blood despite the
theoretical concept of autonomous functioning.
20
Clinical Signs Associated with PPID in the Equine Athlete
1Grubbs S.T, 1Kirschner K.A., 2Baus M.R., 2Kremburg J.R., 1Neal D.L., and 3Keefe
T.R.
1. Boehringer Ingelheim Vetmedica, Inc., 2. Grand Prix Equine, Hawleyville, CT. 3.
Colorado State University
Pituitary Pars Intermedia Dysfunction (PPID) has been described as one of the most
common diseases of horses and ponies 15 years of age and older. Recently, the
clinical signs of PPID have been divided into early and advanced clinical signs.
Establishing a diagnosis of PPID in horses with early clinical signs is currently a
difficult challenge facing equine veterinarians. Particularly difficult may be the
diagnosis of horses with PPID in the equine athlete. Many of the same clinical signs
identified in early or advanced PPID may be recognized in the sport horse along
with tendon or suspensory ligament degeneration. Suspensory ligament injuries
have been considered a common cause of lameness, in the equine athlete involved
in competitive events. A recent histopathological study concluded that an
association exists between PPID and suspensory ligament (SL) degeneration. The
objective of this study was to identify the most common clinical signs associated
with PPID in the sport horse.
Sport horses >10 years of age, any breed, and sex were eligible for study
enrollment as long as they were documented to be exhibiting one or more of the
early or advanced clinical signs of PPID including suspensory ligament desmitis.
Forty-nine horses were evaluated and included in the final data analysis with at
least one clinical sign of early or advanced PPID. Demographic data, signalment,
and a physical examination was conducted and each horse was tested for PPID
using the TRH stimulation test measuring ACTH at 0 (T0ACTH) and 10 (T10ACTH)
min. Insulin and glucose levels were also determined. Normal horses were excluded
from the study. Blood samples were shipped overnight to the Animal Health
Diagnostic Center, Cornell University, Ithaca, NY for analysis. The association
between PPID status, based on ACTH and insulin results, and each of the
demographic variables (age, sex, and breed), clinical signs, the two test result
variables insulin and glucose were statistically evaluated individually using the
Pearson chi-square test. Odds ratios for significant predictors of PPID status were
computed using corresponding 95% confidence intervals when applying multiple
logistic regression analysis.
Of the 49 horses, 19 (39%) were PPID+ and 8 (16%) were IR+. Of the 19 PPID+
horses, only 2 (11%) were PPID+ at the T0ACTH time point, whereas 19/19 (100%)
were PPID+ at T10ACTH. Six (32%) of 19 PPID+ horses were hyperinsulinemic.
Horses’ ages ranged from 11 to 25 years of age (arithmetic mean 17 years) in the
PPID+ group. The most common clinical signs observed in the PPID+ horses were
Continued next page
21
delayed regional shedding, loss of epaxial muscle mass, regional adiposity, skeletal
muscle atrophy and suspensory desmitis. PPID+ was significantly (P= 0.023)
associated with lameness (suspensory desmitis, tendon laxity, superficial digital
flexor tendonitis). Of the horses that were lame, 70% were PPID+.
Based on the results of this study, the TRH stimulation procedure was required in
89% of enrolled horses for laboratory confirmation of PPID. In the sport horse,
suspensory desmitis was significantly associated with PPID+ status. Veterinarians
should include PPID in the list of differential diagnoses when examining sport
horses with suspensory desmitis along with early and advanced clinical signs of
PPID.
22
Adipose Tissue Morphology and Hormone-Sensitive Lipolytic Protein
Expression in Lean and Obese Horses and Ponies
Morrison, PK Chen Bing, Dai H. Grove-White, Patricia A. Harris, Charlotte A.
Maltin, Caroline McG. Argo.
School of Veterinary Medicine, Manor Park Campus, University of Surrey, School of
Veterinary Science, University of Liverpool, UK. Waltham Centre for Pet Nutrition,
Mars Horsecare UK Ltd.
Body weight management is important for the mitigation of risk for the
development of insulin dysregulation and associated conditions. Lipolysis is
dynamically regulated by several neuroendocrine factors, including insulin and
thyroid hormone. Obesity is associated with increased adipocyte volumes and
perturbations of lipolysis in other species. This study tested the hypothesis that
adipocyte size is increased across specific fat storage depots in obese horses and
ponies and this cellular expansion is associated with changes in the expression of
key lipid-droplet proteins, perilipin-1 (PLIN1) and hormone-sensitive lipase (HSL).
Adipose tissue samples from 5 anatomically-discrete depots (ventro-abdominal
retroperitoneal, epicardial, omental, nuchal crest and tailhead) were collected
immediately post-mortem from 6 lean (BCS 3.1/9 ± 0.50) and 6 obese (BCS 7.7/9
±0.46) horses and ponies of mixed breed and gender for both histological and
western blot analysis.
Adipocyte area was significantly (p < 0.05) greater for obese animals compared to
lean animals for all adipose depots studied apart from epicardial WAT. No
differences in adipocyte area between depots within lean/obese animals. Protein
expression of PLIN1 and HSL was significantly (p < 0.05) lower in obese animals for
retroperitoneal WAT in both cytosolic and lipid droplet associated protein fractions.
Data confirm that equine obesity is associated with changes in the expression of
lipolytic proteins in certain depots which may indicate functional differences
between regional adipose depots. These data provide a foundation for future work
to improve our understanding of endocrine/hormone-sensitive protein interactions
and how these proteins may be functionally modified in insulin-dysregulated horses.
23
Plasma Insulin-Like Growth Factor-1 Concentrations in Ponies and Horses
under Conditions of Weight Gain and Weight Loss
CL Baskerville1, NJ Bamford1, PA Harris2, SR Bailey1.
1 Faculty of Veterinary and Agricultural Sciences, University of Melbourne, Victoria,
AUS, 2 WALTHAM Centre for Pet Nutrition, Leicestershire, UK.
Low levels of insulin-like growth factor-1 (IGF-1) have been associated with obesity
and metabolic syndrome in humans. It has been postulated that the link between
hyperinsulinaemia and laminitis in equids is mediated via the IGF-1 receptor on
lamellar epithelial cells; however, the relationship between breed, diet and
adiposity on plasma IGF-1 concentrations has not been fully evaluated.
Eight Standardbred horses, 8 mixed-breed ponies and 8 Andalusian-cross horses
were studied (5-15 years old; all of moderate body condition). Animals received
either a cereal-rich diet (4 of each breed; meals contained micronized maize) or an
isocaloric fat/oil-rich diet (4 of each breed; meals contained vegetable oil). These
rations, providing 200% of daily DE requirements, were fed over 20 weeks to
induce obesity. Blood samples were collected before and after weight gain, and
plasma IGF-1 was measured using a validated ELISA. A multivariate general linear
model was used for statistical analysis. Breed differences in plasma IGF-1 were
present at the outset, with ponies (149.5 ±22.1 ng/mL) having higher levels than
Standardbreds (115.0±17.9) and Andalusians (88.8±7.5). Plasma IGF-1
concentrations did not change significantly with weight gain. There was no
difference between diet groups detected, despite the cereal-rich diet inducing
insulin resistance.
Plasma IGF-1 levels appear to be relatively stable in adult equids transitioning
between moderate and obese body condition. The higher levels observed in ponies
may be related to their size rather than insulin sensitivity since Andalusian horses,
with similar insulin responses to ponies, had IGF-1 concentrations which were not
detectably different to Standardbreds.
24
Metabolomics of Equine Metabolic Syndrome
Samantha A Brooks1 Samantha L. Lewis1, Heather M Holl1, Martha Mallicote2,
Maureen T Long3
1Department of Animal Sciences, IFAS, 2Department of Large Animal Clinical
Sciences, College of Veterinary Medicine, 3Department of Infectious Diseases and
Pathology, College of Veterinary Medicine, all at University of Florida
There are approximately 9.2 million horses in the US, nearly half of which may be
overweight and at risk for laminitis due to Equine Metabolic Syndrome (EMS). This
study utilizes global metabolomics assays to characterize “metabotypes” associated
with EMS. Study horses were volunteered by their owners, from the Arabian breed
to control for genetic background, and were age, sex and farm of residence
case/control matched whenever possible. A total of 50 animals, 26 females and 24
castrated males with an average age of 16 years, fit the study criteria. Diagnostic
endocrinology parameters for these horses, including plasma insulin, leptin, ACTH,
glucose and triglycerides were combined with biometric measures of obesity in a
factor analysis to yield a quantitative score of EMS severity. Liquid
Chromatography-Mass Spectroscopy (LC-MS) analysis of frozen plasma from study
horses was conducted through the Southeast Center for Integrative Metabolomics
core facilities. Stringent quality control filters yielded 2019 LC-MS peak features,
out of a raw count of 6619. Nine features correlated significantly (p < 7.8e-5) with
the composite EMS score among these 49 horses. Additional analysis including
compound identification and pathway exploration is ongoing. As the first dataset of
its kind in the horse, this work will reveal promising new biomarkers for veterinary
diagnostic use. This discovery-based approach may also generate novel targets for
the development of therapeutic interventions for obesity, insulin resistance, and
laminitis in horses.
25
Case Control Study of Pasture and Endocrinopathy-Associated Laminitis in
Horses
Michelle Coleman1, Jim Belknap2, Larry Bramlage3, Susan Eades4, Bryan
Fraley5, Hannah Galantino-Homer6, Robert Hunt5, Ray Geor7, Molly McCue8,
Wayne McIlwraith9, Rustin Moore2, John Peroni10, Hugh Townsend11, Nathaniel
White12, Kevin Cummings1, Renata Ivanek-Miojevic1, Noah Cohen13
1Texas A&M University, 2The Ohio State University,3Rood and Riddle Equine
Hospital, 4Louisiana State University, 5Hagyard Equine Medical Institute,6New
Bolton Center, University of Pennsylvania School of Veterinary Medicine, 7College of
Sciences, Massey University,8University of Minnesota, , Orthopaedic Research
Center,9Colorado State University,10University of Georgia College of Veterinary
Medicine,11 University of Saskatchewan,12Virginia Tech Equine Medical Center,13
Cornell University College of Veterinary Medicine,
Significant efforts have been made in the past decade to further our understanding
of laminitis in horses; however, much research has been limited to the study of the
mechanistic pathways following experimental induction of disease. The conduct of
observational studies of naturally-occurring laminitis is necessary for the
improvement of our knowledge and understanding of disease predisposition and the
design of future investigations into the prevention and control of this debilitating
disease. Thus, the objective of this study was to determine risk factors for the
development of pasture- and endocrinopathy-associated laminitis (PEAL) in horses
evaluated by veterinarians in North America. In this case-control study, incident
cases of PEAL evaluated by veterinary practitioners in North America from 2012-
2015 and horses from 2 control populations were included. Participating
veterinarians provided historical data from a case of PEAL, a healthy control, and a
lameness control. Conditional logistic regression analysis was used to compare data
from PEAL-affected horses and each set of controls. A total of 199 horses with
acute, incident PEAL, 198 healthy controls, and 153 lameness controls were
included in the analysis. Horses with an obese body condition (BCS ≥ 7),
generalized or regional adiposity, a historic diagnosis of an endocrinopathy, and
recent glucocorticoid administration were at increased odds of developing PEAL.
Elucidating the determinants and earlier recognition of obesity, adiposity, and
endocrinopathies might be a strategy for reducing the burden of this form of
laminitis. (233 words)
This study was approved by the Institutional Animal Care and Use Committee and
the Clinical Research and Review Committee of the College of Veterinary Medicine &
Biomedical Sciences at Texas A&M University
26
Equine Metabolic Syndrome and Laminitis: Estimation of Risk, and
Induction of Laminitis in Insulin Dysregulated Ponies using a New Dietary-
Challenge Model
M.N. Sillence1, A.D. Meier1, L.M. Brown1, M.A. de Laat1, J.M. McGree1, C.C. Pollitt2,
D.M. Walsh3 and D.B. Reiche4
1Queensland University of Technology, Brisbane,Australia; 2 The University of
Queensland, Gatton,Australia; 3Animal Health Foundation, Pacific, MO,USA;
4Boehringer Ingelheim Vetmedica, Ingelheim,Germany.
It is known that severe insulin dysregulation (ID) in ponies with Equine Metabolic
Syndrome (EMS) places the animal at risk of laminitis, but the precise relationship
between insulin concentrations and laminitis is not well understood. The present
study used 37 ponies identified as having mild to severe ID using an in-feed oral
glucose test (OGT, 1 g dextrose/kgBW). Within three weeks after the OGT was
performed, the ponies were given a high-energy ‘challenge diet’ containing 12.3 g
NSC/kg BW for up to 18 days. Fourteen ponies developed Obel grade 1 or 2
laminitis. On day 2 of the diet challenge, the maximum serum insulin concentration
(Cmax) was recorded for each pony during a 4 h period after feeding. The Cmax
values showed a positive association with the speed of laminitis onset (r2 = 0.45, P
< 0.05), and the mean (± SEM) Cmax insulin concentration was higher (P < 0.05)
in ponies that developed laminitis (428 ± 59 µU/mL) than in ponies that did not
(274 ± 52 µU/mL). Laminitis incidence was also related to the pre-trial OGT results.
Laminitis occurred at frequencies of 0% (0/7) if post-dextrose insulin was <50
µU/mL; 36% (8/23) if insulin was 50-195 µU/mL; and 86% (6/7) if insulin was
>195 µU/mL. Although the sample size was small, these data support the
hypothesis that laminitis risk can be estimated in EMS ponies by testing the insulin
response to oral glucose. Furthermore, the diet induction model provides a useful
platform to test treatment and preventative measures.
27
Aspects of Veterinary-Diagnosed Endocrinopathic and Pasture-Associated
Laminitis: A Prospective, Cohort Study
M. A. de Laat1, D. Reiche2, M. N. Sillence1 and J. M. McGree1
1Science and Engineering Faculty, Queensland University of Technology, Brisbane,
4001, Queensland, Australia 2Boehringer Ingelheim Vetmedica GmbH, Ingelheim
am Rhein; Registergericht Mainz, Germany
Abbreviations: ACTH; adrenocorticotropic hormone, EMS; equine metabolic
syndrome, F; female, LAM; endocrinopathic and pasture-associated laminitis, M;
male, PPID; pituitary pars intermedia dysfunction
Background: Epidemiological data about endocrinopathic and pasture-associated
laminitis (LAM) are limited. Increased understanding of the characteristics, risk
factors and recurrence rates of LAM would aid management and prevention.
Aim: To investigate the characteristics, treatment and management of LAM and to
determine risk factors and recurrence rates.
Methods: A prospective, longitudinal two-year study of veterinary-diagnosed cases
of LAM. Data were acquired using online questionnaires and are reported as median
[interquartile range]. Laminitis causality was assigned using history, basal serum
insulin and plasma ACTH concentrations, clinical examination and phenotype.
Results: Cases (n=301; 151M/150F; 15 [11-20] years) had either endocrine-
associated (PPID, EMS) or pasture-associated laminitis, or combined causality. A
larger number of cases were recruited in spring (36%). Autumn ACTH
concentrations (38.8 [23.9-173] pg/mL) were higher (P<0.05) than other seasons.
The insulin concentration (µIU/mL) of cases with concurrent PPID and EMS (47 [19-
128]; n=57) was higher (P<0.05) than cases with PPID (5 [2-12.5]; n=25), EMS
(24.5 [5-81.3]; n=120) or pasture-associated laminitis (11 [3-16.5]; n=17) alone.
Insulin concentration was positively correlated (P=0.05) with Obel laminitis grade.
The most common clinical signs were increased digital pulses (82%) and hoof tester
sensitivity (68%). Common treatments included anti-inflammatory drugs (77%)
and farriery (74%). Dietary modification was the most frequent management
recommendation (74%). A subset of cases (n=30) has been followed for two years,
with a laminitis recurrence rate of 46%.
Conclusions: The greater hyperinsulinism associated with concurrent PPID and
EMS may increase laminitis risk and severity. The recurrence rate of LAM may be
higher than anticipated.
Acknowledgement: funded by Boehringer Ingelheim Vetmedica
28
Repeatability of the Combined Glucose/Insulin Test in Ponies of the same
Breed and Gender, across Time
Philippa K. Morrison, Alexandra, H.A. Dugdale, Dai H. Grove-White, Patricia A.
Harris, Clare F. Barfoot, Caroline McG. Argo.
School of Veterinary Medicine, University of Surrey, Guildford, UK, School of
Veterinary Science, Leahurst Campus, University of Liverpool, UK, Waltham Centre
for Pet Nutrition, Melton Mowbray,UK , Mars Horsecare UK Ltd. Milton Keynes,UK.
The CGIT is recommended as a dynamic test for the evaluation of insulin
dysregulation (ID) and defines diagnostic thresholds for blood insulin and glucose
concentrations collected 45 and 75 minutes post-infusion. This study tested the
reliability and repeatability of the CGIT in diagnosing ID in native ponies maintained
under common husbandry/dietary management.
Six, Welsh Mountain pony mares (5-14 years, Outset BM, 216-244kg, BCS 3.8-
5.3/9) were fed hay at 2% BM as DM/day. The 30 week study (May–December)
was subdivided into six, successive 5-week periods (Periods 1-6). CGIT’s were
repeated on 4 occasions for all ponies, at intervals ≥5 weeks. Ponies were randomly
allocated for study across all 6 periods.
Ponies gained 8.2±2.9% of BM and 0.43/9±0.67/9 BCS points. Mixed-effects
models identified no effect of period on area-under-curve (AUC) for glucose,
however there was a trend for AUC insulin (using iT0, iT45, iT75, Immulite) to
increase from Period 1 to Period 6. Insulin concentrations at iT45 and iT75 were
tightly associated with AUCi (iT45, r2=0.99, iT75=0.84). All fasted insulin
concentrations were <20mU/L. At T45, 4/6 ponies had insulin concentrations
>100mU/L on at least one occasion (2 once; 1 twice; 1 all 4 tests). On no occasion
did any pony return to fasted insulin concentrations by T75. 4/6 ponies were
normoinsulinaemic (<20UmU/L) at T75 once (all P1) and one also at P2. Glucose
concentrations returned to baseline values by T45 for all bar one pony (last 2
tests). There is a requirement to redefine diagnostic ‘cut-off’ values for native
ponies.
29
Immunohistochemical Expression of Insulin, Glucagon and Somatostatin in
Pancreatic Islets from Insulin Sensitive and Insulin Resistant Horses
Kim Newkirk1,Gordon Ehrensing1,Agricola Odoi1,Nicholas Frank2
1Department of Biomedical and Diagnostic Sciences, College of Veterinary
Medicine, University of Tennessee, 2Department of Clinical Sciences Cummings
School of Veterinary Medicine, Tufts University
Objective: Hyperinsulinemia and insulin resistance are associated conditions in
horses and insulin secretion increases as tissue insulin sensitivity decreases. We
hypothesized that insulin-resistant (IR) horses would have increased insulin
staining of pancreatic islets when compared to insulin-sensitive (IS) horses.
Animals: 23 horses
Procedures: Horses were assigned to IS (n = 13) and IR (n = 10) groups on the
basis of frequently-sampled intravenous glucose tolerance tests and minimal model
analysis, or fasted insulin concentrations. Humane euthanasia was performed for
reasons other than this study, and pancreas samples were obtained for
immunohistochemical analysis. Pancreas tissues were stained for insulin, glucagon
and somatostatin and digital images were analyzed to determine expression of each
hormone relative to total islet area.
Results: No significant differences in insulin staining were detected between
groups and our hypothesis was not supported, but IR horses had a significantly less
glucagon within pancreatic islets than IS horses. Median (interquartile range)
percentage of total islet area staining positive for glucagon was 12% (5%, 13%) of
total islet area in IR horses, compared to 18% (16%, 22%) in IS horses (P =
0.001). Immunoreactive glucagon, insulin, and somatostatin were present in
approximately 15%, 63%, and 8% of total islet area, respectively.
Conclusions and Clinical Relevance: Insulin expression did not differ between IR
and IS groups and there was no evidence that insulin resistance increases insulin
secretion within pancreatic islets. Lower glucagon expression in IR horses may be
a result of compensatory down-regulation of hormone secretion in response to
hyperinsulinemia or hyperglycemia.
30
Effect of Varying the Dose of Karo Light Syrup on the Insulin Response to
the Oral Sugar Test
N.A. Jocelyn1, P.A. Harris2 and N.J. Menzies-Gow1
1Royal Veterinary College, UK,2WALTHAM Centre for Pet Nutrition, UK
The oral sugar test (OST) is used to identify equine insulin dysregulation (ID);
however only 0.1 and 0.15ml/kg Karo Light syrup (KLS) doses have been evaluated
previously. The study aimed to determine the effect of varying the KLS dose on the
OST insulin response and the test’s ability to distinguish between previously
laminitic (PL) and non-laminitic (NL) ponies. Eight ponies (5 PL, 3 NL) were fasted
overnight before and throughout testing. In a 3-way randomised crossover design
with 7 days between tests, 0.15ml/Kg, 0.3ml/Kg or 0.45ml/Kg KLS was
administered orally and blood samples obtained at 0-120 min. Serum [insulin] was
measured using a previously validated radioimmunoassay. Area under insulin
response curve (AUCi) was calculated. Differences in serum insulin response
between doses and between groups were assessed using mixed effects models.
Cut-offs were extrapolated. Serum [insulin] following 0.15ml/Kg significantly
(p<0.04) differed from 0.3ml/Kg only at 120 min; whilst serum [insulin] following
0.45ml/Kg significantly (p<0.02) differed from 0.15ml/Kg and 0.3ml/Kg at 30-120
min. The insulin response significantly (p<0.02) differed between NL and PL only
following 0.45ml/Kg at 60 (mean±SD 86.4±17.7
min. AUCi significantly (p<0.05) differed between NL and PL following 0.3 and
0.45ml/Kg. Using [insulin] >68, 59 or 135 µIU/ml between 60-90 min as cut-offs
following 0.15ml/Kg, 0.3ml/Kg or 0.45ml/Kg respectively, 5/5 OSTs from PL were
positive and 2/3 OSTs from NL were negative. Overall, a dose of 0.45ml/Kg Karo
light syrup may be preferably to differentiate PL and NL ponies.
31
Androgen Excretion in Horses with Equine Metabolic Syndrome and
Pituitary Pars Intermedia Dysfunction
Ruth A. Morgan1,2, Patrick W. F. Hadoke1, Brian R. Walker1 and John A. Keen2
1 University/BHF Centre for Cardiovascular Science, The Queen’s Medical Research
Institute, University of Edinburgh, 2 Royal (Dick) School of Veterinary Studies,
University of Edinburgh, UK.
Androgens are steroid hormones best known for their role in the development and
maintenance of sex phenotypes but also important in other organ systems including
bone and metabolism. Androgen production occurs principally in reproductive
tissues in males and both the adrenal glands and ovaries in females. The main
adrenal androgens in the human are dehydroepiandrosterone (DHEA) and
androstenedione, while androgens synthesised in extra-adrenal sites include
testosterone and dihydrotestosterone (DHT). Dysregulation of androgens and
androgen metabolism is associated with various disease states in humans. In
polycystic ovary syndrome for example, adrenal androgen synthesis is increased in
response to elevated ACTH and is thought to contribute to insulin resistance and
obesity in this syndrome. Furthermore, in obesity androgen metabolising enzyme
5α-reductase is up-regulated and androgen metabolite excretion is increased. This
study aimed to investigate whether equine metabolic syndrome (EMS) and pituitary
pars intermedia dysfunction (PPID) were associated with altered androgen
metabolism. Blood and urine samples were collected from castrated male and
female healthy horses (n=10), horses with EMS (n=6) and horses with PPID (n=6).
Androgen metabolites were measured by gas chromatography- tandem mass
spectrometry in urine and by ELISA in plasma. There was no effect of disease on
plasma androgen metabolite levels. Horses with EMS and PPID had significantly
higher urinary testosterone, aetiocholanolone and androstendiol levels compared to
healthy horses. Total androgen excretion was increased in both EMS and PPID. This
pilot study indicates that altered androgen metabolism may be a feature of EMS
and PPID and warrants further investigation.
32
Dissecting Metabolic Syndrome and Insulin Dysregulation Molecular
Pathophysiology using “Big Data”
ME McCue1, EM Norton1, S Jacob3, J Manfredi3, RJ Schafer1, NE Schultz1, SA
Durward-Akhurst1, JR Mickelson2 and RJ Geor3
1University of Minnesota, College of Veterinary Medicine, 2University of Minnesota,
College of Veterinary Medicine, Veterinary and Biomedical Sciences, 3Michigan State
University, College of Veterinary Medicine, Large Animal Clinical Sciences,4Massey
University, College of Sciences, NZ
Complex, multifactorial phenotypes, such as Equine Metabolic Syndrome (EMS), can
be dissected into molecular phenotypes at different levels across multiple tissues
that sum together to create clinical disease. Yet, few studies have attempted to
identify the metabolic derangements of EMS at a cellular or tissue level; thus our
understanding of EMS pathophysiology is based on clinical assays that fail to assess
the underlying molecular alterations within tissues. We have collected 11
morphometric, biochemical and hormonal phenotypes from > 900 horses/ponies.
Using this cohort, we have begun to dissect EMS molecular pathophysiology. At the
genomic level, heritability estimates for neck-circumference-to-height ratio (21%),
girth-to-height ratio (11%), insulin (32%), insulin post-OST (34%), leptin (14%),
adiponectin (55%) and ACTH (56%), have demonstrated that these phenotypes are
influenced by genetics. Using genome wide association in Welsh Ponies and
Morgans we have identified >180 chromosomal regions harboring >3,000 positional
candidate genes associated with these phenotypes. At the transcriptomic level,
preliminary analysis has identified 463 skeletal muscle and 798 adipose tissue
genes differentially expressed between hyper- and normo-insulinemic horses, and
1,001 muscle and 497 adipose genes differentially expressed between individuals
with high and low adiponectin concentrations. At the metabolomic level,
preliminary analyses of serum metabolites have identified significant differences
between hyper- and normo-insulinemic individuals for >130 molecules, including
metabolites involved in the tricarboxylic acid cycle, fatty acid and branched-chain
amino acid metabolism. Using biological networks of interactions between these
three categories of molecular phenotypes, we are working to unravel the complex
molecular interactions in EMS.
33
Identification of a Genetic Locus associated with Height and Fasting
Insulin in Welsh Ponies and Morgan Horses
Norton EM1, Avila F1, Schultz NS1, Mickelson JR2, McCue ME1
1University of Minnesota, College of Veterinary Medicine, Veterinary Population
Medicine, 2University of Minnesota, College of Veterinary Medicine, Veterinary and
Biomedical Sciences
Ponies have higher fasting insulin concentrations and are more insulin resistant
than horses. In humans and mice, genetic alleles resulting in small skeletal size
have also been associated with alterations in insulin and glucose metabolism. We
hypothesized genetic that loci affecting height in ponies have pleiotrophic effects on
metabolic traits. Pearson’s correlation coefficient identified an inverse relationship
between wither height and fasting insulin in 298 Welsh ponies (WP) (-0.26; 95% CI
-0.36 to -0.15; p-value: <6.4e-06). Using genome-wide association studies were
performed for height and fasting insulin in 232 WP and 286 Morgan horses, a locus
on chromosome 6 was significantly associated with height and fasting insulin in the
WP, but not in Morgans. HMGA2 was identified as a potential candidate gene, due
to a recently identified C.83G>A variant associated with height in Shetland ponies.
To date, we have genotyped 250 WP and 60 Morgans for this variant and identified
an allelic frequency of 0.802 and 0.375, respectively for the A allele. Correlations
were identified for the additive effect of the A allele on height [0.59; 95% CI -0.66
to -0.51; p-value: <2.2e-16 (WP) and 0.69; 95% CI -0.81 to -0.59; p-value: 7.4e-
10 (Morgan)] and baseline insulin values [0.22; 95% CI 0.10 to 0.34; p-value 3.5e-
04.22 (WP) and 0.46; 95% CI 0.23 to 0.64; p-value: 2.1e-04 (Morgan)]. These
data suggest that the variant in HMGA2 may have an effect on both height and
insulin, which has important implications for equine metabolic syndrome
susceptibility.
34
The Association between Endocrine Disrupting Chemicals and Equine
Metabolic Syndrome
Durward-Akhurst SA1, Norton EM1, Schultz NS1, Geor R3, Mickelson JR2, McCue
ME1
1University of Minnesota, College of Veterinary Medicine, Veterinary Population
Medicine, 2University of Minnesota, College of Veterinary Medicine, Veterinary and
Biomedical Sciences, 3University of Massey, College of Sciences
Our group has demonstrated that 49% of variability in Equine Metabolic Syndrome
(EMS) phenotypes is explained by shared environment; however only 4-18% of this
variability is explained by diet, exercise and season, suggesting that other
environmental factors play a role in EMS. Endocrine Disrupting Chemicals (EDCs)
are associated with metabolic syndrome and other endocrine abnormalities in
humans. Preliminary data demonstrated that horses from farms <=30 miles of EDC
disposal sites were more likely to have had laminitis, and had higher post oral sugar
challenge insulin concentrations (OST-INS), suggesting EDC exposure is an EMS
risk factor. We sought to determine if plasma EDC concentration is correlated with
metabolic measurements in 301 horses from 32 farms with bioassays that measure
aryl hydrocarbon receptor (AHR) and estrogen receptor (ER) activation by EDCs.
Mean (range) EDC-AHR and EDC-ER concentrations were 0.223 (0.02-2.47) and
279.66 (4.35-15,000) pg/ml plasma. EDCs were below the detection limit in
approximately half of the horses. AICc statistics were used to determine the best
linear multivariable regression model for EDC association with 9 EMS phenotypic
variables (glucose, OST-glucose, INS, OST-INS, triglycerides, leptin, adiponectin,
ACTH). Month sampled was associated with EDC-AHR (p=0.007). Hours grazing
was associated with EDC-ER (p=0.043). EDC-AHR interaction with plasma fat
extracted (p=0.060), and EDC-ER (p=0.050) approached significance with OST-
INS. The interaction between pregnancy and EDC-AHR concentration was
associated with leptin (p=0.046). The results suggest that some of the unexplained
environmental variance in individuals with EMS is due to EDC exposure mediated
through the AHR and ER.
35
Gene Expression Differences of Adipose and Gluteal Muscle Tissues in Four
Breeds of Horses with a Range of Insulin Sensitivities
Manfredi JM, 1 Geor RJ,2 Weber PSD, 1 LJ McCutcheon2, Kemper A,3 Schaefer R,4
McCue ME4
1Michigan State University, College of Veterinary Medicine, Large Animal Clinical
Sciences,2Massey University, College of Sciences, NZ, 3University of Illinois, College
of Veterinary Medicine, Veterinary Teaching Hospital,4University of Minnesota,
College of Veterinary Medicine, Veterinary Population Medicine,
Equine metabolic syndrome (EMS) and associated insulin dysregulation (ID) has
been identified as the most common cause of laminitis. Certain breeds seem
susceptible to EMS, and we have identified breed differences in metabolic
phenotypes. Muscle and adipose tissue have large roles in glucose and insulin
regulation. Here we compare gene expression within the tailhead adipose tissue
(TAT) and gluteal muscle in different breeds. Frequently sampled intravenous
glucose tolerance tests (FSIGTT), TAT, and muscle biopsies were performed in 28
geldings from four breeds. Gene expression in gluteal muscle and TAT was
measured using RNASeq. Differential gene expression was determined using HTSeq
and Limma Voom. Functional analysis of genes was performed using Ingenuity
Pathway Analysis (IPA). Each breed had a range of insulin sensitivities based on
minimal model analysis of the FSIGTT and uniquely differentially expressed genes
in each tissue (7-1347 in adipose, 94-691 in muscle). In TAT, top networks in
Arabians and Welsh Ponies (WP) were Carbohydrate Metabolism and Developmental
Disorders/Lipid Metabolism respectively. WP had upstream analysis activation of
cytochrome p450 reductase. There was upstream activation of hypoxia-inducible
factor 1-alpha and transforming growth factor beta 1 in Morgans and Arabians, with
deactivation in Arabians and activation in Morgans of forkhead box protein 01, C-X-
C Motif Chemokine Ligand 12, and growth hormone. In muscle, the top QH network
was Lipid Metabolism, with upstream analysis showing deactivation of fenofibrate,
pirinixic acid, and rosiglitazone. The top WP network was Energy Production/Lipid
Metabolism. Breed specific patterns of differentially expressed genes may
contribute to ID.
36
Horse-Factors Influencing the Seasonal Increase in Plasma ACTH Secretion
Andy Durham, Helen Shreeve
The Liphook Equine Hospital, UK; Boehringer Ingelheim, UK
Published studies describe an increase in plasma ACTH in August, September and
October with PPID cases exhibiting a greater magnitude of seasonal increase than
normal horses. Data were examined from almost 150,000 chilled plasma samples
between January 2012 and August 2016. Data were categorised by age, gender,
breed and colour to examine differences in ACTH concentration through the year.
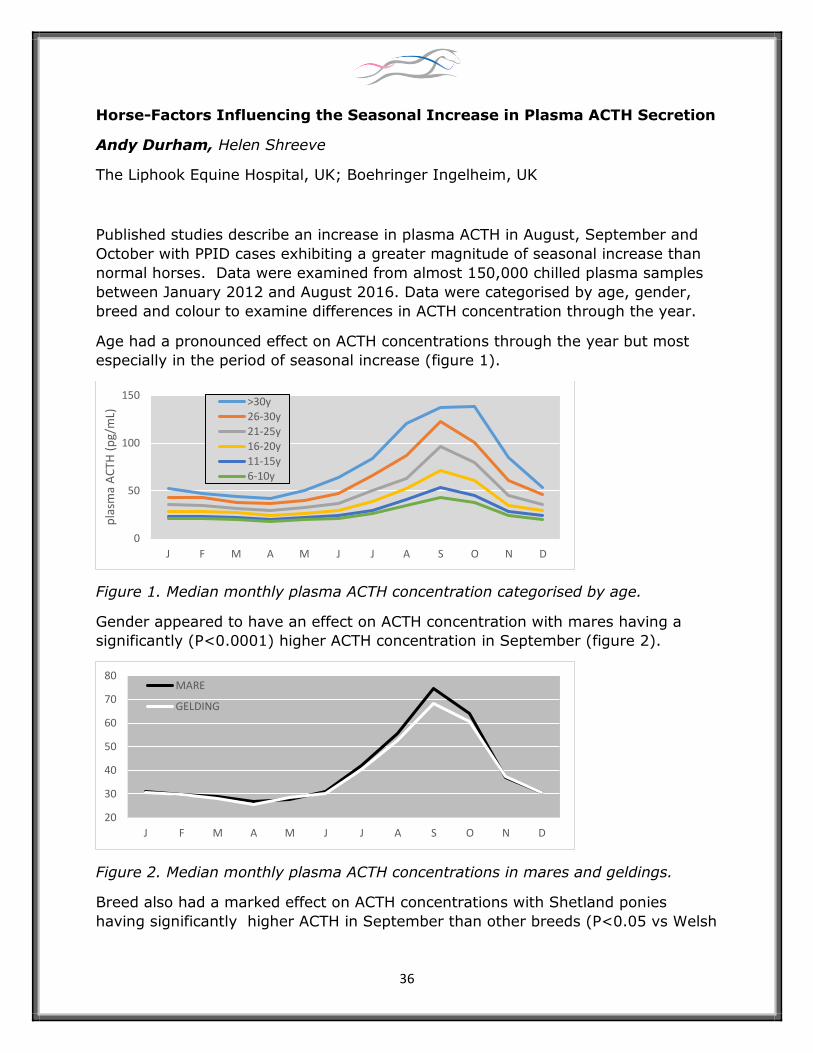
Age had a pronounced effect on ACTH concentrations through the year but most
especially in the period of seasonal increase (figure 1).
Figure 1. Median monthly plasma ACTH concentration categorised by age.
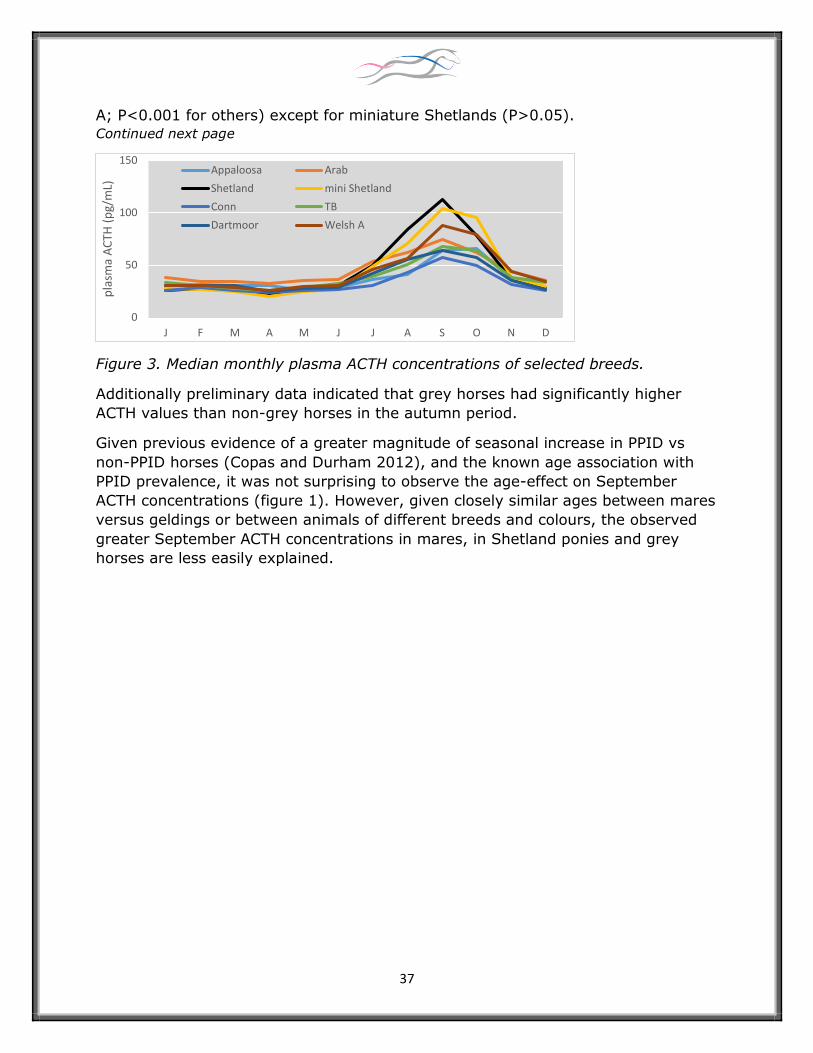
Gender appeared to have an effect on ACTH concentration with mares having a
significantly (P<0.0001) higher ACTH concentration in September (figure 2).
Figure 2. Median monthly plasma ACTH concentrations in mares and geldings.
Breed also had a marked effect on ACTH concentrations with Shetland ponies
having significantly higher ACTH in September than other breeds (P<0.05 vs Welsh
0
50
100
150
J F M A M J J A S O N D
pla
sma
AC
TH (
pg/
mL)
>30y26-30y21-25y16-20y11-15y6-10y
20
30
40
50
60
70
80
J F M A M J J A S O N D
MARE
GELDING
37
A; P<0.001 for others) except for miniature Shetlands (P>0.05).
Continued next page
Figure 3. Median monthly plasma ACTH concentrations of selected breeds.
Additionally preliminary data indicated that grey horses had significantly higher
ACTH values than non-grey horses in the autumn period.
Given previous evidence of a greater magnitude of seasonal increase in PPID vs
non-PPID horses (Copas and Durham 2012), and the known age association with
PPID prevalence, it was not surprising to observe the age-effect on September
ACTH concentrations (figure 1). However, given closely similar ages between mares
versus geldings or between animals of different breeds and colours, the observed
greater September ACTH concentrations in mares, in Shetland ponies and grey
horses are less easily explained.
0
50
100
150
J F M A M J J A S O N D
pla
sma
AC
TH (
pg/
mL)
Appaloosa Arab
Shetland mini Shetland
Conn TB
Dartmoor Welsh A
38
Pharmacokinetics and Pharmacodynamics of Oral Pergolide Mesylate in
Horses with Pituitary Pars Intermedia Dysfunction
D. I. Rendle1, G. Doran2, J. Ireland2 and S. Edwards3
1School of Animal and Veterinary Sciences and 2School of Agricultural and Wine
Sciences, EH Graham Centre for Agricultural Innovation (Doran), Charles Sturt
University, Wagga Wagga, New South Wales 2650, Australia. 3 The Animal Health
Trust, Lanwades Park, Kentford, Newmarket, Suffolk, CB8 7UU
Objectives: Investigate pharmacokinetic and pharmacodynamic properties of
orally administered pergolide in horses with pituitary pars intermedia dysfunction
(PPID).
Study design: Cohort study
Methods: Six horses with clinical and endocrinological PPID received oral pergolide
(Prascend; Boehringer Ingelheim) at 4 μg/kg for 18 days. Samples were collected
0.5 hours before and 2 and 12 hours after administration of pergolide daily for 18
days. Plasma pergolide and adrenocorticotropic hormone (ACTH) concentrations
were determined using high-performance liquid chromatography–tandem mass
spectrometry and a chemiluminescent immunoassay respectively.
Results: Maximum plasma concentrations after the first oral dose of pergolide
(0.104 to 0.684 ng/mL; mean 0.308 ± 0.201 ng/mL) were not significantly
different to the maximum steady state concentration at day 18 (0.197 to 0.628
ng/mL; mean 0.336 ± 0.159 ng/mL). A marked difference between mean plasma
peak and trough concentrations of pergolide remained throughout the study.
Pergolide concentration reached steady state within 3 days and the drug did not
accumulate (R=1.09). Plasma ACTH concentration reduced significantly within 12
hours of the first dose of pergolide with further reductions occurring over the next
10 days. Although there were parallel fluctuations in the concentrations of pergolide
and ACTH, timing of ACTH measurement in relation to the administration of
pergolide did not have a significant effect.
Clinical Implications: Oral pergolide rapidly suppresses the pars intermedia in
horses with PPID. Follow-up testing may be possible earlier than is employed
currently. More frequent dosing may reduce fluctuation in pergolide and ACTH
concentrations which might have implications for patient monitoring.
39
Insulin Assay Choice Affects Results of the Oral Sugar Test
Knowles, E.J.1,2, Harris, P.A.3, Elliott, J.1 and Menzies-Gow, N.J.1
1The Royal Veterinary College, UK, 2Bell Equine Veterinary Clinic,Kent,UK, 3WALTHAM Centre for Pet Nutrition, Leicestershire, UK
Aims: Diagnostic thresholds for serum [insulin] in the oral sugar test (OST) were
originally derived using a radioimmunoassay (RIA) that is discontinued. Different
immunoassays may yield different results and affect interpretation of the OST. This
study aimed to compare OST results using different assays for serum [insulin]
analysis.
Methods: OSTs (0.3ml/kg karo-light syrup) were performed on 41 ponies with no
known history of laminitis. Serum [insulin] 60 minutes after dosing was analysed
concurrently using 3 insulin assays, a chemiluminescent immunoassay (Immulite)
and two radioimmunoassays (MP Biomedicalsb (MP) and Milliporec). Differences
between results were compared by Bland-Altman plots and a within-subjects
ANOVA of logarithmically transformed data. Values above (n=1) or below (n=4) the
calibration range for each assay were assigned an arbitrary value of the range limit.
Results: Median (range) for each assay were MP 70 (24-310)µIU/ml, Millipore 40
(16-226)µIU/ml, Immulite 11 (2-147)µIU/ml. The differences between all assays
were proportional to their means. Percentage difference Bland-Altman plots
indicated proportionally lower results for the Immulite assay at low concentrations
than at high concentrations when compared with either radioimmunoasay. All
assays differed from each other (p<0.001). Mean ratios (95% confidence intervals)
for the differences between assays were: MP:Immulite 6.7 (5.2-8.7), Millipore:
Immulite 4.0 (3.1-5.1), MP:Millipore 1.7 (1.6-1.8). Figure 1 shows the correlation
between assays.
Conclusions: The chemiluminescent assay yielded lower results than either RIA
particularly at low serum [insulin] and may be unsuitable for OST interpretation at
this dose of sugar. Insulin results are assay dependent. Laboratory specific
diagnostic thresholds should be derived. Continued next page
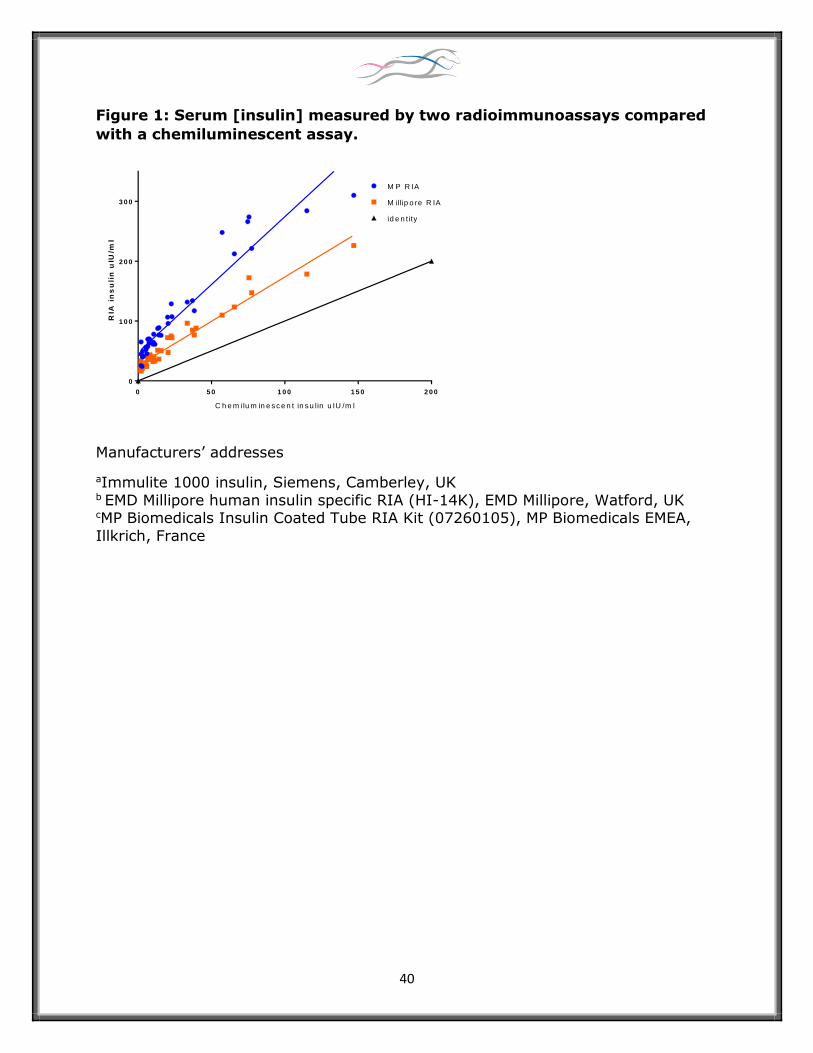
40
Figure 1: Serum [insulin] measured by two radioimmunoassays compared
with a chemiluminescent assay.
0 5 0 1 0 0 1 5 0 2 0 0
0
1 0 0
2 0 0
3 0 0
C h e m ilu m in e s c e n t in s u lin u IU /m l
RIA
in
su
lin
uIU
/ml
M P R IA
M illip o re R IA
id e n t ity
Manufacturers’ addresses
aImmulite 1000 insulin, Siemens, Camberley, UK b EMD Millipore human insulin specific RIA (HI-14K), EMD Millipore, Watford, UK cMP Biomedicals Insulin Coated Tube RIA Kit (07260105), MP Biomedicals EMEA,
Illkrich, France
41
The Effect of pH on Large Intestinal Ion Transport and Transepithelial
Resistance in Suspected Insulin Resistance Horses
Frank M. Andrews,1 Marion Thibault,1 Catherine Koch,1 Michael L. Keowen,1 Nicole
Arana Valencia,2 Michael T. Kearney,1 Nicholas Frank3
1Equine Health Studies Program, Department of Veterinary Clinical Sciences, School
of Veterinary Medicine; 2Department of Animal Science, Louisiana State University,
Baton Rouge, LA; 3Department of Clinical Sciences, Cummings School of Veterinary
Medicine, Tuft University, North Grafton, MA.
Aims: Hyperinsulinemia might cause alterations in large intestinal ion transport
and transepithelial resistance which might lead to colitis and diarrhea. These
factors might be critical when colon pH is decreased because of intake of feeds with
high soluble carbohydrate content. The purpose of this study was to determine the
effect of the pH on colonic mucosa in insulin resistance horses using an in-vitro
Ussing chamber system.
Methods: Tissue samples of the right dorsal colon were collected in suspected
insulin resistant (n=4) and normal (n=5) horses immediately after euthanasia. The
colonic mucosa was dissected from the muscular layers and mounted in an Ussing
chambers. Ussing chambers are used to measure ion transport and transepithelial
resistance in gut mucosa, as an indicator of viability and permeability. Colonic
tissue was exposed to pH 4, 6, or 7 (control) on the mucosal side and pH 7.0 on the
submucosal side. Potential difference (PD) and short circuit current (Isc) were
measured every 15 minutes. Tissue transepithelial resistance (TER) was calculated
from the open-circuit PD and Isc, using Ohm's Law (R=PD/Isc).
Results: The mean Isc and TER did not change in the colonic tissues from control
horses when exposed to different pH. However, mean Isc decreased rapidly in right
dorsal colon tissues exposed to pH 4.0, but this was not significant. Also, mean
TER decreased significantly (P<0.015) in colon tissues exposed to pH 4.0 from
insulin resistant horses, when compared to tissues exposed to pH 6 or 7.
Conclusion: Hyperinsulinemia in horses with insulin resistance might be
predisposed to alterations in mucosal ion flux and transepithelial resistance,
especially when there is a drop in pH after feeding a diet high in soluble
carbohydrates and lead to colitis and diarrhea. These data are preliminary and
further research is indicated to confirm this trend.
42
Comparison and Clinical Interpretation of Three Methods for Measurement
of Equine Insulin
T. Warnken1, K. Huber2, K. Feige1
1 Clinic for Horses, University of Veterinary Medicine Hannover, Foundation,
Hannover, Germany, 2 Institute of Animal Sciences, Faculty of Agricultural Sciences,
University of Hohenheim, Stuttgart, Germany
In clinical use, determination of equine insulin dysregulation requires exact insulin
quantification. However, striking differences in values obtained from different
immunoassays exist. Most assays used in veterinary medicine include antibodies
directed against human insulin, although amino acid sequences between equine and
human insulin differ. Therefore, the aim of this study was to test the accuracy of an
equine-optimized insulin ELISA, to compare it to a frequently used
radioimmunoassay (RIA), to a chemiluminescence immunoassay (CLIA), and to test
their clinical applicability. Forty samples used for comparison of methods were
obtained from seventeen horses and ponies of various breeds and body condition
scores (6.8±1.1) under fasting conditions as well as during oral glucose testing
procedures. All intra- and inter-assay coefficients of variations (CVs) determined by
the ELISA differed concentration-dependent, but were within the acceptable range
for clinical use of immunoassays. In diluted and non-diluted samples from both,
fasted and glucose-stimulated horses, insulin values obtained by CLIA were
significantly (p<0.001) lower when compared to values obtained by ELISA or RIA.
However, values measured by ELISA and RIA were not significantly different.
Calculated recovery upon dilution was 101±11 % for CLIA, 160±41 % for RIA, and
98±4 % for ELISA. Our findings indicate that the tested equine-specific insulin
ELISA appeared to be an appropriate assay to determine equine insulin
concentrations. Nonetheless, comparison of insulin concentrations measured by
different methods should be interpreted carefully, especially in clinical cases, where
small changes in insulin levels can cause false classification of healthy or insulin
dysregulated horses.
Acknowledgement: This work was financially supported by Boehringer Ingelheim.
43
Blood Glucose and Insulin Concentrations Following Xylazine HCl and
Detomidine HCl administration in Insulin Resistant and Normal Horses
Kritchevsky, JE1 and Hess, EK1 and Bertin, FR2.
1Purdue University, West Lafayette, IN, 2University of Queensland, Gatton, QLD
Alpha2 sedatives cause decreases in insulin secretion followed by hyperglycemia in
normal horses. This study was conducted to determine how insulin resistant (IR)
horses respond to alpha2 drugs.
Eight horses, 4 IR and 4 controls, were given either 1.1 mg/kg xylazine HCl or 30
µg/kg detomidine HCl I.V. Blood was collected for glucose and insulin
concentrations at 0 (baseline), 0.25, 0.5, 0.75, 1.0, 1.5, 2.0, 3.0, and 5.0 h. Horses
received each in random order with a 24 h washout period between drugs.
Baseline insulin was significantly higher in ID horses (49.9 ± 39.2 µIU/mL vs 16 ±
6.8 µIU/mL, p < 0.001); however, there was no difference in glucose baseline.
Injection of xylazine resulted in significant decreases in insulin (p < 0.001) and
increases in glucose (p < 0.001) in both ID and control horses with no significant
effect of insulin dysregulation. Injection of detomidine also resulted in significant
decreases in insulin (p < 0.001) and increases in glucose (p < 0.001) in both ID
and control horses; however, there was a trend for a milder effect in ID horses (p =
0.086). Regardless of the drug used, alpha2-agonists caused a decrease in insulin
after 15 min and an increase in glucose maximal at 45 min; however, in control
horses, detomidine injection resulted in a significantly lower insulin at 1.5 and 2.0h
(11.94 ± 4.07 vs. 34.60 ± 25.33, p < 0.01 and 17.86 ± 6.00 vs. 37.48 ± 15.00, p
< 0.05, respectively).
44
Sensitivity and Specificity of Fasted Basal Insulin compared to Dynamic
Testing in Horses and Ponies with suspected Equine Endocrine Disease
C.M. McGowan,1,2 R.B. Olley2 and H.B. Carslake1,2
1Institute of Aging and Chronic Disease, 2Institute of Veterinary Science, Faculty of
Health and Life Sciences, University of Liverpool, Leahurst, Cheshire, UK.
Basal insulin testing is popular in practice yet limited data exist comparing it to
dynamic testing for diagnosis of insulin dysregulation in clinical cases. We
hypothesised that basal insulin would have a low sensitivity compared to the
combined glucose-insulin test (CGIT) and this would be more pronounced in horses
on a low NSC diet. 129 CGIT tests from 67 fasted horses were evaluated. Basal
insulin was correlated (P<0.001) to insulin at 45min (rs=0.66) and 75min
(rs=0.72), AUCinsulin (rs=0.67), glucose at 45min (rs=0.53) and AUCglucose
(rs=0.50). There were 82/129 (64%) CGIT and 12/129 (9%) basal insulin positive
tests using conventional criteria (basal insulin < 20mIU; 45min insulin > 100mIU/L
and/or glucose > baseline and > 6mmol/L at 45min). Specificity and sensitivity of
basal insulin were 100% and 16.5% respectively; ROC analysis revealed maximum
sensitivity (77.8%) and specificity (68.8%) occurred at ≥ 3.03 mIU/L. Horses with
current (59/129) or current and historical laminitis (95/129) were more likely to
have a positive CGIT test (P<0.05), but there was no effect of obesity or baseline
diet. There was a trend for horses on a low NSC diet to have a false negative basal
insulin (P=0.07) based on conventional CGIT cutoffs, especially for glucose at
45min (P=0.05), but no effect of current laminitis or obesity. Basal insulin is
strongly correlated to tests of dynamic insulin sensitivity but has a poor sensitivity
at conventional cut-offs in fasted horses. Basal insulin cut-off values should be
revised and further work comparing unfasted to fasted horses is warranted.
45
Postprandial Gastric Inhibitory Polypeptide Responses of Different Equine
Breeds adapted to meals containing Micronized Maize
CL Baskerville1, NJ Bamford1, PA Harris2, SR Bailey1.
1Faculty of Veterinary and Agricultural Sciences, University of Melbourne, Victoria,
AUS, 2WALTHAM Centre for Pet Nutrition, Leicestershire, UK.
The pancreatic insulin response to dietary non-structural carbohydrates (NSC) is
partly due to the release of incretin hormones (gastric inhibitory polypeptide [GIP]
and glucagon-like peptide-1 [GLP-1]) from specialized enteroendocrine cells. There
are breed differences in the GLP-1 response to dietary NSC in equids, but GIP levels
have not been similarly determined.
Four Standardbred horses (5 to 14 yr, BCS 5.2 ± 0.2), 4 mixed-breed ponies (5 to
10 yr, BCS 5.3 ± 0.3) and 4 Andalusian-cross horses (4 to 11 yr, BCS 5.7 ± 0.3)
were studied. Animals were adaptated to twice-daily meals containing micronized
maize over a 12-week period, ultimately providing 1.1 g/kg BW of starch in each
meal. Serial blood samples were obtained following the first meal at 8am and the
second meal at 4pm. Plasma concentrations of total GIP were determined using an
ELISA (Merck Millipore, Darnstadt, Germany) previously validated for equine
plasma. The area under the plasma GIP curves (AUC) were compared between
breeds by Kruskal-Wallis test with Dunn’s post hoc test.
Plasma GIP peaked approximately 2 hours after the grain-containing meals. Ponies
exhibited significantly greater peak GIP and AUC values compared to the other two
breeds (P<0.05). This study further demonstrates breed differences in the
enteroinsular endocrine axis that may contribute to hyperinsulinemia in ponies. An
improved understanding of the factors that contribute to equine hyperinsulinemia is
of critical importance in reducing the prevalence of laminitis in domestic horse
populations.
46
Associations between Body Fat and Indicators of Insulin Dysregulation
Philippa K. Morrison, Alexandra, H.A. Dugdale, Dai H. Grove-White, Patricia A.
Harris, Clare F. Barfoot, Caroline McG. Argo.
School of Veterinary Medicine, Manor Park Campus, University of Surrey, Guildford
UK. School of Veterinary Science, Leahurst Campus, University of Liverpool, UK.
Waltham Centre for Pet Nutrition, Melton Mowbray, UK, Mars Horsecare UK Ltd.
Milton Keynes,UK.
Obesity and age are known risk factors for insulin dysregulation (ID) in the horse.
This study investigated associations between markers of adiposity and indicators of
insulin dynamics as evaluated by the CGIT.
Eighteen mature individually housed Welsh Mountain pony mares were fed hay at
an estimated maintenance level (2% of BM as daily DMI). Animals were divided into
3 groups: Control (n=6; 5-15 years, BCS 3.8-5.3/9, BM 216-244kg), obese (n=6;
5-15 years, BCS >7/9, BM 276-323kg), geriatric (n=6; 19-27 years, BCS 4-7.4/9,
BM 212-288kg). The 30 week study (May–December) was subdivided into six,
successive 5-week periods (Periods 1-6). CGIT’s were repeated on 2 occasions for
all ponies, at intervals of ≤5 weeks. Ponies were randomly allocated for study
across all 6 periods.
Mixed-effects models identified with area-under-curve for insulin (using T0, 45 and
75; Immulite) or iT0 as outcome variables revealed a strong positive association
between age and AUCi (p<0.05), with a weaker positive association between AUCi
and BCS and no associations for ultrasound measures of fat (rump, ribeye, ventro-
abdominal retroperitoneal) or percentage body fat (deuterium dilution) and AUCi.
Conversely, there was no association for age and ultrasound or deuterium dilution
measures of fat with iT0, with moderate positive associations between BCS and iT0.
Together, these data suggest that ultrasound and deuterium dilution measures of
body fat are not predictive of insulin dynamics and that in this study, whilst
geriatric ponies showed no difference in baseline insulin, they demonstrated greater
AUCi than their younger counterparts.
47
Sensitivity or Resistance to Diet-Induced Weight Loss is associated with
Insulin/Glucose Dynamics
Philippa K. Morrison, Alexandra, H.A. Dugdale, Dai H. Grove-White, Patricia A.
Harris, Clare F. Barfoot, Caroline McG. Argo
School of Veterinary Medicine, Manor Park Campus, University of Surrey, Guildford
GU2 7AL, UK. Department of Veterinary Clinical and Animal Sciences, Faculty of
Health and Medical Sciences, Leahurst Campus, University of Liverpool, CH64 7TE,
UK. Waltham Centre for Pet Nutrition, Melton Mowbray, LE14 4RT, UK, Mars
Horsecare UK Ltd. Milton Keynes, MK12 5PZ, UK.
For obese animals, weight loss (WL) management requires the imposition of
negative energy balance. Physiological responses to under-nutrition are poorly
understood. Starved horses switch to tissue catabolism with corresponding
decreases in plasma insulin.
We used the CGIT to evaluate pre- and post-diet insulin/glucose dynamics in 8
obese (BCS>7/9), native pony mares undergoing controlled WL management in
winter. All ponies were fed hay at 2% BM as daily DMI (~maintenance), before hay
intake was halved (diet) for 7 weeks.
Ponies lost 1.15±0.20% of BM weekly. Published CGIT ‘cut-offs’ classified 1/8, 8/8
and 7/8 ponies as insulin-dysregulated pre-diet on the basis of insulin
concentrations (Immulite) at T0 (11.3±7.2mU/L), T45 (217.6±90.1mU/L) and T75
(152±184mU/L). Post-diet, insulin concentrations were decreased at T0 (-33
±20%) but increased in 7/8 animals at T45 (+47±50%) and T75 (+168±191%).
The magnitude of individual WL was associated with the percentage change in
insulin concentrations pre- and post-diet (r2’s, T0, 0.38; T45, 0.88; T75, 0.47;
AUCi, 0.86). Pre-diet insulin concentrations were useful predictors of WL
sensitivity/resistance (r2’s, T0, 0.55; T45, 0.78; T75, 0.47; AUCi, 0.79). AUCi and
iT45 were strongly associated (r2=0.98). All ponies were normoglycaemic (T0,
5.1±0.2mmol/L) pre- and post-diet but the time taken to return to baseline glucose
(RBG) concentrations post-infusion, increased post-diet (78.1±37 to120±34
minutes). Pre-diet RBG was a useful predictor of WL sensitivity (r2=0.76).
WL resistant animals had lower insulin responses but more rapid glucose clearance
rates pre-diet. Although these animals had relatively greater increases in insulin
concentrations post-diet, glucose clearance rates did not increase proportionately.
48
Diet-Induced Obesity does not similarly affect Glucose Tolerance in
Shetland Pony Mares
E. Roelfsema, C. Gibson, T.A.E. Stout, M. de Ruijter-Villani
Department of Equine Sciences, Faculty of Veterinary Medicine, Utrecht University,
Utrecht, The Netherlands
Background: Under field circumstances not every obese pony in a herd develops
hyperinsulinemia. Is experimentally-induced obesity able to overcome these
individual differences?
Objectives: To examine the repeatability of the effects of an experimentally
dietary-induced obesity on oral glucose tolerance in three different groups of
Shetland pony mares in three different years.
Methods: In three following years different groups of pony mares were divided in a
control (C) and test group (T). (Group1: 7T/4C; Group2: 3T/3C; Group3: 2T/3C).
Test group was fed 200% of maintenance netto energy (NE) requirements to induce
weight gain for about 20-28 weeks. Control group was fed 100% NE requirements.
Each pony underwent oral glucose tolerance testing before the start, at the end and
during the dietary period (2-3 times). Ponies were weighed weekly. Statistical
analyses were performed using a general linear mixed model and Bonferroni test.
Differences were considered significant when P<0.05.
Results: Bodyweight increased in all test ponies (bodyweight range 123-202 kg;
increase range 30-65 kg; median 45.5 kg). On the diet all test ponies significantly
decreased the area under the curve (AUC) for plasma glucose concentration
compared to the control group. On the diet group 1 and 3 test ponies increased the
AUC insulin in contrast with group 2 test ponies. The control group did not show
significant changes in AUC glucose or AUC insulin in all three years.
Conclusion: Dietary-induced obesity is an important factor in the occurrence of
insulin dysregulation however does not overrule individually based factors involved
in regulating the response.
49
Long-Term and Short-Term Dopaminergic (Cabergoline) and
Antidopaminergic (Sulpiride) Effects on Indices of Insulin Sensitivity in
Horses
Nicole Arana-Valencia, Donald L. Thompson, Jr., and Erin L. Oberhaus
School of Animal Sciences, Louisiana Agricultural Experiment Station, LSU
AgCenter, Baton Rouge, LA
Dopaminergic drugs used to treat pituitary pars intermedia dysfunction (PPID) in
horses have been shown to improve insulin sensitivity in humans and rodents.
Moreover, D2 receptor knockout mice have revealed that dopamine is needed for
normal insulin secretion and normal glucose tolerance. Other reports show that
dopaminergic agents may not have any effect on insulin sensitivity in horses. High
serum insulin concentrations, insulin resistance and laminitis are typical symptoms
of horses with equine metabolic syndrome and in some instances, but not always,
in horses affected with PPID. There is speculation whether the loss of dopaminergic
control to the pars intermedia leads to higher insulin secretion. Four experiments
were conducted to determine the effect of dopaminergic inhibition or stimulation on
insulin secretion and insulin sensitivity in horses. The first experiment tested the
long-term effects of cabergoline in insulin insensitive mares, while the second
tested the short-term effects of cabergoline on insulin sensitive and insensitive
mares. Experiments three and four tested the long-term effects of sulpiride in
insulin sensitive and insensitive geldings and the short-term effects of sulpiride in
insulin sensitive and insensitive mares, respectively. Results gathered from these
experiments concluded that neither increased nor decreased dopaminergic activity,
in the long or short-term, had any impact on insulin secretion after glucose infusion
or insulin sensitivity in horses (P > 0.1), regardless if starting insulin sensitivity
status. These results support the model in which dopaminergic agents have little
efficacy on insulin sensitivity and that insulin resistance may develop independently
of dopaminergic alterations.
50
Incretin Receptor Antagonists Decrease the Equine Insulin Response to
Incretin Hormones In Vitro
M. H. Kheder, M. N. Sillence and M. A. de Laat
Queensland University of Technology, Brisbane, AUS
Abbreviations: EC50; half-maximal effective concentration, GIP; glucose-dependent
insulinotropic peptide, GLP-1; glucagon-like peptide-1
Background: The incretin hormones glucagon-like peptide-1 (GLP-1) and glucose-
dependent insulinotropic peptide (GIP) augment the insulin response to oral glucose
in insulin-dysregulated ponies. If antagonists of the human GLP-1 and GIP
receptors can attenuate the effects of incretins in horses they may be useful for
treating hyperinsulinaemia.
Aim: To develop an in vitro model for investigating equine incretin action and to
determine whether commercially-available GLP-1 and GIP antagonists inhibit
incretin-stimulated insulin release.
Methods: Pancreatic islets were isolated from fresh, abattoir-sourced horse
pancreas (n=5) using collagenase digestion and layering through a density
gradient. Islet viability was confirmed microscopically and by demonstrating insulin
release in response to glucose stimulation. Insulin secretion was stimulated for 60
min with increasing concentrations of GIP or GLP-1 to determine the half-maximal
effective concentration (EC50) for each hormone. Insulin secretion was then
measured at the EC50 for GLP-1 and GIP, in the presence and absence of their
respective antagonists (Exendin 9-39 and pro3GIP).
Results: Viable pancreatic islets were isolated successfully from horses and their
insulin secretion was concentration-dependent with glucose. Insulin release was
stimulated by both hormones in a concentration-dependent manner with a maximal
insulin concentration of 484 µIU/mg of protein at 1µM GLP-1 and 299 µIU/mg of
protein at 0.1µM GIP. The antagonists achieved a similar decrease (30%) in the
insulin response to GLP-1 (P=0.06) and GIP (P=0.04).
Conclusions: Incretin-stimulated insulin secretion in horses can be partially
inhibited with antagonists. Further investigation of these compounds in vivo may
identify new therapeutic strategies for equine insulin dysregulation.
Acknowledgement: This study was funded by the Australian Research Council
51
Metformin for the Treatment of Equine Metabolic Syndrome: A Prospective
Field Study
Kamus L, Vargas A, Lavoie JP
Department of Clinical Sciences, Faculty of Veterinary Medicine, Université de
Montréal
Metformin is used to treat Metabolic Syndrome in humans, owing to its anti-
hyperglycemic properties, which improve insulin sensitivity and reduce hepatic
gluconeogenesis. Despite an unfavorable pharmacokinetic in this species,
veterinarians and clients have anecdotally reported that metformin improves the
clinical signs associated with Equine Metabolic Syndrome (EMS). The aim of this
study was to assess the owner appreciation, the clinical signs and the insulinemic
response of horses with EMS following an enteral administration of metformin in a
placebo controlled blinded prospective study.
Sixteen horses were recruited by equine veterinarians from Quebec. Enrollment
criteria included clinical signs of EMS including being an easy keeper, exercise
intolerance, regional/general obesity and history of laminitis. Horses with laminitis
requiring medications or having concurrent medical conditions were excluded.
Horses were randomly administered either metformin (n=10) or placebo (n=6)
orally twice daily for 30 days. A standardized physical examination and an oral
glucose stimulation test (OGST) were performed by attending veterinarians prior to
and after either treatment. Owners were also asked to fill out a questionnaire,
before, during and after the completion of the study.
Metformin improved the body weight (p=0.04) and the owner’s assessment of the
overall condition of the horses (current activity acceptance, overweight) and their
subjective assessment of the body weight (p=0.01). There were no significant
changes in the OGST and the baseline insulin levels decreased only after placebo
treatment. Taken together, these results support a beneficial effect of metformin in
the clinical signs of EMS, but the insulin response was unaltered.
Acknowledgement: This study was financially supported by an unrestricted
research grant from Zoetis Canada.
52
Use of an IGF-1 Receptor Antagonist in Hyperinsulinemic Laminitis
Dianne McFarlane1, Todd Holbrook1, Julie Engiles2, Darla Moser1;
1Center for Veterinary Health Sciences, Oklahoma State University, Stillwater OK;
2New Bolton Center, University of Pennsylvania, Kennett Square PA
Introduction: Endocrinopathic laminitis has been induced in normal horses by
sustained administration of high dose insulin, resulting in clinical and histological
signs similar to naturally occurring disease. Preliminary studies investigating the
expression of receptors and glucose transporters in the equine foot along with the
proliferative and elongated appearance of the secondary lamellae in
endocrinopathic laminitis have led to the hypothesis that hyperinsulinemia may
cause endocrinopathic laminitis through activation of the IGF-1 receptor (IGF-1R) in
the laminae rather than a direct action at the insulin receptor.
Hypothesis: Regional perfusion of an IGF-1R antagonist will prevent induction of
laminitis secondary to hyperinsulinemic clamp
Methods and Materials: • Horses (n=5) were exposed to high insulin concentrations (HEC) for 72 hrs • One limb injected with PBS, one with an IGF-R antagonist once daily by
regional perfusion for 3 doses • Clinical response was monitored
• Horses were euthanized, hoof sections collected and assessed by a blinded pathologist (JE) Results:
Clinical signs: • 2/5 horses were lame at 72 hrs
• 4/5 horses had heat in feet, increased digital pulses or weight shifting during the last 24 hrs; all worse in control limb • 1/5 horses no clinical evidence of laminitis
Histological signs: • 5/5 horses showed bilateral evidence of laminitis
• 3/5 horses had marginally less severe signs in treated foot Summary: • The hyperinsulinemic clamp caused clinical lameness in only 2/5 horses
• Clinical signs were worse in the control foot, typically at 48 hours of clamp, in 4/5 horses
• IGF-1R antagonist was associated with a mild improved histology in only 3/5 cases
• Reason for “failure” may include timing of sample collection, inappropriate IGF-1 receptor antagonist dose or drug delivery to the tissue, or lack of drug specificity to equine receptor
• Alternatively, IGF-1 R activation may not be the mechanism of endocrinopathic laminitis
53
Insulin Dysregulation and Inflammation
S. Elzinga1, D. Barker1, S. Schindler2, and A. Adams1
1M.H. Gluck Equine Research Center, Department of Veterinary Science, University
of Kentucky, Lexington, Kentucky,2College of Veterinary Medicine, Lincoln Memorial
University, Harrogate, Tennessee
Abstract
Insulin dysregulation (ID) in horses is associated with many negative health
conditions. Particularly concerning is its association with the inflammatory disease
of the hoof tissue, laminitis. However, the link between ID and systemic
inflammation in the horse remains unclear. In order to better understand potential
relationships between ID and inflammation, inflammatory and insulinemic
responses to an oral sugar test (OST) were determined. To accomplish this, 5
horses with ID and 5 normal controls were selected. All horses were administered
an OST at 0.15ml*bw (kg), with jugular venipuncture blood samples taken prior to
as well as 30, 60, 90, and 240 minutes post oral sugar administration. Serum
samples were used to measure insulin concentrations and heparinized plasma to
isolate peripheral blood mononuclear cells (PBMCs). PBMCs were used to measure
inflammatory cytokine protein concentrations using flow cytometry. Results were
analyzed with a repeated measures ANOVA procedure in SIGMAPLOT version 12.3
(Systat Software Inc.) and results considered statically significant when p < 0.05.
Horses with ID had significantly higher serum insulin concentrations compared to
controls 60 minutes following oral sugar administration. Furthermore, ID horses
had a significantly higher percentage of cells producing inflammation at this same
time point compared to control horses. These data provide evidence for a link
between insulin dysregulation and inflammation, and may indicate potential
mechanisms relating to the predisposition to and pathogenesis of laminitis.
54
The Effect of Docosahexaenoic Acid (DHA) Supplementation on Metabolic
and Inflammatory Parameters of Horses with Equine Metabolic Syndrome
(EMS)
S. Elzinga1, D. Barker1, M. Siard1, C. Stewart1, K. Brennan2, and A. Adams1
1M.H. Gluck Equine Research Center, Department of Veterinary Science, University
of Kentucky, Lexington, Kentucky,2Center for Animal Nutrigenomics and Applied
Animal Nutrition, Alltech Inc, Nicholasville, Kentucky, USA
Abstract
There is a high incidence of obesity in the equine population. Obesity in horses is
associated with health concerns such as equine metabolic syndrome (EMS).
Omega-3 fatty acid supplementation has been suggested for humans with
metabolic dysfunction, as it has been reported to improve insulin sensitivity and
reduce inflammation in these individuals. However, no research has been conducted
to determine the effects of DHA supplementation on metabolic and inflammatory
responses in EMS horses. To investigate its effects in horses with EMS, 10 mixed-
sex and mixed-breed adult EMS horses were selected. Treated horses (n=6) were
supplemented with 16 g DHA per day for 46 days while controls (n=4) received no
supplementation. Pre (Day 0) and Post (Day 46) supplementation samples were
collected via jugular venipuncture and insulinemic responses measured via oral
sugar test (OST). Inflammatory cytokines were measured by serologic ELISA and
analysis of peripheral blood mononuclear cells (PBMCs) via flow cytometry and RT-
PCR. Circulating fatty acids, triglyceride, leptin, and adiponectin concentrations
were also measured. Post supplementation, treated horses had a significant
increase in many circulating fatty acids compared to controls. These horses also
had lower serum triglycerides post supplementation. In addition, supplemented
horses had a reduction in TNF-α mean florescent intensity per lymphocyte.
Interestingly, control horses had a rise in insulin concentrations 60 minutes post
oral sugar administration 46 days post supplementation whereas DHA
supplemented horses did not. These data indicate that algal DHA supplementation
modulated circulating fatty acids, reduced inflammation, and influenced insulinemic
responses in EMS horses.
55
HMW Adiponectin Concentrations and Association with Critical Illness in
Horses
Anne A. Wooldridge and Qiao Zhong
Auburn University College of Veterinary Medicine, Auburn AL USA
Adiponectin is an adipocyte-derived hormone with insulin sensitizing, anti-
inflammatory, and vascular protective properties. The metabolically active form of
adiponectin, high molecular weight (HMW), is decreased in humans with obesity,
insulin resistance, and inflammatory disease. However, higher adiponectin gene
expression in adipose tissue is associated with increased mortality in horses
undergoing emergency laparotomy. The purpose of this study was to examine HMW
adiponectin concentrations in horses with critical illness. Serum HMW adiponectin
and insulin concentrations were measured in archived clinical samples using a
validated ELISA. Insulin concentrations were measured using a validated
radioimmunoassay. Severity of illness was scored using weighted parameters
(white blood cell count, band neutrophils, platelets, heart rate, temperature,
increased digital pulse, mucous membrane color, etc.), and horses were designated
into the following groups (Score 0, 1-4, 5-9, >10). Higher scores indicated worse
severity of illness. Data were compared between groups using Kruskal-Wallis
nonparametric analysis with Dunn’s multiple comparison test and P <0.05. HMW
adiponectin concentrations in each group were as follows: score 0 (n=27): 4.0
(2.0- -4 (n= 39): 3.9 (2.0- -9 (n= 20): 4.9
(2.1- -
concentrations were as follows: score 0 (n=24): 8.4 (2.9- -4
(n= 31): 7.3 (3.2- -9 (n= 14): 17.1 (4.2-
>10 (n=12): 2.7 (2.3-
groups in HMW adiponectin concentrations or insulin concentrations. There was a
trend toward higher HMW adiponectin concentrations in horses with the worst
severity of illness score (>10) and a trend toward higher insulin concentrations in
horses with scores 5-9. HMW adiponectin is not decreased in horses with critical
illness. Studies specifically measuring markers of inflammation and examining
correlation with adiponectin concentrations are needed.
56
Osteocalcin, CTX-1, Insulin, Vitamin D and PTH in Hospitalized Foals
Kamr A,a Dembek KA,a Slovis SM,b Barr B,c Burns T, a Toribio RE a
aCollege of Veterinary Medicine, The Ohio State University, Columbus, OH; bHagyard
Equine Institute, Lexington, KY; cRood and Riddle Equine Hospital, Lexington, KY
Hypovitaminosis D and elevated parathyroid hormone (PTH) concentrations are
frequent in critically ill foals and linked to disease severity and mortality. However,
information on markers of bone turnover, including osteocalcin (OCN: formation)
and C-terminal telopeptide-1 (CTX-1; resorption) concentrations and their
association with 25-hydroxyvitamin D3 [25(OH)D3], 1,25-dihydroxyvitamin D3
[1,25(OH)2D3], PTH, and insulin concentrations is unknown. In other species,
insulin increases OCN production (bone anabolic) and OCN promotes insulin
secretion (bone-insular axis). The goals of this study were to assess bone
remodeling biomarkers (OCN, CTX-1) and determine their association with vitamin
D metabolites, PTH, and insulin concentrations, disease severity and mortality in
hospitalized foals.
Foals (≤72-hour-old; n=98) divided into hospitalized (n=82) and healthy (n=16)
groups were included. Samples were collected on admission. Factors were
measured by immunoassays. CTX-1, insulin, and PTH were higher while OCN,
25(OH)D3 and 1,25(OH)2D3 concentrations lower in hospitalized than healthy foals
(P<0.05). PTH was positively associated with CTX-1, and OCN was positively
correlated with 1,25(OH)2D3 concentrations (P<0.05). CTX-1, OCN, and 1,25(OH)2D
concentrations were also associated with disease severity. Non-survivors had higher
CTX-1 and insulin but lower OCN, 25(OH)D3, and 1,25(OH)2D3 concentrations than
survivors (P<0.05). Hospitalized foals with low insulin concentrations were more
likely to die.
Reduced OCN with elevated insulin concentrations suggests that osteoblast insulin
signaling may be impaired (deregulated bone-insular axis), possibly reflecting
sepsis-mediated insulin resistance. Elevated CTX-1 with reduced OCN together with
low 1,25(OH)2D3, but increased PTH concentrations in sick foals indicates increased
bone turnover and decreased bone formation.

57