Embed Size (px)
Citation preview
1
The Effect of Infrequent Trading on Market Efficiency: The Case of the Middle East Stock Markets
Bashar Abuzarour* Research Assistant
Department of Business Administration
University Campus, Rio Patras, Greece
Abstract Emerging markets are typically characterized by low liquidity, thin trading, and possibly less well informed investors with access to unreliable information and considerable volatility. Therefore, in the context of MENA region, one would expect the inefficiency and illiquidity of the local capital markets to raise a firm’s marginal cost of capital, when it forced to raise capital locally. Little is known about stock price behavior in these economies. It is well known that infrequent trading can affect the results of empirical studies on efficiency by introducing serious bias into the results of empirical work. In addition, inferences drawn from tests of market efficiency are rendered imprecise in the presence of infrequent trading. As the observed indices in thinly traded markets may not represent the true underlying index value, there is a systematic bias toward rejecting the efficient market hypothesis. This paper investigates the effect of infrequent trading on market efficiency and the validity of the random walk hypothesis (RWH) for three emerging Arabian equity markets Jordan, Egypt, and Palestine. Miller, Muthuswamy, and Whaley (1994) approach will be used to estimate the true underlying index.
* E-mail: [email protected] phone #: 0030 693 4406294
2
1- Introduction
Efficient market theory and the random walk model have been at the center stage of
debate in financial literature for several decades; the implications of market efficiency for
investors, investment strategies, financial markets, and the economy are profound indeed
and deserve the interest they have generated. The increasing globalization of financial
markets has increased interest in emerging markets. Researchers have focused on whether
these markets are informationally efficient or whether anomalies exist. In the context of
MENA region, questions of market efficiency are of concern both to MENA equity
investors, and companies in the region that make capital budgeting decisions. Specifically,
if stock market found to be not efficient and segmented and a firm is forced to raise
capital locally, then its cost of capital is likely to be higher than that of a company with
unrestricted access to the regional and international capital markets. Therefore, one
would expect the restriction to the local capital markets to raise a firm’s marginal cost of
capital. Hence, increased financial integration within the MENA region is expected to
bring considerable benefits to MENA investors. A more liquid and well regulated capital
market, offers lower borrowing costs for MENA firms wishing to raise funds locally.
Moreover, international financial institutions will be willing to diversify their portfolios
by tapping the MENA financial markets which will benefit from portfolio capital inflows,
if the convergence asset returns in the world markets leads international investors to
increase their MENA markets holdings, in order to diversify across countries with a wide
range of risk and returns.
However, evidence from other emerging markets is not the same. Urrutia (1995) using
the variance ratio test rejects the RWH for Latin American emerging markets of
Argentina, Brazil, Chile, and Mexico whereas the runs test indicates weak form
efficiency. Antonios, Ergul, and Holmes (1997) study the Istanbul stock exchange and
find it to be inefficient in the early times and efficiency improved as the country started
liberalization and deregulation. Ojah and Karemera (1999) find that the Latin American
equity returns follow a random walk and are generally weak form efficient. Very few
studies target countries from the Middle East particularly Arabian stock markets. Bulter
and Malaikah (1992) study the Kuwaiti and Saudi stock markets. They find the Saudi
stock market to be inefficient, while the Kuwaiti stock market is found to be efficient. El-
3
Erian and Kumar (1995) examine the RWH in emerging markets by choosing two
countries from the Middle East region (Jordan and Turkey) and three other emerging
markets from a different region. They find that there is serial dependence among the day-
to-day price changes in the stock market of Jordan and Turkey, indicating that the
random model does not hold for these markets. Abraham et al (2002) test the RWH for
three Gulf equity markets; namely Saudi Arabia, Kuwait, and Bahrain after adjusting for
infrequent trading. They find that both RWH and weak form efficiency are rejected for
the Gulf markets when the observed index levels are used. In contrast, inferences are
reversed with the use of the corrected true indices. Omran and Farrar (2001) test the
validity of the random walk hypothesis (RWH) in five Middle Eastern emerging markets,
Jordan, Morocco, Egypt, Israel, and Turkey. Their results reject the RWH for all markets;
instead they suggest that the stock returns in these markets exhibit calendar effects.
This paper examines the effect of non-trading on market efficiency for three emerging
Arabian equity markets in the Middle East, Jordan, Egypt, and Palestine, using the
variance ratio test and the nonparametric runs test during the period from 1992 to 2004. A
major difficulty in interpreting the results from tests on thinly traded markets is the
confounding effect of infrequent trading on the observed index. Thus rejection of the
RWH or the efficient market hypothesis could simply be a result of having used the
observed index. Infrequent trading is widespread in most emerging markets and it is
particularly so in the case of the markets under examination here.
- Infrequent trading
It is well known that infrequent trading can affect the results of empirical studies on
efficiency by introducing serious bias into the results of empirical work. Furthermore,
conventional tests on efficiency have been developed for testing markets which are
characterized by high levels of liquidity, sophisticated investors with access to high
quality and reliable information and few institutional impediments. On the other hand,
emerging markets are typically characterized by low liquidity, thin trading, and possibly
less well informed investors with access to unreliable information and considerable
volatility. A number of studies have investigated the impact of thin trading and discussed
its consequences. These studies include Fisher (1966), Dimson (1979), Cohen (1978,
4
1979), Lo and MacKinlay (1990), Stoll and Whaley (1990), and Mathuswamy and
Whaley (1994).
Infrequent trading has two forms: The first occurs when stocks are traded every
consecutive interval, but not necessary at the close of each interval. This form of
infrequency, often dubbed “nonsynchronous trading” has been studied by Scholes and
Williams (1977a, 1977b) and Muthuswamy (1990). Infrequent trading is also said to
occur when stocks are not traded every consecutive interval. Fisher (1966), Dimson
(1979), Cohen et al. (1978, 1979), Lo and MacKinlay (1990), and Stoll and Whaley
(1990b) focus on this “non-trading” and its consequences. The key to distinguishing
nonsynchronous trading from non-trading is the interval over which price changes or
returns are computed. When returns are measured on a monthly basis, virtually all stocks
will have been traded at least once, but not all stocks will have been transacted exactly at
the close of trading on the last trading day of the month. That is nonsynchronous trading.
When returns are measured over trading intervals as short as for example fifteen minutes,
however, all stocks in the market are unlikely to have been traded at least once in every
consecutive fifteen minutes interval. That is non-trading. As the trading interval shrinks,
nonsynchronous trading becomes non-trading. The problem is created by the fact that the
value of an asset over a certain time cannot be directly observed, if the asset does not
trade in that period. Since most indices are computed on the basis of the most recent
transaction prices of the constituent stocks, the reported index becomes stale in the
presence of infrequent trading; the result is that the observed index does not reflect the
true value of the underlying stock portfolio. One of the consequences of infrequent
trading is the spurious serial correlation it induces in the observed index returns.
Therefore, observed dependence is not necessarily evidence of predictability, but rather
may be a statistical illusion brought about by thin trading. A number of different
approaches have been suggested to correct for infrequent trading. Stoll and Whaley (1990)
use the residual from an ARMA (p,q) regression as a proxy of the true index, whereas;
Bassett, France, and Pliska (1991) propose the use of a Kalman filter to estimate the
distribution of the true index. Jokivuolle (1995) suggests a modified version of the Stoll
and Whaley approach to estimate the true unobserved index from the history of the
observed index. The correction consists of decomposing the log of the observed index in

5
its random and stationary components, using the Beveredge and Nelson (1981)
methodology. In this the random component can be shown to equal the log of the true
index. In this paper we will use the methodology which was proposed by Miller,
Muthuswamy, and Whaley (1994) to correct for infrequent trading. Separating the effects
of infrequent trading allows us to draw a definitive conclusion regarding market
efficiency and random walk. The remainder of this paper proceeds as follows: section 2
provides an overview of the three Arabian stock markets under study. Analytical details
of the correcting method to estimate the true index and test methodologies for assessing
the RWH and weak form efficiency are described in section 3. Section 4 identifies the
data sources, presents the empirical results, and contrasts the findings between the
observed and the corrected indices. Conclusions follow.
2- Characteristics of the markets
The Arabian equity markets included in this study are Jordan, Egypt, and Palestine.
Concerning Palestine Stock Exchange, maybe this paper is the first empirical work which
studies the properties of this new emerging Arabian equity market.
2.1 Egypt
The stock market activity in Egypt goes back as far as 1881. Alexandria stock exchange
was the fifth one established in the world after those of Inverness (1536), Amsterdam
(1609), London (1666), and Paris (1808). Cairo stock exchange was established later in
(1903). However, a significant change affected the stock market in Egypt in the late
1950s, as this period witnessed the start of massive and successive waves of
nationalization that radically changed the structure of the economy and this in turn had a
devastating effect on the stock market. The stock exchange collapsed and the primary
market became rudimentary. Until the 1970s the market remained fairly inactive. But
then reforms were implemented to reactivate the private sector and aimed at attracting
foreign investment and mobilizing domestic investment as well. But the bias in the tax
code against investment in securities, the structural deficiencies and practices, the
absence of a governing securities law, the inadequacy of accounting, auditing and
financial disclosure, and the lack of protection for small investors kept the role of the
stock exchange minimal during the period. Since the early years of the last decade, Egypt
6
has witnessed major and radical changes in its economic climate. The Egyptian
government adopted a program of economic reform in 1991 aimed at increasing the
growth rate of the economy. This objective is not likely to be achieved without increasing
the level of investment. In turn, this investment can be obtained through creating a strong
stock market that is capable of attracting local and foreign investment. As a result, the
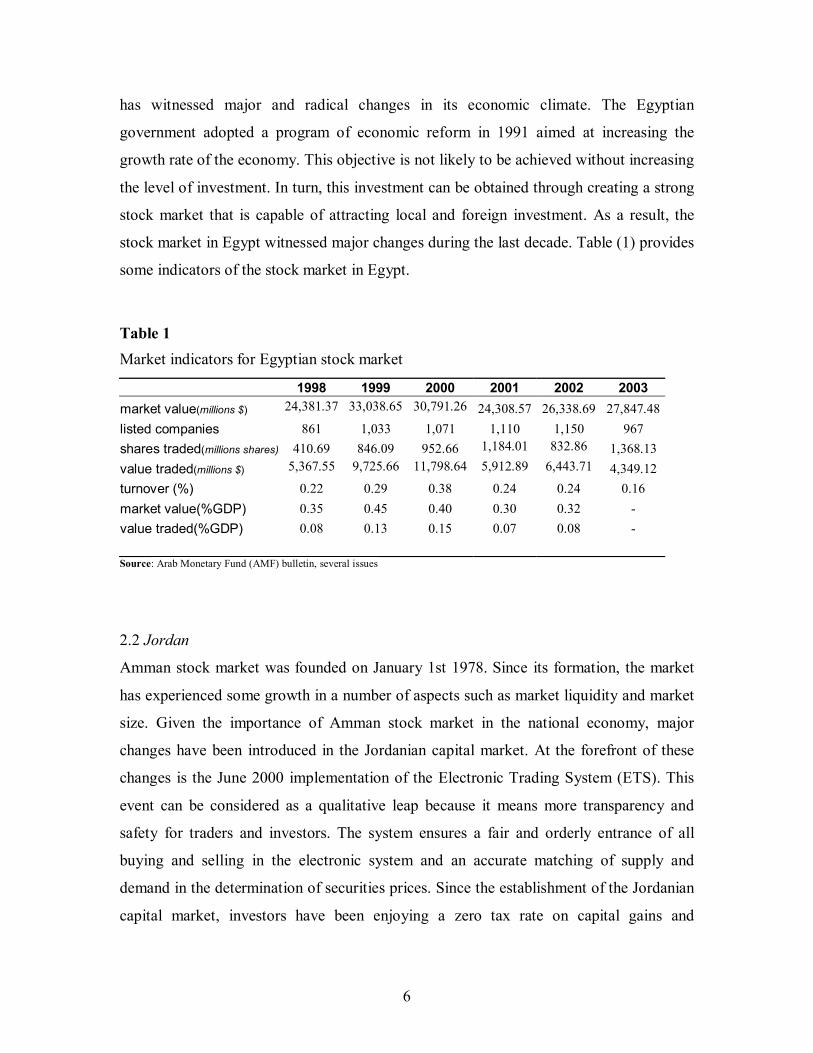
stock market in Egypt witnessed major changes during the last decade. Table (1) provides
some indicators of the stock market in Egypt.
Table 1 Market indicators for Egyptian stock market
1998 1999 2000 2001 2002 2003 market value(millions $) 24,381.37 33,038.65 30,791.26 24,308.57 26,338.69 27,847.48listed companies 861 1,033 1,071 1,110 1,150 967 shares traded(millions shares) 410.69 846.09 952.66 1,184.01 832.86 1,368.13 value traded(millions $) 5,367.55 9,725.66 11,798.64 5,912.89 6,443.71 4,349.12 turnover (%) 0.22 0.29 0.38 0.24 0.24 0.16 market value(%GDP) 0.35 0.45 0.40 0.30 0.32 - value traded(%GDP) 0.08 0.13 0.15 0.07 0.08 - Source: Arab Monetary Fund (AMF) bulletin, several issues
2.2 Jordan
Amman stock market was founded on January 1st 1978. Since its formation, the market
has experienced some growth in a number of aspects such as market liquidity and market
size. Given the importance of Amman stock market in the national economy, major
changes have been introduced in the Jordanian capital market. At the forefront of these
changes is the June 2000 implementation of the Electronic Trading System (ETS). This
event can be considered as a qualitative leap because it means more transparency and
safety for traders and investors. The system ensures a fair and orderly entrance of all
buying and selling in the electronic system and an accurate matching of supply and
demand in the determination of securities prices. Since the establishment of the Jordanian
capital market, investors have been enjoying a zero tax rate on capital gains and
7
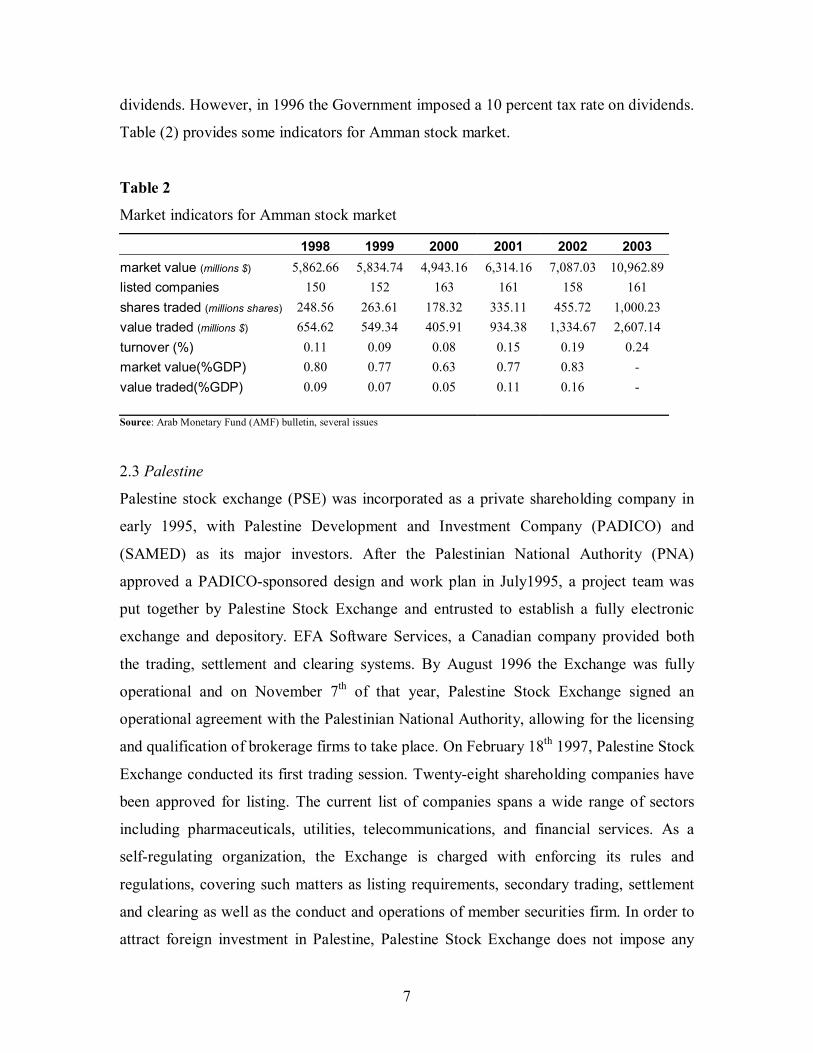
dividends. However, in 1996 the Government imposed a 10 percent tax rate on dividends.
Table (2) provides some indicators for Amman stock market.
Table 2
Market indicators for Amman stock market
1998 1999 2000 2001 2002 2003 market value (millions $) 5,862.66 5,834.74 4,943.16 6,314.16 7,087.03 10,962.89listed companies 150 152 163 161 158 161 shares traded (millions shares) 248.56 263.61 178.32 335.11 455.72 1,000.23 value traded (millions $) 654.62 549.34 405.91 934.38 1,334.67 2,607.14 turnover (%) 0.11 0.09 0.08 0.15 0.19 0.24 market value(%GDP) 0.80 0.77 0.63 0.77 0.83 - value traded(%GDP) 0.09 0.07 0.05 0.11 0.16 - Source: Arab Monetary Fund (AMF) bulletin, several issues
2.3 Palestine
Palestine stock exchange (PSE) was incorporated as a private shareholding company in
early 1995, with Palestine Development and Investment Company (PADICO) and
(SAMED) as its major investors. After the Palestinian National Authority (PNA)
approved a PADICO-sponsored design and work plan in July1995, a project team was
put together by Palestine Stock Exchange and entrusted to establish a fully electronic
exchange and depository. EFA Software Services, a Canadian company provided both
the trading, settlement and clearing systems. By August 1996 the Exchange was fully
operational and on November 7th of that year, Palestine Stock Exchange signed an
operational agreement with the Palestinian National Authority, allowing for the licensing
and qualification of brokerage firms to take place. On February 18th 1997, Palestine Stock
Exchange conducted its first trading session. Twenty-eight shareholding companies have
been approved for listing. The current list of companies spans a wide range of sectors
including pharmaceuticals, utilities, telecommunications, and financial services. As a
self-regulating organization, the Exchange is charged with enforcing its rules and
regulations, covering such matters as listing requirements, secondary trading, settlement
and clearing as well as the conduct and operations of member securities firm. In order to
attract foreign investment in Palestine, Palestine Stock Exchange does not impose any
8
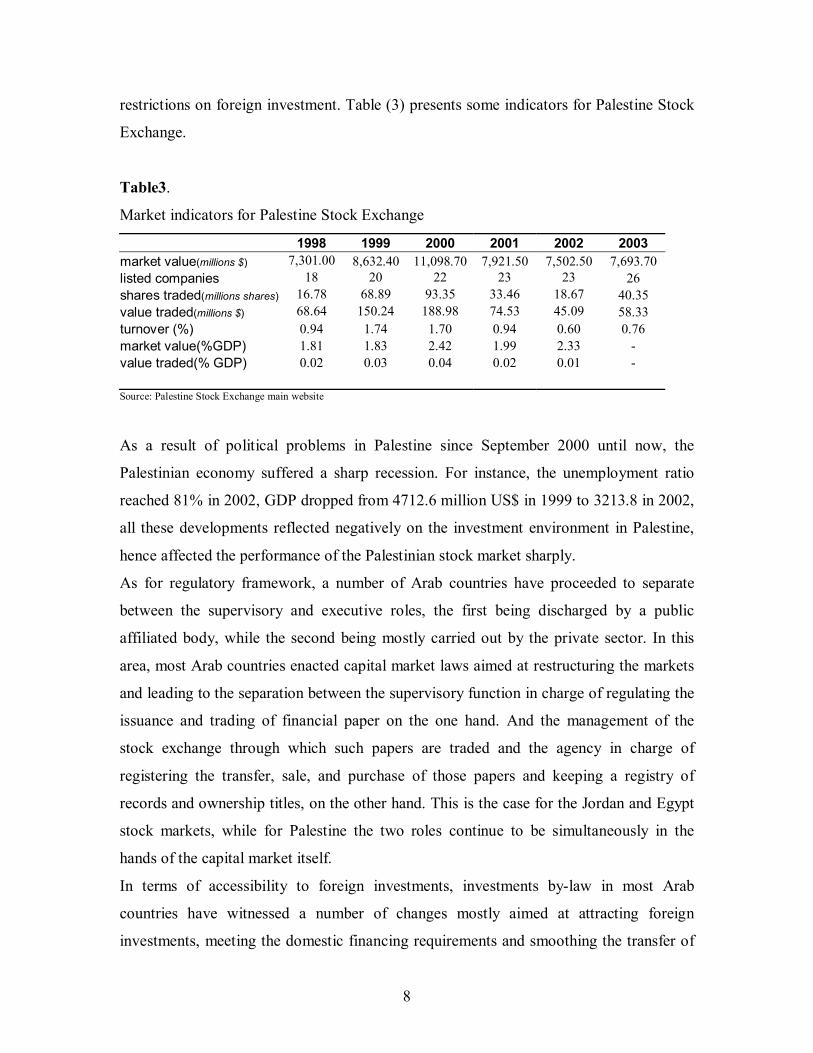
restrictions on foreign investment. Table (3) presents some indicators for Palestine Stock
Exchange.
Table3.
Market indicators for Palestine Stock Exchange
1998 1999 2000 2001 2002 2003 market value(millions $) 7,301.00 8,632.40 11,098.70 7,921.50 7,502.50 7,693.70 listed companies 18 20 22 23 23 26 shares traded(millions shares) 16.78 68.89 93.35 33.46 18.67 40.35 value traded(millions $) 68.64 150.24 188.98 74.53 45.09 58.33 turnover (%) 0.94 1.74 1.70 0.94 0.60 0.76 market value(%GDP) 1.81 1.83 2.42 1.99 2.33 - value traded(% GDP) 0.02 0.03 0.04 0.02 0.01 - Source: Palestine Stock Exchange main website
As a result of political problems in Palestine since September 2000 until now, the
Palestinian economy suffered a sharp recession. For instance, the unemployment ratio
reached 81% in 2002, GDP dropped from 4712.6 million US$ in 1999 to 3213.8 in 2002,
all these developments reflected negatively on the investment environment in Palestine,
hence affected the performance of the Palestinian stock market sharply.
As for regulatory framework, a number of Arab countries have proceeded to separate
between the supervisory and executive roles, the first being discharged by a public
affiliated body, while the second being mostly carried out by the private sector. In this
area, most Arab countries enacted capital market laws aimed at restructuring the markets
and leading to the separation between the supervisory function in charge of regulating the
issuance and trading of financial paper on the one hand. And the management of the
stock exchange through which such papers are traded and the agency in charge of
registering the transfer, sale, and purchase of those papers and keeping a registry of
records and ownership titles, on the other hand. This is the case for the Jordan and Egypt
stock markets, while for Palestine the two roles continue to be simultaneously in the
hands of the capital market itself.
In terms of accessibility to foreign investments, investments by-law in most Arab
countries have witnessed a number of changes mostly aimed at attracting foreign
investments, meeting the domestic financing requirements and smoothing the transfer of
9
advanced technologies in their markets. In this context, the markets under study here do
not impose any restrictions on foreign investments in financial papers. Trading takes
place in these markets through fully computerized dealing systems, as most Arab capital
markets took vast steps to modernize their dealing systems and to introduce modern
technologies in share trading operations with a view to improve performance, enhance
speed and accuracy in the conduct of business and increase transparency and operators’
confidence. Palestine for example inaugurated distant-dealing services, which constitutes
one of the innovative services witnessed by those markets and offered a mechanism
enabling accredited brokers to conduct contracts without the need to be present on the
physical floor.
3- Methodology
Empirical studies utilize several techniques to test for market efficiency. In this paper we
follow previous empirical work and employ the most common statistical and econometric
methods used in the recent literature after adjusting the observed index for infrequent
trading. To test for the independence of successive price changes we employ runs test,
non-parametric tests for detecting the frequency of the changes in the direction of a time
series. Another test used to test for the random walk hypothesis (RWH) is the variance
ratio test developed by Lo and Mackinlay (1988), which measures the randomness of a
return series.
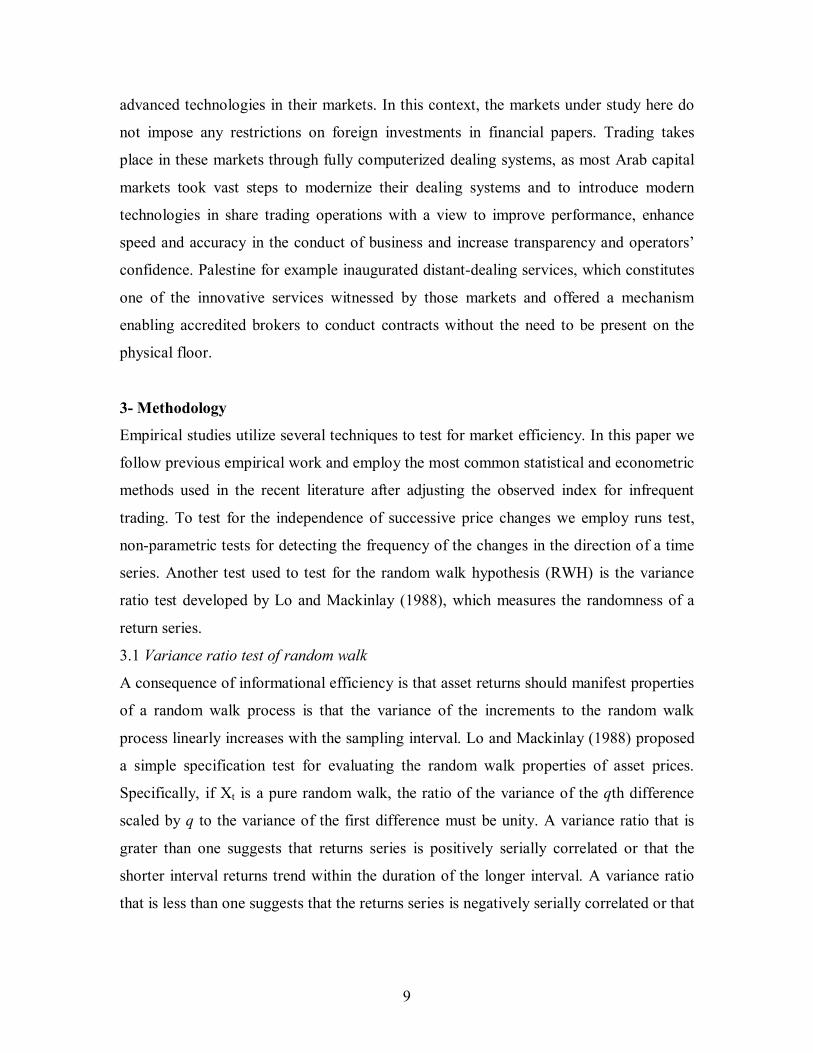
3.1 Variance ratio test of random walk
A consequence of informational efficiency is that asset returns should manifest properties
of a random walk process is that the variance of the increments to the random walk
process linearly increases with the sampling interval. Lo and Mackinlay (1988) proposed
a simple specification test for evaluating the random walk properties of asset prices.
Specifically, if Xt is a pure random walk, the ratio of the variance of the qth difference
scaled by q to the variance of the first difference must be unity. A variance ratio that is
grater than one suggests that returns series is positively serially correlated or that the
shorter interval returns trend within the duration of the longer interval. A variance ratio
that is less than one suggests that the returns series is negatively serially correlated or that

10
the shorter interval returns tend toward mean reversion within the duration of the longer
interval. The variance ratio VR (q) is defined as:
)1()()( 2
2
σσ qqVR = (1)
Where σ2 (q) is 1/q the variance of the q- differences and σ2 (1) is the variance of the first
differences.
22 )ˆ(1)( µσ qxx
mq qi
nq
qii −−= −
=∑ (2)
Where:
( )
−+−=
nqqqnqqm 11
And
( ) ( )2
11
2 ˆ1
1)1( ∑=
− −−−
=nq
iii xx
nqµσ (3)
Where:
( )0
1ˆ xxnq nq −=µ
They developed test statistics both for homoscedastic and heteroscedastic increments. Because it is the heteroscedasticity in the data that is of interest, we use the more robust heteroscedastic test statistic that uses overlapping intervals. The test statistic is:
11
[ ])1,0(
)(
1)()(21
*
*N
q
qVRqZ ≈Φ
−= (4)
Where:
)(ˆ)(2)(21
1
*j
qjqq
q
j
δ∑−
=
−=Φ
And
( ) ( )
( )[ ]∑
∑
=−
+=−−−−
−−
−−−−= nq
iii
nq
jijijiii
xx
xxxxj
1
221
1
21
21
ˆ
ˆˆ)(̂
µ
µµδ
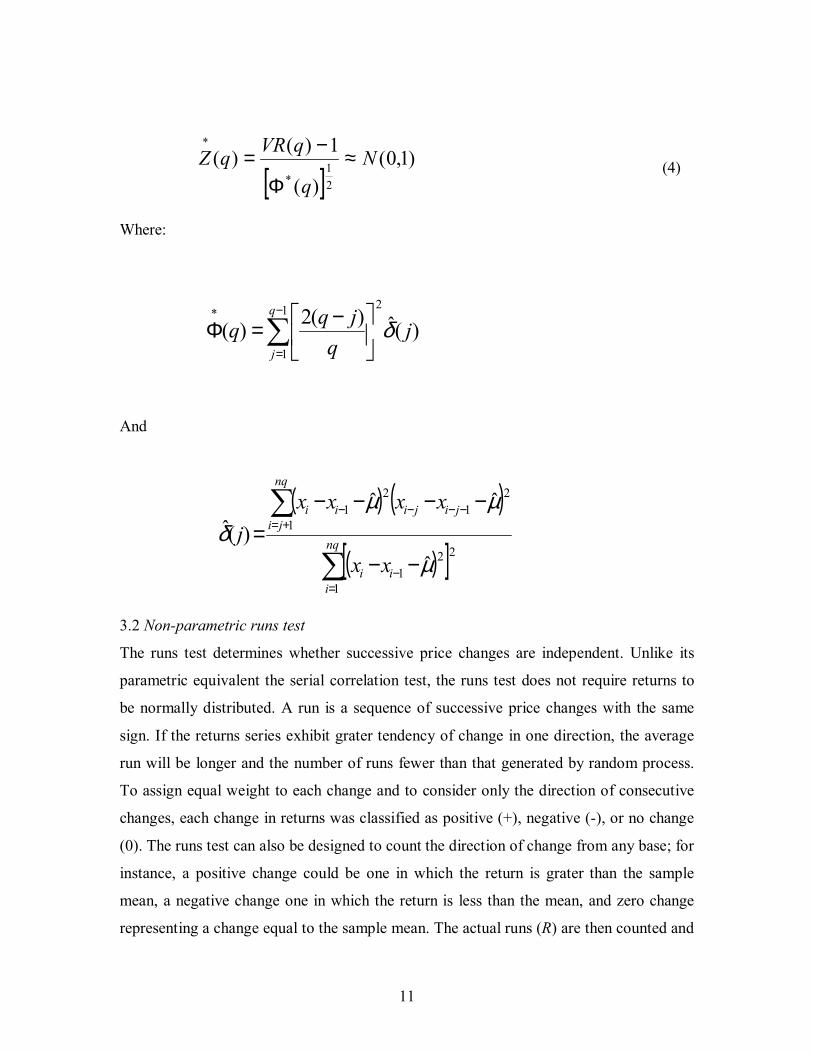
3.2 Non-parametric runs test
The runs test determines whether successive price changes are independent. Unlike its
parametric equivalent the serial correlation test, the runs test does not require returns to
be normally distributed. A run is a sequence of successive price changes with the same
sign. If the returns series exhibit grater tendency of change in one direction, the average
run will be longer and the number of runs fewer than that generated by random process.
To assign equal weight to each change and to consider only the direction of consecutive
changes, each change in returns was classified as positive (+), negative (-), or no change
(0). The runs test can also be designed to count the direction of change from any base; for
instance, a positive change could be one in which the return is grater than the sample
mean, a negative change one in which the return is less than the mean, and zero change
representing a change equal to the sample mean. The actual runs (R) are then counted and
12
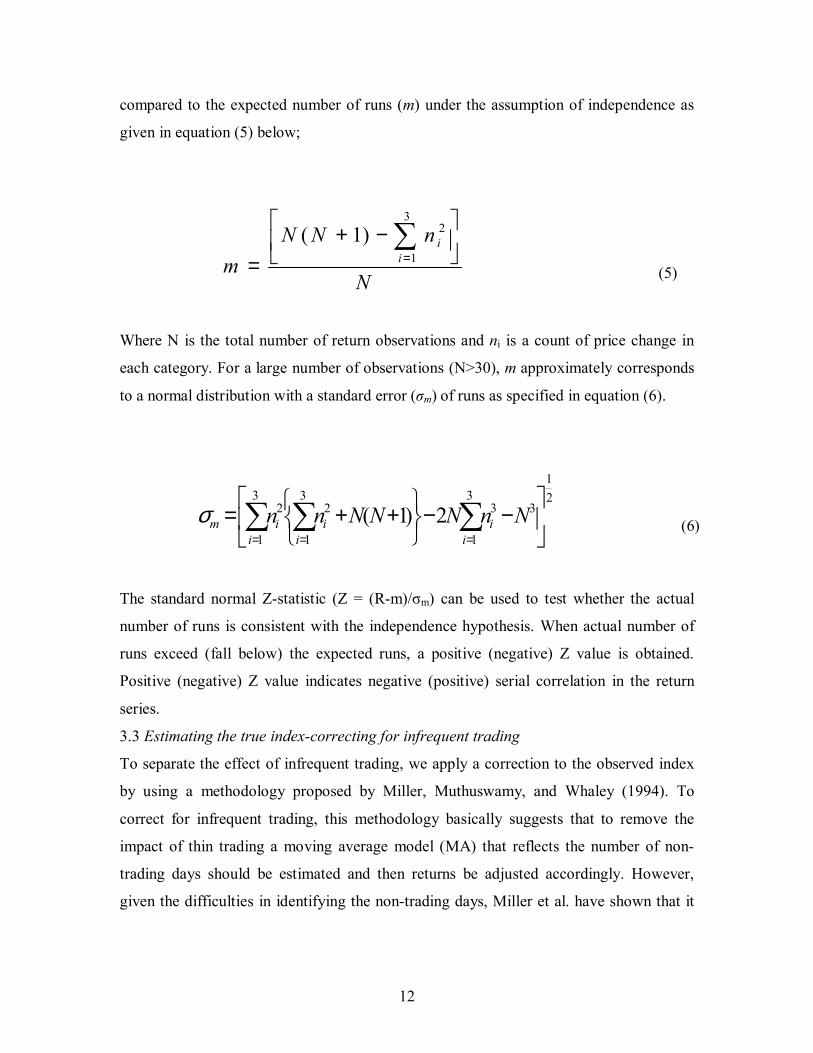
compared to the expected number of runs (m) under the assumption of independence as
given in equation (5) below;
N
nNNm i
i
−+=
∑=
3
1
2)1(
(5)
Where N is the total number of return observations and ni is a count of price change in
each category. For a large number of observations (N>30), m approximately corresponds
to a normal distribution with a standard error (σm) of runs as specified in equation (6).
21
3
1
3
1
333
1
22 2)1(
−−
++= ∑ ∑∑
= ==i ii
iiim NnNNNnnσ (6)
The standard normal Z-statistic (Z = (R-m)/σm) can be used to test whether the actual
number of runs is consistent with the independence hypothesis. When actual number of
runs exceed (fall below) the expected runs, a positive (negative) Z value is obtained.
Positive (negative) Z value indicates negative (positive) serial correlation in the return
series.
3.3 Estimating the true index-correcting for infrequent trading
To separate the effect of infrequent trading, we apply a correction to the observed index
by using a methodology proposed by Miller, Muthuswamy, and Whaley (1994). To
correct for infrequent trading, this methodology basically suggests that to remove the
impact of thin trading a moving average model (MA) that reflects the number of non-
trading days should be estimated and then returns be adjusted accordingly. However,
given the difficulties in identifying the non-trading days, Miller et al. have shown that it
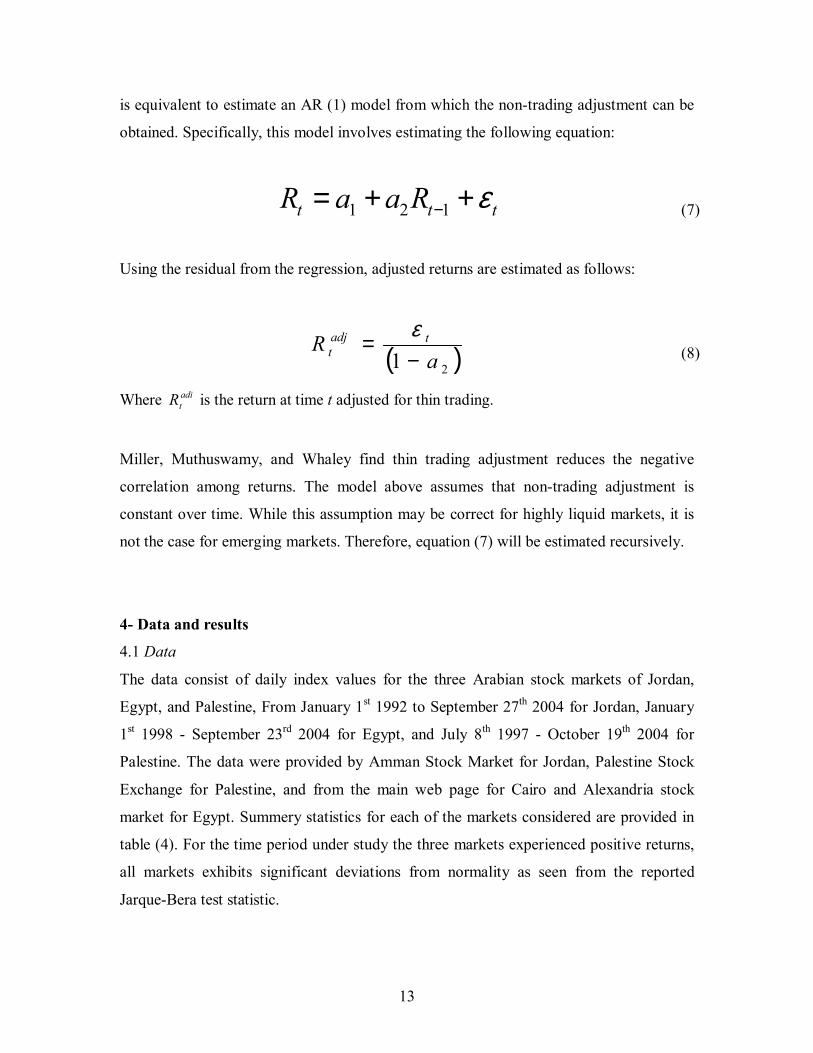
13
is equivalent to estimate an AR (1) model from which the non-trading adjustment can be
obtained. Specifically, this model involves estimating the following equation:
ttt RaaR ε++= −121 (7)
Using the residual from the regression, adjusted returns are estimated as follows:
( )21 aR tadj
t −=
ε (8)
Where aditR is the return at time t adjusted for thin trading.
Miller, Muthuswamy, and Whaley find thin trading adjustment reduces the negative
correlation among returns. The model above assumes that non-trading adjustment is
constant over time. While this assumption may be correct for highly liquid markets, it is
not the case for emerging markets. Therefore, equation (7) will be estimated recursively.
4- Data and results
4.1 Data
The data consist of daily index values for the three Arabian stock markets of Jordan,
Egypt, and Palestine, From January 1st 1992 to September 27th 2004 for Jordan, January
1st 1998 - September 23rd 2004 for Egypt, and July 8th 1997 - October 19th 2004 for
Palestine. The data were provided by Amman Stock Market for Jordan, Palestine Stock
Exchange for Palestine, and from the main web page for Cairo and Alexandria stock
market for Egypt. Summery statistics for each of the markets considered are provided in
table (4). For the time period under study the three markets experienced positive returns,
all markets exhibits significant deviations from normality as seen from the reported
Jarque-Bera test statistic.
14
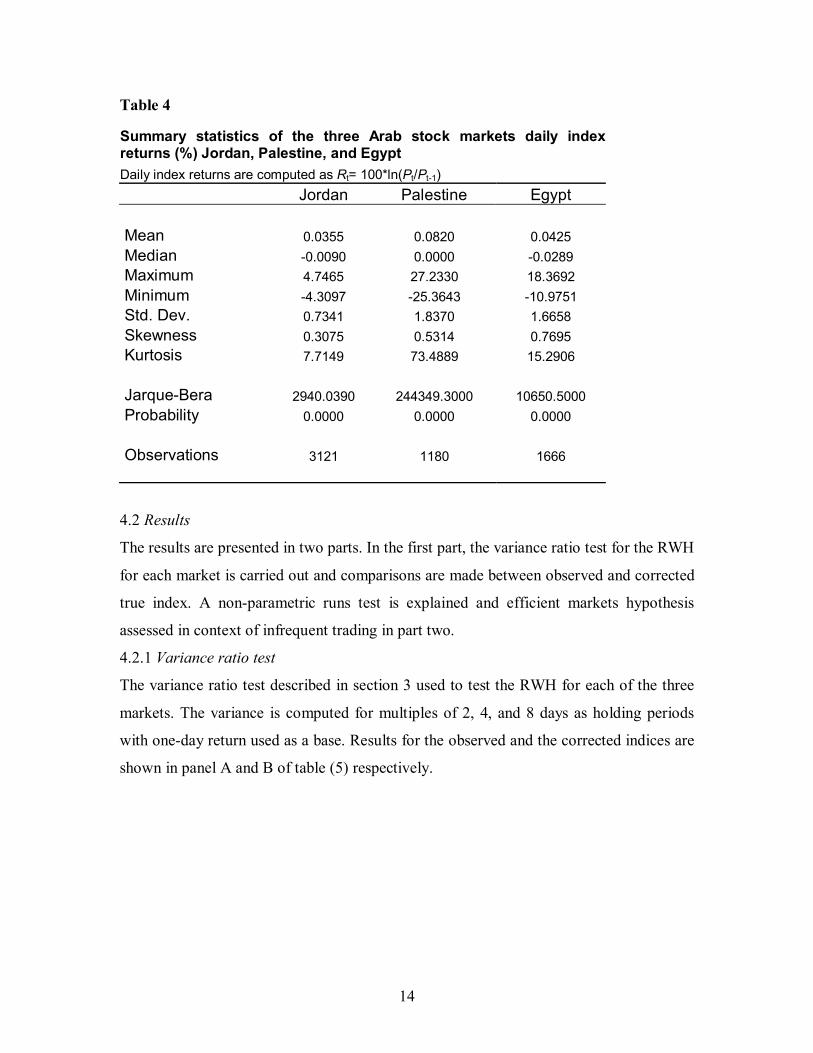
Table 4
Summary statistics of the three Arab stock markets daily indexreturns (%) Jordan, Palestine, and Egypt Daily index returns are computed as Rt= 100*ln(Pt/Pt-1) Jordan Palestine Egypt Mean 0.0355 0.0820 0.0425 Median -0.0090 0.0000 -0.0289 Maximum 4.7465 27.2330 18.3692 Minimum -4.3097 -25.3643 -10.9751 Std. Dev. 0.7341 1.8370 1.6658 Skewness 0.3075 0.5314 0.7695 Kurtosis 7.7149 73.4889 15.2906 Jarque-Bera 2940.0390 244349.3000 10650.5000 Probability 0.0000 0.0000 0.0000 Observations 3121 1180 1666
4.2 Results
The results are presented in two parts. In the first part, the variance ratio test for the RWH
for each market is carried out and comparisons are made between observed and corrected
true index. A non-parametric runs test is explained and efficient markets hypothesis
assessed in context of infrequent trading in part two.
4.2.1 Variance ratio test
The variance ratio test described in section 3 used to test the RWH for each of the three
markets. The variance is computed for multiples of 2, 4, and 8 days as holding periods
with one-day return used as a base. Results for the observed and the corrected indices are
shown in panel A and B of table (5) respectively.
15
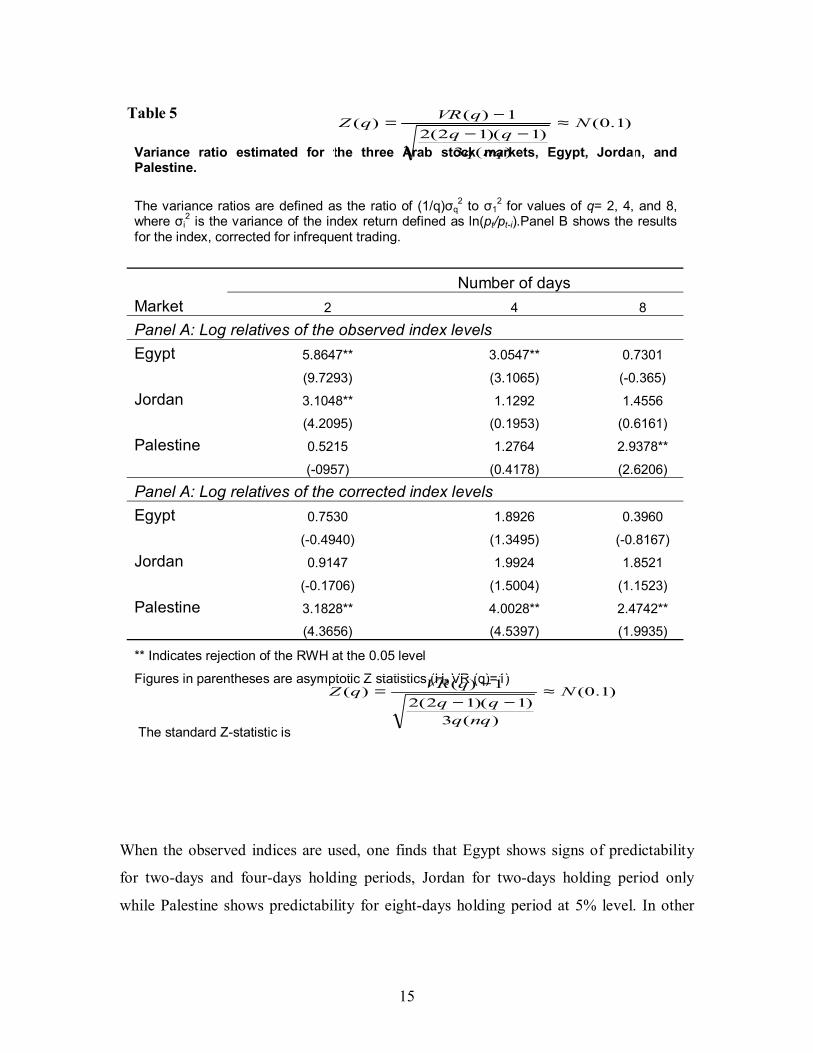
Table 5
Variance ratio estimated for the three Arab stock markets, Egypt, Jordan, and Palestine.
The variance ratios are defined as the ratio of (1/q)σq2 to σ1
2 for values of q= 2, 4, and 8, where σi
2 is the variance of the index return defined as ln(pt/pt-i).Panel B shows the results for the index, corrected for infrequent trading.
Number of days
Market 2 4 8
Panel A: Log relatives of the observed index levels
Egypt 5.8647** 3.0547** 0.7301 (9.7293) (3.1065) (-0.365) Jordan 3.1048** 1.1292 1.4556 (4.2095) (0.1953) (0.6161) Palestine 0.5215 1.2764 2.9378** (-0957) (0.4178) (2.6206)
Panel A: Log relatives of the corrected index levels
Egypt 0.7530 1.8926 0.3960 (-0.4940) (1.3495) (-0.8167) Jordan 0.9147 1.9924 1.8521 (-0.1706) (1.5004) (1.1523) Palestine 3.1828** 4.0028** 2.4742** (4.3656) (4.5397) (1.9935)
** Indicates rejection of the RWH at the 0.05 level
Figures in parentheses are asymptotic Z statistics (H0 VR (q)=1)
The standard Z-statistic is
When the observed indices are used, one finds that Egypt shows signs of predictability
for two-days and four-days holding periods, Jordan for two-days holding period only
while Palestine shows predictability for eight-days holding period at 5% level. In other
)1.0(
)(3)1)(12(2
1)()( N
nqqqq
qVRqZ ≈−−
−=
)1.0(
)(3)1)(12(2
1)()( N
nqqqq
qVRqZ ≈−−
−=
16
words, there is evidence to reject the RWH and the independence of returns for all
markets under study here during the sample period when the observed indices are used.
However, when the corrected indices are used as shown in panel B of table 5 both Egypt
and Jordan do not show any predictability for all holding periods. Therefore, we can not
reject the RWH for these two markets. These results are in consistence with the evidence
from other emerging markets in MENA region (Abraham et al. 2002, Omran et al. 2001).
While for Palestine, the results show signs of predictability for all holding periods.
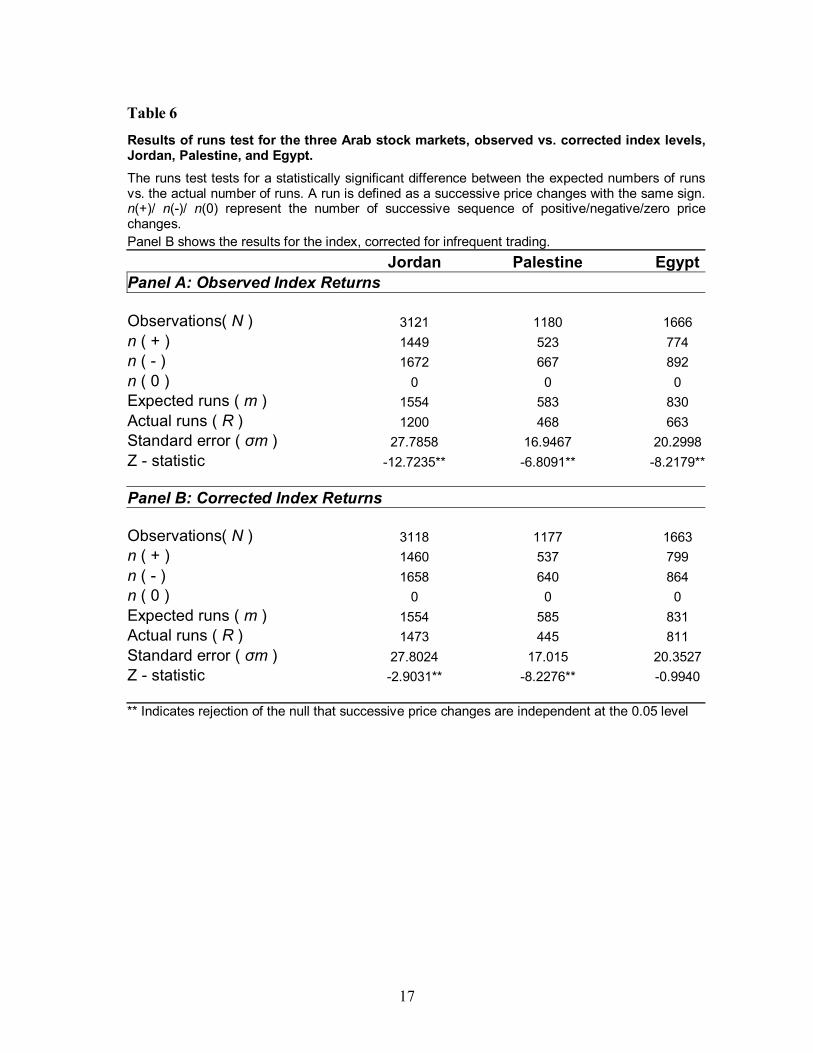
4.2.3 Runs test for weak form efficiency
In this section we report results of weak form efficiency using the non-parametric runs
test. This test found to be preferable to its equivalent parametric test (serial correlation)
under the circumstances here, that returns data do not conform the normal distribution
(the Jarque-Bera test statistic is reported in table 4), and we examine in this section the
independence of price changes using the runs test. Results of the runs test are reported in
table (6), both for observed indices and indices after corrected for infrequent trading. In
panel A for observed indices, the actual number of runs (R) in each of the three markets
can be seen to fall short of the expected number of runs under the null hypothesis of stock
return independence. The resulting negative Z-values for the three Arabian stock markets
indicate positive serial correlation. Results show that the successive returns for each of
the three markets are not independent at the 5% level (critical value -1.96), which
consistent with the finding of Abraham et al. (2002).
When indices are corrected for infrequent trading, the results still the same for both
Jordan and Palestine with noticeable reduction in predictability for Jordan. While for
Egypt we can not reject the weak form efficiency when we use the corrected index.
17
Table 6
Results of runs test for the three Arab stock markets, observed vs. corrected index levels,Jordan, Palestine, and Egypt. The runs test tests for a statistically significant difference between the expected numbers of runsvs. the actual number of runs. A run is defined as a successive price changes with the same sign.n(+)/ n(-)/ n(0) represent the number of successive sequence of positive/negative/zero pricechanges. Panel B shows the results for the index, corrected for infrequent trading. Jordan Palestine EgyptPanel A: Observed Index Returns Observations( N ) 3121 1180 1666 n ( + ) 1449 523 774 n ( - ) 1672 667 892 n ( 0 ) 0 0 0 Expected runs ( m ) 1554 583 830 Actual runs ( R ) 1200 468 663 Standard error ( σm ) 27.7858 16.9467 20.2998Z - statistic -12.7235** -6.8091** -8.2179**
Panel B: Corrected Index Returns Observations( N ) 3118 1177 1663 n ( + ) 1460 537 799 n ( - ) 1658 640 864 n ( 0 ) 0 0 0 Expected runs ( m ) 1554 585 831 Actual runs ( R ) 1473 445 811 Standard error ( σm ) 27.8024 17.015 20.3527Z - statistic -2.9031** -8.2276** -0.9940 ** Indicates rejection of the null that successive price changes are independent at the 0.05 level
18
5- Conclusions
It has been known for some time that infrequent trading makes inferences drawn from
efficiency tests imprecise, particularly so for thinly traded emerging markets. However,
researchers have continued to use the observed index levels in their analysis, and not
surprisingly the extant literature on emerging markets has predominantly rejected the
efficient market hypothesis. The results of this study, consistent with the results in the
literature for similar emerging markets, show that for Jordan, Egypt, and Palestine both
random walk hypothesis and weak form efficiency can be rejected on the basis of the
tests used in this study: the variance ratio test and the non-parametric runs test when the
observed index levels are used. However, when we take account for infrequent trading
using Miller, Muthuswamy, and Whaley (1994) methodology to produce the unobserved
corrected indices. In contrast, when the corrected indices are used, according to the
variance ratio test the RWH can not be rejected for both Egypt and Jordan stock markets.
The RWH is rejected for Palestine stock market even after correcting for infrequent
trading. However, the runs test indicates that there is no predictability in returns for Egypt
when we use the corrected indices. It should be noted, however, that the departure from
the null hypothesis of no predictability for the runs test is less pronounced even for
Jordan, once the index is corrected for infrequent trading.
This paper indicates that infrequent trading has a significant effect on the efficiency and
liquidity of stock markets in the MENA region. The implication of these results for
decision makers is that; the removal of restrictions and barriers to the flow of capital in
MENA region’s financial markets is expected to improve and enhance growth and
liquidity in these markets. Since a more liquid capital market offers lower borrowing
costs for firms wishing to raise funds locally. Increased inter-MENA liberalization will
not only increase a locative efficiency within MENA, as the experience of developed
economies shows, but will also provide MENA investors with grater opportunities to
diversify their portfolios and reduce risk. Increased liberalization within the MENA
region is expected to attract important portfolios and direct investments to the region. It
will also reduce borrowing costs for local firms and will simulate economic growth in the
region.
19
References
Abraham, A., Sayyed, F. And Alsakran, S. (2002) Testing the random walk behavior
and efficiency of the Gulf stock markets The Financial Review 37, pp. 469-480.
Antoniou, A. Ergul, N. and Holmes, P. (1997) Market efficiency thin trading and
non-linear behavior: evidence from an Emerging Market European Financial
Management, Vol.3, No.2, pp.175-190.
Arab Monetary Fund, Quarterly bulletins, several issues, Abu Dhabi.
Basset, G. W., France, V. G. and Pliska, S. R. (1991) Kalmen filter estimation for
valuing non-trading securities, with application to the MMI cash-futures spread on
October 19 and 20, 1987 Review of Quantitative Finance and Accounting 1, pp.135-
151.
Beverdge, S. and Nelson, C. R. (1981) A New approach to decomposition of
economic time series into permanent and transitory components with particular
attention to measurement of the business cycle Journal of Monetary Economics 7,
pp.151-174.
Benartzi, S. and Thaler, R. H. (1992) Myopic loss aversion and the equity premium
puzzle National Bureau of Economic Research Working Paper, 4369.
Butler, K. and Malaikah, S. (1992) Efficiency and inefficiency in thinly traded stock
markets: Kuwait and Saudi Arabia Journal of Banking and Finance, 16, pp.197-210.
Cohen, K.J., Maier, S. f., Schwartz, R.A. and Whitcomb, D. K. (1978) The returns
generation process, returns variance, and the effect of thinness in securities markets
Journal of Finance, Vol.33, pp.149-167.
Cohen, K.J., Maier, S. f., Schwartz, R.A. and Whitcomb, D. K. (1979) On the
existence of serial correlation in an efficient securities market TIMS Studies in the
Management Sciences, Vol.11, pp.151-168.
Dimson, E. (1979) Risk measurement when shares are subject to infrequent trading
Journal of Financial Economics, Vol.7, pp.197-226.
El-Erian, M. and Kumar, M. (1995) Emerging equity markets in Middle Eastern
countries IMF Staff Paper 42, pp.313-43.
Fama, E. (1970) Efficient capital markets: a review of theory and empirical work
Journal of Finance, Volume 25, Issue 2, pp.383-417.
20
Fama, E. (1991) Efficient capital markets: II The Journal of Finance, Vol. XLVI,
No.5, pp.1575-1617.
Fama, E. (1998) Market efficiency, long term returns, and behavioral finance Journal
of Financial Economics, 49, pp.283-306.
Fisher, L. (1966) Some new stock market indexes Journal of Business 39, pp.191-
225.
Jokivuolle, E. (1995) Measuring true stock index value in the present of infrequent
trading The Journal of Financial and Quantitative Analysis, Vol.30, No.3, pp.455-
464.
Lo, A. and Mackinlay, A. (1988) Stock market prices do not follow random walk:
evidence from a simple specification test Review of Financial Studies, 1, pp.41-66.
Lo.A, and Mackinlay.A, (1990) An econometric analysis of infrequent trading
Journal of Econometrics 45, pp.181-211.
Miller, M. H., Muthuswamy, J. and Whaley, R. E. (1994) Mean reversion of standard
and Poor 500 index basis changes: arbitrage-induced or statistical illusion? Journal of
Finance, Vol.49, pp.479-513.
Muthuswamy, J. (1990) Nonsynchronous trading and the index autocorrelation
problem Ph.D. Dissertation, Graduate School of Business, University of Chicago.
Ojah, K. and Karemera, D. (1999) Random walks and market efficiency tests of
Latin American emerging equity markets: a revisit The Financial Review, 34, pp.57-
72.
Omet, G. (2004) Dividend policy behavior in the Jordanian capital market
International Journal Of business, 9(3), pp.287-299.
Omran, M. And Farrar, S. (Forthcoming) Tests of weak efficiency in the Middle East
emerging markets Studies in Economic and Finance.
Schatzberg, J. D. and Reiber, R. R. (1992) Extreme negative information and the
market adjustment process: the case of corporate bankruptcy Quarterly Journal of
Business and Economics, Vol.31, pp.3-21.
Scholes, M. and Williams, J. (1977a) Estimating betas from nonsynchronous data
Journal of Financial Economics, 5, pp.309-327.
21
Scholes, M. and Williams, J. (1977b) Estimating betas from nonsynchronous data
Working Paper, Graduate School of Business, University of Chicago.
Stoll, R. and Whaley, E. (1990a) Stock market structure and volatility Review of
Financial Studies 3, pp.37-71.
Stoll, R. and Whaley, E. (1990b) The dynamic of stock index and stock index futures
returns Journal of Financial and Quantitative Analysis 25, pp.441-468.
Urrutia, J.L. (1995) Tests of random walk and market efficiency for Latin American
emerging equity markets Journal of Financial Research 81, pp.299-310.