Embed Size (px)
Citation preview

Available online at www.worldscientificnews.com
( Received 22 December 2018; Accepted 07 January 2019; Date of Publication 08 January 2019 )
WSN 118 (2019) 43-58 EISSN 2392-2192
The Effect of Increased Scale of Production on Fish Silage Quality
Junianto* and Eddy Afrianto
Staff of the Fisheries Department Lecturer, Faculty of Fisheries and Marine Science, University of Padjadjaran, Indonesia
*E-mail address: [email protected]
ABSTRACT
Dead fish due to reversal of water mass in floating net cages cultivation, most of which cannot be
sold because they are not suitable for consumption or processing into food. One effort that can be done
to increase the added value of dead fish is processed into silage. Silage is a very good feed ingredient
for fish and poultry because of its low metabolic basal energy. This study aims to determine the effect
of increasing the scale of production on the characteristics of fish silage quality. The research method
used was experimental with a complete randomized design consisting of 3 treatments namely a) scale
of production of 1 kg of fish, b) scale of production of 5 kg of fish, and c) scale of production of 25 kg
of fish. The three treatments were repeated 3 times. The parameters observed were protein content, fat,
ash content, water content and amino acid composition of silage fluid and rendemen. Data obtained from
all observation variables except amino acid compositions were analyzed by F test, if significant
continued with Duncan test, each test was carried out at 95% confidence level. The results of the study
obtained conclusions that the quality characteristics of fish silage made from dead fish due to reversal
of water mass were not affected by the scale of the production process. The silage quality characteristics
produced in this study were protein content of 16.02%, fat content of 8.98%, ash content of 2.35%,
carbohydrate content of 2.45% and moisture content of 70.2%. Rendemen is 62.72%.
Keywords: dead fish, production, quality characteristics, scale increase, silage, Cyprinus carpio

World Scientific News 118 (2019) 43-58
-44-
1. INTRODUCTION
The mass mortality of fish in the Floating Net Cage (FNC) system, due to reversal of
water masses, has an impact on the emergence of economic and social losses to the FCN system
fish farmers community. The perceived economic loss is the potential profit lost for fish
farmers, fish feed traders and fish traders. The social impacts that are taken into account
economically are the loss of sources of livelihood [1].
The handling of dead fish must be carried out as soon as possible, if not then there will
be more severe environmental pollution. The handling that has been done so far is that the dead
fish are removed from the body of the water and then buried. In addition, some are sold if the
fish still looks fresh, but the price is very low compared to if it is sold alive.
One of the efforts to handle mass dead fish due reversal of water mass is made silage.
Fish silage is a product in the form of thick liquid resulting from the breakdown of complex
compounds into simple compounds carried out by enzymes in a controlled environment. Based
on the control process, making fish silage can be carried out chemically and biologically [2].
The resulting silage quality depends on the method and process conditions. The method
of making silage can be carried out chemically and biologically. Based on previous research
chemical silage making is the most frequently performed. Chemical silage production is known
as acid silage because the chemical compounds used are acid compounds such as formic acid,
acetic acid or propianic acid. The role of these acid compounds is to soften fish tissue and
reduce acidity. As a result, proteolytic enzymes contained in the fish's body will actively work
to break down proteins (complex compounds) into dipeptides and amino acid acids (simple
compounds) which are soluble in water [3].
The handling of dead fish waste due to reversal of water mass into silage is an effective
and economical and environmentally friendly treatment [4]. Silage contains a lot of protein and
amino acids so it is very good for animal feed and mixtures in fish rations [5].
The Making of silage to handle mass dead fish must be on a high scale of production.
Previous research was still carried out on a laboratory scale. Thus, research of increasing the
scale of fish silage production is very important. The purpose of this study was to determine the
effect of increasing the scale of production on the quality characteristics of the resulting silage
of fish.
2. RESEARCH METHODS
The research method used was experimental with a complete randomized design
consisting of 3 treatment levels of production scale namely a) scale of production of 1 kg of
fish, b) scale of production of 5 kg of fish, and c) scale of production of 25 kg of fish. The three
treatments were repeated 4 times. The parameters observed were protein content (Kjeldahl [6]),
fat (Soxhlet [6], ash content [6], water content [6] and amino acid composition (HPLC) of silage
fluid and rendemen. Data obtained from all observation variables except amino acid
compositions will be analyzed by variance test (F test), if significant, followed by Duncan test,
each test was carried out at 95% confidence level.
The experimental procedure was carried out as follows [7].

World Scientific News 118 (2019) 43-58
-45-
1) Carp (Cyprinus carpio) dead due to reversal of water mass washed with clean water and
then finely chopped using a machete or chopper. Next, the chopped fish is weighed. The
weight is in accordance with the level of the production scale.
2) Chopped fish was inserted into each reactor tank (plastic barrel). Then added a mixture
of formic acid and propianate (1:1) as much as 3% of the total weight of the chopped
fish.
3) Then each reactor was stirred 4 (four) times every day for 4 (four) days, then on days 5
to 8 are stirred once a day.
4) After that, the solids and liquid fractions are separated. The silage liquid obtained from
each reactor was then analyzed for protein, fat, ash content, water content and amino
acid composition.
3. RESULTS AND DISCUSSION
3. 1. Rendemen of silage liquid
Rendemen of fish silage is the percentage of silage liquid obtained on the raw materials
of fish used. Silage liquid is the desired product in the process of making silage, while the waste
is pulp. This pulp consists of scales, bones and fish skin. High rendemen of fish silage indicate
that the process of making silasas runs optimally. Raw material for silage of dead goldfish due
to water mass reversal in this study, simulated with goldfish which were turned off 12 hours
before being processed into silage. The rendemen of silage obtained in this research from
various levels of production scale is shown in Table 1.
Table 1. The rendemen of fish silage liquid made from dead fish due to reversal water mass
Treatment of production scale Rendemen (%)
Production scale of 1 kg 63.38
Production scale of 5 kg 62.80
Production scale of 25 kg 61.98
Based on Table 1, the greater the scale of production, the lower the yield value. The results
of the variance analysis (Appendix 1) show that the scale of production does not affect the yield
of silage produced. This means that the silage yield produced from the scale of production of
25 kg is statistically the same as the silage yield produced from a production scale of 1 kg.
The composition of raw materials plays an important role in the rendemen of fish silage.
Thick fleshed fish and spines and bones less, will have a higher rendemen than thin fleshed fish
and many spines and bones. The rendemen of trash fish silage has a yield of 65.40% [8]. This
rendemen value is higher than the yield produced from this study (mean = 62.72%). The high
value of trash fish rendemen compared to the rendemen of carp because trash fish do not have
as many scales as carp. In addition, trash fish offal is less than carp.
World Scientific News 118 (2019) 43-58
-46-
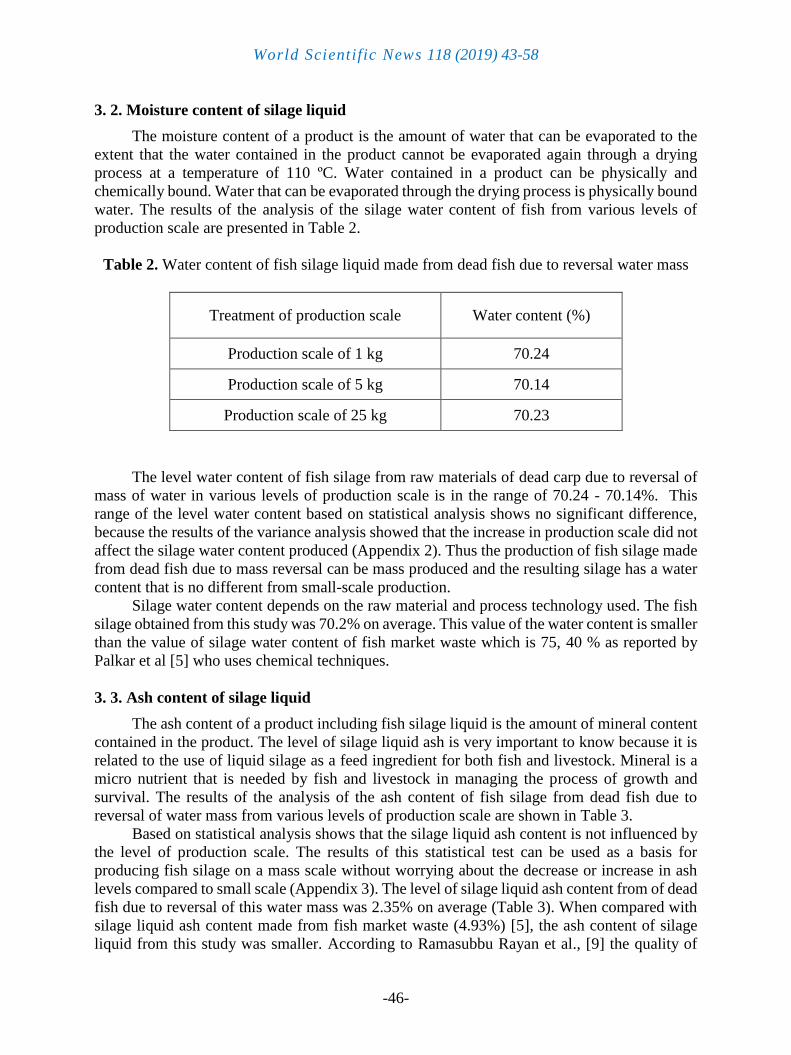
3. 2. Moisture content of silage liquid
The moisture content of a product is the amount of water that can be evaporated to the
extent that the water contained in the product cannot be evaporated again through a drying
process at a temperature of 110 ºC. Water contained in a product can be physically and
chemically bound. Water that can be evaporated through the drying process is physically bound
water. The results of the analysis of the silage water content of fish from various levels of
production scale are presented in Table 2.
Table 2. Water content of fish silage liquid made from dead fish due to reversal water mass
Treatment of production scale Water content (%)
Production scale of 1 kg 70.24
Production scale of 5 kg 70.14
Production scale of 25 kg 70.23
The level water content of fish silage from raw materials of dead carp due to reversal of
mass of water in various levels of production scale is in the range of 70.24 - 70.14%. This
range of the level water content based on statistical analysis shows no significant difference,
because the results of the variance analysis showed that the increase in production scale did not
affect the silage water content produced (Appendix 2). Thus the production of fish silage made
from dead fish due to mass reversal can be mass produced and the resulting silage has a water
content that is no different from small-scale production.
Silage water content depends on the raw material and process technology used. The fish
silage obtained from this study was 70.2% on average. This value of the water content is smaller
than the value of silage water content of fish market waste which is 75, 40 % as reported by
Palkar et al [5] who uses chemical techniques.
3. 3. Ash content of silage liquid
The ash content of a product including fish silage liquid is the amount of mineral content
contained in the product. The level of silage liquid ash is very important to know because it is
related to the use of liquid silage as a feed ingredient for both fish and livestock. Mineral is a
micro nutrient that is needed by fish and livestock in managing the process of growth and
survival. The results of the analysis of the ash content of fish silage from dead fish due to
reversal of water mass from various levels of production scale are shown in Table 3.
Based on statistical analysis shows that the silage liquid ash content is not influenced by
the level of production scale. The results of this statistical test can be used as a basis for
producing fish silage on a mass scale without worrying about the decrease or increase in ash
levels compared to small scale (Appendix 3). The level of silage liquid ash content from of dead
fish due to reversal of this water mass was 2.35% on average (Table 3). When compared with
silage liquid ash content made from fish market waste (4.93%) [5], the ash content of silage
liquid from this study was smaller. According to Ramasubbu Rayan et al., [9] the quality of

World Scientific News 118 (2019) 43-58
-47-
silage fluids including ash content is highly dependent on raw materials and process technology
that used. Widjastuti et al., [10] also state the same thing that silage quality is influenced by raw
materials and process technology. Based on these information, it is more convincing that the
scale of production in making silage is not a factor that influences the quality of silage produced.
Table 3. Ash content of fish silage liquid ash made from dead fish due to reversal water mass
Treatment of production scale Ash content (%)
Production scale of 1 kg 2.41
Production scale of 5 kg 2.34
Production scale of 25 kg 2.31
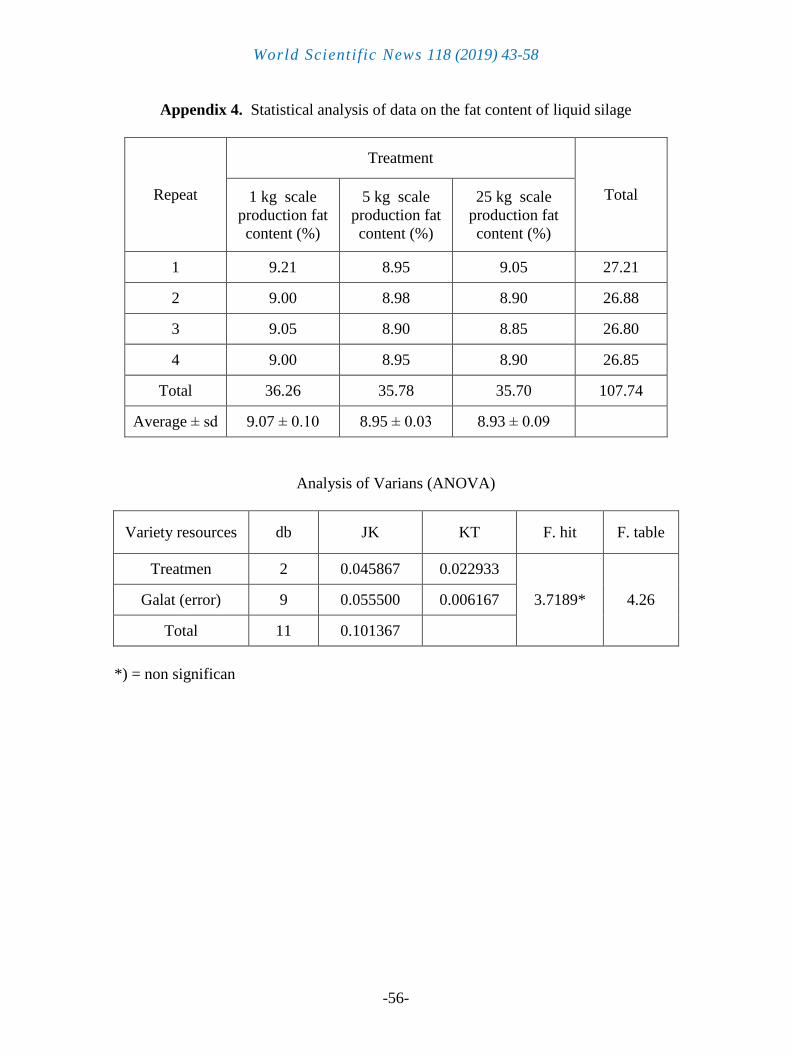
3. 4. Fat content of silage liquid
Fish silage liquid can be used as a source of raw material in making fish pellets. One of
the nutrients that must be present in fish pellets is fat. This fat compound is used as a constituent
of organelles in the body of the fish. Besides that it is also used as an energy reserve. The
existence of a very important fat compound in the source of this pellet raw material was
considered necessary to was analyzed the fat content in fish silage liquid obtained from this
study. The proximate test results of fat content in fish silage liquids from this study was show
in Table 4.
Table 4. Fat content of fish silage liquid made from dead fish due to reversal of water mass.
Treatment of production scale Fat content (%)
Production scale of 1 kg 9.07
Production scale of 5 kg 8.95
Production scale of 25 kg 8.93
Based on Table 4, the fat content of fish silage from the treatment results from various
levels of production scale ranged from 9.07% to 8.93%. Fish silage liquid which has the highest
fat content is obtained from the production scale of 1 kg. The larger the scale of production, the
smaller the fat content in the silasenya fluid. However, based on the results of statistical analysis
the fat content in silage liquid is not influenced by the scale of production (Appendix 4).
The fat content average of silage liquid from raw materials of dead fish due to the reversal
of this water mass obtained from various levels of production scale is 8.98%. The value of this
fat content is higher than the fat content of fish silage from the raw material of nile tilapia which

World Scientific News 118 (2019) 43-58
-48-
is 3.26% [11] and fish offal which is 8.6% [12]. The high fat content of the fish silage liquid is
because the raw material used is carp that including fat fish.
High fat content in fish silage fluids can have an impact on the short shelf life of the silage
fluid. Fat compounds are easily oxidized by oxygen to rancid-smelling compounds. This rancid
odor is an unpleasant odor and can reduce the acceptability of fish's silage liquid by livestock
or fish.
3. 5. Carbohydrate content of silage fluid
Compounds belonging to the group of carbohydrates found in fish tissues are glycogen
and some intermediate compounds in the krebb cycle process. The carbohydrate compounds
contained in fish tissues are relatively small compared to protein compounds. Therefore, the
content of carbohydrate compounds in fish silage fluids is also relatively small when compared
with their protein levels. The results of carbohydrate level calculation of fish silage fluids made
from goldfish that die from water mass reversals are presented in Table 5.
Table 5. Carbohydrate content of fish silage liquid made from dead fish due to reversal
of water mass.
Treatment of production scale Carbohydrate content (%)
Production scale of 1 kg 2.15
Production scale of 5 kg 2.56
Production scale of 25 kg 2.65
The results of statistical tests show that the carbohydrate content of fish silage as found
in Table 5 is not affected by the level of scale of production (Appendix 5). That is, although the
number of carbohydrate levels is different, statistically not significantly different. The average
carbohydrate content of carp silage liquid is around 2.45%. This value is greater than the
carbohydrate content of the liquid silage nila tilapia (1,0%) [11], and when compared with
silage liquid made from tuna waste (head and bone which still contains tetelan meat) is also still
greater. The liquid silage level of carbohydrate tuna waste is 1.01% [10].
The relatively low carbohydrate content value of fish silage liquid as one of the feed
ingredients is not an important problem. This is because the use of silage liquid in the feed
constituent is intended not as a source of carbohyrate but as a source of protein.
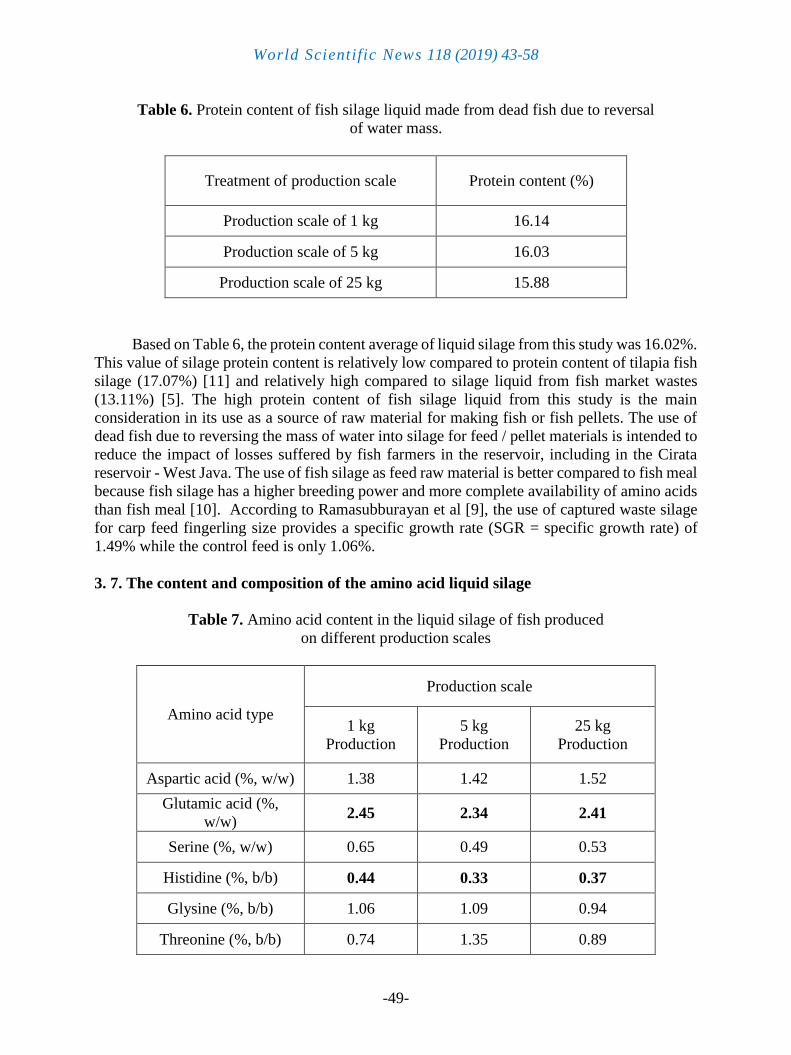
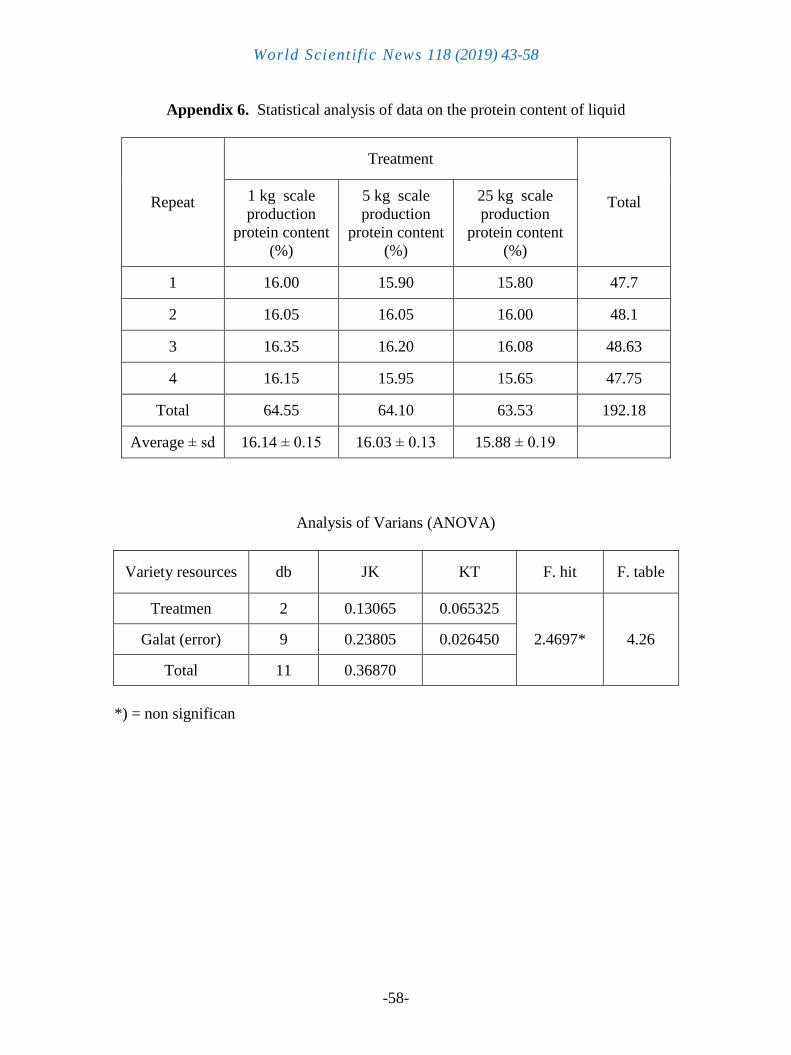
3. 6. Protein content of silage fluid
Proximate test results of proteins on fish silage fluids made from dead fish due to water
mass reversals are presented in Table 6. After statistical testing, the value of liquid silage protein
levels from various levels of production showed no real effect (Appendix 6). This means that
the protein content of fish silage fluid is not affected by the level of production scale. The
conclusions of this statistic are in line with those informed by Vidotti et al., [13] that the silage
making process does not depend on the scale of production.
World Scientific News 118 (2019) 43-58
-49-
Table 6. Protein content of fish silage liquid made from dead fish due to reversal
of water mass.
Treatment of production scale Protein content (%)
Production scale of 1 kg 16.14
Production scale of 5 kg 16.03
Production scale of 25 kg 15.88
Based on Table 6, the protein content average of liquid silage from this study was 16.02%.
This value of silage protein content is relatively low compared to protein content of tilapia fish
silage (17.07%) [11] and relatively high compared to silage liquid from fish market wastes
(13.11%) [5]. The high protein content of fish silage liquid from this study is the main
consideration in its use as a source of raw material for making fish or fish pellets. The use of
dead fish due to reversing the mass of water into silage for feed / pellet materials is intended to
reduce the impact of losses suffered by fish farmers in the reservoir, including in the Cirata
reservoir - West Java. The use of fish silage as feed raw material is better compared to fish meal
because fish silage has a higher breeding power and more complete availability of amino acids
than fish meal [10]. According to Ramasubburayan et al [9], the use of captured waste silage
for carp feed fingerling size provides a specific growth rate (SGR = specific growth rate) of
1.49% while the control feed is only 1.06%.
3. 7. The content and composition of the amino acid liquid silage
Table 7. Amino acid content in the liquid silage of fish produced
on different production scales
Amino acid type
Production scale
1 kg
Production
5 kg
Production
25 kg
Production
Aspartic acid (%, w/w) 1.38 1.42 1.52
Glutamic acid (%,
w/w) 2.45 2.34 2.41
Serine (%, w/w) 0.65 0.49 0.53
Histidine (%, b/b) 0.44 0.33 0.37
Glysine (%, b/b) 1.06 1.09 0.94
Threonine (%, b/b) 0.74 1.35 0.89
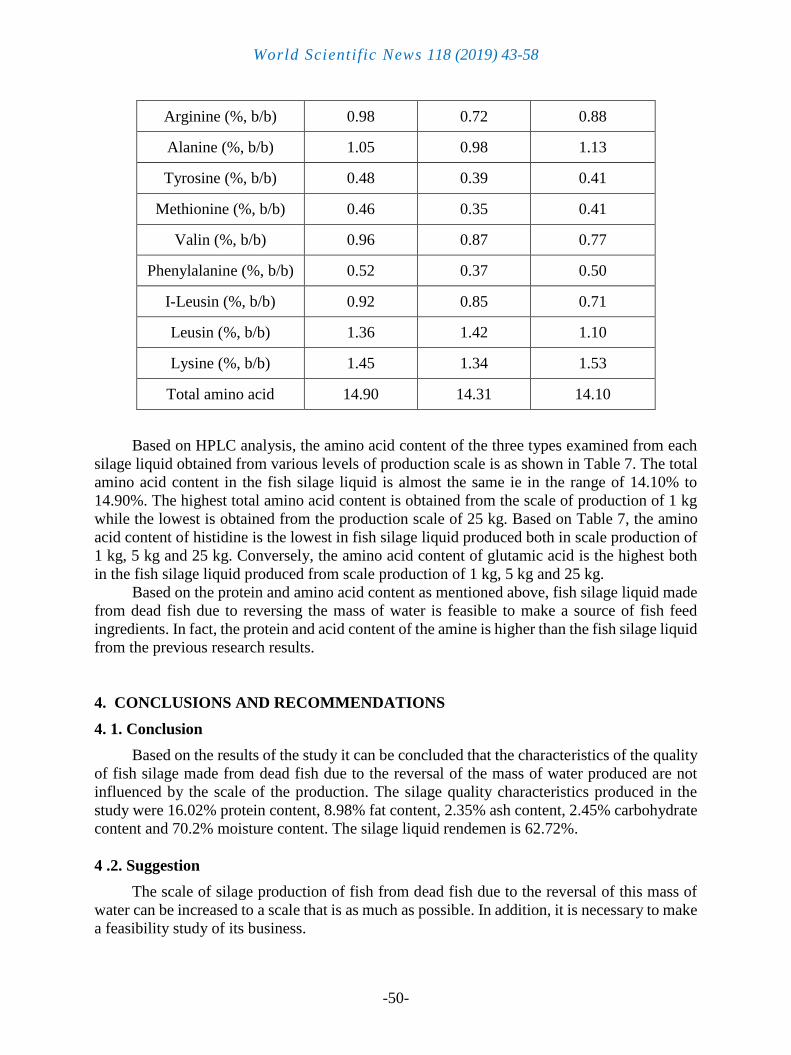
World Scientific News 118 (2019) 43-58
-50-
Arginine (%, b/b) 0.98 0.72 0.88
Alanine (%, b/b) 1.05 0.98 1.13
Tyrosine (%, b/b) 0.48 0.39 0.41
Methionine (%, b/b) 0.46 0.35 0.41
Valin (%, b/b) 0.96 0.87 0.77
Phenylalanine (%, b/b) 0.52 0.37 0.50
I-Leusin (%, b/b) 0.92 0.85 0.71
Leusin (%, b/b) 1.36 1.42 1.10
Lysine (%, b/b) 1.45 1.34 1.53
Total amino acid 14.90 14.31 14.10
Based on HPLC analysis, the amino acid content of the three types examined from each
silage liquid obtained from various levels of production scale is as shown in Table 7. The total
amino acid content in the fish silage liquid is almost the same ie in the range of 14.10% to
14.90%. The highest total amino acid content is obtained from the scale of production of 1 kg
while the lowest is obtained from the production scale of 25 kg. Based on Table 7, the amino
acid content of histidine is the lowest in fish silage liquid produced both in scale production of
1 kg, 5 kg and 25 kg. Conversely, the amino acid content of glutamic acid is the highest both
in the fish silage liquid produced from scale production of 1 kg, 5 kg and 25 kg.
Based on the protein and amino acid content as mentioned above, fish silage liquid made
from dead fish due to reversing the mass of water is feasible to make a source of fish feed
ingredients. In fact, the protein and acid content of the amine is higher than the fish silage liquid
from the previous research results.
4. CONCLUSIONS AND RECOMMENDATIONS
4. 1. Conclusion
Based on the results of the study it can be concluded that the characteristics of the quality
of fish silage made from dead fish due to the reversal of the mass of water produced are not
influenced by the scale of the production. The silage quality characteristics produced in the
study were 16.02% protein content, 8.98% fat content, 2.35% ash content, 2.45% carbohydrate
content and 70.2% moisture content. The silage liquid rendemen is 62.72%.
4 .2. Suggestion
The scale of silage production of fish from dead fish due to the reversal of this mass of
water can be increased to a scale that is as much as possible. In addition, it is necessary to make
a feasibility study of its business.

World Scientific News 118 (2019) 43-58
-51-
References
[1] Nasution Z, Sari Y.D and Huda HM, Aquaculture on Maninjau Lake: Anticipation of
Policies for Handling the Impact of Fish Death. Journal of Socio-Economic and
Fisheries Policy Vol. 1 (2011).
[2] Ramírez JCR, Ibarra JI, Romero FA, Ulloa PR, Ulloa JA, Matsumoto KS, Cordoba BV,
and Manzano MAM, Preparation of Biological Fish Silage and its Effect on the
Performance and Meat Quality Characteristics of Quails (Coturnix coturnix japonica).
Brazilian Archives of Biology and Technology, Vol. 56 (6) (2013) 1002-1010
[3] Savoie A, Le François NR, Lamarre SG, Blier PU, Beaulieu L, and Cahu C, Dietary
protein hydrolysate and trypsin inhibitor effects on digestive capacities and
performances during early-stages of spotted wolffish: Suggested mechanisms.
Comparative Biochemistry and Physiology - Part A: Molecular & Integrative
Physiology, Vol. 158(4) (2011) 525-530
[4] Raj R, Raju CV, Lakshmisha IP, and Jagpa, Nutritional and Biochemical Properties of
Fish Silage Prepared as an Ingredient in Poultry Feed. International Journal of Current
Microbiology and Applied Sciences, Vol.7(5) (2018) 423-428
[5] Palkar ND, Koli JM, Patange SB, Sharangdhar ST, Sadavarte RK and Sonavane AE.,
Comparative Study of Fish Silage Prepared from Fish Market Waste by Using Different
Techniques. International Journal of Current Microbiology and Applied Sciences, Vol.
6 (12) (2017) 3844-3858
[6] Association of Analytical Chemist (AOAC) Publisher, Official Methods of Analysis.
Washington DC: AOAC Publisher, (2005).
[7] Mousavi, S.L., Mohammadi, G., Khodadadi, M. and Keysami, M. A. Silage production
from fish waste in cannery factories of Bushehr city using mineral acid, organic acid,
and biological method. International Journal of Agriculture and Crop Sciences, 6(10)
(2013) 610-616
[8] Adityana D.,Utilization of Different Types of Trash Silage in the Production of Artemia
Franciscana Biomass. Thesis, Faculty of Mathematics and Natural Sciences, Sebelas
Maret University - Surakarta (2007).
[9] Ramasubburayan R, Iyapparaj P, Subhashini KJ, Chandran MN, Palavesam A and
Immanue G., Characterization and Nutritional Quality of Formic Acid Silage
Developed from Marine Fishery Waste and their Potential Utilization as Feed Stuff for
Common Carp Cyprinus carpio Fingerlings. Turkish Journal of Fisheries and Aquatic
Sciences 13 (2013) 281-289
[10] Widjastuti T, Lengkey A H, Wiradimadja R and Herianti,. Utilizing Product of Tuna
Waste (Thunnus atlanticus) Fish Silage and Its Implementation on The Meat Protein
Conversion of Broiler. Lucrari Stiintifice Vol. 55, Seria Zootehnie (2005).
[11] Sales RO and Oliveira AC., Evaluation nutritional of acid silage of Nile tilapia
(Oreochromis niloticus), whole fish discarded, farmed in Indaiatuba. Revista Brasileira
de Higiene e Sanidade Animal, Vol. 7(2) (2013) 16-30
World Scientific News 118 (2019) 43-58
-52-
[12] Manca E and Carrizo J.C. 2002. Informed final de producción y utilización de ensilados
en la formulación de dietas, DNA / INIDEP project, expte 4961, Argentina.
[13] Vidotti, R.M., Viegas, E.M.M. and Carneiro, D.J., Amino acid Composition of
processed fish silage using different raw materials. Animal Feed Science and
Technology, 105 (2003) 199-204

World Scientific News 118 (2019) 43-58
-53-
Appendix 1. Statistical analysis of data on the rendemen of liquid silage
Repeat
Treatment
Total 1 kg scale
production
rendemen (%)
5 kg scale
production
rendemen (%)
25 kg scale
production
rendemen (%)
1 62.3 60.7 61,5 184.5
2 65.9 63.9 60,5 190.3
3 60.5 64.1 63,4 188.0
4 64.8 62.5 62,5 189.8
Total 253.5 251.2 247.9 752.6
Average ± sd 63.38 ± 2.44 62.8 ± 1.57 61.98 ± 1.25
Analysis of Varians (ANOVA)
Variety resources db JK KT F. accout F. table
Treatmen 2 3.961667 1.980833
0.59554* 4.26 Galat (error) 9 29.935 3.326111
Total 11 33.89667
*) = non significan

World Scientific News 118 (2019) 43-58
-54-
Appendix 2. Statistical analysis of data on the water content of liquid silage
Repeat
Treatment
Total 1 kg scale
production
water content
(%)
5 kg scale
production
water content
(%)
25 kg scale
production
water content
(%)
1 70.73 69.53 70.07 210.33
2 69.45 71.09 70.85 211.39
3 70.55 70.08 69.95 210.58
4 70.23 69.85 70.05 210.13
Total 280.96 280.55 280.92 842.43
Average ± sd 70.24 ± 0.57 70.14 ± 0,67 70.23 ± 0,42
Analysis of Varians (ANOVA)
Variety resources db JK KT F. accout F. table
Treatmen 2 0.02555 0.012775
0.04043* 4.26 Galat (error) 9 2.843475 0.315942
Total 11 2.869025
*) = non significan

World Scientific News 118 (2019) 43-58
-55-
Appendix 3. Statistical analysis of data on the ash content of liquid silage
Repeat
Treatment
Total 1 kg scale
production ash
content (%)
5 kg scale
production ash
content (%)
25 kg scale
production ash
content (%)
1 2.41 2.48 2.01 6.90
2 2.45 2.43 2.35 7.23
3 2.26 2.05 2.48 6.79
4 2.51 2.38 2.40 7.29
Total 9.63 9.34 9.24 28.21
Average ± sd 2.41±0.11 2.34 ± 0.19 2.31 ± 0.22
Analysis of Varians (ANOVA)
Variety resources db JK KT F. accout F. table
Treatmen 2 0.020517 0.010258
0.334541* 4.26 Galat (error) 9 0.275975 0.030664
Total 11 0.296492
*) = non significan
World Scientific News 118 (2019) 43-58
-56-
Appendix 4. Statistical analysis of data on the fat content of liquid silage
Repeat
Treatment
Total 1 kg scale
production fat
content (%)
5 kg scale
production fat
content (%)
25 kg scale
production fat
content (%)
1 9.21 8.95 9.05 27.21
2 9.00 8.98 8.90 26.88
3 9.05 8.90 8.85 26.80
4 9.00 8.95 8.90 26.85
Total 36.26 35.78 35.70 107.74
Average ± sd 9.07 ± 0.10 8.95 ± 0.03 8.93 ± 0.09
Analysis of Varians (ANOVA)
Variety resources db JK KT F. hit F. table
Treatmen 2 0.045867 0.022933
3.7189* 4.26 Galat (error) 9 0.055500 0.006167
Total 11 0.101367
*) = non significan

World Scientific News 118 (2019) 43-58
-57-
Appendix 5. Statistical analysis of data on the carbohydrate content of liquid silage
Repeat
Treatment
Total 1 kg scale
production
carbohydrate
content (%)
5 kg scale
production
carbohydrate
content (%)
25 kg scale
production
carbohydrate
content (%)
1 1.65 3.14 3.07 27.21
2 3.05 1.45 1.90 26.88
3 1.79 2.77 2.64 26.80
4 2.11 2.87 3.00 26.85
Total 8.60 10.23 10.61 107.74
Average ± sd 2.15 ± 0.63 2.56 ± 0.75 2.65 ± 0.54
Analysis of Varians (ANOVA)
Variety resources db JK KT F. hit F. table
Treatmen 2 0.570117 0.285058
0.6820* 4.26 Galat (error) 9 3.76135 0.417928
Total 11 4.331467
*) = non significan
World Scientific News 118 (2019) 43-58
-58-
Appendix 6. Statistical analysis of data on the protein content of liquid
Repeat
Treatment
Total 1 kg scale
production
protein content
(%)
5 kg scale
production
protein content
(%)
25 kg scale
production
protein content
(%)
1 16.00 15.90 15.80 47.7
2 16.05 16.05 16.00 48.1
3 16.35 16.20 16.08 48.63
4 16.15 15.95 15.65 47.75
Total 64.55 64.10 63.53 192.18
Average ± sd 16.14 ± 0.15 16.03 ± 0.13 15.88 ± 0.19
Analysis of Varians (ANOVA)
Variety resources db JK KT F. hit F. table
Treatmen 2 0.13065 0.065325
2.4697* 4.26 Galat (error) 9 0.23805 0.026450
Total 11 0.36870
*) = non significan