Embed Size (px)
Citation preview

NBER WORKING PAPER SERIES
THE EFFECT OF HIGH SCHOOL EXIT EXAMS ON GRADUATION, EMPLOYMENT,WAGES AND INCARCERATION
Olesya BakerKevin Lang
Working Paper 19182http://www.nber.org/papers/w19182
NATIONAL BUREAU OF ECONOMIC RESEARCH1050 Massachusetts Avenue
Cambridge, MA 02138June 2013
We are grateful to Arias Wan whose undergraduate thesis started us on this project and to ClaudiaOlivetti, Daniele Paserman and participants in seminars and workshops at Boston University, FederalReserve Bank of Chicago, American Institutes for Research, CNA, Abt Associates and the US Censusfor helpful comments. The usual caveat applies. The views expressed herein are those of the authorsand do not necessarily reflect the views of the National Bureau of Economic Research.
NBER working papers are circulated for discussion and comment purposes. They have not been peer-reviewed or been subject to the review by the NBER Board of Directors that accompanies officialNBER publications.
© 2013 by Olesya Baker and Kevin Lang. All rights reserved. Short sections of text, not to exceedtwo paragraphs, may be quoted without explicit permission provided that full credit, including © notice,is given to the source.

The Effect of High School Exit Exams on Graduation, Employment, Wages and IncarcerationOlesya Baker and Kevin LangNBER Working Paper No. 19182June 2013JEL No. I21,I24,I28,J24,J3
ABSTRACT
We evaluate the effects of high school exit exams on high school graduation, incarceration, employmentand wages. We construct a state/graduation-cohort dataset using the Current Population Survey, Censusand information on exit exams. We find relatively modest effects of high school exit exams excepton incarceration. Exams assessing academic skills below the high school level have little effect. However,more challenging standards-based exams reduce graduation and increase incarceration rates. Abouthalf the reduction in graduation rates is offset by increased GED receipt. We find no consistent effectsof exit exams on employment or the distribution of wages.
Olesya BakerDivision of Health Policy TranslationBrigham and Women's HospitalNH 30475 Francis St., Boston, MA [email protected]
Kevin LangDepartment of EconomicsBoston University270 Bay State RoadBoston, MA 02215and [email protected]
1
Twenty-five states, with nearly 70 percent of public school students, have high school exit exams
(Center on Education Policy, 2012). Typically, students who do not pass all portions of the high
school exit exam even after multiple attempts cannot obtain a high school diploma. This high-
stakes nature of exit exams has made them highly controversial. Proponents of high-stakes
testing assert that exit exams raise achievement by motivating students and assure employers and
colleges of the quality of high school graduates. However, critics argue that exit exams increase
the dropout rate, narrow the curriculum, and withdraw attention from low-performing students
whose achievements fall far short of the established standards.
Most studies of high school exit exams find adverse effects on graduation rates, some
positive effects on employment and no effect on mean wages. While replicating these findings
except that we find no consistent employment effects, we broaden the range of outcomes to
distinguish between GEDs and high school diplomas. We also examine different quantiles of the
wage distribution and address incarceration.
We use Current Population Surveys (CPS) and Census data to create a state/cohort panel
and exploit the staggered timing of the implementation of exit exams across states. We include
state and graduation cohort fixed effects to control for time-invariant characteristics of states and
characteristics that affect all states but vary across graduating cohorts. In some specifications, we
also include state-specific cohort trends. We focus on results that are robust to the in/exclusion of
these trends and the choice of sample.
Overall, we find modest effects of high school exit exams. “Minimum competency”
exams that assess skills taught below the high school level have negligible effects on graduation
rates. “Standards-based” exams that test high school level content are associated with a decline

2
in the graduation rate of about one percentage point, consistent with findings in the previous
literature. In addition, this decline is only partially offset by an increase in the number of students
obtaining a GED. We also find that in some specifications, standards-based exams that replace
existing minimum competency exams have small and insignificant effects on graduation rates,
while standards-based exams that were implemented from the ground up have a much larger
negative effect. This suggests that the decline in the graduation rate might be a transitory
adjustment cost. Our attempts to confirm this hypothesis directly give mixed results.
In addition, we find a robust adverse effect of standards-based exams on the
institutionalization rate. The exams increase incarceration by about .2 percentage points or about
12.5 percent. As for graduation rates, we find that the effect of these exams is greater when they
start from the ground up rather than replace a minimum competency exam. The point estimates
of the effect of minimum competency exams on incarceration are also positive but fall well short
of significance at conventional levels. We find no consistent effects on the remaining outcomes:
percentiles of the wage distribution and employment.
The organization of this paper is as follows. The next section examines the history and
current state of the high-school exit exam movement. Section 2 briefly describes the theory
regarding the impact of exit exams on graduation rates and wages. Section 3 reviews previous
studies. Sections 4 and 5 describe the data and our statistical approach. Section 6 presents the
results. Finally, Section 7 concludes.
1 Background
The roots of the high school exit exam movement date to the 1970s. The initiators of this
movement, mainly state policy-makers and grass-root reformers, were responding to concerns

3
that many young people were graduating from high school without a solid foundation of
academic knowledge and skills. Their proposed solution was to set minimum standards for
graduation. Whether high school students met this minimum quality standard was determined by
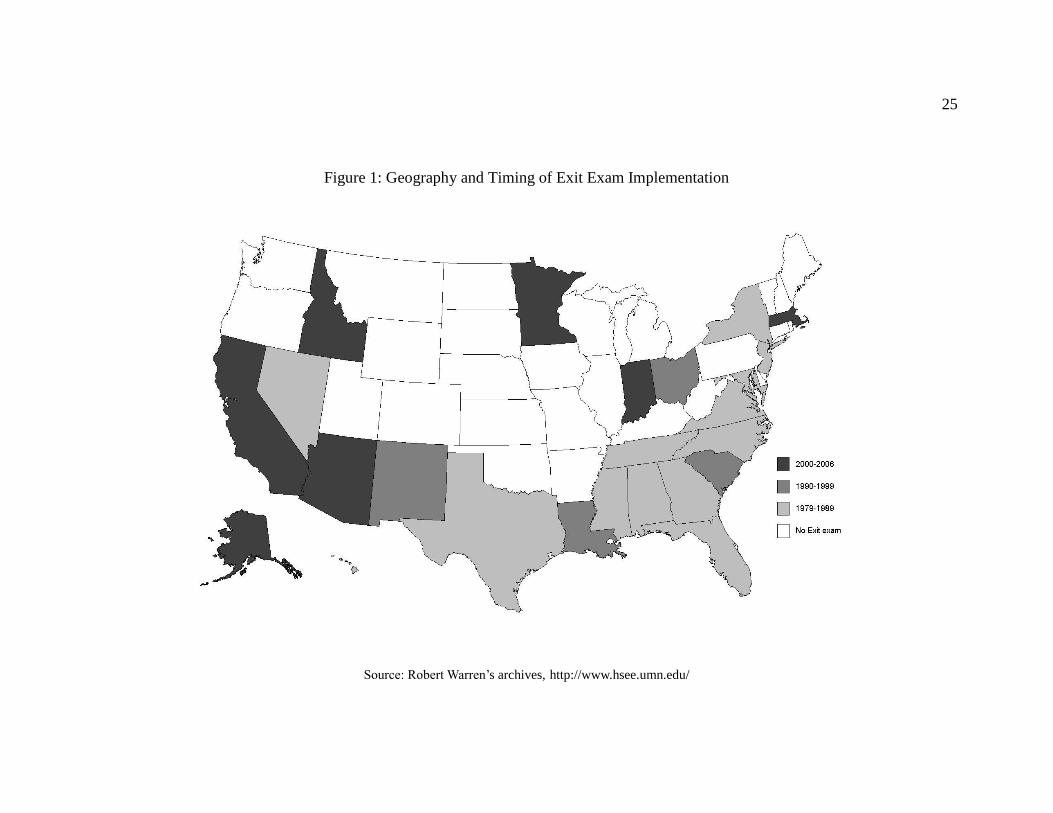
a state high school exit exam. Figure 1 shows that early adopters were primarily border-states
and East Coast states, while later adopters included the West Coast and a handful of centrally
located states.
Initially, cutoffs for high school exit exams were low; exams tested basic academic skills
typically taught between 6th
and 8th
grades. These minimum competency exams were prevalent
in the 1970s and 1980s, but in more recent years they have been replaced with more rigorous
standards-based exams that focus on academic skills learned in 9th
grade or later. Both types of
exams assess English and math skills; some of the more recent standards-based exams also
assess other subjects such as science or social studies and several states implemented end-of-
course exams that test content taught in particular courses. Exams are first administered in the
9th
, 10th
or 11th
grades, depending on the type of exam and the state. Students have two to eleven
retesting opportunities, depending on the state. In some states students who fail multiple attempts
can petition to graduate based on course grades, letters of recommendation, school attendance
and other academic factors (Center on Education Policy, 2002).
2. Theoretical Motivation
We describe the theory only briefly and informally. Fuller treatments can be found in Betts and
Costrell (2001) and Lang (2007, chapter 8). We treat exit exams as raising the graduation
requirement. Since typically performance on exit exams is not readily available to employers,

4
this is the primary mechanism through which they can affect education and labor market
outcomes,
The easiest case arises when education is a pure sorting device. By definition, in this
case, testing has no effect on average wages. By raising the cost of obtaining a diploma, exit
exams induce some people who would otherwise graduate from high school to leave without a
diploma. Assuming that individuals who are on the margin of obtaining their diploma are, on
average, more skilled than are dropouts and less skilled than infra-marginal high school
graduates, wages will rise both for individuals who would drop out anyway and for those or who
get their diploma in both cases. The losers are those whom the exam induces to drop out.
If individuals have the option of earning a GED, the change is even more complicated.
Since the minimum competency exams are at a lower level than the GED, it is difficult to see
how the presence of the GED would influence their effect. However, when standards-based
exams raise graduation requirements, we would expect many of the marginal diploma recipients
to switch to the GED. This raises the value of the GED and should induce some additional low
performing dropouts to also take the GED. Under this scenario, the increase in the number of
GEDs would more than offset the reduction in the number of students getting diplomas.
Even in this very simple scenario, the effects of high-stakes exams on the wage
distribution are complex, lowering wages for those who continue to have no certification, raising
them for those who switch from no certification to GED or who hold GEDs in both scenarios,
lowering wages for those who switch from a diploma to a GED and raising them for those who
hold diplomas in both settings.

5
Adding the role of education in human capital production adds further complexity.
Presumably, those individuals who are induced to work harder to pass the exam see somewhat
larger wage increases while those who are induced to drop out lose even more.
It is possible to derive scenarios in which high-stakes exams increase graduation rates,
but since we do not observe this in the data and since the focus of this paper is empirical, we do
not discuss them here.
3. Literature Review
The existing literature reaches inconsistent conclusions about the consequences of exit exams.
The early literature (David Grismer et al, 2000; Stephen Klein et al, 2000; Haney, 2000; Amrein
and Berliner, 2002) often focused on reforms in a small number of states, most notably Texas,
and on effects on test scores and, to a lesser extent, graduation rates often confounding
accountability and exit exams. Later papers broadened the analysis to include more states and
more outcomes.
Our paper is closest in spirit to Warren, Jenkins, and Kulick (2006), Dee and Jacob
(2006), and Warren, Grodsky, and Lee (2008). All three papers are based on a time-series/cross-
section analysis of states. Warren, Jenkins and Kulick use the October Current Population
Surveys to measure dropout rates among 16 to 19 year olds, the Common Core of Data to
measure high school completion rates and data from the American Council on Education to
measure the proportion of 16 to 19 year olds taking the GED. They estimate that more difficult,
but not less difficult, exams reduce the high school completion rate and may increase use of the
GED. Moreover, they find larger effects in states with more ethnically and racially diverse
populations and higher poverty rates.

6
Dee and Jacob use Census data to examine the effect of high school exit exams on school
completion rates. Unlike Warren, Jenkins and Kulick, they can address ultimate graduation rates
because they look at older respondents. However, the data do not distinguish between a GED and
a traditional diploma, forcing them to examine the effects on high school graduation including
the GED. They find small adverse effects of more difficult exams and even smaller adverse
effects of less difficult exams. They also find some evidence of positive employment effects for
women, positive wage effects for blacks (for more difficult exams) and adverse wage effects for
whites and Hispanics.
Finally, Warren, Grodsky, and Lee use the U.S. Census 5% Public-Use Microdata
Samples and the Outgoing Rotation Groups of the Current Population Surveys to assess whether
high school exit exams have widened the gap in labor force status between those with and
without high school diplomas. They find no evidence that high school exit exams affect gaps in
labor force status or that these outcomes vary across race.1
Our analysis differs from the above studies in the following ways. First, we look at older
cohorts for whom we can observe completed schooling. Second, using the older cohorts and CPS
data we separately analyze GED and high school diploma rates and test whether a decrease in
high school completion rates is offset by an increase in GED receipt. Third, we separately
evaluate the short-term and long-term effects of exit exams on graduation and GED rates. Fourth,
we use Census data to examine effects on rates of institutionalization. Finally, rather than
focusing on mean wages, we analyze different quantiles of the wage distribution.
1 There is a voluminous literature on the effects of school accountability systems. For an
excellent review see Figlio and Loeb (2011). Deming et al (2013) includes a briefer but more
recent review.

7
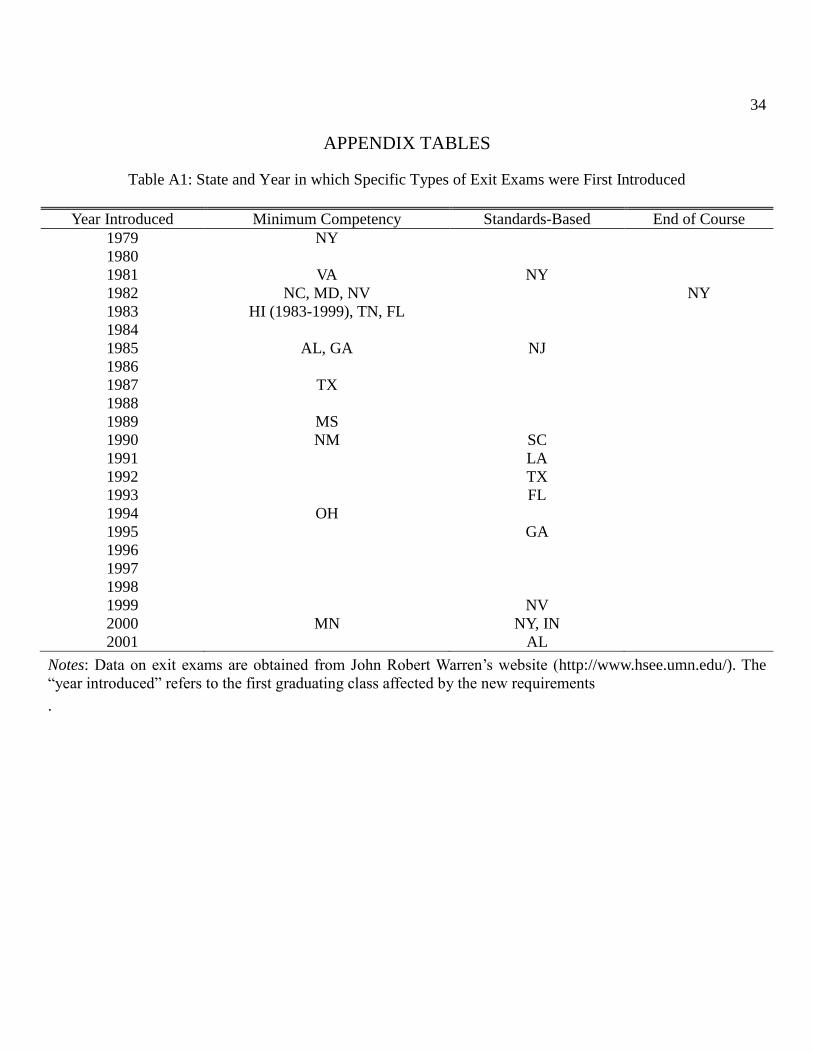
4. Data
We gathered information on the implementation date, type of exam and grade when first tested
using archival research, direct communication with state departments of education and,
primarily, from John Robert Warren at the University of Michigan.2 These data allow us to
distinguish between two types of high school exit exams: minimum competency (basic skills
below the 9th
grade) and standards-based (aligned with high school level standards).3 We limit
our sample period to cohorts who graduated between 1977 and 2001. Although new exit exam
policies were implemented after 2001, No Child Left Behind (NCLB) policies also applied after
then and graduation targets set under NCLB can confound the effects of exit exams.
By 2001 eighteen states had a high school exit exam: Alabama, Florida, Georgia, Indiana,
Louisiana, Maryland, Minnesota, Mississippi, Nevada, New Jersey, New Mexico, New York,
North Carolina, Ohio, South Carolina, Tennessee, Texas, and Virginia. The 33 remaining states
(including the District of Columbia) either never introduced a high school exit exam or did so
later.
Although not the primary focus of our study, it is important to account for the use of
accountability systems because exit exams are often used for school and district accountability.
There are two types of accountability systems: report card accountability that requires
dissemination of school performance information to the public, and consequential accountability
that goes a step further by attaching consequences (e.g., financial incentives, takeover threats) to
school performance. Accountability systems might affect the graduation rate if, for example,
schools at risk of sanctions improve student performance and increase high school completion.
2 See http://www.hsee.umn.edu/.
3 We code two states that have end-of-course exams as having standards-based exams.

8
We obtain data on the introduction of state accountability policies from Hanushek and
Raymond’s (2004) accountability study.4
We draw outcomes data from both the merged outgoing rotation groups (MORG) of the
Current Population Survey (CPS) and the US Census. Both sources include information on
educational attainment, earnings and basic demographics. After 1998 the CPS distinguishes
between a high school diploma and GED while the Census combines these two categories into a
single variable. The primary disadvantages of the CPS are that a) we must classify individuals by
their current state of residence, not by where they lived when they attended high school, and b) it
excludes the institutionalized population and therefore significantly under-represents high school
dropouts (Sum and Harrington, 2003).5 The Census, on the other hand, identifies and surveys the
institutionalized population and provides information on the individual’s state of birth.
Therefore, the Census complements the CPS data, and we use both in our analysis.
When exit exam policies are first introduced, they apply to a given graduating class: the
state first begins withholding diplomas from students who reach 12th
grade in the
“implementation year.” Therefore, we focus on people who turned 18 (assumed high school
graduation age) from 1977 to 2001 in the CPS and 1977 to 1998 in the Census data.6 We refer to
these yearly samples as “graduation cohorts,” even though some individuals may have dropped
out of high school before turning 18.
4 For the 9 states not in Hanushek and Raymond sample—Alaska, Idaho, Illinois, Iowa, New
Hampshire, New Jersey, Ohio, Pennsylvania, and South Dakota—we conducted additional
research using state education department websites. We assumed that once an accountability
system is introduced, it remains in place for the following years. 5 Exclusion of the non-civilian population likely produces a downward bias.
6 Assuming all students graduate at 18 entails some measurement error and can create attenuation
bias. We must limit the endpoint of Census data to 1998 because we focus on individuals who
are 20 years or older in the Censuses.
9
Although we focus on individuals who turned 18, or “graduated”, between 1977 and
2001, the outcomes data are drawn from the 1994 through 2011 CPS MORG files and from a 5
percent sample of the 1990 and 2000 Censuses. We begin the CPS analysis in 1994 because it is
the first year in which we can eliminate immigrants who arrived after the age of sixteen and,
hence, attended little or no high school in the United States. Furthermore, 1998 is the first year in
which we can distinguish between having a GED and a high school diploma. We focus on the
1990 and 2000 Censuses because the time span of this sample is similar to that of the CPS
sample. We restrict both samples to those individuals who are at least twenty (twenty-three for
the wage analysis) at the time of the survey to allow for individuals who receive their diplomas
when they are nineteen. The samples are restricted to those forty or younger in order to reduce
educational attainment recall bias.7
Because we begin observing outcomes in the 1990s, individuals who turned 18 during the
late seventies or early eighties will be older when we observe them in our sample. Assuming
there is no recall bias about educational attainment, the effect of exit exams on the graduation
rate should not vary by age at observation. Employment and wage outcomes for older cohorts,
however, do reflect long-term effects and can help us learn whether effects of exit exams are
short-lived or whether they persist.
The resulting CPS dataset consists of 1,500,396 individuals whose predicted graduation
occurred between 1977 and 2001 and whose schooling and employment outcomes are observed
between 1994 and 2011. The dataset of individuals for whom we can distinguish between
holding a traditional diploma or a GED consists of 1,222,191 observations. The Census dataset
7 Our initial examination of the data revealed a strong tendency for within cohort educational
attainment to grow after age 40, which we deemed implausible.
10
consists of 5,811,769 individuals whose predicted graduation occurred between 1977 and 1998
and whose schooling, incarceration and employment outcomes are observed in 1990 or 2000.
Because exit exams apply uniformly to all students in a given state, within-state variation
across students does not contribute to identification. Therefore, we aggregate the data so that our
dependent variable is, for example, the proportion of individuals in cohort c in state s who
received a high school diploma.8 Wage and employment outcomes must be adjusted for the ages
and years in which the cohort is observed. We discuss this adjustment in detail later. The
aggregated CPS dataset contains 1275 state-graduation cohort observations. The Census dataset
has 1122 observations, reflecting the absence of data on the 1999 to 2001 graduation cohorts.
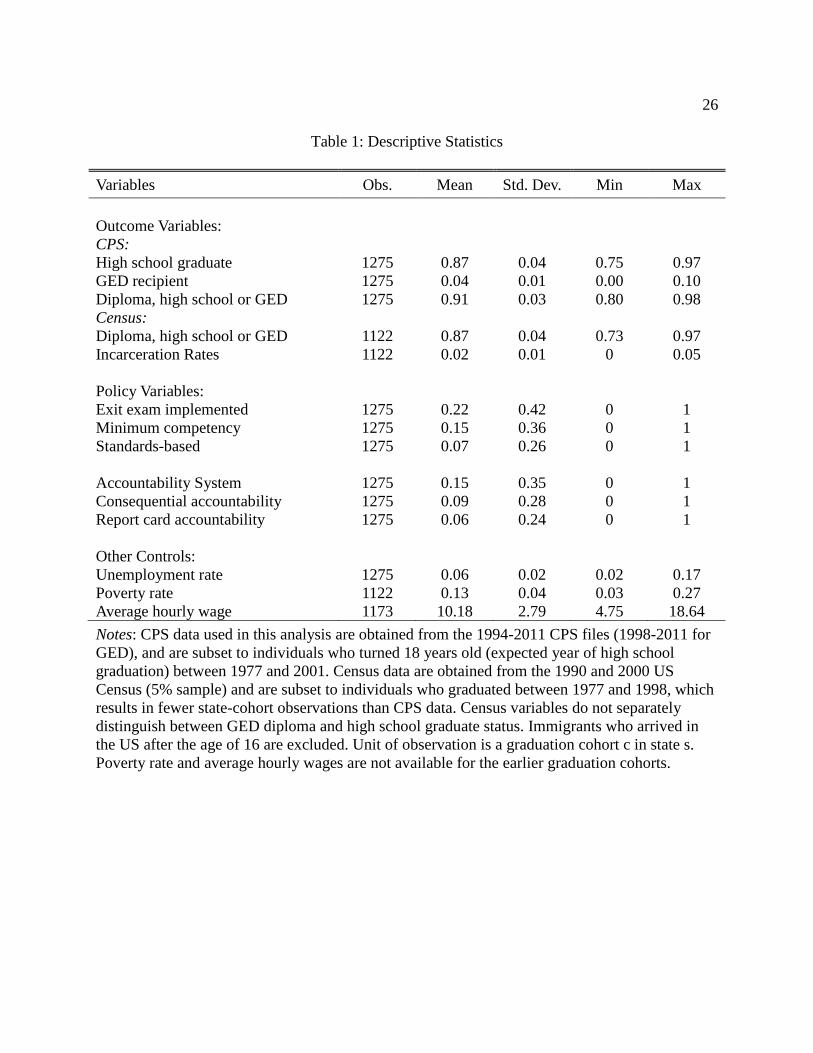
Table 1 presents descriptive statistics for the key variables. High school diploma rates for
the state-graduation cohort CPS sample are about 91 percent of which about 4 percent are GED.9
The Census high school diploma rates are lower, at 87 percent. Roughly 22 percent of the state-
graduation cohort observations have an exit exam, of which 15 percent are minimum
competency exams and 7 percent are standards-based. Accountability systems are in place in 15
percent of the state-cohort sample.
5. Empirical Strategy
The contradictory conclusions presented in the literature review suggest that identifying the
effect of exit exams is difficult. In particular, exit exam policies may be endogenous to the
outcomes of interest. For example, states with a greater share of low-performing students might
8 The individual-level observations are weighted using sampling weights provided by the CPS
9 Our CPS estimates of graduation rates are higher than the national averages. This is because we
exclude immigrants who arrived after the age of 16 and the institutionalized population. Both of
these groups have high school dropout rates above the national average.
11
be more likely to pursue exit exam policies but also to have lower initial graduation rates relative
to other states.
We use a fairly standard differences-in-differences approach with state and graduation
cohort fixed effects to control for characteristics that are common across graduating cohorts
within a state and characteristics that vary over graduation cohorts but are constant across all
states (such as national economic or education policies). 10
Using the state-graduation cohort dataset, we estimate the effects of high school exit
exams on graduation/dropout, GED and non-employment rates and wage quantiles using the
following equation:
(1)
where is the outcome variable of interest for state s and graduation cohort c; is a set of
dummy variables capturing whether state s had a minimum competency exam, a standards-based
exam, report card or consequential accountability that applied to graduating cohort c; is a state
fixed effect and is a cohort effect measuring the year of assumed graduation.
When we analyze short-term versus long-term effects of exit exams, we expand to
include three types of exams: minimum competency, standards-based not preceded by a
minimum competency exam and standards-based implemented after a minimum competency
phase-out. In one specification, we then interact each of these three variables with years since
exam implementation dummies.
10
CPS data contain only the state of current residence; therefore, we must assume that the state
where individuals are residing at the time of the survey is the state where they attended high
school. Census data contain an individual’s state of birth, and we use this variable for robustness
checks.
12
A potential problem with Equation 1 is that not only may policies be correlated with
unobserved state effects, but policy changes may also reflect underlying state trends. This could
generate serial correlation in the state error terms and severely bias the standard errors. First, we
address this by clustering the standard errors in Equation 1 by state. In addition, we estimate:
(2)
where we do not cluster standard errors by state but have added a state-specific cohort
trend .11
The state-specific cohort trend captures any systematic state-specific changes over
the sample period; is a set of additional state-specific time-varying regressors
(unemployment rate, average hourly wages, poverty rate) measured at the cohort’s graduation
year. Those specifications that include these time-varying state-specific variables must drop the
first three graduation cohorts.
As described in the theory section, exit exams can affect the distribution of wages.
Therefore, we begin our wage analysis by using individual-level data and calculate the 10th
, 30th
,
50th
, 70th
, and 90th
percentiles of the log hourly wage for each state-graduation cohort. We
estimate the percentiles in two ways: our preferred Ordinary Least Squares (OLS) method is
described below; the quantile regression method is described in the section on robustness checks.
We then examine the effects of testing on each percentile separately.
To calculate wage quantiles for each graduation cohort in each state, we regress log
wages on age and time (year of survey) dummies:
11 For this specification, we do not cluster errors by state. Experimentation showed that such clustering did not have
a consistent effect on the reported standard errors, and it is not clear that the problems that clustering is intended to
address should remain in the presence of state-specific trends.
13
(3)
From this regression we obtain the residuals, , which have been purged of the effects of age
(experience) and survey year (economy-wide factors). For each state and graduation cohort, we
then compute the quantiles of these residuals. The resulting dataset is a collection of (residual)
wage quantiles for each state and graduation cohort; therefore, it has the same observational
structure as the aggregated data used in previous regression specifications. We then use these
state-cohort quantiles as dependent variables. The explanatory variables are the same as in
equations (1) and (2).
We estimate the employment effects in an analogous fashion. First, we regress a dummy
variable for non-employment on year and age dummies as in (3). We then calculate the mean
residual for each state-cohort group and use this corrected employment rate as the dependent
variable in equations (1) and (2). Age, conditional on being 23-40, and year are in practice close
to orthogonal to state-cohort especially once we condition on state and cohort fixed effects.
Therefore, the residual means are very close to state-cohort fixed-effects estimates. In fact, in
practice, our results using the corrected employment variable are virtually indistinguishable from
estimates using the state-cohort mean employment rate across all surveys.
6. Results
Education Outcomes
Tables 2 and 3 show the effects of exit exams on high-school graduation rates when we do not
distinguish between a high school diploma and GED. These tables consist of three panels. In the
upper panel, we differentiate only between the presence and absence of an exit exam and

14
between the presence and absence of an accountability system. The middle panel distinguishes
between minimum competency and standards-based exams and between report card and
consequential accountability. Finally, the lower panel distinguishes among minimum
competency, standards-based not preceded by minimum competency exams and standards-based
that replaced minimum competency exams.
The coefficients in the first column of both tables are uniformly negative, which suggests
that both exit exams and accountability systems are associated with lower graduation/GED rates.
However, in the absence of state and cohort controls, there is little reason to believe that the
estimated effects are causal. Indeed, once we control for state and cohort in column 2 and state-
specific trends in column 3, the exam and accountability effects estimated using both CPS and
Census data become smaller and some become statistically insignificant.
The coefficient on the exit exam dummy, displayed in the last columns of the first panel,
is negative and significant when CPS data are used, and small and insignificant when Census
data are used, making it difficult to draw strong conclusions. Panel two of both tables displays
the coefficients for minimum competency and standards-based exams and for report card and
consequential accountability separately. The CPS results suggest that more rigorous standards-
based exams have an adverse effect on graduation rates of about 0.8 percentage points. The
Census results are similar but generally somewhat smaller and not always statistically
significant. The effects of minimum competency exams are smaller than those of standards-
based exams using the CPS and non-existent using the Census. We find no consistent effect of
either form of accountability.
15
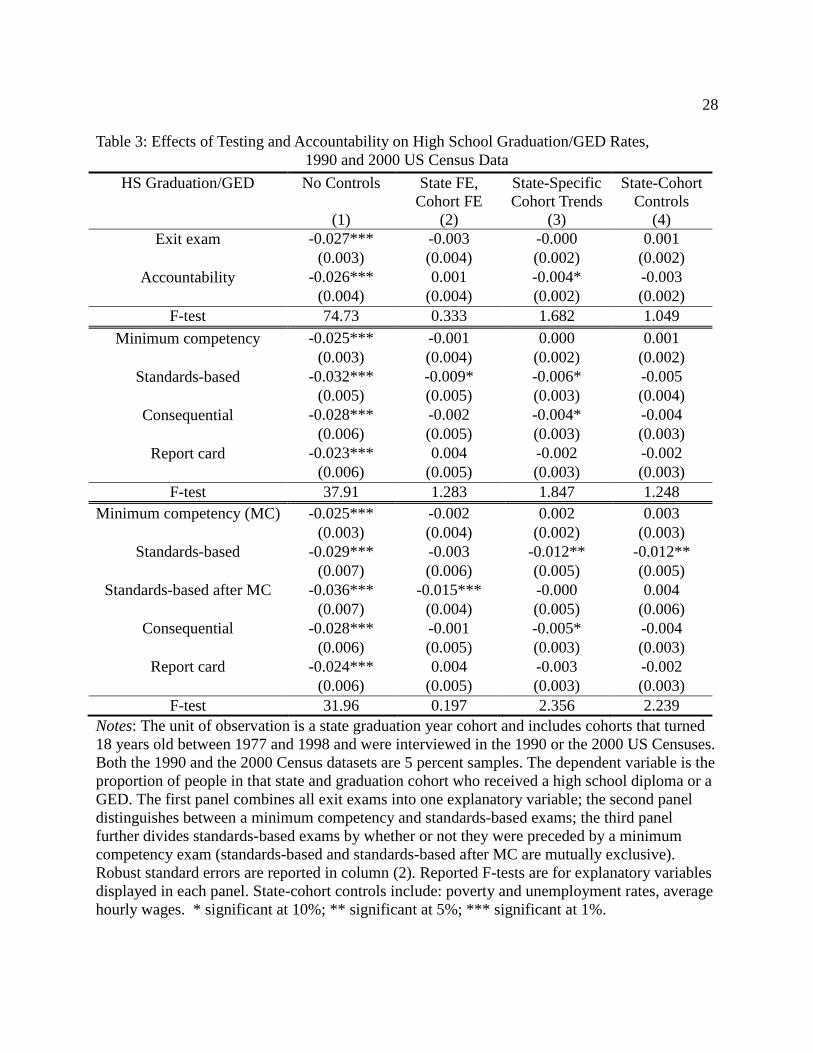
The third panel addresses the possibility that implementing a challenging exit exam
lowers graduation rates more than does replacing a less rigorous exit exam with a more rigorous
one. As panel 3 shows, when we use the CPS data and do not control for state-specific trends, the
effects of standards-based testing are estimated to be similar regardless of whether they replace a
minimum competency exam. Using the Census data, column (2) suggests a stronger effect of
standards-based exams when they follow a minimum competency exam. However, when we
control for state-specific trends, standards-based exams implemented from scratch have a larger
negative effect on graduation rates, 1.3 percentage points using the CPS and 1.2 percentage
points using the Census. Standards-based exams that were preceded by minimum competency
exams show no adverse effect—an insignificant decline in graduation rates of about 0.3
percentage points using CPS data and an insignificant increase of 0.4 percentage points using
Census data.12
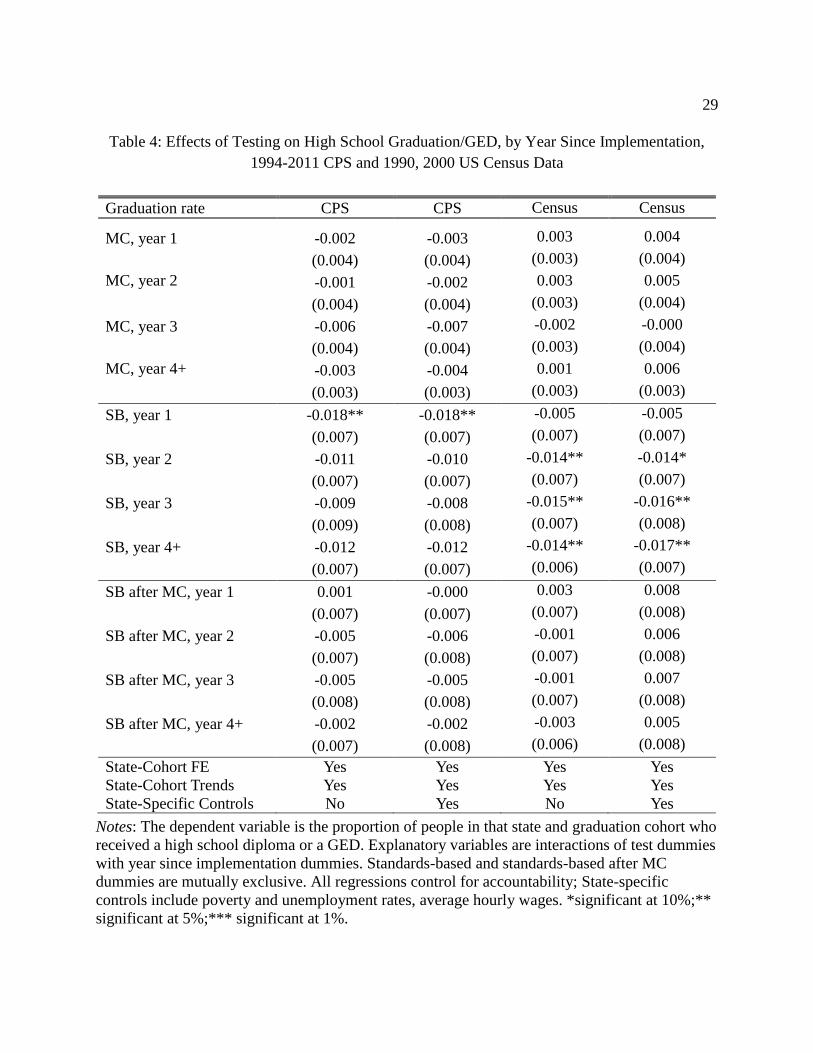
The results with state-specific trends suggest the hypothesis that schools can adjust to
tougher requirements over time, by, for example, developing new teaching methods and remedial
courses. This suggests interacting the three types of exit exam dummies (minimum competency,
and standards-based with or without prior minimum competency) with year-since-
implementation dummies. We distinguish among one, two, three and four or more years since
exit exam implementation. The results, presented in table 4, are imprecise and inconsistent.
Although the CPS estimates show that effects of standards-based exams that were not preceded
by minimum competency exams are reduced in year two, Census estimates show the opposite –
large and significant negative effects that are sustained even four or more years after exam
12
The two standards-based dummies are mutually exclusive.

16
implementation. In neither case are the differences between the first and long-standing
administrations of the test statistically significant. Thus while the adaptation hypothesis has some
intuitive appeal, our data are inadequate to support or reject it.
Table 5 displays the results of CPS data analysis that distinguishes between a GED and a
high school diploma.13
With varying degrees of significance, all specifications tell the same
story. Minimum competency exams do not affect GED receipt, but standards-based exams are
associated with an increase in the GED that only partially offsets the decline in high school
diplomas and that the effect is driven by standards-based exams that were not preceded by
minimum competency exams.
The results presented in table 5 are partially consistent with theoretical models of exit
exams. Theory predicts a decrease in high school graduation rates due to exit exams, and in some
specifications we do observe a such a decrease in traditional diploma rates due to standards-
based exams. Theory also predicts that this decline will be fully offset by individuals obtaining a
GED. However, the increase in the proportion of individuals obtaining a GED is too small to
offset the decline in graduation rates.
Extensions and Robustness Checks
We attempted to look at the effects of exit exams on graduation rates for three separate
categories of race/ethnicity (non-Hispanic white, Hispanic, black) interacted with sex. However,
our estimates were too imprecise to draw any conclusions. Some of the coefficients were not
small, but only one of thirty-six coefficients was significant at the .05 level.
13
Table 5 uses four fewer years of data than table 2. Therefore, we do not expect the sum of the
high school diploma and the GED effect to be exactly the same as that reported in table 2. GED
and high school diploma variables are not available in the Census.
17
In addition to the overall effect of exit exams on graduation, it would be helpful to
understand how exit exams affect the timing of the dropout decision for those students who are
adversely affected by exams. Martorell and Clark (2010) find little difference in the earnings of
students who just pass and just fail the last administration of a high school exit exam. This
suggests that if the students who are induced to drop out do so mostly late in high school, the
cost of dropping out may be low. However, dropping out in earlier grades will lead to fewer
years of schooling which might entail more substantial costs. Unfortunately, perhaps because we
do not observe grade completion for individuals who earned a GED, we obtained no conclusive
results.
In the analysis above, we treat individuals as currently residing in the state in which they
attended high school. The Census permits us to limit the sample to individuals living in the state
where they were born and who therefore attended high school there with high probability.
Results of this robustness check are presented in table A3 of the Appendix. The estimates are
similar to those in table 3 when we control for state-specific trends although the standard errors
are higher. With only state fixed effects, the adverse effect of standards-based exams is
attenuated.
We have followed Donald and Lang (2007) and Dickens (1990) in not weighting our
estimates because the relatively large sample size should make most of the error term reflect a
common state-cohort error rather than sampling error. As a robustness check, we replicate the
bottom panel of table 2 using feasible GLS where we have obtained the weights by regression
the squared residual on a constant and the inverse of sample size and used the inverse of the
18
predicted variance as the weights. As shown in appendix table A4, the results are similar to those
with no weighting.
Other Outcomes
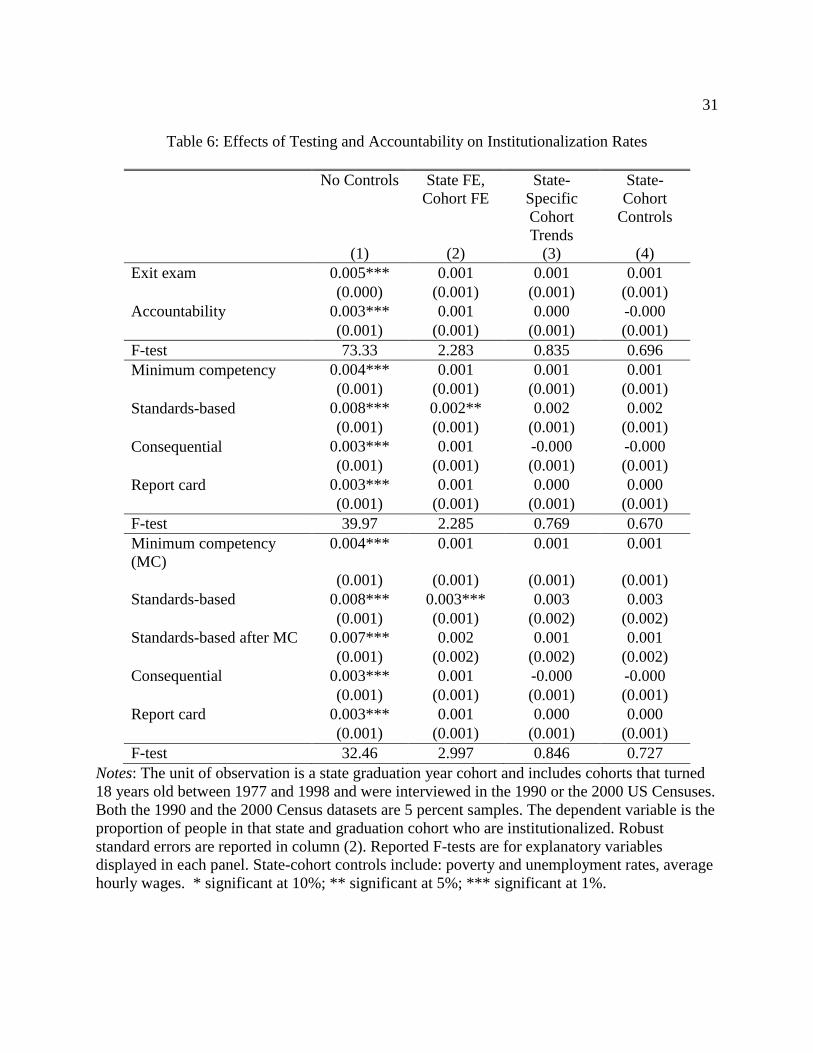
Before turning to labor market outcomes, we examine the effect of testing on
institutionalization or, de facto, incarceration. We compute the percentage of individuals in each
state/graduation cohort who are institutionalized and estimate equations similar to those we have
used to examine high school graduation rates. As can be seen in the top panel of table 6, exit
exams overall have no detectable effect on incarceration rates once we control for state and
cohort fixed effects. However, the middle panel suggests that an important adverse effect of
standard-based exams is obscured by a much smaller or zero effect of minimum competency
exams. When we control for state and cohort fixed effects, we estimate that standards-based
exams raise the incarceration rate by .23 percentage points, significant at the .02 level. Adding
state-specific trends raises the standard errors but does not noticeably change the estimate. In this
specification, standards-based exams raise the incarceration rate by .20 percentage points and the
t-statistic is 1.64. Adding further time-varying state controls at the cost of three cohorts of data,
produces an estimated effect of .22 percentage points but with a t-statistic of only 1.49.
Strikingly, the estimated effect of minimum competency exams in all specifications is to raise
the incarceration rate by .08 - .09 percentage points although the significance falls far short of
conventional levels.
The implied effects on incarceration are large although somewhat imprecise. The average
state has an institutionalization rate of about 1.6 percent during our sample period. An increase
of even .2 percentage points is therefore substantial. Consistent with some of our earlier findings

19
regarding graduation, we also find larger effects of standards-based exams if they do not replace
a minimum competency exam. Again, the absence of statistical significance when we add
state/cohort trends reflects higher standard errors rather than different coefficients. The
coefficient rises from .26 percentage points without such trends to .29 percentage points in the
last two specifications. The point estimates also suggest that standards-based exams have adverse
effects of .12 - .19 percentage points even when they follow minimum competency exams, but
the coefficients are not significant at any conventional level.14
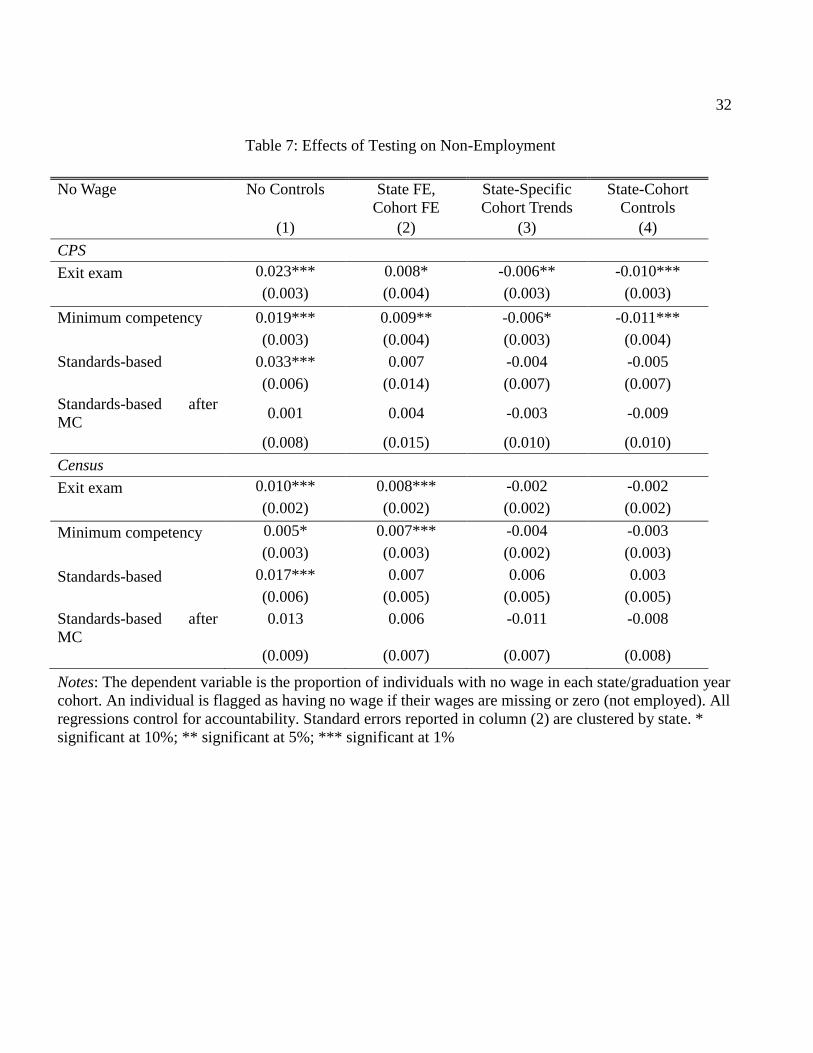
In the labor market analysis, we restrict our sample to those who are between the ages of
23 and 40 at the time of the CPS and Census surveys. In table 7, we show the effect of testing on
the proportion of workers who do not report a wage, that is, on non-employment. The upper
panel examines the effects of testing as a whole, while the lower panel examines the effects of
minimum competency vs. the two types of standards-based exams separately. The results are
very sensitive to whether or not we control for state-specific trends and somewhat sensitive to
choice of sample. When we control for state trends, the results suggest a small but beneficial
effect of exit exams on non-employment when CPS data are used, but no significant result when
Census data are used. When we divide the sample into six groups based on race/ethnicity and
sex, most of the estimated effects are small and none is significant at the .05 level.
14
We attempted to examine the effect of testing on incarceration rates by race and gender, but
the estimates were too imprecise to be useful. Coefficients often reversed sign between
specifications and only one estimate out of thirty-six (white males in the specification with state-
specific time-trends ) was significant at even the .05 level.

20
Table 8 shows the effect of exit exams on quantiles of the log wage distribution. These
quantiles are computed using the distribution of the log wage residuals that are purged of the
effects of age and time. Overall, the CPS results show neither large nor significant effects of high
school exit exams on the distribution of wages. It is difficult to say what would constitute a large
effect, but certainly the results suggest neither a dramatic drop nor a dramatic increase in wages
near the lower parts of the wage distribution which are most likely to be affected by exit exams.
We performed a number of specification tests on these data, analyzing a finer partition of the
lower part of the wage distribution, and again did not find any large or significant effects. The
Census data do show significant effects on the 50th
and 70th
percentiles; however, these results
are not robust to the choice of specification, nor would they survive a Bonferroni adjustment.
Note that the lack of an effect on the lower percentiles is consistent with the relatively
small effect of exit exams on educational attainment, which is likely too modest to show up in
the wage estimates. The lack of a wage effect also suggests that testing neither greatly improves
nor greatly diminishes the quality of instruction.
Finally, as an alternative to our approach to calculating wage quantiles, we estimate
quantile regressions separately for each state to get a normalized cohort wage for that state. Table
A5 shows the effect of the exit exam policies on the 10th, 30th, 50th, 70th and 90th quantiles of
the log wage distribution. The results are similar to those in table 8.
7. Conclusion
Perhaps the most important conclusion of our analysis is that, with the exception of
incarceration, the effects of exit exams are modest and many are not robust. We find no effect on
graduation rates of minimum competency exams. Standards-based exams reduce the graduation

21
rate by about one percentage point. This effect seems to be concentrated in states that had not
previously administered a minimum competency exam although the evidence is somewhat mixed
on this point. This suggests the hypothesis that the effect is short-lived while schools adjust to
the new standards. However, the direct evidence for this hypothesis is at best weak.
We do not find consistent evidence of an effect of exit exams on non-employment or the
distribution of wages. This lack of any measureable wage effect may reflect a lack of power. If
we assume that the average additional dropout loses one and a half years of education valued at
10 percent per year, the effect on the average wage of a one percentage point increase in the
dropout rate is too small to measure. However, we do not find any effect at lower percentiles,
where there should be somewhat more power. At the same time, the absence of any positive
effects suggests that the tests do not significantly increase student learning. Of course, it is
possible that modest learning gains for those who stay in school just offset the large losses of
those who do not, but the simplest explanation is that both effects are small.
The real concern raised by the results presented here is the effect on the incarceration rate
where we find large effects of standards-based exams and smaller and statistically insignificant
effects of minimum competency exams that are nevertheless also sufficiently large to be
disturbing.
Overall, the results presented in this paper support neither the dreams of the strongest
advocates of exit exams nor the nightmares of their severest critics. However, nothing in this
paper suggests that exit exams have large positive effects on student learning and productivity
growth while they do suggest an important adverse effect for one segment of the population.
22
REFERENCES
Amrein, Audrey L., and David C. Berliner. (2002a, January). “An Analysis of Some
Unintended and Negative Consequences of High-Stakes Testing.” Retrieved November 02,
2012 from National Education Policy Center: http://nepc.colorado.edu/files/EPSL-0211-125
EPRU.pdf
Amrein, Audrey L., and David C. Berliner. (2002b, March 28). High-stakes testing, uncertainty,
and student learning. Education Policy Analysis Archives, 10(18).
Amrein-Beardsley, Audrey L., and David C. Berliner. (2003, August 4). Re-analysis of NAEP
math and reading scores in states with and without high-stakes tests: Response to Rosenshine.
Education Policy Analysis Archives, 11(25).
Betts, Julian R. and Robert M. Costrell. (2001). “Incentives and equity under standards-based
reform.” In Diane Ravitch (Ed.), Brookings Papers on Education Policy 2001. Washington,
D.C.: The Brookings Institution Press, 2001.
Bishop, John, and Ferran Mane. (2001, May). The impacts of minimum competency exam
graduation requirements on high school graduation, college entrance and early labor market
success. Labour Economics, 8(2), 203-222.
Braun, Henry. (2004, January 5). Reconsidering the impact of high-stakes testing. Education
Policy Analysis Archives, 12(1). Retrieved Novermber 02, 2012 from
http://epaa.asu.edu/ojs/article/view/157
Bureau of Labor Statistics. Local Area Unemployment Statistics: Annual Average Estimates
from the Current Population Survey. Retrieved February 7, 2005 from
http://www.bls.gov/lau/staadata.pdf
Cameron, Stephen V., and James J. Heckman. (1993, January). The nonequivalence of high
school equivalents. Journal of Labor Economics, 11(1), 1-47.
Center for Education Policy (2002, September). State High School Exit Exams 2002 Annual
Report. Retrieved October 20, 2012 from
http://www.cep-dc.org/index.cfm?DocumentSubTopicID=8
Center for Education Policy (2012, September). State High School Exit Exams: A Policy in
Transition. Retrieved October 20, 2012 from
http://www.cep-dc.org/displayDocument.cfm?DocumentID=408
Chaplin, Duncan. (1999, November 29). “GEDs for teenagers: Are there unintended
consequences?” Retrieved November 02, 2012 from the Urban Institute:
http://www.urban.org/UploadedPDF/GED.pdf
23
Dee, Thomas S. (2002, June). “Standards and student outcomes: Lessons from the ‘first wave’
of education reform.” Prepared for “Taking account of accountability: Assessing politics and
policy,” Kennedy School of Government, Harvard University, June 10 and 11, 2002.
Deming, David J, Sarah Cohodes, Jennifer Jennings, Christopher Jencks and Maya Lopuch,
“High-Stakes Testing, Postsecondary Attainment and Earnings” unpublished, 2013.
Dickens, William T. (1990, May). “Error Components in Grouped Data: Is It Ever Worth
Weighting?” Review of Economics and Statistics, 72: 328-333.
Donald, Stephen and Kevin Lang (2007, May). “Inference with Differences-in-Differences and
Other Panel Data,” Review of Economics and Statistics, 89: 221-33.
Figlio, David and Susanna Loeb, “School Accountability,” in Eric A. Hanushek, Stephen
Machin and Ludger Woessmann, eds., Handbook of the Economics of Education, Vol 3,
Amsterdam: North-Holland, 383-421.
Grissmer, David W., et al. Improving Student Achievement: What State NAEP Test Scores Tell
Us. Santa Monica, CA: Rand Corporation, 2000.
Haney, Walt. (2000, August 19). The Myth of the Texas Miracle in Education. Education
Policy Analysis Archives, 8(41). Retrieved November 02, 2012 from
http://epaa.asu.edu/ojs/article/view/432
Hanushek, Eric A. and Margaret E. Raymond. (2004, September). “Does school accountability
lead to improved student performance?” Journal of Policy Analysis and Management, 24(2),
Spring 2005.
Klein, Stephen P., et al. “What Do Test Scores in Texas Tell Us?” Issue Paper 202, Rand
Corporation, Santa Monica, CA, 2000.
Koretz, Daniel (2008). Measuring Up, Cambridge, MA: Harvard University Press.
Lang, Kevin. (2007). Poverty and Discrimination, Princeton, NJ: Princeton University Press.
Martorell, Paco and Damon Clark (2010, August) “The Signaling Value of a High School
Diploma,” Rand Working Paper WR-780-UFLA.
Rosenshine, Barak. (2003, August 4). High-stakes testing: Another analysis. Education Policy
Analysis Archives, 11(24). Retrieved Nov 02, 2012 from http://epaa.asu.edu/ojs/article/view/252
Sum, Andrew, and Paul Harrington. “The hidden crisis in the high school dropout problems of
young adults in the U.S.: Recent trends in overall school dropout rates and gender differences in

24
dropout behavior.” Feb 2003. Retrieved November 02, 2012 from
http://www.brtable.org/pdf/914.pdf
U.S. Census Bureau. "Historical Poverty Tables, Table 21. Number of Poor and Poverty Rate,
by State: 1980 to 2003." Last revised: August 2004. Retrieved February 15, 2005
fromhttp://www.census.gov/hhes/poverty/histpov/hstpov21.html
U.S. Department of Education. (2003). Approved state accountability plans. Retrieved January
20, 2005 from http://www.ed.gov/admins/lead/account/stateplans03/index.html
U.S. Department of Education. (2004). A Guide to Education and No Child Left Behind.
Washington, D.C.: U.S. Department of Education, Office of the Secretary, Office of Public
Affairs. Retrieved on November 02, 2012 from
http://www2.ed.gov/nclb/overview/intro/guide/guide.pdf
.
25
Figure 1: Geography and Timing of Exit Exam Implementation
Source: Robert Warren’s archives, http://www.hsee.umn.edu/
26
Table 1: Descriptive Statistics
Variables Obs. Mean Std. Dev. Min Max
Outcome Variables:
CPS:
High school graduate 1275 0.87 0.04 0.75 0.97
GED recipient 1275 0.04 0.01 0.00 0.10
Diploma, high school or GED 1275 0.91 0.03 0.80 0.98
Census:
Diploma, high school or GED 1122 0.87 0.04 0.73 0.97
Incarceration Rates 1122 0.02 0.01 0 0.05
Policy Variables:
Exit exam implemented 1275 0.22 0.42 0 1
Minimum competency 1275 0.15 0.36 0 1
Standards-based 1275 0.07 0.26 0 1
Accountability System 1275 0.15 0.35 0 1
Consequential accountability 1275 0.09 0.28 0 1
Report card accountability 1275 0.06 0.24 0 1
Other Controls:
Unemployment rate 1275 0.06 0.02 0.02 0.17
Poverty rate 1122 0.13 0.04 0.03 0.27
Average hourly wage 1173 10.18 2.79 4.75 18.64
Notes: CPS data used in this analysis are obtained from the 1994-2011 CPS files (1998-2011 for
GED), and are subset to individuals who turned 18 years old (expected year of high school
graduation) between 1977 and 2001. Census data are obtained from the 1990 and 2000 US
Census (5% sample) and are subset to individuals who graduated between 1977 and 1998, which
results in fewer state-cohort observations than CPS data. Census variables do not separately
distinguish between GED diploma and high school graduate status. Immigrants who arrived in
the US after the age of 16 are excluded. Unit of observation is a graduation cohort c in state s.
Poverty rate and average hourly wages are not available for the earlier graduation cohorts.

27
Table 2: Effects of Testing and Accountability on High School Graduation/GED Rates,
1994-2011 CPS MORG Data
HS Graduation/GED No Controls State FE,
Cohort FE
State-Specific
Cohort Trends
State-Cohort
Controls
(1) (2) (3) (4)
Exit exam -0.016*** -0.005 -0.005** -0.006**
(0.002) (0.003) (0.002) (0.002)
Accountability -0.015*** 0.001 -0.001 -0.001
(0.002) (0.002) (0.002) (0.002)
F-test 69.12 1.328 3.004 3.343
Minimum competency -0.015*** -0.004 -0.005** -0.005**
(0.002) (0.003) (0.002) (0.002)
Standards-based -0.019*** -0.007* -0.008** -0.008**
(0.003) (0.004) (0.004) (0.004)
Consequential -0.014*** 0.001 0.000 -0.001
(0.003) (0.003) (0.002) (0.002)
Report card -0.015*** 0.000 -0.003 -0.002
(0.003) (0.003) (0.003) (0.003)
F-test 34.79 0.886 1.848 1.878
Minimum competency (MC) -0.015*** -0.004 -0.003 -0.004
(0.002) (0.003) (0.002) (0.003)
Standards-based -0.014*** -0.006 -0.013*** -0.013**
(0.005) (0.005) (0.005) (0.005)
Standards-based after MC -0.023*** -0.008* -0.002 -0.003
(0.004) (0.004) (0.005) (0.006)
Consequential -0.014*** 0.002 -0.000 -0.001
(0.003) (0.003) (0.002) (0.002)
Report card -0.015*** 0.000 -0.003 -0.002
(0.003) (0.003) (0.003) (0.003)
F-test 27.16 0.689 2.406 2.273
Notes: The unit of observation is a state graduation year cohort and includes cohorts that turned
18 years old between 1977 and 2001 and were interviewed by the CPS between 1994 and
2011. The dependent variable is the proportion of people in that state and graduation cohort
who received a high school diploma or a GED. The first panel combines all exit exams into
one explanatory variable; the second panel distinguishes between a minimum competency and
standards-based exams; the third panel further divides standards-based exams by whether or
not they were preceded by a minimum competency exam (standards-based and standards-based
after MC are mutually exclusive). Robust standard errors are reported in column (2). Reported
F-tests are for explanatory variables displayed in each panel. State-cohort controls include:
poverty and unemployment rates, average hourly wages.
* significant at 10%; ** significant at 5%; *** significant at 1%.
28
Table 3: Effects of Testing and Accountability on High School Graduation/GED Rates,
1990 and 2000 US Census Data
HS Graduation/GED No Controls State FE,
Cohort FE
State-Specific
Cohort Trends
State-Cohort
Controls
(1) (2) (3) (4)
Exit exam -0.027*** -0.003 -0.000 0.001
(0.003) (0.004) (0.002) (0.002)
Accountability -0.026*** 0.001 -0.004* -0.003
(0.004) (0.004) (0.002) (0.002)
F-test 74.73 0.333 1.682 1.049
Minimum competency -0.025*** -0.001 0.000 0.001
(0.003) (0.004) (0.002) (0.002)
Standards-based -0.032*** -0.009* -0.006* -0.005
(0.005) (0.005) (0.003) (0.004)
Consequential -0.028*** -0.002 -0.004* -0.004
(0.006) (0.005) (0.003) (0.003)
Report card -0.023*** 0.004 -0.002 -0.002
(0.006) (0.005) (0.003) (0.003)
F-test 37.91 1.283 1.847 1.248
Minimum competency (MC) -0.025*** -0.002 0.002 0.003
(0.003) (0.004) (0.002) (0.003)
Standards-based -0.029*** -0.003 -0.012** -0.012**
(0.007) (0.006) (0.005) (0.005)
Standards-based after MC -0.036*** -0.015*** -0.000 0.004
(0.007) (0.004) (0.005) (0.006)
Consequential -0.028*** -0.001 -0.005* -0.004
(0.006) (0.005) (0.003) (0.003)
Report card -0.024*** 0.004 -0.003 -0.002
(0.006) (0.005) (0.003) (0.003)
F-test 31.96 0.197 2.356 2.239
Notes: The unit of observation is a state graduation year cohort and includes cohorts that turned
18 years old between 1977 and 1998 and were interviewed in the 1990 or the 2000 US Censuses.
Both the 1990 and the 2000 Census datasets are 5 percent samples. The dependent variable is the
proportion of people in that state and graduation cohort who received a high school diploma or a
GED. The first panel combines all exit exams into one explanatory variable; the second panel
distinguishes between a minimum competency and standards-based exams; the third panel
further divides standards-based exams by whether or not they were preceded by a minimum
competency exam (standards-based and standards-based after MC are mutually exclusive).
Robust standard errors are reported in column (2). Reported F-tests are for explanatory variables
displayed in each panel. State-cohort controls include: poverty and unemployment rates, average
hourly wages. * significant at 10%; ** significant at 5%; *** significant at 1%.
29
Table 4: Effects of Testing on High School Graduation/GED, by Year Since Implementation,
1994-2011 CPS and 1990, 2000 US Census Data
Graduation rate CPS CPS Census Census
MC, year 1 -0.002 -0.003 0.003 0.004
(0.004) (0.004) (0.003) (0.004)
MC, year 2 -0.001 -0.002 0.003 0.005
(0.004) (0.004) (0.003) (0.004)
MC, year 3 -0.006 -0.007 -0.002 -0.000
(0.004) (0.004) (0.003) (0.004)
MC, year 4+ -0.003 -0.004 0.001 0.006
(0.003) (0.003) (0.003) (0.003)
SB, year 1 -0.018** -0.018** -0.005 -0.005
(0.007) (0.007) (0.007) (0.007)
SB, year 2 -0.011 -0.010 -0.014** -0.014*
(0.007) (0.007) (0.007) (0.007)
SB, year 3 -0.009 -0.008 -0.015** -0.016**
(0.009) (0.008) (0.007) (0.008)
SB, year 4+ -0.012 -0.012 -0.014** -0.017**
(0.007) (0.007) (0.006) (0.007)
SB after MC, year 1 0.001 -0.000 0.003 0.008
(0.007) (0.007) (0.007) (0.008)
SB after MC, year 2 -0.005 -0.006 -0.001 0.006
(0.007) (0.008) (0.007) (0.008)
SB after MC, year 3 -0.005 -0.005 -0.001 0.007
(0.008) (0.008) (0.007) (0.008)
SB after MC, year 4+ -0.002 -0.002 -0.003 0.005
(0.007) (0.008) (0.006) (0.008)
State-Cohort FE Yes Yes Yes Yes
State-Cohort Trends Yes Yes Yes Yes
State-Specific Controls No Yes No Yes
Notes: The dependent variable is the proportion of people in that state and graduation cohort who
received a high school diploma or a GED. Explanatory variables are interactions of test dummies
with year since implementation dummies. Standards-based and standards-based after MC
dummies are mutually exclusive. All regressions control for accountability; State-specific
controls include poverty and unemployment rates, average hourly wages. *significant at 10%;**
significant at 5%;*** significant at 1%.

30
Table 5: Effect of Testing on GED and High School Graduation, CPS Data
Dependent Variable GED Diploma
(1) (2) (1) (2)
Minimum competency 0.000 0.001 -0.002 -0.004
(0.002) (0.002) (0.004) (0.003)
Standards-based 0.004 0.003 -0.009** -0.011**
(0.002) (0.003) (0.004) (0.005)
Minimum competency (MC) -0.000 0.001 -0.002 -0.002
(0.002) (0.002) (0.004) (0.003)
Standards-based 0.006** 0.005 -0.010** -0.015**
(0.002) (0.004) (0.004) (0.007)
Standards-based after MC 0.001 0.001 -0.007 -0.006
(0.003) (0.004) (0.006) (0.007)
State and Cohort FE Yes Yes Yes Yes
State-Cohort Trends No Yes No Yes
Notes: GED and diploma rate analysis uses observations from 1998-2011 CPS data (therefore,
they do not add up to table 2 coefficients estimated using 1994-2011 data). GED and diploma
rates are not available as separate variables in the US Census. The dependent variable is the
proportion of people in that state and graduation cohort who received a GED or a traditional high
school diploma. Standards-based and standards-based after MC dummies are mutually exclusive.
All regressions control for accountability. Standard errors reported in column (1) are clustered by
state. * significant at 10%; ** significant at 5%; *** significant at 1%.
31
Table 6: Effects of Testing and Accountability on Institutionalization Rates
No Controls State FE,
Cohort FE
State-
Specific
Cohort
Trends
State-
Cohort
Controls
(1) (2) (3) (4)
Exit exam 0.005*** 0.001 0.001 0.001
(0.000) (0.001) (0.001) (0.001)
Accountability 0.003*** 0.001 0.000 -0.000
(0.001) (0.001) (0.001) (0.001)
F-test 73.33 2.283 0.835 0.696
Minimum competency 0.004*** 0.001 0.001 0.001
(0.001) (0.001) (0.001) (0.001)
Standards-based 0.008*** 0.002** 0.002 0.002
(0.001) (0.001) (0.001) (0.001)
Consequential 0.003*** 0.001 -0.000 -0.000
(0.001) (0.001) (0.001) (0.001)
Report card 0.003*** 0.001 0.000 0.000
(0.001) (0.001) (0.001) (0.001)
F-test 39.97 2.285 0.769 0.670
Minimum competency
(MC)
0.004*** 0.001 0.001 0.001
(0.001) (0.001) (0.001) (0.001)
Standards-based 0.008*** 0.003*** 0.003 0.003
(0.001) (0.001) (0.002) (0.002)
Standards-based after MC 0.007*** 0.002 0.001 0.001
(0.001) (0.002) (0.002) (0.002)
Consequential 0.003*** 0.001 -0.000 -0.000
(0.001) (0.001) (0.001) (0.001)
Report card 0.003*** 0.001 0.000 0.000
(0.001) (0.001) (0.001) (0.001)
F-test 32.46 2.997 0.846 0.727
Notes: The unit of observation is a state graduation year cohort and includes cohorts that turned
18 years old between 1977 and 1998 and were interviewed in the 1990 or the 2000 US Censuses.
Both the 1990 and the 2000 Census datasets are 5 percent samples. The dependent variable is the
proportion of people in that state and graduation cohort who are institutionalized. Robust
standard errors are reported in column (2). Reported F-tests are for explanatory variables
displayed in each panel. State-cohort controls include: poverty and unemployment rates, average
hourly wages. * significant at 10%; ** significant at 5%; *** significant at 1%.
32
Table 7: Effects of Testing on Non-Employment
No Wage No Controls State FE,
Cohort FE
State-Specific
Cohort Trends
State-Cohort
Controls
(1) (2) (3) (4)
CPS
Exit exam 0.023*** 0.008* -0.006** -0.010***
(0.003) (0.004) (0.003) (0.003)
Minimum competency 0.019*** 0.009** -0.006* -0.011***
(0.003) (0.004) (0.003) (0.004)
Standards-based 0.033*** 0.007 -0.004 -0.005
(0.006) (0.014) (0.007) (0.007)
Standards-based after
MC 0.001 0.004 -0.003 -0.009
(0.008) (0.015) (0.010) (0.010)
Census
Exit exam 0.010*** 0.008*** -0.002 -0.002
(0.002) (0.002) (0.002) (0.002)
Minimum competency 0.005* 0.007*** -0.004 -0.003
(0.003) (0.003) (0.002) (0.003)
Standards-based 0.017*** 0.007 0.006 0.003
(0.006) (0.005) (0.005) (0.005)
Standards-based after
MC
0.013 0.006 -0.011 -0.008
(0.009) (0.007) (0.007) (0.008)
Notes: The dependent variable is the proportion of individuals with no wage in each state/graduation year
cohort. An individual is flagged as having no wage if their wages are missing or zero (not employed). All
regressions control for accountability. Standard errors reported in column (2) are clustered by state. *
significant at 10%; ** significant at 5%; *** significant at 1%

33
Table 8: Estimated effects on the distribution of log wage residuals (conditional on working)
10-percentile 30-percentile 50-percentile 70-percentile 90-percentile
CPS Census CPS Census CPS Census CPS Census CPS Census
Exit exam -0.006 0.005 -0.000 0.007 -0.003 0.007 -0.007 0.013** -0.011 0.011
(0.006) (0.009) (0.005) (0.006) (0.005) (0.005) (0.006) (0.006) (0.007) (0.008)
Minimum competency -0.006 0.009 0.002 0.010 -0.001 0.012** -0.004 0.016** -0.006 0.012
(0.007) (0.010) (0.006) (0.007) (0.006) (0.006) (0.006) (0.006) (0.008) (0.008)
Standards-based -0.011 0.000 -0.005 -0.003 -0.011 -0.009 -0.009 0.003 -0.009 0.004
(0.014) (0.021) (0.012) (0.014) (0.012) (0.012) (0.013) (0.013) (0.017) (0.017)
Standards-based after MC -0.001 0.038 0.011 0.019 0.018 0.030 0.016 0.015 0.021 0.005
(0.020) (0.032) (0.018) (0.022) (0.017) (0.019) (0.019) (0.020) (0.025) 0.012
Notes: The dependent variable is the quantile of a residual obtained from an individual-level regression of wages on age and time dummies. The
quantiles are computed for each state-graduation year cohort. All regressions control for state and cohort fixed effects, state-specific cohort trends
and accountability. * significant at 10%; ** significant at 5%; *** significant at 1% .
34
APPENDIX TABLES
Table A1: State and Year in which Specific Types of Exit Exams were First Introduced
Year Introduced Minimum Competency Standards-Based End of Course
1979 NY
1980
1981 VA NY
1982 NC, MD, NV NY
1983 HI (1983-1999), TN, FL
1984
1985 AL, GA NJ
1986
1987 TX
1988
1989 MS
1990 NM SC
1991 LA
1992 TX
1993 FL
1994 OH
1995 GA
1996
1997
1998
1999 NV
2000 MN NY, IN
2001 AL
Notes: Data on exit exams are obtained from John Robert Warren’s website (http://www.hsee.umn.edu/). The
“year introduced” refers to the first graduating class affected by the new requirements
.

35
Table A2: State and Year in which Specific Types of Accountability Systems were First Introduced
Consequential Report Card
1987 ME
1988 LA
1989
1990
1991 IN IL, MD, MS
1992
1993 KY, WI
1994
1995 MD
1996 GA NJ
1997 CT, AL, MI, PA, TX AZ, DC
1998 NV, NC, OK MO, NH,
1999 CA, FL, VA OH
2000 DE,RI, WV, LA, NY
2001 AR, MA, OR, SD,TN, VT MN, WA,

36
Table A3: Effects of Testing and Accountability on High School Graduation/GED Rates
State of Birth Equals State of Residence, US Census
HS Graduation/GED No Controls State FE,
Cohort FE
State-Specific
Cohort Trends
State-Cohort
Controls
(1) (2) (3) (4)
Exit exam -0.032*** -0.000 -0.002 -0.001
(0.004) (0.004) (0.003) (0.003)
Accountability -0.020*** 0.001 -0.002 -0.002
(0.005) (0.004) (0.003) (0.003)
F-test 53.61 0.0210 0.565 0.177
Minimum competency -0.033*** 0.001 -0.002 -0.000
(0.004) (0.004) (0.003) (0.003)
Standards-based -0.029*** -0.004 -0.006 -0.003
(0.006) (0.005) (0.005) (0.006)
Consequential -0.018** -0.001 -0.002 -0.002
(0.008) (0.005) (0.004) (0.004)
Report card -0.023*** 0.003 -0.002 -0.002
(0.007) (0.005) (0.004) (0.004)
F-test 26.94 0.404 0.480 0.140
Minimum competency (MC) -0.033*** 0.001 -0.001 0.002
(0.004) (0.004) (0.003) (0.004)
Standards-based -0.029*** -0.003 -0.010 -0.010
(0.009) (0.007) (0.007) (0.008)
Standards-based after MC -0.029*** -0.006 -0.001 0.006
(0.009) (0.006) (0.007) (0.008)
Consequential -0.018** -0.001 -0.002 -0.002
(0.008) (0.005) (0.004) (0.004)
Report card -0.023*** 0.003 -0.002 -0.002
(0.007) (0.005) (0.004) (0.004)
F-test 24.95 0.163 0.671 0.588
Notes: The unit of observation is a state graduation year cohort and includes cohorts that turned
18 years old between 1977 and 1998 and were interviewed in the 1990 or the 2000 US Censuses.
Both the 1990 and the 2000 Census datasets are 5 percent samples. The data is subset to
individuals who are residing in the same state as their state of birth. The dependent variable is the
proportion of people in that state and graduation cohort who received a high school diploma or a
GED. The first panel combines all exit exams into one explanatory variable; the second panel
distinguishes between a minimum competency and standards-based exams; the third panel
further divides standards-based exams by whether or not they were preceded by a minimum
competency exam (standards-based and standards-based after MC are mutually exclusive).
Robust standard errors are reported in column (2). Reported F-tests are for explanatory variables
displayed in each panel. State-cohort controls include: poverty and unemployment rates, average
hourly wages. * significant at 10%; ** significant at 5%; *** significant at 1%.

37
Table A4: Effects of Testing on Graduation, Weighted Regressions
HS Graduation/GED (1) (2) (3) (4)
Mininimum Competency (MC) -0.015*** -0.002 -0.001 -0.000
(0.002) (0.002) (0.002) (0.003)
Standards-based -0.003 -0.007 -0.013*** -0.011**
(0.005) (0.005) (0.005) (0.005)
Standards-based after MC -0.018*** -
0.006*
-0.001 0.001
(0.003) (0.003) (0.004) (0.005)
Consequential -0.016*** 0.003 0.002 0.002
(0.003) (0.003) (0.002) (0.002)
Report card -0.010*** -0.000 -0.003 -0.002
(0.004) (0.003) (0.003) (0.003)
Notes: The dependent variable is the proportion of people in that state and graduation cohort
who received a high school diploma or a GED. Column (1) does not include any controls,
column (2) controls for state and cohort FE and report robust standard errors. Column (3)
controls for state-cohort time trends and column (4) adds state-specific controls. State-cohort
controls include: poverty and unemployment rates, average hourly wages. Regression weights
are inversely proportional to the variance of an observation. * significant at 10%; ** significant
at 5%; *** significant at 1%.

38
Table A5: Estimated effects on the log(hourly wage) distribution (conditional on working)
10-percentile 30-percentile 50-percentile 70-percentile 90-percentile
(1) (2) (1) (2) (1) (2) (1) (2) (1) (2)
Exit exam 0.007 -0.004 0.007 -0.002 0.017 -0.001 0.017 -0.007 0.005 -0.007 (0.010) (0.006) (0.012) (0.005) (0.012) (0.005) (0.014) (0.006) (0.014) (0.008)
Minimum 0.006 -0.003 0.006 -0.001 0.015 0.000 0.012 -0.007 0.006 -0.005 competency (0.009) (0.006) (0.012) (0.006) (0.011) (0.005) (0.013) (0.006) (0.013) (0.008) Standards 0.006 -0.008 0.009 -0.000 0.019 -0.004 0.028 0.003 0.004 -0.000 based (0.017) (0.009) (0.018) (0.009) (0.020) (0.009) (0.021) (0.009) (0.025) (0.012)
Notes: The data used to produce this table comes from the CPS MORG files. Each cell is a regression model with two specifications. The dependent variable is a wage quantile for state s and cohort c obtained from a quantile regression, unit of observation is a state-graduation year cohort. Model 1 includes state and cohort dummies. Model 2 also includes state-specific cohort trends. Standard errors reported in column (2) are clustered by state. All regressions control for accountability.* significant at 10%; ** significant at 5%; *** significant at 1%.