Embed Size (px)
Citation preview

Tp
Pa
b
c
a
ARRAA
KGZAHTN
1
smcadme[pshiam
h0
Thermochimica Acta 635 (2016) 41–58
Contents lists available at ScienceDirect
Thermochimica Acta
j ourna l h om epage: www.elsev ier .com/ locate / tca
he effect of heat treatment on the mechanical and structuralroperties of one-part geopolymer-zeolite composites
. Sturm a,∗, G.J.G. Gluth a, S. Simon b, H.J.H. Brouwers c, H.-C. Kühne a
Division 7.4 Technology of Construction Materials, Bundesanstalt für Materialforschung und -prüfung (BAM), Berlin, GermanyDivision 7.1 Building Materials, Bundesanstalt für Materialforschung und -prüfung (BAM), Berlin, GermanyDepartment of the Built Environment, Eindhoven University of Technology, Eindhoven, The Netherlands
r t i c l e i n f o
rticle history:eceived 26 October 2015eceived in revised form 12 February 2016ccepted 21 April 2016vailable online 23 April 2016
eywords:eopolymers
a b s t r a c t
This contribution presents the results of structural and compressive strength investigations on cured andhigh-temperature treated silica-based one-part geopolymer-zeolite composites. The specimens weresynthesized from two different silica sources, sodium aluminate and water. The phase content as well asthe compressive strength of the cured composites varied depending on the starting mix-design and thesilica feedstock. Besides geopolymeric gel, A-type zeolites and hydrosodalites were the major reactionproducts. One of the silica feedstocks yielded significantly higher compressive strength (19 MPa), whilethe other one appears to cause less variation in phase content. Strength testing indicated an improvement
◦ ◦ ◦
eoliteslkali-activationigh-temperature treatmenthermal behaviorephelineon heating up to 200–400 C (28 MPa) followed by a moderate decrease up to 700 C. Above 700 C the sys-tems underwent new phase formation and shrinkage (volume decrease) deformations. After exposureat 1000 ◦C the different mixes consisted of a mix of several stuffed silica phases, almost pure hexago-nal nepheline or amorphous phase. Depending on the mix-design, the onset temperature of the hightemperature phase transformations varied.
© 2016 Elsevier B.V. All rights reserved.
. Introduction
Geopolymers are aluminosiliceous compounds whose networktructure closely resembles those of zeolites [1–4]. The geopoly-eric gel is amorphous to X-rays, but in many cases the material
ontains crystalline zeolites. The geopolymeric gel can be regardeds metastable amorphous zeolites that were unable to crystallizeue to deficiency in water in the reaction system [5–7]. Geopoly-ers can form the basis of concretes with much lower related CO2
missions than concretes based on conventional Portland cement8]. In addition to this environmental benefit, geopolymers, whenroperly designed, can possess beneficial engineering properties,uch as high chemical durability [9,10] and good resistance againstigh temperatures [11–15]. The latter makes them particularly
nteresting for fire-resistant coatings and refractories [16–19], and
lso for production of ceramics [20–22]. However, some geopoly-er systems exhibit significant shrinkage during dehydration due∗ Corresponding author.E-mail address: [email protected] (P. Sturm).
ttp://dx.doi.org/10.1016/j.tca.2016.04.015040-6031/© 2016 Elsevier B.V. All rights reserved.
to the release of “structural” water (e.g. Ref. [23]), which is a prob-lem in construction and high-temperature applications.
Recent approaches have focused on so called “one-part”geopolymer mixes [24–29]. The synthesis route for these formula-tions is similar to the procedure for the hydration of conventionalPortland cement-based binders. For example, one-part geopoly-mers can be produced from mixed silica and alumina sourcesincorporating the alkalis in water-soluble form, thus, just water hasto be added. There is no necessity to handle highly alkaline solu-tions, because the solution forms directly in the reaction systemby dissolution of the solid starting material(s). This can provide ahigher social and economic acceptance compared to conventionalgeopolymers [24,30].
Compared to conventional “two-part” geopolymers (i.e.geopolymers from a solid aluminosilicate feedstock and a highlyalkaline solution), much less is known about the thermal propertiesof one-part geopolymers, and experience with the former cannotbe simply transferred to the new systems. Therefore, the present
contribution investigates one-part geopolymers-zeolite compos-ites in terms of compressive strength performance and phasedevelopment during elevated to high temperature treatment.
42 P. Sturm et al. / Thermochimica
Table 1Chemical composition of the feedstocks.
Component MS (wt.%) CR (wt.%) NaAlO2 (wt.%)
SiO2 95.16 84.23 0.61Al2O3 0.17 4.18 60.85Fe2O3 0.04 0.43 0.06TiO2 <0.01 0.06 0.00CaO 1.71 2.97 0.26MgO 0.28 0.17 0.02Na2O 0.19 0.22 36.07K2O 0.65 0.03 0.03SO3 0.25 0.16 0.16Cl− n.d. 1.36 n.d.L
n
2
2
satteX8dioXmCt#nacf
o1saTid
2
s(nuPason
vInD
OI 1.12 5.08 1.73
.d.: not determined; LOI: loss on ignition.
. Experimental
.1. Starting materials
One-part mixes were synthesized from two different silicas andodium aluminate. A commercial microsilica (referred to as MS) andn industrial residue from the chlorosilane production (referredo as CR) were used as silica sources. All feedstocks were charac-erized by chemical analysis (inductively coupled plasma opticalmission spectrometry (ICP-OES) after microwave digestion) and-ray diffraction (XRD). MS contained 95.2 wt.% SiO2, CR contained4.2 wt.% SiO2. The medians of the particle size distributions were50 = 0.19 �m for silica MS and d50 = 6.83 �m for silica CR. SEM
nvestigations indicated an average size of the primary particlesf about 100–200 nm (MS) and 50–200 nm (CR) [26], respectively.RD showed only an “amorphous hump” for the MS feedstock andinor amounts of silicon carbide (PDF # 01-089-3167) (Fig. 1).
R diffractograms indicate, besides amorphous phase, minor crys-alline impurities calcite (PDF # 01-086-0174) and quartz (PDF
00-046-1045). In contrast to calcite, the quartz impurity wasot observed in all samples, and the included quartz was foundt amounts only slightly above the detection limit. Results of thehemical analysis are presented in Table 1. The loss on ignition (LOI)or CR is higher than for MS; this is due to the incorporated calcite.
The sodium aluminate had an almost stoichiometric Na/Al ratiof 0.98 mol/mol. Besides dry sodium aluminate (PDF # 00-033-200), XRD (Fig. 1) also indicated very small amounts of hydratedodium aluminate (PDF # 01-083-0315) and, because of the carbon-tion tendency of the material, some natrite (PDF # 01-072-0628).he loss on ignition (LOI) of 1.73 wt.% (including ∼0.2 wt.% CO2) is
n line with the identified low amounts of hydrated phase in theiffractogram.
.2. Sample preparation
For the synthesis of the one-part mixes, the solid feed-tocks were mixed to yield specific silica/alumina ratiosSiO2/Al2O3 mol/mol). After the addition of water at a nomi-al water/binder-ratio (w/b) by mass of 0.50, pastes were mixedsing a contact free planetary centrifugal mixer (2000 rpm; 2 min).astes were then cast into 20 mm × 20 mm × 20 mm cube mouldsnd compacted by tapping the moulds on the lab bench. Sub-equently the samples were cured at 80 ◦C and 80% r. H. in anven with climate control for three days. Table 2 presents sampleomenclature and mix designs for the binder pastes.
Some pastes were produced in duplicate to measure the pH
alue in the paste within the first 30 min after the addition of water.n addition, pH measurements were done on various sodium alumi-ate solutions. All Measurements were conducted using a METTLERELTA 350 device with Metrom pH-electrode. Calibration of theActa 635 (2016) 41–58
electrode was done with standard buffer solutions of pH 7 and pH10.
Cube specimens were used for compressive strength tests inthe initial (as cured) state and for the residual strength tests afterfurther temperature treatment. After one day of curing sampleswere removed from the moulds and cured for further two days at80 ◦C and 80% r. H. After the complete curing period of 3 days theywere stored 1–7 days at 23 ◦C and 50% r. H in a climate chamber untilrequired for testing or heating. After heating and strength testingfracture pieces for the structural investigations were stored in adesiccator over dried silica gel at ambient temperature. Grindingwas done manually with mortar and pestle (agate) to provide apreparation as gently as possible, in particular for samples duringdehydration.
2.3. Thermogravimetric analyses and thermal treatment
Thermogravimetric (TG) investigations were conducted with aNetzsch device (STA 449C Jupiter) in N2 atmosphere at a heat-ing rate of 5 K min−1, treating ∼20 mg sample mass. The thermaltreatment of the cube specimens was realized in a muffle furnace(Carbolite CWF 12/5; Tmax = 1200 ◦C). The samples were transferredto the furnace at ambient temperature and heated to the targettemperature using a ramp program (1 K min−1) to avoid excessivetemperature gradients in the specimens. The desired temperaturewas held for three hours. Afterwards the samples were allowedto cool down naturally to ambient temperatures in the furnacefollowed by an immediate testing of the compressive strength.
2.4. Structural investigations
XRD measurements were done with a Rigaku Ultima IV deviceusing Cu K� radiation (� = 1.5419 Å), Bragg-Brentano geometry, a10 mm divergence slit, sampling steps of 0.01◦ 2� and a samplingspeed of 0.2◦ 2� min−1 (1◦ 2� min−1 for the sodium aluminate) inthe scanning range 3–63◦ 2�.
Attenuated total reflection Fourier transform infrared spec-troscopy (ATR FT-IR) measurements were conducted using aBruker Tensor 27 device with a diamond ATR module (measur-ing range: 4000–400 cm−1; resolution 4 cm−1; scans: 16; detector:RT-DLaTGS).
SEM investigations were performed using a Carl Zeiss EVO MA10device with a secondary electron (SE) detector and an accelerat-ing voltage of 7–10 kV. Samples were sputtered with gold beforemeasurements.
2.5. Compressive strength testing
The compressive strength performance testing was conductedwith a ToniPRAX device on the 20 mm × 20 mm × 20 mm cubes ata loading rate of 240 N/s (equivalent to 0.6 MPa/s for the investi-gated samples). Strength testing was also done on cube samplesheated to temperatures between 100 ◦C and 750 ◦C (MS mixes) and800 ◦C (CR mixes). For each cured and thermal treated one-part mixthree experiments were conducted and the means of the results arepresented.
2.6. Dilatometry
The dilatometry measurements were conducted with a vertical
dilatometry device (Bähr TMA 801) between ambient temperatureand 900 ◦C. Samples were prepared with a high precision diamondsaw blade to form square tablets of 5 mm height and ∼5 mm sidelengths. Samples were heated at a rate of 5 K min−1 in an air atmo-
P. Sturm et al. / Thermochimica Acta 635 (2016) 41–58 43
Fig. 1. Diffraction patterns of the feedstocks (SA = sodium aluminate; SAH = sodium aluminate hydrate; N = natrite; q = quartz; C = calcite, SiC = silicon carbide). The sodiumaluminate sample was measured with a speed of 1◦ 2� per minute because of its hygroscopic character.
Table 2Mix-designs of the one-part composites.
Sample series m(Na2O) (wt.%) m(Al2O3) (wt.%) m(SiO2) (wt.%) m(H2O) (wt.%) Na2O/Al2O3 (mol/mol) SiO2/Al2O3 (mol/mol) H2O/Al2O3 [mol/mol]
CR 2 12.70 22.63 26.88 34.15 0.92 2.02 8.54CR 3.5 9.13 16.99 35.19 34.09 0.88 3.51 11.35CR 6 5.98 12.01 42.55 34.03 0.82 6.01 16.04
24
20
17
sh
3
3
acAcopamptsip1nM
MS 2 13.75 23.16 27.53 34.MS 3.5 10.42 17.52 36.31 34.MS 6 7.43 12.46 44.19 34.
phere. The loading force was 0.05 N. Relative changes of sampleseight were recorded during heating.
. Results and discussion
.1. pH measurements
Besides the kind of silica feedstock, the behavior of the sodiumluminate plays an important role for the evolution of the phaseontent of the one-part mixes. It is known that in the Na2O-l2O3-H2O system at temperatures up to 150 ◦C the equilibriumoncentration of Na is always higher than that of Al (also when Cl−
r CO32− impurities are present) [31], i.e. in NaAlO2 solutions the
recipitation of Al(OH)3 is expected. This is confirmed by our ownuxiliary experiments, in which it was found that a sodium alu-inate suspension (25 g sodium aluminate in 50 g water) rapidly
recipitates a white gel. XRD analyses (results not shown) revealedhat after several days aging at 80 ◦C the gel had crystallized to gibb-ite (PDF # 00-033-0018); no sodium-containing phase was foundn the precipitation product. The pH of the sodium aluminate sus-
ension was determined 10 min after the addition of water to be4.4. A sodium aluminate suspension with 28.48 g sodium alumi-ate suspended in 25.00 g water, i.e. simulating the conditions inS 2 and CR 2 (cf. Table 2), had pH = 14.7 after 8 min.0.98 2.02 8.370.98 3.52 11.050.98 6.02 15.51
pH measurements were also conducted on the fresh pastes: TheMS 2 paste had pH = 14.5 10 min after adding water, and pH = 14.7after 30 min. CR 2 pastes had pH = 14.7 after 10 min. On the con-trary, the fresh high-silica (SiO2/Al2O3 = 6) pastes had pH values ofonly 14.2 (MS 6) and pH = 13.4 (CR 6) after 10 min. These resultswill be further discussed below in connection with phase assem-blage of the cured materials.
3.2. Structural properties of the cured specimens
XRD investigations (Fig. 2) showed that in addition to an amor-phous gel phase significant amounts of crystalline phases formed inthe reaction products. Thus, the products obtained after curing aremore properly termed geopolymer-zeolite composites, rather thangeopolymers. Depending on the silica feedstock and the mix-designof the starting mix, differences in the phase content of the hardenedsamples were observed, as is detailed in the following paragraphs.In the discussion that follows it is assumed that a higher relativeintensity of a particular phase in a diffractogram corresponds toa higher fraction of that phase in the investigated material, com-
pared to a material with lower intensities of that phase. Though noquantitative analysis (e.g. Rietveld analysis) of the diffractogramshas been undertaken, it is assumed that this approach allows atleast a semi-quantitative interpretation of the results, particularly
44 P. Sturm et al. / Thermochimica Acta 635 (2016) 41–58
F ays ofE
ss
1ihivbi(hismiuawc
ig. 2. Diffraction patterns of the geopolymer-zeolite composites systems after 3 dMT; C = calcite; q = quartz).
ince all the observed major crystalline phases have a cubic crystaltructure, and thus preferred orientation effects are absent.
The hump, representing amorphous phase, is located at ca.5◦–35◦ 2� in the diffractograms (Fig. 2). Compared to the sil-
ca feedstock (Fig. 1) the hump is broadened and/or shifted toigher 2�. For high silica mixes (SiO2/Al2O3 = 6 mol/mol) the max-
mum of the hump was located at ∼22◦ 2�. This was the samealue as for the silica feedstocks (Fig. 1). However, the hump isroadened and in addition to the first maximum, a second max-
mum at ∼30◦ 2� could be detected. For the low silica mixesSiO2/Al2O3 = 2 mol/mol) the hump was shifted to higher 2� andad its maximum at ∼30◦ 2�. The samples with intermediate sil-
ca/alumina ratio (SiO2/Al2O3 = 3.5 mol/mol) exhibited a behavioromewhere in between, i.e. the hump was shifted slightly with aaximum in the range 22–30◦ 2�. In a previous investigation [28]
t was shown that the low-silica sample (MS 2) contains no resid-al silica feedstock after curing, thus the hump with the maximumt ∼30◦ 2� can be assigned to the geopolymeric gel, in accordance
ith literature data [32]. From these observations it can be con-luded that the hump in the mixes with higher SiO2/Al2O3 ratios
curing (A = zeolite A; HS = hydrosodalite, Ch = chabazite; F = faujasite; EMT = zeolite
is caused by contributions from geopolymeric gel and remainingsilica material.
For microsilica (MS)-based one-part mixes (MS 2, MS 3.5, MS 6)dominant crystalline phases were hydrated zeolite A (PDF # 00-039-0222) and non-basic hydrosodalite of intermediate watercontent, Na6(AlSiO4)6·4H2O (PDF # 00-042-0216). This hydroso-dalite has been found previously in geopolymer systems with lowsilica starting contents [25,28,33]. Depending on the chemical com-position of the starting system the two primary crystalline reactionproducts varied in their quantities. With decreasing silica contentthe relative amount of hydrosodalite versus zeolite A increased, ashas been reported previously [28]. Both phases are presented in allMS-based specimens and, except in the low-silica samples MS 2(SiO2/Al2O3 = 2 mol/mol), zeolite A is always the main phase of thereaction products.
Medium-silica (MS 3.5), and particularly the low-silica samples(MS 2) may include higher hydrated forms of hydrosodalite, e.g.Na (AlSiO ) ·8H O (PDF # 00-040-0102), and/or basic hydroso-
6 4 6 2dalite (Na8(AlSiO4)6OH2·xH2O) (PDF # 00-040-0101; PDF #00-041-0009), which have quite similar peak positions, noticeableas asymmetric peak shapes of the main peaks (cf. Section 3.3). Fur-
himica
tipnasah
daaiapz(pf
c(roimCCpotos
li#(HitstoRa1ztpd2d
3
czT(aadas
P. Sturm et al. / Thermoc
hermore, because of the fairly broad shape and low maximumntensities of the diffraction pattern of MS 2, especially of the maineaks of hydrosodalite, it can be assumed that basically heteroge-eous sodalite structures with rather small crystallite sizes [33–35]ppear in the reaction system. In addition, the MS 2 mix containedmall amounts of chabazite, NaAlSi2O6·3H2O (PDF # 00-019-1178),
zeolite with increased silicon content compared to zeolite A andydrosodalite.
For CR-based mixes (CR 2, CR 3.5, CR 6) zeolite A was always theominant crystalline phase. Besides zeolite A, no further crystallineluminosilicate phase could be observed by XRD in intermediatend high-silica specimens (CR 3.5, CR 6). Only the low-silica spec-mens (CR 2) contained small amounts of hydrosodalite (Fig. 2). Inddition, faujasite (PDF # 00-038-0239) occurred in the latter sam-les; a shoulder at the main peak indicates also the presence ofeolite EMT (PDF # 00-046-0566). These two zeolites tend to formdisordered) intergrowths [36,37]. Besides crystalline and amor-hous reaction products also remaining impurities (calcite, quartz)
rom the silica feedstock (CR) were observed (Fig. 2).The differences in the phase content of the cured composites
an be partly explained by the differences in pH of the fresh pastesSection 3.1): The higher pH in the MS 2 mix is assumed to be theeason for direct formation of hydrosodalite or early transformationf zeolite A into hydrosodalite structures (cf. Ref. [38]). However,
t is not clear at present why hydrosodalite formation is muchore pronounced in the MS-based composites, compared to the
R-based ones. The higher pH in the low-silica samples (MS 2 andR 2) will also cause faster dissolution of the silica in the hardeningastes. This is possibly the reason for the formation of chabazite,r faujasite and zeolite EMT in the MS 2 and CR 2 samples, respec-ively. These zeolites have an anionic framework with silicon excessver aluminium (Si:Al > 1), which implies a faster dissolution of theilica, and are only present in the low-silica mixes.
The relative intensities of the three peaks of zeolite A atowest diffraction angles (7.17◦, 10.16◦ and 12.47◦ 2�) var-ed in the samples (Fig. 2). For reference zeolite A (e.g. PDF
00-039-0222) their intensities are decreasing from the first7.17◦ 2�) over the second (10.16◦ 2�) to the third (12.47◦ 2�).owever, depending on the mix-design of the composites the
ntensity of the third of these peaks was increased, in par-icular for the low-silica mixes. This is most likely related tomall variations of stoichiometry (Si:Al ratio) and water con-ent of the A-type zeolites framework: In the diffractogramsf conventionally synthesized zeolite A samples, presented byadulovic et al. [39], comparable changes in peak intensitiesre observed on going from 1.05Na2O·1.06Al2O3·2.00SiO2 to.05Na2O·1.00Al2O3·2.05SiO2, though the cell parameters of theeolites did not differ significantly. In addition, calculated XRD pat-erns of hydrated and dehydrated zeolite A [37] reveal a moreronounced decrease of the peak height of the third peak on dehy-ration, compared to the height of the other two peaks at lower�. Comparable tendencies were observed during heating (dehy-ration) of the considered composite samples (Section 3.4).
.3. Thermogravimetric analyses
Since zeolite A is the dominating crystalline phase in most of theonsidered samples, TG analysis was also performed on a referenceeolite A sample (Henkel AG & Co. KGaA, Düsseldorf, Germany).he average crystallite size of the reference zeolite A was ∼1 �mas observed with SEM; results not shown), and it contained only
marginal amount of hydrosodalite as impurity (checked by XRD
s well as 29Si and 27Al MAS NMR; results not shown). Its dehy-ration behavior was compared to those of the cured composites,nd selected temperature points were determined for additionaltructural and mechanical investigations (Fig. 3). Mass loss for both,Acta 635 (2016) 41–58 45
the quasi-pure zeolite A and the geopolymer-zeolite composites,ran quite similar with different absolute amounts. At 400 ◦C themajor part of the dehydration was completed. All samples con-tained small amounts surface water noticeable as mass loss below100 ◦C (Table 3, Fig. 3).
Zeolite A exhibited a stepwise dehydration behavior with a steeploss up to ∼200 ◦C and a second step with lower slope between200 ◦C and 400 ◦C. The geopolymer-zeolite composites exhibited arather continuous behavior with the TG curve flattening due to aslower water release with increasing temperature. However, theMS 2 specimen exhibited a multiple-step mass loss at higher tem-peratures, most likely due to several incorporated hydrosodalitestructures (see below).
For the composites the most dominant mass loss of 6.2–8.4 wt.%occurred between 100 ◦C and 200 ◦C (for comparison: zeolite A:12.3 wt.%). A further significant mass loss of 2.5–5.3 wt.% (zeoliteA: 3.7 wt.%) followed between 200 ◦C and 400 ◦C. This dehydrationrange correlates quite well with reported TG data for zeolite A andhydrosodalites [34,40–42].
In general, in each class of geopolymer-zeolite composites (i.e.CR-based or MS-based), the final mass loss at 1200 ◦C decreasedwith increasing SiO2/Al2O3 ratio. This is related to the fact that onlyin the low-silica samples (SiO2/Al2O3 = 2) the silica feedstocks reactvirtually completely, while in the mixes with higher SiO2/Al2O3ratios the silica reacts only partly, the fraction of remaining silicabeing larger at higher SiO2/Al2O3 ratios [28]. This means that athigher SiO2/Al2O3 ratios the fraction of porous reaction products(zeolites and geopolymeric gel) in the cured specimens is generallylower, and correspondingly the total water content is lower.
Deviating from this general trend, the MS 2 sample exhibited apeculiar behavior in that its mass loss up to ca. 900 ◦C was lowerthan the mass loss of MS 3.5 (and virtually the same at 1200 ◦C)and that distinct steps can be distinguished in the TG curve inthe range 400–900 ◦C. Felsche and Luger [40] reported a double-step dehydration (two overlapping DTG peaks) of fully hydratednon-basic hydrosodalite (Na6(AlSiO4)6·8H2O) in the range of ca.60–340 ◦C and a multiple-step dehydration and dehydroxylationof presumed basic hydrosodalite (“Na8(AlSiO4)6OH2·4H2O”) in therange ca. 80–810 ◦C. In a subsequent study [42] the result forNa6(AlSiO4)6·8H2O was confirmed (double-step dehydration inthe range 100–350 ◦C), but it was found that basic hydroso-dalite, Na8(AlSiO4)6OH2·2H2O, exhibits a double-step dehydration(two overlapping DTG peaks) in the range ca. 530–700 ◦C. Thestudy furthermore proved that basic hydrosodalites with morethan 2 mol hydration water (Na8(AlSiO4)6OH2·2H2O) are actu-ally a mix of basic and non-basic hydrosodalites. The TG curveof MS 2 is comparable to the curve presented in Ref. [40] for“Na8(AlSiO4)6OH2·4H2O”, which was found later to be a mix of basicand non-basic hydrosodalites [42]. Taking also into account the XRDpeak shapes (see Section 3.2), it is tentatively concluded that thissample contained, besides non-basic hydrosodalite of intermedi-ate water content, also smaller amounts of basic hydrosodalite andpossibly non-basic hydrosodalites of different water content.
All CR-based samples exhibited a distinct step around850–1000 ◦C. This step is related to the impurities in the CR-based systems: these contained calcite from the silica feedstock(Figs. 1 and 2), which decomposes in that temperature range.
3.4. Structural changes during thermal treatment
XRD experiments were conducted to identify structure changesand phase transformations during the dehydration (main part up
to 400 ◦C), up to the “breakdown” of the structure between 650 ◦Cand 750 ◦C and the new phase formation up to 1000 ◦C. Since thesamples were allowed to cool down to ambient in the furnacebefore testing, rehydration of zeolites as well as retrograde phase
46 P. Sturm et al. / Thermochimica Acta 635 (2016) 41–58
Fig. 3. TG curves of the composites after 3 days of curing and zeolite A. Squares represent temperatures chosen for XRD investigations and residual compressive strengthtesting.
Table 3Residual masses of the samples during TG analysis.
mr (100 ◦C) mr (200 ◦C) mr (400 ◦C) mr (650 ◦C) mr (700 ◦C) mr (750 ◦C) mr (1000 ◦C)
Sample (wt.%) (wt.%) (wt.%) (wt.%) (wt.%) (wt.%) (wt.%)
CR 2 97.2 88.9 84.8 82.9 82.8 82.7 81.7CR 3.5 98.5 90.1 84.8 83.7 83.5 83.5 83.0CR 6 97.6 91.1 88.5 87.5 87.5 87.4 86.5MS 2 96.7 90.5 87.2 85.7 85.5 85.3 83.9
faow(fc
sa1sai
Oipbf
0
MS 3.5 96.1 88.7 85.5
MS 6 97.3 90.8 88.3
zeolite A 96.3 84.0 80.3
ormation cannot be fully excluded. Up to specific temperatures,t least 650 ◦C, basically no major phase transformations could bebserved. Above this temperature completely new structures occurith significant differences between the different mix-designs
Figs. 4–11). Equally composed mixes (i.e. mixes produced from dif-erent silica feedstocks but with identical SiO2/Al2O3 ratio) showedomparable behavior.
Fig. 4 presents the XRD patterns of the mix CR 2 after heating topecific temperatures up to 1000 ◦C. Up to 400 ◦C, except the dis-ppearance of faujasite and a decrease of the third zeolite A peak at2.47◦ 2�, no significant changes could be observed by XRD. Othermall changes of the absolute intensities in the range of moder-te temperature treatment are not regarded significant due to thenfluence of the preparation with mortar and pestle.
At 650 ◦C first significant structure transformations occurred.nly zeolite A remained, all peak intensities decreased signif-
cantly and the FWHMs (full widths at half maximum) of theeaks increased, probably attributable to commencing of structural
reakdown. A new peak occurred (21.4◦ 2�), indicating the initialormation of a new phase.At 700 ◦C this “metaphase” and nepheline, NaAlSiO4 (PDF #0-035-0424), were the new main phases. Most peaks of the
84.7 84.5 84.4 83.987.7 87.6 87.5 87.279.8 79.8 79.7 79.5
pattern can be matched with the nepheline reference, but thereflection of maximum intensity located at 21.4◦ 2� was exagger-ated. At 700 ◦C intensities were increased and FWHMs decreasedcompared to 650 ◦C as a result of further crystallization. Severalstudies [21,39,43] found low carnegieite, NaAlSiO4, as a metaphaseduring the transformation of geopolymers and A-type zeolites tostuffed tridymite structures (nepheline), and reported the posi-tion of the diagnostic main peak to be in the same 2�-range as theobserved exaggerated peak at 21.4◦ 2�. However, with the availablecarnegieite reference (PDF # 96-101-0954) this peak could not bematched satisfyingly. Since the composition of stuffed silica struc-tures is variable [44,45], a carnegieite-type phase of intermediarycomposition is possible. In addition to the aforementioned phases,sodalite sensu stricto, Na8(SiAlO4)6Cl2, (PDF # 00-037-0476) wasobserved in the heated CR 2 samples (chloride provided by the sil-ica feedstock CR). Only residues of zeolite A remained in the sample.
At 750 ◦C again a further phase transition was apparent.Nepheline was clearly the new main phase, and the exaggeration
of the main peak at 21.4◦ 2� decreased. Sodalite, which is known tocoexist with nepheline [46], remained in the system, but no zeoliteA. At 800 ◦C the system was almost equal to that at 750 ◦C, only the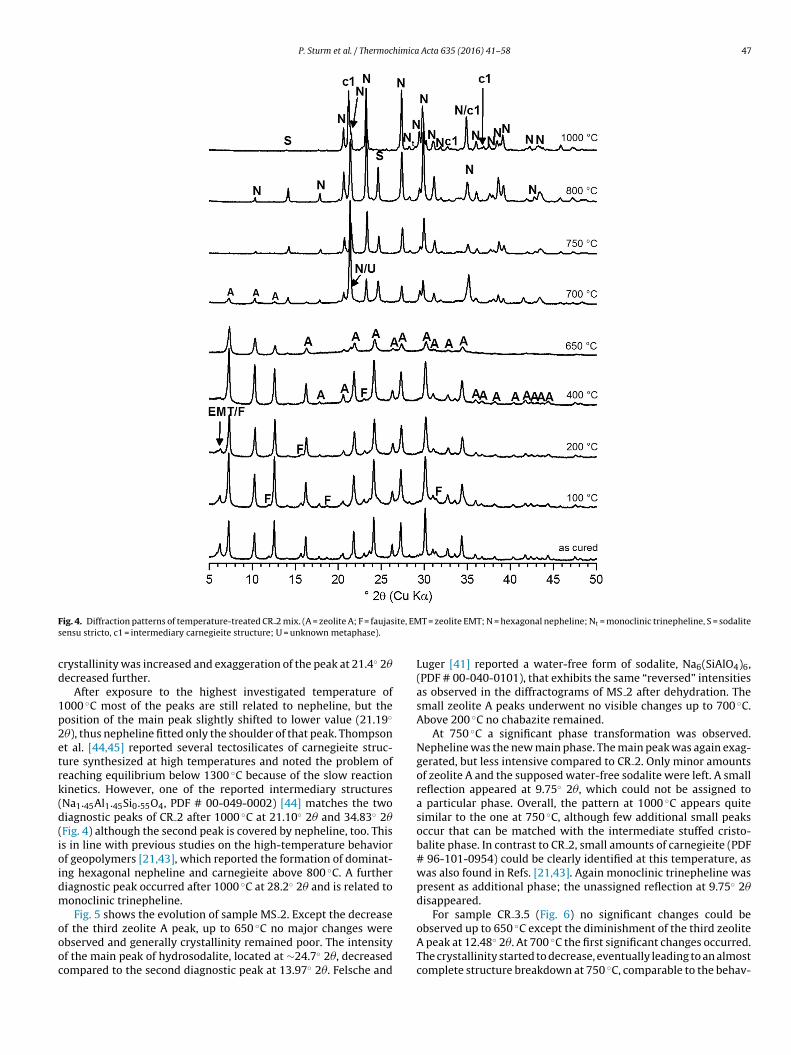
P. Sturm et al. / Thermochimica Acta 635 (2016) 41–58 47
F ite, EMs
cd
1p2etrk(d(ioidm
oooc
ig. 4. Diffraction patterns of temperature-treated CR 2 mix. (A = zeolite A; F = faujasensu stricto, c1 = intermediary carnegieite structure; U = unknown metaphase).
rystallinity was increased and exaggeration of the peak at 21.4◦ 2�ecreased further.
After exposure to the highest investigated temperature of000 ◦C most of the peaks are still related to nepheline, but theosition of the main peak slightly shifted to lower value (21.19◦
�), thus nepheline fitted only the shoulder of that peak. Thompsont al. [44,45] reported several tectosilicates of carnegieite struc-ure synthesized at high temperatures and noted the problem ofeaching equilibrium below 1300 ◦C because of the slow reactioninetics. However, one of the reported intermediary structuresNa1.45Al1.45Si0.55O4, PDF # 00-049-0002) [44] matches the twoiagnostic peaks of CR 2 after 1000 ◦C at 21.10◦ 2� and 34.83◦ 2�Fig. 4) although the second peak is covered by nepheline, too. Thiss in line with previous studies on the high-temperature behaviorf geopolymers [21,43], which reported the formation of dominat-
ng hexagonal nepheline and carnegieite above 800 ◦C. A furtheriagnostic peak occurred after 1000 ◦C at 28.2◦ 2� and is related toonoclinic trinepheline.
Fig. 5 shows the evolution of sample MS 2. Except the decreasef the third zeolite A peak, up to 650 ◦C no major changes were
bserved and generally crystallinity remained poor. The intensityf the main peak of hydrosodalite, located at ∼24.7◦ 2�, decreasedompared to the second diagnostic peak at 13.97◦ 2�. Felsche andT = zeolite EMT; N = hexagonal nepheline; Nt = monoclinic trinepheline, S = sodalite
Luger [41] reported a water-free form of sodalite, Na6(SiAlO4)6,(PDF # 00-040-0101), that exhibits the same “reversed” intensitiesas observed in the diffractograms of MS 2 after dehydration. Thesmall zeolite A peaks underwent no visible changes up to 700 ◦C.Above 200 ◦C no chabazite remained.
At 750 ◦C a significant phase transformation was observed.Nepheline was the new main phase. The main peak was again exag-gerated, but less intensive compared to CR 2. Only minor amountsof zeolite A and the supposed water-free sodalite were left. A smallreflection appeared at 9.75◦ 2�, which could not be assigned toa particular phase. Overall, the pattern at 1000 ◦C appears quitesimilar to the one at 750 ◦C, although few additional small peaksoccur that can be matched with the intermediate stuffed cristo-balite phase. In contrast to CR 2, small amounts of carnegieite (PDF# 96-101-0954) could be clearly identified at this temperature, aswas also found in Refs. [21,43]. Again monoclinic trinepheline waspresent as additional phase; the unassigned reflection at 9.75◦ 2�disappeared.
For sample CR 3.5 (Fig. 6) no significant changes could beobserved up to 650 ◦C except the diminishment of the third zeolite
A peak at 12.48◦ 2�. At 700 ◦C the first significant changes occurred.The crystallinity started to decrease, eventually leading to an almostcomplete structure breakdown at 750 ◦C, comparable to the behav-
48 P. Sturm et al. / Thermochimica Acta 635 (2016) 41–58
F HS =
c
i[ittaca
vtt7aCon
cA
ig. 5. Diffraction patterns of temperature-treated MS 2 mix. (A = zeolite A,
1 = intermediary carnegieite structure; Cn = carnegieite).
or of almost stoichiometric zeolite A, but at lower temperature39]. Only residues of zeolite A remained as well as a very small notdentified peak at the position of faujasite’s main peak; the rest ofhe diffraction pattern displays just an amorphous hump. At 800 ◦Che mix recrystallized with hexagonal nepheline as the main phasend minor amounts of sodalite sensu stricto, due to the incorporatedhloride. At 1000 ◦C XRD indicates almost pure nepheline phase anddditionally some residues of the previously introduced sodalite.
Fig. 7 shows the XRD results for MS 3.5. As for the CR 3.5 mix,irtually no changes occurred with the main phase zeolite A upo 650 ◦C, except a noticeable maximum of crystallinity at thatemperature and the diminishment of the peak at 12.48◦ 2�. At00 ◦C a breakdown of the initial phases commenced, and at 750 ◦Clmost the whole sample appeared X-ray amorphous. Compared toR 3.5, more zeolite A residues remained as well as little amountsf sodalite. After exposure to 1000 ◦C XRD indicates only hexagonalepheline.
Fig. 8 shows the XRD patterns of the sample CR 6. Almost nohanges occurred up to a temperature of 650 ◦C. At 700 ◦C zeolite
started to collapse. At 750 ◦C a large fraction of zeolite A had
hydrosodalite, N = nepheline; Nt = monoclinic trinepheline; S2 = dehydrated HS;
been transformed into amorphous phase. Besides the remainingzeolite, like for CR 3.5 again a single reflection, matching the mainpeak of faujasite structures occurred in the low 2�-range at 6.25◦
2�. After treatment at 800 ◦C the sample was almost completelyamorphous; only three residual zeolite A peaks were observed. Theunassigned peak at 6.25◦ 2� disappeared. After 1000 ◦C the sampleremained mainly amorphous, but some albite (PDF # 00-010-0393)appeared. This means that, in contrast to the previously discussedmixes, a feldspar phase with an elemental formula of Na(Si3AlO8)was formed. This can be explained by the higher amount of silicain the CR 6 mix (SiO2/Al2O3 = 6) compared to the other mixes.
The results for MS 6 are displayed in Fig. 9. Up to 650 ◦Cthis compositeexhibited the same behavior as the previously dis-cussed medium- and high-silica mixes. At 700 ◦C the sample stayedquite crystalline, although first signs of structural breakdown wereobserved. No hydrosodalite was left. After treatment at 1000 ◦C thesample appeared X-ray amorphous.
For sample CR 3.5 additional ATR FT-IR measurements on theheat-treated samples were conducted. In particular the regionbetween 3000 cm−1 and 4000 cm−1 (Fig. 10) is of interest for the

P. Sturm et al. / Thermochimica Acta 635 (2016) 41–58 49
.5 mix
ctaaTrab
obAs∼[(vcw[
Fig. 6. Diffraction patterns of temperature-treated CR 3
onsideration of the dehydration, since in that range the charac-eristic stretching vibration centers of water and hydroxyl groupsppear. At 100 ◦C almost no change was observed. After treatmentt 150 ◦C, i.e. in the region of the most significant dehydration (Fig. 3,able 3), the intensity reduced by almost 50%, which fits the TGesults quite well. After heating to 400 ◦C almost the entire band dis-ppeared, again in line with the TG results. Above 400 ◦C no waterand remained.
Also the IR spectra below 1400 cm−1 (Fig. 11) fit the resultsf the other methods. Up to 400 ◦C no significant changes coulde observed since the framework was stable despite dehydration.t 800 ◦C the IR spectrum indicated a breakdown of the originaltructure, as shown by the disappearance of absorption band at550 cm−1, characteristic of zeolite A [47]. Recent investigations
48,49] have found this band in A-type zeolites to be a complex bandCB) occurring from stretching vibrations (vs Si-O-Si) and bendingibrations (ı O-Si-O). After heating to 1000 ◦C four new absorptionenters (982 cm−1, 702 cm−1, 514 cm−1 and 465 cm−1) occurred,
hich fit quite well the IR spectra of nepheline presented in Ref.50], again in accord with the observed diffraction patterns (Fig. 6).
. (A = zeolite A, N = nepheline, S = sodalite sensu stricto).
3.5. Compressive strength
After curing for three days at 80 ◦C the composites were testedfor compressive strength (Fig. 12). For the MS-based samples thecompressive strength correlated with the starting silica content:The higher the silica content in the starting mix (higher SiO2/Al2O3ratio), the higher was the compressive strength, in line with previ-ous results [28]. On the contrary, the compressive strength of theCR-based composites decreased with increasing SiO2/Al2O3 ratio,although this decrease was less pronounced than the increase forthe MS-based samples.
Possible influences on the compressive strength of the inves-tigated composites include the amount of non-reacted startingmaterials (which may act as micro-aggregates), and the relativeamounts of the reaction products, i.e. zeolite A, hydrosodalite andgeopolymeric gel in the present cases. While the amount of non-reacted silica feedstock in the composites has been determinedpreviously [28], no quantitative data is available for the abundances
of the reaction products at present. Thus, a detailed analysis of theinfluence of phase assemblage on the differences in compressivestrength has to be conducted at a later stage. Nevertheless, it is
50 P. Sturm et al. / Thermochimica Acta 635 (2016) 41–58
S 3.5 m
cipvlmac
)dampmmirtthc
Fig. 7. Diffraction patterns of temperature-treated M
lear that the composites investigated in the present study exhib-ted significantly lower strength than pure geopolymers which canossess compressive strengths in excess of 80 MPa [13,51]. This isery probably related to the significant amount of crystalline zeo-ites in the composite materials (cf. Refs. [29,52]) and their porous
icrostructure (Section 3.7). However, the compressive strengthschieved (up to ∼19 MPa) appear to be sufficient for various appli-ations such as coatings etc.
In addition to the aforementioned influences, the (macro-porosity of a solid is important in controlling its strength. As will beiscussed below (Section 3.7), the fresh mixes exhibited swellingnd macro-pore formation during curing; these processes wereuch more significant in the MS-based mixes, and were the more
ronounced, the lower SiO2/Al2O3 ratio was. This means that theacro-porosity increased with decreasing SiO2/Al2O3 ratio in theseaterials. This behavior provides an explanation for the decrease
n strength of the MS-based mixes with decreasing SiO2/Al2O3atio. On the other hand, swelling was much less pronounced inhe CR-based mixes, thus another mechanism is responsible for
he dependency of strength on SiO2/Al2O3 ratio. We note that atigh SiO2/Al2O3 ratios the workability of the CR-based pastes wasonsiderably inferior to the workability of the MS-based pastes,ix. (A = zeolite A, N = nepheline, HS = hydrosodalite).
and workability decreased with increasing SiO2/Al2O3 ratio. Thismay partly explain the lower strengths of the CR-based compositesat medium and high SiO2/Al2O3 ratios, as insufficient workabil-ity of the fresh pastes impacts on the compressive strength of thecured composites by introducing inhomogeneities and flaws intothe material.
Generally, the (residual) compressive strength of the specimensincreased after thermal treatment at moderate temperatures, i.e.200–400 ◦C, compared to the strength after curing (Figs. 13 and 14).The only exception was MS 2, which had the lowest strength aftercuring and no strength increase after thermal treatment as well.After treatment at temperatures ≥ 400 ◦C the MS 2 samples couldbe crumbled by hand, i.e. strength was virtually zero.
The strength of MS 3.5 reached a maximum after heating to400 ◦C (22.7 MPa). Except for a drop at 650 ◦C, performance stayedalmost constant up to 700 ◦C. At 750 ◦C the compressive strengthdecreased below the starting value. With almost 28 MPa aftera treatment at 200 ◦C the MS 6 specimens yielded the higheststrength of all samples. With further increasing temperature the
compressive strength decreased. However, after heating to 400 ◦Cit was still the mix with the highest strength, but at 650 ◦C thestrength value decreased below the starting value, and at 750 ◦C
P. Sturm et al. / Thermochimica Acta 635 (2016) 41–58 51
CR 6
o(a(amsm
2rribvtn
h7io
Fig. 8. Diffraction patterns of temperature-treated
nly strength of 5 MPa remained and large deformations occurredsee Section 3.6). MS 3.5 and MS 6 mixes reached a maximum rel-tive compressive strength of about 150% of the starting valuesFig. 14). While the performance of MS 6 continuously diminishedfter reaching the maximum at 200 ◦C, MS 3.5 retained its perfor-ance over a larger temperature range. Both mixes had residual
trength of only 10 MPa (MS 3.5) and 5 MPa (MS 6) after a treat-ent at 750 ◦C.
Also the CR-based mixes increased in strength at least up to00 ◦C, including the low-silica mix CR 2. These latter compositeseached a maximum of 19.0 MPa after treatment at 200 ◦C. CR 6eached a maximum of 15.3 MPa at 400 ◦C. CR 3.5 exhibited sim-lar behavior as MS 3.5, i.e. strength decreased slightly at 650 ◦C,ut increased significantly to 20.5 MPa after heating to 700 ◦C. Thisalue corresponds to 195% of the strength after curing. Increasinghe temperature to 750 ◦C resulted in massive deformations andearly total loss of strength (Fig. 14).
Above 200 ◦C, the strength of CR 2 decreased successively withigher treatment temperatures down to a minimum of 8.5 MPa at
00 ◦C (∼65% of the starting value). A further temperature increasen excess of 700 ◦C resulted in a regain of strength, reaching theverall maximum for this series of almost 25 MPa at 800 ◦C. This is
mix. (A = zeolite A, a = albite, q = quartz, C = calcite).
equivalent to 183% of the starting strength and represents the high-est compressive strength of all experiments on CR-based mixes.
CR 6 reached a relative compressive strength of 220% afterheating to 400 ◦C. After treatment at 750 ◦C the strength was sig-nificantly reduced by 65% compared to the former maximum. Afterheating to 800 ◦C, a re-increase of 138% of the value measured at750 ◦C was observed. At this point CR 6 reached an average strengthof 20.3 MPa or 292% of the starting value. This is the highest rela-tive increase of all considered composites caused by the thermaltreatment. Remarkable is a massive, rather ductile but neverthe-less crack inducing shrinkage (volume decrease) between 750 ◦Cand 800 ◦C. The absolute cracking forces were the same as the onesfor 750 ◦C but due to the smaller sample size the calculated strengthincreased significantly.
3.6. Dilatometry
Dilatometry experiments indicated only minor deformations
in the dehydration range up to 400 ◦C (Fig. 15). Except MS 3.5(�l/l ≈ 2%) all mixes exhibited a relative linear shrinkage of �l/l≤ 1.5% up to this temperature. At 650 ◦C a relative shrinkage ofonly 1.5% was observed for CR 6, while the other mixes exhibited
52 P. Sturm et al. / Thermochimica Acta 635 (2016) 41–58
eated
st7svito
e(stma
f(8sMsd
Fig. 9. Diffraction patterns of temperature-tr
omewhat higher deformations (�l/l ≤ 3%). Up to this temperaturehe deformations proceeded almost linear over temperature. At ca.00 ◦C the deformation-temperature curves of all samples becameignificantly steeper, and consequently the shrinkage increased toalues of 4.2% (CR 6) to 9.5% (CR 3.5) at 800 ◦C. This behavior isn line with the observed deformation behavior of the cubes forhe residual compressive strength tests and it correlates with thebserved phase transformations above 650 ◦C (Section 3.4).
Above ca. 800 ◦C the various samples behaved quite differ-nt. The low-silica mixes yielded the lowest maximum shrinkageCR 2 = 9.8% and MS 2 = 9.5%), while CR 3.5 reaches a maximumhrinkage of 23% at 860 ◦C. The CR 6 mix showed basically the sameendency but at slightly higher temperatures and with lower maxi-
um shrinkage (�l/l = 16.2%). This is readily explained by the lowermount of pores in the initial state.
Medium- and high-silica MS-based mixes exhibited a dif-ering behavior. Both had comparable shrinkage maxima�l/lmax(MS 3.5) = 17% at 840 ◦C and �l/lmax(MS 6) = 18% at50 ◦C), but with further increasing temperature the samplestarted to expand (MS 6: +6% and MS 3.5: +18%). In contrast to
S 2 both mixes incorporated remaining microsilica from thetarting mix. This peculiar behavior of MS 3.5 and MS 6 will beiscussed below (Section 4).
MS 6 mix. (A = zeolite A, HS = hydrosodalite).
3.7. SEM observations
The low-silica mixes, in particular MS 2, tended to expand dur-ing curing, associated with an increased volume of air voids, i.e.large pores (Fig. 16, top left). Also Krivenko and Kovalchuk [53]reported that certain geopolymer mixes comprising microsilicaexpanded during curing, without attempting to explain this behav-ior. Prud’homme et al. [54] observed foam formation at 70 ◦Cin highly alkaline aluminosiliceous systems controllable by silicafume. A hydrogen release due to the dissolution and oxidation ofsilicon was proposed to be the cause of this behavior. With pro-gressing polycondensation reaction the mix became stiffer andfinally initially consolidated; simultaneous ongoing hydrogen gasdevelopment resulted in foaming and swelling. This process seemsto be a reason for the expansion also for the geopolymer-zeolitecomposites investigated in the present study. Gas release wasobservable as bubble formation at the surface of samples MS 2,MS 3.5, MS 6, CR 2 and CR 3.5 at the very early stage of curing at80 ◦C. The expansion and the associated porosity had a consider-able influence on the compressive strength, which was lowest for
MS 2 and highest for MS 6, the latter being almost free of largepores (Fig. 16, top right). A possible explanation for the more pro-nounced expansion tendency at low SiO2/Al2O3 ratios is again thehigher pH of the pore solution (Section 3.1): the higher pH may
P. Sturm et al. / Thermochimica Acta 635 (2016) 41–58 53
Fig. 10. ATR FT-IR spectra of selected temperature-treated CR 3.5 samples between 3000 cm−1 and 4000 cm−1.
F en 40v
has
ig. 11. ATR FT-IR spectra of selected temperature-treated CR 3.5 samples betweibration, CB = complex band; � = bending vibration).
ave caused the “foaming” reactions to proceed faster and/or to higher extent than in the high-silica mixes, which had lowerodium aluminate fractions and consequently higher H2O/Na2O
0 cm−1 and 1400 cm−1. (T = Si or Al, vas,s = asymmetric and symmetric stretching
ratios (equal to (H2O/Al2O3)/0.98; Table 2). Compared to the MS 2,the CR 2 samples expanded much less, which is probably a reasonfor their considerably higher compressive strength. The reason for

54 P. Sturm et al. / Thermochimica Acta 635 (2016) 41–58
0
2
4
6
8
10
12
14
16
18
20
22
2 3.5 6
Com
pres
sive
str
engt
h (M
Pa)
SiO2/Al2O3 (mol/mol)
sil ica CR
silica MS
Fig. 12. Compressive strength of the composites after 3 days of curing. Error barsrepresent one standard deviation in each direction.
Fig. 13. Compressive strengths of the composites after 3 days of curing and thermalto
tiMMt1cota−csc
Fig. 14. Relative compressive strengths (i.e. strengths relative to the strengths after
reatment at the specified temperatures (residual strengths). Error bars representne standard deviation in each direction.
his difference in behavior is not clear, but it is interesting to noten this context that CR 2 contained much less hydrosodalite than
S 2. At higher magnifications, the SEM micrographs of MS 2 andS 6 (Fig. 16, middle and bottom row) reveal a porous microstruc-
ure, consisting of particles with an approximate diameter of ca.00 nm. This parallels previous findings on one-part geopolymeromposites produced from CR-silica [26]. The microstructure of thene-part geopolymer-zeolite composites is thus much less compacthan that of conventional geopolymers (e.g. [5,13,15,20,22,51]). Aslready mentioned in Section 3.5, this more porous microstructure
in connection with the high amount of crystalline zeolites in theomposites − is probably responsible for the comparatively lowtrength of the composites under investigation, when compared toonventional geopolymers. In Fig. 16 (bottom row) it appears that
curing) of the composites after 3 days of curing and thermal treatment at the spec-ified temperatures (residual strengths).
microstructure of MS 6 is more compact than the microstructureof MS 2, which provides an additional explanation (in addition tothe lower amount of air voids) for the higher strength of MS 6.
4. General discussion of the high-temperature behavior ofthe composites
Thermal analysis (TG) showed that release of most of the waterin the samples occurred between ca. 100 ◦C and 200 ◦C, which isthe typical dehydration range of geopolymers [11,14,15,20–22,55],and some additional water loss at 200–400 ◦C. Comparison withthe TG curve of an almost pure zeolite A (Fig. 3) and considera-tion of the IR spectra of the heated samples (Figs. 10, 11) as wellas the deformation behavior (Fig. 15) leads to the conclusion thatmost of this water is of zeolitic character, in particular relatedto zeolite A and/or hydrosodalite. Above 400 ◦C only minor masslosses occurred, particularly for CR mixes, caused by escaping CO2from incorporated calcite. In contrast to other geopolymer sys-tems [11,13–15,20–23,43,55], the geopolymer-zeolite compositesinvestigated in the present study do not exhibit pronounced shrink-age in the dehydration range 100–200 ◦C, probably because thereleased water is mainly “zeolitic” water; instead, thermal shrink-age occurred rather continuously from ambient to ca. 700 ◦C (<3%).At temperatures above ca. 700 ◦C a sudden increase in shrink-age occurred. This sudden “softening” is generally attributed toviscous sintering or densification/crystallization in the geopoly-mers [11,13,15,20–22,55]. The rather uniform shrinkage of thespecimens up to this sintering/densification temperature is con-sidered to be an advantage in high-temperature applications. Inall cases except for MS 2, thermal treatment at temperatures upto 200–400 ◦C caused the (residual) compressive strength of thesamples to increase. Up to these temperatures no changes in phaseassemblage and only subtle changes in crystallinity of the sam-ples could be observed (Figs. 4–9). However, it has been previously
established [28] that virtually no further geopolymerization occursin the investigated mixes after one day of curing at 80 ◦C. Thus,the increases in strength are probably mainly related to the subtlechanges in crystallinity or to other changes, not observable with
P. Sturm et al. / Thermochimica Acta 635 (2016) 41–58 55
ed spe
Xe
sMtaitMot[
aitvSsaswmicsmtAMti
Fig. 15. Relative linear shrinkage of the cur
RD. The shrinkage (densification) most likely also had a positiveffect on the residual strength.
Depending on the starting mix-design, phase transformationstarted between 400 ◦C and 750 ◦C. Except for the high-silica mixesS 6 and CR 6, the materials transformed to stuffed silica struc-
ures of nepheline-type (MS 3.5 and CR 3.5) or a mix of nephelinend carnegieite-type silica structures (MS 2 and CR 2). This behav-or parallels previous reports about aluminosiliceous precursorsransforming into various stuffed silica structures [18,21,39,44,45].
S 6 and CR 6 turned into completely amorphous or formed albiten heating to 1000 ◦C, respectively, the latter being a behaviorhat has already been reported for geopolymers with SiO2/Al2O3 = 618].
Significant changes in compressive strength could be observedfter heating to temperatures that also caused significant changesn phase assemblage of the composites, particularly at tempera-ures of 700 ◦C and higher. The behavior at these temperaturesaried considerably, depending on the silica feedstock and theiO2/Al2O3 ratio of the composites. MS 3.5 and CR 3.5 exhibited atrength increase on going to a treatment temperature of 700 ◦C and
sharp decrease afterwards (i.e. at 750 ◦C). For MS 6 only a smalltrength increase, followed by continuous strength deteriorationas observed. On the contrary, CR 2 and CR 6 exhibited a moreoderate strength loss after heating to 700 ◦C or 750 ◦C, and signif-
cant strength gain afterwards (800 ◦C). For CR 2 the strength gainan be mainly attributed to sintering effects, while with CR 6 thetrength increase is attributed to sintering and shrinkage (the ulti-ate load for 800 ◦C was similar to the ultimate load for 750 ◦C, but
he dimensions of the sample were smaller after 800 ◦C treatment).lthough no strength increase was observed for MS 3.5, CR 3.5 and
◦
S 6 in the range 700–800 C, their residual strength evolution, i.e.he absence of an abrupt strength decrease up to 700 ◦C, is beneficialn high-temperature applications.cimens during dilatometry measurements.
The peculiar behavior of MS 2, i.e. its decreased strength afterthermal treatment at 100 ◦C and 200 ◦C and its complete loss ofstrength already at temperatures of 400 ◦C, may be related tothe fact that the major crystalline phase in the specimens washydrosodalite. Felsche and Luger [40,41] reported an increase ofthe volume of the unit cell of hydrosodalite during dehydrationand assigned this behavior to destruction of the hydrogen bondingbetween hydrate water and the sodalite framework. This expan-sion of hydrosodalite in MS 2, restrained by shrinking zeolite Aand other compounds, probably led to excessive crack formationin these samples. This assumption is supported by the dilatometryresults (Fig. 15): MS 2 exhibited the lowest shrinkage of all mixesup to ca. 500 ◦C.
The dilatometry results showed a maximum shrinkage formedium- and high-silica MS-based mixes (MS 3.5 and MS 6)around 850 ◦C, followed by a sharp expansion at higher temper-atures. A rapid expansion at temperatures around 600–800 ◦C hasbeen observed previously for some fly ash-based geopolymers andattributed to silica gel-like products of the employed sodium sili-cate activating solutions [13,15,56]. In addition, Fletcher et al. [57]observed swelling of metakaolin-based geopolymers, comprisinghigh amounts of silica (Aerosil), at temperatures of 100–300 ◦C.Since in the present study only samples with remaining microsilicaafter curing (in MS 2 the silica is virtually completely reacted [28])showed sharp high temperature swelling, this behavior seems tobe mainly caused by the residual microsilica. The CR-based samplesdid not exhibit extensive swelling up to the maximum measuredtemperature of 900 ◦C, which is considered to be an advantage overthe MS-based mixes.
5. Conclusions
One-part geopolymer-zeolite composites were synthesizedwith a maximum strength of ca. 19 MPa (MS 6) after curing at 80 ◦C

56 P. Sturm et al. / Thermochimica Acta 635 (2016) 41–58
es of t
aoatltasws
arseaCr
g7
Fig. 16. SEM micrographs (secondary electrons) of fracture surfac
nd 80% r. H. The phase content of the cured one-part mixes basedn silica MS was dominated by hydrosodalite at low silica content;t high silica content zeolite A was the major crystalline phase. Athe same time, swelling during curing was more significant for theow silica content. This expansion is possibly related to the forma-ion of hydrogen during curing. The expansion reactions resulted in
high amount of large pores in the hardened specimens and corre-pondingly low compressive strength. The volume of large pores asell as the degree of reaction of the silica decreased with increasing
ilica content, with a positive effect on the compressive strength.For the CR-based composites the crystalline phase content was
lways dominated by zeolite A. Differences in the phase contentelated to different mix-design (SiO2/Al2O3 ratios) were much lessignificant for this feedstock. Also, differences between the mixes inxpansion behavior and compressive strength were smaller; gener-lly swelling was much less pronounced in the CR-based mixes. TheR 6 mix exhibited the lowest compressive strength, most likely
elated to the poor workability of this mix.An approximately linear shrinkage was observed for theeopolymer-zeolite composites in the present investigation up to00 ◦C, with the maximum shrinkage up to this temperature being
he cured composites MS 2 (left column) and MS 6 (right column).
ca. 2–3%. This behavior differs from the usual behavior of geopoly-mers, i.e. rapid shrinkage in the dehydration range 100–200 ◦C dueto the release of “structural” water, making the investigated materi-als interesting for high-temperature applications. This observationleads to the conclusion (together with the TG results) that the incor-porated water is more of zeolitic character for the investigatedsystems. Except for MS 2, thermal treatment at moderate temper-atures (200–400 ◦C) led to a strength improvement up to 28 MPa(MS 6). Heating above this range led to a moderate performanceloss up to 700 ◦C.
Above ca. 700 ◦C extensive shrinkage deformations occurredin all mixes. This behavior is caused by structural breakdown ofthe initial phase content and sintering/densification. The low-silicaand medium-silica specimens underwent complex phase transfor-mations during heating, leading to nepheline polymorphs and/orcarnegieite-like phases at 1000 ◦C, which are of some interest forthe ceramic industry. (Medium-silica mixes led to almost pure
hexagonal nepheline phase.) The high-silica mixes produced anamorphous phase at 1000 ◦C that contained albite in addition whenthe silica feedstock was silica CR.
himica
A
Pmfaih
R
[
[
[
[
[
[
[
[
[
[
[
[
[
[
[
[
[
[
[
[
[
[
[
[
[[
[
[
[
[
[
[
[
[
[
[
[
[
[
[
[
[
[
[
P. Sturm et al. / Thermoc
cknowledgements
The authors thank Christian Meyer, Christiane Weimann andatrick Klack for help with the dilatometry, SEM and ATR FT-IReasurements, respectively. P.S. acknowledges financial support
rom BAM within the MIS program (proposal Ideen 2012 36). Theuthors would also like to thank two anonymous reviewers for theirnsightful comments which greatly contribute to this paper andelped to improve the intelligibility of the nomenclature used.
eferences
[1] J. Davidovits, Geopolymers: inorganic polymeric new materials, J. Therm.Anal. 37 (1991) 1633–1656.
[2] H. Rahier, B. van Mele, M. Biesemanns, J. Wastiels, X. Wu, Low-temperaturesynthesized aluminosilicate glasses. Part I. Low-temperature reactionstoichiometry and structure of a model compound, J. Mater. Sci. 31 (1996)71–79.
[3] V.F.F. Barbosa, K.J.D. MacKenzie, C. Thaumaturgo, Synthesis andcharacterisation of materials based on inorganic polymers of alumina andsilica: sodium polysialate polymers, Int. J. Inorg. Mater. 2 (2000) 309–317.
[4] A. Palomo, S. Alonso, A. Fernandez-Jiménez, I. Sobrados, J. Sanz, Alkalineactivation of fly ashes: NMR study of the reaction products, J. Am. Ceram. Soc.87 (2004) 1141–1145.
[5] W.M. Kriven, J.L. Bell, M. Gordon, Microstructure and microchemistry offully-reacted geopolymers and geopolymer matrix composites, Ceram. Trans.153 (2003) 227–250.
[6] J.L. Bell, P. Sarin, P.E. Driemeyer, R.P. Haggerty, P.J. Chupas, W.M. Kriven, X-raypair distribution function analysis of a metakaolin-based, KAlSi2O6·5.5H2Oinorganic polymer (geopolymer), J. Mater. Chem. 18 (2008) 5974–5981.
[7] J.L. Bell, P. Sarin, J.L. Provis, R.P. Haggerty, P.E. Driemeyer, P.J. Chupas, J.S.J. vanDeventer, W.M. Kriven, Atomic structure of a cesium aluminosilicategeopolymer: a pair distribution function study, Chem. Mater. 20 (2008)4768–4776.
[8] P. Duxson, J.L. Provis, G.C. Lukey, J.S.J. van Deventer, The role of inorganicpolymer technology in the development of ‘green concrete’, Cem. Concr. Res.37 (2007) 1590–1597.
[9] A. Fernandez-Jimenez, I. García-Lodeiro, A. Palomo, Durability ofalkali-activated fly ash cementitious materials, J. Mater. Sci. 42 (2007)3055–3065.
10] C. Montes, E.N. Allouche, Evaluation of the potential of geopolymer mortar inthe rehabilitation of buried infrastructure, Struct. Infrastruct. Eng. 8 (2012)89–98.
11] V.F.F. Barbosa, K.J.D. MacKenzie, Thermal behaviour of inorganic geopolymersand composites derived from sodium polysialate, Mater. Res. Bull. 38 (2003)319–331.
12] A. Fernández-Jiménez, A. Palomo, J.Y. Pastor, A. Martín, New cementitiousmaterials based on alkali-activated fly ash: performance at hightemperatures, J. Am. Ceram. Soc. 91 (2008) 3308–3314.
13] W.D.A. Rickard, J. Temuujin, A. van Riessen, Thermal analysis of geopolymerpastes synthesised from five fly ashes of variable composition, J. Non-Cryst.Solids 358 (2012) 1830–1839.
14] L. Vickers, W.D.A. Rickard, A. van Riessen, Strategies to control the hightemperature shrinkage of fly ash based geopolymers, Thermochim. Acta 580(2014) 20–27.
15] W.D.A. Rickard, C.S. Kealley, A. van Riessen, Thermally inducedmicrostructural changes in fly ash geopolymers: experimental results andproposed model, J. Am. Ceram. Soc. 98 (2015) 929–939.
16] J. Davidovits, M. Davidovics, Geopolymer: room-temperature ceramic matrixfor composites, Ceram. Eng. Sci. Proc. 9 (7/8) (1988) 835–841.
17] D.C. Comrie, W.M. Kriven, Composite cold ceramic geopolymer in a refractoryapplication, Ceram. Trans. 153 (2003) 211–225.
18] P.V. Krivenko, G.Y. Kovalchuk, Directed synthesis of alkaline aluminosilicateminerals in a geocement matrix, J. Mater. Sci. 42 (2007) 2944–2952.
19] P.V. Krivenko, Y.K. Pushkavera, M.V. Sukhanevich, S.G. Guziy, Fireproofcoatings on the basis of alkaline aluminum silicate systems, Ceram. Eng. Sci.Proc. 29 (10) (2009) 129–142.
20] J.L. Bell, P.E. Driemeyer, W.M. Kriven, Formation of ceramics frommetakaolin-based geopolymers: part I—Cs-based geopolymer, J. Am. Ceram.Soc. 92 (2009) 1–8.
21] C. Kuenzel, L.M. Grover, L. Vandeperre, A.R. Boccaccini, C.R. Cheeseman,Production of nepheline/quartz ceramics from geopolymer mortars, J. Eur.Ceram. Soc. 33 (2013) 251–258.
22] J.L. Bell, P.E. Driemeyer, W.M. Kriven, Formation of ceramics frommetakaolin-based geopolymers. Part II: K-based geopolymer, J. Am. Ceram.Soc. 92 (2009) 607–615.
23] C. Kuenzel, L.J. Vandeperre, S. Donatello, A.R. Boccaccini, C. Cheeseman,
Ambient temperature drying shrinkage and cracking in metakaolin-basedgeopolymers, J. Am. Ceram. Soc. 95 (2012) 3270–3277.24] A. Hajimohammadi, J.L. Provis, J.S.J. van Deventer, One-part geopolymermixes from geothermal silica and sodium aluminate, Ind. Eng. Chem. Res. 47(2008) 9396–9405.
[
Acta 635 (2016) 41–58 57
25] A. Hajimohammadi, J.L. Provis, J.S.J. van Deventer, Effect of alumina releaserate on the mechanism of geopolymer gel formation, Chem. Mater. 22 (2010)5199–5208.
26] G.J.G. Gluth, C. Lehmann, K. Rübner, H.-C. Kühne, Geopolymerization of asilica residue from waste treatment of chlorosilane production, Mater. Struct.46 (2013) 1291–1298.
27] X. Ke, S.A. Bernal, N. Ye, J.L. Provis, J. Yang, One-part geopolymers based onthermally treated red mud/NaOH blends, J. Am. Ceram. Soc. 98 (2015) 5–11.
28] P. Sturm, S. Greiser, G.J.G. Gluth, C. Jäger, H.J.H. Brouwers, Degree of reactionand phase content of silica-based one-part geopolymers investigated usingchemical and NMR spectroscopic methods, J. Mater. Sci. 50 (2015) 6768–6778.
29] D. Kolousek, J. Brus, M. Urbanova, J. Andertova, V. Hulinsky, J. Vorel,Preparation, structure and hydrothermal stability of alternative (sodiumsilicate-free) geopolymers, J. Mater. Sci. 42 (2007) 9267–9275.
30] P. Duxson, J.L. Provis, Designing precursors for geopolymer cements, J. Am.Ceram. Soc. 91 (2008) 3864–3869.
31] E. Königsberger, P.M. May, G. Hefter, Comprehensive model of synthetic Bayerliquors. Part 3. Sodium aluminate solutions and the solubility of gibbsite andboehmite, Monatsh. Chem. 137 (2006) 1139–1149.
32] J.L. Provis, G.C. Lukey, J.S.J. van Deventer, Do geopolymers actually containnanocrystalline zeolites? A reexamination of existing results, Chem. Mater. 17(2005) 3075–3085.
33] B. Zhang, K.J.D. MacKenzie, I.W.M. Brown, Crystalline phase formation inmetakaolinite geopolymers activated with NaOH and sodium silicate, J.Mater. Sci. 44 (2009) 4668–4676.
34] D.W. Breck, Zeolite Molecular Sieves, Wiley, New York, 1974.35] C.S. Cundy, P.A. Cox, The hydrothermal synthesis of zeolites: precursors,
intermediates and reaction mechanism, Microporous Mesoporous Mater. 82(2005) 1–78.
36] J. Weitkamp, R. Schumacher, U. Weiß, Hydrothermalsynthese undCharakterisierung von Zeolith EMT, Chem. Ing. Tech. 64 (1992) 1109–1112.
37] M.M.J. Treacy, J.B. Higgins, Collection of Simulated XRD Powder Patterns forZeolites, 4th revised edn., Elsevier, Amsterdam, 2001.
38] B. Subotic, D. Skrtic, I. Smit, L. Sekanovic, Transformation of zeolite A intohydroxysodalite: I. An approach to the mechanism of transformation and itsexperimental evaluation, J. Cryst. Growth 50 (1980) 498–508.
39] A. Radulovic, V. Dondur, P. Vulic, Z. Miladinovic, G. Ciric-Marjanovic, R.Dimitrijevic, Routes of synthesis of nepheline-type polymorphs: an influenceof Na-LTA bulk composition on its thermal transformations, J. Phys. Chem.Solids 74 (2013) 1212–1220.
40] J. Felsche, S. Luger, Phases and thermal decomposition characterisitics ofhydro-sodalites Na6+x[AlSiO4]6(OH)x·nH2O, Thermochim. Acta 118 (1987)35–55.
41] J. Felsche, S. Luger, Structural collapse or expansion of the hydro-sodalitesseries Na8[AlSiO4]6(OH)2·nH2O and Na6[AlSiO4]6·nH2O upon dehydration,Ber. Bunsenges. Phys. Chem. 90 (1986) 731–736.
42] G. Engelhardt, J. Felsche, P. Sieger, The hydrosodalite systemNa6+x[SiAlO4]6(OH)x·nH2O: formation, phase composition, and de- andrehydration studied by 1H, 23Na, and 29Si MAS–NMR spectroscopy in tandemwith thermal analysis, X-ray diffraction, and IR spectroscopy, J. Am. Chem.Soc. 114 (1992) 1173–1182.
43] A. Buchwald, M. Vicent, R. Kriegel, C. Kaps, M. Monzó, A. Barba, Geopolymericbinders with different fine fillers—phase transformations at hightemperatures, Appl. Clay Sci. 46 (2009) 190–195.
44] J.G. Thompson, A. Melnitchenko, S.R. Palethorpe, R.L. Withers, An XRD andelectron diffraction study of cristobalite-related phases in theNaAlO2–NaAlSiO4 system, J. Solid State Chem. 131 (1997) 24–37.
45] J.G. Thompson, R.L. Withers, A. Melnitchenko, S.R. Palethorpe,Cristobalite-related phases in the NaAlO2–NaAlSiO4 system. I. Two tetragonaland two orthorhombic structures, Acta Crystallogr. B 54 (1998) 531–546.
46] M. Okrusch, S. Matthes, Mineralogie: Eine Einführung in die spezielleMineralogie, in: Petrologie und Lagerstättenkunde, 9th edn., Springer, Berlin,2014.
47] E.M. Flanigen, H. Khatami, H.A. Szymanski, Infrared structural studies ofzeolite frameworks, in: E.M. Flanigen, L.B. Sand (Eds.), Molecular sievezeolites–I, Adv. Chem. Ser. 101, American Chemical Society Washington, D.C.,(1971) 201–229.
48] W. Mozgawa, W. Jastrzebski, M. Handke, Vibrational spectra of D4R and D6Rstructural units, J. Mol. Struct. 744–747 (2005) 663–670.
49] W. Mozgawa, M. Król, K. Barczyk, FT-IR studies of zeolites from differentstructural groups, Chemik 65 (2011) 671–674.
50] H.H.W. Moenke, Silica, the three-dimensional silicates, borosilicates andberyllium silicates, in: V.C. Farmer (Ed.), The Infrared Spectra of Minerals,Mineralogical Society, London, 1974, pp. 365–382.
51] P. Duxson, J.L. Provis, G.C. Lukey, S.W. Mallicoat, W.M. Kriven, J.S.J. vanDeventer, Understanding the relationship between geopolymer composition,microstructure and mechanical properties, Colloids Surf. A 269 (2005) 47–58.
52] S.J. O’, Connor, K.J.D. MacKenzie, Synthesis, characterisation and thermalbehavior of lithium aluminosilicate inorganic polymers, J. Mater. Sci. 45(2010) 3707–3713.
53] P.V. Krivenko, G.Y. Kovalchuk, Fly-ash based zeolite cements, in: R.K. Dhir, P.C.
Hewlett, L.J. Csetenyi (Eds.), Innovations and Developments in ConcreteMaterials and Construction, Thomas Telford, London, 2002, pp. 123–132.54] E. Prud‘homme, P. Michaud, E. Joussein, C. Peyratout, A. Smith, S.Arrii-Clacens, J.M. Clacens, S. Rossignol, Silica fume as porogent agent ingeo-materials at low temperature, J. Eur. Ceram. Soc. 30 (2010) 1641–1648.

5 himica Acta 635 (2016) 41–58
[
[
8 P. Sturm et al. / Thermoc
55] P. Duxson, G.C. Lukey, J.S.J. van Deventer, Physical evolution of Na-geopolymerderived from metakaolin up to 1000 ◦C, J. Mater. Sci. 42 (2007) 3044–3054.
56] J.L. Provis, C.Z. Yong, P. Duxson, J.S.J. van Deventer, Correlating mechanicaland thermal properties of sodium silicate-fly ash geopolymers, Colloids Surf.A 336 (2009) 57–63.
[
57] R.A. Fletcher, K.J.D. MacKenzie, C.L. Nicholson, S. Shimada, The compositionrange of aluminosilicate geopolymers, J. Eur. Ceram. Soc. 25 (2005)1471–1477.