Embed Size (px)
Citation preview

THE EFFECT OF HAY TYPE AND SOAKING
ON GLYCEMIC RESPONSE IN HORSES
Josie Collins
A Thesis Submitted in Partial Fulfillment
of the Requirements for the Degree of
Master of Science in Horse Science
Equine Industry Management
Middle Tennessee State University
May 2015
Thesis Committee:
Dr. Rhonda M. Hoffman, Chair
Dr. Holly S. Spooner
Dr. John C. Haffner

ii
ABSTRACT
Dietary management of equine metabolic syndrome includes minimizing
glycemic response. Soaking hay prior to feeding reduces nonstructural carbohydrate
content, but little research indicates if soaking hay reduces glycemic response. Glycemic
response of four hay diets were evaluated: dry or soaked prairiegrass hay, and dry or
soaked alfalfa hay. Twelve healthy horses were randomly assigned into two groups and
fed the hay diets at 0.5% BW in a 2x2 factorial design. Blood samples were collected at
0, 30, 60, 90, 120, 180, 240, and 300 min after feeding. Plasma glucose was analyzed
using a colorimetric assay, and incremental area under the curve (AUC) of glucose
response calculated. Data were analyzed using a mixed model with repeated measures.
Plasma glucose and the AUC was higher (P =0.0001) in healthy horses fed alfalfa
compared to grass hay, with no differences identified due to soaking (P = 0.82).
Additional research is needed to determine if soaking hay has physiological merit in
horses with metabolic issues.
Keywords
Glycemic response, Hay soaking, Horses

iii
TABLE OF CONTENTS
Page
LIST OF TABLES v
LIST OF FIGURES vi
CHAPTER I: LITERATURE REVIEW 1
Introduction 1
Carbohydrate Digestion in the Horse 2
Diseases and Conditions Related to Sugar Sensitivity 4
Glycemic Response 6
Nonstructural Carbohydrate Affects the Glycemic Index 7
Source of Starch 9
Processing of Starch 12
Amount of Starch 14
Mixed Diets 16
Challenges with High Glycemic Index Feeds in Horses 18
Grass Hay vs. Legume Hay and the Glycemic Response 18
Hay Soaking 23
CHAPTER II: THE EFFECT OF DRY VERSUS SOAKED HAY ON GLYCEMIC
RESPONSE IN HORSES 25
Materials and Methods 26
Results 30
Discussion 31
Conclusion 32

iv
LITERATURE CITED 35
APPENDICES 40
APPENDIX A: IACUC Approval 41

v
LIST OF TABLES
Page
Table 1. Hay analysis based on percent dry matter 28
Table 2. Hay moisture analysis on an as fed basis 29

vi
LIST OF FIGURES
Page
Figure 1. (Rodiek and Stull, 2005) mean glycemic indices of 10 horse feeds. 11
Figure 2. Effect of processing on the Glycemic Index of barley. 13
Figure 3. Postprandial serum glucose concentrations increase with increasing
amounts of starch (Vervuert, 2009). 15
Figure 4. Effect of time of hay feeding on glycemic response (Pagan, 1999a). 17
Figure 5. Sinusoidal circadian patterns in nonstructural carbohydrate and insulin
in grazing horses (McIntosh et. al, 2006). 22
Figure 6. Postprandial plasma glucose response after feeding different hays. 33
Figure 7. Incremental area under the curve (AUC) of plasma glucose response
to feeding dry vs soaked alfalfa or grass hay. 34

1
CHAPTER I: LITERATURE REVIEW
Introduction
Horses are hind gut fermenting herbivores, making forage the greatest proportion of
the horse’s diet. Forage provides a great fiber source that is fermented slowly. The slow
fermentation process allows the survival and multiplication of beneficial bacterial that
provide volatile fatty acids, which are then used by the horse as a major energy source. In
addition to providing fuel for bacterial fermentation, fiber in forages also maintains gut
health by providing scratch factor (Warner, 1991). Scratch factor pulls away dead cells
along the gut lining and allows for better secretion of gut enzymes. Lastly fiber provides
structural support for the gut. Horses that have continuous access to forage maintain
proper gut structure, which helps in preventing twists and kinks.
In addition to fiber, forage contains storage carbohydrates including fructans, starch,
and simple sugars; which are nonstructural carbohydrates (NSC). Fructans and simple
sugars act as an energy source for cool-season grasses, while starches are stored in
legumes and warm-season grasses. Starch and simple sugars can be hydrolyzed in the
foregut, but fructans are rapidly fermented in the hindgut (Hoffman et al., 2001).
Furthermore if starch is consumed in excess of 400 g per 100 kg BW per meal (Potter et
al., 1992), it overwhelms the capacity of the foregut and is fermented rapidly in the
hindgut. The rapid fermentation of these carbohydrates in large quantities has been
demonstrated to cause colic and laminitis (Cohen et al., 1999; Longland et al., 1999).
The NSC content in pasture forages undertake circadian and seasonal variation, directly

2
affecting the horses metabolism and perhaps exacerbating metabolic disease (McIntosh,
2006).
Researchers evaluating metabolic disorders recommend reducing rapidly fermentable
nonstructural carbohydrates (Frank, 2009). Although simply reducing the amount fed is a
possibility, the large amount of fiber is important for gut health. A management practice
that is becoming commonly recommended is soaking hay.
Martinson et al. (2011) studied the effect of soaking on carbohydrate removal of
different hays and found a significant loss in nonstructural carbohydrates with 30 minutes
of soaking in warm water or 60 minutes in cold water. This management practice has
been proven as a viable way to reduce NSC in hay. The next matter at hand would be
whether the soaked hay has a lowered effect on blood glucose and insulin. The large
spike in blood glucose and insulin exacerbates metabolic conditions in the horse.
Carbohydrate Digestion in the Horse
Although forage is the largest portion of their diet, performance horses are
commonly supplemented with grain concentrates. Dietary carbohydrate composition in
grain range from simple sugars and starch to slowly fermentable and indigestible fiber.
The horse’s digestive system is organized to hydrolyze disaccharides and starches to
yield simple sugars, which are absorbed in the small intestine. Fermentation of fibrous
carbohydrates in the hindgut yields volatile fatty acids. The determination of where
carbohydrates are digested depends on the linkage of its sugar molecules. Alpha 1, 4

3
linkages predispose the carbohydrate to hydrolysis by enzymes in the small intestine,
while β 1, 4 linkages are subject to microbial fermentation in the hindgut (NRC, 2007).
Hydrolytic digestion is achieved using enzymes produced by the horse. The
enzymes include alpha amylase, alpha glucosidase (sucrase, glucoamylase, and maltase)
and beta galactosidase (lactase). Alpha amylase is secreted from the pancreas and the
other enzymes are brush border enzymes. Disaccharides and starches are hydrolyzed to
an extent by the low acidity of the stomach however, the majority of hydrolysis occurs in
the small intestine by alpha amylase. Amylopectinase cleaves α 1, 4 linkages leaving
disaccharides and oligosaccharides. The brush border enzymes then complete hydrolysis
yielding free sugars glucose, galactose, and fructose.
Microorganisms prosper in the large intestine of horses because of a pH greater
than five and sufficient retention time. The pH is optimally greater than six, because
lower pH favors lactic acid producing bacteria (Radicke et al., 1991). Small amounts of
fermentation are thought to occur in the fundic region of the stomach; these bacteria are
also lactic acid producing. Some fermentation occurs in the distal region of the small
intestine, but it is uncertain if this occurs independently of the horse’s hind gut or if this is
due to reflux of the hindgut contents. The large majority of fermentation happens in the
cecum and large intestine. Nonstructural carbohydrates that pass through the small
intestine unhydrolyzed are rapidly fermented in the hindgut yielding lactate. This occurs
typically when the concentration of starch exceeds 400 g per 100 kg of body weight per
meal (Potter et al., 1992). Carbohydrates that can be digested in the foregut yield greater
energy than those fermented in the hindgut (Blaxter, 1989; Kronfeld et al., 1996).

4
Fermentation of fiber produces desired volatile fatty acids acetate, propionate,
butyrate, and usually smaller amounts of lactate and valerate (Argenzio et al., 1974).
Lactate is an undesired end product of rapid fermentation because it is poorly absorbed,
and accumulated amounts of lactic acid lower cecal pH below six and further favors the
production of bacteria that yield lactate. The decrease in pH leads to death of desired
fiber fermenting microbes creates microdamage to the intestinal epithelium (Clarke et al.,
1990). The dying microbes release endotoxins that are absorbed through the damaged
epithelium, leading to endotoxemia and laminitis (Pollitt and Visser, 2010).
Diseases and Conditions Related to Sugar Sensitivity
Several equine disorders are characterized by sensitivities to sugar and starch
intake. These sensitivities are most commonly related insulin resistance or, in some cases,
extreme sensitivity to insulin. These metabolic conditions include Insulin resistance,
Equine Metabolic Syndrome, Polyssacharide Storage Myopathy, and Laminitis.
Insulin resistance is defined as a state when normal concentrations of insulin fail
to obtain a normal biological response (Kahn, 1978). Normal concentrations of insulin do
not lower blood glucose effectively. In response, the pancreas then produces increasing
amounts of insulin. Dietary recommendations for horses with insulin resistance suggest
for low nonstructural carbohydrate content. Consuming diets with large amounts of
simple sugars can worsen symptoms of obesity, hyperinsulinemia, and laminitis. An
optimal diet for insulin resistant horses contains low nonstructural carbohydrate content
and high fiber (Johnson et al., 2012).

5
The major clinical signs of Equine Metabolic Syndrome include obesity and or
regional adiposity, prior or current laminitis, and insulin resistance (Frank, 2009). The
definite causes of Equine Metabolic Syndrome are unknown, but there seem to be genetic
correlations (Brosnahan et al., 2010). Common factors include genetic predisposition,
low activity, diets with excess energy and high glycemic indices. Horses with Equine
Metabolic Syndrome have recommended dietary restrictions due to symptoms of Insulin
resistance.
Polysaccharide Storage Myopathy is characterized with clinical signs of muscle
cramping and pain with exercise (Frishman, 2005). Horses diagnosed with
Polysaccharide Storage Myopathy have muscle damage and are deficient in energy
generation. Studies show when feeding Polysaccharide Storage Myopathy afflicted
horses grain based concentrated feeds containing large amounts of simple sugars and
starch, muscle pain and exercise intolerance is worsened (Ribeiro, 2004). Polysaccharide
Storage Myopathy horses secrete less insulin to a glucose load (De la Corte, 1999),
exhibiting insulin sensitivity and enhanced blood glucose uptake (Annandale et al.,
2004). Feeding a ration restricting starch and sugar content (total ration < 8% DE from
starch and sugar) and adding fat (> 10% of total DE) results in affected horses improving
clinically (Frishman, 2005; Riberio, 2004). Recommendations for hay fed to
Polysaccharide Storage Myopathy horses include feeding hay containing 11%
nonstructural carbohydrates or less (Borgia et al., 2011).
Laminitis is a disabling disease in horses and ponies, which is a failure of the
attachment between the dero-epidermal junction, resulting in pain and lameness in

6
affected horses (Pollitt et al., 2003). Of the cases reported to the USDA (2000), lush
pasture consumption is the number one cause of laminitis at 46%, followed by grain
overload at 7%. Laminitis has been induced experimentally by administering starch and
fructans at a dosage between 7.5 to 12.5 g per kg BW (French and Pollitt, 2004). Rapid
fermentation causes the proliferation of lactic acid producing saccharolytic and
amylolytic bacteria which decreases the hindgut (Garner, 1977). King and Mansmann
(2004) recommended hay containing less than 15% nonstructural carbohydrates for
healthy horses, preventing the onset of laminitis. Maintenance of laminitic horses also
includes prevention of excess weight, increasing the importance of limiting excess
carbohydrates.
Grain intake has been well documented as the culprit in the onset and
exacerbating these disorders (Clarke et al., 1990; Kronfeld and Harris 2003; Frank,
2009). Controlling nonstructural carbohydrate intake and the glycemic response to feeds
is paramount to managing equine metabolic disorders.
Glycemic Response
Glycemic response occurs as the body’s goal is to maintain a safe level of blood
glucose. The horses’ normal level is between 72 to 114 mg/dl of blood. After a meal is
consumed, the gut breaks down the carbohydrate and starch down into simple sugars. The
simple sugars are then absorbed into the blood. Blood glucose increases while absorption
rate exceeds clearance. Pancreatic β cells detect a rise in blood glucose and produce
insulin in response, causing a pronounced rise in blood insulin. Insulin then facilitates the

7
uptake of glucose into muscle and liver cells where it is converted into glycogen and
stored. The uptake of glucose causes serum levels of glucose to decrease and insulin
follows this pattern. The amount blood glucose and insulin rises varies dramatically and
depends on the food consumed.
Nonstructural Carbohydrate Affects the Glycemic Index
The glycemic index was created in the 1980s for the use in human nutrition. It
was a method to classify different foods by their potential to raise blood glucose levels,
which cannot be predicted by chemical analysis of the food. As defined by the Food and
Agriculture Organization and World Health Organization, the glycemic index of a food is
the incremental area under the blood glucose response curve when administered a 50 g
carbohydrate portion of a test food. The glycemic index of the test food is then expressed
as a percentage of the blood glucose response curve of a standard food (FAO/WHO,
1998).
This description entails that foods with high glycemic indices produce higher peaks and
overall blood glucose response than foods with a low glycemic index (Jenkins, 1981).
Foods with a low glycemic index elevate blood glucose less or at a slower rate. The
glycemic index is calculated as a percent of a response when compared to a standard
food, which is assigned a glycemic index of 100. The standard food used to evaluate the
glycemic response in human studies is most commonly white bread (FAO/WHO, 1998).
Horse research has frequently used oats or corn as a standard food of comparison (Jose-
Cunilleras et al., 2004; Rodiek and Stull, 2005). Like human glycemic index, equine

8
research has divided horse feed glycemic indices into three groups; high (> 70), medium
(55 to 69), and low (< 55) (Kronfeld et al., 2004).
Compared to glycemic index, the glycemic load has been defined as the glycemic
index multiplied the amount of carbohydrate available in the portion of the food. The
glycemic load is used to quantify the overall glycemic effect using quantity and quality of
carbohydrate. A low glycemic load can be obtained through decreasing the total
carbohydrates consumed by feeding smaller meals, or by reducing glycemic index of the
carbohydrates consumed by choosing feeds with a low glycemic index (Vervuert, 2006).
There are three major factors where glycemic response is influenced differently
humans when compared to horses. First there are carbohydrates that are fermentable and
accessible to equines but not humans, and these fermentable carbohydrates may affect
glycemic response. Secondly when horses consume meals with large amounts of
nonstructural carbohydrate, digestive disturbance can occur. These disturbances are cause
by the capacity of the small intestine being overwhelmed, thus pushing the excess
carbohydrate load to the hindgut where it is rapidly fermented. Rapid fermentation of
nonstructural carbohydrates yield primarily lactic acid, which in turn lowers the pH of the
colon causing disturbance of the bacterial population, potentially leading to colic,
osmotic diarrhea or laminitis. Lastly, humans consuming fructose have smaller serum
insulin concentrations as compared to consuming glucose, a response not noted in horses
(Bullimore et al, 2000; Vervuert et al. 2004).
Variability in horse glycemic index research has created difficulties when
comparing published results. Researchers may compare feeds to different standardized

9
feeds (oats or corn) or different amounts of feeds (Jose-Cunilleras et al., 2004; Rodiek
and Stull, 2005; Pagan, 1999a). The amount of starch consumed, the feed source, and the
processing of the feed source alters the breadth and scope of the postprandial blood
glucose response to a meal.
Source of Starch
Rodiek et al. (2005) evaluated ten common horse feeds and their glycemic
response. During this study oats were set as the standard feed and assigned a glycemic
index of 100. All ten samples were fed in isocaloric amounts, at 4.0 MCal DE. The
results showed sweet feed, corn, jockey oats, and oats were all considered high on the
glycemic index, while beet pulp, alfalfa, rice bran, and soy bean hulls were all considered
low glycemic index. Both barley and wheat bran were in the middle, but not significantly
different than feeds in the high and low groups (Rodiek, 2005). In order for the feeds to
be evaluated at the same DE, the weights of the meals varied from 1.18 to 2.36 kg. In
other equine glycemic index research, glucose concentration time to peak increased by 45
minutes when increasing the amount fed from 0.75 to 1.5 kg (Pagan et al., 1999b). The
large variation in meal size may alter the glycemic response however, in order to evaluate
the same quantity of starch among samples the weights had to differ. Another likely
cause in variation is the time of feed consumption, which ranged from 15 to 300 minutes
for individual horses. Furthermore there was feed refusal for low glycemic responsive
feeds. The values of feed refusal rates were 14% soy hulls, 31% rice bran, and 37% beet
pulp. Regardless of the variation these results were similar to glycemic index values

10
compiled by Kronfeld et. al., (2004). The difference is Kronfeld et al.,’s interpretation of
the high, medium, and low values of the glycemic response; that is, feeds with high
glycemic index are greater than 70; feeds with medium glycemic indexs are in the range
of 50 to70; and feeds with glycemic indexes less than 50 were considered low (Kronfeld
et. al., 2004).

11
Figure 1. (Rodiek and Stull, 2005) mean glycemic indices of 10 horse feeds.
12
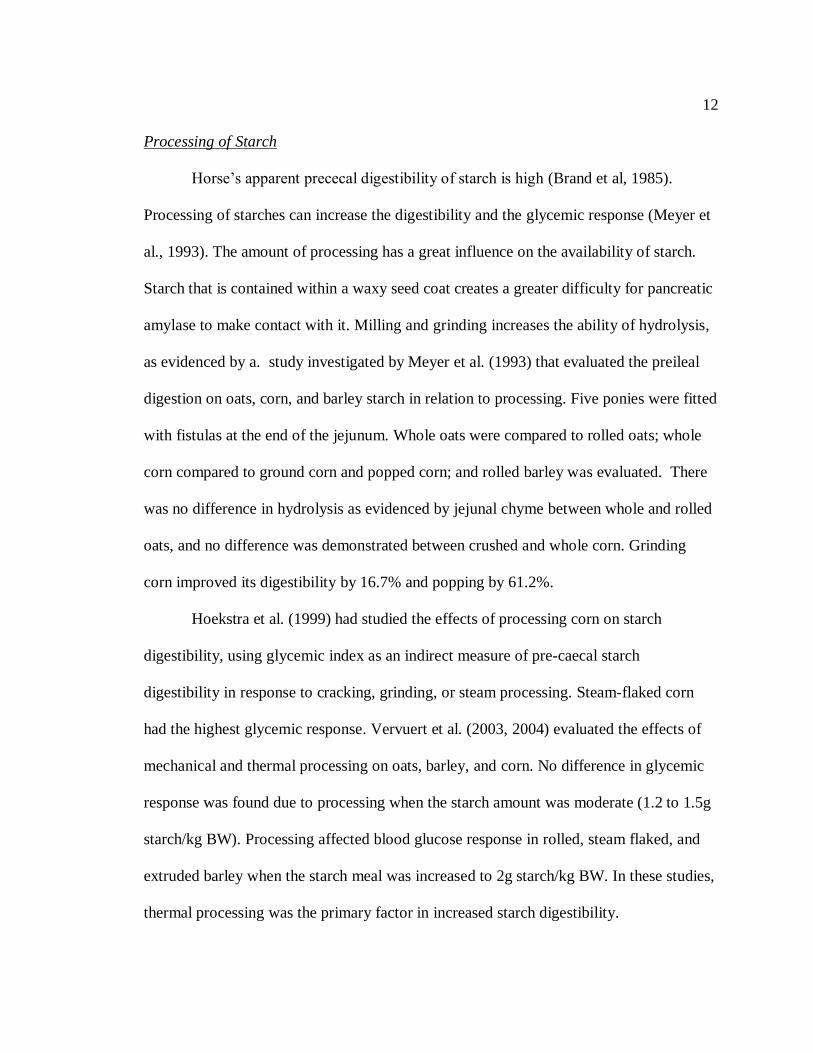
Processing of Starch
Horse’s apparent prececal digestibility of starch is high (Brand et al, 1985).
Processing of starches can increase the digestibility and the glycemic response (Meyer et
al., 1993). The amount of processing has a great influence on the availability of starch.
Starch that is contained within a waxy seed coat creates a greater difficulty for pancreatic
amylase to make contact with it. Milling and grinding increases the ability of hydrolysis,
as evidenced by a. study investigated by Meyer et al. (1993) that evaluated the preileal
digestion on oats, corn, and barley starch in relation to processing. Five ponies were fitted
with fistulas at the end of the jejunum. Whole oats were compared to rolled oats; whole
corn compared to ground corn and popped corn; and rolled barley was evaluated. There
was no difference in hydrolysis as evidenced by jejunal chyme between whole and rolled
oats, and no difference was demonstrated between crushed and whole corn. Grinding
corn improved its digestibility by 16.7% and popping by 61.2%.
Hoekstra et al. (1999) had studied the effects of processing corn on starch
digestibility, using glycemic index as an indirect measure of pre-caecal starch
digestibility in response to cracking, grinding, or steam processing. Steam-flaked corn
had the highest glycemic response. Vervuert et al. (2003, 2004) evaluated the effects of
mechanical and thermal processing on oats, barley, and corn. No difference in glycemic
response was found due to processing when the starch amount was moderate (1.2 to 1.5g
starch/kg BW). Processing affected blood glucose response in rolled, steam flaked, and
extruded barley when the starch meal was increased to 2g starch/kg BW. In these studies,
thermal processing was the primary factor in increased starch digestibility.

13
Figure 2. Effect of processing on the Glycemic Index of barley. Adapted from Vervuert
et al. (2003).

14
Amount of Starch
The next factor that influences the glycemic response and starch digestibility is
the amount of starch consumed. Vervuert et al. (2009) studied the effect of feeding
increasing quantities of starch on the glycemic and insulinaemic responses. During this
study six quantities of starch were evaluated including 0.3, 0.6, 0.8, 1.1, 1.4, and
2gstarch/ kg body weight. The feed used was a commercial compounded feed containing
oats, wheat, corn, and barley as starch sources. There was a significant increase in serum
glucose when starch intake exceeded 1.1g /kg body weight. The glycemic index for
starch intakes between 1.1 and 2.0 g starch/kg body weight were not different, while
there was a difference in meal sizes varying from 0.45 to 3.1 kg dry matter, suggesting
that glycemic index may reach a maximal response, as meal sizes larger than 1.1 g
starch/kg body weight did not appear to continue influence the glycemic index (Vervuert
et al., 2009).

15
Figure 3. Postprandial serum glucose concentrations increase with increasing amounts of
starch (Vervuert, 2009).

16
Mixed Diets
Generally meals are not made of one food in isolation but a complex mixture of
feeds. The glycemic index of mixed meals is difficult to predict, as the glycemic indices
of mixed meals are not linear. Forage has a large effect the digestibility and absorption of
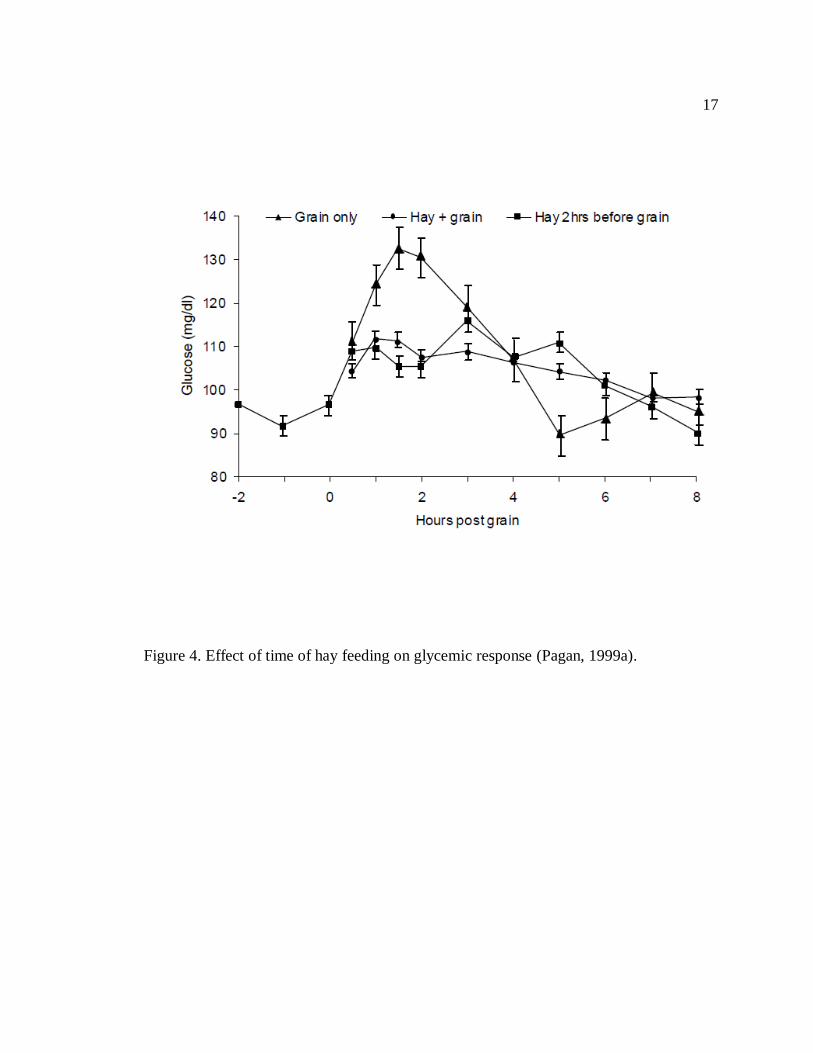
carbohydrates in the foregut. Research investigated by Pagan et al. (1999a) studied the
effect of time of hay feeding, using glycemic response as an indicator of prececal starch
digestibility. The treatments included feeding horses hay four hours after grain intake,
feeding hay two hours before grain intake, and feeding hay and grain at the same time.
Feeding hay at the same time or two hours before the grain significantly decreased the
glycemic response.
Rate of gastric empting plays a huge role in understanding why meal size and the
addition of fat and fiber affect the glycemic index. Larger meal size and higher starch
content have been linked to slower gastric empting in horses (Métayer et al. 2004).
Human research has demonstrated dietary fat to slow gastric empting, and with the
release of gut hormones, glucose clearance increases (Thorne et al., 1983). Similar effects
of added dietary fat on the lowering of glycemic index have been demonstrated in horses
(Stull and Rodiek, 1988), attributed to an increased insulin response and more rapid
glucose clearance (Veruert, 2006).
17
Figure 4. Effect of time of hay feeding on glycemic response (Pagan, 1999a).

18
Challenges with High Glycemic Index Feeds in Horses
Many adverse equine conditions are exaggerated with a diet containing a high
glycemic load. Previously explained in this review, the conditions caused may include
offsetting bacterial populations in the hind gut. These populations are extremely
important to maintain fiber fermentation. Furthermore large amounts of starch digestion
and a changed bacterial population can also lead to hind gut acidosis. Like previously
mentioned fiber fermenting bacteria prefer a pH of greater than six and bacterial
populations in general prefer a pH greater than five. Low pH in the hind gut irritates the
colon lining and inhibits efficient absorption (Clarke et al., 1990). Simple sugar rich diets
in horses have been associated as a risk factor insulin resistance. Horses with metabolic
syndrome and insulin resistance demonstrate a greater glycemic response when compared
to horses that do not have the condition. Common management practices work to lower
the glycemic load, which can be accomplished by lowering the glycemic index of the
foods consumed or lowering the quantity of hydrolysable carbohydrates.
Grass Hay vs. Legume Hay and the Glycemic Response
Forage is a main staple in the horse’s diet, and horse owners provide it though
pasture or hay. Common legumes used as forage are alfalfa and clover. Many grass
species are used in horse diets including orchardgrass, timothy, Kentucky bluegrass, and
tall fescue. Forages all contain a nonstructural carbohydrate including simple sugars,
starches, and fructans; and a structural carbohydrate including cell wall components and
lignin. Both the nonstructural carbohydrates and the strutural carbohydrates provide the

19
energy base of forages utilized by horses. The simple sugars and starch can be digested
by endogenous enzymes in the small intestine; however the cell wall carbohydrates and
fructans cannot be digested in the foregut. The carbohydrates that undergo enzymatic
hydrolysis contain a α-1,4 or α-1,6 linkages. These carbohydrates include disaccharides,
starch, and some oligosaccharides. Horse enzymes cannot cleave carbohydrates
containing β-1,4 linkages. Carbohydrates including these β-1,4 linkages include cellulose,
hemicelluloses, lignocelluloses, fructans, galactans, and soluble fibers. Due to β-1,4
linkages not being hydrolyzed, they bypass the small intestine and are broken down by
microbial fermentation in the hindgut (NRC,2007). Digestion of hydrolysable
carbohydrates can produce a large spike in blood glucose and insulin response. The
carbohydrates that are fermented do not produce a pronounced blood glucose spike
(Harris, 2009) The major storage carbohydrate of grass and legume seeds, in addition to
vegetative tissues of legumes and warm season grasses, is starch (Chatterton et al., 1989).
However cool season grass vegetative tissues store their carbohydrates as fructans
(Ojima, K., and T. Isawa. 1968). Cool season grasses contain up to 50 to 60% cellulose,
30 to 50% hemicellulose, and 2 to 4% pectin (Longland et al.,1995). Legumes contain up
to 30 to 50% cellulose, 25 to 30% hemicellulose, and up to 30% pectin (Nordkvist and
Åman, 1986). The differences in pectin makes legumes such as alfalfa a highly soluble
fiber source. In addition to these differences, mid-maturity cool season grass hays contain
13.3% protein and mid-maturity legume hays contain 20.8% protein. Legumes are
generally higher in calcium, potassium, magnesium, copper, zinc, iron, and cobalt than
grasses (NRC, 2007). The differences between legumes and grasses cause horses to

20
digest them differently and create different levels of glycemic response. Horses
consuming alfalfa produce a more pronounced glycemic index than those consuming
grass due to the higher nonstructural carbohydrates and less cellulose and hemicelluloses
(Rodiek and Stull, 2005).
Plant carbohydrate varies greatly between plant type (variety and species) stage of
growth, growth conditions, temperature, rainfall sunlight hours and intensity, and any
stressors put on the plant. Typically the more immature the plant, the higher the fructan
and starch content. The growth stage provides the plant with lots of stored energy, and
the time of the year the plants are immature also plays a huge role. The spring and early
summer months provide an abundance of sunlight, rain, and ideal temperatures. Plant
stressors such as frost or bright cold days cause the plant to produce excess energy. While
grass or legumes undergoing flowering or seeding may be high in fructans and starch,
plants that have already undergone these processes tend to be lower in fructan and starch.
The more mature the plant, the less excess energy it stores, and the more indigestible
fiber it contains (King et al., 2004). These environmental factors create a great variation
in plant carbohydrate.
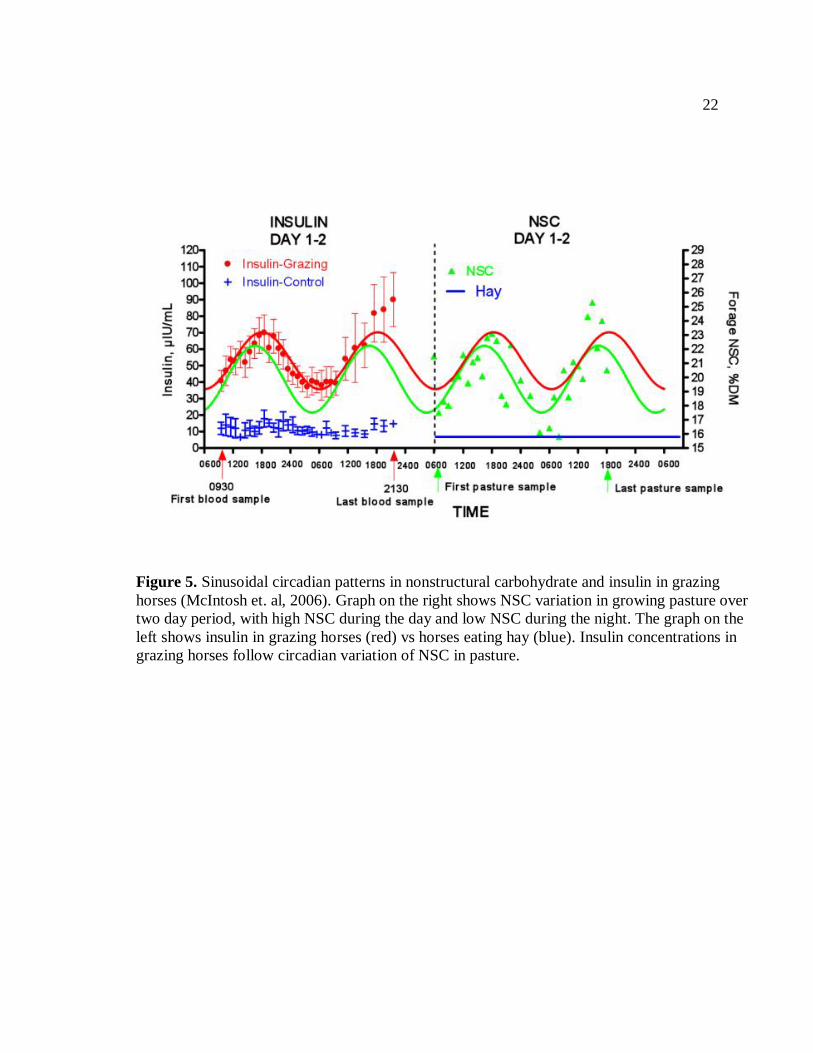
The circadian and seasonal variability of cool season grass (Max-Q tall fescue)
was evaluated by McIntosh (2006) during the months of April, May, August, October,
and January of the following year. Large variation in nonstructural carbohydrates in the
pasture occurred within hours, days and seasons. Nonstructural carbohydrate in cool
season grass pasture was lowest (17.6 ± 0.3%) during the morning and highest by late
afternoon (22.2 ±0.3%). April provided the pasture with the highest nonstructural

21
carbohydrate content due to its ambient temperature, amount of sunlight, and humidity.
Grazing horses demonstrated higher plasma lactate levels and lower fecal pH when
compared to control horses being fed mix grass hay. Furthermore, McIntosh (2006) found
a link between forage nonstructural carbohydrate content and alterations in glucose and
insulin concentrations (Figure 5). These carbohydrates are stable in hay, making
environmental factors that alter nonstructural carbohydrates and the timing of making hay
important to feeding horses with sugar sensitivities
22
Figure 5. Sinusoidal circadian patterns in nonstructural carbohydrate and insulin in grazing
horses (McIntosh et. al, 2006). Graph on the right shows NSC variation in growing pasture over
two day period, with high NSC during the day and low NSC during the night. The graph on the
left shows insulin in grazing horses (red) vs horses eating hay (blue). Insulin concentrations in
grazing horses follow circadian variation of NSC in pasture.
23
Hay Soaking
Soaking hay affects dry matter loss and fructan removal in immature orchard
grass and alfalfa hay, based on water temperature and soaking time (Martinson et al.,
2011). Hays were soaked for 15, 30, 60 min or 12 hour time intervals and in warm or
cold water. Water temperature did not have a significant effect on soaking times except
during the 15 and 30 minute soaks. Dry matter loss was not significant until 12 hours of
soaking all hays except for immature orchard grass, which had significant DM loss within
at 1 hour of soaking in warm water. All time intervals greater than 15 minutes for all hay
except the mature alfalfa hay exhibited greater loss in nonstructural carbohydrates than
the control unsoaked hay. Both alfalfa hays were below the recommended 10%
nonstructural carbohydrate recommendation (Borgia et al., 2011) but also had a
significant loss of nonstructural carbohydrate after a 15 min soak in warm and cold water.
Before the trials the mature orchard grass contained 14.3% nonstructural carbohydrates
and the immature orchard grass contained 13.8% nonstructural carbohydrates. Mature
orchard grass was below the recommended 10% nonstructural carbohydrates within 15
minute of soaking in warm water (9.2%) and 30 minutes of soaking in cold water (9.5%).
Soaking the mature alfalfa and orchard grass and immature orchard grass for 12 hours
produced the largest loss of nonstructural carbohydrate, but recommended levels of
nonstructural carbohydrate for metabolically diseased horses was met within a hour of
soaking (Martinson et al., 2011).
A study by Longland et al. (2011) also evaluated time of soaking on nonstructural
carbohydrates loss. Nine different meadow hays varying in water soluble carbohydrate

24
(WSC) were soaked in cold water 20 min, 40 min, three hours, and 16 hours. A 2 to 9%
loss of WSC was noted within 20 minutes of soaking. For a majority of the hays, WSC
increasingly leached out as time increased. After 16 hours of soaking in water, 9 to 54%
of the WSC had diffused out. The results of the study give the impression of hay soaking
to be a viable practice in lowering nonstructural carbohydrates for horses with sugar
sensitivities. It was noted, however, that soaking for longer periods of time may leach
enough nutrients out excessively, to the point that the horse’s nutrient requirements may
not be met (Longland et al., 2011).
Cottrell et al. (2005) evaluated the glycemic and insulin responses to horses being
fed soaked hay with high NSC. The study used 12 Belgian X Quarter horse weanlings,
aging between four to five months old. Horses were paired according to body size then
randomly assigned to one of two treatments. The research design was a simple cross over
design. The two trials included a single 0.91kg meal of 12% NSC hay or a single meal of
22% NSC hay fed at 0.3% body weight. Both trails were fed dry and soaked for 30
minutes. Findings included fecal pH decrease after 36 hours during the 12% NSC trial
but not during the 22% NSC trial. Plasma glucose AUC decreased during the trials. Peak
glucose was lower during the 22% NSC trial. Lastly peak insulin and AUC were both
decreased during both trials. Further research is needed to evaluate the glycemic and
insulin responses in mature horses consuming long stem hay with a moderate NSC
content.

25
CHAPTER II: THE EFFECT OF DRY VERSUS SOAKED HAY
ON GLYCEMIC RESPONSE IN HORSES
Low glycemic feeds and forages are recommended in the management of horses
with equine metabolic diseases. Research has demonstrated the exacerbating effects of
high nonstructural carbohydrates loads have on the horse and how they can further
worsen the symptoms of a metabolically disabled horse. There is limited research that has
evaluated reducing chemical composition of nonstructural carbohydrate (starches, sugars,
fructans) in feeds and forages, rather than determining the actual glycemic impact of
dietary components. Veterinarians and horse nutritionists recommend reducing
nonstructural carbohydrate content of the forage portion of the equine diet by soaking hay
prior to feeding. This recommendation arose from previous reports of reducing
nonstructural carbohydrate content in soaked hay compared to dry hay from Martinson et.
al.(2011) and Longland et al. (2011). Although soaked hay, compared to dry hay, has
lower nonstructural carbohydrate as measured chemically in the laboratory, to date,
research has not been found that examines the glycemic impact of soaked versus dry hay.
The goal of this study is to examine the glycemic response in horses fed soaked versus
dry hay in order to determine if the common recommendation of soaking hay has a
physiological effect in horses.

26
Materials and Methods
Twelve healthy horses aged 17 ± 4 yr, weighing 549 ± 51 kg, with BCS 5 to 6
were randomly assigned into two groups and one of four hay diets in a 2x2 factorial
design. Four hay diets were evaluated for effect on glycemic response: dry prairiegrass
hay, soaked prairiegrass hay , dry alfalfa hay , and soaked alfalfa hay .
For the hay glycemic response test, horses were placed in 9.3 m2 stalls and offered
water but no hay or grain for 10 h prior to the onset of feeding hay for the study.
Remaining hay and grain was cleaned out of the stalls at 2200 h the night before the test.
Horses were weighed using an electronic scale, and the hay diet allotment for each horse
was measured at 0.5 % of BW on a dry basis.
Hay to be soaked was placed in a hay net and then soaked in 10 to 12 gallons of
cold water for 60 min prior to the beginning of each feeding, following procedures
recommended by Martinson et al. (2011). After 60 min of soaking, each wet hay diet was
raised from the soak water in the hay net and drained until water stopped running out of
the hay. The wet hay was removed from the hay net, and hay for each horse (wet or dry)
was placed in an elevated corner hay rack, 1.4 m from the floor. Early completion of
meals or cessation of eating bouts were recorded, as well as renewed periods of eating.
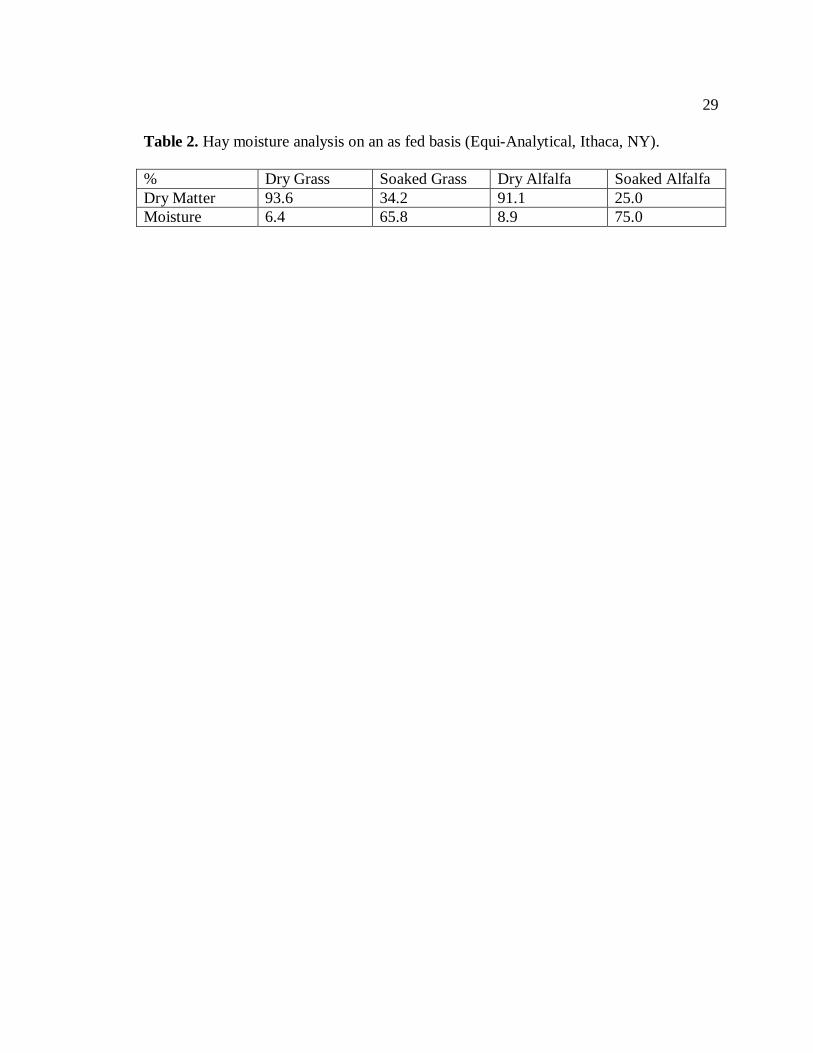
Nutrient profiles of the hay are shown in Table 1 and moisture contents are shown in
Table 2.
Hay diets were offered to the horses beginning at 0800 h on the morning of the
glycemic response trials in order to avoid any potential effect of diurnal variation on
glucose response. Blood samples were collected prior to offering hay, and at 30, 60, 90,

27
120, 180, 240, and 300 min after hay feeding began. Samples were collected into
heparinized tubes, placed immediately in ice, centrifuged, and plasma aliquots frozen at -
4°C pending analysis. Plasma glucose concentrations were analyzed using a colorimetric
assay (Wako Diagnostics Auto Glucose kit, Wako Chemicals USA Inc., Richmond, VA).
The magnitude of the incremental area under the curve of postprandial glucose response
to the meal in each horse was calculated using graphical approximation (Slide Write Plus
Ver. 7, Advanced Graphics Software, Inc., Rancho Santa Fe, CA).
Data were tested for normality and analyzed using a mixed model with repeated
measures (SAS Inst. Ver 9.2, Inc., Cary, NC) with hay type and treatment (dry vs wet) as
main effects, horse as the subject, and sample time as the repeated effect.

28
Table 1. Hay analysis based on percent dry matter (Equi-Analytical, Ithaca, NY).
% Dry Grass Soaked
Grass
Dry Alfalfa Soaked
Alfalfa
Crude Protein 6.0 7.2 16.9 23.8
Acid Detergent Fiber (ADF) 39.1 39.5 39.0 38.0
Neutral Detergent Fiber (aNDF) 65.7 69.1 49.3 45.1
Water Soluble Carbohydrates
(WSC)
9.5 6.8 8.8 6.6
Ethanol Soluble Carbohydrates
(Simple Sugars)
6.4 4.4 6.7 5.3
Non- Fiber Carbohydrates (NFC) 19.2 14.6 21.7 19.1
Starch 1.2 0.6 0.9 1.6
Calcium 0.60 0.50 1.24 1.44
Phosphorus 0.08 0.08 0.19 0.19
Magnesium 0.21 0.13 0.21 0.18
Potassium 0.92 0.59 1.57 0.81
Sodium 0.061 0.002 0.081 0.031
29
Table 2. Hay moisture analysis on an as fed basis (Equi-Analytical, Ithaca, NY).
% Dry Grass Soaked Grass Dry Alfalfa Soaked Alfalfa
Dry Matter 93.6 34.2 91.1 25.0
Moisture 6.4 65.8 8.9 75.0

30
Results
Plasma glucose concentrations over time were higher (P = 0.001) in horses fed
alfalfa compared to grass hay, while no difference was identified in horses fed dry
vssoaked grass (P = 0.99) or dry vs soaked alfalfa (P = 0.82). The AUC of glucose
response was higher (P =0.0004) in horses fed alfalfa compared to grass hay. There was
no difference in AUC of glucose response in horses fed dry grass hay as compared to
soaked grass hay (2780 ± 563 vs 1271 ± 465 ug*dL-1
*min-1
, respectively; P = 0.26).
There was also no difference in AUC of glucose response in horses fed dry alfalfa as
compared to soaked alfalfa hay (5156 ± 905 vs 3347 ± 473 ug*dL-1
*min-1
, respectively;
P = 0.13). While type of hay fed influenced glucose response and glucose AUC, no
difference in physiological glucose response or glucose AUC was observed in healthy
horses fed dry vs soaked hay. Additional research is needed to determine if soaking hay
has physiological merit in horses with metabolic issues sensitive to nonstructural
carbohydrate.

31
Discussion
Type of hay fed influenced glucose response and glucose area under the curve. No
difference in physiological glucose response or glucose area under the curve was
observed in healthy horses fed dry vs. soaked hay. However, results may vary with
diseased horses. Previous research (Rodiek, 2004) evaluating the effect of cool season
grasses, warm season grasses, and alfalfa on the glycemic index in the horse were similar
to results from this study regarding the type of hay. The current study found no
significant difference between soaked and unsoaked hay in either the prairiegrass or
alfalfa hay treatments, these results differ from Cottrell et al., (2005). Variation in
methods and materials used between Cottrell et al., (2005) may be the cause for different
results. Cottrell et al. (2005) used chopped hay as compared to this study using long stem
hays. The differences in processing changes exposed surface area. The smaller surface
area in chopped hay may have caused differences in digestibility and the leaching of
nonstructural carbohydrates during the soaking period. Furthermore, Cottrell et al., 2005
used 4 to 5 month old draft light breed horse cross weanlings, as compared to our study
using mature horses. Differences in age of horses may cause a difference in digestibility
and insulin sensitivities to feedstuffs consumed. Lastly, Cottrell et al., 2005 used hays
containing high levels of nonstructural carbohydrates. The hays they used contained 12
and 22% nonstructural carbohydrates and the hays we used had moderate levels of
nonstructural carbohydrates. These differences in nonstructural carbohydrate content may
have caused glycemic index differences.

32
Conclusion
Owners of healthy horses do not need to soak hay. It is unknown if soaking hay
holds merit for diseased horses. Type of hay fed influenced glucose response and glucose
AUC. No difference in physiological glucose response or glucose AUC was observed in
healthy horses fed dry vs. soaked hay.

33
Figure 6. Postprandial plasma glucose response after feeding different hays. There was
no effect of soaking but glucose response to alfalfa hay was higher than grass hay (P =
0.041).
0 60 120 180 240 300
TIME, min
70
80
90
100
110
120
130
140
150
PL
AS
MA
GL
UC
OS
E, u
g/d
L
Dry Alfalfa
Soaked Alfalfa
Dry Grass
Soaked Grass

34
Figure 7. Incremental area under the curve (AUC) of plasma glucose response to feeding
dry vs soaked alfalfa or grass hay. There was no effect of soaking but AUC for alfalfa
hay was higher than grass hay (P = 0.0004).
Alfalfa Grass0
1000
2000
3000
4000
5000
6000
7000
AU
C, u
g*d
L-1*m
in-1
a
ab
b
b
D R Y
SOAKED

35
LITERATURE CITED
Annandale, E. J., S. J. Valberg, J. R. Mickelson, and E. R. Seaquist. 2004. Insulin
sensitivity and skeletal muscle glucose transport in horses with equine
polysaccharide storage myopathy. Neuromuscul. Disord. 14:666–74.
Argenzio, R. A, M. Southworth, and C. E. Stevens. 1974. Sites of organic acid
production and absorption in the equine gastrointestinal tract. Am J Physiol.
226:1043–1050.
Blaxter, K. 1989. Energy Metabolism in Animals and Man. Cambridge University Press,
New York.
Borgia L., S. Valberg, M. McCue, K. Watts, and J. Pagan. 2011. Glycaemic and
insulinaemic responses to feeding hay with different non-structural carbohydrate
content in control and polysaccharide storage myopathy-affected horses. J. Anim.
Physiol. Anim. Nutr. 95:798–807.
Brand J. C., P. L. Nickolson, A. W. Thorburn, and A. S. Truswell. 1985. Food processing
and the glycemic index. Am. J. Clin. Nutr. 42:1192–1196.
Brosnahan, S A. Brooks, and D F. Antczak. 2010. Equine clinical genomics: a clinician’s
primer.Equine Vet J. 42:658–670.
Bullimore, S.R., J. D. Pagan, P. A. Harris, K. E. Hoekstra, K. A. Roose, S. C. Gardner,
and R. J. Geor. 2000. Carbohydrate supplementation of horses during endurance
exercise: comparison of fructose and glucose. J. Nutr. 120:1760–1765.
Chatterton, N. J., P. A. Harrison, J. H. Bennett, and K. H. Asay. 1989. Carbohydrate
partitioning in 185 accessions of graminae grown under warm temperatures. J.
Plant Physiol. 143:169–179.
Clarke, L.L., M. C. Roberts, and R. A. Argenzio. 1990. Feeding and digestive problems
in horses. Vet. Clin. North Am. Equine. Pract. 6:433–451.
Cohen, N. D., P. G. Gibbs, and A. M. Woods. 1999. Dietary and other management
factors associated with colic in horses. J. Am. Vet. Med. Assoc. 215:53−60.
Cottrell E, K. Watts, and S. Ralston. 2005. Soluble sugar content and glucose/insulin
responses can be reduced by soaking hay in water. In: Proc. Equine Nutr. Phys.
Soc., Lansing, MI. p. 293–298.

36
De La Corte, F. D., S. J. Valberg, J. M. MacLeay, S. E. Williamson, and J. R. Mickelson.
1999. Glucose uptake in horses with polysaccharide storage myopathy. Am. J.
Vet. Res. 60:458–462.
FAO. 1998. Carbohydrates in human nutrition. FAO Food and nutrition paper 66. Joint
FAO/WHO Expert Consultation, Rome.
http://www.fao.org/docrep/w8079e/w8079e00.htm (Accessed 5 March 2015.)
Firshman, A., S. J. Valberg, T. L. Karges, L. E. Benedict, E. J. Annandale, and E. R.
Seaquist, 2005. Serum creatine kinase response to exercise during dexamethasone
induced insulin resistance in Quarter Horses with polysaccharide storage
myopathy. Am. J. Vet. Res. 66:1718–1723.
Frank N. 2009. Equine metabolic syndrome. J. Equine Vet. Sci. 29:259–267.
French, K. R., and C. C. Pollitt. 2004. Equine laminitis: loss of hemidesmosomes in hoof
secondary epidermal lamellae correlates to dose in an oligofructose induction
model: an ultrastructural study. Equine Vet. J. 36:230-235.
Garner, H. E., D. P. Hutcheson, J.R. Garner, C. Coffman, and A.W. Hahn. 1977. Lactic
acidosis. A factor associated with equine laminitis. J. Anim. Sci. 45:1037–41.
Harris, P. and R. J. Geor. 2009. Primer on dietary carbohydrates and utility of the
glycemic index in equine nutrition. Vet. Clin. N. Amer. Equine Prac. 25:23–37.
Hoekstra, K.E., K. Newman, M. A. P. Kennedy, J. D. Pagan. 1999. Effect of corn
processing on glycemic responses in horses. In: Proc. 16th Equine Nutr. Phys.
Symp., Raleigh, NC. p. 144–148.
Hoffman, R. M., J. A. Wilson, D. S. Kronfeld, W. L. Cooper, L. A. Lawrence, D. Sklan,
and P. A. Harris. 2001. Hydrolyzable carbohydrates in pasture, hay, and horse
feeds: direct assay and seasonal variation. J. Anim. Sci. 79:500–506.
Jenkins, D. J., T. M. Wolever, R. M. Taylor, H. Barker, H. Fielden, J. M. Baldwin, A. C.
Bowling, H. C. Newman, A. L. Jenkins, and D. V. Goff. 1981. Glycemic index of
foods: a physiological basis for carbohydrate exchange. Am. J. Clin. Nutr.
34:362–366.
Johnson, P. J, C. E. Wiedmeyer, and K. S. Ganjam. 2012. Diabetes, insulin resistance,
and metabolic syndrome in horses. J. Diabetes Sci. Tech. 6:534–540.
Jose-Cunilleras. E., L. E. Taylor, and K. W. Hinchcliff. 2004. Glycemic index of cracked
corn, oat groats and rolled barley in horses. J. Anim. Sci. 82:2623–2629.

37
Kahn, C. R. 1978. Insulin resistance, insulin insensitivity, and insulin unresponsiveness: a
necessary distinction. Metab. Clin. Exp. 27:1893–1902.
King, C., and R. A. Mansmann. 2004. Preventing laminitis in horses: dietary strategies
for horse owners. Clin. Tech. Equine Pract. 3:96–102.
Kronfeld, D. S. 1996. Dietary fat affects heat production and other variables of equine
performance, especially under hot and humid conditions. Equine Vet. J.
22:24−34.
Kronfeld, D. S., and P. A. Harris. 2003. Equine grain-associated disorders (EGAD).
Compend. Vet. Pract. 25:974–982.
Kronfeld, D. 2004. Glycemic indices, glycemic loads, and glycemic dietetics. J. Equine
Vet. Sci. 9:399–404.
Longland, A. C., C. Barfoot, and P. A. Harris. 2011. Effects of soaking on the water-
soluble carbohydrate and crude protein content of hay. Vet. Rec. 168:618–623.
Longland, A. C., A. J. Cairns, and M. O. Humphreys. 1999. Seasonal and diurnal changes
in fructan concentration in Lolium perenne: implications for the grazing
management of equines pre-disposed to laminitis. In: Proc. 16th Equine Nutr.
Phys. Symp., Raleigh, NC. p. 258–259.
Longland, A. C., R. Pilgrim, and I. J. Jones. 1995. Comparison of oven drying vs. freeze
drying on the analysis of non-starch polysaccharides in gramminaceous and
leguminous forages. In: Proc. Br. Soc. Anim. Sci. p. 60.
Martinson, K. L., M. Hathaway, H. Jung, and C. Sheaffer. 2012. The effect of soaking on
protein and mineral loss in orchardgrass and alfalfa hay. J. Equine Vet. Sci. 32:
776–782.
Martinson K., H. Jung, M. Hathaway, and C. Sheaffer. 2011. The effect of soaking on
carbohydrate removal and dry matter loss in orchardgrass and alfalfa hays. J.
Equine Vet. Sci. 32:332–338.
McIntosh, B. 2006. Circadian and seasonal variation in pasture nonstructural
carbohydrates and the physiological response of grazing horses. PhD Diss.
Virginia Tech, Blacksburg.

38
Metayer, N., M. Lhöte, A. Bahr, N. D. Cohen, I. Kim, A. J. Roussel, and V. Julliand.
2004. Meal size and starch content affect gastric emptying in horses. Equine Vet
J. 36:436–440.
Meyer, H., S. Radicke, E. Kiengle, S. Wilke, and D. Kleffken. 1993. Investigations on
preileal digestion of oats, corn, and barley starch in relation to grain processing.
In: Proc. 13th Equine Nutr. Phys. Soc., Gainesville, FL, pp 92–97.
Nordkvist, E., and P. Åman. 1986. Changes during growth in anatomical and chemical
composition of in vitro degradability. J. Sci. Feed Agric. 31:1–7.
NRC. 2007. Nutrient Requirements of Horses. 7th
rev. ed. Natl. Acad. Press,
Washington, DC.
Ojima, K., and T. Isawa. 1968. The variation of carbohydrate in various species of
grasses and legumes. Can. J. Bot. 46:1507–1511.
Pagan, J. D. 1999a. Carbohydrates in equine nutrition. World Equine Vet. Review
4:23−31.
Pagan. J. D., P. A. Harris, M. A. P. Kennedy, N. Dacidson, and K. E. Hoekstra. 1999b.
Feed type and intake affect glycemic response in thoroughbred horses. In: Proc.
Equine Nutr. Conf. Feed Manufact., Lexington, KY. p. 147-149.
Pollitt, C. C., M. Kyaw-Tanner, K. R. French, A. W. Van Eps, J. K. Hendrikz, and M.
Daradka. 2003. Equine laminitis. In: Proc. 49th Annual Conv. Am. Assn. Equine
Pract., New Orleans, LA. Document No. P0616.1103 IVIS.
Pollitt C., and M. Visser. 2010. Carbohydrate alimentary overload laminitis. Vet. Clin. of
N. Amer. Equine Pract. 26:65–78.
Potter, G. D., F. F. Arnold, D. D. Householder, D. H. Hansen and K. M. Brown. 1992.
Digestion of starch in the small intestine of the equine. Pferdeheilkunde 1:107–
111.
Radicke, S., E. Kienzle, and H. Meyer. 1991. Preileal apparent digestibility of oats and
corn starch and consequences for caecal metabolism. In: Proc. 12th Equine Nutr.
Phys. Soc. Symp., Calgary, Alberta. p. 43–48.
Ribeiro, W. P., S. J. Valberg, J. D. Pagan, and B. E. Gustavsson. 2004. The effect of
varying dietary starch and fat content on serum creatine kinase activity and
substrate availability in equine polysaccharide storage myopathy. J. Vet. Int. Med.
18:887–894.

39
Rodiek, A.V., and C. L. Stull. 2007. Glycemic index of ten common horse feeds. J.
Equine Vet. Sci. 27:205–211.
Rodiek, A.V., and C. L. Stull. 2005. Glycemic index of common horse feeds. In: Proc.
19th Equine Nutr. Phys. Soc. Symp., Tucson, AZ. p. 153.
Stull C.L., and A. V. Rodiek. 1988. Responses of blood glucose, insulin and cortisol
concentrations to common equine diets. J. Nutr. 118:206–13.
Thorne, M. J., L. U. Thompson, and J. A. Jenkins. 1983. Factors affecting starch
digestibility and the glycaemic response with special reference to legumes. Am. J.
Clin. Nutr. 38:481–488.
Treiber, K. H., R. C. Boston, D. S. Kronfeld, W. B. Staniar, and P. H. Harris. 2005.
Insulin resistance and compensation in Thoroughbred weanlings adapted to high-
glycemic meals. J. Anim. Sci. 83:2357–2364.
USDA. 2000. Lameness and laminitis in US horses. USDA:APHIS:VS, CEAH, National
Animal Health Monitoring System. Fort Collins, CO. #N318.0400.
Vervuert, I., and M. Coenen. 2006. Factors affecting glycaemic index of feeds for horses.
In: Proc. 3rd
European Equine Nutr. Health Congress. Merelbeke, Belgium. p. 1–
9.
Vervuert, I., M. Coenen, and C. Bothe. 2003. Effects of oat processing on the glycaemic
and insulin responses in horses. J. Anim Physiol. 87:96–104.
Vervuert, I., M. Coenen, and C. Bothe. 2004. Effects of corn processing on the glycaemic
and insulinaemic responses in horses. J. Anim Physiol. 88:348–355.
Vervuert, I., M. Coenen, and M. Bichmann. 2004. Comparision of the effects of fructose
and glucose supplementation on metabolic responses in resting and exercising
horses. J. Vet. Med. A Physiol. Pathol. Clin. Med. 51:171–177.
Vervuert, I., K. Voigt, T. Hollands, D. Cuddeford, and M. Coenen. 2009. Effect of
feeding increasing quantities of starch on glycaemic and insulinaemic responses
in healthy horses. Vet. J. 182: 67–72.
Warner, R. G. 1991. Nutritional factors affecting the development of a functional
ruminant–a historical perspective. Proc. Cornell Nutr. Conf. 53:1–12.

40
APPENDICES

41
APPENDIX A: IACUC Approval
7/10/2014
Investigator(s) Name: Rhonda M. Hoffman, Josie Collins, John Haffner, Holly Spooner
Investigator(s) Email: [email protected], [email protected],
[email protected], [email protected]
Protocol Title: “The Effect of Dry versus Soaked Hay on Glycemic Response in Horses”
Protocol Number: 14-013
Dear Investigator,
The MTSU Institutional Animal Use and Care Committee has reviewed your research
proposal identified above and has approved your research in accordance with PHS policy.
Approval is granted for three (3) years. Your study expires 7/10/2017. Please note you
will need to file a Progress Report annually regarding the status of your study and submit
an end-of-project report.
According to MTSU Policy, an investigator is defined as anyone who has contact with
animals for research purposes. Anyone meeting this definition needs to be listed on the
protocol and needs to complete the IACUC training through citiprogram. If you add
investigators to an approved project, please forward an updated list of investigators to the
Office of Compliance before they begin to work on the project.
Any change to the protocol must be submitted to the IACUC before implementing this
change. Any unanticipated harms to subjects or adverse events must be reported to the
Office of Compliance at (615) 494-8918.
Also, all research materials must be retained by the PI or faculty advisor (if the PI is a
student) for at least three (3) years after study completion. Should you have any questions
or need additional information, please do not hesitate to contact me.
Sincerely,
Kellie Hilker
Compliance Officer
615-494-8918