Embed Size (px)
Citation preview

IJER © Serials Publications12(5), 2015: 1647-1669
ISSN: 0972-9380
THE EFFECT OF FREE CASH FLOW, DIVIDENDPOLICY AND GROWTH OPPORTUNITY TODEBT POLICY IN MANUFACTURINGCOMPANYLISTED ON BEI
Abstract: The purpose of this study was to determine the effect of free cash flow to debtpolicy, dividend policy ondebt policyandinfluencegrowthopportunityfordebt policyandtheinfluence offree cash flow, dividend policy and growth opportunity for the debt policy incompanies listed on the Stock Exchange. The strategy used in this study is descriptivestrategies and multiple linear regression. The method used is descriptive research method.The populationin this studyis thatthe companieslisted onthe Stock Exchange in2010-2013,the sample used in this study were selected based on purposive sampling method to obtain asample of15companies. The results of this study indicate that the free cash flow and growthopportunity to have a positive influence on the policy of debt, while the dividend policy hasa negative impact on debt policy. The results of this study also showed that the variables offree cash flow, dividend sand growth opportunity policies have an influence on the debtpolicy.
Keywords: Free Cash Flow, Dividend Policy, Growth Opportunities, Debt Policy
INTRODUCTION
Companies in Indonesia consists of several parts of the industry. Companies withmanufacturing industry is one of the largest industries in Indonesia are able to competein developing the company. These companies are publicly traded company listed onthe Indonesia Stock Exchange.In starting the investment activity, financing policy isneeded here. Funds can come from internal funds and external funds. Selection ofsources of funds which have been the authority of the manager of the company whichhas been entrusted by the shareholders to manage and run the company.
When the manager will invest at least funding needs can be met by attracting newloans (debt). This will reduce conflicts of interest between management and theshareholders. Because the company will distribute a high amount of dividends toshareholders. But the actual decision followed other problems attached to it, namely
* E-mail: [email protected]
1648 Flourien Nurul and Muhammad Iqbal
the emergence of demands from creditors in the form of interest. With the burden ofthis interest, it will have an impact also for shareholders because most of the company’sprofits must first be used to pay loan interest expenses. High and low conflict betweenthe shareholders and lenders are influenced by the growth opportunities of thecompanies that see investment opportunities, The greater the investment opportunitiesof the company, the greater the conflict between the two.
Issues to be addressed in this study are:
1. Is there any influence between free cash flow to debt policy?
2. Is there any influence of dividend policy on debt policy?
3. Is there any influence between the growth opportunity of the debt policy?
4. Is there any influence of free cash flow, dividend policy and growthopportunity of the debt policy together?
The purpose of this study was to determine the effect between free cash flow todebt policy, to determine the effect of dividend policy on debt policy, to determine theeffect of growth opportunity for debt policy and to determine the effect of free cashflow, dividend policy and growth opportunity for the policy Debt in companies listedon the Stock Exchange.
The expected benefits of the research is to be able to apply the knowledge receivedby the researchers during the lecture, assist companies in selecting a debt policy thatwill take the company to meet the objectives of the company itself, and can increaseknowledge about the research with the dependent variable dept until policy is expectedto help to be used as future reference.
LITERATURE REVIEW
Debt Policy
Every company both large and small have debts. Debt is defined as the sacrifice offuture liabilities arising from the present. For reporting purposes, loans are classifiedinto two main types, namely, current debts and long term debt. The debt policy describedecisions taken by management in determining sources of funding. According to SuadHusnan and Enny Pudjiastuti (2004: 70) policy of debt a company can be measured byleverage ratio is the ratio that measures how much the company in using debt.Debt policy can also be seen from the ratio of debt-to-equity ratio is also known asSofyansol vabilitas. According to SyafriHarahap (2011: 303) This solvency ratiodescribes the company’s ability to pay long-term liabilities or obligations if the companyis liquidated.
There are several factors that affect the debt policy, namely: sales stability, assetstructure, elasticity of operations, growth rates, profitability, tax, corporate control,management attitude, the attitude of creditors, market conditions, the internal condition

The Effect of Free Cash Flow, Dividend Policy and Growth Opportunity... 1649
of the company. And there are four theories on debt policy, namely: Agency Theory,Signalling Theory, Packing Order Theory and the Trade-Off Theory.
Free Cash Flow
Free cash flow by Arthur J Keown (2010: 45), “free cash flow or free cash flow is theamount of cash available from operations after investments in working capital andnet operating constant cash. Money assets available for distribution to the owners ofthe company and creditor. Simple meaning of free cash flow in the website snowballs(2012) is the remainder of the calculation of the cash flow generated by a company atthe end of the financial period after paying salaries, production costs, charges, taxesand capital expenditures for business development. The rest is called free cash flow orfree cash flow.From some of the above understanding, it can be concluded that freecash flow is the free cash flow is obtained after use as working capital or investmentsin assets.
Free cash flow likely will lead to the manager’s behavior is wrong and a baddecision is not for the benefit of holders of stock.debt can be used to control the useof excessive free cash flow by manager. Ifcompany issued new debt and use theproceeds to buy back ordinary shares owed, the management is obliged to pay incash to cover this debt. With the existence of this debt, management will work moreefficiently in order to avoid financial failure that would reduce agency costs of freecash flow.
Dividend Policy
According to Donald E. Kieso (2008: 329) is the dividend distribution may take theform of cash, other assets, letter or other evidence that states the company’s debt. Indetermining how much profit to be paid as dividends to shareholders and howmuch should be planted back as retained earnings on the company neededpolicy commonly known as the dividend policy (Rinaldi Siahaan, 2013).Dividend policy has an influence on the level of use of debt an enterprise. Dividendpolicy is a policy that is controversial because: when dividends increased, cash flowfor investors will increase and benefit the investors as well as when enhanceddividends, retained earnings is reinvested and future growth will decline to thedetriment of investors.
So it can be said that the dividend policy is a determination on the part of thecompany regarding the amount of dividend distribution and decision making onthe use of funds for investment dividends other companies or for distribution inwhole / proportion to the holders of stocks dividend.The policy very important forthe company for two reasons. First, payment of dividends may affect the value ofthe company as reflected in the company’s stock price. Second, retained earnings isusually a source of internal funds greatest and most important for the growth of thecompany.
1650 Flourien Nurul and Muhammad Iqbal
RESEARCH PROCEDURES
This research was done by taking data from PT. Indonesian Capital Market ElectronicLibrary (ICaMEL), in the Indonesia Stock Exchange Building is located at Jl. Kav.52-53Sudirman, Jakarta 12190. The data collection and implementation of this research isfor 5 months, namely the month of September 2014 until January 2015.
The strategy used in this study is a research strategy of descriptive statistics andmultiple linear regression.Research methodsused in this research is descriptive researchmethod.
The population in this study are manufacturing companies listed in IndonesiaStock Exchange (BEI) 2010-2013. It is known that the number of manufacturingcompanies that went public on the Stock Exchange and listed on the 2010-2013 year ina row is at least 138 companies were divided into 19 categories of companies based ontheir fields.
As for the selection of the sample used in this study were selected using purposivesampling method. As for the criteria in determining the sample in this research is aManufacturing Company in accordance with the type of classification of IndonesiaCapital Market Directory (ICMD), the Company publishes financial reports in a rowduring the study period and the financial statements ending December 31, the companypublished a report finance the rupiah currency, Listed on the Stock Exchange at leastone year prior to the observation period and successively during the observation periodthe year 2010-2013, a manufacturing company that reported dividend for the year2010-2013. Number of sample was 15 companies, data is as follows:
Sample Data Table
No. Field Code Company Name
1 Ceramics, porcelain and glass AMFG PT. Asahimas Flat Glass Tbk2 Ceramics, porcelain and glass ARNA PT. Arwana Citra MuliaTbk3 Automotive and Components ASII PT. Astra International Tbk4 Automotive and Components AUTO PT. Astra AutopartsTbk5 Animal Feed CPIN PT. Charoen Pokphand Indonesia Tbk6 Chemistry EKAD PT. Ekadharma International Tbk7 Cigarette GGRM PT. GudangGaramTbk8 Food and Drink INDF PT. Indofood SuksesMakmurTbk9 Cement INTP PT. Indocement Tunggal Prakarsa Tbk10 Pharmacy KAEF PT. Kimia FarmaTbk11 Pharmacy KLBF PT. Kalbe FarmaTbk12 Metal and the like LION PT. Lion Metal Works Tbk13 Metal and the like LMSH PT. Lionmesh Prima Tbk14 Cement SMGR PT. Semen Gresik Tbk15 Cosmetic Purposes and Items RT UNVR PT. Unilever Indonesia Tbk
Source : www.idx.co.id

The Effect of Free Cash Flow, Dividend Policy and Growth Opportunity... 1651
The data used in this research is secondary data which includes data on the financialstatements of companies listed on the Stock Exchange in 2010-2013. Here are variablesused in this study:
Dependent Variables
Debt policy
Debt policy is measured by the debt ratio (debt to equity ratio) or on call as well as thesolvency ratio. This ratio shows the ratio of debt and capital. This ratio illustrates theextent to which the owners of capital to cover debts to outside parties. The smallerthis ratio, the better.
Here is the formula:
Debt = Total Debt Total Equity
Independent Variables
(a) Free cash flow
Free cash flow is calculated by using the formula Ross et al. in the journal Tarjo (2003),which was formulated as follows:
FCF it = AKOit - Pmit - NWCit equity
In this case:
FCFit : Free cash flow
AKOit : operating cash flow of the company i in year t
Pmit : Capital expenditures firm i in year t
NWCit : Net working capital the company i in year t
Equity : Equity Company
To calculate their capital expenditure, then use the following formula:
Pm = AT end – At beginning
Specification:
Pm = capital expenditure
ATend = fixed assets end
ATbegining = initial fixed assets
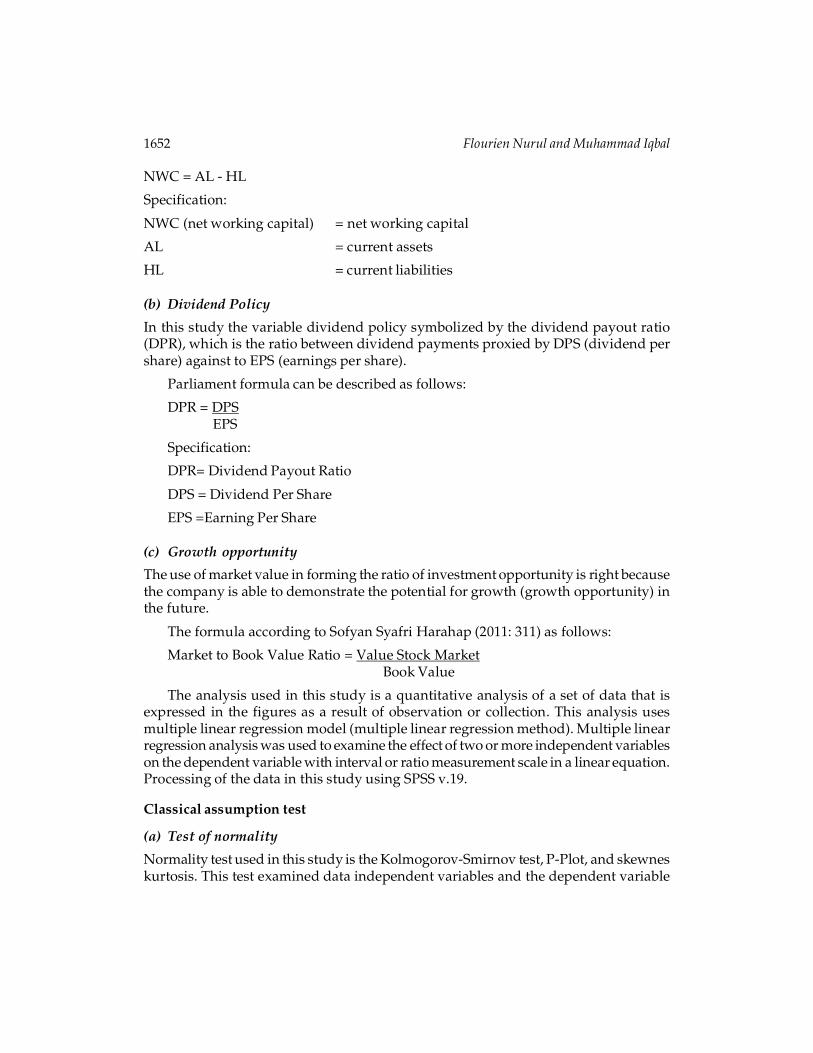
According Wijantini (2012) to calculate the NWC (net working capital) used thefollowing formula:
1652 Flourien Nurul and Muhammad Iqbal
NWC = AL - HL
Specification:
NWC (net working capital) = net working capital
AL = current assets
HL = current liabilities
(b) Dividend Policy
In this study the variable dividend policy symbolized by the dividend payout ratio(DPR), which is the ratio between dividend payments proxied by DPS (dividend pershare) against to EPS (earnings per share).
Parliament formula can be described as follows:
DPR = DPS EPS
Specification:
DPR= Dividend Payout Ratio
DPS = Dividend Per Share
EPS =Earning Per Share
(c) Growth opportunity
The use of market value in forming the ratio of investment opportunity is right becausethe company is able to demonstrate the potential for growth (growth opportunity) inthe future.
The formula according to Sofyan Syafri Harahap (2011: 311) as follows:
Market to Book Value Ratio = Value Stock MarketBook Value
The analysis used in this study is a quantitative analysis of a set of data that isexpressed in the figures as a result of observation or collection. This analysis usesmultiple linear regression model (multiple linear regression method). Multiple linearregression analysis was used to examine the effect of two or more independent variableson the dependent variable with interval or ratio measurement scale in a linear equation.Processing of the data in this study using SPSS v.19.
Classical assumption test
(a) Test of normality
Normality test used in this study is the Kolmogorov-Smirnov test, P-Plot, and skewneskurtosis. This test examined data independent variables and the dependent variable
The Effect of Free Cash Flow, Dividend Policy and Growth Opportunity... 1653
in the regression equation generated, whether the normal distribution or distributionis not normal. The regression equation is quite good if it has a free variable data andthe data were normally distributed dependent variable or normal at all (DanangSunyoto, 2011: 84)
Testing of data normality using Kolmogorov Smirnov test using the level ofsignificant use is 0.05. Basis for decision making are as follows:
If the value Asymp. Sig. (2-tailed) <0.05, then the data is not normally distributed.
If the value Asymp. Sig. (2-tailed)> 0.05, then the normal distribution of data.
Variabel normal distribution can be said when the value of skewness andkurtosisnyaberada the range of values for an alpha of 0.05 ± 1.96 whereas the criticalvalue. The critical value is obtained based on significance level of 5%.
(b) Test multicolinearity
Classical assumption of this kind is applied to multiple regression analysis whichconsists of two or more independent variables, which will be measured the level ofassociation relationship / influence of the free between variables through correlationcoefficient (DanangSunyoto, 2011: 81).
According to Imam Ghozali (2011: 105) good regression model should not happenbecause the correlation between the independent variables when there is a correlationbetween variables then these variables are not orthogonal. Orthogonal variable is theindependent variable correlation values between the members of the independentvariables equal to zero.
Multicolinearity can be seen from (a) The value of tolerance and the opponent (b)Variance Inflation Factor (VIF).
The basis for decision making:
If VIF> 10 or tolerance <0.1, then there multikolinieritas.
If VIF <10 or tolerance> 0.1, then it does not happen multikolinieritas.
(c) Test Autocorrelation
A good regression equation is that no problems occur autocorrelation.If the equationbecomes bad or improper use prediction.In order to know the symptoms ofautocorrelation can use the Durbin-Watson test (DW). This test produces DW countvalue and the value DW tables (dL& d U).
(d) Test Heteroskidastity
Heteroskidastity test aims to test whether the regression model occurred inequalityresidual variance from one observation to another observation. One way to detect thepresence or absence Heteroskidastity is using this glejser. This test proposed forabsoluteregressing the residual value of the independent variable.
1654 Flourien Nurul and Muhammad Iqbal
The basis for decision making:
If significant <0.05, then the case heteroscedasticity.
If significant> 0.05, then there is no heteroscedasticity.
Multiple Regression Analysis
Multiple regression analysis is used to determine whether or not a significantindependent variables influence free cash flow, dividend policy and growthopportunity for the dependent variable, namely debt policy.
Forms of multiple regression equation that can be used for this research are:
Y = � + �1X1 + �2X2 + �3X3 + e
Where:
Y = debt policy
X1 = free cash flow
X2 = the dividend policy
X3 = growth opportunity
�1, �2, �3, = coefficient of regression
� = constant
e = standard error
Hypothesis Testing
(a) Individual Parameter Significance test (Test Statistic t)
Testing by t test or t test that compares between t with t table.Tests carried outusing a 0.05 significance level (� = 5%). Acceptance or rejection of the hypothesisperformed with the following criteria:
1. If a significant value> 0.05 then the hypothesis is rejected. This means thatpartially independent variable has no significant effect on the dependentvariable.
2. If the significant value � 0.05 then the hypothesis is accepted. This meanspartially independent variables have a significant influence on the dependentvariable.
Decision-making is based on the t:
Ho accepted if t <t table
Ho is rejected if t> t table
b. Simultaneous Significance Test (Test Statistic F)
The Effect of Free Cash Flow, Dividend Policy and Growth Opportunity... 1655
According Ghozali (2011: 98) F statistical test basically shows whether allindependent variables in the model that is intended to have the simultaneous effecton the dependent variable. Tests carried out using a 0.05 significance level (� = 5%).
Provisions acceptance or rejection of the hypothesis is as follows:
1) If significant value ¬� 0.05 then the hypothesis is accepted (regressioncoefficient is not significant).
2) If significant value � 0.05, then the hypothesis is rejected (significantregression coefficients).
Decision-making based on the calculated F F table:
1) If F count> F table, then Ho is rejected
2) If F arithmetic <F table, then Ho is accepted
c. Test The coefficient of determination (R2)
The coefficient of determination (R2) essentially measures how far the ability of themodel to explain variations in the dependent variable. R2 is little value means theability of independent variables in explaining the dependent variables is very limited.Mean value approaching one independent variables provide almost all the informationneeded to predict the variation of the dependent variable (Ghozali, 2011: 97).
RESULTS AND DISCUSSION
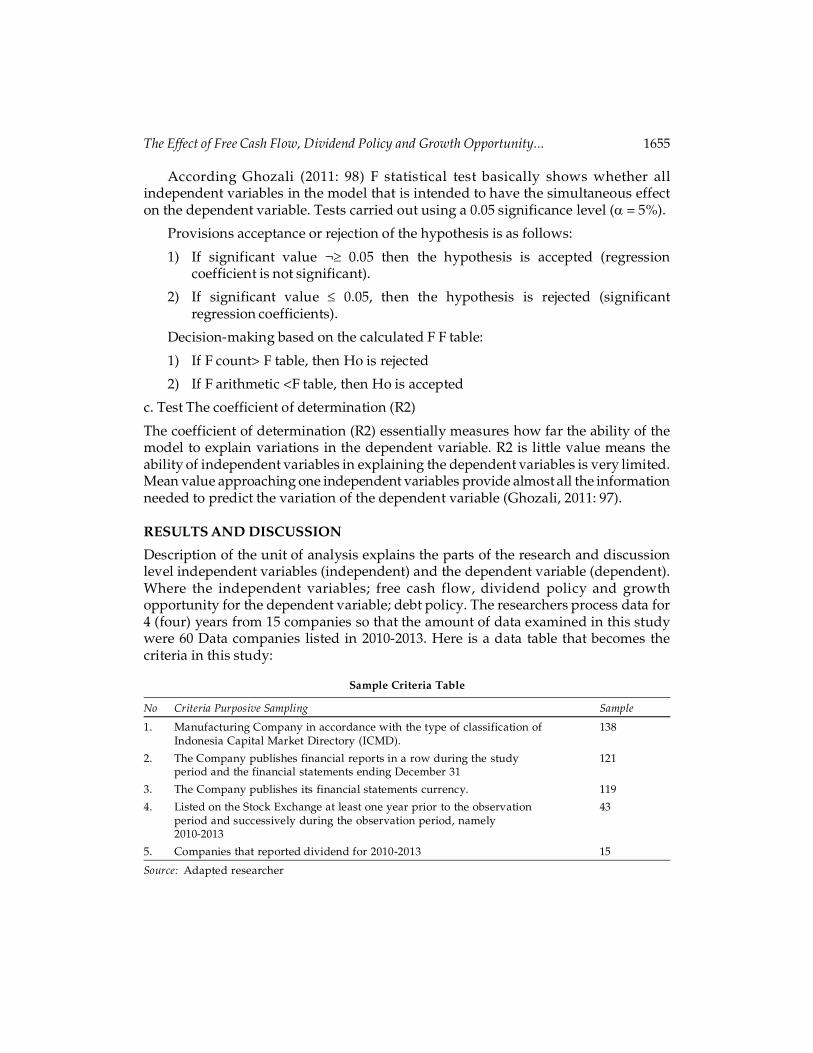
Description of the unit of analysis explains the parts of the research and discussionlevel independent variables (independent) and the dependent variable (dependent).Where the independent variables; free cash flow, dividend policy and growthopportunity for the dependent variable; debt policy. The researchers process data for4 (four) years from 15 companies so that the amount of data examined in this studywere 60 Data companies listed in 2010-2013. Here is a data table that becomes thecriteria in this study:
Sample Criteria Table
No Criteria Purposive Sampling Sample
1. Manufacturing Company in accordance with the type of classification of 138Indonesia Capital Market Directory (ICMD).
2. The Company publishes financial reports in a row during the study 121period and the financial statements ending December 31
3. The Company publishes its financial statements currency. 119
4. Listed on the Stock Exchange at least one year prior to the observation 43period and successively during the observation period, namely2010-2013
5. Companies that reported dividend for 2010-2013 15
Source: Adapted researcher
1656 Flourien Nurul and Muhammad Iqbal
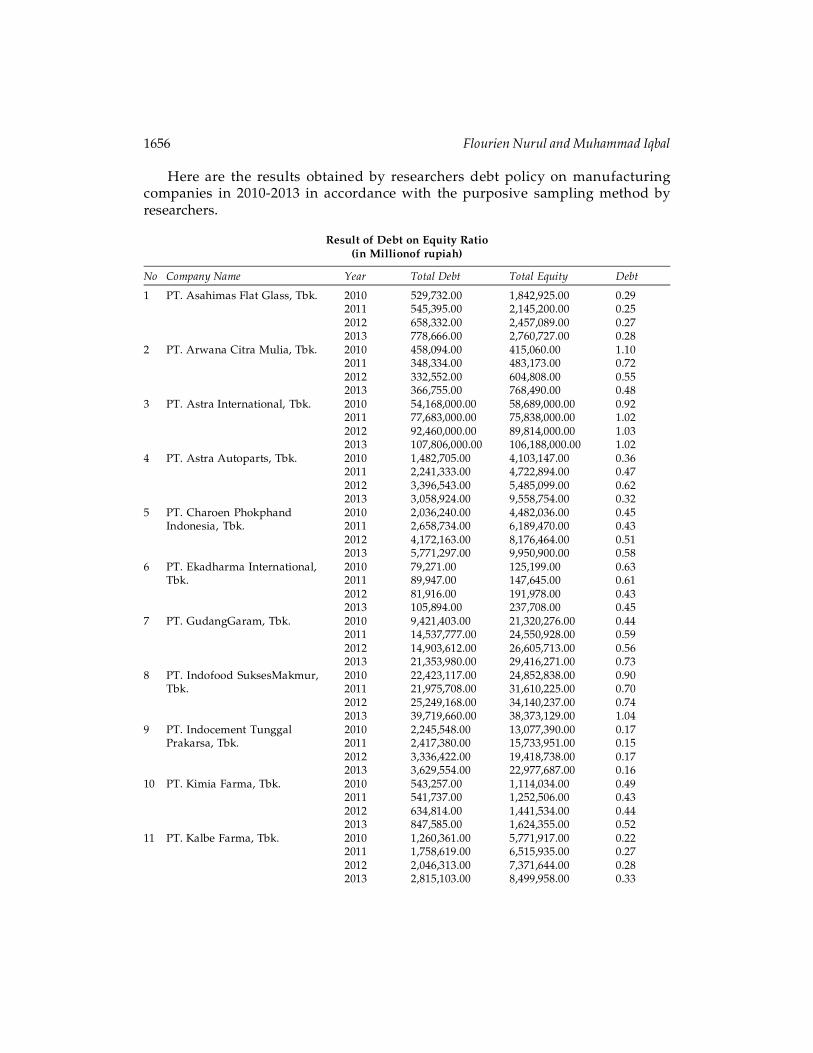
Here are the results obtained by researchers debt policy on manufacturingcompanies in 2010-2013 in accordance with the purposive sampling method byresearchers.
Result of Debt on Equity Ratio(in Millionof rupiah)
No Company Name Year Total Debt Total Equity Debt
1 PT. Asahimas Flat Glass, Tbk. 2010 529,732.00 1,842,925.00 0.292011 545,395.00 2,145,200.00 0.252012 658,332.00 2,457,089.00 0.272013 778,666.00 2,760,727.00 0.28
2 PT. Arwana Citra Mulia, Tbk. 2010 458,094.00 415,060.00 1.102011 348,334.00 483,173.00 0.722012 332,552.00 604,808.00 0.552013 366,755.00 768,490.00 0.48
3 PT. Astra International, Tbk. 2010 54,168,000.00 58,689,000.00 0.922011 77,683,000.00 75,838,000.00 1.022012 92,460,000.00 89,814,000.00 1.032013 107,806,000.00 106,188,000.00 1.02
4 PT. Astra Autoparts, Tbk. 2010 1,482,705.00 4,103,147.00 0.362011 2,241,333.00 4,722,894.00 0.472012 3,396,543.00 5,485,099.00 0.622013 3,058,924.00 9,558,754.00 0.32
5 PT. Charoen Phokphand 2010 2,036,240.00 4,482,036.00 0.45Indonesia, Tbk. 2011 2,658,734.00 6,189,470.00 0.43
2012 4,172,163.00 8,176,464.00 0.512013 5,771,297.00 9,950,900.00 0.58
6 PT. Ekadharma International, 2010 79,271.00 125,199.00 0.63Tbk. 2011 89,947.00 147,645.00 0.61
2012 81,916.00 191,978.00 0.432013 105,894.00 237,708.00 0.45
7 PT. GudangGaram, Tbk. 2010 9,421,403.00 21,320,276.00 0.442011 14,537,777.00 24,550,928.00 0.592012 14,903,612.00 26,605,713.00 0.562013 21,353,980.00 29,416,271.00 0.73
8 PT. Indofood SuksesMakmur, 2010 22,423,117.00 24,852,838.00 0.90Tbk. 2011 21,975,708.00 31,610,225.00 0.70
2012 25,249,168.00 34,140,237.00 0.742013 39,719,660.00 38,373,129.00 1.04
9 PT. Indocement Tunggal 2010 2,245,548.00 13,077,390.00 0.17Prakarsa, Tbk. 2011 2,417,380.00 15,733,951.00 0.15
2012 3,336,422.00 19,418,738.00 0.172013 3,629,554.00 22,977,687.00 0.16
10 PT. Kimia Farma, Tbk. 2010 543,257.00 1,114,034.00 0.492011 541,737.00 1,252,506.00 0.432012 634,814.00 1,441,534.00 0.442013 847,585.00 1,624,355.00 0.52
11 PT. Kalbe Farma, Tbk. 2010 1,260,361.00 5,771,917.00 0.222011 1,758,619.00 6,515,935.00 0.272012 2,046,313.00 7,371,644.00 0.282013 2,815,103.00 8,499,958.00 0.33
The Effect of Free Cash Flow, Dividend Policy and Growth Opportunity... 1657
12 PT. Lion Metal Works, Tbk. 2010 43,971.00 259,929.00 0.172011 63,755.00 302,060.00 0.212012 61,668.00 371,829.00 0.172013 82,783.00 415,784.00 0.20
13 PT. Lionmesh Prima, Tbk. 2010 31,415.00 46,785.00 0.672011 40,816.00 57,203.00 0.712012 31,023.00 97,525.00 0.322013 31,229.00 110,468.00 0.28
14 PT. Semen Gresik, Tbk. 2010 3,423,246.00 12,139,753.00 0.282011 5,046,506.00 14,615,097.00 0.352012 8,414,229.00 18,164,855.00 0.462013 8,988,908.00 21,803,976.00 0.41
15 PT. Unilever Indonesia, Tbk. 2010 4,652,409.00 4,048,853.00 1.152011 6,801,375.00 3,680,937.00 1.852012 8,016,614.00 3,968,365.00 2.022013 9,093,518.00 4,254,670.00 2.14
Sumber: data sekunderdiolah
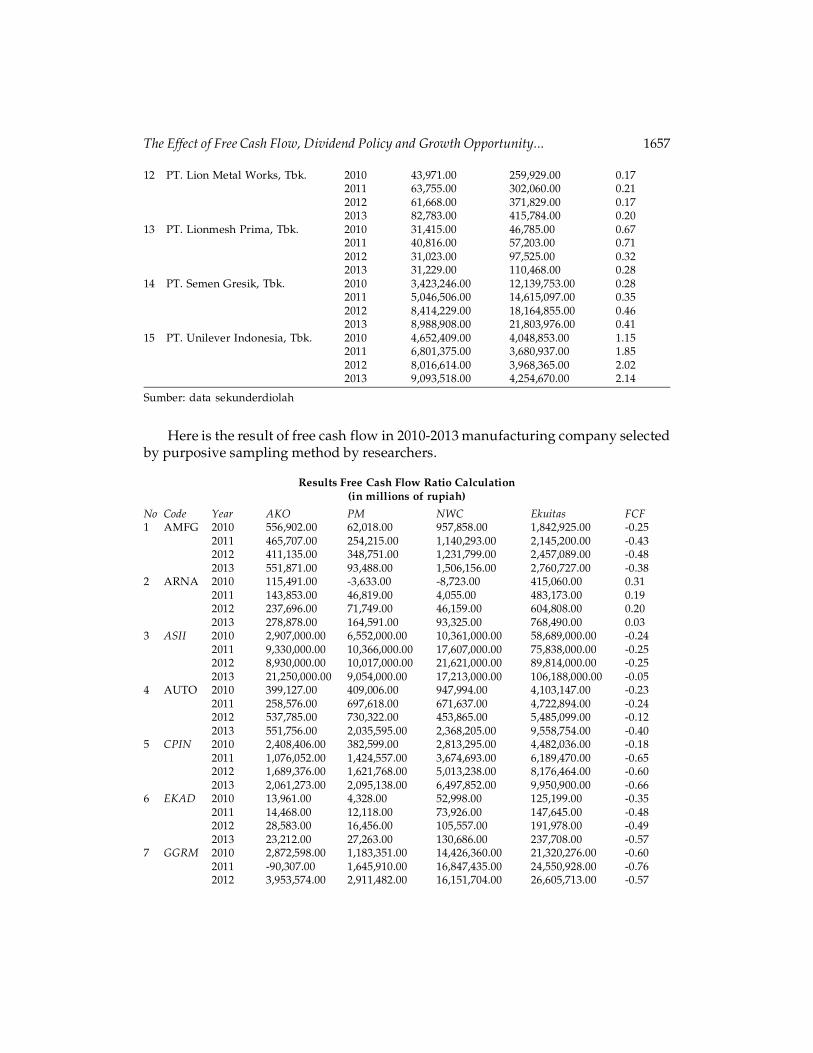
Here is the result of free cash flow in 2010-2013 manufacturing company selectedby purposive sampling method by researchers.
Results Free Cash Flow Ratio Calculation(in millions of rupiah)
No Code Year AKO PM NWC Ekuitas FCF1 AMFG 2010 556,902.00 62,018.00 957,858.00 1,842,925.00 -0.25
2011 465,707.00 254,215.00 1,140,293.00 2,145,200.00 -0.432012 411,135.00 348,751.00 1,231,799.00 2,457,089.00 -0.482013 551,871.00 93,488.00 1,506,156.00 2,760,727.00 -0.38
2 ARNA 2010 115,491.00 -3,633.00 -8,723.00 415,060.00 0.312011 143,853.00 46,819.00 4,055.00 483,173.00 0.192012 237,696.00 71,749.00 46,159.00 604,808.00 0.202013 278,878.00 164,591.00 93,325.00 768,490.00 0.03
3 ASII 2010 2,907,000.00 6,552,000.00 10,361,000.00 58,689,000.00 -0.242011 9,330,000.00 10,366,000.00 17,607,000.00 75,838,000.00 -0.252012 8,930,000.00 10,017,000.00 21,621,000.00 89,814,000.00 -0.252013 21,250,000.00 9,054,000.00 17,213,000.00 106,188,000.00 -0.05
4 AUTO 2010 399,127.00 409,006.00 947,994.00 4,103,147.00 -0.232011 258,576.00 697,618.00 671,637.00 4,722,894.00 -0.242012 537,785.00 730,322.00 453,865.00 5,485,099.00 -0.122013 551,756.00 2,035,595.00 2,368,205.00 9,558,754.00 -0.40
5 CPIN 2010 2,408,406.00 382,599.00 2,813,295.00 4,482,036.00 -0.182011 1,076,052.00 1,424,557.00 3,674,693.00 6,189,470.00 -0.652012 1,689,376.00 1,621,768.00 5,013,238.00 8,176,464.00 -0.602013 2,061,273.00 2,095,138.00 6,497,852.00 9,950,900.00 -0.66
6 EKAD 2010 13,961.00 4,328.00 52,998.00 125,199.00 -0.352011 14,468.00 12,118.00 73,926.00 147,645.00 -0.482012 28,583.00 16,456.00 105,557.00 191,978.00 -0.492013 23,212.00 27,263.00 130,686.00 237,708.00 -0.57
7 GGRM 2010 2,872,598.00 1,183,351.00 14,426,360.00 21,320,276.00 -0.602011 -90,307.00 1,645,910.00 16,847,435.00 24,550,928.00 -0.762012 3,953,574.00 2,911,482.00 16,151,704.00 26,605,713.00 -0.57

1658 Flourien Nurul and Muhammad Iqbal
2013 2,472,971.00 5,429,144.00 14,509,881.00 29,416,271.00 -0.598 INDF 2010 6,989,734.00 1,793,180.00 10,218,876.00 24,852,838.00 -0.20
2011 4,968,991.00 2,059,779.00 11,670,430.00 31,610,225.00 -0.282012 7,419,046.00 3,976,491.00 13,430,790.00 34,140,237.00 -0.292013 6,928,790.00 8,723,757.00 12,993,188.00 38,373,129.00 -0.39
9 INTP 2010 3,376,092.00 528,328.00 6,137,101.00 13,077,390.00 -0.252011 3,883,711.00 574,419.00 8,837,976.00 15,733,951.00 -0.352012 5,674,822.00 802,721.00 12,160,638.00 19,418,738.00 -0.382013 5,419,268.00 2,152,104.00 14,106,159.00 22,977,687.00 -0.47
10 KAEF 2010 139,120.00 34,835.00 669,726.00 1,114,034.00 -0.512011 81,553.00 40,048.00 803,335.00 1,252,506.00 -0.612012 230,613.00 76,293.00 968,614.00 1,441,534.00 -0.562013 253,784.00 71,699.00 1,064,491.00 1,624,355.00 -0.54
11 KLBF 2010 1,253,908.00 215,119.00 3,885,056.00 5,771,917.00 -0.492011 1,473,495.00 419,946.00 4,325,535.00 6,515,935.00 -0.502012 1,376,344.00 514,633.00 4,550,093.00 7,371,644.00 -0.502013 927,164.00 855,486.00 4,856,729.00 8,499,958.00 -0.56
12 LION 2010 32,526.00 1,780.00 242,535.00 259,929.00 -0.812011 40,207.00 2,095.00 281,663.00 302,060.00 -0.812012 66,606.00 16,108.00 352,554.00 371,829.00 -0.812013 52,557.00 33,270.00 365,092.00 415,784.00 -0.83
13 LMSH 2010 9,648.00 648.00 31,282.00 46,785.00 -0.482011 5,100.00 -2,444.00 42,751.00 57,203.00 -0.622012 10,589.00 5,355.00 76,797.00 97,525.00 -0.732013 13,815.00 1,425.00 87,966.00 110,468.00 -0.68
14 SMGR 2010 3,378,416.00 4,022,902.00 4,828,349.00 12,139,753.00 -0.452011 4,415,753.00 4,464,934.00 4,757,008.00 14,615,097.00 -0.332012 5,591,865.00 6,180,481.00 3,406,092.00 18,164,855.00 -0.222013 6,047,147.00 3,144,410.00 4,674,480.00 21,803,976.00 -0.08
15 UNVR 2010 3,619,189.00 1,273,913.00 -654,810.00 4,048,853.00 0.742011 5,461,876.00 1,419,527.00 -2,028,375.00 3,680,937.00 1.652012 5,191,646.00 1,218,006.00 -2,499,934.00 3,968,365.00 1.632013 6,241,679.00 1,031,438.00 -2,556,503.00 4,254,670.00 1.83
Source: Secondary data is processed
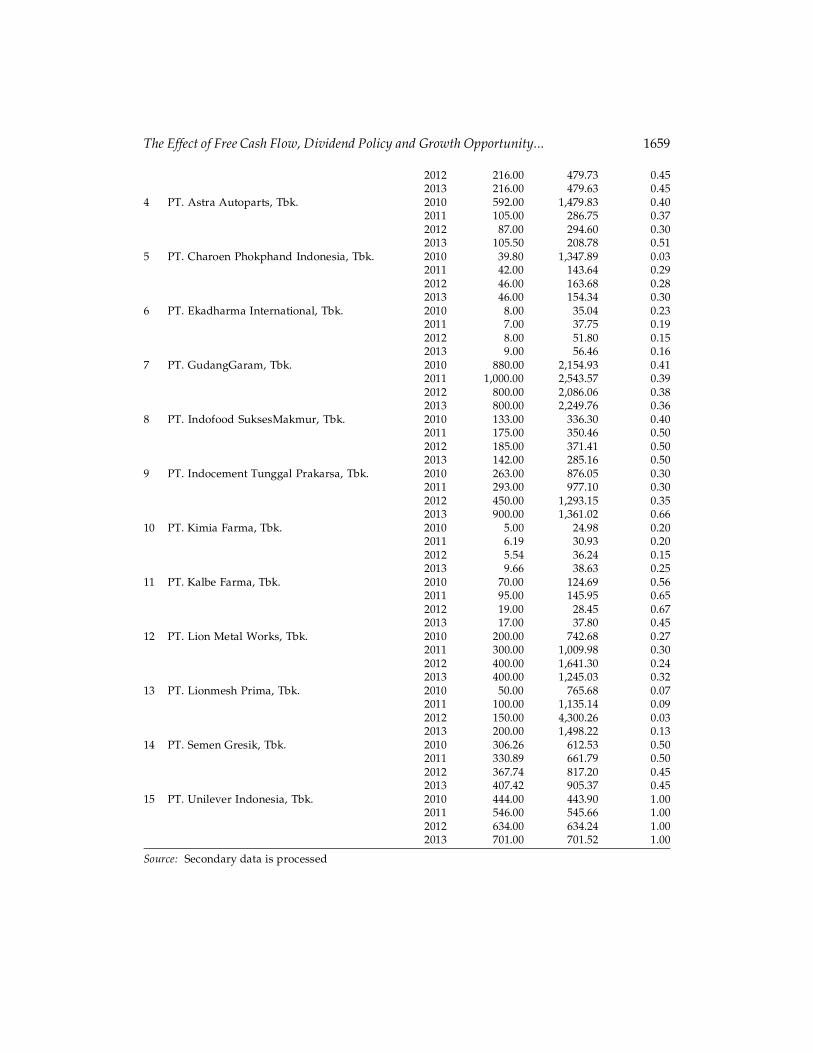
Here are the results obtained from the manufacturing company in 2010-2013 wereselected by purposive method samplingoleh researchers.
Results of calculation of dividend payout ratio (DPR)
No Company Name Year DPS EPS DPR
1 PT. Asahimas Flat Glass, Tbk. 2010 80.00 762.61 0.102011 80.00 776.49 0.102012 80.00 798.64 0.102013 80.00 779.63 0.10
2 PT. Arwana Citra Mulia, Tbk. 2010 15.00 43.07 0.352011 20.00 51.62 0.392012 40.00 85.25 0.472013 16.00 32.03 0.50
3 PT. Astra International, Tbk. 2010 470.00 3,548.60 0.132011 1,980.00 4,393.14 0.45
The Effect of Free Cash Flow, Dividend Policy and Growth Opportunity... 1659
2012 216.00 479.73 0.452013 216.00 479.63 0.45
4 PT. Astra Autoparts, Tbk. 2010 592.00 1,479.83 0.402011 105.00 286.75 0.372012 87.00 294.60 0.302013 105.50 208.78 0.51
5 PT. Charoen Phokphand Indonesia, Tbk. 2010 39.80 1,347.89 0.032011 42.00 143.64 0.292012 46.00 163.68 0.282013 46.00 154.34 0.30
6 PT. Ekadharma International, Tbk. 2010 8.00 35.04 0.232011 7.00 37.75 0.192012 8.00 51.80 0.152013 9.00 56.46 0.16
7 PT. GudangGaram, Tbk. 2010 880.00 2,154.93 0.412011 1,000.00 2,543.57 0.392012 800.00 2,086.06 0.382013 800.00 2,249.76 0.36
8 PT. Indofood SuksesMakmur, Tbk. 2010 133.00 336.30 0.402011 175.00 350.46 0.502012 185.00 371.41 0.502013 142.00 285.16 0.50
9 PT. Indocement Tunggal Prakarsa, Tbk. 2010 263.00 876.05 0.302011 293.00 977.10 0.302012 450.00 1,293.15 0.352013 900.00 1,361.02 0.66
10 PT. Kimia Farma, Tbk. 2010 5.00 24.98 0.202011 6.19 30.93 0.202012 5.54 36.24 0.152013 9.66 38.63 0.25
11 PT. Kalbe Farma, Tbk. 2010 70.00 124.69 0.562011 95.00 145.95 0.652012 19.00 28.45 0.672013 17.00 37.80 0.45
12 PT. Lion Metal Works, Tbk. 2010 200.00 742.68 0.272011 300.00 1,009.98 0.302012 400.00 1,641.30 0.242013 400.00 1,245.03 0.32
13 PT. Lionmesh Prima, Tbk. 2010 50.00 765.68 0.072011 100.00 1,135.14 0.092012 150.00 4,300.26 0.032013 200.00 1,498.22 0.13
14 PT. Semen Gresik, Tbk. 2010 306.26 612.53 0.502011 330.89 661.79 0.502012 367.74 817.20 0.452013 407.42 905.37 0.45
15 PT. Unilever Indonesia, Tbk. 2010 444.00 443.90 1.002011 546.00 545.66 1.002012 634.00 634.24 1.002013 701.00 701.52 1.00
Source: Secondary data is processed

1660 Flourien Nurul and Muhammad Iqbal
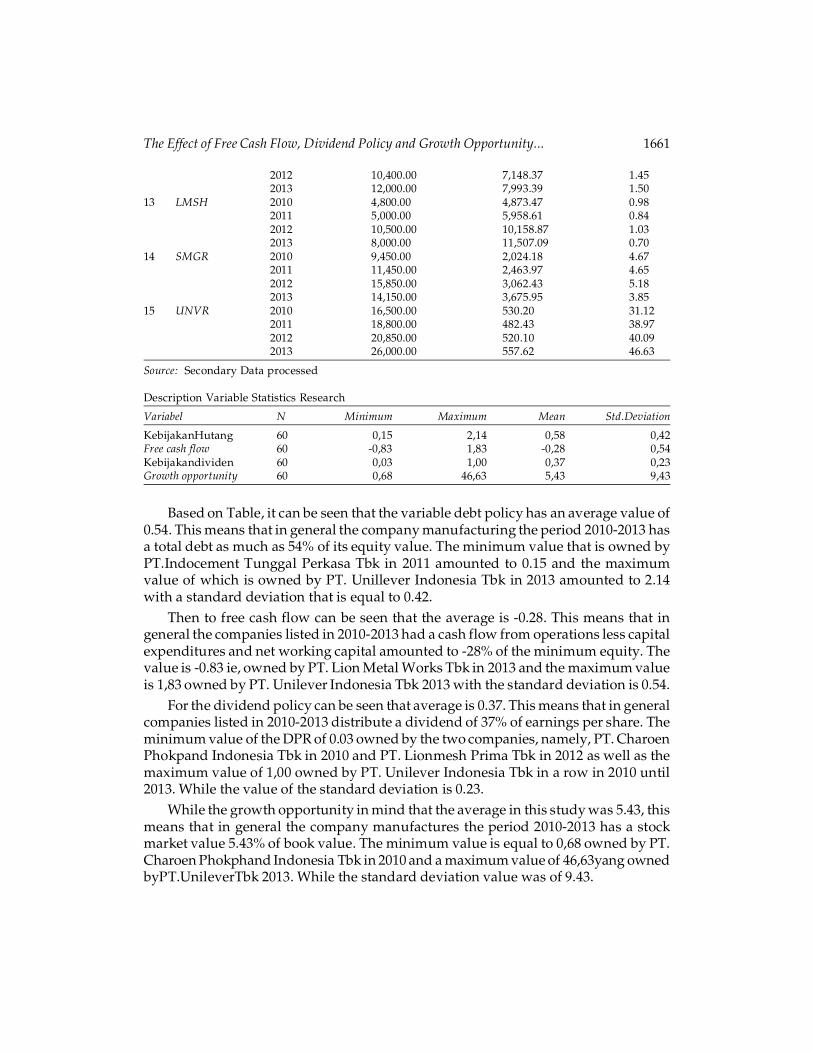
Here are the results of the research results obtained from the manufacturingcompany in 2010-2013 were selected by purposive sampling method by researchers.
Results of calculation Market to Book Value Ratio (PBV)
No Code Year Closing price Book value PBV
1 AMFG 2010 5,800.00 4,246.37 1.372011 6,550.00 4,942.86 1.332012 8,300.00 5,661.50 1.472013 7,000.00 6,361.12 1.10
2 ARNA 2010 290.00 222.69 1.302011 365.00 263.26 1.392012 1,640.00 329.53 4.982013 820.00 104.68 7.83
3 ASII 2010 54,550.00 12,180.25 4.482011 74,000.00 18,733.04 3.952012 7,600.00 2,218.53 3.432013 6,800.00 2,622.99 2.59
4 AUTO 2010 13,950.00 5,006.54 2.792011 3,400.00 1,224.88 2.782012 3,700.00 1,422.56 2.602013 3,650.00 1,983.25 1.84
5 CPIN 2010 1,840.00 2,718.89 0.682011 2,150.00 377.45 5.702012 3,650.00 498.63 7.322013 3,375.00 606.84 5.56
6 EKAD 2010 255.00 190.55 1.342011 280.00 211.29 1.332012 350.00 274.73 1.272013 390.00 340.18 1.15
7 GGRM 2010 40,000.00 11,016.73 3.632011 62,050.00 12,759.77 4.862012 56,300.00 13,827.70 4.072013 42,000.00 15,288.42 2.75
8 INDF 2010 4,875.00 1,911.60 2.552011 4,600.00 3,600.08 1.282012 5,850.00 3,888.50 1.502013 6,600.00 4,370.30 1.51
9 INTP 2010 15,950.00 3,552.45 4.492011 17,050.00 4,274.10 3.992012 22,450.00 5,275.07 4.262013 20,000.00 6,241.85 3.20
10 KAEF 2010 159.00 200.58 0.792011 340.00 225.51 1.512012 740.00 258.74 2.862013 590.00 292.47 2.02
11 KLBF 2010 3,250.00 529.12 6.142011 3,400.00 641.58 5.302012 1,060.00 120.97 8.762013 1,250.00 167.39 7.47
12 LION 2010 3,800.00 4,997.09 0.762011 5,250.00 5,807.07 0.90
The Effect of Free Cash Flow, Dividend Policy and Growth Opportunity... 1661
2012 10,400.00 7,148.37 1.452013 12,000.00 7,993.39 1.50
13 LMSH 2010 4,800.00 4,873.47 0.982011 5,000.00 5,958.61 0.842012 10,500.00 10,158.87 1.032013 8,000.00 11,507.09 0.70
14 SMGR 2010 9,450.00 2,024.18 4.672011 11,450.00 2,463.97 4.652012 15,850.00 3,062.43 5.182013 14,150.00 3,675.95 3.85
15 UNVR 2010 16,500.00 530.20 31.122011 18,800.00 482.43 38.972012 20,850.00 520.10 40.092013 26,000.00 557.62 46.63
Source: Secondary Data processed
Description Variable Statistics Research
Variabel N Minimum Maximum Mean Std.Deviation
KebijakanHutang 60 0,15 2,14 0,58 0,42Free cash flow 60 -0,83 1,83 -0,28 0,54Kebijakandividen 60 0,03 1,00 0,37 0,23Growth opportunity 60 0,68 46,63 5,43 9,43
Based on Table, it can be seen that the variable debt policy has an average value of0.54. This means that in general the company manufacturing the period 2010-2013 hasa total debt as much as 54% of its equity value. The minimum value that is owned byPT.Indocement Tunggal Perkasa Tbk in 2011 amounted to 0.15 and the maximumvalue of which is owned by PT. Unillever Indonesia Tbk in 2013 amounted to 2.14with a standard deviation that is equal to 0.42.
Then to free cash flow can be seen that the average is -0.28. This means that ingeneral the companies listed in 2010-2013 had a cash flow from operations less capitalexpenditures and net working capital amounted to -28% of the minimum equity. Thevalue is -0.83 ie, owned by PT. Lion Metal Works Tbk in 2013 and the maximum valueis 1,83 owned by PT. Unilever Indonesia Tbk 2013 with the standard deviation is 0.54.
For the dividend policy can be seen that average is 0.37. This means that in generalcompanies listed in 2010-2013 distribute a dividend of 37% of earnings per share. Theminimum value of the DPR of 0.03 owned by the two companies, namely, PT. CharoenPhokpand Indonesia Tbk in 2010 and PT. Lionmesh Prima Tbk in 2012 as well as themaximum value of 1,00 owned by PT. Unilever Indonesia Tbk in a row in 2010 until2013. While the value of the standard deviation is 0.23.
While the growth opportunity in mind that the average in this study was 5.43, thismeans that in general the company manufactures the period 2010-2013 has a stockmarket value 5.43% of book value. The minimum value is equal to 0,68 owned by PT.Charoen Phokphand Indonesia Tbk in 2010 and a maximum value of 46,63yang ownedbyPT.UnileverTbk 2013. While the standard deviation value was of 9.43.
1662 Flourien Nurul and Muhammad Iqbal
Classical assumption test
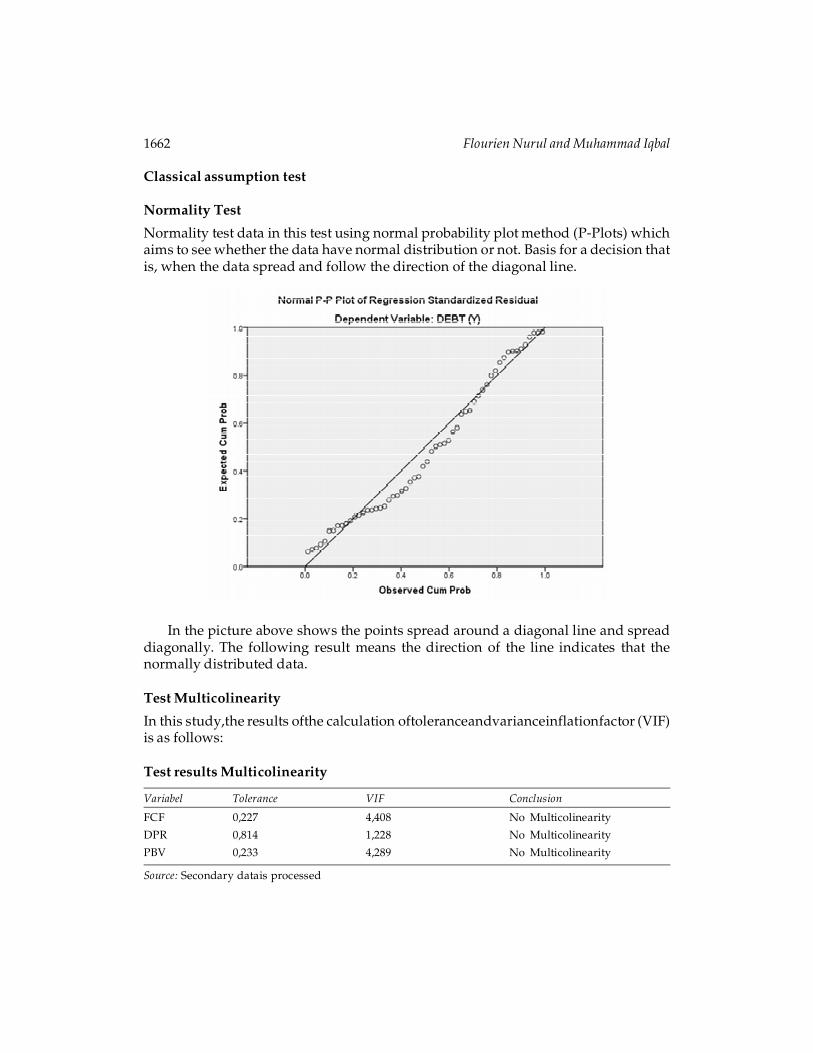
Normality Test
Normality test data in this test using normal probability plot method (P-Plots) whichaims to see whether the data have normal distribution or not. Basis for a decision thatis, when the data spread and follow the direction of the diagonal line.
In the picture above shows the points spread around a diagonal line and spreaddiagonally. The following result means the direction of the line indicates that thenormally distributed data.
Test Multicolinearity
In this study,the results ofthe calculation oftoleranceandvarianceinflationfactor (VIF)is as follows:
Test results Multicolinearity
Variabel Tolerance VIF Conclusion
FCF 0,227 4,408 No Multicolinearity
DPR 0,814 1,228 No Multicolinearity
PBV 0,233 4,289 No Multicolinearity
Source: Secondary datais processed

The Effect of Free Cash Flow, Dividend Policy and Growth Opportunity... 1663
From these results, it can be said that the regression model freefrommultikolinieritas because VIF no tolerance values exceeding 10 and no less than0.10.
Test Auto correlation
The testis used todetect thepresence or absence ofclassic assumption deviation autocorrelation is the Durbin-Watson test (DW test).
Test Autocorrelation
Model N K dL dU DW Conclusion
1 60 3 1,4797 1,6889 2,278 Noautocorrelation, positiveornegative
Source: Secondary datais processed
Based on thetable above, can beseen the value ofDurbinWatsonresultingfrom theregression modelis2.278. DWvalueis at5criteria, namely=Du<DwHit<(4-Du)=1.6889<2.278 <2.3111 (4-1.6889). So it canbe saidthat the regression modelfreeofautocorrelation.
Test Heteroskidastity
Test Heteroskidastity
Variabel Signifikansi Conclusion
FCF 0,094 No Heteroskidastity
DPR 0,662 No Heteroskidastity
PBV 0,065 No Heteroskidastity
Source: Secondary datais processed
From the results ofSPSS, it can be seenthat thesignificanceabove5% confidencelevel(0.05), so it can be concluded that the regression model did not contain anyheteroskidastityorit can be said homoscedasticity.
Hypothesis Testing
Multiple Linear Regression Model
Multiple linear regression analysis was used to predict the value of the effect of two ormore independent variables on the dependent variable. Once the data are calculated,the obtained results as follows:
1664 Flourien Nurul and Muhammad Iqbal
Coefficientsa
Model Unstandardized StandardizedCoefficients Coefficients
B Std. Error Beta t Sig.
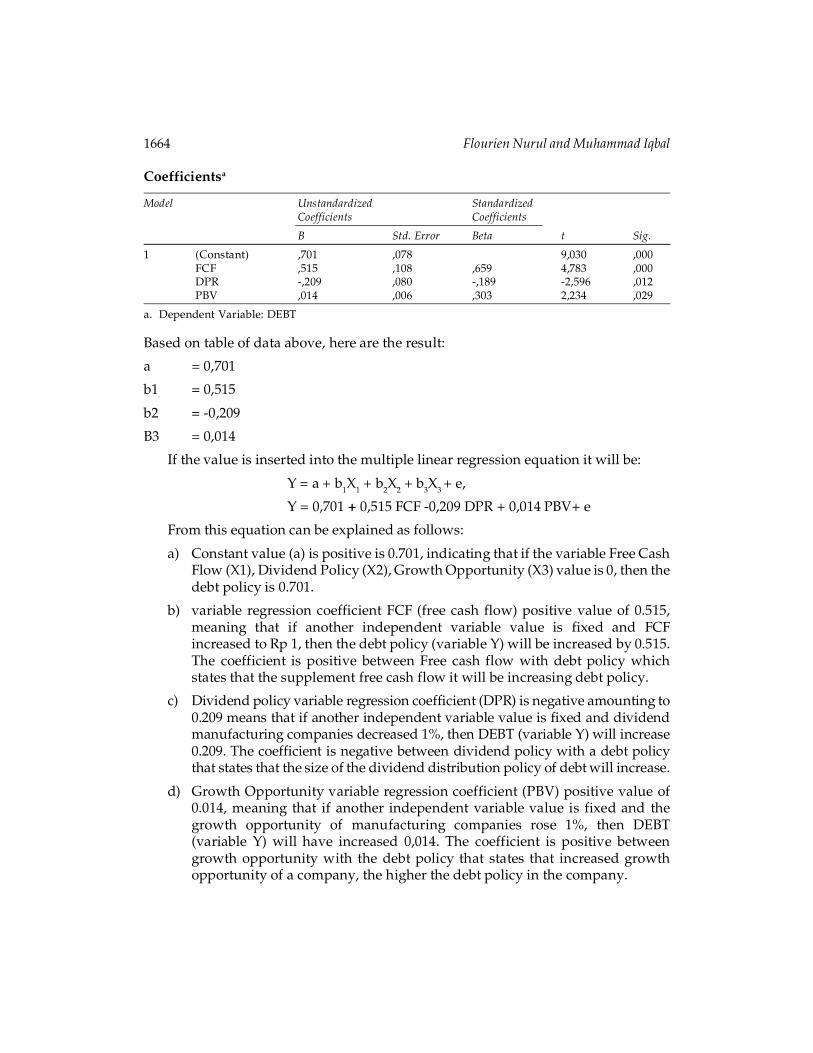
1 (Constant) ,701 ,078 9,030 ,000FCF ,515 ,108 ,659 4,783 ,000DPR -,209 ,080 -,189 -2,596 ,012PBV ,014 ,006 ,303 2,234 ,029
a. Dependent Variable: DEBT
Based on table of data above, here are the result:
a = 0,701
b1 = 0,515
b2 = -0,209
B3 = 0,014
If the value is inserted into the multiple linear regression equation it will be:
Y = a + b1X1 + b2X2 + b3X3 + e,
Y = 0,701 + 0,515 FCF -0,209 DPR + 0,014 PBV+ e
From this equation can be explained as follows:
a) Constant value (a) is positive is 0.701, indicating that if the variable Free CashFlow (X1), Dividend Policy (X2), Growth Opportunity (X3) value is 0, then thedebt policy is 0.701.
b) variable regression coefficient FCF (free cash flow) positive value of 0.515,meaning that if another independent variable value is fixed and FCFincreased to Rp 1, then the debt policy (variable Y) will be increased by 0.515.The coefficient is positive between Free cash flow with debt policy whichstates that the supplement free cash flow it will be increasing debt policy.
c) Dividend policy variable regression coefficient (DPR) is negative amounting to0.209 means that if another independent variable value is fixed and dividendmanufacturing companies decreased 1%, then DEBT (variable Y) will increase0.209. The coefficient is negative between dividend policy with a debt policythat states that the size of the dividend distribution policy of debt will increase.
d) Growth Opportunity variable regression coefficient (PBV) positive value of0.014, meaning that if another independent variable value is fixed and thegrowth opportunity of manufacturing companies rose 1%, then DEBT(variable Y) will have increased 0,014. The coefficient is positive betweengrowth opportunity with the debt policy that states that increased growthopportunity of a company, the higher the debt policy in the company.

The Effect of Free Cash Flow, Dividend Policy and Growth Opportunity... 1665
Significant Individual Test Parameters (Test Statistic t)
T-statistics test is done by comparing t arithmetic with t table, significance level of 5%:2 = 2.5% (Test 2 sides) with degrees of freedom (df) nk-1 or 60-3-1 = 56 (n is the numberof samples and k is the number of independent variables). By testing two sides(significant = 0.025), the results obtained for the t table of 2.00324.
Statistics t testCoefficientsa
Unstandardized Coefficients Standardized CoefficientsB Std. Error Beta t Sig.
,701 ,078 9,030 ,000,515 ,108 ,659 4,783 ,000-,209 ,080 -,189 -2,596 ,012,014 ,006 ,303 2,234 ,029
a. Dependent Variable: DEBT
From the above table, in order to obtain the test results as follows:
a. Free cash flow variable (X1) has t count equal to 4.783. Thus it appears that tcount> t-table. Besides, based on the results of SPSS, t value of 4.783 is thesignificant level of 0,000 (0.0%), which means under the significant level of0.05 (5%). This shows that the free cash flow positive effect on debt policy inmanufacturing companies, namely the high free cash flow, the high debtpolicies.
b. Dividend policy variables (X2) have t calculate equal to -2.596. Thus it appearsthat t count> t-table. Besides, based on the results of SPSS, t value of -2.596 isthe significant level of 0.012 (1.2%), which means under the significant level of0.05 (5%). This indicates that the dividend policy negatively affect debt policyin manufacturing companies, namely the low dividend policy of high debtpolicy.
c. Variable growth opportunity (X3) has amounted to 2,234 t. Thus it appearsthat t count> t-table. Besides, based on the results SPSSv.19, t-test value of2.234 is the significant level of 0.029 (2.9%), which means under the significantlevel of 0.05 (5%). This suggests that the growth opportunity positive effect ondebt policy in manufacturing companies, namely the opportunity of highgrowth rate of the high debt policies as well.
Significant Simultaneous Test (Test Statistic F)
This testing is done by comparing Fhitung with Ftabel and a significance level of lessthan 5% (0.05).
Test Statistic F

1666 Flourien Nurul and Muhammad Iqbal
ANOVAB
Model Sum of Squares df Mean Square F Sig.
1 Regression 8,047 3 2,682 58,827 ,000a
Residual 2,554 56 ,046
Total 10,601 59
Source: Secondary data is processed
From the above table it is known that Fhitung 58.827 with a significance of 0.000and the value of F table 2,76 with a significance level of 5%. From the calculationresults show that F-count> F-table that is 58.827> 2.76 and a significance level of lessthan 0.05 is equal to 0.000. Thus showing that there is a simultaneous effect betweenfree cash flow, dividend policy, and growth opprtunity against debt policy incompanies listed on the Stock Exchange 2010-2013.
Coefficient of Determination
In the multiple linear regression is analyzed also the magnitude of the coefficient ofdetermination (R2) as a whole.
Coefficient of Determination
Model R R Square Adjusted R Square Std. Error of theEstimate
1 ,871a ,759 ,746 ,21354
This test shows the results of R2 (adjusted R2) of 0.746 means that the influence ofthe independent variables together on the dependent variable of 74.6%. So it can besaid that the magnitude of the debt policy 74.6% of manufacturing companies due toFree Cash Flow, dividend policy and growth opportunity, the remaining 25.4% isinfluenced by other variables.
Based on research data and its processing is sourced from the financial statementsof companies listed on the Indonesian Stock Exchange (BEI) 2010-2013, the discussionof each variable in the study was as follows:
The influence of free cash flow to debt policy
The results showed that the free cash flow significantly influence debt policy. Thepositive results obtained in this study reflect the direction of the relationship betweenfree cash flow to debt policy. This indicates that the manufacturing companies thathave high debt policies mostly have free cash flow the company is high as well. It canbe concluded that the manufacturing companies in Indonesia, the use of high debtbecause they have a high free cash flow.

The Effect of Free Cash Flow, Dividend Policy and Growth Opportunity... 1667
The influence of dividend policy on debt policy
Dividend policy one of the things that affect the debt policy a dividend policy of thecompany.In this study gave negative results but significant. This means that thedividend policy is inversely proportional to the impact on the debt policy and debtpolicy of the company.If high dividend policy, low debt policy. If the company has alot of debt, the company will reduce the amount of the dividend because most of theprofits will be used to pay interest and installment loans.
Effect of growth opportunity against debt policy
Based on the hypothesis that the results obtained, it is known that the growthopportunity companies influence the direction of the debt policy, which means ifgrowth opportunity increases the debt policy of an enterprise increases. When growthincreases the opportunity of a company’s debt policy will increase as well supportedwith funds needed for the development of the company’s growth.
Effect of Free Cash Flow, Dividend Policy and Growth Opportunity on Debt Policy
The results showed that these three variables can influence debt policy co-generalsama. Several companies generate a lot of cash but a limited amount of its investmentopportunities-this is happening to the companies in the lucrative industry, too mature,where there is little growth. Companies are also usually share a large percentage ofcash to shareholders, thus attracting a group of investors who choose high dividendand cause the company to have a low amount of debt.
Results of this study indicate the three independent variables affect the dependentvariable together. With manufacturing companies the object of research in 2010-2013has the result that a high free cash flow, a low dividend policy and the high growthopportunity that influence the debt policy so that high debt policy
CONCLUSIONS AND SUGGESTIONS
Based on the analysis and discussion of research that has been conductedon a manufacturing company, then the results of this study can be summarized asfollows:
1. There is a significantly positive influence between free cash flow for debtpolicy and has a unidirectional relationship with debt policy. So it can be saidthat when a high free cash flow, the debt policy will be high as well. This isbecause the debt policy can reduce agency costs that occur.
2. Dividend policy has a significant negative effect on debt policy and has aninverse relationship with debt policy. These results reinforce the assertionthat if the high dividend policy, the debt will be low. This is because at thetime of a high dividend, the company is still able to fund its operationswithout having to use funds from external parties.
1668 Flourien Nurul and Muhammad Iqbal
3. The growth opportunity positive effect on debt policy in manufacturingcompanies, namely the opportunity of high growth rate of the high debtjuga.memiliki influence policy and direction of the debt policy. So if acompany has a high growth opportunity, the high debt policy will also resultfrom a company that has a high growth opportunities tend to borrow loansfor business development and operations.
4. The free cash flow, dividend policy and growth opportunity positive andsignificant impact on debt policy with a significance of 0,000dengan F-count58.827. This means that the hypothesis that these three variables influencingvariables debt policy. Its influence is with high free cash flow, a low dividendpolicy and the high growth opportunity companies have high debt policies aswell.
SUGGESTION
Based on research that has been done, researchers will provide some suggestions thatcan be submitted is limited samples in manufacturing companies alone. Future studiesneed to expand beyond manufacturing samples such as other industries which are inthe BEI and can add research years. Also need for samples with intervals and in differentstudies of the development of the capital market which is quite high.
For further research, it is expected that researchers can add multiple variablessuch as profitability, sales growth, investment, business risk, and can also be seenfrom the relationship with the tax or other variables that include new variables thatcan influence the policy of debt and further research could also use another proxy, socan be compared with previous research.
References
Ghozali, Imam. (2011), AplikasiAnalisis Multivariate Dengan Program IBM SPSS 19. Semarang:Badan Penerbit Undip.
Harahap, Sofyan Syafri. (2011), Teori Akuntansi. Jakarta: Rajawali Pers.
Husnan, Suaddan Pudjiastuti, Enny. (2004), Dasar-dasar Manajemen Keuangan. Edisi4.Yogyakarta : UPP AMP YKPM.
Keown, Arthur dan John. (2010), Manajemen Keuangan, Edisi Sepuluh. Penerjemah: BambangRiyanto. Jakarta : PT Indeks.
Siahaan, Rinaldi. (2013), Faktor-faktor yang Mempengaruhi Kebijakan Hutang Pada PerusahaanManufaktur yang Terdaftar di Bursa Efek Indonesia. Skripsi S-1.Jurusan akuntansi. SekolahTinggiIlmu Ekonomi Indonesia. Jakarta.
Sunyoto, Danang. (2011), Analisis Regresidan Uji Hipotesis. Yogyakarta : PT. BukuSeru.
Tarjodan Jogiyanto, (2003), ”Analisis Free Cash Flow dan Kepemilikan ManajerialterhadapKebijakan Utangpada Perusahaan Publik di Indonesia. Simposium Nasional Akuntansi VI,Surabaya.

The Effect of Free Cash Flow, Dividend Policy and Growth Opportunity... 1669
Wijantini. (2012), RisikoLikuiditas. Diakses 28 November 2014, http://Mobile.kontan.co.id/news_wakeup/70/Risiko-likuiditas,.
http://Bolasalju.com/2012/07/23/arus-kas-bebas-free-cash-flow.html,ArusKasBebas, Diakses 8Desember 2014
www.idx.co.id