Embed Size (px)
Citation preview
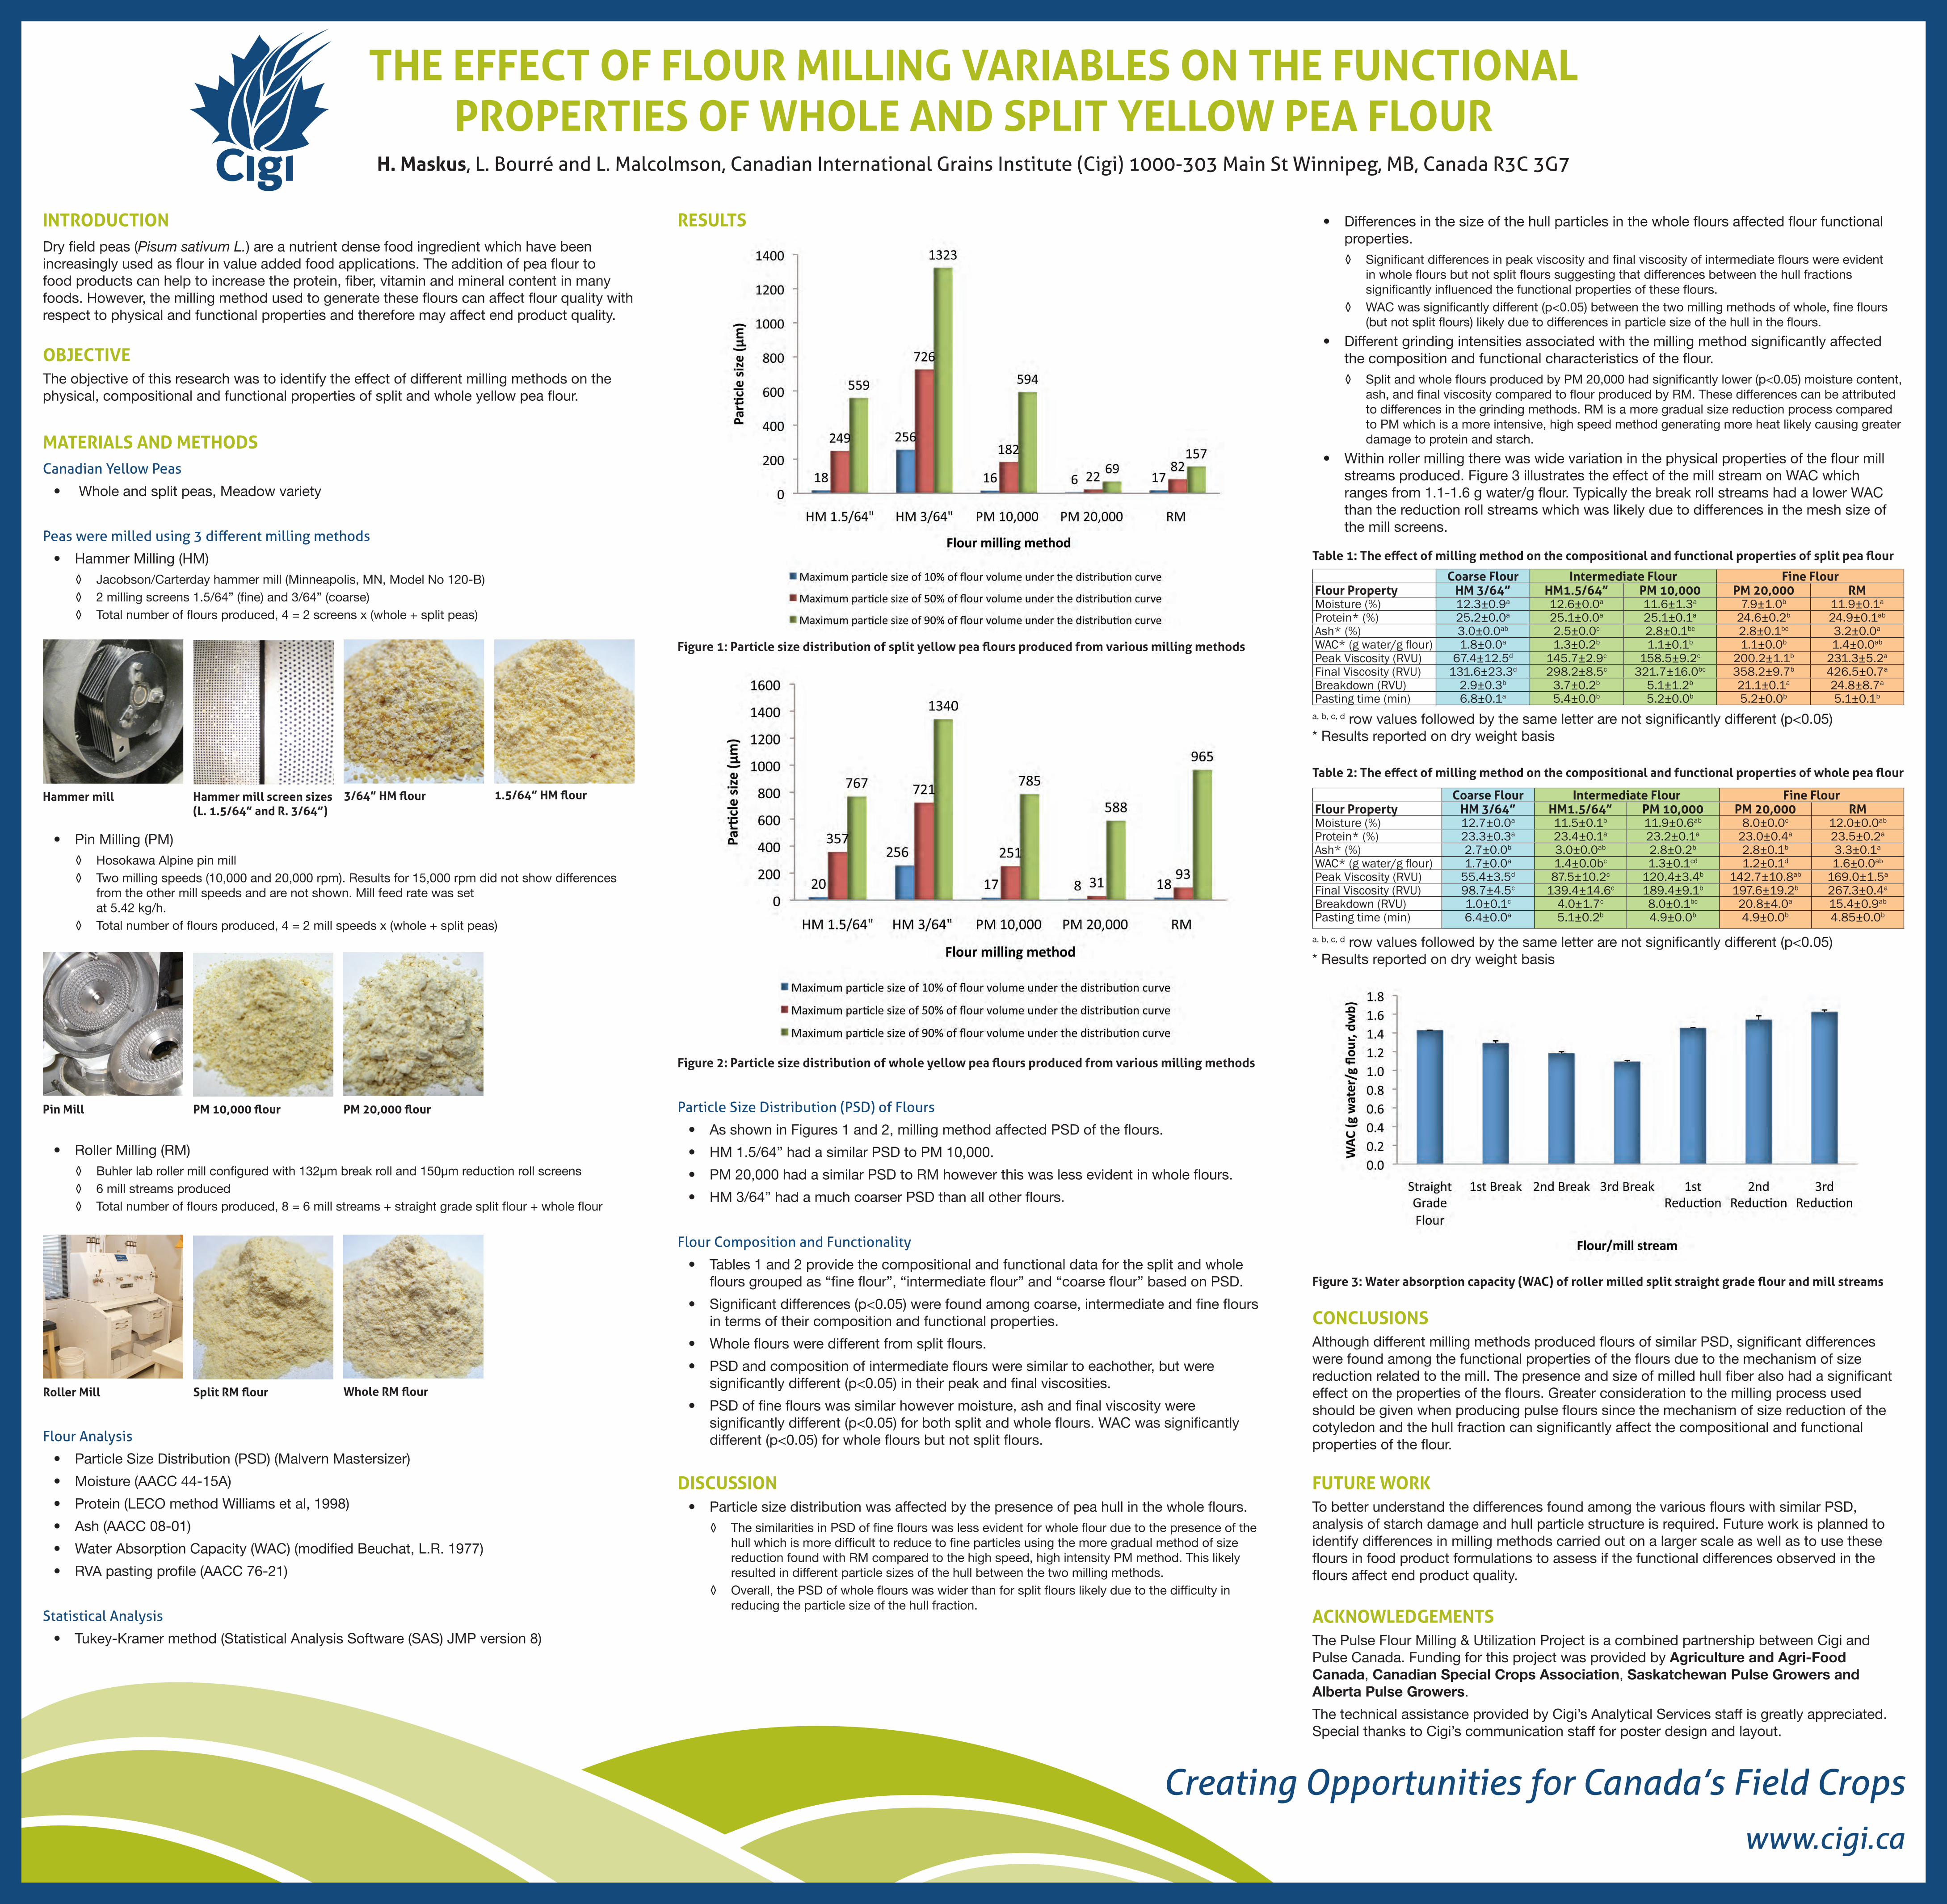
THE EFFECT OF FLOUR MILLING VARIABLES ON THE FUNCTIONAL PROPERTIES OF WHOLE AND SPLIT YELLOW PEA FLOUR
H. Maskus, L. Bourré and L. Malcolmson, Canadian International Grains Institute (Cigi) 1000-303 Main St Winnipeg, MB, Canada R3C 3G7
Creating Opportunities for Canada’s Field Crops
INTRODUCTION Dry field peas (Pisum sativum L.) are a nutrient dense food ingredient which have been increasingly used as flour in value added food applications. The addition of pea flour to food products can help to increase the protein, fiber, vitamin and mineral content in many foods. However, the milling method used to generate these flours can affect flour quality with respect to physical and functional properties and therefore may affect end product quality.
OBJECTIVE The objective of this research was to identify the effect of different milling methods on the physical, compositional and functional properties of split and whole yellow pea flour.
MATERIALS AND METHODS Canadian Yellow Peas
• Whole and split peas, Meadow variety
Peas were milled using 3 different milling methods
• Hammer Milling (HM) ◊ Jacobson/Carterday hammer mill (Minneapolis, MN, Model No 120-B)◊ 2 milling screens 1.5/64” (fine) and 3/64” (coarse) ◊ Total number of flours produced, 4 = 2 screens x (whole + split peas)
• Pin Milling (PM) ◊ Hosokawa Alpine pin mill ◊ Two milling speeds (10,000 and 20,000 rpm). Results for 15,000 rpm did not show differences
from the other mill speeds and are not shown. Mill feed rate was set at 5.42 kg/h.
◊ Total number of flours produced, 4 = 2 mill speeds x (whole + split peas)
• Roller Milling (RM) ◊ Buhler lab roller mill configured with 132µm break roll and 150µm reduction roll screens◊ 6 mill streams produced◊ Total number of flours produced, 8 = 6 mill streams + straight grade split flour + whole flour
Flour Analysis
• Particle Size Distribution (PSD) (Malvern Mastersizer)
• Moisture (AACC 44-15A)
• Protein (LECO method Williams et al, 1998)
• Ash (AACC 08-01)
• Water Absorption Capacity (WAC) (modified Beuchat, L.R. 1977)
• RVA pasting profile (AACC 76-21)
Statistical Analysis
• Tukey-Kramer method (Statistical Analysis Software (SAS) JMP version 8)
RESULTS
Figure 1: Particle size distribution of split yellow pea flours produced from various milling methods
Figure 2: Particle size distribution of whole yellow pea flours produced from various milling methods
Particle Size Distribution (PSD) of Flours
• As shown in Figures 1 and 2, milling method affected PSD of the flours.
• HM 1.5/64” had a similar PSD to PM 10,000.
• PM 20,000 had a similar PSD to RM however this was less evident in whole flours.
• HM 3/64” had a much coarser PSD than all other flours.
Flour Composition and Functionality
• Tables 1 and 2 provide the compositional and functional data for the split and whole flours grouped as “fine flour”, “intermediate flour” and “coarse flour” based on PSD.
• Significant differences (p<0.05) were found among coarse, intermediate and fine flours in terms of their composition and functional properties.
• Whole flours were different from split flours.
• PSD and composition of intermediate flours were similar to eachother, but were significantly different (p<0.05) in their peak and final viscosities.
• PSD of fine flours was similar however moisture, ash and final viscosity were significantly different (p<0.05) for both split and whole flours. WAC was significantly different (p<0.05) for whole flours but not split flours.
• Differences in the size of the hull particles in the whole flours affected flour functional properties.◊ Significant differences in peak viscosity and final viscosity of intermediate flours were evident
in whole flours but not split flours suggesting that differences between the hull fractions significantly influenced the functional properties of these flours.
◊ WAC was significantly different (p<0.05) between the two milling methods of whole, fine flours (but not split flours) likely due to differences in particle size of the hull in the flours.
• Different grinding intensities associated with the milling method significantly affected the composition and functional characteristics of the flour. ◊ Split and whole flours produced by PM 20,000 had significantly lower (p<0.05) moisture content,
ash, and final viscosity compared to flour produced by RM. These differences can be attributed to differences in the grinding methods. RM is a more gradual size reduction process compared to PM which is a more intensive, high speed method generating more heat likely causing greater damage to protein and starch.
• Within roller milling there was wide variation in the physical properties of the flour mill streams produced. Figure 3 illustrates the effect of the mill stream on WAC which ranges from 1.1-1.6 g water/g flour. Typically the break roll streams had a lower WAC than the reduction roll streams which was likely due to differences in the mesh size of the mill screens.
Figure 3: Water absorption capacity (WAC) of roller milled split straight grade flour and mill streams
CONCLUSIONSAlthough different milling methods produced flours of similar PSD, significant differences were found among the functional properties of the flours due to the mechanism of size reduction related to the mill. The presence and size of milled hull fiber also had a significant effect on the properties of the flours. Greater consideration to the milling process used should be given when producing pulse flours since the mechanism of size reduction of the cotyledon and the hull fraction can significantly affect the compositional and functional properties of the flour.
FUTURE WORKTo better understand the differences found among the various flours with similar PSD, analysis of starch damage and hull particle structure is required. Future work is planned to identify differences in milling methods carried out on a larger scale as well as to use these flours in food product formulations to assess if the functional differences observed in the flours affect end product quality.
ACKNOWLEDGEMENTSThe Pulse Flour Milling & Utilization Project is a combined partnership between Cigi and Pulse Canada. Funding for this project was provided by Agriculture and Agri-Food Canada, Canadian Special Crops Association, Saskatchewan Pulse Growers and Alberta Pulse Growers.
The technical assistance provided by Cigi’s Analytical Services staff is greatly appreciated. Special thanks to Cigi’s communication staff for poster design and layout.
1.5/64” HM flourHammer mill Hammer mill screen sizes (L. 1.5/64” and R. 3/64”)
3/64” HM flour
Pin Mill PM 20,000 flourPM 10,000 flour
Roller Mill Whole RM flourSplit RM flour
Coarse Flour Intermediate Flour Fine FlourFlour Property HM 3/64” HM1.5/64” PM 10,000 PM 20,000 RMMoisture (%) 12.3±0.9a 12.6±0.0a 11.6±1.3a 7.9±1.0b 11.9±0.1a
Protein* (%) 25.2±0.0a 25.1±0.0a 25.1±0.1a 24.6±0.2b 24.9±0.1ab
Ash* (%) 3.0±0.0ab 2.5±0.0c 2.8±0.1bc 2.8±0.1bc 3.2±0.0a
WAC* (g water/g flour) 1.8±0.0a 1.3±0.2b 1.1±0.1b 1.1±0.0b 1.4±0.0ab
Peak Viscosity (RVU) 67.4±12.5d 145.7±2.9c 158.5±9.2c 200.2±1.1b 231.3±5.2a
Final Viscosity (RVU) 131.6±23.3d 298.2±8.5c 321.7±16.0bc 358.2±9.7b 426.5±0.7a
Breakdown (RVU) 2.9±0.3b 3.7±0.2b 5.1±1.2b 21.1±0.1a 24.8±8.7a
Pasting time (min) 6.8±0.1a 5.4±0.0b 5.2±0.0b 5.2±0.0b 5.1±0.1b
Table 1: The effect of milling method on the compositional and functional properties of split pea flour
a, b, c, d row values followed by the same letter are not significantly different (p<0.05) * Results reported on dry weight basis
Coarse Flour Intermediate Flour Fine FlourFlour Property HM 3/64” HM1.5/64” PM 10,000 PM 20,000 RMMoisture (%) 12.7±0.0a 11.5±0.1b 11.9±0.6ab 8.0±0.0c 12.0±0.0ab
Protein* (%) 23.3±0.3a 23.4±0.1a 23.2±0.1a 23.0±0.4a 23.5±0.2a
Ash* (%) 2.7±0.0b 3.0±0.0ab 2.8±0.2b 2.8±0.1b 3.3±0.1a
WAC* (g water/g flour) 1.7±0.0a 1.4±0.0bc 1.3±0.1cd 1.2±0.1d 1.6±0.0ab
Peak Viscosity (RVU) 55.4±3.5d 87.5±10.2c 120.4±3.4b 142.7±10.8ab 169.0±1.5a
Final Viscosity (RVU) 98.7±4.5c 139.4±14.6c 189.4±9.1b 197.6±19.2b 267.3±0.4a
Breakdown (RVU) 1.0±0.1c 4.0±1.7c 8.0±0.1bc 20.8±4.0a 15.4±0.9ab
Pasting time (min) 6.4±0.0a 5.1±0.2b 4.9±0.0b 4.9±0.0b 4.85±0.0b
Table 2: The effect of milling method on the compositional and functional properties of whole pea flour
a, b, c, d row values followed by the same letter are not significantly different (p<0.05) * Results reported on dry weight basis
www.cigi.ca
DISCUSSION• Particle size distribution was affected by the presence of pea hull in the whole flours.
◊ The similarities in PSD of fine flours was less evident for whole flour due to the presence of the hull which is more difficult to reduce to fine particles using the more gradual method of size reduction found with RM compared to the high speed, high intensity PM method. This likely resulted in different particle sizes of the hull between the two milling methods.
◊ Overall, the PSD of whole flours was wider than for split flours likely due to the difficulty in reducing the particle size of the hull fraction.