Embed Size (px)
Citation preview

THE EFFECT OF FINANCIAL STRUCTURE ON THE FINANCIAL
PERFORMANCE OF CONVENTIONAL AND ISLAMIC BANKS IN KENYA
ANN NJAMBI NG’ANG’A
A RESEARCH PROJECT SUBMITTED IN PARTIAL FULFILLMENT OF
THE REQUIREMENTS FOR THE AWARD OF THE DEGREE OF MASTER
IN BUSINESS ADMINISTRATION, UNIVERSITY OF NAIROBI.
2013

ii
DECLARATION
This research project is my original work and has not been presented for a degree in
any other university
Signed: Date:
ANN N. NG’ANG’A
D61/63365/11
This research project has been submitted for examination with my approval as the
University Supervisor.
Signed: Date:
MR. HERICK ONDIGO
Lecturer
Department of Finance and Accounting
University of Nairobi

iii
DEDICATION
I dedicate this project to my parents, Mr. And Mrs. Ng‟ang‟a for their support and
encouragement during the entire period of my study. To my sisters and grandmother
for their continued prayers towards the successful completion of this course.

iv
ACKNOWLEDGEMENTS
Special thanks to the almighty God for the gift of life, good health and opportunity to
complete this program. To my special family for their material and moral support as
well as their prayers.
I wish to thank the school of business for giving me this opportunity to attain an
MBA. Much gratitude to my supervisor, Mr. Herick Ondigo, for his patience and
great guidance throughout the period that I have carried out this project.
Special thanks also to my friends Joshua, Simon, Jane and Wambui for their support
and encouragement.
May you all be blessed.

v
Table of Contents
DECLARATION ...................................................................................................................... ii
DEDICATION ....................................................................................................................... iii
ACKNOWLEDGEMENT ...................................................................................................... iv
LIST OF TABLES ................................................................................................................ vii
LIST OF FIGURES ............................................................................................................. viii
LIST OF ABBREVIATIONS ................................................................................................ ix
ABSTRACT ............................................................................................................................. x
CHAPTER ONE ...................................................................................................................... 1
INTRODUCTION ................................................................................................................... 1
1.1 Background of the Study ............................................................................................. 1
1.1.1 Financial Structure...................................................................................................... 2
1.1.2 Financial Performance .............................................................................................. 2
1.1.3 Effect of Financial Structure on Financial Performance ............................... 4
1.1.4 Commercial Banks in Kenya .................................................................................... 6
1.2 Research Problem .......................................................................................................... 7
1.3 Objective of the Study ........................................................................................................ 9
1.4 Value of the Study ................................................................................................................ 9
CHAPTER TWO .................................................................................................................. 10
LITERATURE REVIEW ..................................................................................................... 10
2.1 Introduction ........................................................................................................................ 10
2.2 Theoretical Review .......................................................................................................... 10
2.2.1 Capital Structure Irrelevance Theory ............................................................... 10
2.2.2 Trade-Off Theory ...................................................................................................... 11
2.2.3 Agency Cost Theory ................................................................................................. 12
2.3 Conventional Banks vs. Islamic Banks ...................................................................... 12
2.3.1 Structural differences between Islamic and Conventional Banks ......... 13
2.4 Determinants of Financial Structures ....................................................................... 15
2.5 Determinants of Financial Performance .................................................................. 16
2.6 Measures of Financial Performance .......................................................................... 19
2.6.1 Return on Equity (ROE) ......................................................................................... 20
2.6.2 Return on Assets (ROA) ......................................................................................... 20
2.6.3 Net Interest Margin (NIM) .................................................................................... 20
2.7 Empirical Review .............................................................................................................. 21
2.8 Summary of Literature Review ................................................................................... 26

vi
CHAPTER THREE .............................................................................................................. 27
RESEARCH METHODOLOGY ......................................................................................... 27
3.1 Introduction ........................................................................................................................ 27
3.2 Research Design ................................................................................................................ 27
3.3 Population ........................................................................................................................... 27
3.4 Data Collection ................................................................................................................... 28
3.5 Data Analysis ...................................................................................................................... 28
3.5.1 Analytical Model ....................................................................................................... 28
CHAPTER FOUR ................................................................................................................ 30
DATA ANALYSIS AND FINDINGS .................................................................................. 30
4.1 Introduction ........................................................................................................................ 30
4.2 Findings ................................................................................................................................ 30
4.3 Descriptive statistics ....................................................................................................... 31
4.4 Regression Analysis ......................................................................................................... 33
4.4.1 Comparison of Financial Performance ............................................................. 34
4.4.2 Analysis of Variance (ANOVA) ............................................................................ 35
4.4.1 Financial Structure and Financial Performance ........................................... 39
4.5 Interpretation of Findings ............................................................................................. 41
CHAPTER FIVE .................................................................................................................. 44
SUMMARY, CONCLUSION AND RECOMMENDATIONS .......................................... 44
5.1 Introduction ........................................................................................................................ 44
5.2 Summary .............................................................................................................................. 44
5.3 Conclusion ........................................................................................................................... 45
5.4 Policy Recommendations .............................................................................................. 45
5.5 Limitations of the Study ................................................................................................. 46
5.6 Areas for Further Research ........................................................................................... 46
REFERENCE ........................................................................................................................ 48
APPENDIX I: List of Registered Commercial Banks as of 31st December 2011 ................................................................................................................................................ 58
APPENDIX II: RAW DATA 2008 – 2009 ..................................................................... 60
APPENDIX III: RAW DATA 2010 – 2011 ................................................................... 61
APPENDIX IV: RAW DATA 2012 .................................................................................. 62

vii
LIST OF TABLES
Table 4.1: Banks Sampled ................................................................................................ 30
Table 4.2: Descriptive Statistics ..................................................................................... 31
Table 4.3: Regression Model Summaries ................................................................... 35
Table 4.4: ANOVA Table .................................................................................................... 36
Table 4.5: Models’ Coefficients Table .......................................................................... 39
Table 4.6: Estimated equations ...................................................................................... 40

viii
LIST OF FIGURES
Figure 4.1: Comparison of Conventional and Islamic Banks’ ROE. .................. 33

ix
LIST OF ABBREVIATIONS
BIMB - Bank Islam Malaysia Berhad
CAMEL - Capital Adequacy, Asset Quality, Management Efficiency, Earnings
Ability and Liquidity
CAR - Capital Adequacy Ratio
CBK- Central Bank of Kenya
CORE - Centralised Online Real-time Environment
DER - Debt to Equity Ratio
GDP - Gross Domestic Product
ICT- Information and Communication Technology
IMF - International Monetary Fund
MENA- Middle East and Northern Africa
NIM - Net Interest Margin
ROA - Return on Asset
ROE - Return on Equity
SPSS - Statistical Package for Social Science

x
ABSTRACT
This study is set out to find the effect that financial structure has on the financial
performance of conventional banks as well as that of Islamic banks. The study used
secondary data with information obtained from the banks‟ financial statements as well
as the central bank of Kenya‟s “Bank supervision annual report”. The study adopted a
descriptive research design which involved a study of sampled conventional banks
and Islamic banks. Secondary data was collected from five conventional banks and
the two Islamic banks in Kenya. CBK classifies banks into large, medium and small.
Since the two Islamic banks in Kenya fall under the small category, the study did a
random sampling out of the twenty banks falling under the small category and
sampled five for purposes of comparison. This is similar to Halkano (2012) who
carried out a comparative case study on the performance of two Islamic banks and
five conventional banks in Kenya.
The study found out that conventional banks displayed a clear relationship between
all the financial structure variables and financial performance whereas for Islamic
banks only the assets had a relationship with the financial performance. The study
revealed that Islamic banks did not have debt to equity ratio in their financial
structures mix, unlike conventional banks. This exposes Islamic banks to more risks
compared to conventional banks. This study recommends that the government should
introduce policies that would: provide interest free investment opportunities to
Islamic banks, provide fair competition grounds to both Islamic and conventional
banks as well as introduce measures that would reduce risks to new Islamic banks
such as interest free lending rates from CBK.

1
CHAPTER ONE
INTRODUCTION
1.1 Background of the Study
Nowadays the banks play a significant role in our society, and it is not even possible
to imagine the life without banks, in other words the banks have become a blood vein
of our economy. In order to stimulate the economy of any specific country the
government does this via banking system by using “Monetary Tools”. Moreover, all
of the finance and business transactions that we are being involved in are done
through the banks.
The requirement of short term funds changes from time to time. Therefore, there is no
such rigid policy implemented to proportionate the sources of short term funds. On
the other hand, a definite policy is to be required to generate long term funds and it is
known as capital structuring of the organization (Sidra et. al., 2013). Decisions about
the debt-equity ratio and dividend are the important issue of this policy. The corporate
enterprises can get long-term funds from various resources such as share capital
(owners‟ investment) and debentures (creditors‟ investment). The profit earned from
business activities may be distributed to the shareholders in form of dividend or may
be retained in the business. The retained profit is a form of reinvestment in the
business and it is owners‟ funds. Therefore, this source is also a part of long term
funds available to any business. All these sources construct the capital structure for
the business.

2
1.1.1 Financial Structure
Financial structure comprises of debt and equity used to finance the firm. The ability
of the firm to carry out their stakeholders need is closely related to the capital
structure. Financial structure in financial context means the way a firm finances its
assets across the blend of debt, equity or hybrid securities (Saad, 2010). It is not
normally easy to determine. The importance of the capital structure of a firm lies in
the power inherent in it. It affects real decisions to a company on production,
employment and investment (Haris and Raviv, 1991). This applies to banks as well.
Details of the structures such as ownership directly influence the financial structures
of the firm (Ongore, 2011).
Demirguc-Kunt and Levine (1999) constructed indices of the organization of the
financial structure, for a large set of developing and developed countries. They
measure the relative importance of bank vs. market finance by the relative size of
stock aggregates, by relative trading or transaction volumes, and by indicators of
relative efficiency. Such measures have been useful in determining the level of
development of the companies as well economies – and categorized as developing
developed. Developing countries are shown to have less developed banks and stock
markets in general. The financial sector - banks, other financial intermediaries and
stock markets - becomes larger, more active and more efficient, as countries become
richer. Further, in developing countries financial systems tend to be more bank-based.
1.1.2 Financial Performance
Investopedia.com defines financial performance as a subjective measure of how well
a firm can use assets from its primary mode of business and generate revenues. It adds
on that the term is also used as a general measure of a firm's overall financial health

3
over a given period of time, and can be used to compare similar firms across the same
industry or to compare industries or sectors in aggregation.
The Banking profits have gained significant importance in recent years as banks are
the institutions, which contribute for overall economic activities that are happening in
any country. Post 1990‟s, due to financial liberalization and deregulation of Banks,
there has been entry of foreign banks and some large private sector banks with the
huge capital and man power has played a key role in Indian economy. Even public
sector has not lagged behind as they have constantly changed and adapted to the new
technological innovations (like Centralised Online Real-time Environment-CORE
Banking Solutions, Basel Capital Adequacy Norms) and so on.
Banks traditional mode of getting funds at a low cost and the spread between getting
funds and providing loans and advances has reduced. Thus, traditional banking
activities yielded low profits and banks started looking for new avenues for increasing
their bottom-line (Chowdhury A. and S. Chowdhury, 2010). According to
Chowdhury, banking conventions usually suggests that with the increase in fee based
income, risks can be diversified. Thus, some banking industries, like the Indian
banking sector, have to focus on fee based income like other developed nations.
According to industry estimates the fee based income has contributed only 25% out of
total income as on 31st March, 2008 and expected to increase over years. Thus it
becomes important to understand the factors play in total profit, total income, interest
income and non- interest income in order to provide stability to business of banking.
The Banks in advanced economies are moving with slow credit growth along with
insufficient capitalization and weak funding positions. The customer‟s confidence in
the banking system was severely affected due to changing sovereign risks in the Euro

4
area. Compared to this, in India, banks are well capitalized, with their asset quality
and profitability indicating significant improvement over the previous year. There was
fast reformation in credit off take during 2010-11 when compared to the subdued
growth in 2009-10 (Reserve Bank of India, 2012).
The Banks liquidity position was severely affected due to increasing mismatches in
deposits and credit growth rates, apart from several structural components such as
huge gaps in maturity of assets and liabilities due to increasing exposure in
infrastructure projects, which are long term in nature. The Banking Stability, when
compared to previous period depicted relative movements in risk parameters of the
banking system over a period of time, which indicated marginal rise in the risks with
reference to liquidity compared to the previous year. However, the Banking Stability
Indicator, showed overall improvements in stability compared to the previous
reporting period (Reserve Bank of India, 2012).
1.1.3 Effect of Financial Structure on Financial Performance
Krishnan and Moyer (1997) pointed out that a list of factors relative to capital
structure decisions include profitability, growth of the firm, size of the firm, debt
maturity, debt ratio, tax and tangibility have.However, considerations affecting the
capital structure decisions can be studied in the light of minimization of risk. A firm's
capital structure must be developed with an eye towards risk because it has a direct
link with the value.
The capital structure of a firm directly affects its financial risk, which may be
described as the risk resulting from the use of financial leverage. Financial leverage is
concerned with the relationship between earnings before interest and taxes and
earnings before tax. The more fixed-cost financing, i.e. debt (including financial

5
leases) and preferred stock, a firm has in its capital structure, the greater its financial
risk. Since the level of this risk and the associated level of returns are key inputs to
the valuation process, the firm must estimate the potential impact of alternative capital
structures on these factors and ultimately on value in order to select the best capital
structure.
Chowdhury A. and P. Chowdhury (2010) noted that banks traditional mode of getting
funds at a low cost and the spread between getting funds and providing loans and
advances has reduced. Thus, traditional banking activities yielded low profits and
banks started looking for new avenues for increasing their bottom-line. According to
Chowdhury, Banking conventions usually suggests that with the increase in fee based
income, risks can be diversified.
The financial structure and financial performance are also important to banks in
determining the financial patterns. For instance, in a study by Omet and Nobanee
(2001) noticed that large firms held a lot of debt in their capital structure, compared to
smaller firms. Such findings would be useful to banks in finding out which financial
patterns they would adopt in the short term and the long term. This helps them
organize their firms accordingly.
Sathye (2005) noticed that few Studies have revealed that the impact of privatization
on banks performance and efficiency shown that privatized banks have performed
better than fully public sector banks and they are catching up with the banks in the
private sector. Bhaumik and Dimova (2004) reports that the major factors affecting
the profitability and efficiency of the banks were directed investments, directed credit,
growth in assets, growth in advances and increased proportion of other income in total
income of the banks.

6
1.1.4 Commercial Banks in Kenya
The banking structure in Kenya allows Kenyans to access finance from various
sources. As at 31st December 2007, the banking sector in Kenya comprised 45
institutions, 42 of which were commercial banks, 2 mortgage finance companies and
1 non-bank financial institution. Out of 45 institutions, 35 were locally owned and 10
were foreign owned.
A study by Musa (2007) showed that several conventional banks have introduced
Shariah compliant deposit products while two fully fledged Islamic banks have been
licensed by the Central Bank of Kenya in 2007. It is necessary that Muslims are able
to access financial services that do not violate their principles and beliefs. The study
reports that the Central Bank of Kenya licensed First Community Bank and Gulf
African Bank as Islamic banks that offer Shariah compliant products. The Banking act
has also been amended to facilitate exemptions for banks that intend to hold fixed
assets in excess of what is required for normal operations. CBK (2007) reports show
that the banking industry in Kenya experienced significant growth, in terms of assets
that expanded to Kshs 951 billion. This growth in turn propelled a 28.5 per cent
growth in profits in 2007 compared to 2006.
Banking institutions were however, confronted by several challenges, the first one
being the urgent dictates that the Kenyan economy must substantially grow, income
equally distributed across the country, and the large numbers of qualified but,
unemployed skilled labour workforce be absorbed into the economy (CBK, 2007).
The second key challenge was the practical difficulties in lending to start-up
businesses with no risk capital/collateral and limited management expertise and lastly,
the adherence to increasing regulatory requirements aimed at maintaining the

7
soundness of the Kenyan financial sector.
1.2 Research Problem
Today, financial structure is one of the most important financial decisions for any
business and firm. This decision is imperative because the organization needs to
enhance return to different organizations and also have an effect on the value of the
organization, which is evident in the firm‟s financial performance. The relationship
between financial structure and financial performance is paramount in any firm. Saad
(2010) points out that financial managers face difficulties in precisely determining an
optimal financial structure for their firms. Optimal financial structure means a
minimum weighted average cost of capital and thus maximize the value of
organization. These points out a correlation between financial structure and financial
performance that is important to this study.
Determining an optimal capital structure is very hot issue in the literature of finance.
When an investor decides to invest in the stock of any company, the strength of
balance sheet helps him in making decision and capital structure is one of the
significant evaluators which determine strength of the balance sheet. Basically, the
capital structure of any company describes the long-term capital of the company that
is the mixture of debt and equity. So it is crucial for the company to have such a
mixture that will help in maximizing the company‟s stock price. Though the company
has many financing options, it is essential to choose that option which will increase its
overall value, an optimal capital structure of the company.
Studies in the last two decades have shown that commercial banks in Sub-Saharan
Africa are more profitable than the rest of the world with an average Return on Assets
(ROA) of 2 percent (Flamini et al., 2009). These have been based on the choices on

8
financial structures such as investment in risky ventures. The other possible reason for
the high profitability in commercial banking business in Sub-Saharan Africa is the
existence of huge gap between the demand for bank service and the supply thereof.
Kiprotich (2012) studied the effect of financial structure on the performance of
commercial banks in Kenya. He found that commercial banks prefer short term
leverage as their source of capital. Halkano (2012) compared the performance of
conventional vs. Islamic banks in Kenya. They found that conventional banks
performed better than Islamic banks. they also learned that Islamic banks were more
liquid than conventional banks but had more inherent risks to investors.
Ongore (2011) studied financial performance of the Kenyan banks and found that the
sector was quite profitable. One of the factors that influenced the financial
performance of the firms lied with various choices on financial structures such as
ownership identity. Oloo (2011) also noticed that despite the good overall financial
performance of banks in Kenya, there are a couple of banks which were declaring
losses and faced bailouts.
Of the banks that were declaring losses, Shariah compliant banks were noticed to be
among them. This makes Islamic banks appear not profitable in this profitable
venture. Why would they not be profitable? Islamic banks are known to have a
different financial structure from other conventional banks that are recording profits
in the region. Could this be influencing their financial performance? This study
therefore intends to address the following research question: What is the effect of
financial structure on the performance of conventional banks and Islamic banks in
Kenya?

9
1.3 Objective of the Study
To establish the effect of financial structure on the performance of conventional banks
and Islamic banks in Kenya
1.4 Value of the Study
There are limited studies that have been carried out to measure the performance of
conventional banks against Islamic banks. This means that there is little proof to
various theories existing in this area of study. This study is therefore a contribution to
fostering existing theories in this area of study. It is also a contribution to the few
academic papers that have been made in the country and region.
Several financial institutions are introducing Shariah compliant banking products.
This is done to improve their financial performance. Findings of this study can
provide insights on the differences in the financial structures and its influence on
financial performance. This can be used in determining better financial structures, to
improve financial performance.
Practicing financial managers could also use the findings of this study as a guide in
making financial structure decisions. Another purpose of research is to make
people aware of Islamic banks financial position and to make comparison of
performance of Islamic and Conventional banks in order to identify, which one
has, better financial position. This could also be of great help in influencing
policy formulation.

10
CHAPTER TWO
LITERATURE REVIEW
2.1 Introduction
This literature review examines past authors‟ and scholars‟ studies, relevant to the
research questions set out in Chapter one. The literature review will address the
research questions using several authors who are acknowledged and examines the
relevant topics.
2.2 Theoretical Review
Academic research shows a wide range for optimal capital structure. However, it is
not possible for financial managers to find out any specific method which will help in
defining optimal financing mix. But capital structure theories help them in
understanding how this mix will have an impact on the value of the organization. The
main theories discussed in this study are: the Capital Irrelevance Theory, the Trade-
Off theory and the Agency Cost theory.
2.2.1 Capital Structure Irrelevance Theory
Modigliani and Miller (1958) proposed “Capital Irrelevance Theory” by analysing the
effect of capital structure on firm‟s value and they made the base to think about the
capital structure. They suggested that under perfect market an organization‟s value is
not affected by its chosen capital structure. In other words, capital structure of the
firm is not affected by selling debt or issuing stocks and cost of capital will remain
constant.
Modern capital structure theory began by Modigliani and Miller's classical paper
(1958) which led to the development of a large number of theoretical and empirical

11
papers. These papers examine the capital structure of chosen listed companies. The
main proposition of this work is that, under a number of restrictive assumptions, the
value of a company is independent from its financial structure. These assumptions
include the absence of taxes, transactions and bankruptcy costs, equality of lending
and borrowing rates and finally the independence of the productive activities of the
company from its financing decisions.
Following the classical work of Modigliani and Miller (1958) which argued that the
value of a company is independent from its financial structure, the theoretical and
empirical capital structure studies, have been extended to incorporate additional
factors, such as taxes, bankruptcy cost, agency costs and asymmetric information
issues. This theory points out that there is no relationship between a firm‟s financial
structure and its value – which is tied to financial performance measures. It
contradicts the presumption in this study which is the existence of an effect of
financial structure on financial performance of a firm.
2.2.2 Trade-Off Theory
According to the Trade-Off theory of Myers (1977), a firm must define a target debt-
equity ratio after considering nature and requirement of business and then put its
efforts to attain that target. This theory suggests that debt financing offers more
benefit to an organization as compared to equity financing since it gets tax shield on
interest paid on debt while equity income is charged with tax. In relation to this study,
this theory suggests that there is a relationship between financial structure and
financial performance. In precision, capital structure (debt /equity financing) relates
positively with financial performance.

12
2.2.3 Agency Cost Theory
Jensen and Meckling (1976) were the first who proposed Agency Cost Theory. It is
assumed under this theory that there exist two types of conflicts of interest in any
organization. First conflict is between the managers and shareholders and second is
between the shareholders and bondholders. Between shareholders and managers,
conflicts arise due to the reason that managers may take decisions in their own self-
interests that are not in line with the aim of maximizing shareholders‟ wealth. Second
type of conflict, between the debt-holders and shareholders, arises due to having
different approach for risk and expected return. Debt-holders have more interest in
current profit because it guarantees their returns. In contrast, shareholders may be
willing to relinquish their current profit in order to get long-term appreciation in
capital. This creates an agency problem. This theory is based on the various forms of
financial structures that may exist in a company, as well as the various financial
performance measures. It shows that different choices of financial structure have
different effects on financial performance.
2.3 Conventional Banks vs. Islamic Banks
Islamic banking and conventional banking approach business differently and traced
its origin to specific focus groups. conventional banking often traced as „western
banking‟ as noted by Beck et al (2009), Islamic banking rooted its origin in Middle
East as noted by Wilson (2009). The growth of Islamic banking, since inception of
Dubai Islamic Bank in 1973, instigated comparative research between conventional
banking and Islamic banking.
The scope of these studies were different and included: comparison of leverage and
profitability by Toumi et al. (2011), comparison of operational framework by Awan

13
(2009), comparison of profitability and performance by Ansari and Redman (2011),
study on differences and similarities by Hanif (2011), comparison on asset quality,
liquidity and profitability by Jaffar et al. (2011), comparison on risk management
practices by Hassan (2011), comparison on customer satisfaction by Ahmed et al.
(2011) and comparison on liquidity risk management by Akhtar et al. (2011) to name
few.
2.3.1 Structural differences between Islamic and Conventional Banks
In order to understand the strength and weakness of Islamic banks with regard to its
performance, it is essential to know the basic environment in which Islamic banks
operate. It is the difference in environment that makes the Islamic bank unique and
distinguished. Abdus (2004) documents that according to the Shariah, Islamic
financial institutions must be based strictly on four basic principles; (1) All
transactions must be interest free, i.e., free from riba. (2) Activities or transactions
involving speculation (gharar) must be avoided. (3) The implementation of Zakat, the
compulsory Islamic tax. (4) No involvement in the production or consumption of
goods and services which are haram (i.e., illegal from the Islamic point of view).
The following is a discussion of these four principles that make the Islamic banking
unique. The Qur’an explicitly prohibits riba but does permit trade (al-Qur’an, 2:
185). It does not clearly mention whether riba is interest or usury. The lack of clarity
led to a controversy among the Muslim scholars in the past. However, there now
seems to be a general consensus that the term riba includes any amount charged over
and above the principal (Abdus, 2004).
The payment of interest or receiving of interest, which is the fundamental principle of
conventional banking and financing, is explicitly prohibited in Islamic banking and

14
finance. Thus, the prohibition of interest, in payment or receipt, is the nucleus of
Islamic banking and its financial instruments, while the charging of interest in all
modes of transaction whether it is in loan, advances or leasing is the core in the
conventional banking. The Islamic banking is not simply interest-free banking. It
takes into account issues of gharar, haram, Zakat and qarè al-úasan.
Abdus (2004) informs that gharar is speculation or gambling and is forbidden in
Islam. Islam allows risk-taking in business transactions, but it prohibits speculative
activity and gambling. Any transaction involving the element of speculation like
buying shares at a low price and selling them at a higher price in the future is
considered illegal. Conventional banks, on the other hand, have no constraint in
financing investment involving speculation.
Zakat is a compulsory religious payment or tax on the wealth of the rich payable to
the poor. It is a built-in mechanism in Islam for ensuring the redistribution of wealth
and the protection of a fair standard of living for the poor (Abdus, 2004). Zakat is one
of the five pillars of Islam. Each Islamic bank must establish a Zakat fund and pay
Zakat on the profits earned. This does not exist in conventional banking.
Ahmad and Ausaf (1987) point out that in Islam, investment in production and
consumption is guided by strict ethical codes. Muslims are not permitted to invest in
production, distribution and consumption enterprises involved in alcohol, pork,
gambling, illegal drugs, etc., even though these enterprises may be profitable.
Providing financing for such activities is illegal in Islam.
Thus, Islamic banks face constraints and operate in a non-friendly environment in
most of the Muslim countries. One should keep the underlying differences in mind in
order to make a fair comparison between the Islamic and the conventional banks.

15
2.4 Determinants of Financial Structures
The theory of capital structure is closely related to the firm's cost of capital. Capital
structure is the mix of the long-term sources of funds used by the firm. The primary
objective of capital structure decisions is to maximize the market value of the firm
through an appropriate mix of long-term sources of funds. This mix, called the
optimal capital structure, will minimize the firm's overall cost of capital. However,
there are arguments about whether an optimal capital structure actually exists. The
arguments focus on whether a firm can, in reality, affect its valuation and its cost of
capital by varying the mixture of the funds used (Beasley and Brigham, 2000, Ross et
al., 2002).
Also, it is important to examine the capital structure of companies because it affects
company‟s real decisions about employment, production, and investment (Harris and
Raviv, 1991). Some of the main studies that examined the determinants of the capital
structure include Myers (1984), Titman and Wessel (1988), Harris and Raviv (1991),
Rajan and Zingales (1995), Bevan and Danbolt (2000), Booth et al., (2001), Huang
and Song (2002), Antonion et al., (2002), Caesar and Holmes (2003), Chen (2004),
Hall et al., (2004) and Buferna et al., (2005).
According to the above studies, the main determinants of the capital structure are: size
of the company, tangibility, profitability, growth opportunities, short-term debt and
long-term debt. Both theoretical and empirical capital structure studies have generated
many results that attempt to explain the determinants of capital structure. As a result
of these studies, some broad categories of capital structure determinants have
emerged. Titman and Wessels (1988) and Harris and Raviv (1991) however, point out
that the choice of suitable explanatory variables is potentially continuous.

16
2.5 Determinants of Financial Performance
The determinants of bank performances can be classified into bank specific (internal)
and macroeconomic (external) factors (Al-Tamimi, 2010; Aburime, 2005). These are
stochastic variables that determine the output. Internal factors are individual bank
characteristics which affect the banks performance. These factors are basically
influenced by internal decisions of management and the board. The external factors
are sector-wide or country-wide factors which are beyond the control of the company
and affect the profitability of banks.
As explained above, the internal factors are bank specific variables which influence
the profitability of specific bank. These factors are within the scope of the bank to
manipulate them and that they differ from bank to bank. These include capital size,
size of deposit liabilities, size and composition of credit portfolio, interest rate policy,
labour productivity, and state of information technology, risk level, management
quality, bank size, ownership and the like. CAMEL framework often used by scholars
to proxy the bank specific factors (Dang, 2011). CAMEL stands for Capital
Adequacy, Asset Quality, Management Efficiency, Earnings Ability and Liquidity.
Each of these indicators is further discussed below.
Capital is one of the bank specific factors that influence the level of bank profitability.
Capital is the amount of own fund available to support the bank's business and act as a
buffer in case of adverse situation (Athanasoglou et al., 2005). Banks capital creates
liquidity for the bank due to the fact that deposits are most fragile and prone to bank
runs. Moreover, greater bank capital reduces the chance of distress (Diamond, 2000).
However, it is not without drawbacks that it induce weak demand for liability, the
cheapest sources of fund Capital adequacy is the level of capital required by the banks

17
to enable them withstand the risks such as credit, market and operational risks they
are exposed to in order to absorb the potential loses and protect the bank's debtors.
According to Dang (2011), the adequacy of capital is judged on the basis of capital
adequacy ratio (CAR). Capital adequacy ratio shows the internal strength of the bank
to withstand losses during crisis. CAR is directly proportional to the resilience of the
bank to crisis situations. It has also a direct effect on the profitability of banks by
determining its expansion to risky but profitable ventures or areas (Sangmi and Nazir,
2010).
The bank's asset is another bank specific variable that affects the profitability of a
bank. The bank asset includes among others current asset, credit portfolio, fixed asset,
and other investments. Often a growing asset (size) is related to the age of the bank
(Athanasoglou et al., 2005). More often than not the loan of a bank is the major asset
that generates the major share of the banks income. Loan is the major asset of
commercial banks from which they generate income. The quality of loan portfolio
determines the profitability of banks. The loan portfolio quality has a direct bearing
on bank profitability. The highest risk facing a bank is the losses derived from
delinquent loans (Dang, 2011). Thus, nonperforming loan ratios are the best proxies
for asset quality. Different types of financial ratios used to study the performances of
banks by different scholars. It is the major concern of all commercial banks to keep
the amount of nonperforming loans to low level. This is so because high
nonperforming loan affects the profitability of the bank. Thus, low nonperforming
loans to total loans shows that the good health of the portfolio a bank. The lower the
ratio the better the bank performing (Sangmi and Nazir, 2010).

18
Management Efficiency is one of the key internal factors that determine the bank
profitability. It is represented by different financial ratios like total asset growth, loan
growth rate and earnings growth rate. Yet, it is one of the complex subject to capture
with financial ratios. Moreover, operational efficiency in managing the operating
expenses is another dimension for management quality. The performance of
management is often expressed qualitatively through subjective evaluation of
management systems, organizational discipline, control systems, quality of staff, and
others. Yet, some financial ratios of the financial statements act as a proxy for
management efficiency. The capability of the management to deploy its resources
efficiently, income maximization, reducing operating costs can be measured by
financial ratios. One of this ratios used to measure management quality is operating
profit to income ratio (Rahman et al. in Ilhomovich, 2009; Sangmi and Nazir, 2010).
The higher the operating profits to total income (revenue) the more the efficient
management is in terms of operational efficiency and income generation. The other
important ratio is that proxy management quality is expense to asset ratio. The ratio of
operating expenses to total asset is expected to be negatively associated with
profitability. Management quality in this regard, determines the level of operating
expenses and in turn affects profitability (Athanasoglou et al., 2005).
Liquidity is another factor that determines the level of bank performance. Liquidity
refers to the ability of the bank to fulfil its obligations, mainly of depositors.
According to Dang (2011) adequate level of liquidity is positively related with bank
profitability. The most common financial ratios that reflect the liquidity position of a
bank according to the above author are customer deposit to total asset and total loan to
customer deposits. Other scholars use different financial ratio to measure liquidity.
For instance Ilhomovich (2009) used cash to deposit ratio to measure the liquidity

19
level of banks in Malaysia. However, the study conducted in China and Malaysia
found that liquidity level of banks has no relationship with the performances of banks
(Said and Tumin, 2011).
The macroeconomic policy stability, Gross Domestic Product, Inflation, Interest Rate
and Political instability are also other macroeconomic variables that affect the
performances of banks. For instance, the trend of GDP affects the demand for banks
asset. During the declining GDP growth the demand for credit falls which in turn
negatively affect the profitability of banks. On the contrary, in a growing economy as
expressed by positive GDP growth, the demand for credit is high due to the nature of
business cycle. During boom the demand for credit is high compared to recession
(Athanasoglou et al., 2005). The same authors state in relation to the Greek situation
that the relationship between inflation level and banks profitability is remained to be
debatable. The direction of the relationship is not clear (Vong and Chan, 2009).
2.6 Measures of Financial Performance
Profit is the ultimate goal of commercial banks. All the strategies designed and
activities performed thereof are meant to realize this grand objective. However, this
does not mean that commercial banks have no other goals. Commercial banks could
also have additional social and economic goals. However, this study focuses on the
ultimate goal of all businesses, profitability. To measure the profitability of
commercial banks there are variety of ratios used of which Return on Asset, Return
on Equity and Net Interest Margin are the major ones (Murthy and Sree, 2003;
Alexandru et al., 2008).

20
2.6.1 Return on Equity (ROE)
ROE is a financial ratio that refers to how much profit a company earned compared to
the total amount of shareholder equity invested or found on the balance sheet. ROE is
what the shareholders look in return for their investment. A business that has a high
ROE is more likely to be one that is capable of generating cash internally. Thus, the
higher the ROE the better the company is in terms of profit generation. It is further
explained by Khrawish (2011) that ROE is the ratio of Net Income after Taxes
divided by Total Equity Capital. It represents the rate of return earned on the funds
invested in the bank by its stockholders. ROE reflects how effectively a bank
management is using shareholders‟ funds. Thus, it can be deduced from the above
statement that the better the ROE the more effective the management in utilizing the
shareholders capital.
2.6.2 Return on Assets (ROA)
ROA is also another major ratio that indicates the profitability of a bank. It is a ratio
of Income to its total asset (Khrawish, 2011). It measures the ability of the bank
management to generate income by utilizing company assets at their disposal. In other
words, it shows how efficiently the resources of the company are used to generate the
income. It further indicates the efficiency of the management of a company in
generating net income from all the resources of the institution (Khrawish, 2011). Wen
(2010) states that a higher ROA shows that the company efficiently uses its resources.
2.6.3 Net Interest Margin (NIM)
NIM is a measure of the difference between the interest income generated by banks
and the amount of interest paid out to their lenders (for example, deposits).Relative to
the amount of their (interest earning) assets. It is usually expressed as a percentage of

21
what the financial institution earns on loans in a specific time period and other assets
minus the interest paid on borrowed funds divided by the average amount of the
assets on which it earned income in that time period (the average earning assets). The
NIM variable is defined as the net interest income divided by total earnings assets
(Gul et al., 2011).
NIM measures the gap between the interest income the bank receives on loans and
securities and interest cost of its borrowed funds. It reflects the cost of bank
intermediation services and the efficiency of the bank. The higher the NIM, the higher
the bank's profit and the more stable the bank is. Thus, it is one of the key measures of
bank profitability. However, a higher NIM could reflect riskier lending practices
associated with substantial loan loss provisions (Khrawish, 2011).
2.7 Empirical Review
Studies on the comparison of financial structures of Conventional banks against
Islamic banks started when Islamic banking started gaining noticeable popularity in
various regions. The first empirical investigations started in the 1990s. The available
studies are observed below.
Metwally (1997) evaluated the performance of 15 interest-free banks and 15
conventional banks in terms of liquidity, leverage, credit risk, profitability and
efficiency. He concluded that the two groups of banks may be differentiated in terms
of liquidity, leverage and credit risk, but not in terms of profitability and efficiency.
Interest-free banks rely more heavily on their equity in loan financing and face more
difficulties in attracting deposits than interest-based banks. Interest-free bank hold a
higher Cash/deposit ratio because they tend to be relatively more conservative in
using their loan-able funds and lack lending opportunities. The profit/loss sharing

22
principle has made it difficult for interest-free banks to finance personal loans and
pushed interest-free banks to channel a greater proportion of their funds to direct
investment (using Musharaka and Mudaraba tools of finance). Both banks offer their
depositors similar returns and direct the largest proportion of their funds towards the
financing of durables.
Samad and Hassan (1999) evaluated the inter-temporal and interbank performance of
Islamic bank Islam Malaysia Berhad (BIMB) for the period 1984-1997 by using same
performance measures and found that in inter-temporal comparison Islamic bank
BIMB's made (statistically) significant progress in profitability while the BIMB risk
increased. In interbank comparison the study found that BIMB is relatively more
liquid and less risky compared to a group of 8 Conventional banks. A study conducted
on five Islamic banks from MENA region analyzed their financial statements over the
period 1993 – 2002 found that liquidity risk arises because of pre mature withdrawal
by account holders due to a mismatch between investor‟s expectations of return and
the actual return. Therefore Islamic banks are required to keep adequate cash or cash
equivalents to meet the demand. They identified the other reasons of liquidity risk can
be the lack of confidence on the banking system, reliance on few large depositors,
reliance on current accounts and restrictions of Islamic banks on sales of debt.
The profitability of Islamic banks is low due to short term investments and low equity
base (Badr-El-Din, Ibrahim and Vijaykumar, 2003). In case of Islamic banks, short
term Debt financing includes Murabaha, Salam, and Qard fund and long term debt
financing includes Sukuk, leasing and Istisna. In case of Conventional banks short
term debt financing include treasury bills, trading bonds, short term loan and
advances and deposits at other financial institution that mature within one year. Long

23
term debt financing include non-trading bonds and medium and long term loans
(Hussein, 2004).
Iqbal (2001) made comparison of performance of Islamic banks with conventional
banks. He compared performance of both types of 12 banks of equivalent size during
1990-1998. In additional to profitability, liquidity, and risk some more variables such
as capital adequacy and deployment efficiency were also studied. The performance of
Islamic banks has been evaluated using both trend and ratio analysis. He concluded
that Islamic banks as a group out-performed the former in almost all areas and in
almost all years. He analyzed through ratio analysis. He concluded that Islamic banks
are not suffering from excess liquidity and are more cost effective and profitable than
their Conventional counterparts. Kader, Janbota, Asarpota and Anju (2007) and
Safiullah (2010) found the same results in UAE and Bangladesh respectively.
The conventional banks profitability theories exist in Islamic banking. It is found that
determinants such as capital ratio, liquidity, interest rate and money supply have
similar effect on Islamic banks. Capital ratio, interest rate and inflation are positively
related with the profitability of Islamic banks. However there is negative relationship
between market share and profitability (Haron and Ahmad, 2001). The conventional
financing system is concerned only with the interest rate, while the Islamic financial
system provide loan without interest and collateral or only against an administrative
cost (Arif, 1988; Ayub, 2002).
Islamic banks are certainly more profitable than their conventional peers enjoying the
same balance sheet structure. The main reason for such a difference is that Islamic
banks benefit from a market imperfection. Islamic banks lose on the grounds of
liquidity, assets and liabilities concentrations and operational efficiency (Hassoune,

24
2002). The NIM another indicator of performance measure indicate that Conventional
banks are operationally efficient than Islamic banks. The profitability of interest-free
banks is positively influenced by high capital and loan-to-asset ratios, favourable
macroeconomic conditions, and negatively to taxes (Hassan & Bashir, 2003).
Omet and Nobanee (2001) examined the capital structure of listed industrial
companies in Jordan. Using firm level panel data, the mean leverage ratios and the
mean ratios of long term debt to total debt are calculated during the time period 1978-
1998. Based on the statistical analysis, they found that company size and retained
earnings divided by total assets are significant determinants of leverage. Furthermore,
it was found that fixed assets to total assets and total assets are the only significant
determinant factors of the debt ratios.
Regarding banks‟ financial structure studies discussed, Bevan and Danbolt (2002)
point out that capital structure studies examining the determinants of leverage based
on total debts may disguise the significant differences between long-term and short-
term debt, this study decompose debt into long-term and short-term debt. The debt
ratio is: total debt to total assets, short-term debt to total assets and long-term debt to
total debts. On the other hand Bevan and Danbolt (2002) report that size of the firm is
found to be negatively related to short-term debt and positively related to long-term
debt. Also they found that the more profitability firms should hold less debt, because
high levels of profits provide a high level of internal funder.
Huang and Song (2002) have investigated the determinants of capital structure of
companies in China, using firm level panel data, the mean leverage ratios and the
mean ratios of long-term debt to total debt. They found a significant positive
relationship between leverage ratios and the firm size.
25
Antonion et al. (2002) found that the capital structure decisions of firms were not only
affected by its own characteristics but also by its surrounding environment. The
surrounding environment may affect the firm's capital structure for different reasons,
such as the deterioration or the improvement in the state of economy, the existence of
a stock market and the size of a firm for its leverage ratio. Sukkari (2003) analyzed
the determinants of the capital structure for Kuwait companies during the time period
1996-2001. Based on company level data, the mean total leverage ratio and the mean
long-term debt to total debt are calculated. Based on the empirical results, it found
that the leverage ratios were low and that company size and company profitability
was the most important determinants of leverage.
Buferna, et al. (2005) investigated the determinants of capital structure of Libyan
private and public companies utilising data from 1995 to 1999. Debt was decomposed
into three categories: short-term, long-term and total debt. The results indicate that
profitable Libyan companies were externally financed and prefer short-term debt
sources. The main public companies use both short-term and long-term debt. Growing
companies tend to rely on their internal funds and large companies tend to have
higher leverage.
The overall financial performance of banks in Kenya in the last two decade has been
improving. However, this doesn't mean that all banks are profitable, there are banks
declaring losses (Oloo, 2010). Studies have shown that bank specific and
macroeconomic factors affect the performance of commercial banks (Flamini et al.,
2009). In this regard, the study of Olweny and Shipho (2011) in Kenya focused on
sector-specific factors that affect the performance of commercial banks. Yet, the
effect of macroeconomic variables was not included. Moreover, to the researcher's
26
knowledge the important element, the moderating role of ownership identity on the
performance of commercial banks in Kenya
Halkano (2012) carried out a comparative case study on the performance of 2 Islamic
banks and 5 conventional banks in Kenya. He compared the banks‟ financial ratios
and the results of the study indicated that on the whole, the conventional banks
performed better than the Islamic banks during the period under review. The study
found Islamic banks to be more liquid than the conventional banks. On risk and
solvency, the Islamic banks seemed to perform better but while the trend for
conventional banks was showing to be stable, the Islamic banks were showing
increasing risks. And therefore considering that the Islamic banks have only been in
Kenya for a short period, the fast increase in risk is an indicator they may be more
risky than the conventional banks.
2.8 Summary of Literature Review
Very few studies (Fatuma, 2009 and Halkano, 2012) have been dedicated for the
comparison of conventional banks and Islamic Banks in Kenya. This study perform‟s
the comparison and sheds some light on the financial performance between Islamic
and conventional banks in Kenya based on the financial structures of the two types of
banks.

27
CHAPTER THREE
RESEARCH METHODOLOGY
3.1 Introduction
This section is organized under the following subsections: Research design, target
population, sample size, data analysis and data presentation.
3.2 Research Design
The research design used in this study is a descriptive research design. Cooper and
Schindler (2009) define descriptive research design as one in which information is
collected without changing the environment. This study employ‟s quantitative
methods of doing research, which have been practiced, as recommended by
management studies in the developing countries. Cooper and Schindler (2009) go
ahead and argue that Descriptive studies are also conducted to demonstrate
associations or relationships between things in the world around you. These are the
aims of this study.
3.3 Population
All the licensed commercial and Islamic banks in the country were the target
population of this study. There are 42 registered banks operating in Kenya (Appendix
I). Of these, only 2 are fully Shariah compliant. The Central Bank of Kenya classifies
banks into three peer groups: small medium and large. Since Islamic compliant banks
are in the small peer group, the study only considered comparison of 22 banks in the
small peer group.

28
3.4 Data Collection
This study was based on secondary data obtained from published statements of
accounts of the commercial banks in Kenya and CBK for four years from 2009 to
2012.
3.5 Data Analysis
The data was collected using data collection sheet. These were then edited, cleaned
and coded. The statistical package for social sciences (SPSS) was used to analyze the
data through appropriate statistical tools, which included descriptive statistics and
linear regression model.
3.5.1 Analytical Model
In this comparative study ordinary regression equation was employed to measure and
evaluate the difference in financial performance of the Islamic and Conventional
Banks. This study conducted regression analysis by using SPSS software program to
estimate our equation. This study replicated a model used by Raheel et al. (2013) in
their study of the effect of financial structure on financial performance of Pakistani
firms. The model is:
ROEi,t = α + β(DER)i,t + θ(Ln Total Asset)i,t + ei,t
Where:
DER = Debt to Equity Ratio
ROE = Return on Equity
Ln Total Asset = Size of firm
ei,t = The error term

29
There was need to test the significance of proxy of financial structure in measuring
the financial performance of the banks. This was achieved by testing the formulated
hypotheses below:
H0: DER and firm size have no significant effect on firm‟s financial performance.
H1: DER and firm size have significant effect on firm‟s financial performance.

30
CHAPTER FOUR
DATA ANALYSIS AND FINDINGS
4.1 Introduction
This chapter analyses the findings of the study and aims at interpreting them to meet
the objective outlined in the first chapter of the study. This section shows how data
was collected, analyzed and then discussed.
4.2 Findings
The study sampled 5 conventional banks with a small market share to compare to the
2 Islamic banks that are available in the country. This is similar to Halkano (2012)
who carried out a comparative case study on the performance of 2 Islamic banks and
5 conventional banks in Kenya. The conventional banks were randomly sampled out
of a population of 20 conventional banks with a small market share. The data
retrieved from financial statements to the banks as well as Central Bank of Kenya‟s
“Bank Supervision Annual Report” as the model required. The banks studied listed in
the table 1 below.
Table 4.1: Banks Sampled
Conventional Banks Islamic Banks
1. ABC
2. Consolidated
3. Credit
4. Fina Bank
5. Oriental
1. First Community Bank
2. Gulf-African Bank
Source: Research Findings

31
Data collected was sorted, cleaned and organized using Microsoft Excel as shown in
Appendix II. Statistical Package for Social Statistics (SPSS) was then used to run
regression analysis on the variables to estimate the model to the study to Islamic and
Conventional banks
4.3 Descriptive statistics
Table 4.2: Descriptive Statistics
type of bank Minimum Maximum Mean Std. Deviation Variance
Conventional Bank ROE in 2009 .03 .22 .1175 .06956 .005
ROE in 2010 .04 .29 .1556 .09476 .009
ROE in 2011 .05 .30 .1759 .09014 .008
ROE in 2012 .07 .26 .1332 .07800 .006
DER in 2009 2.11 9.25 5.6409 2.71222 7.356
DER in 2010 1.33 9.68 5.9333 3.65235 13.340
DER in 2011 1.34 9.68 6.1055 3.29832 10.879
DER in 2012 3.49 10.44 6.4491 2.80831 7.887
ln(tot assets in 2009) 21.84 23.23 22.6135 .63743 .406
ln(tot assets in 2010) 22.23 23.45 22.8704 .59681 .356
ln(tot assets) in 2011 22.34 23.45 22.9711 .55112 .304
ln(tot assets in 2012 22.55 23.67 23.1965 .57695 .333
Islamic Bank ROE in 2009 -.23 -.14 -.1856 .06279 .004
ROE in 2010 -.28 .04 -.1222 .22656 .051
ROE in 2011 .12 .13 .1256 .01103 .000
ROE in 2012 .24 .27 .2560 .02404 .001
DER in 2009 5.72 5.74 5.7277 .01534 .000
DER in 2010 6.84 10.29 8.5632 2.43802 5.944
DER in 2011 8.79 9.45 9.1190 .46486 .216
DER in 2012 7.69 8.24 7.9624 .39140 .153

32
ln(tot assets in 2009) 22.22 22.77 22.4937 .39194 .154
ln(tot assets in 2010) 22.58 22.98 22.7804 .28847 .083
ln(tot assets) in 2011 22.89 23.28 23.0875 .27462 .075
ln(tot assets in 2012 23.02 23.33 23.1761 .21836 .048
Source: Research Findings
Table 4.2 above shows the descriptive statistics to each of the variables used in the
study. It shows general growth in each of the variables among Islamic and
conventional banks through the years under study. This shows growing profitability
among both groups. However, Islamic banks have negative ROE in the years 2009
and 2010.
The mean ROE for conventional banks through the period is 14.56% while that for
Islamic banks is 1.85%. Lower ROE between Islamic banks is due to losses incurred
by banks in this category during the period. Islamic banks have a higher average DER
compared to conventional banks. Islamic banks have a DER of 7.81 while
conventional banks have a DER of 5.57. This shows that Islamic banks are more
aggressive and include more debt in their financial structure compared to their
conventional counterparts. They are also becoming more efficient in managing
shareholders‟ equity as time goes by. Conventional banks have a higher ln (total
assets) of 23.04 while Islamic banks have ln (total assets) of 22.91. This shows that
conventional banks have more assets on average compared to Islamic banks.
From Table 4.2, there has been general growth across the variables. This shows
growth among the banks. Islamic banks, which are the newest of the banks sampled,
started off by recording losses. Through the period, they have recorded growing ROE,
higher than conventional banks. This observation has been visualized in figure 4.1
below.

33
Figure 4.1: Comparison of Conventional and Islamic Banks’ ROE.
This figure shows the change of the avarage ROE in Islamic and conventional banks from the year 2009 – 2012.
Source: Research Findings
Islamic banks have a higher average debt to equity ratio compared to conventional
banks. This reveals that Islamic banks use more debt compared to conventional banks
in the acquisition of assets. The size of the banks can be observed to be growing
through the years. This can be observed through the growing asset size. Often a
growing asset (size) is related to the age of the bank (Athanasoglou et al., 2005).
4.4 Regression Analysis
Appendix II shows the dataset that was used in regression analysis. Regression
analysis was run across all the years in the period under analysis. Discussions of the
findings are therefore also based on year under study.
For the purpose of testing hypotheses about the values of model parameters, the linear
regression model also assumes the following: The error term has a normal distribution
with a mean of 0; the variance of the error term is constant across cases and
independent of the variables in the model. An error term with non-constant variance is
said to be heteroscedastic, the value of the error term for a given case is independent

34
of the values of the variables in the model and of the values of the error term for other
cases.
4.4.1 Comparison of Financial Performance
Before going ahead to compare the effects of financial structure to the financial
performance between conventional and Islamic banks, it is important to verify that the
models are suitable for comparison. This is done by examining the portion of data that
is used in The first part of linear regression is the determination of the portion of data
that has been used in predicting the models. This is done by examining the R
statistics. From table 4.2 below, the regression models for the years 2010, 2011 and
2012 can be predicted using the models. R values shows the level of correlation
between the dependent and independent variables while the R square values show the
proportion of independent variables that describe the dependent variable.
From table 4.3 below, the R values for the years 2010, 2011 and 2012 are 97.6%,
96.3% and 74.7% for conventional banks‟ data and 100% for Islamic banks data..
These indicate high correlation between the dependent and independent variables. The
R and square values for the respective models are 95.3%, 92.7% and 55.8%
respectively for conventional banks‟ data and 100% for Islamic banks‟ data. This
means that the dependent variables of the years 2010, 2011 and 2012 in the model
have been influenced by 95.3%, 92.7% and 55.8% of the independent variables. For
the year 2009, R square value is 0.233. This means that the dependent variable can
only be described using 23% of the dataset. This would make the model inaccurate in
describing banks under study‟s performance in that year.

35
Table 4.3: Regression Model Summaries
Year Type of bank R R Square
Adjusted R
Square
Std. Error of
the Estimate
2009 Conventional Bank .483a .233 -.534 .08616
Islamic Bank 1.000b 1.000 . .
2010 Conventional Bank .976c .953 .905 .02916
Islamic Bank 1.000d 1.000 . .
2011 Conventional Bank .963e .927 .853 .03451
Islamic Bank 1.000f 1.000 . .
2012
Conventional Bank .747g .558 .117 .07331
Islamic Bank 1.000h 1.000 . .
a. Predictors: (Constant), ln(tot assets in 2009), DER in 2009
b. Predictors: (Constant), ln(tot assets in 2009)
c. Predictors: (Constant), ln(tot assets in 2010), DER in 2010
d. Predictors: (Constant), ln(tot assets in 2010)
e. Predictors: (Constant), ln(tot assets) in 2011, DER in 2011
f. Predictors: (Constant), ln(tot assets) in 2011
g. Predictors: (Constant), ln(tot assets in 2012, DER in 2012
h. Predictors: (Constant), ln(tot assets in 2012
Source: Research Findings
4.4.2 Analysis of Variance (ANOVA)
The next part of regression analysis is the (ANOVA). The ANOVA is used in testing
hypothesis of the whole model. We compare the calculated F ratio to the significant F

36
ratio (which is read from the statistical table of critical values), and reject the null
hypothesis if the calculated F ratio is greater than the critical F ratio. In our case, the
hypothesis to be tested is clearly outlined in chapter three. The results from the
ANOVA table in Table 4.4 show that the calculated, absolute F value for the
conventional banks is greater than the significant F value in all the years except in
2009. We therefore we reject the null hypothesis for conventional banks at 95% level
of confidence for all the years under study except for 2009. This implies that based on
our analysis, we are 95% confident that DER and firm size have significant effect on
firm‟s financial performance. This allows us to go ahead to the next level of the
analysis, which is the study of the specific regression model for conventional banks.
Table 4.4: ANOVA Table
2009 ANOVAc
Year Type of bank Sum of Squares Df Mean Square F Sig.
2009 Conventional
Bank
Regression .005 2 .002 .304 .767a
Residual .015 2 .007
Total .019 4
Islamic Bank Regression .004 1 .004 . .b
Residual .000 0 .
Total .004 1
2010 ANOVAf
2010 Conventional
Bank
Regression .034 2 .017 20.120 .047d
Residual .002 2 .001
Total .036 4
Islamic Bank Regression .051 1 .051 . .e

37
Residual .000 0 .
Total .051 1
2011 ANOVAi
2011 Conventional
Bank
Regression .030 2 .015 12.649 .073g
Residual .002 2 .001
Total .033 4
Islamic Bank Regression .000 1 .000 . .h
Residual .000 0 .
Total .000 1
2012 ANOVAl
2012 Conventional
Bank
Regression .014 2 .007 1.264 .442j
Residual .011 2 .005
Total .024 4
Islamic Bank Regression .001 1 .001 . .k
Residual .000 0 .
Total .001 1
a. Predictors: (Constant), ln(tot assets in 2009), DER in 2009
b. Predictors: (Constant), ln(tot assets in 2009)
c. Dependent Variable: ROE in 2009
d. Predictors: (Constant), ln(tot assets in 2010), DER in 2010
e. Predictors: (Constant), ln(tot assets in 2010)
f. Dependent Variable: ROE in 2010
g. Predictors: (Constant), ln(tot assets) in 2011, DER in 2011

38
h. Predictors: (Constant), ln(tot assets) in 2011
i. Dependent Variable: ROE in 2011
j. Predictors: (Constant), ln(tot assets in 2012, DER in 2012
k. Predictors: (Constant), ln(tot assets in 2012
l. Dependent Variable: ROE in 2012
Source: Research Findings
The F value for Islamic banks was not computed because the residual sum of squares
in the ANOVA tables was zero. This is because one of the variables (DER) could not
fit into the model. The regression analysis for Islamic banks‟ models proceeded
without one variable.
The Standard Errors are the standard errors of the regression coefficients. They can be
used for hypothesis testing and constructing confidence intervals. The T statistic tests
the hypothesis that a population regression coefficient is 0 when the other predictors
are included in the model. It is the ratio of the sample regression coefficient to its
standard error. This statistic is a measure of the likelihood that the actual value of the
parameter is not zero. In our case, since the absolute T values are greater than the
significant T values except one; it means that the levels of the variables in
conventional banks‟ models in the years under study except in 2009 have a
statistically significant influence on ROE among the banks under study. For Islamic
banks, only one variable was used in predicting the model. Therefore, T could not be
computed.

39
4.4.1 Financial Structure and Financial Performance
Table 4.5: Models’ Coefficients Table
Unstandardized
Coefficients
Standardized
Coefficients
Dependent
variable Type of bank B Std. Error Beta T Sig.
ROE in 2010 Conventional
Bank
(Constant) -9.393 1.506 -6.236 .025
DER in 2010 -.065 .011 -2.506 -5.804 .028
ln(tot assets in 2010) .434 .069 2.736 6.335 .024
Islamic Bank (Constant) -18.013 .000 . .
ln(tot assets in 2010) .785 .000 1.000 . .
ROE in 2011 Conventional
Bank
(Constant) -8.150 1.748 -4.663 .043
DER in 2011 -.049 .013 -1.783 -3.678 .067
ln(tot assets) in
2011
.375 .079 2.295 4.734 .042
Islamic Bank (Constant) 1.053 .000 . .
ln(tot assets) in
2011
-.040 .000 -1.000 . .
ROE in 2012 Conventional
Bank
(Constant) -3.072 2.482 -1.238 .341
DER in 2012 -.011 .023 -.405 -.489 .674
ln(tot assets
in 2012
.141 .112 1.045 1.259 .335
Islamic Bank (Constant) 2.808 .000 . .
ln(tot assets
in 2012
-.110 .000 -1.000 . .
Source: Research Findings

40
The third and the final part of the regression analysis is the estimation of the models.
This is obtained from the coefficients table generated by the SPSS software. These
coefficients are shown in table 4.5 above. From table 4.5 above, final model estimates
can be drawn by reading the corresponding B values. The final estimates for the
models are therefore shown in table 2 below:
Table 4.6: Estimated equations
Year Conventional Bank Islamic Bank
2010
ROE= -9.39 - 0.07(DER) + 0.79
ln(total asset) + e
ROE = -18 + 0.79 ln (total assets) + e
2011
ROE=-8.15 - 0.05 (D/R ratio) + 0.38
ln(total assets) + e
ROE = 1.05 – 0.04 ln(total assets) + e
2012 ROE = -3.07 - 0.01(DER) + 0.14
ln(total assets) +e
ROE = 2.81 – 0.11 ln(total assets) + e
Source: Research Findings
From these models, it is clear that in conventional banks, there is a relationship
between all the financial structure variables and financial performance of the banks.
In Islamic banks, only assets have a relationship with financial performance.
For the year 2010, a decrease in debt/equity ratio by 0.07 led to an increase in ROE by
1 in the sampled conventional banks. An increase in the natural log to the total assets
by 0.79 resulted in an increase in ROE by 1 among conventional banks. For Islamic
banks, an increase in the natural log by 0.79 led to an increase in ROE by 1. For the
year 2011, a decrease in DER by 0.05 increased ROE of the sampled conventional
banks by 1. In the same year, an increase in the natural logarithm by 0.38 increased

41
the ROE of the conventional banks by 1. For Islamic banks, reduction in natural
logarithm of the total assets by 0.04 led to an increase in ROE by 1 in 2011. In 2012,
a decrease in DER by 0.01 increased the ROE by 1 while an increase in natural log of
the total assets by 0.14 increased the ROE by 1 among the conventional banks
sampled. On the other hand, decrease in the natural log of the total assets to the
Islamic banks by 0.11 increased the ROE by 1
4.5 Interpretation of Findings
Results mentioned in this section show that change in DER have a negative and
significant relation to change in ROE. If a firm‟s level of debt changes it is expected
to cause deviations in firm‟s ROE, ultimately increasing a firm‟s risk level. R square
value indicates that change in DER explains as high as 95 percent of the volatility in
returns of firms. This is highly evident in conventional banks, but not common
between Islamic banks.
The R values were found to be significant & positive for the association between debt
to equity ratio and the natural logarithm of total assets, in all the years under study
except in 2009 for both conventional and Islamic banks. debt to equity ratio and
natural logarithm of the total assets consisting the R values of 0.976, 0.963 and 0.747
for the years 2010, 2011 and 2012 respectively. This reveals that there is high
correlation between debt to equity ratio and the size of the firm in determining the
financial performance of banks.
In conventional banks, DER negatively affects ROE of the banks by less than 10%.
This means that an optimum financial mix for conventional banks would be one that
has minimum DER. On the other hand, acquisition of assets increases ROE.
Conventional banks are therefore increasing their ROE by investing in assets. This

42
finding can be explained by capitalization, a common characteristic of conventional
banks (Thorsten, Asli and Ouarda, 2010). However, Islamic banks data show no
statistically significant relationship between DER and ROE. However, assets tend to
have a negative impact on ROE in 2011 and 2012, but positive impact in 2010. It is
notable to point out that the inconsistency in the coefficients of the variables can be
attributed to the age and population of the Islamic banks. Banks, like other financial
institutions, require time to mature and have consistent results that can be analysed.
All the banks analysed use debt in financing their assets. This is because of the debt to
equity ratio values exceed 5. This value is higher in Islamic banks compared to
conventional banks. These findings are similar to the explanations of Damodaran
(2003) and Fischer (1989) suggesting that increase in firm‟s debt level increase its
risk level. Since debt provides a tax shield, firms increase the level of debt in their
financial structure and high debt level in the capital mix increase the risk level of
firms.
In summary our conventional banks‟ results support Fischer‟s (1989) dynamic trade
off theory predicting a negative relation between, capital structure and firm
performance, change in DER and firm value and also the level of risk of firms.
Fischer continues that banks with large advances have low financial distress costs and
easy access to capital market as compare to smaller banks and they prefer debt
financing to obtain target capital structure. Moreover, larger banks have low problem
of information asymmetry, low monitoring cost which will reduce agency cost and are
more diversified with stable cash flows which will lessen the possibility of
bankruptcy; therefore they prefer debt financing in their financing structure.
Akhavein, Berger, and Humphrey (1997) explains the reason of direct relationship

43
between size and leverage as banks with large size increase their lending thus
allowing banks to run their business with less capital. Gropp and Heider (2010) also
predict banks with larger size are more leveraged. Hence, findings of this study are
consistent with those of Hassoune (2002), Sukkari (2003) and Halkano (2012) which
found that: Islamic banks are more profitable than their conventional banks
counterparts, company size is a key determinant of financial structure of a company
and Islamic banks face more risks in Kenya compared to their conventional
counterparts.
44
CHAPTER FIVE
SUMMARY, CONCLUSION AND RECOMMENDATIONS
5.1 Introduction
This last section of the study gives a summary of the entire study, conclusions,
limitations, recommendations and proposals of areas for future research studies.
Having met the objectives of the study,
5.2 Summary
This study compares the effect of financial structure on financial between Islamic
banks and conventional banks in Kenya. It seeks to find out the variation in financial
structure and the effects on financial performance between conventional and Islamic
banks. The study explored a descriptive research design and formulated hypotheses to
help achieve the objective of the study. The elements of financial structure studied
were debt to equity ratio and the size of the bank. For financial performance, this
study considered only one measure: ROE. Data required for the study was collected
from audited financial statements of the sampled banks and Central Bank of Kenya‟s
Annual Audit Reports of the banks.
Ordinary Least Squares was used in analysing the collected data. Analysis was done
based on four years: 2009 – 2012. The findings revealed an overall growth among the
banks sampled. This can also be observed across all the variables through the years.
The findings revealed that the effect of debt to equity ratio to ROE was quite low in
conventional banks, while it did not exist at all in Islamic banks. the size of the banks,
however, had significant effect on ROE of both Islamic and conventional banks.
Among the conventional banks, ROE has a negative relationship with debt to equity
45
while it has a positive relationship with the size of the firm. For the Islamic banks, on
the other hand, ROE has no relationship with debt to equity ratio, but a significantly
small negative relationship with the size of the firm.
5.3 Conclusion
The intended aim of conducting this study was to compare the influence of financial
structure on financial performance between conventional and Islamic banks in Kenya.
The findings of study validated a negative relationship between ROE and debt to
equity ratio among the conventional banks and an optimistic dependence on bank
size. Islamic banks‟ ROE on the other hand, had no relationship debt to equity ratio
and an insignificantly negative relationship with the size of the banks. Now by
comparing the models of both Islamic and conventional banks, results of each
variable we can conclude that there exist a difference in the financial structure of
Islamic banks and conventional banks.
5.4 Policy Recommendations
Islamic banks do not participate in any interest based investment. Even though there
are treasury bills and bonds which conventional banks have access to, Islamic banks
do not stand such a chance. The government should therefore push for the creation of
investment alternatives to Islamic banks.
The current market conditions seem to favour conventional banks compared to
Islamic banks. This is because of the numerous interest based investments that
conventional banks can access. This places them at an advantage, above their Islamic
counterparts. The government should, therefore, come up with strategies that will
provide fair competitive markets to both Islamic to conventional banks.

46
The trends on performance of Islamic banks in Kenya show losses during the first
years of operation. This indicates the risks the Islamic banks face in the Kenyan
market. The government should therefore take on measures that would lower the risks
faced by new Islamic banks in the industry such as interest free lending rates from
CBK for a given period.
5.5 Limitations of the Study
There are several issues related to the topic of study. However, most of them have not
been touched. This dissertation only focuses on the issue raised in the research
question. Here are the limitations:
The analysis does not touch on other performance indicators such as growth
opportunities, maturity, sustainability, shareholders‟ wealth maximization and
profitability. The analysis is restricted only to one accounting performance measure:
ROE.
This study does not tackle the instantaneous effect on corporate performance of any
changes in corporate governance structure, but rather concentrates on the relation
between capital structure and financial performance.
The effects of the geographical location of the firms and current global economic
performance on the capital structure decisions and financial performance of Kenyan
firms are not studied as this on its own deserves a separate study.
5.6 Areas for Further Research
Capital structure is a puzzling concept especially so in emerging markets like Kenya.
This study has laid groundwork to compare how financial structure influences

47
financial performance of Islamic and conventional banks. Further study is required to
address the following:
Include other measures of financial performance such as ROA, NIM and profitability.
The studies should include other performance indicators such as growth opportunities,
maturity, sustainability, shareholders‟ wealth maximization and profitability.
Further studies should also formulate new hypothesis as well as design new variables
which can reflect the influence of the institution. In addition to this, more detailed
work should that will show the effects of geographical location of the banks and
current global economic performance.
Finally, this study compared two Islamic banks to five conventional banks. The whole
industry consists of two Islamic banks and forty three conventional banks. The same
study should be carried out to cover a larger geographic region that would provide a
fair representation of both Islamic and conventional banks. The study should also
study longer periods and select more established Islamic banks

48
REFERENCE
Abdus, S. (2004). Performance of Interest-free Islamic Banks Vis-à-vis Interest-based
Conventional banks. Journal of Economics and Management 12, no.2.The
International Islamic University, Malaysia
Abor, J. (2005). The effect of capital structure on profitability: an empirical analysis
of listed firms inGhana, Journal of Risk Finance, 6, 438-47.
Abor, J. (2007). Debt policy and performance of SMEs: evidence from Ghanaian and
South Africa firms. Journal of Risk Financ. 8, 364-79.
Aburime, U. (2005) Determinants of Bank Profitability: Company-Level Evidence
from Nigeria. Nigeria: University of Nigeria, Enugu Campus.
Ahmad, A. (1987). Development and Problems of Islamic Banks. Jeddah: Islamic
Research and Training Institute, Islamic Development Bank.
Ahmad, A., Rehman, K., & Safwan, N. (2011).Comparative study of Islamic and
conventional banking in Pakistan based on customer satisfaction. African
Journal of Business Management,5(5). 1768-1773.
Akhtar, M.H., Ali K. & Sadaqat, S. (2011). Liquidity Risk Management: A
comparative study between Conventional and Islamic Banks of Pakistan,
Interdisciplinary Journal of Research in Business, 1(1). 35-44.
Al-Tamimi, H., Hassan, A. (2010). Factors Infuluncing Performance of the UAE
Islamic and Conventional National Banks. Department of Accounting, Finance
and Economics, College ofBusiness Administration, University of Sharjah.

49
Ansari, S. & Rehman, K. (2011). Comparative Financial Performance of existing
Islamic Banks and Contemporary Conventional Banks in Pakistan.Proceedings
2nd International Conference on Economics, Business and Management,
IPEDR 22.
Antoniou, A., Guney, Y., & Paudyal, K. (2002). Determinants of Corporate Capital
Structure: Evidence from European Countri., University of Durham, Working
paper, pp: 1-8.
Ariff, M. (1988).“Islamic Banking.”Asian-Pacific Economic Literature, 2(2). 46-62.
Athanasoglou, P.P., Sophocles, N.B., Matthaios, D.D. (2005). Bank-specific, industry-
specific and macroeconomic determinants of bank profitability.Working paper,
Bank of Greece. 1(1). 3-4.
Awan, A.G. (2009). Comparison of Islamic and Conventional Banking in
Pakistan.Proceedings 2nd CBRC, Lahore.
Ayub, M. (2002). Islamic Banking and Finance Theory and Practice. Karachi:
Research Department, State Bank of Pakistan.
Ayubi, N. (2000). Religion and Finance.
Badr-El-Din, A., Ibrahim, & Vijaykumar, K.C. (2003). Some Aspects of Liquidity in
Islamic Banks (ISBS) A Case Study of Selected Banks In The Mena
Region.Research report 422 sponsored by the ERF Research Program.
Baltagi, B.H. (2005.) Econometric Analysis of Panel Data. England: John Wiley &
Sons Ltd.The Atrium, Southern Gate, Chichester, West Sussex PO19 8SQ.

50
Beck, T., Demirguc-Kunt, A., & Merrouche, O. (2010). Islamic vs. Conventional
Banking Business Model. World Bank - Efficiency and Stability Policy
Research Working Paper, 5446.
Besley, S. & Brigham, E.F. (2000). Essentials of managerial finance. Twelfth edition,
the Dryden press, USA, P. 458.
Bevan, A. & Danbolt, J. (2000). Dynamics in the Determinants of Capital Structure in
the UK.University of Glasgow, Working paper, pp: 1-10.
Booth, L., Aivazian, V., Demirguc-Kunt, A. and Maksimovic, V. (2001). Capital
Structures in Developing Countries. The Journal of Finance, LVI: 87-130.
Buferna, F., Bangassa, K., & Hodgkinson, L. (2005). Determinants of Capital
Structure: Evidence from Libya. University of Liverpool, Working Paper, pp: 2-
7.
Caesar, G. & Holmes, S. (2003). Capital Structure and Financing of SMEs: Australian
Evidence. Journal of Accounting and Finance. 43: 123-147
Chen, J. (2004). Determinants of Capital Structure of Chinese-listed Companies,
Journal of Business Research. 57: 1341-1351
Chowdhury, A., & Chowdhury, S. P. (2010). Impact of Capital Structure on Firm‟ s
Value: Evidence from Bangladesh. Business and Economic Horizons, Vol. 3,
Issue 3, pp. 111-122
Damodaran, A. (2003). Investment Philosophies: Successful Investment Philosophies
and the Greatest Investors Who Made Them Work. Wiley. 1-15.

51
Dang, U. (2011). The CAMEL Rating System in Banking Supervision: a Case Study of
Arcada University of Applied Sciences. International Business.
Demirguc-Kunt, A. & Ross, L. (1999). Bank-based and market-based financial
systems: cross-country comparison.mimeo, World Bank.
Diamond, D.W., Raghuram, A. (2000). A Theory of Bank Capital. The Journal of
Finance.52(6). 12-23
Donaldson, G. (1961). Corporate Dept Capacity: A Study of Corporate Debt Policy
and the Determination of Corporate Debt Capacity. Division of Research,
Graduate School of Business Administration, Harvard University.
Fatuma, H.M. (2010). An Analysis of Shariah Compliant Banking in Kenya. Masters
Disertation Submitted to Strathmore Business School, Nairobi, Kenya.
Fischer, E.O., Heinkel, R.., & Zechner, J. (1989). Dynamic capital structure choice:
theory and tests, Journal of Finance 44, 19-40.
Flamini, C., Valentina C., McDonald, G., & Liliana, S. (2009). The Determinants of
Commercial Bank Profitability in Sub-Saharan Africa. IMF Working Paper.
Gujarati, D.N. (2003). Basic Econometrics.United States Military Academy, West
Point. Published by McGraw-HiII/lrwin, a business unit of The McGraw-Hili
Companies, Inc. 1221 Avenue of the Americas, New York, NY, 10020.
Gul, S., Faiza, I., Khalid, Z. (2011). Factors Affecting Bank Profitability in Pakistan.
The Romanian Economic Journal, 2(3). 6-9.

52
Halkano, Molu, (2012). Performance of Islamic and Conventional Banks in Kenya: A
Comparative Case Study. College of Humanities and Social Sciences,
University of Nairobi.
Hall, G., Hutchinson, P. & Michaelas, N. (2004). Determinants of the Capital
Structures of European SMEs. Journal of Business Finance & Accounting. 31:
711-728.
Hanif, M. (2011). Differences and Similarities in Islamic and Conventional Banking,
International Journal of Business and Social Science, 2(2).
Haron, S. & Ahmad, N.H. (2001). Conventional Banking Profitability Theories in
Islamic Banking: Some Evidences. Journal of Islamic Banking and Finance,
18(3&4). 122-131.
Harris, M. & Raviv, A. (1991). The Theory of Capital Structure. The Journal of
Finance, 46: 297-355.
Hassan, M.K., & Bashir, A.H.M. (2003). Determinants of Islamic Banking
Profitability. Paper presented at the Economic Research Forum (ERF) 10th
Annual Conference, 16th-18th
December 2003, Marrakech: Morocco.
Hassan, W.M. (2011). Risk Management Practices: A Comparative Analysis between
Islamic Banks and Conventional Banks in the Middle East, International
Journal of Academic Research, 3.
Hassoune, A. (2002). Islamic Banks‟ Profitability in an Interest Rate Cycle.
International Journal of Islamic Financial Services, 4(2)

53
http://www.investopedia.com/terms/f/financialperformance.asp. Accessed on18th
June
2013.
Huang, S. & Song, F. (2002). The Determinants of Capital Structure: Evidence from
China. Working paper, The University of Hong Kong, pp: 2-7.
Ilhomovich, S.E. (2009) Factors affecting the performance of foreign banks in
Malaysia, Malaysia: A thesis submitted to the fulfillment of the requirements
for the degree Master of Science (Banking) College of Business (Finance and
Banking.)
Iqbal, Zubair, & Abbas, M. (1987). “Islamic Banking.”International Monetary Fund,
Washington, D.C.,
Jaffar, M & Manarvi, I. (2011). Performance comparison of Islamic and
Conventional banks in Pakisthan, Global Journal of Management and Business
Research, 11(1). Version 1.
Jensen, M. C., & Meckling, W. H. (1976). Theory of the firm: Managerial behaviour,
agency costs and ownership structure. Journal of financial economics,
3(4).305-360.
Kader, Janbota M., & Asarpota, A.K. (2007).vComparative Financial Performance of
Islamic vis-à-vis Conventional Banks in the UAE. Paper presented at 2006-2007
Annual Student Research Symposium & First Chancellor‟s Undergraduate
Research Award at UAE University.
54
Khrawish, H.A. (2011). Determinants of Commercial Banks Performance: Evidence
from Jordan International Research Journal of Finance and Economics. Zarqa
University, 5(5). 19-45.
Kiprotich, B. (2012). A survey of the effect of financial structure on the performance
of commercial Banks in Kenya. Kenyata University.
Krishnan, V. S. & R. C. Moyer (1997). “Performance, Capital Structure and Home
Country: An Analysis of Asian Corporations”, Global Finance Journal, Vol. 8,
Issue 1, Pp. 129 -143.
Metwally, M.M. (1993). Essays on Islamic Economics, Academic Publishers,
Calcutta.
Modigliani, F. & Miller, M. (1958). The Cost of Capital, Corporation Finance and
the Theory of Investment. The American Economic Review, 48: 261-297.
Murthy, Y., Sree, R. (2003). A Study on Financial Ratios of major Commercial
BanksResearch Studies. College of Banking & Financial Studies, Sultanate of
Oman.
Musa, L.B. (2007). Determining whether Muslims prefer to use a fully fledged Islamic
Bank to meet their banking needs or whether they can work with products
offered by conventional banks that have introduced Islamic banking windows
Myers, S. C. (1977). Determinants of corporate borrowing. Journal of financial
economics, 5(2).147-175.
Myers, S. C. (1984). Capital structure puzzle. National Bureau of Economic Research
Cambridge, Mass., USA.

55
Myers. C, S, & Majluf., N. (1984). Corporate Financing and In-vestment Decisions
When Enterprises Have Information Investors Do Not Have. Journal of
Finance, 187-221.
Oloo, O. (2010). Banking Survey Report: The best banks this decade 2000-2009.
Think Business Limited, Kenya, www.bankingsurvey.co.ke
Olweny, T., Shipho, T.M. (2011). Effects of Banking Sectoral Factors on the
Profitability of Commercial Banks in Kenya. Economics and Finance Review,
1(5). 1-30.
Omet, G. & Nobanee, H. (2001). The Capital Structure of Listed Industrial
Companies inJordan.Arabic Journal of Administrative Sciences, 8: 273-289.
Ongore, V.O. (2011). The relationship between ownership structure and firm
performance: An empirical analysis of listed companies in Kenya. African
Journal of Business Managemen. 5(6). 2120-2128.
Raheel, M., Shahnaz, A., Rauf, Bashir, A., & Umara, N. (2013). Capital Structure and
Financial Performance: Evidence from Pakistan, Journal of Basic and Applied
Scientific Research. p. 115
Rajan, R. & Zingales, L. (1995). What Do Know About Capital Structure? Some
Evidence from International Data.The Journal of Finance. 50: 1421-1460.
Saad, N. M. (2010). Corporate Governance Cpmpliance and the Effects to capital
Structure. International Journal of Economics and Financial, 2(1).105-114.

56
Safiullah, M. (2010). Superiority of Conventional Banks & Islamic Banks of
Bangladesh: A Comparative Study. International Journal of Economics and
Finance, 2(3).
Said, R.M., Mohd, H.T. (2011) Performance and Financial Ratios of Commercial
Banks in Malaysia and China.
Samad, Abdus, (1999) Comparative Efficiency of the Islamic Bank Malaysia vis-à-vis
Conventional Banks. IIUM Journal of Economics and Management 7, no.1: 1-
25.
Sangmi, M., Tabassum, N. (2010). Analyzing Financial Performance of Commercial
Banks in India: Application of CAMEL Model. Pakistan Journal Commercial
Social Sciences.
Santos, J. A. C. (2000). Bank Capital Regulation in Contemporary Banking Theory: A
Review of the Literature. BIS working papers, No. 90, Bank for International
Settlements: Monetary and Economic Department, Basel, Switzerland.
Sathye, M. (2005). Market Structure and Performance in Australian Banking. Review
of Accounting and Finance, Vol. 4 Iss: 2, pp.107 – 124
Sidra, A., Bilal & Sumaira, T., (2013). Determinants of Capital Structure: What can
be the Determinants of Capital Structure of Banking Sector in Pakistan? Hailey
College of Commerce, University of the Punjab, Lahore
Sumon, B. & Ralitza, D. (2004). How important is ownership in a market with a level
playing field. The Indian banking industry revisited. Journal of Comparative
Economics 32, no. 1: 165-180.

57
Titman, S. & Wessels, R. (1988). The Determinants of Capital Structure Choice. The
Journal of Finance, 43: 1-19.
Toumi, K., Viviani, J.L., & Belkacem, L., (2011). A comparison of leverage and
profitability of Islamic and Conventional Banks. International Conference of the
French Finance Association (AFFI).
Vong, A, Hoi, S. (2009). Determinants of Bank Profitability in Macao. Faculty of
Business Administration, University of Macau.
Wen, W. (2010). Ownership Structure and Banking Performance: New Evidence in
China. Universitat Autònoma de Barcelona Departament D‟economia de
L‟empresa.
Wilson, R. (2009). The development of Islamic finance in the GCC. Working Paper,
Kuwait Programme on Development, Governance and Globalization in the Gulf
States.

58
APPENDIX I: List of Registered Commercial Banks as of 31st
December 2011 Commercial Bank Peer Group Year Licenced
1 African Banking Corporation Ltd Small 1984
2 Bank of Africa Kenya Ltd Medium 1980
3 Bank of Baroda (K) Ltd Medium 1953
4 Bank of India Medium 1953
5 Barclays Bank of Kenya Ltd Large 1953
6 CFC Stanbic Bank Ltd Large 1955
7 Chatterhouse Bank Ltd Small 1996
8 Chase Bank (K) Ltd Medium 1991
9 Citibank N.A Kenya Medium 1974
10 Commercial Bank of Africa Ltd Medium 1967
11 Consolidated Bank of Kenya Ltd Small 1989
12 Co-operative Bank of Kenya Ltd Large 1965
13 Credit Bank Ltd Small 1986
14 Development Bank of Kenya Ltd Small 1973
15 Diamond Trust Bank Kenya Ltd Medium 1946
16 Dubai Bank Kenya Ltd Small 1982
17 Ecobank Kenya Ltd Medium 2005
18 Equity Bank Ltd Large 2004
19 Family Bank Ltd Medium 1984
20 Fidelity Commercial Bank Ltd Small 1992
21 Fina Bank Ltd Small 1986
22 First Community Bank Ltd Small 2008
23 Giro Commercial Bank Ltd Small 2008
24 Guardian Bank Ltd Medium 1992

59
25 Gulf African Bank Limited Small 2007
26 Habib Bank A.G Zurich Small 1978
27 Habib Bank Ltd Small 1956
28 Imperial Bank Ltd Medium 1992
29 I&M Bank Ltd Medium 1974
30 Jamii Bora Bank Limited Small 1984
31 Kenya Commercial Bank Ltd Large 1986
32 K-Rep Bank Ltd Small 1999
33 Middle East Bank (K) Ltd Small 1980
34 National Bank of Kenya Ltd Medium 1968
35 NIC Bank Ltd Medium 1959
36 Oriental Commercial Bank Ltd Small 1991
37 Paramount Universal Bank Ltd Small 1993
38 Prime Bank Ltd Medium 1992
39 Standard Chatered Bank Kenya Ltd Large 1910
40 Trans National Bank Ltd Small 1985
41 UBA Kenya Bank Limited Small 2009
42 Victoria Commercial Bank Ltd Small 1987
Source: Directory of Commercial Banks And Mortgage Finance Companies – CBK
2011
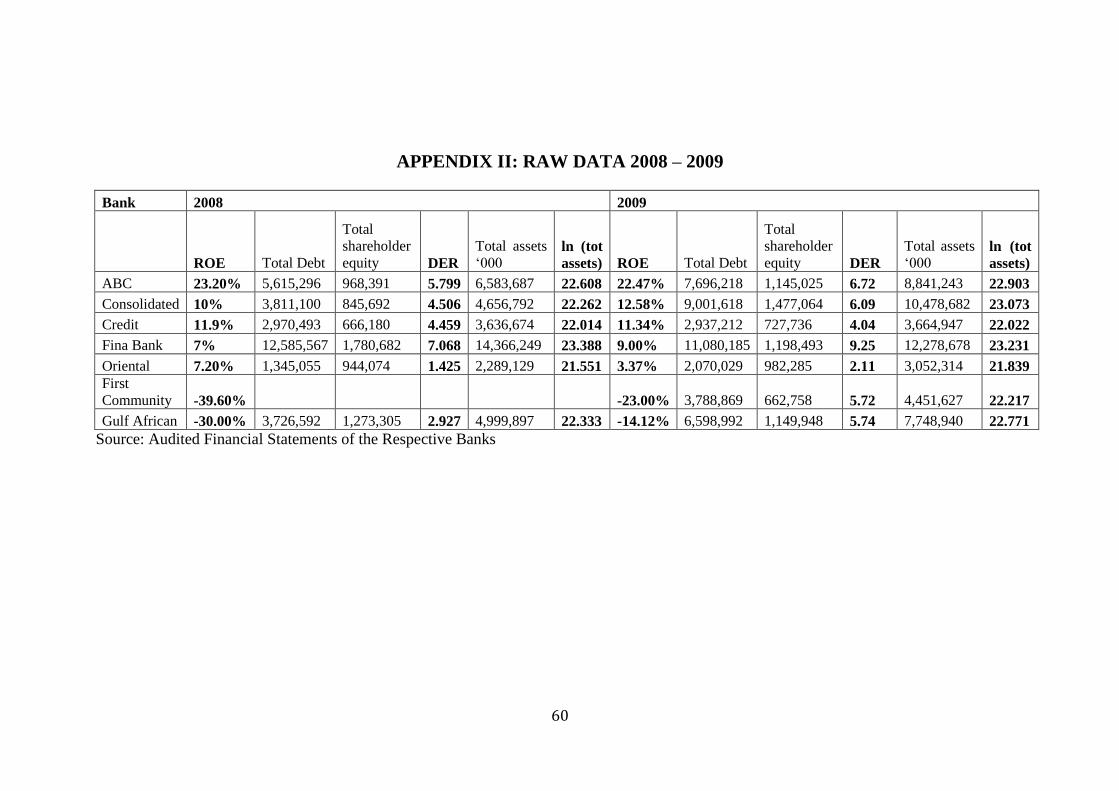
60
APPENDIX II: RAW DATA 2008 – 2009
Bank 2008 2009
ROE Total Debt
Total
shareholder
equity DER
Total assets
„000 ln (tot
assets) ROE Total Debt
Total
shareholder
equity DER
Total assets
„000 ln (tot
assets)
ABC 23.20% 5,615,296 968,391 5.799 6,583,687 22.608 22.47% 7,696,218 1,145,025 6.72 8,841,243 22.903
Consolidated 10% 3,811,100 845,692 4.506 4,656,792 22.262 12.58% 9,001,618 1,477,064 6.09 10,478,682 23.073
Credit 11.9% 2,970,493 666,180 4.459 3,636,674 22.014 11.34% 2,937,212 727,736 4.04 3,664,947 22.022
Fina Bank 7% 12,585,567 1,780,682 7.068 14,366,249 23.388 9.00% 11,080,185 1,198,493 9.25 12,278,678 23.231
Oriental 7.20% 1,345,055 944,074 1.425 2,289,129 21.551 3.37% 2,070,029 982,285 2.11 3,052,314 21.839
First
Community -39.60% -23.00% 3,788,869 662,758 5.72 4,451,627 22.217
Gulf African -30.00% 3,726,592 1,273,305 2.927 4,999,897 22.333 -14.12% 6,598,992 1,149,948 5.74 7,748,940 22.771
Source: Audited Financial Statements of the Respective Banks

61
APPENDIX III: RAW DATA 2010 – 2011
Bank 2010 2011
ROE Total Debt
Total
shareholder
equity DER
Total assets
„000 ln (tot
assets) ROE Total Debt
Total
shareholder
equity DER
Total assets
„000 ln (tot
assets)
ABC 29.46% 8,665,990 1,630,571 5.315 10,296,561 23.055 30.28% 10,804,808 1,702,087 6.35 12,506,895 23.25
Consolidated 17.45% 13,883,382 1,434,806 9.676 15,318,148 23.452 17.18% 13,883,382 1,434,806 9.68 15,318,148 23.452
Credit 3.55% 3,582,535 947,559 3.781 4,530,094 22.234 5.35% 4,436,023 958,041 4.63 5,394,064 22.409
Fina Bank 11.32% 12,776,242 1,336,123 9.562 14,112,365 23.37 20.22% 13,094,926 1,535,533 8.53 14,630,459 23.406
Oriental 16.07% 4,558,349 3,420,295 1.333 4,558,349 22.24 14.93% 5,030,090 3,740,031 1.34 5,030,090 22.339
First
Community -28.24% 5,814,846 565,252 10.29 6,380,099 22.576 13.34% 7,903,753 836,576 9.45 8,758,568 22.893
Gulf African 3.80% 8,370,219 1,223,842 6.839 9,594,061 22.984 11.78% 11,595,997 1,319,177 8.79 12,915,174 23.282
Source: Audited Financial Statements of the Respective Banks

62
APPENDIX IV: RAW DATA 2012
Bank 2012
ROE Total Debt Total shareholder equity DER
Total assets
„000 ln (tot
assets)
ABC 26.40% 16,959,170 2,111,609 8.031396911 19,070,779 23.67142
Consolidated 11.20% 16,426,695 1,574,163 10.43519318 18,000,858 23.61369
Credit 6.90% 5,228,686 1,178,799 4.435604374 6,407,485 22.58073
Fina Bank 13.90% 14,648,770 2,503,675 5.850907166 17,152,445 23.56541
Oriental 8.20% 4,835,380 1,384,526 3.492444346 6,219,906 22.55102
First
Community 27.30% 8,880,886 1,077,881 8.239208224 9,958,767 23.02172
Gulf African 23.90% 12,000,420 1,561,398 7.685689363 13,561,818 23.33052
Source: Audited Financial Statements of the Respective Banks