Embed Size (px)
Citation preview
The effect of felt compression on the performance and pressure drop
of all-vanadium redox flow batteries
Leon D. Brown1, Tobias P. Neville1,2, Rhodri Jervis1, Thomas J. Mason1, Paul R. Shearing1,
Daniel J.L. Brett1*
1Electrochemical Innovation Lab, Dept. Chemical Engineering, UCL, London, WC1E 7JE
2Centre for Nature Inspired Engineering, Dept. Chemical Engineering, UCL, London, WC1E
7JE
*Corresponding author. Email - [email protected]; Tel - + 44 (0) 20 7679 3310
Abstract
The compression of carbon felt electrodes for redox flow batteries leads to changes in the
electrochemical performance and has a large effect on the pressure drop of electrolyte flow through
the system. In this investigation, the authors have characterised the electrochemical performance of
all-vanadium redox flow batteries by studying the effect of compression on the contact resistance,
polarisation behaviour and efficiency. Contact resistance was seen to reduce from ca. 2.0 Ω cm2 to
1.2 Ω cm2 and an energy efficiency of 85% was obtained from a felt compressed to 75%. Moreover,
X-ray computed tomography (CT) has been employed to study the microstructure of felt electrodes
at compressions up to 70%, showing a linear decrease in porosity and a constant fibre surface area-
to-volume ratio. The pressure drop was modelled using computational fluid dynamics and employing
the 3D structure of the felts obtained from CT, revealing that a 60% increase in compression related
to a 44.5% increase in pressure drop.
Keywords: Energy storage; X-ray computed tomography; flow; contact resistance; compression
1. Introduction
Redox flow batteries (RFBs) are promising candidates for a variety of large scale energy storage
solutions, such as optimising renewable energy sources with intermittent supply, standalone power
systems, frequency regulation and peak shaving applications. RFBs have a particular advantage of
being able to de-couple power from energy: the former is a characteristic of the cell(s) architecture
(electrode area, operating voltage, etc.), whereas the latter is dependent on the volume (and
concentration) of electrolyte contained in external storage tanks. This gives RFBs great design
flexibility to match the requirements of a range of applications. Although many RFB chemistries have
been reported, including bromine-based [1-3], iron-based [4, 5] and organic-based systems [6-8], the
most developed is the all-vanadium redox flow battery (VRFB) [9]. The VRFB utilizes the four stable
oxidation states of vanadium: on the negative electrode vanadium exists in the V2+ (charged) and V3+
(discharged) states, whilst on the positive electrode vanadium exists in the V5+ (charged) and V4+
(discharged) states. An advantage of RFB systems over traditional battery systems is the rate of self-
discharge may be more easily controlled by removal of reactants from the reaction area of the cell
when the battery is not in use. Flow batteries can suffer from reactant cross-over, the rate and
selectivity of which is determined by the nature of the separator employed, which reduces the
capacity of the battery. However, an advantage of the all-vanadium system, over other mixed flow

battery chemistries, is that any imbalance from cross-over is able to be addressed electrochemically:
i.e., the electrolyte can be electrochemically regenerated without any chemical separation of
reactant required, by virtue of the reactants all being the same chemical species. However, RFBs, in
general, tend to suffer from low energy and power densities compared to hydrogen fuel cells and Li-
ion batteries.
Many studies have attempted to improve the performance of RFBs by altering numerous design
aspects of cells and stacks. Examples include thermal and chemical treatments of electrodes and
separators [10, 11], electrode modifications [12, 13], perforating electrodes to decrease pressure
drops [14] and addition of chemicals to the electrolyte [15, 16]. One particular study investigated the
effect of mechanical, electrical and morphological properties on compressed electrodes in VRFBs
[17]. The study showed that an increase of cell clamping pressure increases the peak power outputs
of RFB systems. The study only considers felts compressed to a maximum of 40% and the method of
extracting the porosity of these electrodes is based on a 2D optical technique containing many
assumptions, which lead to an estimated porosity.
Microstructural properties such as porosity and tortuosity of electrodes are inherently 3D properties
and should therefore be studied in three dimensions. Microstructural characteristics of RFB
electrodes are significant as they may have a large effect on the performance of said electrodes; for
example, electrolyte intrusion, pressure drop and porosity. Jervis et al. have designed a flow cell
which permits in situ microstructural characterisation of flow battery innards in three dimensions
[18]. In this study, the authors expand on the work of Chang et al. by considering felts over a broader
compression range and using X-ray computed tomography (CT) to extract true values of the
microstructure of felt electrodes (porosity, surface area, etc.) in three dimensions. Moreover, by
reconstructing the actual felt structures in three dimensions, computational fluid dynamics (CFD)
may be used to model the effect of felt compression on the liquid pressure drop through the actual
structure of the felts to deduce how the orientation of the felt fibres under compression affects the
electrolyte flow.
2. Experimental
2. 1 Electrochemical characterisation
Carbon felts with an uncompressed thickness of 3.18 mm (99% carbon, Alfa Aesar (43199.RR)) were
heat treated in air at 400°C for 30 hours to thermally activate the fibre surfaces, as described by Sun
et al. [10]. The felts were then cut into 5 5 cm squares for electrochemical testing and into 1/8”
discs for the X-ray tomography studies using a hollow punch, which is described below. Electrolyte
membrane (Nafion 117) was cut using a CO2 laser and then treated in 3% H2O2 for one hour,
followed by thermal treatment in 1M H2SO4 at 80°C before being rinsed in de-ionised water and
oven dried at 60°C for 30 minutes. Graphite composite blocks with a triple serpentine flow field (1
mm channel width, 1 mm depth) were fabricated in-house using a CNC routing machine; these
components acted to help distribute the anolyte and catholyte to the felt electrodes and conduct
charge to the external circuit via gold coated copper plates. PTFE spacers of various thicknesses were
used to control the compression of the felt electrodes. The whole assembly was held together using
bolted end-plates by tightening the eight bolts to a torque of 12 Nm and is shown in Figure 1(a). The
electrolyte used was a 1.6 M vanadium species (50:50 ratio V3+:V4+) in 3 M H2SO4 (PV3 Technologies,
UK). A three-arm peristaltic pump (Watson-Marlow Ltd., UK) was used to pump the electrolytes at a

normalised flowrate of 2 mL min-1 per cm2 of electrode area. The catholyte and anolyte were kept
under a flow of nitrogen and the battery was charged at 50 mA cm-2 until a potential of 1.6 V was
reached before holding potentiostatically at 1.6 V until the current fell below 2 mA cm-2. Once
charged, electrochemical impedance spectroscopy was performed to deduce the high frequency
intercept at open circuit (representing the Ohmic resistance of the cell) before a galvanostatic
polarisation curve was performed. Charge-discharge cycling was performed at a current density of
50 mA cm-2 until cell voltage limits of 1.6 V and 1.0 V were reached, respectively. Electrical resistivity
measurements were performed on a single, heat treated, SGL GFA6 felt and used the same setup
but without electrolyte flow and a membrane. All electrochemical measurements were made using
an Ivium NStat potentiostat (±5 A, ±12 V (Ivium Technologies B.V. NL)) apart from the electrical
resistivity measurements which were obtained from a Gamry Reference 3000 equipped with a
Gamry 30k Booster (Gamry Instruments, USA).
2.1 X-ray computed tomography and pressure drop modelling
Three 1/8” diameter tokens were cut from the carbon felts and then assembled into a fibreglass
housing with various thickness spacers, used to control the compression. The housing was
laminated with a fibreglass cap with the use of epoxy and held under pressure for 24 hours to allow
the epoxy to cure. The resulting tokens containing the compressed felts (assembly shown in Figure
1(b)) were then placed inside a ZEISS Xradia Versa 520 3D X-ray microscope (Zeiss, Pleasanton, CA).
The tokens were scanned using the laboratory X-ray source utilising a tungsten target and
acceleration voltage of 40 kVp. A total of 1601 projections were taken with 12 s exposure over 360°
using an objective lens with 4× magnification, resulting in a pixel size of 3.48 μm.
The tomograms were reconstructed using a filtered back-projection algorithm (Zeiss XM
Reconstructor) and imported into the Avizo software suite (FEI Co, USA) in order to calculate the
porosity of the samples and to measure the exact compression of each of the tokens. Smaller,
representative volumes of 1 mm3 of each of these scans were then cropped from the original data.
A surface mesh was generated for the three felts and contained 2.4×10⁶, 2.9×10⁶ and 3.8×10⁶ mesh
elements respectively (the increase in the number of mesh elements is due to more fibres being
present in the sample volume with compression). The resulting meshes were imported into the
StarCCM+ computational fluid dynamics software suite (CD Adapco, UK) [19-21]. This enabled
modelling of the pressure drop through the samples to be achieved. A Boolean subtraction of the
fibre volume was used in order to generate a surface mesh of the porous phase of the felts. The
sample pore volume was then extended by 0.1 mm to produce a void on each side in the cross
section in which the liquid flows. This void enabled the simulation to converge with much greater
accuracy. The pressure drop was calculated using a 64-bit operating system PC equipped with an
Intel® Xeon® CPU E5-2687W processor and 128 GB of installed RAM. The simulations were ran
assuming a steady state, laminar, liquid flow of water at constant density. The density of water was
not equal to that of the electrolyte but as the same conditions were used for each sample, the
results provide a semi-quantitative comparisons to be drawn. The pressure drop was modelled
through-plane for each axis and all other surfaces were set as a symmetry plane. The first through-
plane boundary condition was set to have a velocity inlet of 0.01 m s-1 whilst the second was set as a
pressure outlet at 0 Pa gauge. Convergence was achieved after approximately 200 iterations and a
mean CPU solver time of 2500 s.

Figure 1 – Illustration showing: (a) the cell assembly for experimentation containing: 1 the bolted end
plates; 2 the gold plated copper current collectors; 3 the POCO graphite composite flow field plate
(flow fields not shown); 4 the PTFE spacers used to control compression and 5 the felt electrode. The
membrane is not shown. (b) Shows the fiberglass housing (6). The thickness of the housing was
changed in order to control the compression on various felts. The fibreglass lid is also shown (7).
3. Results and discussion
3.1 Effect of compression on the contact resistance
Four different compressions of the carbon felts were tested electrochemically for the contact
resistance: 0 %, 25 %, 50 % and 75 % compression. The contact resistance measurements were
performed using electrochemical impedance spectroscopy with an AC perturbation of 15 mV at open
circuit voltage. The contact resistance was taken to be equal to the actual real high frequency
resistance (HFR) determined as the intercept with the real axis. Each test at differing compression
was performed with the electrolyte being pumped through the battery in the discharged state and
no significant variation in contact resistance was observed between the discharged and charged
electrolytes. The resulting area-specific resistances (ASR) are plotted versus the felt compression for
both heat treated and fresh (as received) felt electrodes in Figure 2. This value of the high frequency
resistance is composed of a number of Ohmic resistances in electrical series, including the
membrane resistances and contact resistances from the current collector/flow-field plate interface.
However, as the membrane is fully hydrated during normal cell operation and the cell assembly
remained constant during the setup of each cell for each value of compression, any changes in the
high frequency resistance are attributed to changes associated with felt compression.

Figure 2 –(a) Area specific resistance versus the felt compression for both as-received (red, circles)
and heat-treated (black, squares) felts. (b) Relative electrical resistivity of graphite felt electrodes.
Figure 2(a) shows a trend of decreasing ASR with higher compression of the carbon felts. This trend
was expected: as the carbon felts are more compressed the electronic resistance of the felt/carbon
composite is decreased, an observation also commented upon by other authors [22, 23]. It was also
suspected that due to the increased compression that the mutual contact between fibres also
contributed to the decrease in HFR, a phenomenon also commented upon by Wang et al., [12] .
However, later in this paper (Section 3.4), it is shown that there is no increase in contact between
the fibres with the compression values studied. The observed reduction in ASR with compression is
attributed solely to increases in fibre contact with the current collector, reducing the macro-contact
resistance of this interface. This ultimately reduces the overall electrical resistance of the cell and is a
phenomenon also observed by Chang et al. [17]. Heat treated felts show lower overall contact
resistances than the as-received, fresh, felts. They are also less sensitive to the effect of
compression. This is due to surface modification of the carbon and is discussed in detail by Sun et al.
[10]. Figure 2(b) shows the effect of compression on the relative electrical resistivity of the carbon
felt electrodes. There is a sharp decrease in relative electrical resistivity of the carbon felts up to
compression values of 20-30 %. Compression values >30 % result in a decrease in the rate of
decrease of relative electrical resistivity which is a phenomenon also observed by different felt
manufacturers (SGL Group and AVCarb, [24, 25]). It should also be noted that compression values >
80 % resulted in disintegration of the SGL GFA6 series felt structure.
3.2 Effect of felt compression on polarisation and power curves
Polarisation curves help identify the various voltage losses in an RFB system. The total voltage drop
is the summation of overpotentials from contact resistances (ηOhmic), activation overpotential (ηact.)
and mass transport limitations (ηconc.), as shown in Equation 1.
𝑉𝑙𝑜𝑠𝑠 = 𝜂𝑂ℎ𝑚𝑖𝑐 + 𝜂𝑎𝑐𝑡. + 𝜂𝑐𝑜𝑛𝑐. Equation 1
In order to ascertain the performance of the flow batteries under the various compressions,
polarisation curves were extracted at an initial state-of-charge (SOC) of 100%, deduced by
controlling the amount of charge passed during charging, initially calculated from the concentration
and volume of electrolyte used. After a polarisation curve was performed, the charge passed was
returned back to the system prior to running the next test (returning the system to 100% SOC).
Due to the large electrolyte inventory, it is calculated that reduction in SOC was less than 1% after
the polarisation curves were performed, and so the system can be assumed to be at steady state
throughout.
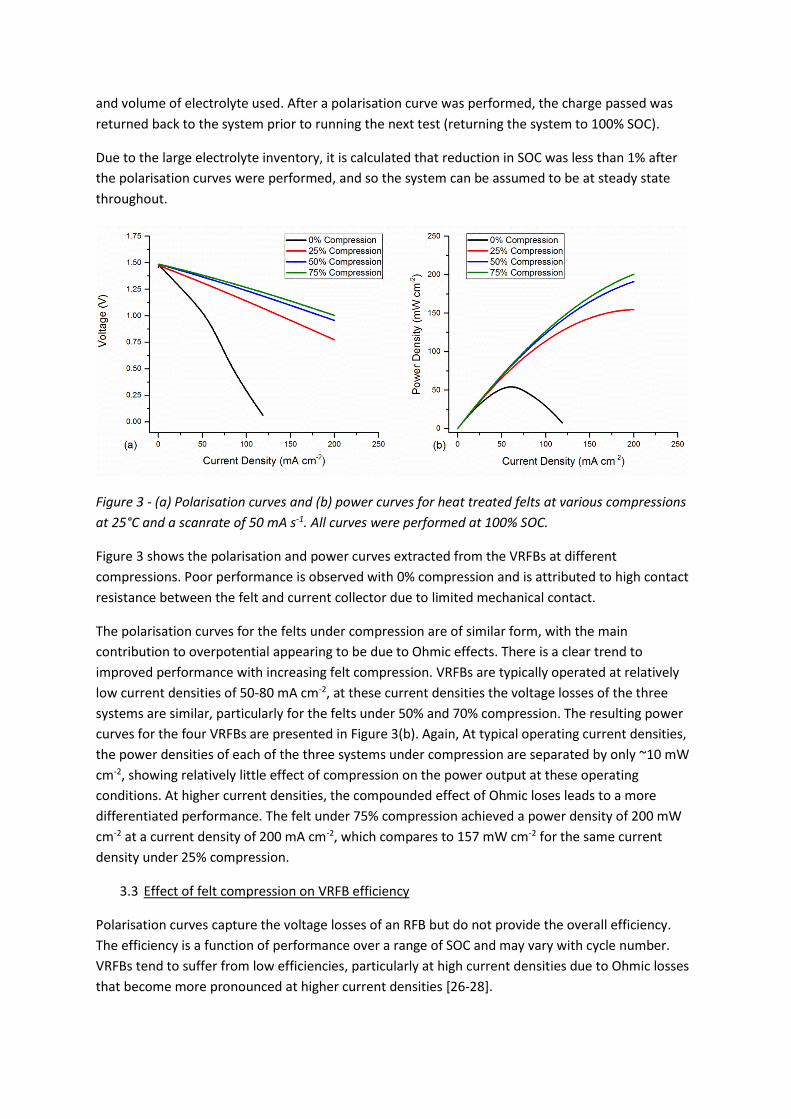
Figure 3 - (a) Polarisation curves and (b) power curves for heat treated felts at various compressions
at 25°C and a scanrate of 50 mA s-1. All curves were performed at 100% SOC.
Figure 3 shows the polarisation and power curves extracted from the VRFBs at different
compressions. Poor performance is observed with 0% compression and is attributed to high contact
resistance between the felt and current collector due to limited mechanical contact.
The polarisation curves for the felts under compression are of similar form, with the main
contribution to overpotential appearing to be due to Ohmic effects. There is a clear trend to
improved performance with increasing felt compression. VRFBs are typically operated at relatively
low current densities of 50-80 mA cm-2, at these current densities the voltage losses of the three
systems are similar, particularly for the felts under 50% and 70% compression. The resulting power
curves for the four VRFBs are presented in Figure 3(b). Again, At typical operating current densities,
the power densities of each of the three systems under compression are separated by only ~10 mW
cm-2, showing relatively little effect of compression on the power output at these operating
conditions. At higher current densities, the compounded effect of Ohmic loses leads to a more
differentiated performance. The felt under 75% compression achieved a power density of 200 mW
cm-2 at a current density of 200 mA cm-2, which compares to 157 mW cm-2 for the same current
density under 25% compression.
3.3 Effect of felt compression on VRFB efficiency
Polarisation curves capture the voltage losses of an RFB but do not provide the overall efficiency.
The efficiency is a function of performance over a range of SOC and may vary with cycle number.
VRFBs tend to suffer from low efficiencies, particularly at high current densities due to Ohmic losses
that become more pronounced at higher current densities [26-28].

In order to deduce the various efficiencies of a VRFB (Coulombic efficiency (CE), voltage efficiency
(VE) and energy efficiency (EE)), VRFBs must be subjected to charge-discharge cycling. The CE of the
system may be deduced by the ratio the charge (Q) passed when discharging to that during charging.
The energy efficiency is calculated by the ratio of the energy extracted from the system (the integral
of power (P) with time (t)) during discharging to the energy put into the system during charging. The
VE is calculated by dividing the EE by the CE, as shown in Equations 2-4:
𝐶𝐸 =𝑄𝑑𝑖𝑠𝑐ℎ𝑎𝑟𝑔𝑒
𝑄𝑐ℎ𝑎𝑟𝑔𝑒∙ 100 Equation 2
𝐸𝐸 = ∫ 𝑃𝑑𝑖𝑠𝑐ℎ𝑎𝑟𝑔𝑒 𝑑𝑡
∫ 𝑃𝑐ℎ𝑎𝑟𝑔𝑒 𝑑𝑡∙ 100 Equation 3
𝑉𝐸 =𝐶𝐸
𝐸𝐸∙ 100 Equation 4
For this investigation, batteries were subjected to cyclic charge-discharge in order to calculate the
CE, VE and EE values under various compressions. Due to the poor polarisation curves extracted
from the felt at 0 % compression, this felt was not included.
Figure 4 shows the efficiencies extracted over 10 charge-discharge cycles for felts at 25%, 50% and
75% compression running with a current density of 50 mA cm-2. All three felts show similar current
efficiency values of 94-95%. However, as compression increases, the VE (and therefore EE) also
increases. This gives rise to the felts compressed to 75% achieving voltage efficiencies of 90%,
resulting in an energy efficiency of >85%.
Figure 4 – Effect of felt compression on Coulombic, voltage and energy efficiency for (a) 25%, (b) 50%
and (c) 75% compressed felt electrode. Each experiment was performed at a current density of 50
mA cm-2. Cut-off voltages of 1.6 V and 1.0 V were used for charging and discharging, respectively.
Although the polarisation curves show relatively little difference between the performance of
different felt compressions, when operated at 50 mA cm-2 and 100% SOC, the effect on voltage (and
subsequently energy) efficiency is more marked when whole discharge/charge cycles are considered
and capture the full range of performance at low SOC where mass transport effects will be more
evident. It should also be noted that while the Coulombic efficiency remains relatively unchanged
with cycle number for each compression, the cycle performance for voltage (energy) efficiency
improves with increasing compression. At 25% compression there is a decrease of 1.3% over the 10
cycles, improving to 0.3% for 50% compression and stable cycle performance at 75% compression.

3.4 Microstructural characterisation
X-ray CT can be used to investigate the microstructure of carbon felts, revealing true microstructural
characteristics, such as porosity. This eliminates any assumptions and difficulties arising from the use
of two-dimensional techniques [29]. Three carbon felt tokens were fabricated and compressed by 44
%, 55% and 70%. The compression values measured here are different to those studied
electrochemically due to difficulties in machining the exact thickness of the fibreglass housing. The
porosity and surface area for the entire felt sample was analysed and used to provide a basis for
cropping smaller, representative volumes. A representative volume analysis was conducted to yield
a representative volume element (RVE): a smaller sample volume of the total felt volume which
permits representative measurements of the bulk felt to be calculated. A major advantage of using a
RVE is that it permits significantly shorter computational times to be used whilst ensuring the sample
size is a true representation of the bulk sample. Measurements yielded for the RVE are valid
regardless of the sample volume. In order to deduce a representative volume, the total scanned
fibre volume was subjected to a uniform shrink analysis [30]. The results of this analysis are
presented in Figures 5(a-c). The RVE has been defined as a sub-volume in which both the pore phase
tortuosity and porosity remain equal to that of the full sample volume. Figures 5(a-c) show that the
tortuosity remains constant for sample volumes down to 10% of the total volume. Therefore, sample
volumes of 1 mm3 where used in all microstructural characterisation (ca. 20% of the total volume
scanned which contained the same porosity, tortuosity and surface area/volume values compared to
the uncropped volumes). Reconstructions of the three 1 mm3 felt volumes are presented in Figure
5(d-f).
Figure 5 – Representative volume analysis based on the tortuosity factor for felts under compression

of (a) 44 % (b) 55% and (c) 70 %. Reconstructions of felt fibres under (d) 44 % (e) 55% and (f) 70 %
compression. The y-axis is normal to the page. All felts were compressed in the z-axis.
Due to the nature of fabrication of the carbon felts, the majority of fibres are aligned parallel to the x
and y axes. Figure 6 shows the extracted porosity and exposed fibre surface area to fibre volume ratio
(SAf:Vf) of the felts at different compressions. The area of fibres in contact with the boundary of the
volume was discounted in the surface area calculation as they do not represent a true surface of the
fibre, this results in a more accurate calculation of the fibre surface area.
Figure 6 shows the porosity decreasing with increasing compression, as expected. Carbon felt
electrodes are highly porous structures, which is a beneficial characteristic in terms of both
electrolyte penetration into the felt and low liquid pressure drops through the electrodes, helping to
minimise parasitic electrolyte pumping losses. The decrease in porosity shows a linear trend of 8%
over the compression range ca. 44-70%.
Figure 6 – Effect of felt compression on the porosity and the fibre surface area to fibre volume ratio.
By contrast, the ratio of the surface area of fibres to the volume of fibres is seen to remain relatively
constant with compression. This indicates that the fibres are not agglomerating, and no increase in
fibre contact is observed during compression over this range. Continuity of the SAf:Vf ratio under
values of compression up to 75% show that the fibres are simply occupying less space under
compression, and the overall structures remain highly porous. This would appear to support the
electrochemical performance data detailed in Sections 3.1 to 3.3; as the compression of felts
increases, the active surface area available to facilitate the electrochemical reaction remains
constant but the electrical resistance is reduced, resulting in better performing VRFBs. As there is no
evidence of improved fibre/fibre interaction within the bulk felt, it follows that the reduced
resistance with increasing compression, shown in Figure 2, is a result of improved contact resistance
due to more intimate mechanical contact between fibres and current collector and an overall
increase in fibre contact with the current collector as all other variables have remained constant,
including the fibre surface area to fibre volume ratio of the fibres.
It is suggested that there will be a value of compression (higher than 75%) which will see the SAf:Vf
ratio begin to decrease as felt fibres come into mutual contact. Performance above this compression
will be determined by a trade-off between improving electrical resistance, decreasing felt surface

area and increase mass transport limitation due to reduced porosity. However, compression above
75% is unusual and there is a further point to consider: loss of felt porosity results in increased flow
resistance (see Section 3.5) and consequence greater electrolyte pumping power requirements to
overcome this pressure drop.
3.5 Effect of felt compression on the pressure drop
Flow was modelled through each of the compressed felt X-ray CT reconstructed. During actual
operation of a flow battery, the flow of electrolyte through the felt will depend on a number of
different factors such as inlet/outlet positioning, flow-field design, pump rate, etc., and will, of
course, flow in all directions simultaneously. However, the approach adopted here examines flow in
each plane to give a semi-quantitative and directly comparative analysis of the pressure drop
through felt electrodes under varying compression.
Figure 7(a) shows an example of an imported mesh geometry of the felt under 70% compression and
Figure 7(b) shows the pressure throughout the porous phase of the felt structure after the
simulation had converged.
Figure 7 – (a) Example of the surface geometry imported into StarCCM+ and (b) example pressure
drop simulation.

Figure 8 – Graph showing the effect of felt compression on the through-plane pressure drop of felt
electrodes in each axis.
Figure 8 displays the total pressure drop through the felt samples in each axis versus the
compression and shows that with an increase in compression per unit volume, the pressure drop
increases throughout the sample in each axis. This is expected, as with higher compressions there
are fewer voids for the electrolyte to flow through.
The pressure drops in the z direction are all in the order of three to four times higher than in the x
and y axis. Significantly, the flow in this direction is normal to the orientation of the majority of the
fibres. Interestingly, the z axis relates to the thickness of the felt electrodes and is typically the
thickness that separates the current collector and the membrane. Having a low through-plane flow
compared to the in-plane flow could promote stagnant areas of electrolyte within the felt’s structure
and increase mass transport limitations.
It is calculated that a 60% increase in compression in the z-axis (43-70%) relates to a 44.5% increase
in pressure drop in the x and y directions. Large pressure drops through the felts would translate
into the need for greater pumping power and, hence, larger parasitic losses in the VRFB system due
to higher compression of the felt. In terms of overall cell design and operation, the total pressure
drop of an RFB systems is strongly dependant on a number of factors such as the piping, manifolding
and flow field designs as highlighted by Tang et al. [31]. The results shown in this work highlight that
the thickness of the felt electrode chosen will have a pronounced effect on the total pressure drop
of the electrolyte in that plane. The increase in performance, shown in Figures 3 and 4, obtained
from higher compression of the felt has to be balanced against losses due to the increase in parasitic
pumping costs which are a function of the RFB design. The information yield for the directional
pressure drop can prove a useful tool in the optimum design for an RFB stack.
Although the pressure drop calculated from the CFD simulations have been calculated on small but
representative felt volumes they do provide a very useful insight into how the orientation of the felt
fibres affect the pumping pressure drop. Tang et al. have reported a mathematical model in which
the pressure drop through the felt may be calculated, as shown in Equation 5 [31].

𝛥𝑝𝑓𝑒𝑙𝑡 =𝜇∙𝑙∙𝑄
𝜅∙𝐴 Equation 5
Where κ is the permeability of the felt, taken to be equal to 4.28 [32], A is the surface area of the felt
electrode, μ is the dynamic viscosity of the flowing liquid, l is the thickness of the felt and Q is the
volumetric flow rate. Equation 5 provides only a single measurement to the overall pressure drop
through the felt (independent of the direction of flow through the felt) and after substituting in the
values used in the CFD modelling, through-plane pressure drop values of 0.05, 0.09 and 0.14 Pa
respectively for felts under 45%, 55% and 70% compression were calculated. These values are similar
to the x and y directions extracted from the CFD modelling and appear to underestimate the
pressure drop in the z axis.
Conclusion
The effect of felt compression on both the electrochemical performance of a VRFB and the pressure
drop through the felt has been investigated – the latter having a direct relation to parasitic loses due
to electrolyte pumping power. In terms of electrochemical performance, higher compressions of the
felt electrodes reduce Ohmic losses and, ultimately, produce higher peak power densities and
energy efficiencies. Interestingly, it was found that increasing compression resulted in greater cycling
stability. In addition, the porosity of felt electrodes is seen to decrease linearly with compression but
the active surface area of the fibres to fibre volume ratio was constant for the range of compression
values studies. Lastly, the effect of felt compression on the pressure drop has been modelled
resulting in lower pressure drops in each axis with lower compression.
Acknowledgements
The authors are grateful for financial support from the UK Engineering and Physical Sciences
Research Council (EP/L014289/1, EP/N032888/1) and from an EPSRC “Frontier Engineering” Award
(EP/K038656/1) PRS acknowledges the Royal Academy of Engineering.
References
[1] M. Skyllas-Kazacos, Journal of Power Sources, 124 (2003) 299-302. [2] P. Morrissey, International Journal of Ambient Energy, 21 (2000) 213-220. [3] K.T. Cho, P. Ridgway, A.Z. Weber, S. Haussener, V. Battaglia, V. Srinivasan, Journal of The Electrochemical Society, 159 (2012) A1806-A1815. [4] K.L. Hawthorne, J.S. Wainright, R.F. Savinell, Journal of The Electrochemical Society, 161 (2014) A1662-A1671. [5] Y. Wen, H. Zhang, P. Qian, H. Zhou, P. Zhao, B. Yi, Y. Yang, Electrochimica acta, 51 (2006) 3769-3775. [6] B. Huskinson, M.P. Marshak, C. Suh, S. Er, M.R. Gerhardt, C.J. Galvin, X. Chen, A. Aspuru-Guzik, R.G. Gordon, M.J. Aziz, Nature, 505 (2014) 195-198. [7] F.R. Brushett, J.T. Vaughey, A.N. Jansen, Advanced Energy Materials, 2 (2012) 1390-1396. [8] B. Yang, L. Hoober-Burkhardt, F. Wang, G.S. Prakash, S. Narayanan, Journal of The Electrochemical Society, 161 (2014) A1371-A1380. [9] M. Rychcik, M. Skyllas-Kazacos, Journal of Power Sources, 22 (1988) 59-67. [10] B. Sun, M. Skyllas-Kazacos, Electrochimica Acta, 37 (1992) 1253-1260. [11] B. Sun, M. Skyllas-Kazacos, Electrochimica Acta, 37 (1992) 2459-2465. [12] W. Wang, X. Wang, Electrochimica Acta, 52 (2007) 6755-6762.
[13] C. Yang, H. Wang, S. Lu, C. Wu, Y. Liu, Q. Tan, D. Liang, Y. Xiang, Electrochimica Acta, 182 (2015) 834-840. [14] D. Aaron, Q. Liu, Z. Tang, G. Grim, A. Papandrew, A. Turhan, T. Zawodzinski, M. Mench, Journal of Power sources, 206 (2012) 450-453. [15] X. Wu, S. Liu, N. Wang, S. Peng, Z. He, Electrochimica Acta, 78 (2012) 475-482. [16] J. Zhang, L. Li, Z. Nie, B. Chen, M. Vijayakumar, S. Kim, W. Wang, B. Schwenzer, J. Liu, Z. Yang, J Appl Electrochem, 41 (2011) 1215-1221. [17] T.-C. Chang, J.-P. Zhang, Y.-K. Fuh, Journal of Power Sources, 245 (2014) 66-75. [18] R. Jervis, L.D.Brown, T.P. Neville, J. Millichamp, D.P. Finegan, T.M.M. Heenan, D.J.L. Brett, P.R. Shearing, Journal of Physics D: Applied Physics, In Press (2016). [19] B. Tjaden, L. Jonathan, P.J. Withers, R.S. Bradley, D.J.L. Brett, P.R. Shearing, Solid State Ionics, In Press (2016). [20] S. Cooper, D. Eastwood, J. Gelb, G. Damblanc, D. Brett, R. Bradley, P. Withers, P. Lee, A. Marquis, N. Brandon, Journal of Power Sources, 247 (2013) 1033-1039. [21] L.D. Brown, R. Abdulaziz, B. Tjaden, D. Inman, D.J.L. Brett, P.R. Shearing, J Nucl Mater, In Press (2016). [22] P. Qian, H. Zhang, J. Chen, Y. Wen, Q. Luo, Z. Liu, D. You, B. Yi, Journal of Power Sources, 175 (2008) 613-620. [23] P. Zhao, H. Zhang, H. Zhou, B. Yi, Electrochimica Acta, 51 (2005) 1091-1098. [24] SGLGroup, in: http://www.sglgroup.com/cms/_common/downloads/products/product-groups/gs/brochures/Specialty_Graphites_for_Energy_Storage_e.pdf. Accessed Sept. 2016. [25] AVCarb, in, http://www.avcarb.com/wp-content/uploads/2015/05/4379-Felts-for-Battery-Apps-SCREEN.pdf Acessed Sept 2016. [26] G.-J. Hwang, H. Ohya, Journal of Membrane Science, 132 (1997) 55-61. [27] J. Xi, Z. Wu, X. Qiu, L. Chen, Journal of Power Sources, 166 (2007) 531-536. [28] Q. Luo, H. Zhang, J. Chen, P. Qian, Y. Zhai, Journal of Membrane Science, 311 (2008) 98-103. [29] O.O. Taiwo, D.P. Finegan, D.S. Eastwood, J.L. Fife, L.D. Brown, J.A. Darr, P.D. Lee, D.J. Brett, P.R. Shearing, Journal of microscopy, (2016). [30] D. P. Finegan, S. J. Cooper, B. Tjaden, O. O. Taiwo, J. Gelb, G. Hinds, D. J. L. Brett, P.R. Shearing;, Journal of Power Sources, In Press (2016). [31] A. Tang, J. Bao, M. Skyllas-Kazacos, Journal of Power Sources, 248 (2014) 154-162. [32] X. Ma, H. Zhang, F. Xing, Electrochimica Acta, 58 (2011) 238-246.