Embed Size (px)
Citation preview

The Effect of Feed and Stage of Lactation on Milk Processability
Dr Eva Lewis2, Michael Reid2, Giulio Visentin, Audrey McDermott, Dr Sinéad McParland2,
Dr Mark Fenelon1
1Teagasc Food Research Centre, Moorepark, Fermoy, Co. Cork
2Teagasc, Animal & Grassland Research and Innovation Centre, Moorepark, Fermoy, Co. Cork

Presentation Guide
Background
Research approach
Milk production
Milk processability
Predicting milk processability (MIR)

Milk Quality ‘Processing’!

Why milk processability?
Milk urea nitrogen (MUN) concentrations very high in
spring 2011
MUN not beneficial from processing cheese perspective
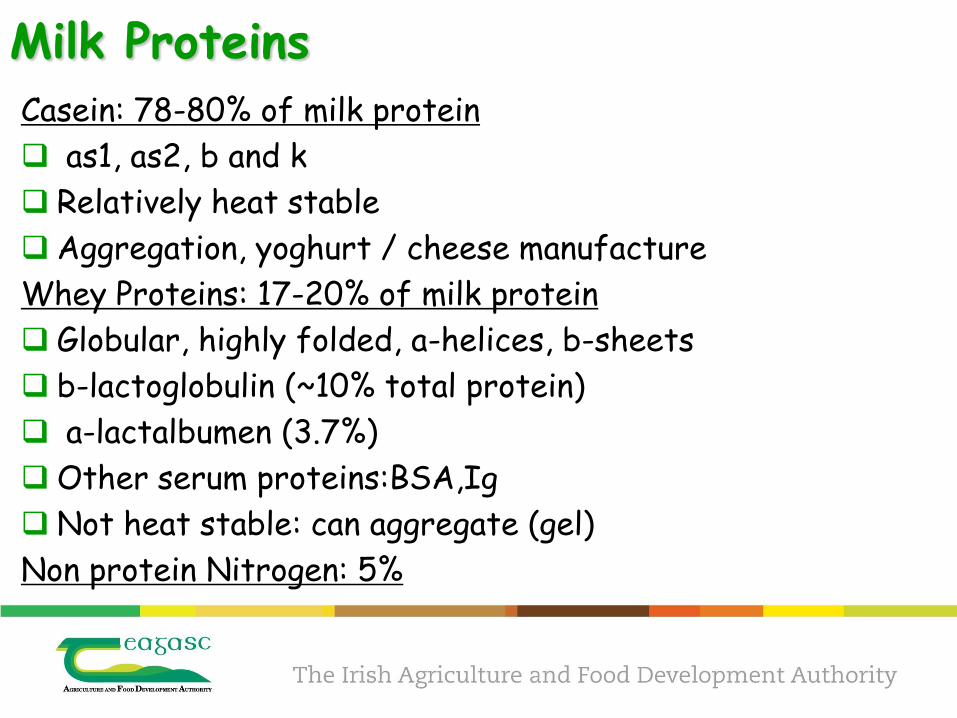
Casein: 78-80% of milk protein
as1, as2, b and k
Relatively heat stable
Aggregation, yoghurt / cheese manufacture
Whey Proteins: 17-20% of milk protein
Globular, highly folded, a-helices, b-sheets
b-lactoglobulin (~10% total protein)
a-lactalbumen (3.7%)
Other serum proteins:BSA,Ig
Not heat stable: can aggregate (gel)
Non protein Nitrogen: 5%
Milk Proteins

Why milk processability?
Milk urea nitrogen (MUN) concentrations very high in
spring 2011
MUN not beneficial from processing cheese perspective
What factors affect MUN?
Diet affects milk composition (Broderick, 2003) and milk
processability (of which heat stability is an indicator) (Singh,
2004)
Stage of lactation has an important effect on milk processability
(Guinee et al., 1999)

Crude protein
Protein
Bacterial protein
Metabolisable protein
Energy
Absorbed Protein (PDI)
Used for maintenance, live weight and milk protein
Undegradable Protein
Degradable Protein
75-80%
Protein Digestion
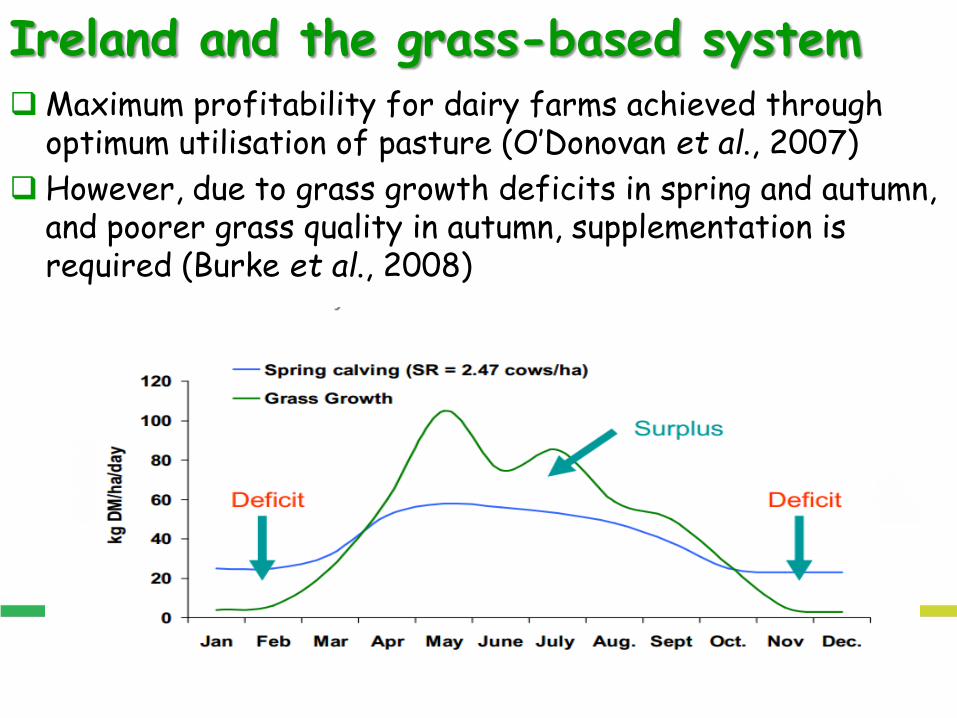
Ireland and the grass-based system Maximum profitability for dairy farms achieved through
optimum utilisation of pasture (O’Donovan et al., 2007)
However, due to grass growth deficits in spring and autumn, and poorer grass quality in autumn, supplementation is required (Burke et al., 2008)

Presentation Guide
Background
Research approach
Milk production
Milk processability
Predicting milk processability (MIR)

Research Approach
Teagasc AGRIC and Teagasc FRC joint research
Impose diets on dairy cows in spring (early lactation) and autumn (late lactation) to Measure milk production
Generate milk from different treatments
Measure total milk protein, NPN and Non-casein N using Kjeldahl method
Remove fat by ‘Separator’ to make Skim milk
Measure protein profile (casein and whey)
Measure heat coagulation time on freeze dried samples

Experimental diets
Spring – early lactation
Autumn – late lactation
Grazed grass as the base feed
With supplementary feed grazed grass as supplementary feed
Spring: no grass silage, only concentrate
Autumn: both feeds considered
Spring: 4 kg DM high, medium or low CP concentrate feed (+13 kg DM grazed grass)
Autumn: 13 kg DM grazed grass alone, or with 4 kg DM supplementary feeds – grass, bale silage, pit silage or concentrate

Presentation Guide
Background
Research approach
Milk production
Milk processability
Predicting milk processability (MIR)

Milk production 13 kg DM grass SPRING
4 kg DM concentrate High CP Medium CP Low CP
Milk Yield (kg/d) 27.6 27.0 26.2
Milk Fat (%) 4.5 4.5 4.6
Milk Protein (%) 3.41 3.36 3.37
Milk Solids (kg/d) 2.1 2.1 2.0
AUTUMN 17 kg DM grass
(HG)
13 kg DM grass (LG)
LG + 4 kg DM bale silage
(GB)
LG + 4 kg DM pit silage
(GP)
LG + 4 kg DM conc
(GC)
Milk yield (kg/d) 12.4a 11.5b 13.3c 13.3c 15.3d
Milk fat (%) 4.91 5.08 4.98 4.67 4.79
Milk protein (%) 3.88 3.76 3.75 3.78 3.88
Milk solids (kg/d) 1.08a 1.01b 1.12a 1.09a 1.29c

0
10
20
30
40
50
60
70
80
90
Wee
k 1
Wee
k 2
Wee
k 3
Wee
k 4
Wee
k 5
Wee
k 6
Wee
k 7
Wee
k 8
Milk
Ure
a N
itro
gen
(m
g/1
00
ml)
Week of Experiment
Spring Milk Urea Concentration
HPr - HP
MPr - HP
LPr - HP
11 Mar 29 Apr
High MUN is an indicator of excess protein in the diet
Low protein diet had lower MUN concentration

Autumn MUN generally lower than in spring No effect of treatment on MUN in autumn
19 Aug 7 Oct

Presentation Guide
Background
Research approach
Milk production
Milk processability
Predicting milk processability (MIR)

…..for Processing!
Selecting Milk Composition
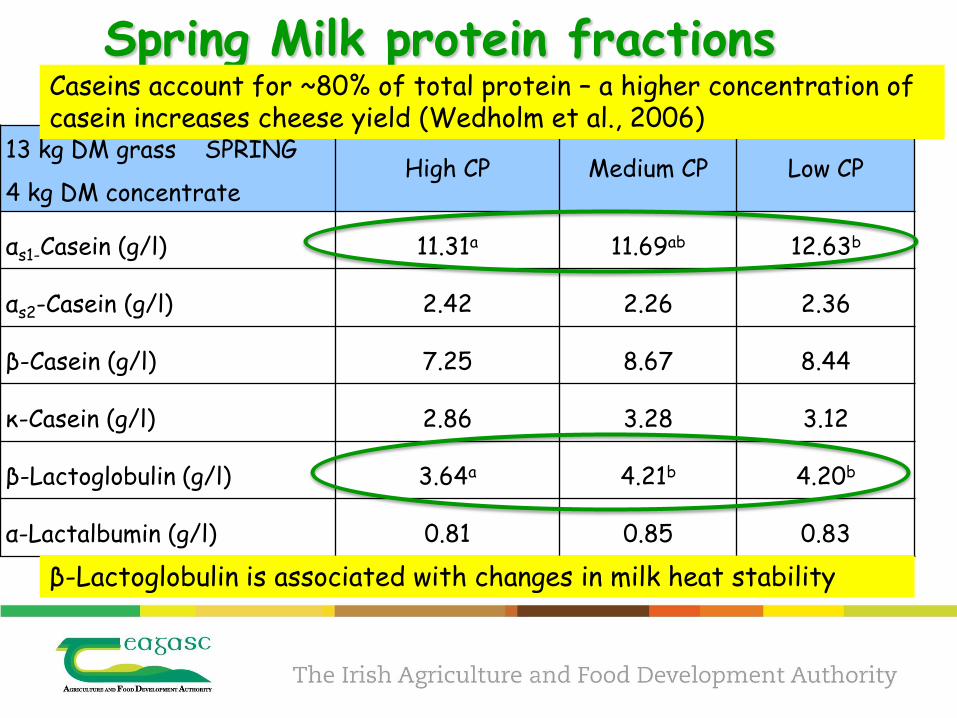
Spring Milk protein fractions
13 kg DM grass SPRING
4 kg DM concentrate High CP Medium CP Low CP
αs1-Casein (g/l) 11.31a 11.69ab 12.63b
αs2-Casein (g/l) 2.42 2.26 2.36
β-Casein (g/l) 7.25 8.67 8.44
κ-Casein (g/l) 2.86 3.28 3.12
β-Lactoglobulin (g/l) 3.64a 4.21b 4.20b
α-Lactalbumin (g/l) 0.81 0.85 0.83
Caseins account for ~80% of total protein – a higher concentration of casein increases cheese yield (Wedholm et al., 2006)
β-Lactoglobulin is associated with changes in milk heat stability

Autumn Milk protein fractions AUTUMN 17 kg
DM grass (HG)
13 kg DM grass (LG)
LG + 4 kg DM bale silage
(GB)
LG + 4 kg DM pit silage
(GP)
LG + 4 kg DM conc
(GC)
αs1-Casein (g/l) 14.2 13.6 14.6 14.2 14.8
αs2-Casein (g/l) 2.79 2.74 2.59 2.70 2.92
β-Casein (g/l) 8.63 8.96 10.40 9.20 9.57
κ-Casein (g/l) 4.62 4.26 4.19 4.03 4.27
β-Lactoglobulin (g/l) 4.83 4.58 4.84 4.68 4.81
α-Lactalbumin (g/l) 0.58a 0.60a 0.67b 0.65b 0.67b
α-Lactalbumin -is major protein of human milk in proportion of α-LA in cow’s milk helps it more closely mimic human milk (Lien, 2003) -is related to production of milk lactose, so may be positively associated with milk yield (Farrell Jr et al., 2004) and therefore be reflective of milk yields of treatments

Spring Milk ‘powder’ heat stability
*
HCT ability to undergo thermal
processing without coagulation (Singh, 2004)

Consequences of low Heat stability – Fouling / Burn on
Poor processability (protein burn on)
• Manufacturing downtime
Protein (whey protein - denaturation/aggregation)
Protein (casein protein – precipitation, instability)
Increase in viscosity, back pressure on heat exchanger, etc.

Presentation Guide
Background
Research approach
Milk production
Milk processability
Predicting milk processability (MIR)

Mid-infrared Spectrometry
Predicting Processability?
Protein, Fat, Lactose Casein, NPN Processability? RCT, Heat Stability, Gelation Properties

Breed quality data base (n=730) Basic Composition Amino Acids Physical
Fat Cysteic Acid Casein Micelle size
Protein Aspartic Acid Colour
Casein Threonine Lightness
Urea Serine Blueness
Lactose Glutamic Acid Yellowness
Total Solids Glycine
Alanine
Protein Profile Cysteine Functional
κ-casein Valine Heat stability
α-s1-casein Methionine Native pH
α-s2-casein Isoleucine
β-casein Leucine
α-lactablumin Tyrosine
β-lactoglobulin a Phenylalanine
β-lactoglobulin b Histidine
Lysine
NH3
Proline
Minerals (n=140)
Full mineral profile
Rennet Coagulation time
Coagulation Properties
Curd firmness

Correlation between gold standard and MIR-predicted traits
Proteins 0.39 (beta LG a) to 0.69 (total LG)
Amino Acids 0.22 (Threonine) to 0.75 (Glycine)
Coagulation time (RCT) 0.74
Milk pH 0.84
Heat stability 0.68

Acknowledgements
DAFM RSF 11/sf/309 Precision Nutrition
Dairy Levy
Teagasc Walsh Fellowship