Embed Size (px)
Citation preview

W&M ScholarWorks W&M ScholarWorks
Undergraduate Honors Theses Theses, Dissertations, & Master Projects
5-2016
The Effect of Ethanol, Methanol, and Water on the Hydrolytic The Effect of Ethanol, Methanol, and Water on the Hydrolytic
Degradation of Polyamide-11 Degradation of Polyamide-11
Patrick Smith College of William and Mary
Follow this and additional works at: https://scholarworks.wm.edu/honorstheses
Part of the Polymer Chemistry Commons
Recommended Citation Recommended Citation Smith, Patrick, "The Effect of Ethanol, Methanol, and Water on the Hydrolytic Degradation of Polyamide-11" (2016). Undergraduate Honors Theses. Paper 965. https://scholarworks.wm.edu/honorstheses/965
This Honors Thesis is brought to you for free and open access by the Theses, Dissertations, & Master Projects at W&M ScholarWorks. It has been accepted for inclusion in Undergraduate Honors Theses by an authorized administrator of W&M ScholarWorks. For more information, please contact [email protected].

THE EFFECT OF ETHANOL, METHANOL, AND WATER ON THE
HYDROLYTIC DEGRADATION OF POLYAMIDE 11
Patrick Smith
Bachelor of Science, the College of William and Mary 2016
A Senior Honors Thesis Presented for a Bachelor of Science Degree in Chemistry from
The College of William and Mary
Department of Chemistry
The College of William and Mary
2016


iii
Abstract
Polyamide 11 (PA11) is commonly used in offshore oil pipelines due to its excellent mechanical properties and chemical resistance. However, PA11 is prone to hydrolysis which is known to significantly reduce the lifetime of these pipelines. This paper explores the effect of ethanol and methanol, two alcohols that are commonly used to prevent the formation of ice-like blockages in the pipeline, on the hydrolytic degradation of PA11. No significant differences in crystallinity were observed between the different test environments. However, PA11 aged in EtOH showed the lowest amount of hydrolytic degradation when compared to PA11 aged in MeOH or pure DI water.

iv
Acknowledgements
Professor David Kranbuehl
John-Andrew Samuel Hocker
Professor Christopher Abelt
Professor Kristin Wustholz
Professor Hannes Schniepp
Chemistry Department at the College of William and Mary
Roy Charles Center
Friends, Family, and Colleagues in Lab

v
Table of Contents
Chapter Page Number
1. Introduction……………………………………………………………………………………………………..….....1
2. Materials and Methods…………………………………………………………………………………………...5
2.1. Synthesis and Preparation of PA-11: neat…………………………………………………………5
2.2. Preparation of Commercial PA-11: NKT…………………………………………………………….5
2.3. Accelerated Aging Study…………………………………………………………………………………….6
2.4. Characterizing Aged Coupons…………………………………………………………………………….7
2.4.1. Molecular Weight Measurements and Hydrolysis Model…………………………7
2.4.2. Crystallinity Measurements…………………………………………………………………….12
2.4.3. Absorbed Liquid Content…………………………………………………………………………13
3. Results……………………………………………………………………………………………………………………..15
3.1. Molecular Weight Data and Rate Constants……………………………………………………….15
3.2. Crystallinity Data………………………………………………………………………………………………..27
3.3. Absorbed Liquid Data…………………………………………………………………………………………30
4. Discussion…………………………………………………………………………………………………………………34
4.1. Molecular Weight and Rate Constants……………………………………………………………….34
4.2. Crystallinity………………………………………………………………………………………………………..37
4.3. Absorbed Liquid…………………………………………………………………………………………………37
5. Conclusion………………………………………………………………………………………………………………..38

vi
References………………………………………………………………………………………………………………………39

1
Chapter 1: Introduction
Polyamide 11 is one of the most widely used polymers for the liner in flexible offshore
oil pipelines throughout the world. This thermoplastic is utilized because of its excellent
mechanical strength, elasticity, and chemical resistance.1 PA11 is made of many 11-
aminoundecnoic acid monomer units, each having an amine end and a carboxylic acid end. The
carboxylic acid end (-CO2H) of one monomer unit attaches to the amine end (-NH2) of another
monomer unit forming long chains via amide bonds. Although ten of the eleven carbons in each
monomer unit are essentially the same as polyethylene (-CH2 repeat unit), the amide groups
give rise to PA11’s excellent physical and mechanical properties by allowing molecular
interactions such as hydrogen bonding.2 Furthermore, amides are the least reactive of the
neutral carboxylic acid derivatives with the only possible interconversion reaction being
hydrolysis back to the parent carboxylic acid and amine.3 Since PA11 does not readily react with
hydrocarbons, it is the optimal choice for the transport layer in an offshore oil pipeline.
Figure 1.1: Top: 11-aminoundecanoic acid monomer Bottom: PA11 repeat unit

2
In offshore oil and natural gas pipelines, about 70% of flow assurance problems come
from the formation of gas hydrates.4 Gas hydrates are ice-like solids that form when small
gases, like ethane or methane, combine with water at low temperature and high pressure.
Under these conditions, water molecules are able to hydrogen bond with one another and form
crystalline lattices around gas molecules. These gas molecules stabilize the water molecules
allowing crystallization above the freezing point of water. Gas hydrates represent a severe
operational problem as the hydrate crystals deposited on the pipe walls accumulate as large
plugs. This leads to pressure build-up and eventually rupture of the pipe. Since the removal of
hydrate plugs is both time consuming and costly, steps are taken to prevent the formation of
gas hydrates.5
The most common hydrate prevention technique is the use of chemical inhibitors.
Chemical inhibitors - such as methanol and ethanol - displace the hydrate formation point to a
temperature and pressure outside of the normal operating conditions of the pipes.5 In general,
efficiency of inhibitors is inversely proportional to the molecular weight, making methanol more
efficient than ethanol. In addition to its high efficiency, methanol is typically the most available
and cost effective, making it the most commonly used hydrate inhibitor in the oil and gas
industry.
The work in this thesis will investigate the effect that the gas hydrate inhibitors
methanol and ethanol have on the degradation of PA11.
Degradation of PA11 occurs when the amide linkages breakdown, resulting in shorter
polymer chains with lower molecular weights. There are many reactions that can initiate the
degradation of PA11. The most common form of degradation of PA11 is oxidation, which can be
induced either by high heat or ultraviolet radiation in the presence of atmospheric oxygen. Both
3
thermal and photo-induced oxidation disrupt the reformation of amide bonds by altering the
amine or acid end-groups. This typically occurs via formation of free radicals or peroxides. As
mentioned before, PA11 is also susceptible to hydrolytic degradation. Hydrolytic degradation
occurs when an amide bond is split into an amine and a carboxylic acid upon reaction with
water. Offshore oil pipelines are typically not exposed to high heat, oxygen, or ultraviolet
radiation, making hydrolytic degradation the predominant form of degradation, and thus the
focus of this study.
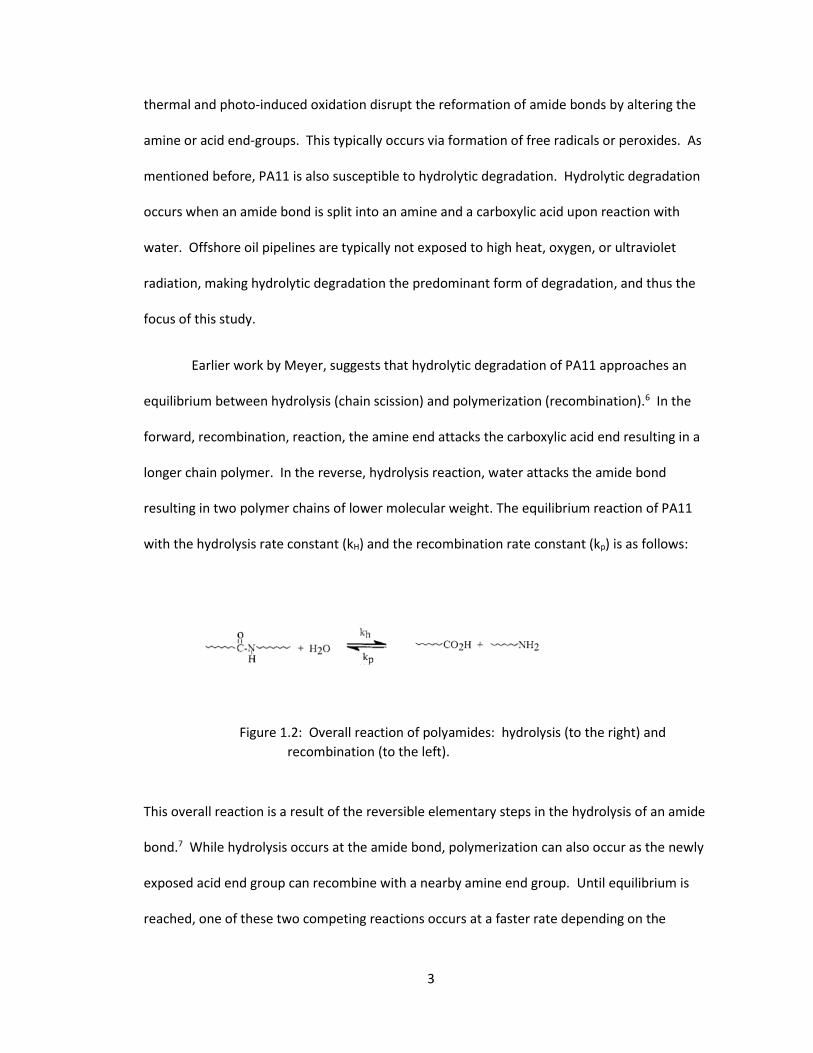
Earlier work by Meyer, suggests that hydrolytic degradation of PA11 approaches an
equilibrium between hydrolysis (chain scission) and polymerization (recombination).6 In the
forward, recombination, reaction, the amine end attacks the carboxylic acid end resulting in a
longer chain polymer. In the reverse, hydrolysis reaction, water attacks the amide bond
resulting in two polymer chains of lower molecular weight. The equilibrium reaction of PA11
with the hydrolysis rate constant (kH) and the recombination rate constant (kp) is as follows:
Figure 1.2: Overall reaction of polyamides: hydrolysis (to the right) and recombination (to the left).
This overall reaction is a result of the reversible elementary steps in the hydrolysis of an amide
bond.7 While hydrolysis occurs at the amide bond, polymerization can also occur as the newly
exposed acid end group can recombine with a nearby amine end group. Until equilibrium is
reached, one of these two competing reactions occurs at a faster rate depending on the

4
concentration of reactants, resulting in a change in molecular weight. At equilibrium, the rate of
the forward reaction is equal to the rate of the reverse reaction resulting in no net change in
molecular weight; this is called the equilibrium molecular weight (Mwe).6 By monitoring the
molecular weights as a function of time, the degradative effects of ethanol, methanol and
deionized water (DI) were studied.

5
Chapter 2: Materials and Methods
2.1 Synthesis and Preparation of PA11: neat
Pure PA11 was synthesized in the laboratory. To synthesize the polymer, 11-
aminoundecanoic acid powder was evenly spread onto a Teflon-lined 100 x 15 mm soda lime
glass petri dish. This dish was then placed into an oven at room temperature which was then
flooded with Argon to remove any ambient oxygen from the system. Oxygen at high
temperatures changes the chemical structure of PA-11 through oxidation and is therefore
removed prior to polymerization. Upon establishment of an anaerobic environment, the oven
was ramped to 240oC, held for four hours, then returned back to room temperature.
To make the polymer a uniform thickness, the resulting block of PA11 was heat pressed
into a 0.50mm film via a Model C Carver Hydraulic Laboratory Press. The process for pressing
the PA11 is as follows, the polymer was sandwiched between two Teflon-lined metal plates,
which was then placed into a chamber made of PTFE Teflon film. Then the Teflon chamber was
flooded with Argon and heated 180oC for 20 minutes, which is well above the glass transition
temperature of PA11 and just below its melting point. After 20 minutes, the sample was
pressed then cooled to room temperature with Argon still flowing. 3.5 x 10 mm coupons were
cut from this pressed polymer film.
2.2 Preparation of Commercial PA-11: NKT
Commercially polymerized PA11 samples were cut from a large manufactured flexible
pipeline provided by NKT. This commercial PA11 has 12 wt% N,n-butylbenzenesulfonamide
added as plasticizer. The plasticizer is added to improve flexibility of the pipe by disrupting

6
hydrogen bonds in the amorphous region of the polymer matrix. The samples were simply cut
into 3.5 x 10mm coupons as received.
2.3 Accelerated Aging Study
In this experiment, several coupons were submerged into one of five test liquids, subjected
to an anaerobic accelerated aging environment, and periodically removed from the aging
environment to be characterized.
Two types of PA11 were tested in this study, laboratory made PA11 (neat) and plasticizer
loaded commercial PA11 (NKT). Eleven 3.5 x 10 mm coupons of each type of PA11 were placed
into ACE no. 8648 heavy walled glass pressure tubes. The pressure tubes were then filled with
one of five test liquids – DI water, 100% EtOH, 8.3µ EtOH, 100% MeOH, and 8.3µ MeOH. Each
pressure tube was sparged with Argon until reaching dissolved oxygen concentration of less
than 1.0 ppm. All dissolved oxygen measurements were conducted via an Oakton DO 450 with a
Rugged Dissolved Oxygen (RDO) probe. The pressure tubes were then sealed, placed into a
100oC oven, and aged for 273 days. A second experiment was also conducted at 120oC for 80
days.
Nine pull days were intermittently scheduled throughout the aging study. On a pull day, the
pressure tubes were removed from the oven and cooled to room temperature in an Argon filled
box. Upon reaching room temperature, the dissolved oxygen content was measured and a
coupon was removed from each tube. After sampling each aging system, the pressure tubes
were filled with fresh liquid, sparged, sealed, and returned to the oven.
This technique has been used in previous studies to expedite and monitor the aging of
PA11.1,6,8,9 In the field it often takes ten to fifteen years for a polymer to degrade to its

7
equilibrium molecular weight. However, in the lab, this same degradation process can be
recreated and studied on the scale of months through accelerated aging.
2.4 Characterizing Aged Coupons
Molecular weight measurements, crystallinity measurements, and liquid absorption
measurements were made on each aged coupon.
2.4.1 Molecular weight measurements and Hydrolysis Model
Many polymeric properties, particularly mechanical properties, are dependent upon the
polymer’s molecular weight. Molecular weight measurements for polymers are significantly
different from those of small molecules. This is because polymers are polydisperse - mixtures of
molecules of different molecular weights. Polydispersity in polymers arises from the vast
amount of statistical variations present during polymerization.7 Therefore, when the molecular
weight of a polymer is reported, one is actually dealing with the average molecular weight.
There are several ways to measure the average molecular weight and correspondingly, there are
several types of average molecular weight. In this thesis, the weight average molecular weight,
which is determined by light scattering, will be discussed. The equation for the weight average
molecular weight is
where wx is the weight fraction of molecules whose weight is Mx. Since light scattering increases
with molecular weight, this method is ideal for polymers with high molecular weights.7

8
Molecular weights were determined using size exclusion chromatography coupled with
multi-angle laser light scattering (SEC-MALLS). Size exclusion chromatography separates
dissolved polymer molecules by size, with the large molecules eluting before the small
molecules. MALLS determines the molecular weight of each molecule by measuring the
intensity of light scattering as it passes through the sample.
Size Exclusion Chromatography (SEC) separates polymer molecules by size using a high
performance liquid chromatography system (HPLC). For this experiment, three Organic SEC Gel
Permeation Chromatography (GPC) columns were used – GPC HFIP-803, GPC HFIP-805, and GPC
HFIP-LG. These columns, which are packed with a polystyrene-divinylbenzene copolymer bead
stationary phase, use hexafluoroisopropanol (HFIP) as eluent. Each column has a different
exclusion limit and thus separates different sized molecules. The HFIP-LG is a guard column
which prevents contaminant particles from entering the system. The HFIP-803 column has an
upper exclusion limit of 30,000 g/mol, which is used to separate low molecular weight
molecules. The HFIP-805 column has an exclusion limit of 1,000,000 g/mol and separates large
molecules. These columns are calibrated by using a standard polymer sample that has well
documented retention times.
The stationary phase of the SEC columns consists of irregularly shaped porous
copolymer beads. Large chain polymer molecules are too big to fit into the pores of the
stationary phase and flow through unhindered. However, small chain molecules get trapped in
these pores and take longer to elute. This separation mechanism causes the large molecules to
elute before the small molecules. Once separated by size in the SEC columns, the polymer
sample enters the MALLS instrument. The MALLS measures the intensity of light scattered as a

9
690 nm laser is passed through various concentrations of the polymer solution. The following
equation is used determine the weight average molecular weight from the light scattering:
(y = b + mx)
where K is the Debye constant, c is the polymer concentration (g/mL), and ΔR is the difference in
Rayleigh ratio between the solution and solvent. Mw is the weight average molecular weight
and A2 is the second virial coefficient. Therefore, a Debye Plot of Kc/Rθ versus c gives a straight
line where the y intercept is the inverse weight average molecular weight.
MALLS solutions were made by dissolving a fraction of each aged coupon in a salted
HFIP solution. The salted HFIP is a solution with a concentration of 7mg of potassium
trifluoroacetate (KTFA) per mL of HFIP. The fraction of aged coupon was massed to the nearest
tenth of a millligram and dissolved in the salted HFIP at a concentration of 2mg of polymer per
mL of salted HFIP. Once dissolved, a 100µL aliquot of the polymer solution was injected into the
SEC-MALLS. Wyatt Technologies’ ASTRA software was used to interpret the raw data and
elucidate the Debye Plots and weight average molecular weight the aged polymer samples.
The measured weight average molecular weights were then used in a mathematical
model of PA11 hydrolysis6 to determine the rate of hydrolysis (kH) and the rate of recombination
(kp). The model resulted in equation 3.0. Experimental Mw data was used in equation 3.10 to
find the number of amide bonds at time t (a) and the initial number of amide bonds (ao). These
values were then used in equation 3.0 to determine the correct values for ae and k’H that
accurately modeled the experimental data. k’H and ae were then plugged into in equation 3.9 to
determine kp.

10
Equation 3.1 is needed to determine kH and kp from the rate law (equation 3.2). Since
the change in end group concentration (𝑑[𝑅′𝑁𝐻2]𝑑𝑡 ) is zero at equilibrium, setting the right side of
equation 3.2 equal to 0 and rearranging gives the equilibrium constant keq (equation 3.3).
[R’NH2] is the concentration of amine end groups and [RCO2H] is the concentration of carboxylic
acid end groups. An increase in the concentration of either of these end groups is caused by
hydrolysis. [R’NCOR] is the concentration of amide bonds and [H2O] is the concentration of
water in the polyamide matrix.
Assuming the concentration of water is large and constant, [H2O] can be combined into
the kH term, resulting in the pseudo first order rate constant k’H. Another simplifying assumption
is that [R’NH2] equals [RCO2H] at all times, since hydrolysis of an amide bond yields exactly one
amine end and one carboxylic acid end.

11
Equation 3.4 can then be expressed as equation 3.5, where 𝑥 is the amine or acid
concentration at time t, and ao is the initial number of amide bonds in the polymer sample.
At equilibrium, 𝑑𝑥𝑑𝑡 = 0, giving equation 3.6 where xe is the amine concentration at
equilibrium.
Equation 3.7 is the relationship between the amine concentration and number of amide
bonds, where a is the number of amide bonds at time t.
Equation 3.8 is the same relationship as equation 3.7 at equilibrium, where ae is the
number of amide bonds at equilibrium.
Rearranging and substituting equation 3.8 into equation 3.6 yields equation 3.9.

12
Since PA11 is a condensation polymer, 𝑀𝑛 =𝑀𝑤2 is assumved and equation 3.10 can be
used to calculate a, the number of amide bonds at time t.
The molecular weight vs. time data was fit via a non-linear least squares fit. The Matlab
program generated a matrix of different kH and kp values and utilized the combination that
produced the best fit for the data. This fit is based on equation 3.9 and was used to determine
the theoretical equilibrium moleculalr weight.
2.4.2 Crystallinity Measurements
Differential Scanning Calorimetry (DSC) is commonly used to measure percent
crystallinity. In differential scanning calorimetry, two small aluminum hermetic pans – one
containing the polymer sample and the other being a reference container – are heated by
individual electric heaters. The temperature of each container is monitored by a heat sensor.
The heat sensor detects when the sample absorbs more heat during a phase transition, then
initiates a greater current flow through the heater to account for the loss. Thus, absorption of
heat by the sample results in an increase in current flow; which is accurately monitored to
provide sensitive measurement of transition temperatures.10 The plots of the heat flow as a
function of temperature can then bex used to determine the melting point and percent
crystallinity PA11.
A TA Instruments Q20 DSC was used to measure the degree of crystallinity, the enthalpy
of fusion, and enthalpy of crystallization of the aged coupons. A small sample, about 5.0 mg, of

13
each aged coupon was sealed in an aluminum hermetic pan. Then a heat-cool-heat program
was run under an inert nitrogen atmosphere. The sample was heated from 40oC to 220oC,
cooled to 40oC, then reheated to 220oC at a rate of 3oC/min. The enthalpy of fusion (ΔHf) was
determined by integrating the areas under the heating peaks and the enthalpy of crystallization
(ΔHcryst) was determined by integrating the area above the cooling peak. The degree of
crystallinity was then determined using the following equation:
where xc is the degree of crystallinity, ΔHf is the enthalpy of fusion and ΔHf0
is the heat of fusion
of 100% crystalline PA11 (which is tabulated as 189.05 J/g). For reproducibility, three samples of
each of the day 273 and day 0 coupons were ran.
2.4.3 Absorbed Liquid Content
Since EtOH and MeOH are volatile, coupons used to characterize absorbed liquid content
were submerged in room temperature decanted liquid from the aging environment prior to
characterization.
Thermogravimetric Analysis (TGA) was used to measure the amount of liquid absorbed by
the polymer as it aged. TGA simply monitors the mass of the sample as a function of
temperature. As the furnace reaches the boiling point of an absorbed liquid it will be expelled
from the polymer and the mass of the sample will decrease. The TA Instruments Q500 model
that was used is accurate to the nearest tenth of a microgram and was purged with nitrogen
throughout the run to prevent oxidation at high temperatures. A small portion of each aged
coupon, about 8mg, was cut using a razor blade and placed onto a tared platinum pan. The
sample was then ramped from room temperature to 105oC, held isothermally for 60 minutes,

14
then ramped up to 240oC, and held isothermally for 120 minutes; with all heating ramps being
10oC/min. The percent loss weight loss after the first and second isotherm can be assumed to
be loss of absorbed aging liquid (EtOH, MeOH, or DI) and loss of plasticizer respectively.
After working up the TGA data with TA Universal Analysis software, a plot of percent
mass loss vs. temperature was produced. Using the percent mass lost, the total moles of each
absorbed liquid was calculated.
Figure 2.1: TGA report of unaged NKT PA11. The first mass loss corresponds to loss off 1.557 wt% absorbed water, the second mass loss coresponds to loss of 11.85 wt% plasticizer.

15
Chapter 3: Results
3.1 Molecular Weight Data and Rate Constants
The SEC-MALLS molecular weight data for the commercial and laboratory made PA11 was
plotted as a function of time and fit with a line of best fit. Commercial (NKT) PA11 aged at 120oC
is depicted in figure 3.1, laboratory made PA11 aged at 120oC in figure 3.2, commercial (NKT)
PA11 aged at 100oC in figure 3.3, and laboratory made PA11 aged at 100oC in figure 3.4. Each
figure compares the five solutions DI water, 100% EtOH, 8.3μ EtOH, 100% MeOH, and 8.3μ
MeOH using a line of best fit for each solution.
The polymer samples all approached an equilibrium molecular weight near day 100 and day
60 for the 100oC samples and 120oC samples respectively (figures 3.1-3.4). The samples aged at
120oC not only reached equilibrium faster, but also had lower equilibrium molecular weights
than the 100oC samples (figures 3.5-3.14). The NKT PA11, at both temperatures, had a higher
equillibrium molecular weight than their laboratory made equivalents by up to 40 percent.
All samples aged in 100% EtOH showed the least amount of degradation and the highest
equilibrium molecular weight. These samples equilibrated at molecular weights up to 150%
more than samples aged in DI water (Table 3.2). 8.3µ EtOH had the second highest equillibrium
molecular weights for both systems at 100oC. The two NKT systems, figures 3.1 and 3.3, show
that both concentrations of MeOH are more degradative than the control group of DI water.
However, the two laboratory made PA11 systems shown in figures 3.2 and 3.3, show that MeOH
has about the same degradative effect as DI water.
According to the values determined by the mathematical model, PA11 aged at 120oC had
higher hydrolysis and recombination rate constants, kH and kp, than PA11 aged at 100oC (tables

16
3.5-3.8). Samples aged in EtOH consistently had the lowest equilibrium rate constant (keq), due
to both lower kH and higher kp, when compared to samples aged in MeOH and DI water. At
120oC, PA11 aged in EtOH had a keq that was half that of DI water. At 100oC, PA11 aged in EtOH
had a keq that was nearly one-third that of DI water (Tables 1.5-3.8).

17
PA-11 neat 120C
Day DI Water (g/mol)
8.3M Methanol (g/mol)
8.3M Ethanol (g/mol)
Methanol 100 (g/mol)
Ethanol 100 (g/mol)
0 97440 97440 97440 97440 97440 1 71120 35780 57290 69750 83390 3 53000 30640 44400 61950 51120 8 35500 30210 31010 33420 39110
20 28000 30270 26830 29140 34230 29 17830 31570 22300 25090 43100 50 21000 23780 20900 23900 30310 72 15600 20300 17910 21580 26400
Table 3.1: MALLS Mw values for neat PA11 aged at 120oC.
PA-11 NKT 120C
Day DI Water (g/mol)
8.3M Methanol (g/mol)
8.3M Ethanol (g/mol)
Methanol 100 (g/mol)
Ethanol 100 (g/mol)
0 136047 136047 136047 136047 136047 1 109240 95570 109580 85930 125910 3 85460 75420 81630 74910 79320 8 73150 60730 78060 57830 72190
20 50540 51620 35830 51090 68940 29 41290 36780 41110 45000 60780 50 38730 32070 33090 41020 50480 72 35510 28240 29050 24670 51660
Table 3.2: MALLS Mw values for NKT PA11 aged at 120oC.

18
neat 100C
Day DI Water (g/mol) 8.3 MeOH (g/mol)
8.3 EtOH (g/mol)
MeOH 100 (g/mol)
EtOH 100 (g/mol)
0 119200 119200 119200 119200 119200 1 74310 45240 65080 60660 92100 5 55790 42690 51340 60189 67620
12 51330 45860 48370 57700 55580 20 41710 35610 37440 42510 52480 40 28260 30290 34050 24930 37270 80 19970 18160 29280 25350 36060
120 16710 22260 45250 25280 46660 273 19220 17130 17830 16110 34140
Table 3.3: MALLS Mw values for neat PA11 aged at 100oC.
NKT 100C
Day DI Water (g/mol)
8.3 MeOH (g/mol)
8.3 EtOH (g/mol)
MeOH 100 (g/mol)
EtOH 100 (g/mol)
1 155200 155200 155200 155200 155200 2 147450 136270 132790 93200 124180 5 139170 115850 131430 90060 119560
12 129720 114370 104430 86010 106340 20 92100 86330 92910 73320 108360 40 88770 67370 78090 56770 80790 80 65120 49010 64080 54870 73420
120 56920 41670 61990 49690 99890 273 38540 24240 50410 24110 60790
Table 3.4: MALLS Mw values for NKT PA11 aged at 100oC.

19
Figure 3.1: Summary plot of Mw vs. Time for NKT PA11 samples aged at 120oC.
Figure 3.2: Summary plot of Mw vs. Time for neat PA11 samples aged at 120oC.
0
20000
40000
60000
80000
100000
120000
0 20 40 60 80
Mol
ecul
ar W
eigh
t (g/
mol
)
Time (days)
Neat 120oC: 100% EtOH has the highest Mwe
8.2M Ethanol (neat)
100% DI Water (neat)
100% Ethanol (neat)
8.2M Methanol (neat)
100% Methanol (neat)
0
20000
40000
60000
80000
100000
120000
140000
160000
0 20 40 60 80
Mol
ecul
ar W
eigh
t (g/
mol
)
Time (days)
NKT 120oC : 100% EtOH has the highest Mwe
8.2M Ethanol (NKT)
100% DI Water (NKT)
100% Ethanol (NKT)
8.2M Methanol (NKT)
100% Methanol (NKT)

20
Figure 3.3: Summary plot of Mw vs. Time for NKT PA11 aged at 100oC.
Figure 3.4: Summary plot of Mw vs. Time for neat PA11 aged at 100oC.
0
20000
40000
60000
80000
100000
120000
140000
0 50 100 150 200 250 300
Mol
ecul
ar W
eigh
t (g/
mol
)
Time (days)
Neat 100oC: 100% EtOH has the highest Mwe
DI Water 100% (neat)
8.3M MeOH (neat)
8.3M EtOH (neat)
MeOH 100% (neat)
EtOH 100% (neat)
0
20000
40000
60000
80000
100000
120000
140000
160000
180000
200000
0 50 100 150 200 250 300
Mol
ecul
ar W
eigh
t (g/
mol
)
Time (days)
NKT 100oC: 100% EtOH has the highest Mwe
DI Water 100% (NKT)
8.3M MeOH (NKT)
8.3M EtOH (NKT)
MeOH 100% (NKT)
EtOH 100% (NKT)

21
Figure 3.5: neat PA11 aged in DI Water 100oC, 120oC, Mw vs. Time
Figure 3.6: neat PA11 aged in 8.3µ MeOH 100oC, 120oC, Mw vs. Time
0
20000
40000
60000
80000
100000
120000
140000
0 50 100 150 200 250 300
Mol
ecul
ar W
eigh
t (g/
mol
)
Time (days)
DI Water neat
DI Water 120C DI water 100C
0
20000
40000
60000
80000
100000
120000
140000
0 50 100 150 200 250 300
Mol
ecul
ar W
eigh
t (g/
mol
)
Time (days)
8.3M Methanol neat
8.3M Methanol 120C 8.3M Methanol 100C

22
Figure 3.7: neat PA11 aged in 8.3µ EtOH 100oC, 120oC, Mw vs. Time
Figure 3.8: neat PA11 aged in 100% MeOH 100oC, 120oC, Mw vs. Time
0
20000
40000
60000
80000
100000
120000
140000
0 50 100 150 200 250 300
Mol
ecul
ar W
eigh
t (g/
mol
)
Time (days)
8.3M Ethanol neat
8.3M Ethanol 120C 8.3M Ethanol 100C
0
20000
40000
60000
80000
100000
120000
140000
0 50 100 150 200 250 300
Mol
ecul
ar W
eigh
t (g/
mol
)
Time (days)
100% Methanol neat
100% Methanol 120C 100% Methanol 100C

23
Figure 3.9: neat PA11 aged in 100% EtOH 100oC, 120oC, Mw vs. Time
Figure 3.10: NKT PA11 aged in DI Water 100oC, 120oC, Mw vs. Time
0
20000
40000
60000
80000
100000
120000
140000
0 50 100 150 200 250 300
Mol
ecul
ar W
eigh
t (g/
mol
)
Time (days)
100% Ethanol neat
100% Ethanol 120C 100% Ethanol 100C
0
40000
80000
120000
160000
200000
0 50 100 150 200 250 300
Mol
ecul
ar W
eigh
t (g/
mol
)
Time (days)
DI Water NKT
DI Water 120C DI Water 100C

24
Figure 3.11: NKT PA11 aged in 8.3µ MeOH 100oC, 120oC, Mw vs. Time
Figure 3.12: NKT PA11 aged in 8.3µ EtOH 100oC, 120oC, Mw vs. Time
0
50000
100000
150000
200000
0 50 100 150 200 250 300
Mol
ecul
ar W
eigh
t (g/
mol
)
Time (days)
8.3M Methanol NKT
8.3M Methanol 120C 8.3M Methanol 100C
020000400006000080000
100000120000140000160000180000
0 50 100 150 200 250 300
Mol
ecul
ar W
eigh
t (g/
mol
)
Time (days)
8.3M Ethanol NKT
8.3M Ethanol 120 8.3M Ethanol

25
Figure 3.13 NKT PA11 aged in 100% MeOH 100oC, 120oC, Mw vs. Time
Figure 3.14: NKT PA11 aged in 100% EtOH 100oC, 120oC, Mw vs. Time
020000400006000080000
100000120000140000160000180000
0 50 100 150 200 250 300
Mol
ecul
ar W
eigh
t (g/
mol
)
Time (days)
100% Methanol NKT
100% Methanol 120C 100% Methanol 100C
020000400006000080000
100000120000140000160000180000
0 50 100 150 200 250 300
Mol
ecul
ar W
eigh
t (g/
mol
)
Time (days)
100% Ethanol NKT
100% Ethanol 120C 100% Ethanol 100C

26
Tables 3.5-3.8: Rate constants and equilibrium molecular weights derived from the mathematical model of PA11 hydrolysis.
120C NEAT KH KP MWE KEQ
(10-2) (10-5) (g/mol) (103) DI 25.2 17.3 19150 1.5 100% MEOH 26.3 22.6 22380 1.2 100% ETOH 24.4 33.6 30140 0.7
Table 3.5
100C NEAT KH KP MWE KEQ (10-2) (10-5) (g/mol) (103) DI 8.8 6.3 19610 1.4 100% MEOH 8.8 7.2 21610 1.2 100% ETOH 5.6 10.4 35590 0.5
Table 3.6
120C NKT KH KP MWE KEQ (10-2) (10-5) (g/mol) (103) DI 5.5 7.2 29270 0.8 100% MEOH 8.3 8.2 24540 1.0 100% ETOH 4.2 9.2 39050 0.5
Table 3.7
100C NKT KH KP MWE KEQ (10-2) (10-5) (g/mol) (103) DI 1.1 4.2 50840 0.3 100% MEOH 2.6 5.6 38530 0.5 100% ETOH 0.7 7.9 71200 0.1
Table 3.8

27
3.2 Crystallinity Measurements
The average values for the crystallinity data - onset melt temperature (To) , melting
temperature (Tm), and percent crystallinity (Xc) - for laboratory made PA11 aged at 100oC is
summarized in tables 3.9-3.11. It is clear that the percent crystallinity increased in all systems as
a function of time. A slight increase (2oC) in the Tm is also seen in all systems as the polymer
ages. Comparison of unaged samples with samples aged 12 days suggests that the both EtOH
and MeOH increase the percent crystallinity at a faster initial rate than DI water. However, the
rate of increase in percent crystallinity decays in all systems resulting in max crystallinity of
about 42-45%. By day 273, the melt onset temperature for both EtOH and MeOH peaks at
183oC, which is slightly higher than that of DI water 180oC. In the DSC heating curves, a slight
shoulder appears and shifts towards the right as the samples age (figure 3.15). For day 12, the
shoulder appears at 165oC, shifts to 175oC by day 80, and continues to shift towards higher
temperatures as the aging time increases.
Table 3.9: Neat PA11 aged in 100% EtOH Table 3.10: Neat PA11 aged in 100% MeOH
DSC Data DSC Data
MeOH Xc (%) To (oC) Tm (oC)
0 24.8 ± 0.3 177.6 ± 0.2 187.5 ± 0.1
12 36.7 183.6 189.5
120 41.3 184.0 189.2
273 42.2 ± 5.7 183.1 ± 0.1 189.8 ± 0.2
EtOH Xc (%) To (oC) Tm (oC)
0 24.8 ± 0.3 177.6 ± 0.2 187.5 ± 0.1
12 34.8 183.0 189.0
120 37.2 183.8 189.3
273 42.5 ± 4.2 183.2 ± 0.2 189.0 ± 0.2

28
Table 3.11: Neat Pa11 aged in DI water
DSC Data
DI Water Xc (%) To (oC) Tm (oC)
0 24.8 ± 0.3 177.6 ± 0.2 187.5 ± 0.1
12 26.2 182.7 189.1
120 38.5 182.4 188.5
273 45.1 ± 2.2 180.6 ± 0.2 188.7 ± 0.2

29
Figure 3.15: DSC curves of neat PA11 aged in DI water. Aging times increase from top to bottom. Red curve: unaged, Green curve: Day 12, Purple Curve: Day 80, Blue curve: Day 120, Orange curve: Day 273.

30
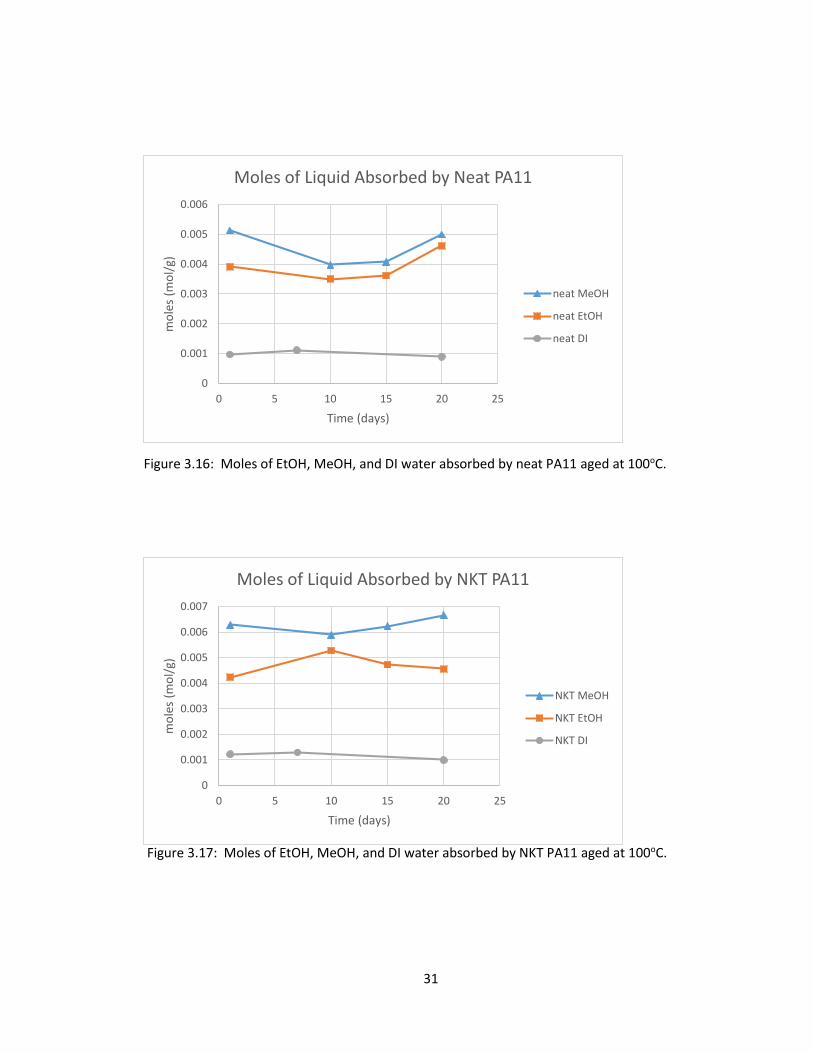
3.3 Absorbed liquid content
The amount of liquid absorbed by PA11 was measured via TGA and manifested as a loss in
mass as a function of temperature. All absorbed liquid from the aging environment - EtOH,
MeOH, or H2O - is presumed to evaporate off by the end of the 105oC isotherm. Figures 3.16-
3.17 show the moles of each liquid that was absorbed from the aging environment. The
samples aged in MeOH lost the most mass by the end of the first isotherm, closely followed by
samples aged in EtOH. Samples aged in DI water showed the smallest mass loss by the end of
the 105oC isotherm. This data shows that PA11 absorbed MeOH slightly more than EtOH and
much more than DI water. This result is consistent with Wu and Siesler’s work that found the
same trend via Fourier transform near infrared spectroscopy.11,12
After just one day of aging, the plasticizer content in the NKT PA11 aged in MeOH, EtOH,
and DI water, dropped from 11.85% to 0.80%, 2.34%, 1.04% respectively (tables 3.15-3.18).
After the first day of aging, the plasticizer content in the NKT PA11 aged in DI water equilibrated,
while the plasticizer content in the NKT PA11 aged in EtOH and MeOH continued to drop. By
day 273, the plasticizer content of NKT PA11 aged in DI water equilibrated at about 1.0% and
about 0.3% in the alcohols.
31
Figure 3.16: Moles of EtOH, MeOH, and DI water absorbed by neat PA11 aged at 100oC.
Figure 3.17: Moles of EtOH, MeOH, and DI water absorbed by NKT PA11 aged at 100oC.
0
0.001
0.002
0.003
0.004
0.005
0.006
0 5 10 15 20 25
mol
es (m
ol/g
)
Time (days)
Moles of Liquid Absorbed by Neat PA11
neat MeOH
neat EtOH
neat DI
0
0.001
0.002
0.003
0.004
0.005
0.006
0.007
0 5 10 15 20 25
mol
es (m
ol/g
)
Time (days)
Moles of Liquid Absorbed by NKT PA11
NKT MeOH
NKT EtOH
NKT DI

32
Tables 3.12-3.14: TGA data for neat PA11 aged at 100oC. Moles of liquid absorbed.
neat MeOH (day)
MeOH content (mol/g)
(10-3)
1 5.13
10 3.97
15 4.09
20 4.99
273 0.08
Table 3.12: Neat PA11 aged in MeOH at 100oC Table 3.13: Neat PA11 aged in EtOH at 100oC
neat DI (day)
Water content (mol/g)
(10-3)
1 0.97
7 1.10
20 0.89
273 0.22
Table 3.14: Neat PA11 aged in DI water at
100oC
*The samples aged for 273 days were not stored in their respective aging environment prior to TGA, which may account for the low concentration of absorbed alcohols and water (table 3.12-3.18).
neat EtOH (day)
EtOH content (mol/g)
(10-3)
1 3.91
10 3.50
15 3.62
20 4.61
273 0.34

33
Tables 3.15-3.18: TGA data for NKT PA11 aged at 100oC. Moles of liquid absorbed and plasticizer content.
Table 3.15: Initial Plasticizer content
unaged NKT (day)
Plasticizer content (wt%)
0 11.85
NKT MeOH (day) MeOH content (mol/g)
(10-3) Plasticizer content (wt%)
1 6.30 0.80
10 5.94 0.40
15 6.20 0.19
20 6.65 0.25
273 0.26 0.27
NKT DI (day) Water content (mol/g)
(10-3) Plasticizer content (wt%)
1 1.22 1.04
7 1.30 1.25
20 1.00 0.70
30 0.96 1.01
273 0.21 0.98
NKT EtOH (day) EtOH content (mol/g)
(10-3) Plasticizer content (wt%)
1 4.24 2.34
10 5.28 1.08
15 4.73 0.38
50 4.42 0.80
273 0.26 0.32

34
Chapter 4: Discussion
4.1 Molecular weight and Rate Constants
All PA11 samples reach an equilibrium molecular weight, underscoring the presence of
two competing hydrolysis and recombination reactions (figures 3.1-3.4). The rate of decrease in
molecular weight is rapid during the early stages of the aging process, and slows as the
molecular weight approaches equilibrium. The initial rapid decrease in molecular weight is due
to the low concentration of amine and acid end groups, [-NH2] and [-CO2H], relative to the large
starting amide concentration, [-NHCO-]. This immense concentration gradient favors hydrolysis
over recombination due to the abundance of amide bonds available to be hydrolyzed. As the
number of amide bonds are increasingly hydrolyzed, the concentration of amine [-NH2] and acid
[-CO2H] end groups increases, allowing recombination to counteract the hydrolysis and slow the
rate of change in molecular weight. The rate of hydrolysis decreases until it equals the rate of
recombination resulting in the final equilibrium molecular weight.
Both neat PA11 and NKT PA11 aged in 100% EtOH had the highest equilibrium molecular
weight at both temperatures. This may be due to the EtOH acting as a base, causing the amide
to undergo base catalyzed hydrolysis. In base catalyzed hydrolysis, the hydroxide ion (OH-)
attacks the carbonyl carbon forming a tetrahedral intermediate.

35
Figure 4.1: Mechanism for the base catalyzed hydrolysis of an amide. This mechanism is analagous to the mechanism for base catalyzed hydrolysis of polyamides due to the equal
reactivity of functional groups assumption.7
This reaction does not always go to completion and form the carboxylic acid (RCOOH) and amine
(H2NR2) because the amine is such a poor leaving group. The tetrahedral intermediate (formed
after step 1) will not kick off the amine until the amine is converted to a better leaving group, via
protonation. Consequently, reversal of the tetrahedral intermediate to the reactants, amide
(RCONHR2) and hydroxide (OH-), is faster than the breakdown to the carboxylic acid and amine.
Therefore, base catalyzed hydrolysis often results in the reformation of the reactants and is not
efficient at breaking amide bonds. Since PA11 aged in EtOH aging undergoes this process, it will
have less chain scission and a higher equilibrium molecular weight than the MeOH and DI water
environments.

36
Acid catalyzed hydrolysis, undergone by MeOH and DI water, leads to the breakdown of
amide bonds more often than base catalyzed. In the first step, the carbonyl oxygen is
protonated, rather than the nitrogen atom, because it is better at stabalizing the positive
charge. Formation of the tetrahedral intermediate, is quickly followed by proton transfer from
the water to the amine (step 3), which is the most basic site in the intermediate. Upon
protonation of the amine, the tetrahedral intermediate breaks down and expels the amine
group, resulting in the formation of a carboxylic acid end and an amine end.
The samples aged at 120oC have higher kH and kp values than at 100oC, which is expected
because rate constants are temperature dependent (tables 3.5-3.8). Since keq is the ratio of
kH/kp, a smaller kH and a larger kp would result in a lower keq. Relatively speaking, lower keq
means that the equilibrium lies more towards the reactants and thus a larger concentration of
amide bonds relative to the concentration of amine and carboxylic acid ends. This trend is
highlighted in tables 3.5-3.8 where lower keq values of samples aged in EtOH correspond to

37
higher equilibrium molecular weights due to both a lower rate of hyrolysis and a higher rate of
recombination.
4.2 Crystallinity
The shoulders in the DSC curves of figure 3.15 suggest the presence of poorly formed
crystalline regions due to low molecular weight chains in the polymeric matrix. As the coupon
aged at the elevated temperatures, the low molecular weight chains had more time to anneal
and form more uniform crystals; indicated by the shoulder shifting towards the higher Tm peak
of the well-formed crystalline region.
The lower onset melting temperature of DI water relative to EtOH and MeOH could be a
result of differences in hydrogen bonding. Water is better able act as a plasticizer and disrupt
the amide-amide hydrogen bonds and form amide-water hydrogen bonds13, resulting in an
earlier onset of melting.
According to tables 3.9-3.11, the melting point and the percent crystallinity of all neat
PA11 samples increased as a function of aging time. However, a lack of substantial difference in
these values across the aging environments suggests that the lower rate and degree of
degradation in EtOH is not due to differences in crystallinity.
4.3 Absorbed liquid content
The TGA data is in agreement with Verdu, and suggests that the rate of hydrolysis is not a
function of the diffusion rate of the absorbed liquids.8 The absorption of liquid by the PA11
already reached equilibrium during the initial days of aging, while the rate of hydrolysis is still
high.

38
Chapter 5: Conclusion
While the alcohols both had faster increases in crystallinity during initial aging, all
samples had about the same percent crystallinity by the end of the study. Therefore,
differences in the rate and severity of degradation do not arise from differences in crystallinity
due to the different aging liquids.
Our experiments show that the hydrolytic degradation of PA11 is less severe in EtOH
relative to degradation in MeOH and DI water. The kH and kp values for samples aged in MeOH
were very similar to those of DI water resulting in roughly the same equilibrium molecular
weights. EtOH aged PA11 consistently had the highest equilibrium molecular weight, a result of
both a lower rate of hydrolysis and a higher rate of recombination compared to samples aged in
MeOH and DI water.
The NKT PA11 had higher equilibrium molecular weights compared to the lab made
PA11. This is due to the apparent effect of the plasticizer. By the end of the study, there was
still about 1%wt plasticizer absorbed in the polymer matrix. Though it is a very small amount,
this plasticizer seems to be able to disrupt the hydrolytic process.

39
1 Romão, Wanderson, Eustáquio V. R. Castro, Elói A. S. Filho, Regina C. L. Guimarães, Ana L. N. Silva, Sylvia C. S. Teixeira, Marco-A. De Paoli, and Geovane L. De Sena. "Ageing of Polyamide 11 Used in the Manufacture of Flexible Piping." Journal of Applied Polymer Science J. Appl. Polym. Sci. 114.3 (2009): 1777-783. Web.
2 Rislan Polyamide Liner Design Guide. Philadelphia, PA: Atofina Chemicals, Inc. 2001. Print.
3 Brown, Foote, Iverson, Anslyn. Organic Chemistry. Belmont, CA: Brooks/Cole, Cengage Learning, 2012. Print.
4 Nakayama, H., Brouwer, D. Handa, Y., Klug, D., Tse, J., Ratcliffe, C., Zhu, X., Ripmeester, J., “METHANOL: CLATHRATE HYDRATE FORMER OR INHIBITOR ?”
5 Mokhatab, S.,Wilkens, R.J, Leontaritis, K.J. (December 2006). A review of Strategies for Solving Gas-Hydrate Problems in Subsea Pipelines. Energy Sources, Part A: Recovery, Utilization and Environmental Effects.
6 Meyer, Andrew, Nick Jones, Yao Lin, and David Kranbuehl. "Characterizing and Modeling the Hydrolysis of Polyamide-11 in a PH 7 Water Environment." Macromolecules 35.7 (2002): 2784-798. Web.
7 Odian, G. (2004). Principles of Polymerization (Fourth ed.). Wiley-Interscience. Print
8 Serpe, G., N. Chaupart, and J. Verdu. "Ageing of Polyamide 11 in Acid Solutions." Polymer 38.8 (1997): 1911-917. Web.
9 Hocker, Samuel, Anne K. Rhudy, Gregory Ginsburg, and David E. Kranbuehl. "Polyamide Hydrolysis Accelerated by Small Weak Organic Acids." Polymer 55.20 (2014): 5057-064. Web.
10 Allcock, H. R., Frederick Walter Lampe, and James E. Mark. Contemporary Polymer Chemistry. Upper Saddle River, NJ: Pearson/Prentice Hall, 2003. Print.
11 Wu, P., and H. W. Siesler. "Fourier Transform NIR Study of Liquid Diffusion Processes in Nylon 11 Films: Comparison of Water with Alcohols." Chemistry of Materials Chem. Mater. 15.14 (2003): 2752-756. Web.
12 Wu, Peiyi, and Heinz W. Siesler. "The Diffusion of Alcohols and Water in Polyamide 11: A Study by Fourier-transform Near-infrared Spectroscopy." Macromolecular Symposia Macromol. Symp. 143.1 (1999): 323-36. Web.
13 Margolis, James M. Engineering Thermoplastics: Properties and Applications. New York: Dekker, 1985. Print.