Embed Size (px)
Citation preview

The Effect of Endogenous Regulation on Telecommunications Expansion in Latin America
Luis H. Gutierrez R. Universidad del Rosario
[email protected] Research Associate, Public Utility Research Center
February 2002*
* I thank Sanford Berg for encouraging me in this line of research and for providing rich insights into the regulatory process. Patricia Mason helped edit this paper. All errors are my own.

2
Introduction
I investigate the effect that having a specialized regulatory body for the
telecommunications sector has on telecommunications performance for a sample of twenty-two
Latin American countries during 1980-97. The main point I want to address is whether having a
better or more developed regulatory framework has been a major factor in main lines deployment
and telecommunications efficiency. To test this hypothesis, I use a second-generation index of
regulatory framework, proxy variables for privatization and liberalization, and some control
variables that allow for country- and time-specific effects. Additionally, I split the sample by
selecting twelve countries with a lower level of development and endogenize some of the main
telecom reform variables. Lastly, I use dynamic panel data techniques to test the hypothesis.
I find that better regulatory frameworks do impact telecommunications efficiency and the
level of network deployment positively, in both the static and dynamic specifications. Those
countries where regulatory reform has been furthered had growing levels of efficiency and main
lines per 100 inhabitants. However, the effect of regulatory reform is a little lower for the sample
of countries with lower income. Also, when time effects are not included, those countries that
allowed competition in basic telecommunications services had more main lines per 100
inhabitants and better efficiency. Privatization also contributed to a better main line network.
This study sheds more light on the importance of a sound regulatory environment that
opens markets to competition and endorses privatization. It also highlights the importance of
considering regulatory framework when analyzing the relative performance of utilities industries.
Telecommunications Reform in Latin America
A major task of Latin American governments has been to signal the credibility of their
telecommunications reform. Without credibility, the expectation of future policy reversal might
become a self-fulfilling prophecy, defeating the purpose of the reform. From the point of view of
private investors, long-term investments in telecommunications carry the risk of expropriation

3
and of having investments taken hostage (Williamson 1983) in terms of government's ability to
force utilities to charge unprofitable rates for their services.
The degree of opportunistic behavior varies from country to country and one should
expect opportunistic behavior to be greater when there is not a sound institutional and regulatory
environment. Thus, governments that want to encourage private investment must create an
institutional arrangement that limits their own ability to behave opportunistically once (private)
telecom operators undertake their investments. Yet, creation of a regulatory body brings new
questions concerned with accountability and degree of autonomy.
Telecommunications reform in Latin America has seldom been studied. Most empirical
studies focus only on the few Latin American countries that have privatized (totally or partially)
their former public telecom operators.1 Some recent econometric studies have tried to explain
partial telecommunications reforms or the effects of political and institutional variables on
network deployment. Henisz and Zelner (2001) explore how political institutions, measured by an
index of checks and balances, affect the long-run level of penetration of telecommunications
infrastructure in 147 countries during 1960-94. Their variable indicating political constraint
showed a strong and positive relation with growth of main lines per 100 inhabitants. Their study
highlights the importance of the macro-polity for promoting steady and strong incentives to
private investors in a sector where opportunistic behavior may be expected.
Gutiϑrrez and Berg (2000) studied the effects of telecommunications regulation and
political variables on network expansion in 20 Latin American countries, but the study was
1 The more outstanding studies include (1) Ramamurti (1996), who analyses the privatization process in Argentina, Jamaica, Mexico and Venezuela, (2) Molano (1997), who studies the effects of micro and macro variables on telecommunications in the Southern Cone of Latin America (Argentina, Brazil, Chile and Uruguay), (3) Adam et al. (1992), who briefly review the cases of Jamaica and Trinidad and Tobago, (4) Levy and Spiller (1996), who thoroughly study the regulatory process in Argentina, Chile, and Jamaica, (5) the five studies of Latin America in a book edited by Wellenius and Stern (1994), (6) Petrazzini (1995), who analyzes the cases of Argentina and Mexico, and (7) Galal et al. (1994)[not listed in references], who examine the welfare effects associated with privatization of the telecom operators in Chile and Mexico. These studies and others helped with my earlier construction of an index of regulatory framework for 24 Latin American countries (Gutiϑrrez 1999).
4
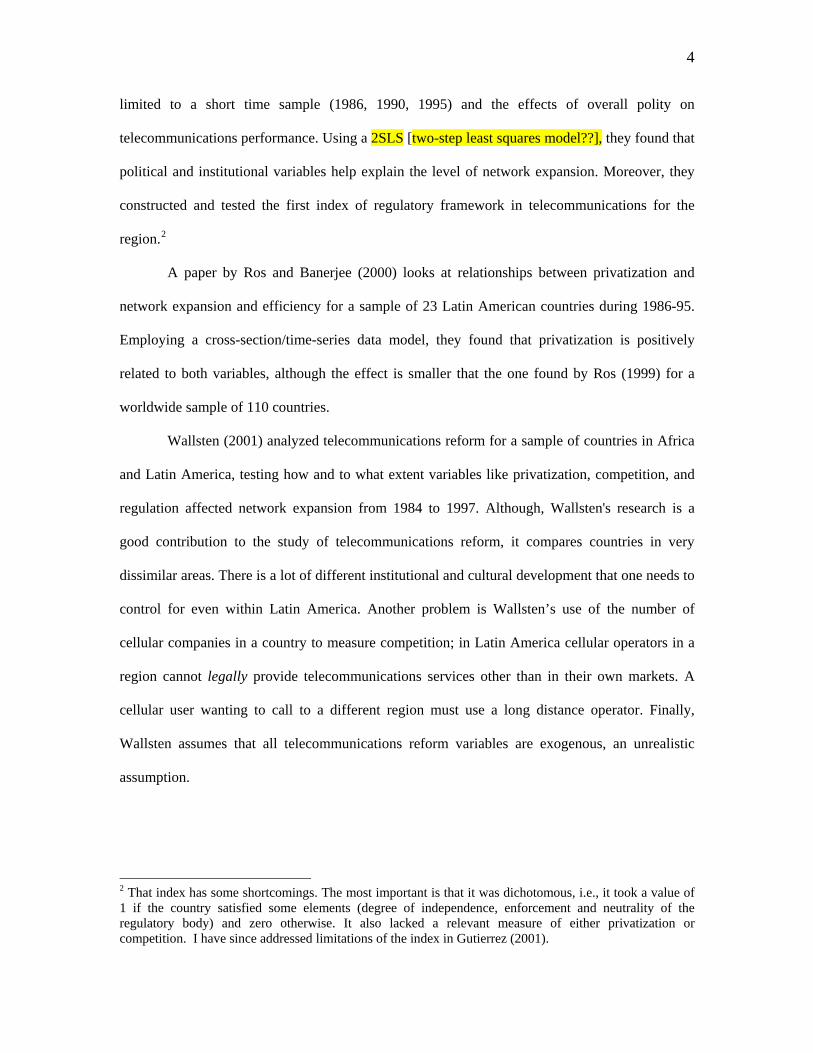
limited to a short time sample (1986, 1990, 1995) and the effects of overall polity on
telecommunications performance. Using a 2SLS [two-step least squares model??], they found that
political and institutional variables help explain the level of network expansion. Moreover, they
constructed and tested the first index of regulatory framework in telecommunications for the
region.2
A paper by Ros and Banerjee (2000) looks at relationships between privatization and
network expansion and efficiency for a sample of 23 Latin American countries during 1986-95.
Employing a cross-section/time-series data model, they found that privatization is positively
related to both variables, although the effect is smaller that the one found by Ros (1999) for a
worldwide sample of 110 countries.
Wallsten (2001) analyzed telecommunications reform for a sample of countries in Africa
and Latin America, testing how and to what extent variables like privatization, competition, and
regulation affected network expansion from 1984 to 1997. Although, Wallsten's research is a
good contribution to the study of telecommunications reform, it compares countries in very
dissimilar areas. There is a lot of different institutional and cultural development that one needs to
control for even within Latin America. Another problem is Wallsten’s use of the number of
cellular companies in a country to measure competition; in Latin America cellular operators in a
region cannot legally provide telecommunications services other than in their own markets. A
cellular user wanting to call to a different region must use a long distance operator. Finally,
Wallsten assumes that all telecommunications reform variables are exogenous, an unrealistic
assumption.
2 That index has some shortcomings. The most important is that it was dichotomous, i.e., it took a value of 1 if the country satisfied some elements (degree of independence, enforcement and neutrality of the regulatory body) and zero otherwise. It also lacked a relevant measure of either privatization or competition. I have since addressed limitations of the index in Gutierrez (2001).

5
Data Analysis
Latin America and the Caribbean are composed of more than 30 large and small countries
with a wide variety of cultural, economic, institutional and political factors. In this analysis, I
consider the telecommunications markets in 22 of these countries3 during 1980-97, using network
deployment (main phone lines per 100 inhabitants) and efficiency (main phone lines per
employee) as the two dependent variables. I consider three main aspects of telecommunications
reform - privatization, competition and regulatory development – as explanatory variables.
OWNER measures the level of privatization,4 with a value of 1 when government
divestment of former state-owned telco operators exceeds 50 percent, and zero otherwise.
COMPET accounts for both allowing entry into basic telecommunications services (local and
long distance) and the beginning of wireless telecommunications. A value of 1 is assigned for
each event and then they are interacted additively [meaning what?]; a zero is assigned if neither
type event occurs. This composite dummy is a better measure of competition than those devised
by Ros or Wallsten.
REGUL, the main variable, is an index of the regulatory framework in
telecommunications for every country. This index reflects whether there is separation of telecom
operations and regulatory activities (ITU 1993-not in refs), although not necessarily whether there
is a specialized and separate regulatory body. The index also reflects the following features of
independent regulatory agencies: (1) whether the regulatory body has autonomy (e.g., whether
there is budgetary independence or limits on government’s ability to freely replace regulators; see
Gutierrez 2001), (2) accountability, measured by existence of mechanisms to resolve disputes
between regulators and operators, (3) clarity of the regulator’s role in terms of ability to set tariffs
3 The countries, in alphabetical order, are: Argentina, Bolivia, Brazil, Chile, Colombia, Costa Rica, Ecuador, El Salvador, Guatemala, Guyana, Honduras, Jamaica, Mϑxico, Nicaragua, Panama, Paraguay, Perδ, Dominican Republic, Suriname, Trinidad and Tobago, Uruguay and Venezuela. 4 For more detailed information about the sources of this variable, see Gutiϑrrez (2001).

6
and fine or penalize operators, and (4) transparency and participation in the regulatory process,
including whether the regulator is backed by law or some minor norm (presidential decree,
decree, etc).5
Index dimensions are weighted and summed by assigning equal value to every
component; i.e., the first and third dimensions, with just one component, have a weight of about
16.6 percent each, as does each of the four components of the second dimension. The index
reflects continuous growth to the extent that countries adopt new regulatory legislation;
unfortunately, the index will always show increases unless the new legislation rules out some of
the criteria already in place.
Still subject to some shortcomings, the current index improves on those in Gutiϑrrez and
Berg (2000) and Wallsten (2001) by considering the evolution of regulation rather than its
presence or absence only [meaning okay?]. Countries display a great range of change and
instability in their polity, and a variable purporting to capture regulatory performance should
reflect this. Also, an index that presents a stepwise development of regulatory governance allows
testing of more complex hypotheses. This is the first study to use an index of this type with
econometric analysis to address network deployment and efficiency in Latin America and the
Caribbean.
The main telecommunications variables are taken from the ITU database, which contains
information on more than 120 telecom-related variables. I do not use the price, quality or
investment variables because, although important in explaining network expansion and
efficiency, their quality and availability for Latin America and the Caribbean are unreliable. To
illustrate, the ITU database provides only 19.9-28 percent of the country-year observations on
price or quality, on average, and some countries report the same information for two different
variables, which degrades the quality of the data and any inference one can make from it.
5 A full explanation of the index is given in Gutiérrez (2001).
7
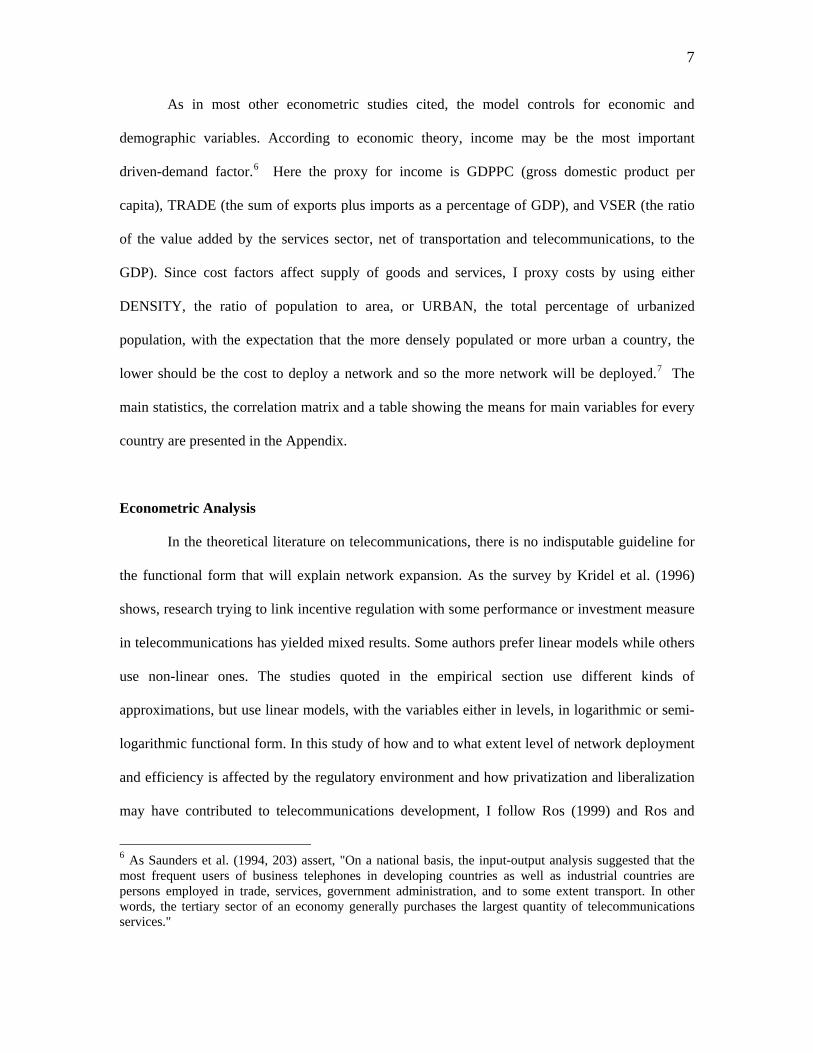
As in most other econometric studies cited, the model controls for economic and
demographic variables. According to economic theory, income may be the most important
driven-demand factor.6 Here the proxy for income is GDPPC (gross domestic product per
capita), TRADE (the sum of exports plus imports as a percentage of GDP), and VSER (the ratio
of the value added by the services sector, net of transportation and telecommunications, to the
GDP). Since cost factors affect supply of goods and services, I proxy costs by using either
DENSITY, the ratio of population to area, or URBAN, the total percentage of urbanized
population, with the expectation that the more densely populated or more urban a country, the
lower should be the cost to deploy a network and so the more network will be deployed.7 The
main statistics, the correlation matrix and a table showing the means for main variables for every
country are presented in the Appendix.
Econometric Analysis
In the theoretical literature on telecommunications, there is no indisputable guideline for
the functional form that will explain network expansion. As the survey by Kridel et al. (1996)
shows, research trying to link incentive regulation with some performance or investment measure
in telecommunications has yielded mixed results. Some authors prefer linear models while others
use non-linear ones. The studies quoted in the empirical section use different kinds of
approximations, but use linear models, with the variables either in levels, in logarithmic or semi-
logarithmic functional form. In this study of how and to what extent level of network deployment
and efficiency is affected by the regulatory environment and how privatization and liberalization
may have contributed to telecommunications development, I follow Ros (1999) and Ros and
6 As Saunders et al. (1994, 203) assert, "On a national basis, the input-output analysis suggested that the most frequent users of business telephones in developing countries as well as industrial countries are persons employed in trade, services, government administration, and to some extent transport. In other words, the tertiary sector of an economy generally purchases the largest quantity of telecommunications services."

8
Banerjee (2000) and use a semi-logarithmic functional form, exploiting the regulatory framework
constructed in Gutierrez (2001).
Previous studies have been limited to static analysis. This study goes a step further by
analyzing both static and dynamic models of network deployment. Panel data techniques are used
to conduct the econometric analysis for both models. Additionally, since the data span eighteen
years (1980-97), it is convenient for analysis to include time dummies that may capture changes
in the economic and industrial environment. The period under study includes important events,
both economic and political, that affected Latin American economies, and telecommunications
underwent dramatic technological changes at the same time. Thus it seems important to control
not only for country-specific effects but also for time effects.
Static Panel Data
Our static model is
1,...T. tand N,1,..., i ´ ´ln it ==+++= εαδβ iitítit dxy (1)
where )́x,..., x, x( Kit2it1it=itx represents the number of control (explanatory) variables that
have been shown meaningful in explaining telecommunications performance in most past studies,
)´..,,,( K21 ββββ = are their respective parameters; the dummies variables are )́d ,(d 2it1it=itd
and their parameters, )́,( 21 δδδ = . We assume that itε may follow either a one-way or two-way
error component model. Thus,
, it i νμε +=it or (1A)
it i νλμε ++= tit , (1B)
7 For more about demand and cost factors in telecommunications, see Falch (1997).

9
where iα and tλ represent country and time effects, respectively, which we assume to be fixed.
The remaining (individual and time-specific effect) itν is assumed to be i.i.d. with mean 0 and
variance 2νσ .
The dependent variable ityln is either teledensity (main lines per 100 inhabitants) or
efficiency (employees per main lines). Among the itx -vector variables, I include GDPPC,
TRADE, VSER, and VMAN (the percentage of value added by the manufacturing sector to
GDP), all lagged one period, as well as URBAN and DENSITY. Lastly, the itd vector represents
the dummies for competition (a value of 1 if competition exists, zero otherwise) and privatization
(a value of 1 whenever more than 50 percent of a former state-owned operator is sold to private
investors, zero otherwise).
Endogeneity is a pervasive problem in econometric analyses of policy impacts. Most
studies have assumed their variables of interest were exogenous. For instance, Wallsten (2001,
need page number for direct quote) states that “competition, privatization and regulation must be
endogenized in these analyses. In this paper, I have implicitly assumed that they are exogenous to
telecom performance, but this assumption is almost certainly not be true.” Ros (1999), quoting
Kridel et al. (1996) also raises the point that competition and privatization (and perhaps
regulation) may be endogenously determined. This is an important issue. Similarly to Ros, I
assume that competition and privatization are more likely than regulation to be endogenous, at
least in this first stage of telecommunications reform. The privatization and competition processes
in Latin American and the Caribbean, although fast in many countries, were accomplished
through the negotiation of key issues, the most important of which was the exclusivity period, the
fulfillment of various goals in performance and quality, and so on.
Levy and Spiller (1996) have made clear the distinction between regulatory governance
and regulatory incentives. The governance framework includes mechanisms to restrain
10
government behavior and solve disputes, while regulatory incentives focus on pricing, subsidies
and operating policies. As Levy and Spiller stress, researchers have paid too much attention to
regulatory incentives in the past and have disregarded regulatory governance. The measure of the
regulatory framework in telecommunications presented here focuses completely on regulatory
governance in telecommunications, leaving (perhaps) less room for any problem of endogeneity. I
assume regulation to be exogenous in the static model and consider the endogeneity aspect in the
dynamic model. After all, telecommunications performance is affected by regulation, while
regulation, in turn, can be affected by performance.
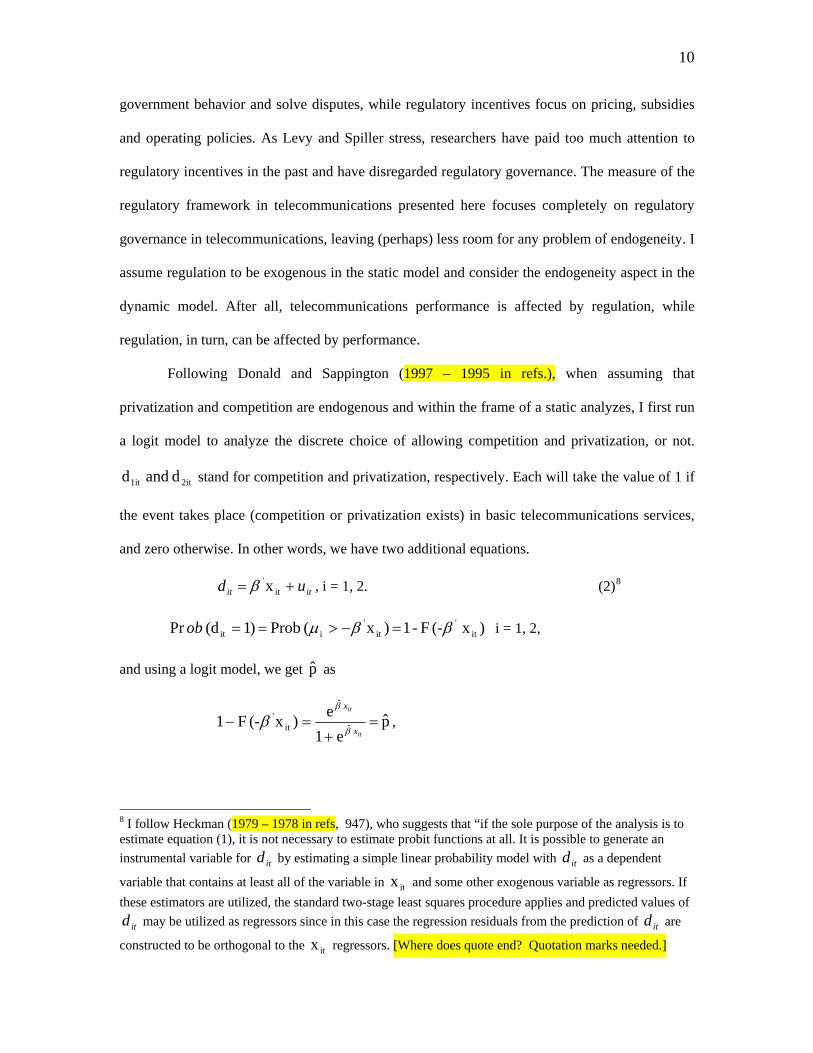
Following Donald and Sappington (1997 – 1995 in refs.), when assuming that
privatization and competition are endogenous and within the frame of a static analyzes, I first run
a logit model to analyze the discrete choice of allowing competition and privatization, or not.
2it1it d and d stand for competition and privatization, respectively. Each will take the value of 1 if
the event takes place (competition or privatization exists) in basic telecommunications services,
and zero otherwise. In other words, we have two additional equations.
itit ud += it'x β , i = 1, 2. (2)8
) x(- F - 1 )x( Prob )1(d Pr it'
it'
iit ββμ =−>==ob i = 1, 2,
and using a logit model, we get p̂ as
p̂ e1
e)x(- F 1 ˆ
ˆ
it' =
+=−
it
it
x
x
β
β
β ,
8 I follow Heckman (1979 – 1978 in refs, 947), who suggests that “if the sole purpose of the analysis is to estimate equation (1), it is not necessary to estimate probit functions at all. It is possible to generate an instrumental variable for itd by estimating a simple linear probability model with itd as a dependent
variable that contains at least all of the variable in itx and some other exogenous variable as regressors. If these estimators are utilized, the standard two-stage least squares procedure applies and predicted values of
itd may be utilized as regressors since in this case the regression residuals from the prediction of itd are
constructed to be orthogonal to the itx regressors. [Where does quote end? Quotation marks needed.]

11
Then, using the fitted value coming from the logit model of Equation 2 and interacting
those values with the original values (as in Ros 1999), I run a two-stage least square dummy
variable model to assure consistent and efficient estimators of Equation 3,
1,...T. tand N,1,..., i ´)p̂( ´ln it ==+++= εαδβ iitítit dxy (3)
The results of the fixed-effect models, Equation 3, explaining the impact of
telecommunications reforms on network expansion are shown in Tables 1 and 2. Tables 5 and 6
show the effects of the same variables on the level of efficiency in telecommunications, measured
by main lines per employee. To facilitate interpretation, the results are organized as follows in
Tables 1-4. The estimates obtained by assuming all regressors are exogenous are shown in the
first two columns to allow, whenever possible, a comparison with Wallsten´s estimates.
Outcomes after correcting for endogeneity of competition and privatization (see Equation 3) are
presented in the next two columns. Regressions controlling for country- and time-specific effects
are also run.
In Table 1, the regulation variable is interacted with competition and privatization. We
then have two interacted variables. In Table 2, we extend the analysis of the regulation variable,
running regressions where that variable enters in level as well as in square term in an attempt to
determine whether a non-linear relationship exists between regulation and telecom performance.
Additionally, since the regulatory framework index (RFI) is the sum of three main dimensions,
we enter each of them separately as regressors (columns 5-8 in Table 2) to see whether lower
economic development in a country creates different relationships between telecom performance
and the reform and control variables. I performed the same econometric runs for a sub-sample of
countries with a GDPPC lower than $2,400 (in 1995 US dollars). The results are shown in Tables
3 and 4.
12
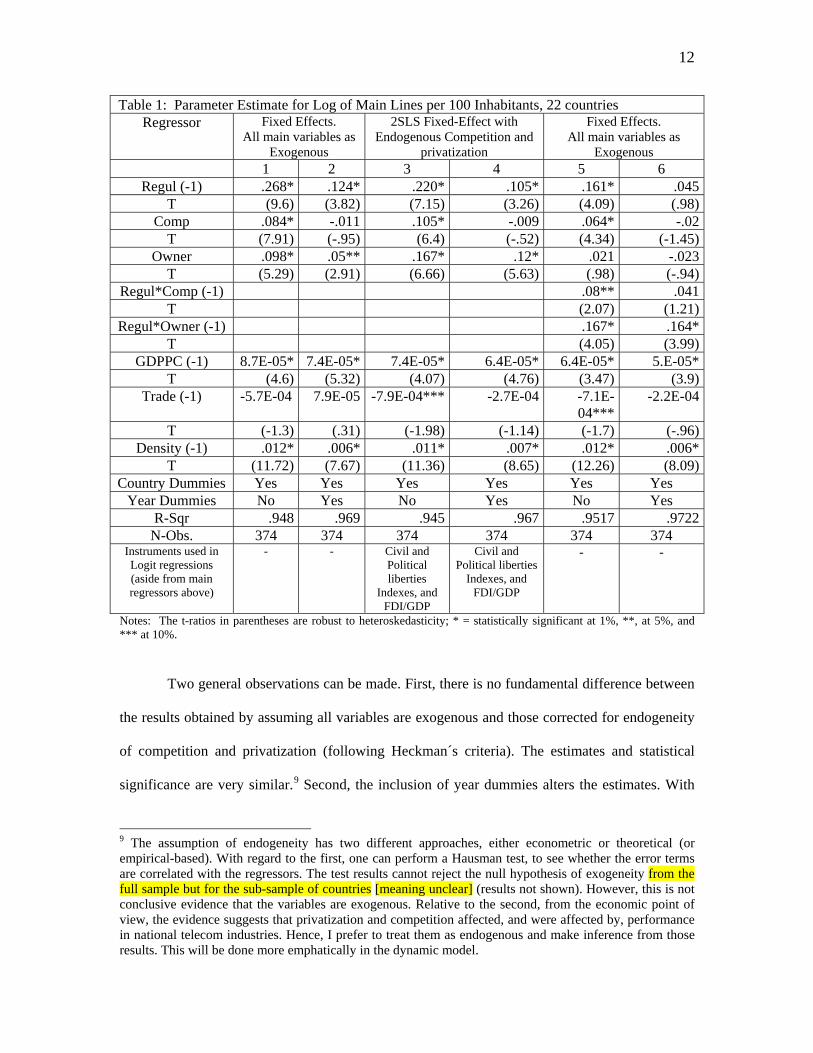
Table 1: Parameter Estimate for Log of Main Lines per 100 Inhabitants, 22 countries Regressor Fixed Effects.
All main variables as Exogenous
2SLS Fixed-Effect with Endogenous Competition and
privatization
Fixed Effects. All main variables as
Exogenous 1 2 3 4 5 6
Regul (-1) .268* .124* .220* .105* .161* .045T (9.6) (3.82) (7.15) (3.26) (4.09) (.98)
Comp .084* -.011 .105* -.009 .064* -.02T (7.91) (-.95) (6.4) (-.52) (4.34) (-1.45)
Owner .098* .05** .167* .12* .021 -.023T (5.29) (2.91) (6.66) (5.63) (.98) (-.94)
Regul*Comp (-1) .08** .041T (2.07) (1.21)
Regul*Owner (-1) .167* .164*T (4.05) (3.99)
GDPPC (-1) 8.7E-05* 7.4E-05* 7.4E-05* 6.4E-05* 6.4E-05* 5.E-05*T (4.6) (5.32) (4.07) (4.76) (3.47) (3.9)
Trade (-1) -5.7E-04 7.9E-05 -7.9E-04*** -2.7E-04 -7.1E-04***
-2.2E-04
T (-1.3) (.31) (-1.98) (-1.14) (-1.7) (-.96)Density (-1) .012* .006* .011* .007* .012* .006*
T (11.72) (7.67) (11.36) (8.65) (12.26) (8.09)Country Dummies Yes Yes Yes Yes Yes Yes
Year Dummies No Yes No Yes No Yes R-Sqr .948 .969 .945 .967 .9517 .9722
N-Obs. 374 374 374 374 374 374 Instruments used in Logit regressions (aside from main regressors above)
- - Civil and Political liberties
Indexes, and FDI/GDP
Civil and Political liberties
Indexes, and FDI/GDP
- -
Notes: The t-ratios in parentheses are robust to heteroskedasticity; * = statistically significant at 1%, **, at 5%, and *** at 10%.
Two general observations can be made. First, there is no fundamental difference between
the results obtained by assuming all variables are exogenous and those corrected for endogeneity
of competition and privatization (following Heckman´s criteria). The estimates and statistical
significance are very similar.9 Second, the inclusion of year dummies alters the estimates. With
9 The assumption of endogeneity has two different approaches, either econometric or theoretical (or empirical-based). With regard to the first, one can perform a Hausman test, to see whether the error terms are correlated with the regressors. The test results cannot reject the null hypothesis of exogeneity from the full sample but for the sub-sample of countries [meaning unclear] (results not shown). However, this is not conclusive evidence that the variables are exogenous. Relative to the second, from the economic point of view, the evidence suggests that privatization and competition affected, and were affected by, performance in national telecom industries. Hence, I prefer to treat them as endogenous and make inference from those results. This will be done more emphatically in the dynamic model.

13
the exception of Trade, all the estimates are about half the value when these dummies are
excluded.
Examining Table 1, we can conclude that a better regulatory environment for
telecommunications is definitely associated with better performance in the sector, measured by
main lines per 100 inhabitants, whether year dummies are included or not.10 A one-point
enhancement in regulation conveys an increase in main lines per 100 inhabitants of 4.5-26.8
percent in the static model. This illustrates the policy implications of a stronger regulatory
framework. My values are somewhat greater than those reported by Wallsten, but then the sample
and model specification are different.
Privatization is also positively associated with network expansion. This corroborates Ros,
although my values are considerably lower than his. Ros found that network expansion was
almost 29 percent greater in countries that privatized their former state-owned telco. The impact
ranges between 10 and 18 percent in this study, in contrast to Wallsten, who reported a negative
association between privatization and level of network deployment.
Competition is positively associated with an increase in network expansion, but only
when year dummies are not included. This result is distinct from Ros but conforms with Wallsten,
who used a different measure of competition but reported its positive effect on telecom lines
deployment. The economic effect of competition is less than that of privatization, but competition
is a relatively new phenomenon in Latin America’s basic telecommunications services. In
general, results from the static model verify that reform that involves privatizing former state-
owned operators, allowing competition, and implementing better regulatory governance leads to
better telecom performance.
Other observations can be made regarding Table 1. When regulation is interacted with
competition and privatization, the estimate value of the regulatory variable falls about 40 percent.
10Recall that all t-ratios are robust to heteroskedasticity, which makes the inference more reliable.

14
Moreover, when we include year dummies to capture some time-specific events, the variable is
no longer statistically significant, although its sign remains positive [meaning correct?]. Also,
estimates for privatization are no longer statistically significant. When we exclude year dummies,
both interacted terms become positively associated with main lines per 100 inhabitants. In
general, these results differ from Wallsten´s. His regulatory variable, alone and interacted with
competition, was not statistically significant, and privatization was negatively associated with the
dependent variable.
There are two possible explanations for these differences. First, I consider only Latin
American countries while Wallsten’s sample includes fifteen African countries. This may
introduce a larger heterogeneity that is not controlled for. Second, as mentioned earlier, his
competition and privatization variables differ from mine. While he proxies competition with the
number of wireless operators, I use it as a dummy variable with a value of 1 whenever entry was
allowed in telecom basic services or as wireless service began. Wallsten defines privatization as
beginning the moment a government started divesting its state-owned operator, no matter the
percentage of the divestment. I define privatization as divestment greater than 50 percent.
Both income and cost proxies are also significant and with the expected [okay, correct?]
sign. GDPPC is associated positively with a greater network deployment. The impact of income
is apparently low when analyzing the size of the coefficients. Ros found that increases of $10,000
in GDPPC resulted in a 6.6 percent increase in main lines per 100 inhabitants. My results show
that an increase of $10,000 will produce only a 0.005-0.008 percent increase in network
deployment. Density, the cost proxy, is also positive [okay?] and its effect on network is
somewhat greater than GDPPC. Trade, the sum of exports plus imports as a proportion of GDP,
did not have the expected sign and usually is not even statistically significant.11
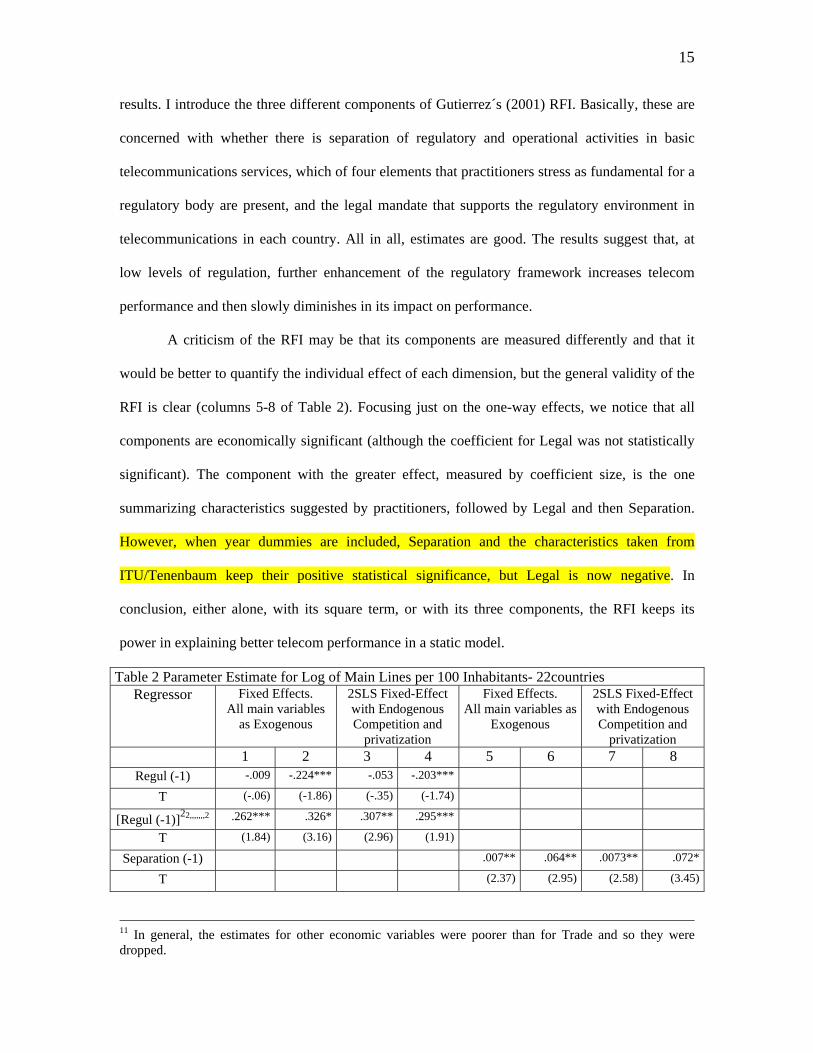
Table 2, where the regulation variable is included in different ways, also shows important
15
results. I introduce the three different components of Gutierrez´s (2001) RFI. Basically, these are
concerned with whether there is separation of regulatory and operational activities in basic
telecommunications services, which of four elements that practitioners stress as fundamental for a
regulatory body are present, and the legal mandate that supports the regulatory environment in
telecommunications in each country. All in all, estimates are good. The results suggest that, at
low levels of regulation, further enhancement of the regulatory framework increases telecom
performance and then slowly diminishes in its impact on performance.
A criticism of the RFI may be that its components are measured differently and that it
would be better to quantify the individual effect of each dimension, but the general validity of the
RFI is clear (columns 5-8 of Table 2). Focusing just on the one-way effects, we notice that all
components are economically significant (although the coefficient for Legal was not statistically
significant). The component with the greater effect, measured by coefficient size, is the one
summarizing characteristics suggested by practitioners, followed by Legal and then Separation.
However, when year dummies are included, Separation and the characteristics taken from
ITU/Tenenbaum keep their positive statistical significance, but Legal is now negative. In
conclusion, either alone, with its square term, or with its three components, the RFI keeps its
power in explaining better telecom performance in a static model.
Table 2 Parameter Estimate for Log of Main Lines per 100 Inhabitants- 22countries Regressor Fixed Effects.
All main variables as Exogenous
2SLS Fixed-Effect with Endogenous Competition and
privatization
Fixed Effects. All main variables as
Exogenous
2SLS Fixed-Effect with Endogenous Competition and
privatization 1 2 3 4 5 6 7 8
Regul (-1) -.009 -.224*** -.053 -.203***
T (-.06) (-1.86) (-.35) (-1.74)
[Regul (-1)]22,,,,,,,2 .262*** .326* .307** .295***
T (1.84) (3.16) (2.96) (1.91)
Separation (-1) .007** .064** .0073** .072*
T (2.37) (2.95) (2.58) (3.45)
11 In general, the estimates for other economic variables were poorer than for Trade and so they were dropped.
16
ITU/Ten (-1) .137* .064*** .11** .048
(3.51) (1.75) (2.79) (1.33)
Legal (-1) .056** .001 .041 -.01
T (2.14) (.03) (1.54) (-.42)
Comp .088* -.008 .114* -.002 .083* -.014 .094* -.01
T (7.95) (-.67) (7.24) (-.13) (7.69) (-1.23) (7.69) (-0.63)
Owner .094** .044* .133* .089* .1* .056* .18* .135*
T (2.63) (5.23) (5.72) (4.28) (5.5) (3.32) (6.79) (5.33)
GDPPC (-1) 8.91E-05* 7.64E-05* 7.8E-05* 7E-05* 9.1E-05* 7.26E-05* 7.8E-05* 6.1E-05*
T (4.74) (5.69) (4.42) (5.42) (4.77) (5.14) (4.26) (4.17)
Trade (-1) -5.8E-04 -7.7E-04 -7.4E-04***
-2.1E-04 -6.6E-04 -1.51E-04 -8.9E-04**
-3.8E-04
T (-1.32) (-.3) (-1.83) (-.88) (-1.49) (-.59) (-2.2) (-1.61)
Density (-1) .012* .006* .011* .006* .012* .006* .011* .007*
T (12.56) (8.29) (11.94) (9.07) (11.2) (7.27) (11.23) (8.19)
Country Dummies Yes Yes Yes Yes Yes Yes Yes Yes
Year Dummies No Yes No Yes No Yes No Yes
R-Sqr .9487 .9705 .9469 .9695 .9485 .97 .9451 .9671
N-Obs. 374 374 374 374 374 374 374 374
Instruments used In Logit
- - See Table 3
See Table 3
See Table 3
See Table 3
Notes: The t-ratios in parentheses are robust to heteroskedasticity; * = statistically significant at 1%, **, at 5%, and *** at 10%.
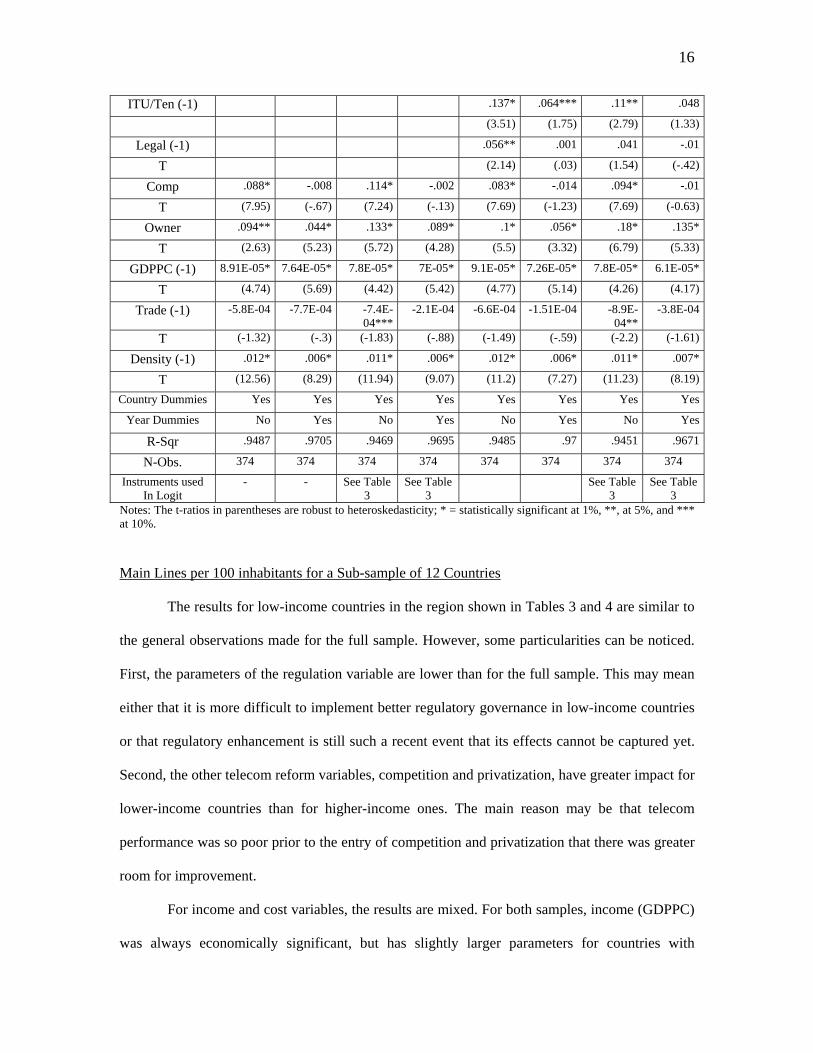
Main Lines per 100 inhabitants for a Sub-sample of 12 Countries
The results for low-income countries in the region shown in Tables 3 and 4 are similar to
the general observations made for the full sample. However, some particularities can be noticed.
First, the parameters of the regulation variable are lower than for the full sample. This may mean
either that it is more difficult to implement better regulatory governance in low-income countries
or that regulatory enhancement is still such a recent event that its effects cannot be captured yet.
Second, the other telecom reform variables, competition and privatization, have greater impact for
lower-income countries than for higher-income ones. The main reason may be that telecom
performance was so poor prior to the entry of competition and privatization that there was greater
room for improvement.
For income and cost variables, the results are mixed. For both samples, income (GDPPC)
was always economically significant, but has slightly larger parameters for countries with

17
GDPPC below $2,400. The explanation may lie with economic conditions (debt crisis, high fiscal
deficit, and the like) that have affected lower-income countries in greater measure. However, the
cost proxy variable has the expected sign and is significant in all cases
Table 3 Parameter Estimate for Log of Main Lines per 100 Inhabitants- 12countries Regressor Fixed Effects.
All main variables as Exogenous
2SLS Fixed-Effect with Endogenous Competition and
privatization
Fixed Effects. All main variables as
Exogenous 1 2 3 4 5 6
Regul (-1) .24* .0045 .128** -.04 .111*** -.041t (5.56) (1.24) (2.46) (-.26) (1.89) (-.96)
Comp .093* -.019 .174* .043 .061** -.036***t (4.71) (-1.02) (5.53) (1.42) (2.66) (-1.79)
Owner .161* .09* .207* .14* .017 -.031t (4.27) (2.95) (5.35) (4.57) (.32) (-.64)
Regul*Comp (-1) .13** .09**t (2.63) (2.22)
Regul*Owner (-1) .302 .254t (4.08)* (3.93*)
GDPPC (-1) 5.7E-05 1.6-05* 8E-05 1.8E-04** 3.5E-05 1.4E-04**T (.95) (3.45) (1.38) (4.25) (.59) (3.34)
Trade (-1) -7.0E-04 1.8E-05 -9.2E-04 -5.7E-05 -1.1E-03**
-2.E-04
t (-1.32) (.57) (-.19 (-.19) (-2.2) (-.67)Density (-1) .011* .005* .009* .004* .011* .005*
t (9.3) (5.4) (7.45) (5.39) (5.8) (9.8)Country Dummies Yes Yes Yes Yes Yes Yes
Year Dummies No Yes No Yes No YesR-Sqr .923 .961 .916 .957 .9672 .9317
N 204 204 204 204 204 204 Instruments used in Logit regressions (aside from main regressors above)
- - Civil and Political liberties
Indexes, and FDI/GDP
Civil and Political liberties
Indexes, and FDI/GDP
- -
Notes: The t-ratios in parentheses are robust to heteroskedasticity; * = statistically significant at 1% [10% etc.??], **, at 5%, and *** at 10%.
Although the estimated coefficients in Table 4 are weaker than for the full sample, the
behavior is similar. The coefficient of the square term of regulation is always positive (ranging
from 0.173 to 0.32) for two-way effect models but statistically insignificant when year dummies
are excluded. The linear term is negative (ranging from -0.283 to -0.013) and significant for the
two-way effect model too.
In this static model for countries with low levels of economic development, it seems that
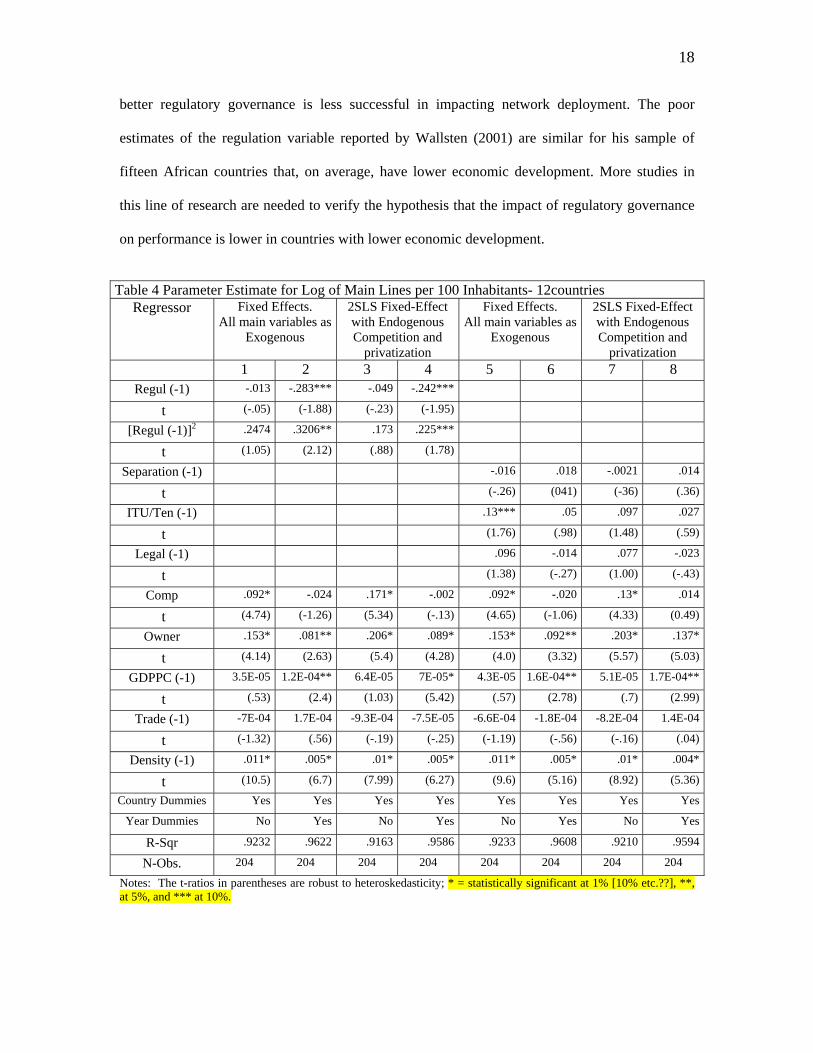
18
better regulatory governance is less successful in impacting network deployment. The poor
estimates of the regulation variable reported by Wallsten (2001) are similar for his sample of
fifteen African countries that, on average, have lower economic development. More studies in
this line of research are needed to verify the hypothesis that the impact of regulatory governance
on performance is lower in countries with lower economic development.
Table 4 Parameter Estimate for Log of Main Lines per 100 Inhabitants- 12countries
Regressor Fixed Effects. All main variables as
Exogenous
2SLS Fixed-Effect with Endogenous Competition and
privatization
Fixed Effects. All main variables as
Exogenous
2SLS Fixed-Effect with Endogenous Competition and
privatization 1 2 3 4 5 6 7 8
Regul (-1) -.013 -.283*** -.049 -.242***
t (-.05) (-1.88) (-.23) (-1.95)
[Regul (-1)]2 .2474 .3206** .173 .225***
t (1.05) (2.12) (.88) (1.78)
Separation (-1) -.016 .018 -.0021 .014
t (-.26) (041) (-36) (.36)
ITU/Ten (-1) .13*** .05 .097 .027
t (1.76) (.98) (1.48) (.59)
Legal (-1) .096 -.014 .077 -.023
t (1.38) (-.27) (1.00) (-.43)
Comp .092* -.024 .171* -.002 .092* -.020 .13* .014
t (4.74) (-1.26) (5.34) (-.13) (4.65) (-1.06) (4.33) (0.49)
Owner .153* .081** .206* .089* .153* .092** .203* .137*
t (4.14) (2.63) (5.4) (4.28) (4.0) (3.32) (5.57) (5.03)
GDPPC (-1) 3.5E-05 1.2E-04** 6.4E-05 7E-05* 4.3E-05 1.6E-04** 5.1E-05 1.7E-04**
t (.53) (2.4) (1.03) (5.42) (.57) (2.78) (.7) (2.99)
Trade (-1) -7E-04 1.7E-04 -9.3E-04 -7.5E-05 -6.6E-04 -1.8E-04 -8.2E-04 1.4E-04
t (-1.32) (.56) (-.19) (-.25) (-1.19) (-.56) (-.16) (.04)
Density (-1) .011* .005* .01* .005* .011* .005* .01* .004*
t (10.5) (6.7) (7.99) (6.27) (9.6) (5.16) (8.92) (5.36)
Country Dummies Yes Yes Yes Yes Yes Yes Yes Yes
Year Dummies No Yes No Yes No Yes No Yes
R-Sqr .9232 .9622 .9163 .9586 .9233 .9608 .9210 .9594
N-Obs. 204 204 204 204 204 204 204 204
Notes: The t-ratios in parentheses are robust to heteroskedasticity; * = statistically significant at 1% [10% etc.??], **, at 5%, and *** at 10%.
19
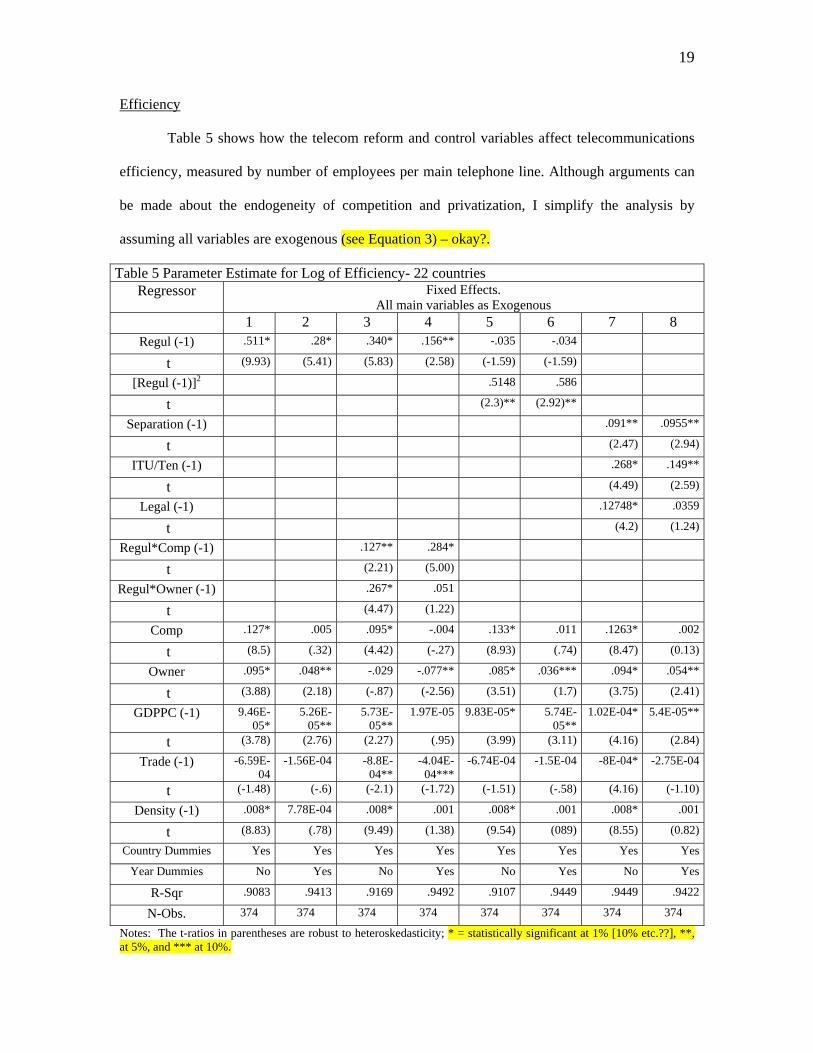
Efficiency
Table 5 shows how the telecom reform and control variables affect telecommunications
efficiency, measured by number of employees per main telephone line. Although arguments can
be made about the endogeneity of competition and privatization, I simplify the analysis by
assuming all variables are exogenous (see Equation 3) – okay?.
Table 5 Parameter Estimate for Log of Efficiency- 22 countries Regressor Fixed Effects.
All main variables as Exogenous 1 2 3 4 5 6 7 8
Regul (-1) .511* .28* .340* .156** -.035 -.034
t (9.93) (5.41) (5.83) (2.58) (-1.59) (-1.59)
[Regul (-1)]2 .5148 .586
t (2.3)** (2.92)**
Separation (-1) .091** .0955**
t (2.47) (2.94)
ITU/Ten (-1) .268* .149**
t (4.49) (2.59)
Legal (-1) .12748* .0359
t (4.2) (1.24)
Regul*Comp (-1) .127** .284*
t (2.21) (5.00)
Regul*Owner (-1) .267* .051
t (4.47) (1.22)
Comp .127* .005 .095* -.004 .133* .011 .1263* .002
t (8.5) (.32) (4.42) (-.27) (8.93) (.74) (8.47) (0.13)
Owner .095* .048** -.029 -.077** .085* .036*** .094* .054**
t (3.88) (2.18) (-.87) (-2.56) (3.51) (1.7) (3.75) (2.41)
GDPPC (-1) 9.46E-05*
5.26E-05**
5.73E-05**
1.97E-05 9.83E-05* 5.74E-05**
1.02E-04* 5.4E-05**
t (3.78) (2.76) (2.27) (.95) (3.99) (3.11) (4.16) (2.84)
Trade (-1) -6.59E-04
-1.56E-04 -8.8E-04**
-4.04E-04***
-6.74E-04 -1.5E-04 -8E-04* -2.75E-04
t (-1.48) (-.6) (-2.1) (-1.72) (-1.51) (-.58) (4.16) (-1.10)
Density (-1) .008* 7.78E-04 .008* .001 .008* .001 .008* .001
t (8.83) (.78) (9.49) (1.38) (9.54) (089) (8.55) (0.82)
Country Dummies Yes Yes Yes Yes Yes Yes Yes Yes
Year Dummies No Yes No Yes No Yes No Yes
R-Sqr .9083 .9413 .9169 .9492 .9107 .9449 .9449 .9422
N-Obs. 374 374 374 374 374 374 374 374 Notes: The t-ratios in parentheses are robust to heteroskedasticity; * = statistically significant at 1% [10% etc.??], **, at 5%, and *** at 10%.

20
In general, the estimate coefficients obtained for Efficiency replicate the outcomes for
Teledensity. Our main variable, the RFI, correlates positively with level of efficiency, when
entered alone as a linear term, when entered with its square term, or when entered as its three
components. Privatization reform turns out to affect the number of main lines per employee
positively, and competition seems to enhance efficiency more than privatization. Income and cost
variables have the expected sign and statistical significance. Again, Trade has a negative sign and
is not even statistically significant most times.
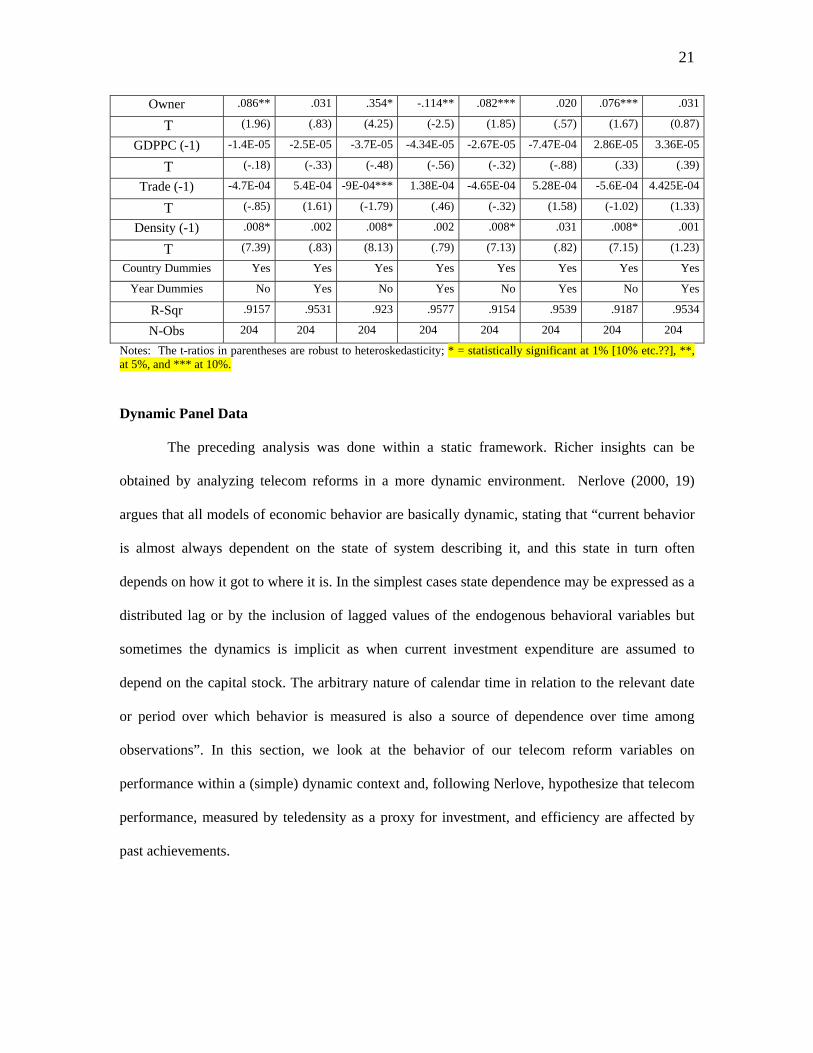
Table 6 presents the estimates obtained for the sub-sample of countries with GDPPC
lower than $2,400. Results are similar to those for the full sample. A better regulatory
environment will, on average, enhance efficiency. Privatization is mostly associated positively
with greater level of efficiency, while competition repeats the pattern of the full sample.
However, the cost variable has a better effect on efficiency than income, as evaluated by its
estimated coefficient.
Table 6 Parameter Estimate for Log of Efficiency- 12 countries Regressor Fixed Effects.
All main variables as Exogenous 1 2 3 4 5 6 7 8
Regul (-1) .486* .229* .360* .173** .336 -.144
T (7.92) (4.0) (4.08) (3.07) (1.19) (-0.59)
[Regul (-1)]2 .1468 .3646
T (.54) (1.62)
Separation (-1) .051 .0745
T (.81) (1.58)
ITU/Ten (-1) .152*** .0786
T (1.93) (1.52)
Legal (-1) .1876** .044
T (2.98) (1.02)
Regul*Comp (-1) .354* .296*
T (4.25) (4.27)
Regul*Owner (-1) .121 .040
T (1.46) (.77)
Comp .118* -.024
.087** -.028 .117** -.03 .1111* -.025
T (4.73) (-1.17) (2.68) (-1.17) (4.67) (-1.48) (4.51) (-1.18)
21
Owner .086** .031 .354* -.114** .082*** .020 .076*** .031
T (1.96) (.83) (4.25) (-2.5) (1.85) (.57) (1.67) (0.87)
GDPPC (-1) -1.4E-05 -2.5E-05 -3.7E-05 -4.34E-05 -2.67E-05 -7.47E-04 2.86E-05 3.36E-05
T (-.18) (-.33) (-.48) (-.56) (-.32) (-.88) (.33) (.39)
Trade (-1) -4.7E-04 5.4E-04 -9E-04*** 1.38E-04 -4.65E-04 5.28E-04 -5.6E-04 4.425E-04
T (-.85) (1.61) (-1.79) (.46) (-.32) (1.58) (-1.02) (1.33)
Density (-1) .008* .002 .008* .002 .008* .031 .008* .001
T (7.39) (.83) (8.13) (.79) (7.13) (.82) (7.15) (1.23)
Country Dummies Yes Yes Yes Yes Yes Yes Yes Yes
Year Dummies No Yes No Yes No Yes No Yes
R-Sqr .9157 .9531 .923 .9577 .9154 .9539 .9187 .9534
N-Obs 204 204 204 204 204 204 204 204 Notes: The t-ratios in parentheses are robust to heteroskedasticity; * = statistically significant at 1% [10% etc.??], **, at 5%, and *** at 10%.
Dynamic Panel Data
The preceding analysis was done within a static framework. Richer insights can be
obtained by analyzing telecom reforms in a more dynamic environment. Nerlove (2000, 19)
argues that all models of economic behavior are basically dynamic, stating that “current behavior
is almost always dependent on the state of system describing it, and this state in turn often
depends on how it got to where it is. In the simplest cases state dependence may be expressed as a
distributed lag or by the inclusion of lagged values of the endogenous behavioral variables but
sometimes the dynamics is implicit as when current investment expenditure are assumed to
depend on the capital stock. The arbitrary nature of calendar time in relation to the relevant date
or period over which behavior is measured is also a source of dependence over time among
observations”. In this section, we look at the behavior of our telecom reform variables on
performance within a (simple) dynamic context and, following Nerlove, hypothesize that telecom
performance, measured by teledensity as a proxy for investment, and efficiency are affected by
past achievements.

22
The econometric of dynamic panel data has and is still experiencing great development.
Although the attempt is modest here, I hope the benefits of this kind of analysis will be apparent.
Our dynamic model is:
1,...T, tand 1,...N, i d ln ln '
it''
1 ==+++= − itititit xyy εδβγ (4)
where, as before, itε may follow a one-way or two-way error component model. Equations 1A
and 1B also apply.
The simple estimation of Equation 4, using either the within transformation or least
square dummy variables (LSDV), will give inconsistent estimators because both itε and iμ in
Equations 1A and 1B are correlated. The problem becomes more acute for micro panel where
∞→N and T is fixed. For macro-panels, ∞→ T and N is fixed, so the estimation will give
consistent estimates, but a bias for either γ̂ or β̂ will appear. Different solutions have been
proposed for problems of this sort, including (1) instrumental variable estimation that utilizes
Anderson-Hsiao IV estimators (see Hsiao 1986), (2) correction of the LSDV bias with Kiviet´s
bias correction (see Kiviet 1995, 1998 – neither is listed in references, although there is a Jiviet
1995), and (3) generalized method of moments estimation (GMM; see Matyas 2000 –1999 in
references). Among the GMM, the estimators attributed to Arellano and Bond (1991) are the
most widely applied in empirical growth econometric. These are used in this analysis of the
dynamic of telecom performance for a sample of Latin American countries. [okay?]
For the strict and partial exogeneity, analysis will be done on just one of the two
performance variables - main lines per 100 inhabitants or Teleden. Different assumptions will be
made regarding the endogeneity of privatization, competition, and regulation. Finally, the
analysis will be concerned only with the full sample of twenty-two countries, and either the one-
way or two-way error component model outcomes will be presented.

23
Exogenous Model
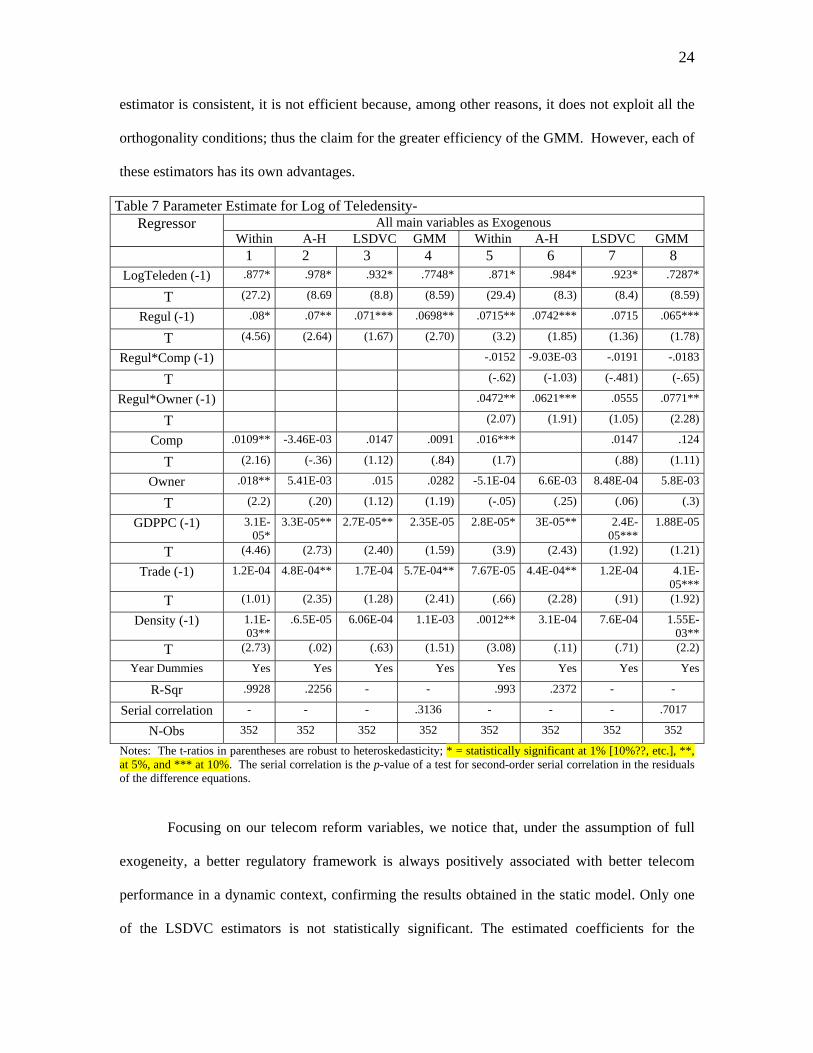
Table 7 presents the results for a dynamic model where all the telecom reform variables
are exogenous. Four different estimates are given. The first (columns 1 and 5) shows the within
estimator (or LSDV) that, as mentioned, has a bias in all coefficients, although this matters more
for the lagged value than for the other parameters. Estimators proposed by Anderson and Hsiao
(1981 – not in refs.) are displayed in columns 2 and 6, while columns 3 and 7 register the LSDV
with Kiviet (1995 - not in refs) correction. The GMM estimator from Arellano and Bond (1991)
is presented in columns 4 and 8.
The standard LSDV model with a lagged dependent variable generates biased estimates
when the time dimension of the panel (T) is small. The main problem appears whenever T is
fixed and N tends to infinity, which is typical in micro-panels that give inconsistent estimates. To
address this, Anderson and Hsiao (1981 - not in refs) propose taking the first differences of
Equation 4 and, since 1-ti,itit y y y −=Δ is correlated with the residual ituΔ , use either 2-ti,y or
2-ti,yΔ .12 I use the first of these, and the transformation yields consistent estimators of the
parameters in Equation 4. More recently, Kiviet (1995 - not in refs) derived a corrected LSDV
estimator and Bun and Kiviet (1999) derived its asymptotic variance,13 which is the LSDVC
estimator of Table 9. Lastly, Arellano and Bond (1991) proposed new estimators called GMM.
The Anderson-Hsiao estimator uses 2-ti,y as an instrument that is uncorrelated with ti,uΔ and so
demonstrates the so-called orthogonality condition, i.e., 0 )y( E 2-ti, =Δ itu for all t=2...T.
Considering other ways of combining the information in the different orthogonality conditions
and/or considering more orthogonality conditions generates the so-called generalized method of
moments (GMM) estimators proposed by Arellano and Bond. Although the Anderson-Hsiao
12 Anderson and Hsiao’s solution lies in removing country-specific effects by differencing the data. Then Equation 4 becomes: ,
'ti,
',
'1, d titiitti xyy εδβγ Δ+Δ+Δ+Δ=Δ − .
13 Although some people disregard the bias because it is small, Judson and Owen (1999) warn that even for a medium-sized T (T= 20) the bias for LSDV for dynamic panel data can be sizeable.
24
estimator is consistent, it is not efficient because, among other reasons, it does not exploit all the
orthogonality conditions; thus the claim for the greater efficiency of the GMM. However, each of
these estimators has its own advantages.
Table 7 Parameter Estimate for Log of Teledensity- All main variables as Exogenous Regressor
Within A-H LSDVC GMM Within A-H LSDVC GMM 1 2 3 4 5 6 7 8
LogTeleden (-1) .877* .978* .932* .7748* .871* .984* .923* .7287*
T (27.2) (8.69 (8.8) (8.59) (29.4) (8.3) (8.4) (8.59)
Regul (-1) .08* .07** .071*** .0698** .0715** .0742*** .0715 .065***
T (4.56) (2.64) (1.67) (2.70) (3.2) (1.85) (1.36) (1.78)
Regul*Comp (-1) -.0152 -9.03E-03 -.0191 -.0183
T (-.62) (-1.03) (-.481) (-.65)
Regul*Owner (-1) .0472** .0621*** .0555 .0771**
T (2.07) (1.91) (1.05) (2.28)
Comp .0109** -3.46E-03 .0147 .0091 .016*** .0147 .124
T (2.16) (-.36) (1.12) (.84) (1.7) (.88) (1.11)
Owner .018** 5.41E-03 .015 .0282 -5.1E-04 6.6E-03 8.48E-04 5.8E-03
T (2.2) (.20) (1.12) (1.19) (-.05) (.25) (.06) (.3)
GDPPC (-1) 3.1E-05*
3.3E-05** 2.7E-05** 2.35E-05 2.8E-05* 3E-05** 2.4E-05***
1.88E-05
T (4.46) (2.73) (2.40) (1.59) (3.9) (2.43) (1.92) (1.21)
Trade (-1) 1.2E-04 4.8E-04** 1.7E-04 5.7E-04** 7.67E-05 4.4E-04** 1.2E-04 4.1E-05***
T (1.01) (2.35) (1.28) (2.41) (.66) (2.28) (.91) (1.92)
Density (-1) 1.1E-03**
.6.5E-05 6.06E-04 1.1E-03 .0012** 3.1E-04 7.6E-04 1.55E-03**
T (2.73) (.02) (.63) (1.51) (3.08) (.11) (.71) (2.2)
Year Dummies Yes Yes Yes Yes Yes Yes Yes Yes
R-Sqr .9928 .2256 - - .993 .2372 - -
Serial correlation - - - .3136 - - - .7017
N-Obs 352 352 352 352 352 352 352 352
Notes: The t-ratios in parentheses are robust to heteroskedasticity; * = statistically significant at 1% [10%??, etc.], **, at 5%, and *** at 10%. The serial correlation is the p-value of a test for second-order serial correlation in the residuals of the difference equations.
Focusing on our telecom reform variables, we notice that, under the assumption of full
exogeneity, a better regulatory framework is always positively associated with better telecom
performance in a dynamic context, confirming the results obtained in the static model. Only one
of the LSDVC estimators is not statistically significant. The estimated coefficients for the
25
regulatory variable are 40-50 percent higher than the ones in the static model. Conversely, neither
privatization nor competition is statistically important in explaining the performance in
telecommunications. However, when regulation is interacted with privatization, it is positively
associated with network deployment, as was the case in the static version.
The estimated coefficient of the lagged dependent variable is always positive and has the
higher statistical significance. Since the double log model is used, the coefficient shows the
elasticity between the current level of network deployment and the past level achieved. This
elasticity ranges between 77 and 98 percent. In the literature on Latin American
telecommunications, analysts have stressed new telco operators’ commitment to deploy lines. The
positive and significant relationship between the interacted terms (regulation times privatization)
may indicate how that commitment was implemented, although the coefficients are similar across
the different estimators.
The income and cost variables show different results. While GPPPC has the expected
sign and is mostly significant, Trade becomes significant half of the time, having been negatively
associated with teledensity in the static model. Density, the cost proxy, is only statistically
significant in the Arellano and Bond estimator. In general, the dynamic version of the model
presents a better specification of the model, with the unrealistic assumption that all telecom
reform is strictly exogenous.14
Partial and Full Endogenous Models
We posit that the three telecom reform variables - regulation, privatization and
competition - are predetermined or endogenous, which could introduce more econometric
complications. However, under the assumption that 2 1,i ,dit = and regulation, ( itx ), are
predetermined, d 1-ti, and 1-ti,x are valid instruments, and 2-ti,x and 2-ti,d are valid if itd and ( itx )
are endogenous, as we assume. By noting that 2-ti,x and 2-ti,d are also valid instruments if 1-ti,x

26
and 1-ti,d are valid, it is evident that when the panel of countries is a set of cross-country
regressions, the number of valid instruments in each cross-section is increasing in the time
dimension (to exploit all orthogonality conditions). This property is used in Arellano and Bond´s
GMM estimator. Additionally, the estimator is linear and its estimation is eased by the
availability of econometric software. I now present coefficient estimates for full or partial
endogeneity of telecom reform variables.
Table 8 gives GMM estimators when assuming that privatization and competition are
endogenous. Again, the regulation variables have the expected positive association with main
lines per 100 inhabitants. However, as can be seen in columns 3 and 4, when we enter the linear
and the square term of regulation, neither of them is statistically significant. When each
component is entered, only the ITU/Tenenbaum factor is positively associated with greater
network deployment and statistically significant at standard levels (for the one-way effect). When
using lagged terms of privatization and competition as instruments, they are positive but
statistically insignificant. There are no fundamental changes in the control variables.
The Sargan´s test from the one-step homoskedastic estimate rejects the null hypothesis
that the overidentifying restrictions are valid. However, as Arellano and Bond warn, this could be
due to heteroskedasticity.15 Here, recall that all t-statistics are heteroskedasticity robust. The
estimate coefficients in the homoskedastic case (not presented here) were all statistically
significant and with the expected sign. I prefer to present the robust estimates. The null of first-
order autocorrelation in the differenced residuals is rejected, but as Arellano and Bond (1991,
281) stress, “the consistency of GMM estimators hinges heavily upon the assumption that
0)( )2(it =−tiE νν ,” so we cannot reject the null of no second-order autocorrelation.
14 The results for the sub-sample of twelve low-income countries in the region were generally poor. The variables displayed the expected sign, but their statistical significance was low for the three new estimators.

27
Table 8 Parameter Estimate for Log of Teledensity- Regressors Competition and Privatization as Endogenous
GMM-One-Step 1 2 3 4 5 6
LogTeleden (-1) .7988* .7602* .7776* .7410* .7973* .7593*
t (12.8) (13.2) (11.8) (12.5) (12.4) (13.0)
Regul (-1) .07679** .07995** -1.89E-03 -.038
t (2.75) (2.66) (-.02) (-.39)
[Regul (-1)]2 6.92E-02 .11255
t (.82) (1.21)
Separation (-1) .0153 .0112
t (.86) (.52)
ITU/Ten (-1) .0402 .0553**
t (1.53) (2.13)
Legal (-1) .0197 .0129
t (1.02) (.72)
Comp .0126 .00997 .0173 1.17E-02 .0131 .0102
t (1.1) (1.2) (1.5) (1.4) (1.2) (1.4)
Owner .0104 .0112 1.53E-02 1.02E-02 .0123 .0111
t (.56) (.56) (.73) (.51) (.70) (.55)
GDPPC (-1) 2.7E-05** 2.0E-05*** 2.74E-05** 2.15E-05** 3.04E-05** 2.04E-05**
t (2.06) (1.77) (2.40) (2.02) (2.43) (1.96)
Trade (-1) 5.5E-05** 2.9E-04 5.4E-04** 2.6E-04 5.1E-04** 2.9E-04
t (2.5) (1.05) (2.45) (.99) (2.29) (1.06)
Density (-1) 8.6E-04 9.74E-04** 1.09E-03 1.1E-03** 8.9E-04 9.7E-04***
t (1.34) (2.01) (1.63) (2.31) (1.37) (1.9)
Year Dummies Yes No Yes No Yes NoWalda .000 .000 .000 .000 .000 .000
Serial correlationb .3708 .4217 .3544 .4344 .3916 .4215N-Obs 352 352 352 352 352 352
Notes: The t-ratios in parentheses are robust to heteroskedasticity; * = statistically significant at 1% [10%??, etc.], **, at 5%, and *** at 10% a The p-value of Wald test of the null that all coefficients except the constant (and time dummies are zero. b The p-value of a test for second-order serial correlation in the residuals of the difference equations.
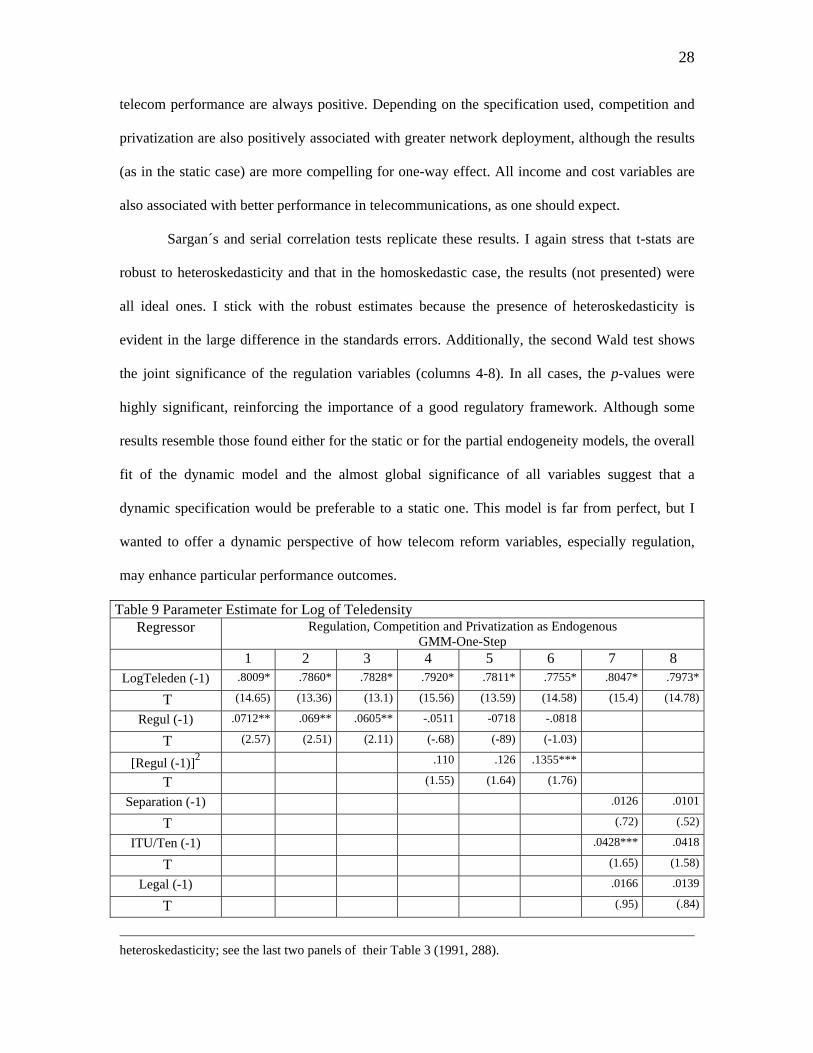
Table 9 shows the GMM estimate coefficients when all telecom reform variables
(regulation, privatization, and competition) are assumed to be endogenous. The relationship
between a better regulatory framework and telecom performance is verified. Entered alone, with
its square term, or (in a lesser measure) with its three components, the effects of regulation on
15 Arellano and Bond found evidence that the one-step Sargan´s test over-rejects in the presence of
28
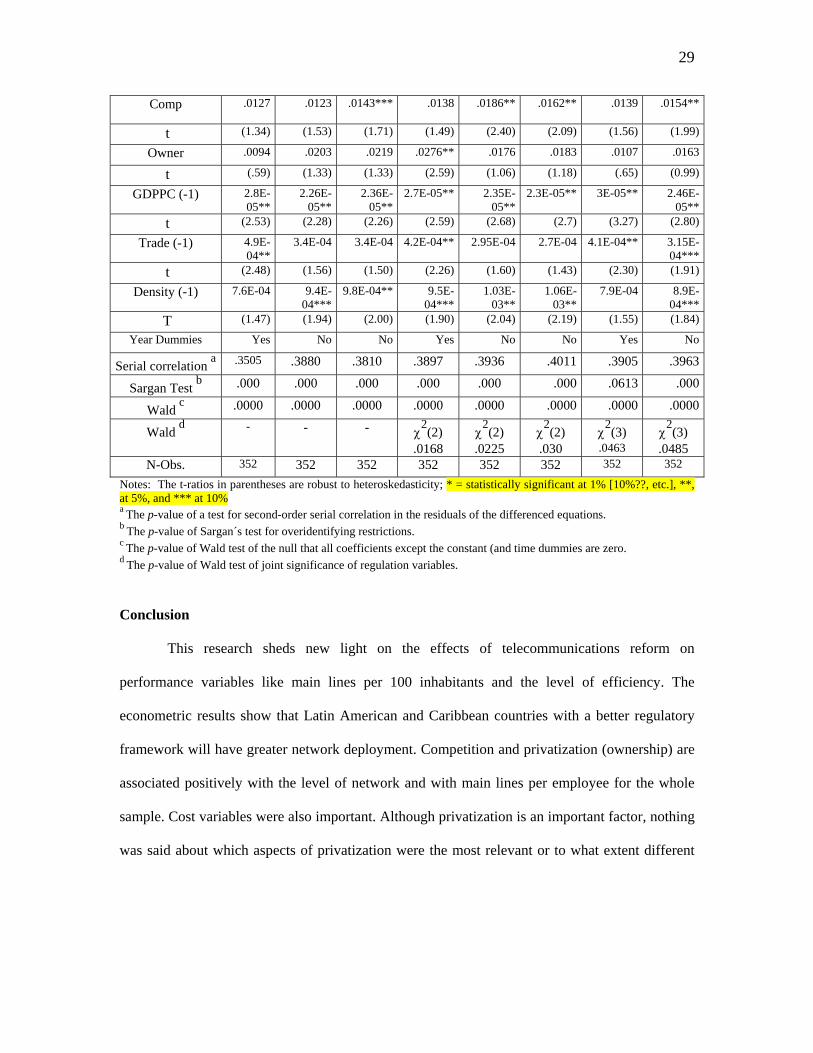
telecom performance are always positive. Depending on the specification used, competition and
privatization are also positively associated with greater network deployment, although the results
(as in the static case) are more compelling for one-way effect. All income and cost variables are
also associated with better performance in telecommunications, as one should expect.
Sargan´s and serial correlation tests replicate these results. I again stress that t-stats are
robust to heteroskedasticity and that in the homoskedastic case, the results (not presented) were
all ideal ones. I stick with the robust estimates because the presence of heteroskedasticity is
evident in the large difference in the standards errors. Additionally, the second Wald test shows
the joint significance of the regulation variables (columns 4-8). In all cases, the p-values were
highly significant, reinforcing the importance of a good regulatory framework. Although some
results resemble those found either for the static or for the partial endogeneity models, the overall
fit of the dynamic model and the almost global significance of all variables suggest that a
dynamic specification would be preferable to a static one. This model is far from perfect, but I
wanted to offer a dynamic perspective of how telecom reform variables, especially regulation,
may enhance particular performance outcomes.
Table 9 Parameter Estimate for Log of Teledensity Regressor Regulation, Competition and Privatization as Endogenous
GMM-One-Step 1 2 3 4 5 6 7 8
LogTeleden (-1) .8009* .7860* .7828* .7920* .7811* .7755* .8047* .7973*
T (14.65) (13.36) (13.1) (15.56) (13.59) (14.58) (15.4) (14.78)
Regul (-1) .0712** .069** .0605** -.0511 -0718 -.0818
T (2.57) (2.51) (2.11) (-.68) (-89) (-1.03)
[Regul (-1)]2 .110 .126 .1355***
T (1.55) (1.64) (1.76)
Separation (-1) .0126 .0101
T (.72) (.52)
ITU/Ten (-1) .0428*** .0418
T (1.65) (1.58)
Legal (-1) .0166 .0139
T (.95) (.84)
heteroskedasticity; see the last two panels of their Table 3 (1991, 288).
29
Comp .0127 .0123
.0143*** .0138 .0186** .0162** .0139 .0154**
t (1.34) (1.53) (1.71) (1.49) (2.40) (2.09) (1.56) (1.99)
Owner .0094 .0203 .0219 .0276** .0176 .0183 .0107 .0163
t (.59) (1.33) (1.33) (2.59) (1.06) (1.18) (.65) (0.99)
GDPPC (-1) 2.8E-05**
2.26E-05**
2.36E-05**
2.7E-05** 2.35E-05**
2.3E-05** 3E-05** 2.46E-05**
t (2.53) (2.28) (2.26) (2.59) (2.68) (2.7) (3.27) (2.80)
Trade (-1) 4.9E-04**
3.4E-04 3.4E-04 4.2E-04** 2.95E-04 2.7E-04 4.1E-04** 3.15E-04***
t (2.48) (1.56) (1.50) (2.26) (1.60) (1.43) (2.30) (1.91)
Density (-1) 7.6E-04 9.4E-04***
9.8E-04** 9.5E-04***
1.03E-03**
1.06E-03**
7.9E-04 8.9E-04***
T (1.47) (1.94) (2.00) (1.90) (2.04) (2.19) (1.55) (1.84)
Year Dummies Yes No No Yes No No Yes No
Serial correlation a .3505 .3880 .3810 .3897 .3936 .4011 .3905 .3963
Sargan Test b .000 .000 .000 .000 .000 .000 .0613 .000
Wald c .0000 .0000 .0000 .0000 .0000 .0000 .0000 .0000
Wald d - - - χ2(2)
.0168 χ
2(2) .0225
χ2(2)
.030 χ
2(3) .0463
χ2(3)
.0485 N-Obs. 352 352 352 352 352 352 352 352
Notes: The t-ratios in parentheses are robust to heteroskedasticity; * = statistically significant at 1% [10%??, etc.], **, at 5%, and *** at 10% a The p-value of a test for second-order serial correlation in the residuals of the differenced equations. b The p-value of Sargan´s test for overidentifying restrictions. c The p-value of Wald test of the null that all coefficients except the constant (and time dummies are zero. d The p-value of Wald test of joint significance of regulation variables.
Conclusion
This research sheds new light on the effects of telecommunications reform on
performance variables like main lines per 100 inhabitants and the level of efficiency. The
econometric results show that Latin American and Caribbean countries with a better regulatory
framework will have greater network deployment. Competition and privatization (ownership) are
associated positively with the level of network and with main lines per employee for the whole
sample. Cost variables were also important. Although privatization is an important factor, nothing
was said about which aspects of privatization were the most relevant or to what extent different

30
privatization procedures may have different effects on performance in the sector. Research in this
area is needed.16
Although the sample of countries chosen in this study is restricted to the Latin American
region, the inferences may be valid for countries with similarities. The main lesson is that the
building of a sound and strong regulatory environment, the opening of the market to more
competition, and the free entry of private investors in basic telecommunications services will
propel network expansion and efficiency across the sector.
Research on telecommunications reform is still in process. In the static context I mostly
assumed that the regulatory framework was exogenously determined. My dynamic model is also
a first step in analyzing the determinants of telecom performance by considering regulation as
endogenous variable. Although the results were good, the regulatory framework index may be
improved with the addition of new factors not yet recognized. In the future, more statistical
information about the recent privatization of telecom operators in Central America and Brazil will
provide more observations. Also, concerns about the rapid convergence in telecommunications
and the rapid growth of mobile telecommunications services complicate matters for research
purposes. It is hoped that this study had raised questions for future research in the region and on
the sector.
16 A working paper by Bortolotti et al. (2001) may be the exception. The authors make a thorough study of the financial and operating performance of thirty-one former state-owned telecom operators. They include a set of simple variables - regulatory, competition, and state ownership, among others - and test their effect on profitability, output, and efficiency. Only two Latin American countries, Argentina and Mexico, were included in this study.
31
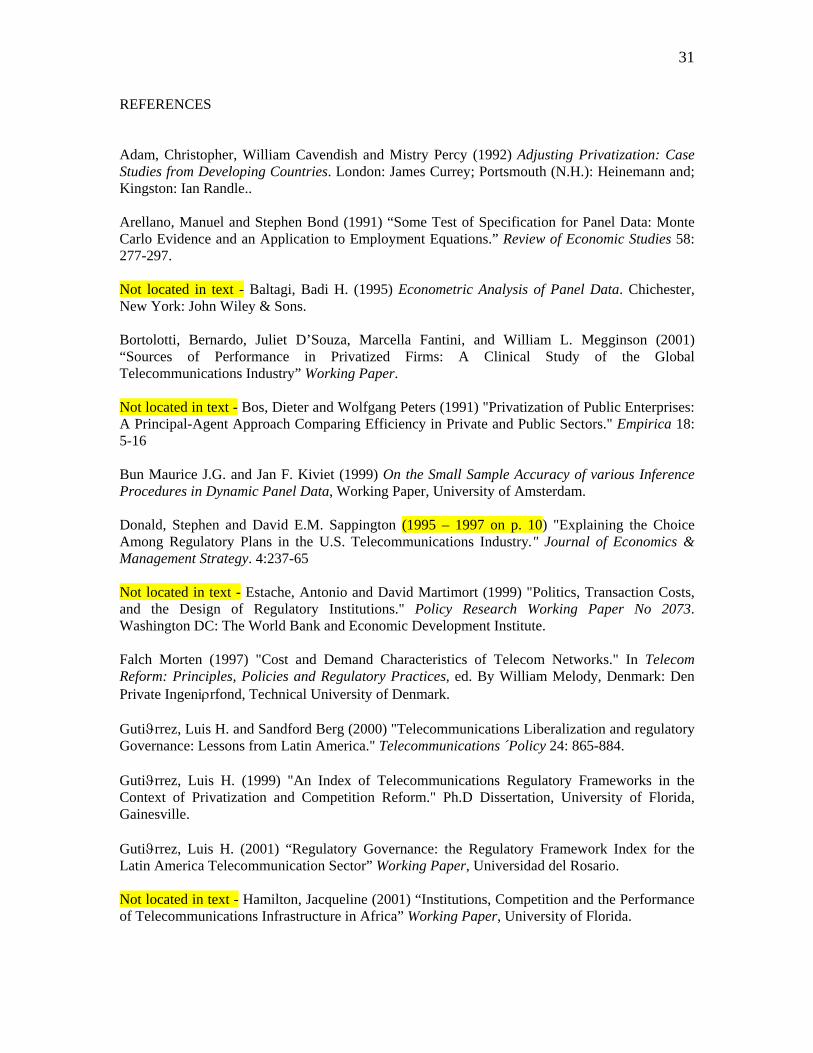
REFERENCES
Adam, Christopher, William Cavendish and Mistry Percy (1992) Adjusting Privatization: Case Studies from Developing Countries. London: James Currey; Portsmouth (N.H.): Heinemann and; Kingston: Ian Randle.. Arellano, Manuel and Stephen Bond (1991) “Some Test of Specification for Panel Data: Monte Carlo Evidence and an Application to Employment Equations.” Review of Economic Studies 58: 277-297. Not located in text - Baltagi, Badi H. (1995) Econometric Analysis of Panel Data. Chichester, New York: John Wiley & Sons. Bortolotti, Bernardo, Juliet D’Souza, Marcella Fantini, and William L. Megginson (2001) “Sources of Performance in Privatized Firms: A Clinical Study of the Global Telecommunications Industry” Working Paper. Not located in text - Bos, Dieter and Wolfgang Peters (1991) "Privatization of Public Enterprises: A Principal-Agent Approach Comparing Efficiency in Private and Public Sectors." Empirica 18: 5-16 Bun Maurice J.G. and Jan F. Kiviet (1999) On the Small Sample Accuracy of various Inference Procedures in Dynamic Panel Data, Working Paper, University of Amsterdam. Donald, Stephen and David E.M. Sappington (1995 – 1997 on p. 10) "Explaining the Choice Among Regulatory Plans in the U.S. Telecommunications Industry." Journal of Economics & Management Strategy. 4:237-65 Not located in text - Estache, Antonio and David Martimort (1999) "Politics, Transaction Costs, and the Design of Regulatory Institutions." Policy Research Working Paper No 2073. Washington DC: The World Bank and Economic Development Institute. Falch Morten (1997) "Cost and Demand Characteristics of Telecom Networks." In Telecom Reform: Principles, Policies and Regulatory Practices, ed. By William Melody, Denmark: Den Private Ingeniρrfond, Technical University of Denmark. Gutiϑrrez, Luis H. and Sandford Berg (2000) "Telecommunications Liberalization and regulatory Governance: Lessons from Latin America." Telecommunications ´Policy 24: 865-884. Gutiϑrrez, Luis H. (1999) "An Index of Telecommunications Regulatory Frameworks in the Context of Privatization and Competition Reform." Ph.D Dissertation, University of Florida, Gainesville. Gutiϑrrez, Luis H. (2001) “Regulatory Governance: the Regulatory Framework Index for the Latin America Telecommunication Sector” Working Paper, Universidad del Rosario. Not located in text - Hamilton, Jacqueline (2001) “Institutions, Competition and the Performance of Telecommunications Infrastructure in Africa” Working Paper, University of Florida.

32
Not located in text - Heckman, James J. (1978) “Dummy Endogenous Variables in a Simultaneous Equation System.” Econometrica 46: 931-959. Henisz, Witold and Bennet A. Zelner (2001) "The Institutional Environment for Telecommunications Investment." Journal of Economics and Management Strategy 10: 123-147. Hsiao, Cheng (1986) Analysis of Panel Data. Melbourne, Australia: Cambridge University Press. Not located in text - International Telecommunications Union (1997a) ITU Database World Telecommunications Indicators 1997. Not located in text - ------------------------------------------------- (1997b) World Telecommunication Development Report 1996/97, Trade in Telecommunications, ITU, Geneva, Switzerland. Not located in text - ------------------------------------------------- (1998b) General Trends in Telecommunication Reform 1998: Americas Volume III, ITU, Geneva, Switzerland. Kiviet in text - ?? Jiviet, Jan F. (1995) “On Bias, Inconsistency, and Efficiency of various Estimators in Dynamic Panel Data Models.” Journal of Econometrics 68: 53-78. Not located in text - Judson Ruth A. And Ann L. Owen “Estimating Dynamic Panel Data Models: a Guide for Macroeconomists.” Economics Letters 65: 9-15. Kridel, Donald, David E.M Sappington and Dennis L. Weisman (1996) "The Effects of Incentive Regulation in the Telecommunications Industry: A Survey." Journal of Regulatory Economics 9: 269-306. Levy, Arthur and Pablo T. Spiller (1996) Regulations, Institutions, and Commitment: Comparative Studies of Telecommunications. New York: Cambridge University Press. Matyas, Laszlo (1999 – 2000 on p. 22) Generalized Method of Moments Estimation, New York: Cambridge University Press. Not located in text - McCubbins, Mathew D. (1995) Utility Regulation. Economic Development and Political Stability: The Contrasting Cases of Argentina and Chile. IRIS Center, W.P. No 160, Maryland: Molano, Walter T. (1997) The Logic of Privatization: The Case of Telecommunications in the Southers Cone in Latin America. Westport, Connecticut: Greenwood Press. Nerlove, Marc (2000) An Essay on the History of Panel Data Econometrics. Working Paper, Department of Agricultural and Resource Economics, University of Maryland. Petrazzini, Ben A. (1995) The Political Economy of Telecommunications Reform in Developing Countries: Privatization and Liberalization in Comparative Perspective. Westport, Connecticut, London: Praeger. Not located in text - Pyramid Research (1998) Telecom Markets and Strategies: South America. September. Cambridge, MA: The Economist Intelligence Unit, Ltd
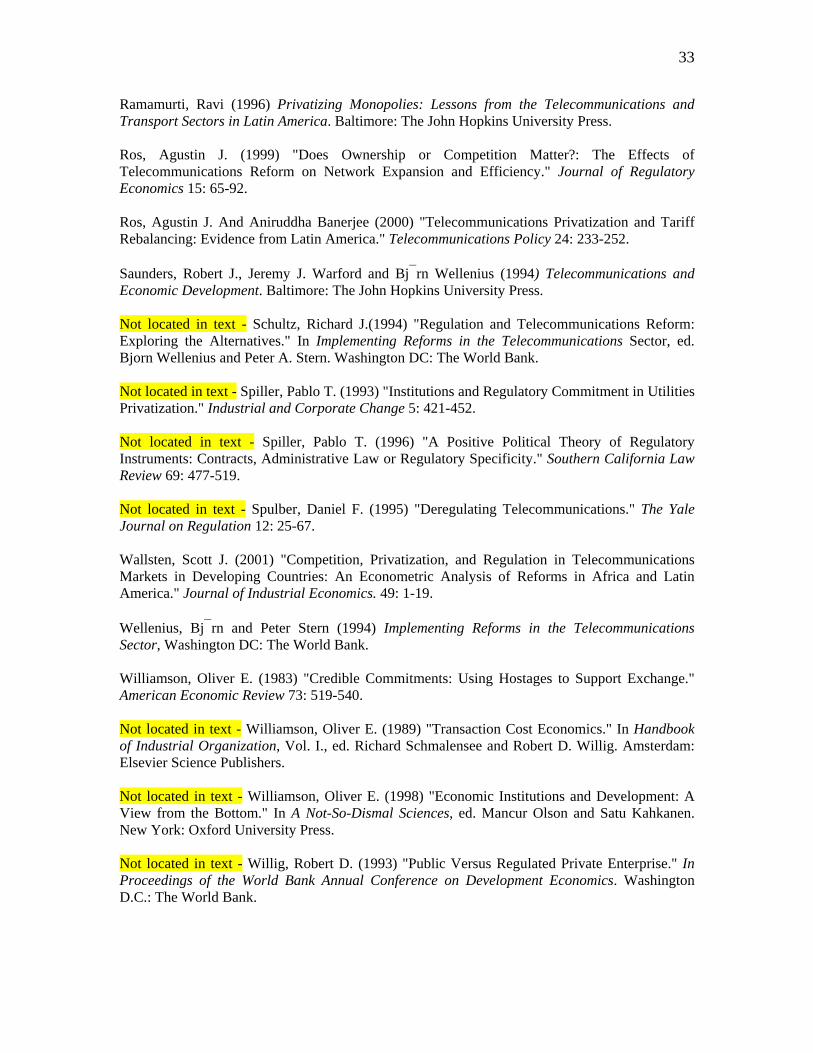
33
Ramamurti, Ravi (1996) Privatizing Monopolies: Lessons from the Telecommunications and Transport Sectors in Latin America. Baltimore: The John Hopkins University Press. Ros, Agustin J. (1999) "Does Ownership or Competition Matter?: The Effects of Telecommunications Reform on Network Expansion and Efficiency." Journal of Regulatory Economics 15: 65-92. Ros, Agustin J. And Aniruddha Banerjee (2000) "Telecommunications Privatization and Tariff Rebalancing: Evidence from Latin America." Telecommunications Policy 24: 233-252. Saunders, Robert J., Jeremy J. Warford and Bj⎯rn Wellenius (1994) Telecommunications and Economic Development. Baltimore: The John Hopkins University Press. Not located in text - Schultz, Richard J.(1994) "Regulation and Telecommunications Reform: Exploring the Alternatives." In Implementing Reforms in the Telecommunications Sector, ed. Bjorn Wellenius and Peter A. Stern. Washington DC: The World Bank. Not located in text - Spiller, Pablo T. (1993) "Institutions and Regulatory Commitment in Utilities Privatization." Industrial and Corporate Change 5: 421-452. Not located in text - Spiller, Pablo T. (1996) "A Positive Political Theory of Regulatory Instruments: Contracts, Administrative Law or Regulatory Specificity." Southern California Law Review 69: 477-519. Not located in text - Spulber, Daniel F. (1995) "Deregulating Telecommunications." The Yale Journal on Regulation 12: 25-67. Wallsten, Scott J. (2001) "Competition, Privatization, and Regulation in Telecommunications Markets in Developing Countries: An Econometric Analysis of Reforms in Africa and Latin America." Journal of Industrial Economics. 49: 1-19. Wellenius, Bj⎯rn and Peter Stern (1994) Implementing Reforms in the Telecommunications Sector, Washington DC: The World Bank. Williamson, Oliver E. (1983) "Credible Commitments: Using Hostages to Support Exchange." American Economic Review 73: 519-540. Not located in text - Williamson, Oliver E. (1989) "Transaction Cost Economics." In Handbook of Industrial Organization, Vol. I., ed. Richard Schmalensee and Robert D. Willig. Amsterdam: Elsevier Science Publishers. Not located in text - Williamson, Oliver E. (1998) "Economic Institutions and Development: A View from the Bottom." In A Not-So-Dismal Sciences, ed. Mancur Olson and Satu Kahkanen. New York: Oxford University Press. Not located in text - Willig, Robert D. (1993) "Public Versus Regulated Private Enterprise." In Proceedings of the World Bank Annual Conference on Development Economics. Washington D.C.: The World Bank.

34
APPENDIX Table 1-A Sample Characteristics Mean Std Dev Min Max Median 1st Qrt 3rd Qrt Teledensity 6.14 4.35 0.81 23.20 5.04 2.52 8.55Efficiency 66.15 51.45 51.45 8.80 54.28 28.31 87.74RFI a 0.380 0.251 0.143 1.00 0.286 0.143 0.571Competition 0.308 0.462 0.00 1.00 0.00 0.00 1.00Privatization 0.202 0.402 0.00 1.00 0.00 0.00 0.00GDPPC b 2,426 1,730 416 8955 1,809 1,330 3,348TRADE 62.35 41.08 10.43 210.71 50.36 35.64 75.38Density 59.90 75.74 2.28 286.09 29.34 15.05 57.72Urban 59.70 16.31 30.50 90.70 56.42 46.49 71.69 Note: a. Regulatory Framework Index b. In 1995 US Dollars Table A-2 Correlation Matrix Teledensity Efficiency RFI GDPPC TRADE COMPET PRIVAT Density Urban Teledensity 1.000 Efficiency 0.529 1.000 RFI 0.381 0.552 1.000 GDPPC 0.612 0.326 0.205 1.000 TRADE 0.039 -0.162 0.097 -0.302 1.000 Competition 0.290 0.560 0.494 0.160 -0.048 1.000 Privatization 0.069 0.320 0.438 0.086 0.0760 0.318 1.000 Density 0.049 -0.149 0.192 -0.064 0.170 -0.102 0.083 1.000 Urban 0.540 0.450 0.316 0.762 -0.422 0.260 0.173 -0.192 1.000
35
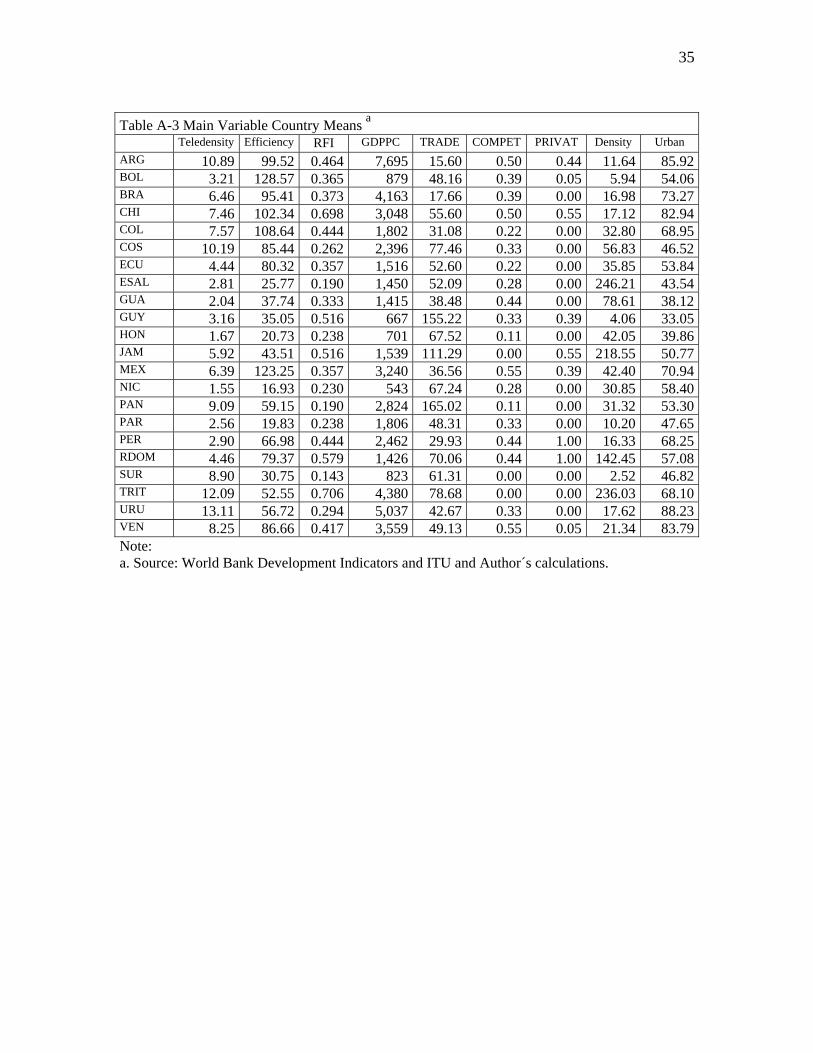
Table A-3 Main Variable Country Means a Teledensity Efficiency RFI GDPPC TRADE COMPET PRIVAT Density Urban ARG 10.89 99.52 0.464 7,695 15.60 0.50 0.44 11.64 85.92BOL 3.21 128.57 0.365 879 48.16 0.39 0.05 5.94 54.06BRA 6.46 95.41 0.373 4,163 17.66 0.39 0.00 16.98 73.27CHI 7.46 102.34 0.698 3,048 55.60 0.50 0.55 17.12 82.94COL 7.57 108.64 0.444 1,802 31.08 0.22 0.00 32.80 68.95COS 10.19 85.44 0.262 2,396 77.46 0.33 0.00 56.83 46.52ECU 4.44 80.32 0.357 1,516 52.60 0.22 0.00 35.85 53.84ESAL 2.81 25.77 0.190 1,450 52.09 0.28 0.00 246.21 43.54GUA 2.04 37.74 0.333 1,415 38.48 0.44 0.00 78.61 38.12GUY 3.16 35.05 0.516 667 155.22 0.33 0.39 4.06 33.05HON 1.67 20.73 0.238 701 67.52 0.11 0.00 42.05 39.86JAM 5.92 43.51 0.516 1,539 111.29 0.00 0.55 218.55 50.77MEX 6.39 123.25 0.357 3,240 36.56 0.55 0.39 42.40 70.94NIC 1.55 16.93 0.230 543 67.24 0.28 0.00 30.85 58.40PAN 9.09 59.15 0.190 2,824 165.02 0.11 0.00 31.32 53.30PAR 2.56 19.83 0.238 1,806 48.31 0.33 0.00 10.20 47.65PER 2.90 66.98 0.444 2,462 29.93 0.44 1.00 16.33 68.25RDOM 4.46 79.37 0.579 1,426 70.06 0.44 1.00 142.45 57.08SUR 8.90 30.75 0.143 823 61.31 0.00 0.00 2.52 46.82TRIT 12.09 52.55 0.706 4,380 78.68 0.00 0.00 236.03 68.10URU 13.11 56.72 0.294 5,037 42.67 0.33 0.00 17.62 88.23VEN 8.25 86.66 0.417 3,559 49.13 0.55 0.05 21.34 83.79Note: a. Source: World Bank Development Indicators and ITU and Author´s calculations.