Embed Size (px)
Citation preview

Glasgow Theses Service http://theses.gla.ac.uk/
Cheng, Kenneth (2013) The effects of elective total knee arthroplasty on the activation of markers of inflammation, coagulation and endothelial dysfunction. MD thesis. http://theses.gla.ac.uk/4096/ Copyright and moral rights for this thesis are retained by the author A copy can be downloaded for personal non-commercial research or study, without prior permission or charge This thesis cannot be reproduced or quoted extensively from without first obtaining permission in writing from the Author The content must not be changed in any way or sold commercially in any format or medium without the formal permission of the Author When referring to this work, full bibliographic details including the author, title, awarding institution and date of the thesis must be given
The effects of elective total knee arthroplasty on
the activation of markers of inflammation,
coagulation and endothelial dysfunction
Kenneth Cheng MBChB (Glasgow)
MRCSEd, FRCSEd (Trauma & Orth)
Submitted in fulfilment of the requirements for the
Degree of Doctor of Medicine (MD)
The University of Glasgow
Institute of Cardiovascular and Medical Sciences
Faculty of Medicine
2013

1
I would like to dedicate this thesis to my lovely wife,
Jacqueline for all her support through the good times
and the bad, without whom I would have never have got
my research done! And to our two beautiful ‘wee
monsters Eilidh and Angus.
2
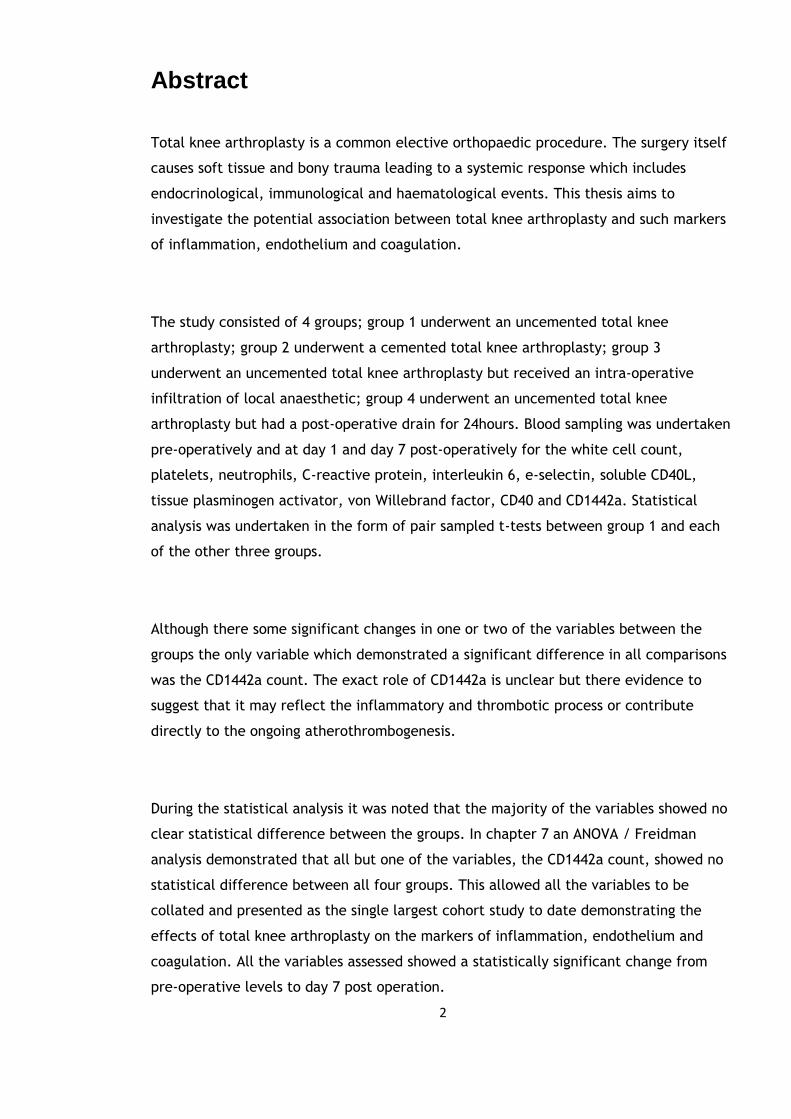
Abstract
Total knee arthroplasty is a common elective orthopaedic procedure. The surgery itself
causes soft tissue and bony trauma leading to a systemic response which includes
endocrinological, immunological and haematological events. This thesis aims to
investigate the potential association between total knee arthroplasty and such markers
of inflammation, endothelium and coagulation.
The study consisted of 4 groups; group 1 underwent an uncemented total knee
arthroplasty; group 2 underwent a cemented total knee arthroplasty; group 3
underwent an uncemented total knee arthroplasty but received an intra-operative
infiltration of local anaesthetic; group 4 underwent an uncemented total knee
arthroplasty but had a post-operative drain for 24hours. Blood sampling was undertaken
pre-operatively and at day 1 and day 7 post-operatively for the white cell count,
platelets, neutrophils, C-reactive protein, interleukin 6, e-selectin, soluble CD40L,
tissue plasminogen activator, von Willebrand factor, CD40 and CD1442a. Statistical
analysis was undertaken in the form of pair sampled t-tests between group 1 and each
of the other three groups.
Although there some significant changes in one or two of the variables between the
groups the only variable which demonstrated a significant difference in all comparisons
was the CD1442a count. The exact role of CD1442a is unclear but there evidence to
suggest that it may reflect the inflammatory and thrombotic process or contribute
directly to the ongoing atherothrombogenesis.
During the statistical analysis it was noted that the majority of the variables showed no
clear statistical difference between the groups. In chapter 7 an ANOVA / Freidman
analysis demonstrated that all but one of the variables, the CD1442a count, showed no
statistical difference between all four groups. This allowed all the variables to be
collated and presented as the single largest cohort study to date demonstrating the
effects of total knee arthroplasty on the markers of inflammation, endothelium and
coagulation. All the variables assessed showed a statistically significant change from
pre-operative levels to day 7 post operation.

3
In summary our studies demonstrate that total knee arthroplasty results in activation of
common markers of inflammation, endothelium and coagulation. These changes may
explain the increased incidence of venous thrombosis and thrombo-embolism post-
operatively as well as a potential risk of venous thrombo-embolism.

4
Table of Contents
Abstract 2
Table of Contents 4
List of Tables 9
List of Figures 21
Acknowledgements 34
Author’s Declaration 35
Definitions / Abbreviations 22
List of Relevant Presentations 25
5
Chapter 1: Introduction 41
1.1 The systemic response to surgery 43
1.2 Cytokines 49
1.3 Acute phase response 61
1.4 Circulating markers of atherosclerosis, thrombosis and
Inflammation 65
1.5 The acute phase response, venous thromboembolism and arterial
thrombosis 86
1.6 Activation of blood cells studied by flow cytometry 93
1.7 Polymethylmethacrylate bone cement 108
1.8 Current evidence: Effect of elective orthopaedic surgery on
activation of markers of inflammation, endothelium and coagulation 111
1.9 Aims of thesis 117
Chapter 2: Subjects and method 120
2.1 Subjects 121
2.2 Blood sampling, handling and laboratory assays 124
2.3 Statistical Analysis 127

6
Chapter 3: The effect of elective uncemented total knee arthroplasty 129
on the activation of markers of inflammation, endothelium and coagulation
3.1 Subject Characteristics 130
3.2 Blood cell count and CRP 130
3.3 Circulating activation markers 137
3.4 Flow cytometry assays of cell cytokine expression 145
3.5 Discussion 151
Chapter 4: The effect of elective cemented total knee arthroplasty on 153
the activation of markers of inflammation, endothelium and coagulation
4.1 Subject Characteristics 154
4.2 Blood cell count and CRP 154
4.3 Circulating activation markers 161
4.4 Flow cytometry assays of cell cytokine expression 169
4.5 Cemented group versus uncemented group to assess any additional
effect the cement may have on the inflammatory and endothelial
response 175
4.6 Discussion 182

7
Chapter 5: Effect of local anaesthetic infiltration intra-operatively on 184
the activation of markers of inflammation, endothelium and coagulation
after uncemented total knee arthroplasty
5.1 Subject Characteristics 185
5.2 Blood cell count and CRP 185
5.3 Circulating activation markers 194
5.4 Flow cytometry assays of cell cytokine expression 202
5.5 Uncemented versus local anaesthetic infiltration group to assess
whether the local anaesthetic would dampen the inflammatory and
endothelial response 208
5.6 Discussion 216
Chapter 6: The effect of using of a drain post-operatively on the 218
activation of markers of inflammation, endothelium and coagulation after
uncemented total knee arthroplasty
6.1 Results 219
6.2 Blood cell count and CRP 219
6.3 Circulating activation markers 226
6.4 Flow cytometry assays of cell cytokine expression 235

8
6.5 Uncemented group versus the group with a surgical drain to assess any
effect this would have on the inflammatory and endothelial response ….. 241
6.6 Discussion 249
Chapter 7: Comparison of four groups and collaboration of results 250
7.1 Introduction 251
7.2 Statistical Analysis 251
7.3 Results 252
7.4 Discussion 268
Chapter 8: Discussion and Future Research 270
8.1 Discussion 271
8.2 Future direction 278
References 279
Appendices 298

9
List of Tables
Table 1.1: Systemic response to surgery 41
Table 1.2: Features of the acute phase response 61
Table 1.3: Clinical parameters in SIRS 63
Table 1.4: Constituents of bone cement 108
Table 2.1: Inclusion criteria for the study 121
Table 2.2: Overview of BD Vacutainer systems 124
Table 3.1: Mean, standard deviations and standard error of means of platelets
(Plat), white cell count (WCC), neutrophils (Neutro), monocytes
(Mono) (all 109/L) and C-reactive protein (CRP) (mg/L) pre-
operatively (P1) and at day 1 (D1) and day 7 (D7)post-operatively
in the uncemented total knee arthroplasty group (n=19) 131
Table 3.2: Paired sample t-test of platelets, WCC, neutrophils, monocytes
and CRP in the uncemented total knee arthroplasty group (n=19) 132
Table 3.3a: Mean, standard deviations and standard error of means of tissue
plasminogen activator (t-PA) (ng/ml), von Willebrand factor (vWF)
(IU/dl), soluble CD40 ligand (sCD40L) (pg/ml), interleukin 6 (IL6)
(pg/ml) and tumour necrosis factor (TNFα) (pg/ml) in the

10
uncemented total knee arthroplasty group (n=19) 137
Table 3.3b: Median and Inter-quartile ranges (IQR) of e-selectin (ng/ml)
in the uncemented total knee arthroplasty group (n=19) 138
Table 3.4a: Paired sample t-test of tissue plasminogen activator (t-PA) (ng/ml),
von Willebrand factor (vWF) (IU/dl), soluble CD40 ligand (sCD40L)
(pg/ml), interleukin 6 (IL6) (pg/ml) and tumour necrosis factor
(TNFα) (pg/ml) in the uncemented total knee arthroplasty group
(n=19) 139
Table 3.4b: Wilcoxon signed rank test for e-selectin (ng/ml) in the uncemented
total knee arthroplasty group (n=19) 140
Table 3.5a: The mean, standard deviation and standard error of means of
CD1442a and CD40, expressed as percentage values in the
uncemented total knee arthroplasty group (n=19) 145
Table 3.5b: Median and Inter-quartile ranges (IQR) of CD1442a and CD40,
expressed as absolute values in the uncemented total knee
arthroplasty group (n=19) 146
Table 3.6a: Mean, standard deviation and p values of CD1442a and CD40 (mean
& SD) in the uncemented total knee arthroplasty group (n=19) 147
Table 3.6b: Wilcoxon signed rank test for CD1442a andCD40 absolute values in the
uncemented total knee arthroplasty group (n=19) 148

11
Table 4.1: Mean, standard deviations and standard error of means of platelets,
white cell count (WCC), neutrophils (Neutro), monocytes (Mono)
(all 109/L) and C-reactive Protein (CRP) (mg/L) pre-operatively (P1)
and on days1 (D1) and day 7 (D7) post-operatively in the cemented
total knee arthroplasty group (n=19) 155
Table 4.2: Paired sample t-tests of WCC, neutrophils, monocytes and CRP in
the cemented total knee arthroplasty group (n=19) 156
Table 4.3a: Mean, standard deviations and standard error of means of tissue
plasminogen activator (t-PA) (ng/ml), von Willebrand factor (vWF)
(IU/dl), soluble CD40 ligand (sCD40L) (pg/ml), interleukin 6 (IL6)
(pg/ml) and tumour necrosis factor (TNFα) (pg/ml) in the cemented
total knee arthroplasty group (n=19) 161
Table 4.3b: Median and Inter-quartile ranges (IQR) of e-selectin (ng/ml) in the
cemented total knee arthroplasty group (n=19) 162
Table 4.4a: Paired sample t-test of tissue plasminogen activator (t-PA) (ng/ml),
von Willebrand factor (vWF) (IU/dl), soluble CD40 ligand (sCD40L)
(pg/ml), interleukin 6 (IL6) (pg/ml) and tumour necrosis factor
(TNFα) (pg/ml) in the cemented total knee arthroplasty group
(n=19) 163
Table 4.4b: Wilcoxon signed rank test for e-selectin (ng/ml) in the cemented
total knee arthroplasty group (n=19) 164

12
Table 4.5a: The mean, standard deviation and standard error means of CD1442a
and CD40, expressed as percentage values in the cemented total knee
arthroplasty group (n=19) 169
Table 4.5b: Median and inter-quartile ranges (IQR) of CD1442a, expressed as
Absolute values in the cemented total knee arthroplasty group
(n=19) 170
Table 4.6a: Mean, standard deviation and p values of CD1442a and CD40 expressed
as percentage values in the cemented total knee arthroplasty group
(n=19) 171
Table 4.6b: Wilcoxon signed rank test for CD1442a and CD40 absolute values in
The cemented total knee arthroplasty group (n=19) 172
Tale 4.7: Mean difference, standard error difference and significance of blood
parameters between the cemented total knee arthroplasty group
(n=19) and uncemented total knee arthroplasty group (n=19) 176
Table 4.8a: Mean difference, standard error difference and significance of tissue
plasminogen activator (t-PA), von Willebrand factor (vWF), soluble
CD40 ligand (sCD40L0, interleukin 6 (IL6) and tumour necrosis factor
alpha (TNFα) levels between the cemented total knee arthroplasty
group (n=19) and uncemented total knee arthroplasty group
(n=19) 177

13
Table 4.8b: Mann-Whitney U test for e-selectin (ng/ml) between the cemented
total knee arthroplasty group (n=19) and uncemented total knee
arthroplasty group (n=19) 178
Table 4.9a: Mean difference, standard error difference and significance of
CD1442a and CD40 between the cemented total knee arthroplasty
group (n=19) and uncemented total knee arthroplasty group
(n=19) 179
Table 4.9b: Mann-Whitney U test for CD1442a and CD40 absolute values between
the cemented total knee arthroplasty group (n=19) and uncemented
total knee arthroplasty group (n=19) 180
Table 5.1: Mean, standard deviations and standard error of means of white
cell count (WCC), neutrophils (Neutro), monocytes (Mono)
(all x109/L) and C-reactive protein (CRP) (mg/L) pre-operatively
(P1) and at day 1 (D1) and day 7 (D7) post-operatively in the
uncemented total knee arthroplasty group with local anaesthetic
infiltration (n=18) 186
Table 5.2: Paired sample t-test of WCC, Neutrophils, monocytes and CRP
in the uncemented total knee arthroplasty group with local
anaesthetic infiltration (n=18) 187
Table 5.3: Mean difference, standard error difference and significance of
blood parameters between cemented and uncemented group in
the uncemented total knee arthroplasty group with local
anaesthetic infiltration (n=18) 192

14
Table 5.4a: Mean, standard deviations and standard error of means of tissue
plasminogen activator (t-PA) (ng/ml), von Willebrand factor (vWF)
(IU/dl), soluble CD40 ligand (sCD40L) (pg/ml), interleukin 6 (IL6)
(pg/ml) and tumour necrosis factor (TNFα) (pg/ml) in the
uncemented total knee arthroplasty group with local anaesthetic
infiltration (n=18) 194
Table 5.4b: Median and Inter-quartile ranges (IQR) of e-selectin (ng/ml) in the
uncemented total knee arthroplasty group with local anaesthetic
infiltration (n=18) 195
Table 5.5a: Paired sample t-test of tissue plasminogen activator (t-PA), von
Willebrand factor (vWF), soluble CD40 ligand (sCD40L), interleukin
6 (IL6) and tumour necrosis factor (TNFα) in the uncemented total
knee arthroplasty group with local anaesthetic infiltration
(n=18) 196
Table 5.5b: Wilcoxon signed rank test for e-selectin (ng/ml) in the uncemented
total knee arthroplasty group with local anaesthetic infiltration
(n=18) 197
Table 5.6a: The mean, standard deviation and standard error means of CD1442a
and CD40, expressed as percentage values in the uncemened total
knee arthroplasty group with local anaesthetic infiltration
(n=18) 202
15
Table 5.6b: Median and Inter-quartile ranges (IQR) of CD1442a and CD40,
expressed as absolute values in the uncemened total knee
arthroplasty group with local anaesthetic infiltration (n=18) 203
Table 5.7a: Mean, standard deviation and p values of CD1442a and CD40
expressed as percentage values in the total knee arthroplasty
group with local anaesthetic infiltration (n=18) 204
Table 5.7b: Wilcoxon signed rank test for CD1442a and CD40 absolute values
in the total knee arthroplasty group with local anaesthetic
infiltration (n=18) 205
Table 5.8: Mean difference, standard error difference and significance of tissue
plasminogen activator (t-PA), von Willebrand factor (vWF), soluble
CD40 ligand (sCD40L0, interleukin 6 (IL6), tumour necrosis factor
alpha (TNFα) and e-selectin levels between the uncemented total
knee arthroplasty group with local anaesthetic infiltration (n=18)
and the uncemented total knee arthroplasty group on its own
(n=19) 208
Table 5.9a: Mean difference, standard error difference and significance of tissue
plasminogen activator (t-PA), von Willebrand factor (vWF), soluble
CD40 ligand (sCD40L0, interleukin 6 (IL6) and tumour necrosis factor
alpha (TNFα) levels between the uncemented total knee arthroplasty
group with local anaesthetic infiltration (n=18) and the uncemented
total knee arthroplasty group on its own (n=19) 211

16
Table 5.9b: Mann-Whitney U test for e-selectin (ng/ml) between the
uncemented total knee arthroplasty group with local anaesthetic
infiltration (n=18) and the uncemented total knee arthroplasty
group on its own (n=19) 212
Table 5.10a: Mean difference, standard error difference and significance of
CD1442a and CD40 percentage values between the uncemented
total knee arthroplasty group (n=19) and the uncemented total
knee arthroplasty group with local anaethetic infiltration
(n=18) 213
Table 5.10b: Mann-Whitney U test for CD1442a and CD40 absolute values between
the uncemented total knee arthroplasty group (n=19) and the
uncemented total knee arthroplasty group with local anaethetic
infiltration (n=18) 214
Table 6.1: Mean, standard deviation and standard error of means of white
cell count (WCC), neutrophils (Neutro), monocytes (Mono) (all x109/L)
and C-reactive protein (CRP) (mg/L) at pre-operative (P1), day 1
(D1) and day 7 (D7) post-operatively in the uncemented total knee
arthroplasty group with a post-operative surgical drain
(n=18) 220
Table 6.2: Paired sample t-tests of WCC, neutrophils, monocytes and CRP in
the uncemented total knee arthroplasty group with a post-operative
surgical drain (n=18) 221
17
Table 6.3a: Mean, standard deviations and standard error of means of tissue
plasminogen activator (t-PA) (ng/ml), von Willebrand factor (vWF)
(IU/dl), soluble CD40 ligand (sCD40L) (pg/ml), interleukin 6 (IL6)
(pg/ml) and tumour necrosis factor (TNFα) (pg/ml) in the
uncemented total knee arthroplasty group with a post-operative
surgical drain (n=18) 226
Table 6.3b: Median and Inter-quartile ranges (IQR) of e-selectin (ng/ml) in the
uncemented total knee arthroplasty group with a post-operative
surgical drain (n=18) 227
Table 6.4a: Paired sample t-test of tissue plasminogen activator (t-PA) (nG/ML),
von Willebrand factor (vWF) (IU/dl), soluble CD40 ligand (sCD40L)
(pg/ml), interleukin 6 (IL6) (pg/ml) and tumour necrosis factor (TNFα)
(pg/ml) in the uncemented total knee arthroplasty group with a post-
operative surgical drain (n=18) 228
Table 6.4b: Wilcoxon signed rank test for e-selectin (ng/ml) in the uncemented
total knee arthroplasty group (n=19) 229
Table 6.5a: The mean, standard deviation and standard error means of CD1442a
and CD40, expressed as percentage values in the uncemented total
knee arthroplasty group with surgical drain (n=18) 235
Table 6.5b: Median and Inter-quartile ranges (IQR) of CD1442a and CD40,
expressed as absolute values in the uncemented total knee
arthroplasty group with surgical drain (n=18) 236

18
Table 6.6a: Mean, standard deviation and p values of CD1442a and CD40
expressed as percentage values in the uncemented total knee
arthroplasty group with surgical drain (n=18) 237
Table 6.6b: Wilcoxon signed rank test for CD1442a andCD40 absolute values
in the uncemented total knee arthroplasty group with surgical
drain (n=18) 238
Table 6.7: Mean difference, standard error difference and significance of blood
parameters between uncemented total knee arthroplasty group with
surgical drain (n=18) and the uncemented total knee arthroplasty
group on its own (n=19). 241
Table 6.8a: Mean difference, standard error difference and significance of tissue
plasminogen activator (t-PA), von Willebrand factor (vWF), soluble
CD40 ligand (sCD40L0, interleukin 6 (IL-6) and tumour necrosis factor
alpha (TNFα) levels between the uncemented total knee arthroplasty
group with surgical drain (n=18) and the uncemented total knee
arthroplasty group on its own (n=19) 244
Table 6.8b: Mann-Whitney U test for e-selectin (ng/ml) between the
uncemented total knee arthroplasty group with surgical drain
(n=18) and the uncemented total knee arthroplasty group on
its own (n=19 245

19
Table 6.9a: Mean difference, standard error difference and significance of
CD1442a and CD40 between the uncemented total knee arthroplasty
group with surgical drain (n=18) and the uncemented total knee
arthroplasty group on its own (n=19). 246
Table 6.9b: Mann-Whitney U test for CD1442a and CD40 absolute values between
the uncemented total knee arthroplasty group with surgical drain
(n=18) and the uncemented total knee arthroplasty group on its own
(n=19). 247
Table 7.1a: Results of repeated measures ANOVA with p-values in all four total
knee arthroplasty groups except e-selectin, CD1442a and CD40 counts
(n=74) 252
Table 7.1b: Results of Freidman test on CD40, CD1442a and e-selectin (ng/ml)
count for all three time points in four total knee arthroplasty
groups (n=74) 253
Table 7.2a: Mean, standard deviation and standard error of mean of platelets,
white cell count (WCC), neutrophils, monocytes (all 109/L),
C-reactive protein (mg/L), tissue plasminogen activator (t-PA)
(ng/ml), von Willebrand factor (vWF) (IU/dl), soluble CD40L (pg/ml)
and interleukin 6 (IL6) (pg/ml) excluding CD1442 in all four total
knee arthroplasty groups (n=74) 255

20
Table 7.2b: Median and Inter-quartile ranges (IQR) of e-selectin (ng/ml)
and CD40 count in all four total knee arthroplasty groups
(n=74) 257
Table 7.3a: Mean difference, standard error difference and significance of platelets,
white cell count, neutrophils, monocytes, C-reactive protein, tissue
plasminogen activator (t-PA), von Willebrand Factor (vWF), soluble CD40
ligand and CD40 percentage values in all four total knee arthroplasty
groups (n=74) 258
Table 7.4b: Wilcoxon signed rank test for eselectin and CD40 absolute values in
all four total knee arthroplasty groups (n=74) 260
21
List of Figures
Figure 1.1: Cytokine cascade 51
Figure 1.2: Role of T-lymphocytes in atherogenesis 66
Figure 1.3: Steps in the recruitment of mononuclear phagocytes to the nascent
atherosclerotic plaque and some of the functions of these cells in
the mature atheroma 70
Figure 1.4: A – Electron micrograph showing pentameric disc-like structure
face-on and side-on (arrows). B – Ribbon diagram showing the lectin
fold and the 2 calcium atoms (spheres) in the ligand-binding site of
each protomer 78
Figure 1.5: 3D image of E-selectin 82
Figure 1.6: Arterial and venous thrombosis pathophysiological links 91
Figure 1.7: Hydrodynamics focusing producing a single stream of particles 93
Figure 1.8: Different types of optical filters 95
Figure 1.9: Electrostatic flow sorting 98
Figure 1.10: Stokes shift 99

22
Figure 1.11: Analysis of lysed whole blood using forward and side scatter 101
Figure 1.12: Lysed whole blood analysis using scatter and fluorescence (from
Introduction to Flow Cytometry by Rahman, AbD Serotec) 102
Figure 1.13: Single parameter histogram 104
Figure 1.14: Two-parameter (dual-colour fluorescence) histogram 106
Figure 3.1: Graph of changes in platelet levels (x109/L) over the three time
points (mean and standard deviation) in the uncemented total
knee arthroplasty group (n=19) 133
Figure 3.2: Graph of changes in white cell count levels (x109/L) over the three
time points (mean and standard deviation) in the uncemented total
knee arthroplasty group (n=19) 133
Figure 3.3: Graph of changes in neutrophil levels (x109/L) over the three time
points (mean and standard deviation) in the uncemented total knee
arthroplasty group (n=19) 134
Figure 3.4: Graph of changes in monocyte levels (x109/L) over the three time
points (mean and standard deviation) in the uncemented total
knee arthroplasty group (n=19) 134
Figure 3.5: Graph of changes in C-reactive protein levels (mg/L) over the three
time points (mean and standard deviation) in the uncemented total
knee arthroplasty group (n=19) 135
23
Figure 3.6: Graph of changes in tissue plasminogen activator levels (ng/ml)
over the three time points (mean and standard deviation)
in the uncemented total knee arthroplasty group (n=19) 141
Figure 3.7: Graph of changes in von Willebrand factor levels (IU/dL) over the
three time points (mean and standard deviation) in the uncemented
total knee arthroplasty group (n=19) 141
Figure 3.8: Graph of changes in soluble CD40 ligand levels (pg/ml) over the
three time points (mean and standard deviation) in the uncemented
total knee arthroplasty group (n=19) 142
Figure 3.9: Graph of changes in soluble interleukin 6 levels (pg/ml) over the
three time points (mean and standard deviation) in the uncemented
total knee arthroplasty group (n=19) 142
Figure 3.10: Graph of changes in tumour necrosis factor alpha levels (pg/ml)
over the three time points (mean and standard deviation)
in the uncemented total knee arthroplasty group (n=19) 143
Figure 3.11: Graph of changes in soluble e-selectin levels (ng/ml) over the three
time points (mean and standard deviation) in the uncemented total
knee arthroplasty group (n=19) 143
Figure 3.12: Graph of changes in CD40 counts over the three time points (mean
and standard deviation) in the uncemented total knee arthroplasty
group (n=19) 149
24
Figure 3.13: Graph of changes in CD1442a counts over the three time points
(mean and standard deviation) in the uncemented total knee
arthroplasty group (n=19) 149
Figure 4.1: Graph of changes in platelet count (x109/L) over the three time
points (mean and standard deviation) in the cemented total
knee arthroplasty group (n=19) against the uncemented total
knee arthroplasty group (n=19) 157
Figure 4.2: Graph of changes in white cell count (x109/L) over the three time
points (mean and standard deviation) in the cemented total
knee arthroplasty group (n=19) against the uncemented total
knee arthroplasty group (n=19) 157
Figure 4.3: Graph of changes in neutrophil count (x109/L) over the three time
points (mean and standard deviation) in the cemented total
knee arthroplasty group (n=19) against the uncemented total
knee arthroplasty group (n=19) 158
Figure 4.4: Graph of changes in monocyte count (x109/L) over the three time
points (mean and standard deviation) in the cemented total
knee arthroplasty group (n=19) against the uncemented total
knee arthroplasty group (n=19) 158
Figure 4.5: Graph of changes in C-reactive protein (mg/L) over the three time
points (mean and standard deviation) in the cemented total
knee arthroplasty group (n=19) against the uncemented total
knee arthroplasty group (n=19) 159

25
Figure 4.6: Graph of changes in tissue plasminogen activator levels (ng/ml)
over the three time points (mean and standard deviation)
in the cemented total knee arthroplasty group (n=19) against
the uncemented total knee arthroplasty group (n=19) 165
Figure 4.7: Graph of changes in von Willebrand Factor (vWF) (IU/dl) over the
three time points (mean and standard deviation) in the cemented
total knee arthroplasty group (n=19) against the uncemented total
knee arthroplasty group (n=19) 165
Figure 4.8: Graph of changes in soluble CD40 ligand levels (pg/ml) over the
three time points (mean and standard deviation) in the cemented
total knee arthroplasty group (n=19) against the uncemented total
knee arthroplasty group (n=19) 166
Figure 4.9: Graph of changes in interleukin 6 levels (pg/ml) over the three
time points (mean and standard deviation) in the cemented total
knee arthroplasty group (n=19) against the uncemented total
knee arthroplasty group (n=19) 166
Figure 4.10: Graph of changes in tumour necrosis factor alpha levels (pg/ml)
over the three time points (mean and standard deviation)
in the cemented total knee arthroplasty group (n=19) against
the uncemented total knee arthroplasty group (n=19) 167
26
Figure 4.11: Graph of changes in e-selectin levels (ng/ml) over the three time
points (mean and standard deviation) in the cemented total
knee arthroplasty group (n=19) against the uncemented total
knee arthroplasty group (n=19) 167
Figure 4.12: Graph of changes in CD1442a counts over the three time points
(mean and standard deviation) in the cemented total knee
arthroplasty group (n=19) against the uncemented total knee
arthroplasty group (n=19) 173
Figure 4.13: Graph of changes in CD40 counts over the three time points (mean
and standard deviation) in the cemented total knee arthroplasty
group (n=19) against the uncemented total knee arthroplasty
group (n=19) 173
Figure 5.1: Graph of changes in platelet count (x109/L) over the three time
points (mean and standard deviation) in the uncemented total
knee arthroplasty group with local anaesthetic infiltration (n=18)
against the uncemented total knee arthroplasty group on its own
(n=19) 189
Figure 5.2: Graph of changes in white cell count (x109/L) over the three time
points (mean and standard deviation) in the uncemented total
knee arthroplasty group with local anaesthetic infiltration (n=18)
against the uncemented total knee arthroplasty group on its own
(n=19) 189

27
Figure 5.3: Graph of changes in neutrophil count (x109/L) over the three time
points (mean and standard deviation) in the uncemented total knee
arthroplasty group with local anaesthetic infiltration (n=18) against
the uncemented total knee arthroplasty group on its own (n=19) 190
Figure 5.4: Graph of changes in monocyte count (x109/L) over the three time
points (mean and standard deviation) in the uncemented total
knee arthroplasty group with local anaesthetic infiltration (n=18)
against the uncemented total knee arthroplasty group on its own
(n=19) 190
Figure 5.5: Graph of changes in C-reactive protein count (mg/L) over the three
time points (mean and standard deviation) in the uncemented total
knee arthroplasty group with local anaesthetic infiltration (n=18)
against the uncemented total knee arthroplasty group on its own
(n=19) 191
Figure 5.6: Graph of changes in tissue plasminogen activator level (ng/ml)
over the three time points (mean and standard deviation) in the
uncemented total knee arthroplasty group with local anaesthetic
infiltration (n=18) against the uncemented total knee arthroplasty
group on its own (n=19) 198
Figure 5.7: Graph of changes in Von Willebrand Factor level (IU/dl) over the
three time points (mean and standard deviation) in the uncemented
total knee arthroplasty group with local anaesthetic infiltration
(n=18) against the uncemented total knee arthroplasty group on its
own (n=19) 198
28
Figure 5.8: Graph of changes in soluble CD40 ligand levels (pg/ml) over the
three time points (mean and standard deviation) in the uncemented
total knee arthroplasty group with local anaesthetic infiltration
(n=18) against the uncemented total knee arthroplasty group on its
own (n=19) 199
Figure 5.9: Graph of changes in interleukin 6 levels (pg/ml) over the three
time points (mean and standard deviation) in the uncemented total
knee arthroplasty group with local anaesthetic infiltration (n=18)
against the uncemented total knee arthroplasty group on its own
(n=19) 199
Figure 5.10: Graph of changes in e-selectin levels (ng/ml) over the three time
points (mean and standard deviation) in the uncemented total
knee arthroplasty group with local anaesthetic infiltration (n=18)
against the uncemented total knee arthroplasty group on its own
(n=19) 200
Figure 5.11: Graph of changes in CD1442a counts over the three time points
(mean and standard deviation) in the uncemented total knee
arthroplasty group with local anaesthetic infiltration (n=18)
against the uncemented total knee arthroplasty group on its own
(n=19) 206
Figure 5.12: Graph of changes in CD40 counts over the three time points (mean
and standard deviation) in the uncemented total knee arthroplasty
group with local anaesthetic infiltration (n=18) against the
uncemented total knee arthroplasty group on its own (n=19) 206

29
Figure 5.13: Graph of changes in platelet count (x109/L) over the three time
points (mean and standard deviation) in the uncemented total
knee arthroplasty group with local anaesthetic infiltration (n=18)
against the uncemented total knee arthroplasty group on its own
(n=19) 209
Figure 6.1: Graph of changes in platelet count (x109/L) over the three time
points (mean and standard deviation) in the uncemented total
knee arthroplasty group with a post-operative surgical drain (n=18)
against the uncemented total knee arthroplasty group on its own
(n=19) 222
Figure 6.2: Graph of changes in white cell count (x109/L) over the three time
points (mean and standard deviation) in the uncemented total
knee arthroplasty group with a post-operative surgical drain (n=18)
against the uncemented total knee arthroplasty group on its own
(n=19) 222
Figure 6.3: Graph of changes in neutrophils count (x109/L) over the three time
points (mean and standard deviation) in the uncemented total
knee arthroplasty group with a post-operative surgical drain (n=18)
against the uncemented total knee arthroplasty group on its own
(n=19) 223
30
Figure 6.4: Graph of changes in monocyte count (x109/L) over the three time
points (mean and standard deviation) in the uncemented total
knee arthroplasty group with a post-operative surgical drain (n=18)
against the uncemented total knee arthroplasty group on its own
(n=19) 223
Figure 6.5: Graph of changes in C-reactive protein (mg/l) level over the three
time points (mean and standard deviation) in the uncemented total
knee arthroplasty group with a post-operative surgical drain (n=18)
against the uncemented total knee arthroplasty group on its own
(n=19) 224
Figure 6.6: Graph of changes in tissue plasminogen activator level (ng/ml)
over the three time points (mean and standard deviation) in the
uncemented total knee arthroplasty group with a post-operative
surgical drain (n=18) against the uncemented total knee
arthroplasty group on its own (n=19) 231
Figure 6.7: Graph of changes in von Willebrand Factor level (IU/dl) over the
three time points (mean and standard deviation) in the uncemented
total knee arthroplasty group with a post-operative surgical drain
(n=18) against the uncemented total knee arthroplasty group on
its own (n=19) 231

31
Figure 6.8: Graph of changes in soluble CD40 ligand level (pg/ml) over the three
time points (mean and standard deviation) in the uncemented total
knee arthroplasty group with a post-operative surgical drain (n=18)
against the uncemented total knee arthroplasty group on its own
(n=19) 232
Figure 6.9: Graph of changes in interleukin 6 level (pg/ml) over the three time
points (mean and standard deviation) in the uncemented total knee
arthroplasty group with a post-operative surgical drain (n=18)
against the uncemented total knee arthroplasty group on its own
(n=19) 232
Figure 6.10: Graph of changes in e-selectin level (ng/ml) over the three time
points (mean and standard deviation) in the uncemented total knee
arthroplasty group with a post-operative surgical drain (n=18)
against the uncemented total knee arthroplasty group on its own
(n=19) 233
Figure 6.11: Graph of changes in CD1442a counts over the three time points
(mean and standard deviation) in the uncemented total knee
arthroplasty group with surgical drain (n=18) against the
uncemented total knee arthroplasty group on its own (n=19) 239
Figure 6.12: Graph of changes in CD40 counts over the three time points (mean
and standard deviation) in the uncemented total knee arthroplasty
group with surgical drain (n=18) against the uncemented total knee
arthroplasty group on its own (n=19) 239

32
Figure 6.13: Graph of changes in monocyte count (x109/L) over the three time
points (mean and standard deviation) in the uncemented total knee
arthroplasty group with surgical drain (n=18) against the
uncemented total knee arthroplasty group on its own (n=19) 242
Figure 7.1: Changes in platelets over the three time points in all four total
knee arthroplasty groups (n=74) 261
Figure 7.2: Changes in white cell count concentrations over the three time
points in all four total knee arthroplasty groups (n=74) 261
Figure 7.3: Changes in neutrophil concentrations over the three time points
in all four total knee arthroplasty groups (n=74) 262
Figure 7.4: Changes in monocyte concentrations over the three time points
in all four total knee arthroplasty groups (n=74) 262
Figure 7.5: Changes in CRP concentrations over the three time points in all
four total knee arthroplasty groups (n=74) 263
Figure 7.6: Changes in t-PA concentrations over the three time points in all
four total knee arthroplasty groups (n=74) 263
Figure 7.7: Changes in vWF concentrations over the three time points in all
four total knee arthroplasty groups (n=74) 264
33
Figure 7.8: Changes in sCD40L concentrations over the three time points in
all four total knee arthroplasty groups (n=74) 264
Figure 7.9: Changes in IL6 concentrations over the three time points in all
four total knee arthroplasty groups (n=74) 265
Figure 7.10: Changes in e-selectin concentrations over the three time points in
all four total knee arthroplasty groups (n=74) 265
Figure 7.11: Changes in CD40 levels over the three time points in all four total
knee arthroplasty groups (n=74) 266
Figure 7.12: Changes in CD40 percentage over the three time points in all
four total knee arthroplasty groups (n=74) 266
34
Acknowledgments
I would like to thank Anne Rumley for all her help, advice and her undertaking of the
analysis of my samples at the Western Infirmary / Glasgow Royal.
My thanks also to John Westwater and June Thomas at the haematology laboratory at
Monklands Hospital. Thank you also to Allyson Doig and Dr Soutar at Gartnavel Hospital
for their help and support in undertaking the flow cytometry analysis. And to the
Robertson Centre of Biostatistics for their advice and guidance.
Finally my eternal gratitude to Professor Lowe in agreeing to be my supervisor of my
thesis and for all his support, advice and guidance during the last four years.

35
Declarations of own work
Author’s Declaration
I declare that, except where explicit reference is made to the contribution of others,
that this dissertation is the result of my own work and has not been submitted for any
other degree at the University of Glasgow or any other institution.
Signature _________________________
Printed Name _________________________
36
Definitions / Abbreviations
ACCP/SCCM American College of Chest Physicians / Society of
Critical Care Medicine
ACTH adrenocorticotrophic hormone
ADH antidiuretic hormone
CRP C - reactive protein
CD154 CD40 ligand
DAG diacylglycerol
DMPT N,N-dimethyl-p-toluidine
EC endothelial cells
ECAT-DVT European Concerted Action on Thrombosis deep
vein thrombosis
EGF endothelial growth factor
ELAM endothelial leukocyte adhesion molecule
FACS fluorescence-activated cell sorting analysis
FN III fibronectin type III
FSC forward scatter channel
FSH follicle stimulating hormone
GM-CSF granulocyte/macrophage colony stimulating
factor
GPI glycosyl-phosphatidylinositol
GP-130 130 kDA signal transducing glycoprotein
IFN-γ interferon-γ
IGF insulin-like growth factor

37
IL-1 interleukin 1
IL-1α interleukin 1 alpha
IL-1β interleukin 1 beta
IL-2 interleukin 2
IL7 interleukin 7
IL-6 interleukin 6
IL-8 interleukin-8
IP3 inositol triphosphate
LBP lipopolysaccharide binding protein
LH luteinizing hormone
LITE Longitudinal Investigation of Thromboembolism
Etiology Study
LPS lipopolysaccharide
MCP-1 monocyte chemotactic protein-1
M-CSF macrophage colony-stimulating factor
MI myocardial infarction
MIP-1α macrophage inflammatory protein 1 alpha
NO nitric oxide
PAI plasminogen activator inhibitor
PAF platelet activating factor
PDGF platelet derived growth factor
PF-4 platelet factor 4
PGE2 prostaglandin E2
PMMA polymethylmethacrylate
PMNL polymorphonuclear leucocytes
38
PSGL-1 p-selectin glycoprotein ligand-1
rT3 reverse tri-iodothyronine
SAP serum amyloid P
sIL-6R soluble IL-6 receptor
SIRS systemic inflammatory response syndrome
sCD40L soluble CD40L
SSC side scatter channel
T4 thyroxine
T3 tri-iodothyronine
TF tissue factor
TBG thyroid-binding globulin
TFPI tissue factor pathway inhibitor
TGF-α transforming growth factor alpha
TGF-β transforming growth factor beta
TNF-α tumour necrosis factor alpha
TNF-β tumour necrosis factor beta
TNFR-1 tumour necrosis factor receptor one
TNFR-2 tumour necrosis factor receptor two
t-PA tissue plasminogen activator
TSH thyroid stimulating hormone
VCAM-1 vascular cell adhesion molecule-1
VTE venous thromboembolism
vWF von Willebrand factor
39
List of relevant presentations
‘The effect of cement in total knee arthroplasty on the markers of inflammation and of
endothelial function: The ‘PMMA effect’’
Cheng K, Rumley, Campbell A, Lowe G
GLAMOR meeting, Glasgow, April 2011
‘The effect of uncemented total knee arthroplasty on markers of inflammation and
endothelial function’.
Cheng K, Westwater J, Thomas J, Rumley A, Lowe G, Campbell A
BASK meeting, Oxford, March 2010

40
CHAPTER 1
INTRODUCTION
41
Introduction
Total knee arthroplasty is a common elective orthopaedic procedure performed in the
United Kingdom. The number performed has been steadily rising for the last few
decades with over 12 000 in 2007 (Scottish arthroplasty project). There is a multitude of
knee prostheses offered by the medical companies but the essential principles of total
knee arthroplasty remains the same.
The majority of procedures are performed with a tourniquet to minimise intra-operative
bleeding and to aid the surgeon. A standard midline incision is used with the medial
parapatellar approach to gain access to the knee joint itself and a degree of soft tissue
balancing is carried out before a sequence of jigs are used to make the bone cuts on the
tibia and femur. This then allows the knee prosthesis to be implanted with or without
polymethylmethacrylate (PMMA) cement, which acts not as the as the name suggests
but rather as a space filling device much akin to that of grout.
The surgery itself by its very nature causes a degree of soft tissue and bony trauma
which induces hormonal and metabolic changes. This forms part of a wider systemic
response to surgical trauma which includes endocrinological, immunological and
haematological events (Table 1.1).

42
Table 1.1: Systemic response to surgery
Sympathetic Nervous System Activation
Endocrine ‘stress response’
pituitary hormone secretion
insulin resistance
Immunological & Haematological Response
cytokine production
acute phase reaction
neutrophil leucocytosis
lymphocyte proliferation
43
This thesis assesses the effect of uncemented total knee arthroplasty on the activation
of the immune system and on markers of inflammation. I will also assess any additional
response evoked from the added use of polymethylmethacrylate (PMMA) bone cement.
My third study will look at the use of local anaesthetic infiltration intra-operatively in
uncemented total knee arthroplasty, comparing the effects that this has on the markers
of inflammation, endothelium and coagulation. My final study will look at the effect of
the use of drains post-operatively on these markers. The quantification of the
inflammatory response following elective orthopaedic surgery is important in the light
of emerging evidence supporting its association between both venous and arterial
thrombosis as well that of atherosclerosis.
In this introduction I will review the systemic response to surgery, then the immune and
endothelial response to surgery. I will then summarise the existing literature on these
responses to total knee arthroplasty, and the effects of bone cement, local anaesthetic
infiltration and the use of post-operative drains.
1.1 The Systemic Response to Surgery
The systemic response to surgery was first described by Cuthbertson in Glasgow Royal
Infirmary, in 1932 (1) who described in detail the time course of the metabolic
responses of lower limb injuries in four patients as well as quantifying the magnitude of
the response. It was here the terms ‘ebb’ and ‘flow’ were first used to portray the time
course of events which was one of an initial decrease in activity followed by an increase
44
in metabolic activity. The initial work on the ebb phase was partly carried out on
animals and the flow phase was exaggerated, this has since been redefined (2).
Following surgical trauma there is the characteristic stress response consisting of the
hypothalamic activation of the sympathetic nervous system as well as an increased
secretion of pituitary hormones as well as secretion from the pancreas and thyroid. The
overall effect of these hormonal changes is to mobilise the energy resources to provide
energy through catabolism and maintain the intravascular fluid volume through salt and
water retention. Stimulation of the autonomic sympathetic nervous system also causes
an increased secretion from the adrenal medulla of catecholamines and norepinephrine.
This produces the well known ‘fight or flight’ response with tachycardia and
hypertension.
1.1.1 Pituitary hormone secretion
In response to the appropriate stimuli the pituitary gland secretes specific hormones
either from its anterior or posterior part. The anterior pituitary stimulated by
hypothalamic releasing factors synthesises adrenocorticotrophic hormone (ACTH), also
known as corticotrophin. ACTH itself is not secreted but the larger precursor molecule
pro-opiomelanocortin is initially secreted instead. This is then metabolised into ACTH,
beta-endorphin (an opioid peptide of 31 amino acids, its circulatory level merely
reflects the increased secretion from the pituitary gland as itself has no major
metabolic activity ) and an N-terminal precursor. Adrenocorticotrophic hormone is a 39
amino acid peptide which stimulates adrenal cortical secretion of glucocorticoids.
Levels of both ACTH and cortisol rise within minutes of surgery.

45
The cortisol levels reach a maximum at around 4-6 hours later and may increase above
1500 nmol-1 from a baseline value of around 400 nmol-1 depending on the degree of
surgery or trauma (3). The usual feedback mechanisms whereby the cortisol
concentrations have a negative impact on the ACTH secretion are ineffective following
surgery. Therefore levels of both the cortisol and ACTH remain high during this period.
Cortisol has a variety of metabolic effects mainly by promoting the breakdown of
protein and gluconeogenesis in the liver. It also promotes lipolysis producing
gluconeogenic precursors from breaking down triglycerides to glycerol and fatty acids.
The glucose produced results in elevated blood levels, the use of glucose by cells is also
inhibited. As well as this, cortisol has anti-inflammatory activity. It inhibits macrophage
and neutrophil buildup in areas of inflammation and interferes with the synthesis of
inflammatory mediators namely prostaglandins.
Other hormones secreted are growth hormone and prolactin. Growth hormone, which
also goes by the name of somatotrophin, consists of 191 amino acids, it is released in
response to growth hormone releasing factor from the hypothalamus. The majority of
its actions are mediated through insulin-like growth factors (IGFs), mainly IGF-1, which
are small protein hormomes released from liver, muscle and other tissues. As well as
regulating growth it also has other effects. It produces a positive protein balance by
preventing protein breakdown at the same time as stimulating protein synthesis. As well
as this it causes lipolysis (triglycerides into fatty acids and glycerol) and has an anti-
insulin effect. Its secretion is related to the severity of the trauma or surgery. The
hormone prolactin has 199 amino acids with a chemical structure not too dissimilar from
that of the growth hormone. Although released in response to surgery or trauma, and in
exercise, it does not affect the metabolic activity.

46
The levels of the other hormones secreted from the anterior pituitary such as follicle
stimulating hormone (FSH) and luteinizing hormone (LH) are not significantly altered by
surgery.
Arginine vasopressin, a potent antidiuretic hormone (ADH) is released from the posterior
pituitary. ADH also acts along with corticotrophin-releasing factor and causes the
release of pro-opiomelanocortin.
1.1.2 Pancreatic hormone secretion
Insulin is a polypeptide of two chains of 21 and 30 amino acids, bound together by two
disulphide bridges. It is the main anabolic hormone (3). After food intake it is released
from the pancreas specifically from the beta cells. It promoted the uptake of glucose
into muscle to form glycogen and into fat cells for conversion into triglycerides. The
conversion of glucose to glycogen in the liver is also in response to insulin. As well as its
anabolic effects it inhibits catabolic events such as protein catabolism and lipolysis.
However there appears to be a failure of insulin secretion that one would expect to
accompany the catabolic, hyperglycaemic response seen intra-operatively. This may in
part be due to the α-adrenergic inhibition of β cell secretion. As well as this there is
also the lack of the ‘insulin resistance’ response in the perioperative period.
The pancreas is also responsible for the secretion of glucagon from α cells. Its main
effects are in the promotion of hepatic glycogenolysis and in increasing glucose

47
production in the liver from amino acids. It also promotes lipolysis. However after major
surgery despite a rise in the concentrations of glucagon it does not significantly add to
the increased glucose levels see in the stress reponse.
1.1.3 Thyroid hormone secretion
Thyroid stimulating hormone (TSH) results in the secretion of thyroxine (T4) and tri-
iodothyronine (T3) as well as small amounts of the inactive reverse T3 (r T3). T3 is
produced peripherally in the tissue where the T4 undergoes mondeiodination.
Metabolically T3 is in the order of three to five times more active than that of T4. A
siginifcant proportion of these hormones are protein bound, mainly to thyroid-binding
globulins (TBG) and thyroxine binding pre-albumins. It is the free unbound percentage
that is metabolically active but these low concentrations remain in balance with the
concentrations bound to protein in tissue and plasma (4).
The thyroid hormone activity affects both metabolism and heat production. It also
stimulates the central and peripheral nervous systems and causes an increased amunt of
carbohydrate absorption from the gastro-intestinal tract. The activity of the thyroid
hormones is closely linked to catecholamines in that it increases the affinity as well as
the number of the β-adrenoceptors in the cardiac muscle and thereby increasing its
response to the catecholamines. Following surgery the TSH levels decrease in the first
few hours post-operatively but soon return to their pre-operative levels. The cause of
which, is yet unknown.

48
The net effect of this following surgery is to provide energy from the breakdown of
resources such as from carbohydrate, protein and fat. Soon after surgery starts the
blood glucose concentrations increase from increased liver glycogenolysis and
gluconeogenesis in response to cortisol and catecholamine levels. The uptake of glucose
peripherally is reduced. The level in the blood is proportional to the degree of the
surgical insult closely following the rise in catecholamines. Due to the apparent lack of
glucose control during this period there is a period of hyperglycaemia due to the
increased production of glucose, the reduced levels of insulin and the insulin resistance
peripherally. The protein catabolism that occurs mainly involves skeletal muscle but
visceral muscle is also broken down to its amino acids. These may then be further used
to provide energy or alternatively be used to form acute-phase proteins in the liver.
With regard to fat the net result is that of increased mobilisation of triglycerides
however this does not appear to significantly affect the concentrations of fatty acids
and glycerol in the plasma.
The intravascular volume is maintained by the release of arginine vasopressin which
causes the retention of water. This increased secretion may continue for several days
following surgical trauma. The kidneys release rennin which in turn causes the release
of angiotensin II which stimulates the release from the adrenal cortex of aldosterone.
The aldosterone then stimulates the distal convoluted tubules of the kidney to absorb
both sodium and water (5).
The endocrine response to surgical trauma is first activated by impulses travelling along
sensory nerve roots to the spinal cord and medulla with activation of the hypothalamus.
It was hypothesised in the 1950s that certain ‘wound hormones’ may be present at the
site of the injury which may be in part be responsible for this response. In the now

49
classical studies by Egdahl (6) it was proved from measuring the adreno-coritcal
response in canine lower limb trauma in those with either an intact sciatic nerve, or one
that was transected, that there was no elevated levels adrenal hormone in those with a
transected sciatic nerve. However this general idea that the presence of these ‘local
substances’ may contribute to the wider stress response seem following surgical trauma
was again brought to the forefront with the evolving research into cytokines.
1.2 Cytokines
From 1950 to 1970 the early studies on cytokines described a number of protein factors
which were shown to mediate certain functions and were produced by different cell
types. They were termed lymphokines as evidence at that time pointed to the T
lymphocytes from the thymus as the cells involved in the secretion of these protein
factors. As cytokine research evolved many individual cytokines were identified. It came
to light that cytokines were synthesised mainly from leucocytes and it was shown that
the majority of its actions were directed to other leucocytes, it was at this time they
were renamed as interleukins. Often the same cytokine mediated a diverse array of
effects. The exact identification and distinction between the various cytokines was due
to impure preparations and non specific antibodies for the cytokines. But over the past
decade with the use of molecular cloning and the availability of more specific
antibodies, the properties and structure of these cytokines has been made possible.
In the presence of tissue trauma these low molecular weight proteins (<80 kDa) can be
released from leucocytes (particularly monocytes), endothelial cell as well as

50
fibroblasts. Following binding to a specific cell receptor they can alter the cellular RNA
and affect protein synthesis and it is through this process that they are able to change
and regulate cell growth as well as cell development and repair. They alter the cell
behaviour through signaling pathways which are predominately intracellular to affect
gene transcription (7). Unlike hormones which are secreted into the circulation and
affect target cells some distance away cytokines are released to act on either nearby
cells (paracrine) or on the same cell (autocrine). They have been termed pleiotropic as
they act on many different cell types and usually have more than one effect on the
same cell as well as influencing the synthesis and action of other cytokines. They also
have a significant role to play in inflammation and immunity and are very powerful at
very low concentrations (8). They are extremely potent and generally act at picomolar
concentrations. The effect that a specific cytokine will have on a cell will depend on a
number of variables such as the levels of the cytokine as well as other regulators which
may be present (5).
The majority of cytokines are synthesised and secreted when needed with exceptions
such as transforming growth factor-beta (TGF-β) stored in platelet alpha granules (9)
and tumour necrosis factor-α (TNF-α) in mast cells (10). Once synthesized cytokines
such as TNF-α and interleukin 1β (IL-1β) are stored as membrane proteins (11). They
may also bind to an extracellular matrix or a cell surface protein to form a complex
such as with interleukin-8 (IL-8) (12;13).
Cytokines have a local and systemic role in response to surgical trauma. The main
cytokines involved are interleukin-1 (IL-1), tumour necrosis factor α (TNF-α) and IL-6.
Following surgical trauma it is the IL-1 and TNF-α which is released first from the
macrophages and monocytes locally, followed by IL-6 and other cytokines are released

51
(figure 1). But it is the IL-6 that is mainly responsible for inducing the acute phase
response (5).
52
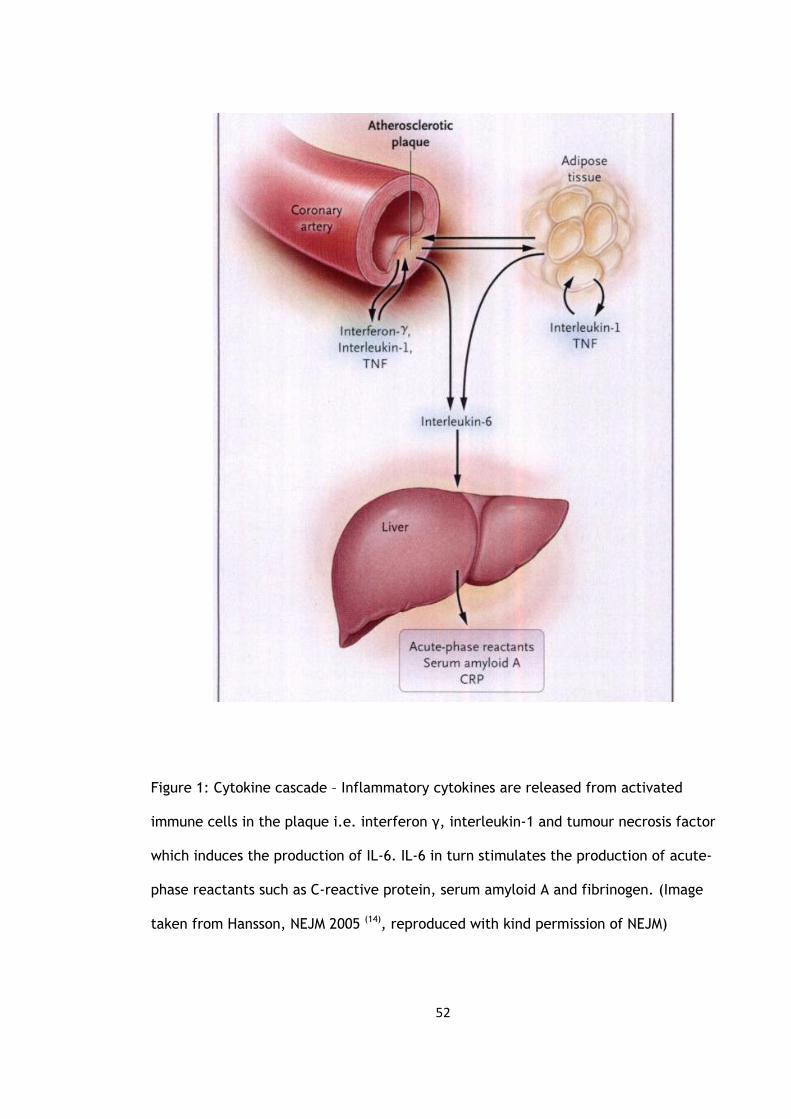
Figure 1: Cytokine cascade – Inflammatory cytokines are released from activated
immune cells in the plaque i.e. interferon γ, interleukin-1 and tumour necrosis factor
which induces the production of IL-6. IL-6 in turn stimulates the production of acute-
phase reactants such as C-reactive protein, serum amyloid A and fibrinogen. (Image
taken from Hansson, NEJM 2005 (14), reproduced with kind permission of NEJM)

53
1.2.1. Cytokine Receptors
The current knowledge on cytokine receptors is that they are transmembrane proteins.
The cytokine binds to the extracellular domain and the intracellular domain can have an
enzymatic activity, bind with other molecules or use a second messenger system. There
are also proteins that exist which are structurally similar to cytokine receptors which
are not membrane bound.There are seven families of cytokine receptors grouped either
according to the structure of the cytokineor intracellular receptor, or by the type of
signal messaging. But the majority of cytokines have different components of their
extracellular cytokine receptors which can belong to more than one of the family of
receptors.
- Group1
This group usually has more than one extracellular immunoglobulin domain. Although it
mainly involves the receptors for IL-1α and β there are also sequences for IL-6R, M-CSF
and PDGF. The IL-1α has a higher affinity for the type I receptor with the IL-1β binding
more to the type II receptor (15). There is also a soluble IL-1 present and there is
evidence suggesting that the type II receptor may play a role in binding with this soluble
form and in a way affect the IL-1 activity (16). To support this, there is an IL-1 binding
protein which matches the type II receptor binding site (17).
54
- Group 2
This group formerly known as the haematopoietic receptor family is the biggest group.
These bind to cytokines with a four α-helical strand structure such as IL-2 to IL-7, G-CSF
and GM-CSF.
- Group 3
These are the type I interferon receptors which binds to IFN-α and IFN-β and the type II
receptor binds to IFN-γ.
- Group 4
These are the nerve growth factor receptors which include the two TNF receptors for
TNF-α and β. Either receptor has equal affinity for both TNF-α and β (18) but they
appear to transmit different signals as the intracellular components differ.
Also present are two soluble TNF binding proteins which are present in the healthly
population not only in the serum but also in the urine. Although the concentrations
normally around 1-2 ng ml -1 have been shown to vary from individual to individual they
seem to be stable in individuals over time (19). Increased concentrations exist in various
conditions like endotoxinaemia (20), systemic lupus erythematous (21), and in
malignancies and infections (22;23).
55
1.2.2 Cytokine Signal Pathways
These pathways are inititated when the cytokine binds to its receptor. The most
common pathway involves protein phosphorylation. Some receptors will have intra-
cellular enzyme messenging through tyrosine kinase activity), whereas other will use G
(GTP-binding) proteins.
The initial cytokine signal can be further amplified by second messenger systems such as
by cyclic-AMP-phosphokinase A, regulated by phosphokinase C (24). Phospholipase
make up the other second messengers. Phospholipase C produces inositol triphosphate
(IP3) and diacylglycerol (DAG) which help regulate calcium within cells (25) and in
activating protein kinase C (26).
Following stimulation by the cytokines there can be a rapid or delayed response over
hours or days. Ultimately resulting in altering protein synthesis through gene
transcription.
Signal transduction and gene transcription is currently being further researched as it
presents the possibility of intervention and modulation.
56
1.2.3 Tumour necrosis factor
Tumour necrosis factor alpha (TNFα) is produced as a pro-hormone, this is then cleaved
to give a 157 amino acid (27). Interaction with a specific receptor results in its
biological response It is extremely potent requiring only 5% of its receptors to be
occupied in order to produce a biochemical response (28). Tumour necrosis factor
consists of two different polypeptides, TNF-α and TNF-β are different antigenically. It
has a key role along with IL-1 in the initiation of inflammation and the immune
response. But over production of TNF is potentially lethal to the host as seen in
cachexia (29), autoimmune disorders (30) and meningococcal septicaemia (31). The TNF
proteins are involved in a multitude of processes through its ability initiate many
different signal transduction paths as well coding for cytokines and acute phase proteins
(32).
As with the TNF there are also two TNF receptors, TNFR-I and TNFR-II. Either receptor
shows the samw affinity for binding on to either TNF-α or TNF-β. Also present in the
serum, are soluble TNF binding proteins acting as receptors which compete with the
bound receptors (33).
Tumour necrosis factor is chemotactic for polymorphonuclear leucocytes (PMNL) and
causes these cells to release oxygen-derived free radicals.

57
1.2.4 Interleukin-1
When activated either endothelial cells or macrophages can release interleukin-1 which
has a short half-life of around 6 minutes. Similar to TNF IL-1 can be present in two
forms, IL-1α and IL-1β. Both with an equal affinity for their receptors. IL-1α produces its
signal through cellular contact. In comparison IL-1β is present in the circulation and
produces similar physiological and metabolic effects to that of TNFα (15). Compared to
TNF it has more inflammatory and immunoenhancing effects. It can stimulate
myelopoesis directly or indirectly through myelopoetic growth factors such as GM-CSF.
It is an endogenous pyrogen and is involved in the anorexic process (34).
As with TNF the main stimulus for its release is lipopolysaccharide (LPS) endotoxin
antigen. Both TNF and IL-1 seem to enhance each other’s effects when present together
(34). Together they cause the release of prostaglandins and IL-6 from monocytes and
endothelial cells. It also causes the release of tissue factor from monocytes and
endothelium as well as down-regulating the expression of thrombomodulin and so the
inflammatory process shifts the haemostatic balance from anticoagulation to
coagulation (35). But unlike TNF it does not stimulates the degranulation of PMNLs to
release oxygen free radicals.
In general IL-1α and IL-1β binds to IL-1R type I and IL-1R type II respectively. Recent
evidence shows that all the effect of IL-1 is due to the transducing signal from IL-R type
I receptor. The function of IL-1R type remains unknown, but similar to TNF it may act to
antagonise and regulate the activity of IL-1 (16;36).
58
1.2.5 Interleukin-6
The acute phase response involves TNF, IL-1 and IL-6 is a mediator of the acute phase.
The chances of a subsequent MI following a previous episode increases with increasing
baseline IL-6 concentrations (37). Interleukin-6 works by binding to a receptor complex
which is made up of IL-6R (80 kDA protein) and gp-130 (130 kDA signal transducing
glycoprotein) (38). Interleukin-6 binds to the receptor IL-6R with only low affinity but
binds with high affinity in the presence of gp-130. Without IL-6R, IL-6 will not bind to
gp-130 unless soluble IL-6 receptor (sIL-6R) is present. This is in contrast to the situation
with TNF where the binding of TNF to soluble TNFR renders TNF inactive. The
significance and regulation of soluble IL-6R is currently poorly understood but what is
known is that increased serum concentration is seen in certain pathological conditions
such as multiple myeloma, HIV infection and adult T cell leukaemia. The soluble IL-6
will enhance the actions of IL-6 (39) possibly due to soluble IL-6 binding with IL-6 and gp
130 without the need for a cytoplasmic region (40). This in contrast to most other
receptors which require their own cytoplasmic regions for signals.
As well as its inflammatory role it also has a role to play in host defence, immune
response and haematopoiesis. Chronic activation is seen in rheumatoid arthritis.
Following surgical trauma IL-6 levels begin to rise and reach significant levels at around
2-4 hours. The cytokine production levels reflect the degree of surgical trauma and so
the largest responses are seen in joint replacement surgery, colorectal and major
vascular surgery (41). In terms of total knee arthroplasty bilateral simultaneous
replacements exhibit a significantly larger IL6 response (42). The levels will reach their

59
maximal point at around 24 hours, remaining elevated for up to 48 – 72 hours (43), so
therefore secretion is a brief and self-limiting event.
There may be some variability between individuals in their response to an inflammatory
stimulus, as the increases in IL-6 and CRP seen in those following coronary angioplasty
or uncomplicated cardiac catheterisation correlate linearly with baseline and CRP and
IL-6 levels (44). This variability in the degree of response may also have a genetic basis
(45). In terms of the response to surgical trauma there has been some correlation found
between the duration of surgery and the magnitude of the IL-6 response (41).
Current evidence now suggests that elevated IL-6 and CRP levels carry not only more
risk of subsequent development of atherosclerosis but also the risk of developing type II
diabetes, even in those with no current evidence of insulin resistance (46).
1.2.6 Interferon-γ
Interferon-γ (IFN-γ) is produced from human T helper lymphocytes as well as from
natural killer (NK) cells. It levels become detectable at around six hours and remain so
for eight days. Tissues which have undergone surgical trauma such as operative wounds
also result in IFN- γ production up to 5 to 7 day afterwards (47).

60
1.2.7 Macrophage / Granulocyte Colony Stimulating Factor
M/G CSF is involved in stimulating leucocytes in the inflammatory response and can also
be effective in the wound healing process. Patients undergoing oncologic procedures
who have been given macrophage colony stimulating factor (M-CSF) peri-operatively and
in those with major burns have shown increased neutrophil activity.
1.3 Acute Phase Response
Following surgical trauma there is an ‘acute phase response’ which results in the
release of certain cytokines. As part of this response the liver produces and releases
acute phase proteins (Table 3) which have a role in the mediation of the inflammatory
response and in tissue repair. The increased levels of C-reactive protein (CRP) follows
that of IL-6. C reactive protein allows for the phagocytosis of bacteria, alpha2
macroglobulin and anti-proteinases. There are many proteins involved. Some are useful
markers of the size of an inflammatory process.
Following surgical trauma the release of cytokines (proportional to the degree of
surgical trauma) may further increase the release of ACTH from the pituitary and so
further increase the cortisol levels. This does not occur as the initial release of cortisol
following surgical trauma is enough to depress the IL-6 levles (8).

61
As the response seen in the cytokines is in direct relation to the severity of the local
tissue trauma the type of anaesthetic will have no effect on this response. However, the
use of regional anaesthesia can reduce the response to surgery. As seen in pelvic and
lower limb surgery, an epidural block along with local anaesthetics will stop the
metabolic and endocrine response usually seen following surgery. It has been
demonstrated that a T4 to S5 blockade will prevent the increase in cortisol and
therefore the increase in glucose following hysterectomies (48).
62
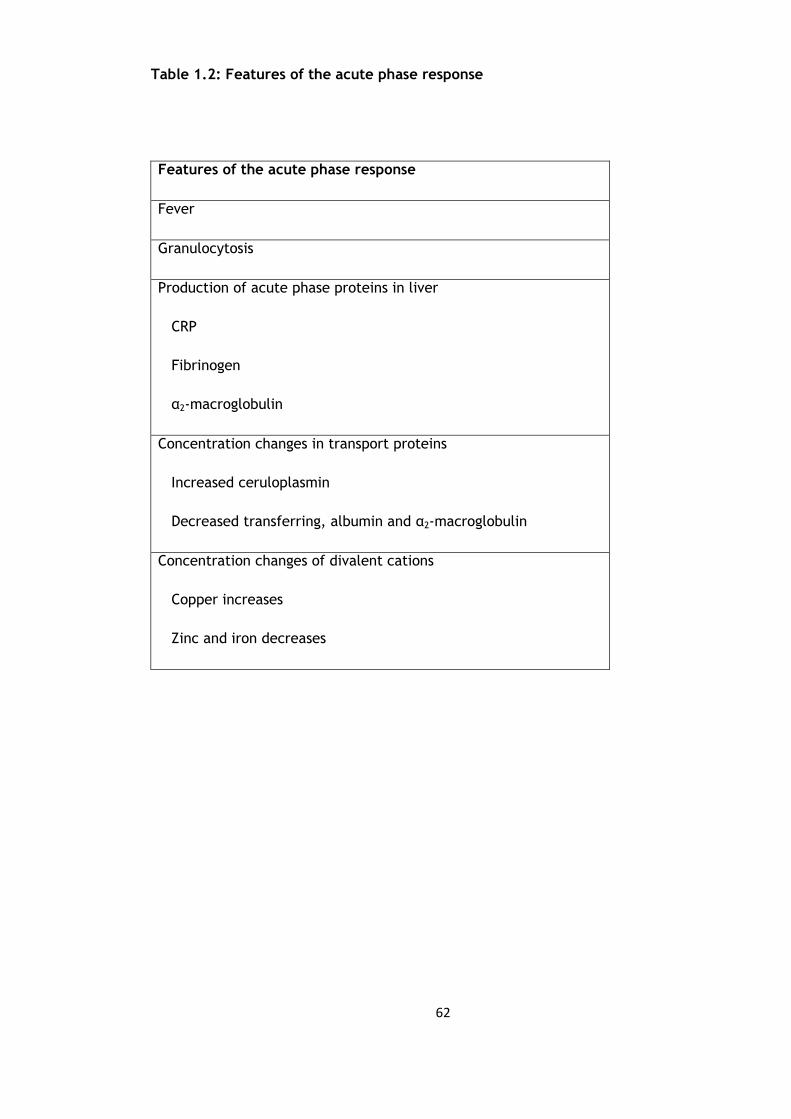
Table 1.2: Features of the acute phase response
Features of the acute phase response
Fever
Granulocytosis
Production of acute phase proteins in liver
CRP
Fibrinogen
α2-macroglobulin
Concentration changes in transport proteins
Increased ceruloplasmin
Decreased transferring, albumin and α2-macroglobulin
Concentration changes of divalent cations
Copper increases
Zinc and iron decreases

63
This is due to the blocking of the signals from the site of trauma to the central nervous
system as well as to the hypothalamus as well as the efferent signals to the liver and
adrenal medulla. Therefore abolishing the signals to the adrenocortex and the
glycaemic responses to surgery. But in the presence of a less extensive blockade this
will not occur. A recent animal study has shown that even the use of local lignocaine
can attenuate the local acute phase response (49)
In cases of severe polytrauma a more severe response may occur. This systemic
inflammatory response syndrome was defined by the American College of Chest
Physicians/Society of Critical Care Medicine (ACCP/SCCM) as the ‘Systemic Inflammatory
Response Syndrome’ (SIRS) in 1991 (50). For the diagnosis of SIRS to be made it was
agreed that at least two out of the four clinical markers must be present (Table 1.3).
In orthopaedic surgery the surgical stress response to an orthopaedic procedure has
been sub-divided into either a primary or a secondary stress response (51). The primary
stress response is that which is seen following any elective orthopaedic operation. On
the other hand if the patient has already undergone a traumatic event such as a hip
fracture following a fall then an emergency operation to deal with the hip fracture
would induce a secondary stress response.

64
Table 1.3: Clinical parameters in SIRS
Clinical Parameters Values
Heart rate >90 / min
Breathing rate >20 / min
Temperature >38oC or <36oC
Number of leucocytes >12,000 / mm3 or <4000 / mm3

65
This has been termed the ‘second hit phenomenon’ (52), the ‘first hit phenomenon’
(53;54) being the initial response induced from the hip fracture. The second hit
phenomenon has been demonstrated in a paper by Giannoudis et al which reported
significant increases in the IL-6 and elastase levels following intramedullary nailing of
femoral fractures (55). As mentioned previously the degree of surgical trauma is related
to the size of the stress response, but there has also been evidence to suggest that
there are potential gender differences in the response as reported by Ono et al. (56)
who reported higher levels of TNF-α and suppressive interferon production in men
following gastrointestinal surgery. It was concluded that men were at a higher risk of
developing SIRS and post-operative infectious complications. These gender variations in
stress response have also been supported by other authors (57;58).
The inflammatory mediators have an important role to play in the acute phase response
but research over the last few decades has shown a role that inflammation plays in the
initial formation and progression of atherosclerosis and in venous thromboembolism.
1.4 Circulating markers of Atherosclerosis, Thrombosis and Inflammation
In the 1970’s atherosclerosis was seen as a lipid storage disease with the lipid deposited
in the arteries which eventually builds up eventually causing a blockage of the artery
resulting in a myocardial infarction (MI) or a stroke. But recent research has shone some
light on the process and development of atherosclerosis. Inflammation appears to be
key here and the development of these plaques occur within and not on the arterial
walls as previously thought.

66
Atherosclerosis has been shown to develop slowly over decades starting as the ‘initial
fatty streak’ and slowly becoming the complex plaques causing potentially
cardiovascular events.
The innermost surfaces of arterial walls are lined by endothelial cells (EC), normally
these will resist the adhesion of leucocytes. But this all changes when the endothelial
cells express adhesion molecules in response to certain factors such as high saturated
fat diet, smoking, high blood pressure, hyperglycaemia and insulin resistnace or obesity.
The vascular cell adhesion molecule-1 (VCAM-1) is an example of an adhesion molecule
which allows the adhesion of both monocytes and T-lymphocytes, both of which are
present in the early developping plaque (Figure 1.2).

67
Figure 1.2: Role of T-lymphocytes in atherogenesis (from Libby, Inflammation in
atherosclerosis, Nature 2002 (70) , produced with kind permission from Nature)

68
Under normal conditions the central lipid core of these plaques are protected from the
bloo contact by a fibrous cap but when this cap fractures it causes the majority of the
acute coronary syndromes. This usually results in the formation of a thrombus which will
cause an increase in the size of the plaque. The biomechanical strength and resilience
of the cap is due to the interstitial collagen and what has been shown is that in those
plaques that have ruptured the collagen cap has been thinner than expected (59-61).
The smooth muscle cells of the arterial wall produce collagen in response to stimulatory
factors such as IL-1, platelet-derived growth factor and transforming growth factor-β .
But the T lymphocytes which are present in the plaque has been shown to produce
interferon-y which not only inhibits the basal collagen formation but also the inhibits
the stimulatory effect on the smooth muscle cells to produce collagen (62). As well as
this CD40 ligand and IL-1 is also released from the T-lymphocytes causing the release of
enzymes responsible for collagen degradation (63).
1.4.1 Vascular Cell Adhesion Molecule-1 and MCP-1
Mice studies have shown that there is a reduction of lesion formation in those with a
poorly functioning VCAM-1 compared with normal VCAM-1 expression (64). The
expression of VCAM-1 is in response to the presence of oxidized lipids mediated by
cytokines such as nuclear factor-kβ, interleukin-1β and tumour necrosis factor-α.
Laminar blood offers protection against the lesion formation due to the shear stresses
generated which causes the release of nitric oxide which reduces the expression of
VCAM-1 through the inhibition of nuclear factor-α and platelet clumping (65) (66).

69
Therfore areas which lack this laminar blood flow are susceptible to lesion formation.
This has been supported by studies which showed that endothelial cells which lack this
laminar blood flow have increased expression of nuclear factor-κβ (67).
Once adhered, the monocytes enter between the endothelial cells through diapedesis
(figure 1.3). The main chemotaxis for this comes from the monocyte chemotactic
protein-1 (MCP-1). Without the expression of MCP-1 there is up to 83% less lipid deposit
in the vasculature of mice and less leson development compared to MCP-1 producing
mice on the same high fat diet (68) (69). Once within intima, macrophages are formed
from matured monocytes. These macropages engulf the lipoproteins and become foam
cells and as there numbers increase they release further cytokines and growth factors
perpetuating the cycle. The macrophage colony-stimulating factor (M-CSF) is the main
mediator of this process confirmed by its over expression in experimental and human
atherosclerotic plaques (70). Although other cytokines and growth factors are involved
in the initiation of this atherosclerotic lesion it is the VCAM-1, MCP-1 and M-CSF that are
the key mediators (figure 1.3).
1.4.2 CD40 ligand (CD154)
CD40 ligand (CD154) is another proinflammatory cytokine which contributes to
atherogenesis, expressed by leucocytic as well as non-leucocytic cells such as platelets.
CD154 is stored pre-synthesised in platelets and released in vitro in seconds after
activation and in the formation of thrombus (71). CD154 interacts with CD40.
70
Interrupting the CD154 signalling pathway will slow the initiation of atherosclerosis (72).
Following this further research was carried out to see if interruption of this pathway
affected the atherosclerotic progression after the lesion had already been established.
It seems that in preventing CD154 signalling the formation as well as the evolution of
established plaques is prevented (73).
Also a recent study by Ray et al (74) pointed towards an association of CD40 ligand and
the thrombotic cascade but did go as far as to state there was a relationship indicating
possible further studies to investigate this.
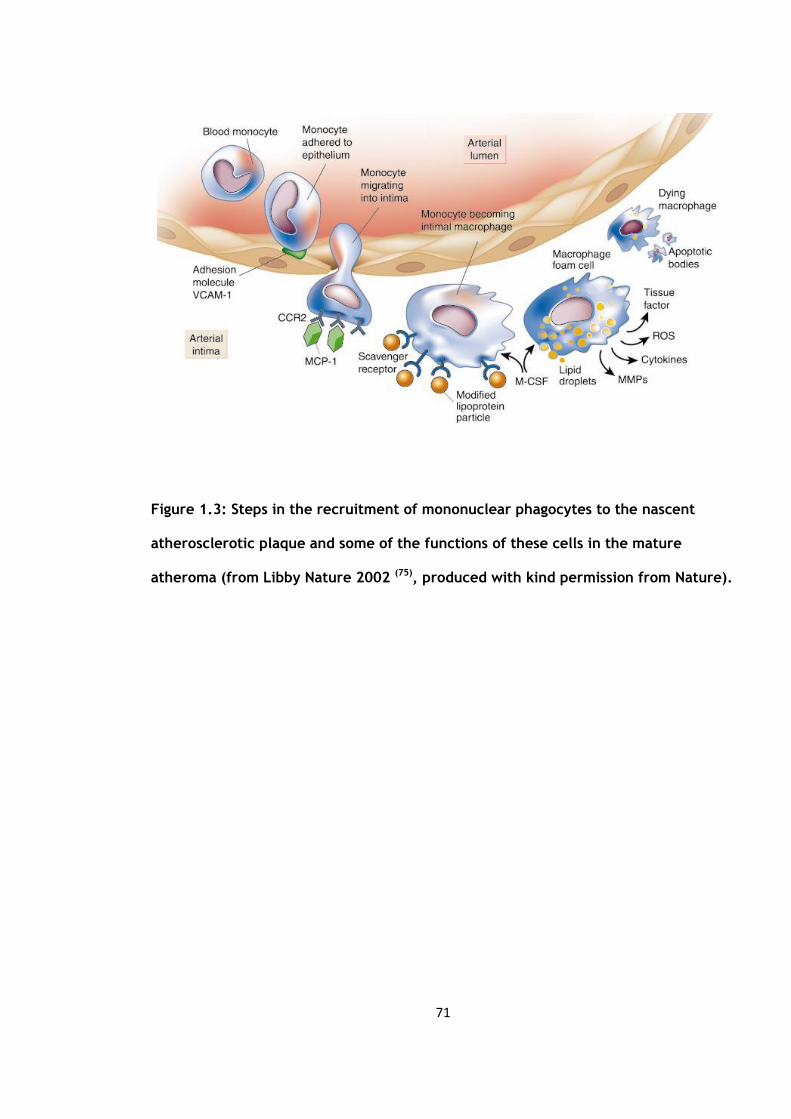
71
Figure 1.3: Steps in the recruitment of mononuclear phagocytes to the nascent
atherosclerotic plaque and some of the functions of these cells in the mature
atheroma (from Libby Nature 2002 (75), produced with kind permission from Nature).
72
1.4.3 Soluble CD40 Ligand
In contrast to the membrane bound CD40L, soluble CD40L (sCD40L) is released mainly
from platelets (76). The levels of sCD40L correlate with platelet activation and can
identify those at risk of having recurrent ischaemic event (77;78) in patients with known
ischaemic heart disease but is not a useful tool in low risk subjects. (79)
The current value of sCD40L as a marker is unknown and further research is needed to
evaluate whether sCD40L is of value in the prediction of future cardiac events in a
healthy population. It may be more useful as an indication of plaque stability and some
pilot studies have shown that sCD40L is more closely associated with plaque composition
than volume (80).
There is conflicting evidence as to whether soluble CD40 ligand correlates to CD40L with
some suggesting a positive correlation (81) and others a negative (82). Varo et al. (83)
highlighted variables that may significantly affect this correlation, these included the
time between collection and analysis, centrifugation and the storage temperatures. He
stated that this could be avoided through a standardised approach.
73
1.4.4 CD40
CD40 regulates a wide variety of biological functions, extending from cellular immunity
to inflammation, two processes intimately involved in atherogenesis. As such, the
endothelium in vessels within inflamed tissue show an increased CD40 expression (84).
CD40 signalling can promote the expression of proatherogenic mediators such as certain
MMPs, caspase-1, and procoagulant activity.
1.4.5 CD14
In the First Leukocyte Typing Conference held in 1982 a set of monoclonal antinbodies
were identified and collectively named unde the title of CD14. These bound only to
monocytes and macrophages and so could be used to highlight cells which were of
monocytes or macrophage lineage.
CD14 is a 55kDa membrane glycoprotein, consisting of 356 amino acids and a 19 amino
acid long N-terminal leader peptide. It is as a receptor for the endotoxin
lipopolysaccharide (LPS) (85) which is found in gram-negative bacteria with only small
amounts resulting in a rapid immune response. LPS in plasma is bound to LPS binding
protein (LBP) which mediates the binding of CD14 to LPS. This results in the production
of inflammatory cytokines such as TGFβ. CD14 also interacts with other bacteria and
fungi, demonstrating its role in innate immunity (86).

74
The synthesis and expression of CD14 in monocytes has several mediators such as IL-4
and IL-3 which will reduce the expression of CD14 at the transcriptional level in 24-
48hrs (87-89) whereas IFNα, IFNγ and TGFβ (90) increases CD14 expression.
Recent in vitro experiments suggests that CD14 has other biological functions such as its
monocyte-endothelial cell interactions (91). The more mature subpopulation of
monocytes, the CD14+/CD16+, have increased numbers in infectious diseases such as
sepsis, tuberculosis, the critically ill and in uraemic patients without infections (92-94).
It has also been suggested that they have a role in the induction of the inflammatory
process involved in atherosclerosis (95). Increased levels are also seen in patients with
with coronary artery disease (96). Schlitt et al demonstrated in their study that patients
with the highest percentages (upper quartile) of CD14+/CD16+ monocytes had an odds
ratio of 4.7 for coronary artery disease after confounding factors such as diabetes,
hypertension and lipid profile were considered. Highlighting it as an independent risk
factor for coronary artery disease.
1.4.6 CD42a
CD42a belongs to the mucin family and is a small membrane glycoprotein found on the
surface of platelets. It combines with CD42b, CD42c and CD42d to form the CD42
complex which acts as a receptor for von Willebrand factor and as a vWF-dependant
adhesion receptor and so mediates the adhesion of platelets at high shear rates to vWF
in the subendothelial matrices which are exposed when the endothelium is damaged. It
also amplifies the response of platelets to thrombin during platelet activation.

75
1.4.7 CD14/CD42a dyad (platelet-monocyte aggregate)
Current evidence suggests that patients who have undergone an acute coronary
syndrome have both increased interactions between platelets as well between platelets
and leucocytes, with the later forming in inflammatory states (97). Platelets adhere to
circulating leucocytes following activation and degranulation. The P-selectin on the
surface of the platelets binds to the P-selectin glycoprotein ligand-1 (PSGL-1) on
leucocytes (98). This in turn causes a further expression of CD11b/CD18 on leucocytes
enhancing the interaction with platelets (99). A recent study has supported the
importance of platelet-leucocyte interaction in vascular disease were human PSGL-1
reduced the degree of reperfusion myocardial damage and endothelial dysfunction in an
animal model (100).
There is growing evidence demonstrating the importance of platelet-leucocyte
aggregation in atherothrombosis and acute coronary syndromes. Sarma et al (101)
demonstrated that higher levels of platelet-monocyte were found those with an acute
coronary syndrome and that this was drastically reduced when the PSGL-1 and P-
selectin receptors were blocked. Therefore adding further evidence that platelet
monocyte binding occurred through PSGL-1 and P-selectin (101). This has been
supported by other studies (102). The exact role of platelet-monocyte aggregates in
acute coronary syndrome is unknown, whether they are a reflection of the inflammatory
and thrombotic process or a directly contribute to the ongoing atherothrombogenesis.

76
1.4.8 C-reactive protein
Out of the acute phase proteins C-reactive protein was the first one described and is
very sensitive in reflecting the ongoing inflammation and tissue damage (103). Plasma
CRP is released from liver hepatocytes in response to IL-6produced predominantly from
hepatocytes mainly under transcriptional control by IL-6. The CRP levels show no diurnal
variation and are unaffected by eating.
The median concentration of CRP in young healthy adults is 0.8 mg/l ranging from 3.0
mg/l (90th centile) to 10 mg/l (99th centile) (104). However, following an acute stimulus
the concentration levels may increase by 10,000 fold. Following stimulation CRP
synthesis and secretion starts rapidly with levels reaching greater than 5 mg/l by 6
hours and eventually peaking at 48 hours. It’s half-life (around 19 hours) remains
constant under all conditions and so its rate of synthesis will determine its circulating
concentration (105) and is a direct measure of the intensity of the pathological
stimulus. When the stimulus is removed the levels of CRP fall almost at the rate of
plasma CRP clearance.
C-reactive protein belongs to the pentraxin family of calcium-dependant ligand-binding
plasma proteins along with serum amyloid P component (SAP). The pentraxin family was
named as such due to it electron micrographic appearance from the Greek penta ragos
(five berries). It is made up of 5 identical nonglycosylated polypeptide subunits, each
subunit with 206 amino acids arranged in a cylic pentameric symmetry (figure 1.4)
(106).

77
C-reactive protein (CRP) has been shown to have a strong association with with the risk
cardiovascular disease in healthy people. Although the main source is from the liver,
complements proteins and arteries can produce CRP. The presence of C-reactive protein
on its own may stimulate the releas of IL-1β, IL-6 and TNF-α from monocytes (107) and
causes the expression of ICAM-1 and VCAM-1. Ridker et al in their study demonstrated a
lower risk of recurrent myocardial infarction (MI) and death from cardiovascular cause
in those on statin therapy with a lower CRP (less than 2mg/L) (108). High-sensitivity
assays have allowed studies to demonstrate a relationship between increased CRP levels
and risk of stroke and progression of peripheral arterial disease (109-112). A meta-
analysis of all published studies in 2000, totalling 1,953 coronary events demonstrated
that those with base values of CRP in the upper third had a relative risk of 2.0 for a
future coronary event (112).
However a more recent meta-analysis by Danesh et al in 2004 (113) gave a slightly
different result. This included 22 prospective studies with a total of 7068 patient with a
weighted mean follow-up 12 years. But they found that studies published before 2000
tended to have more extreme conclusion and made the decision to limit their analysis
to four studies with over 500 patients in each (a total of 4107 patients). This gave an
overall odds ratio of 1.49 (93% CI of 1.37- 1.62) compared to that of 1.58 (95% CI 1.48 –
1.68) when all 22 studies were included. The authors concluded that the levels of C-
reactive protein was only a moderate predictor of the future risk of coronary heart
disease in the presence of already well established risk factors.
The Lancet published its results of a meta-analysis from the Emerging Risk Factors
Collaboration in 2010 with over 160 000 individuals with no past medical history of
vascular disease (114). They concluded that the CRP concentration had a continuous

78
association with the risk of heart disease, stroke and vascular mortality because it was
similarly associated with non-vascular mortality but its relevance in pathogenesis was
unclear. They also noted that the association with ischaemic vascular disease depended
significantly on the conventional risk factors as well as other markers of inflammation.
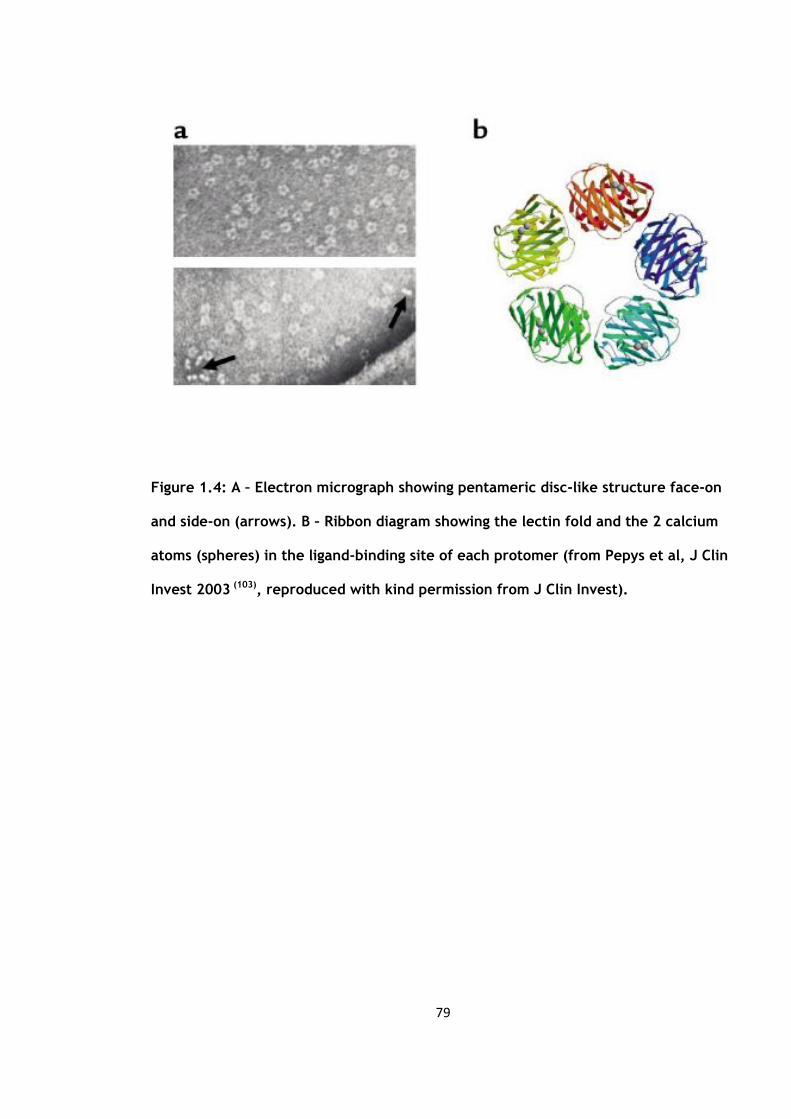
79
Figure 1.4: A – Electron micrograph showing pentameric disc-like structure face-on
and side-on (arrows). B – Ribbon diagram showing the lectin fold and the 2 calcium
atoms (spheres) in the ligand-binding site of each protomer (from Pepys et al, J Clin
Invest 2003 (103), reproduced with kind permission from J Clin Invest).

80
1.4.9 Tumour necrosis factor alpha
Tumour necrosis factor alpha (TNFα) is a trimeric protein it was first discovered as a
17kd secreted form but later a noncleaved 27kd precursor form was found in a
transmembrane form (115). The 27kd TNFα form is secreted from activated
macrophages but it can also be produced from other cell types it then binds to tumour
necrosis factor receptors 55 and 75 through cellular contact or bind following cleavage
to its soluble form. TNFα has to ability to transform from a hydrophobic to hydrophilic
form allowing it cross cell membranes as well as forming ion channels. It has been
speculated that this is due to its structural resemblance to that of viral coat proteins
(116).
Tumour necrosis factor alpha is a pleiotropic cytokine. It appears to influence the
majority of the organs in the body and has a wide spectrum of functions many of which
are not understood. It can both stimulate and inhibit growth as well as self regulatory
properties. An example of this is that TNFα can cause neutrophil proliferation as well as
apoptosis during inflammation and binding to the TNF-R55 receptor respectively (117).
It has beneficial functions such as its role in the necrosis of certain tumours as well as
the role it plays in the immune response to infection from either bacterium, viruses or
parasitic causes. Tumour necrosis factor has a key role to play in the inflammatory
response locally as well as being one of the acute phase proteins. Without TNFα, mice i
with gram negative bacteria undergo septicaemic shock (118).

81
1.4.10 E-selectin
This was originally known as the endothelial leukocyte adhesion molecule (ELAM)
because of its localisation to the endothelium and its role in binding leucocytes to the
endothelium. However when two other similar adhesive glyoproteins were identified,
(the homing receptor and granule membrane protein of molecular weight 140kD) they
were renamed under the nomenclature of selectins, with ELAM being renamed as E-
selectin (119), the homing receptor named L selectin and the granule membrane protein
of molecular weight 140kD was named the P selectin.
All three selectins are either expressed on the surface of platelets (P selectin), vascular
endothelial cells (E and P selectin) and leucocytes (L selectin) and function in binding to
ligands to promote intercellular adhesion. E-selectin is thought to be expressed only on
activated endothelial cells and its expression is induced by cytokines (120).
In addition to mediating leucocyte rolling it is also involved in the conversion from
rolling to adhesion. This has been shown by a reduction in adherent leucocytes in mice
that are E-selectin deficient (121) (122). Under baseline conditions, E-selectin is
expressed by the microvessls of the skin (123) and evidence suggests that it plays an
important role in skin inflammation through its role in the recruitment of T lymphocytes
specific to the skin (124). The three-dimensional structure of E-selectin (Figure 1.5) was
determined using x-ray crystallographic methods (125).

82
1.4.11 Tissue plasminogen activator
In normal healthy endothelium, thrombus formation is inhibited by several mechanisms.
There are the endothelium-derived inhibitors of coagulation such as thrombomodulin,
heparin sulphate, protein S, proteoglycans and tissue factor inhibitor, as well as
prostacyclin and nitric oxide (NO) which prevent the aggregration of platelets. But
following injury or inflammation there is a downregulation of these mechanisms and
endothelium becomes procoagulant with tissue factor expression and the realease of
fibronectin, vWF and platelet activating factor (126).

83
Figure 1.5: 3D image of E-selectin (reproduced with kind permission from the
University of Virginia Biomedical engineering website).

84
After thrombus formation has begun tissue plasminogen activator (t-PA) is released
mainly in response to factor Xa and to thrombin (127). T-PA causes the breakdown of
the thrombus to soluble fibrin byproducts through converting plasminogen to plasmin
which is accelerated by the presence of fibrin at the endothelial cell surface, (128;129)
producing localised activation. It is the t-PA release which determines the onset and
efficacy of fibrinolysis as plasminogen is present in vast quantities compared to t-PA.
In human plasma the concentration of t-PA is around 3 to 10 ng/ml. But serine protease
inhibitors (serpins); mainly plasminogen activator inhibitor (PAI) type 1(PAI-1) as well as
PAI-2, PAI-3, ensure that only a small amount is activeproportion is functionally active
(130). The half-life of t-PA is around 5 minutes and is cleared by the liver (131). The
percentage of active t-PA varies from 2% to 33% (132).
Tissue plasminogen activator is a 68 kDa serine protease consisting of 530 amino acids.
Endothelial cells in culture synthesise and secrete t-PA (133). The presence of histamine
and thrombin will stimulate its synthesis (134) whereas plasmin will inhibit it (135).
Protein kinase C may have a role (136) but the exact mechanism is still unclear.
It is believed by some authors that t-PA and vWF is stored together in Weibel-Palade
bodies (137), but strong evidence suggests that t-PA is not stored in the Weibel-Palade
bodies (138;139), supported by the observation that the stimulation of the release of t-
PA does not cause a simultaneous release of vWF (140;141). The exact signalling
mechanism is unclear but G proteins and elevated intra-cellular calcium concentrations
seem to have a role (139;142).
85
The release of t-PA also varies with the anatomic region,with more being released from
the upper limbs than the lower limbs (143). The endothelium has a substantial capacity
to store and release t-PA and continuous release is possible for several hours without
significant tachyphylaxis (144;145).
The main cause of death in acute coronary syndromes is due to the thrombosis that
occurs following the rupture of an atheromatous plaque (146). Although comoonly
present they are not usually of clinical significance (147). But if there is a disturbance in
the equilibrium of the fibrinolytic system then the thrombus formation may continue
leading to arterial occlusion (126). A reduction in the release or activity of t-PA in those
with stable or unstable angina, has been linked to an increased risk of cardiac events
(148) (149).
In 2004, Lowe et al conducted a meta-analysis of twelve relevant prospective studies on
t-Pa including their own study cohort, totalling 2119 cases of either a fatal or a non-
fatal myocardial infarction and 8832 controls (150). Their combined analysis of the
seven studies on the general population (1669 coronary heart disease cases and 5635
controls) yielded an odds ratio 2.18 (1.77-2.69) in those in the top third against those in
the bottom third baseline t-Pa values. But this dropped to 1.47 (1.19-1.81) when
adjusted for age, sex and vascular risk factors. A similar process carried out on the
remaining six studies (based on previous vascular disease), with 450 coronary heart
disease cases and 3197 controls revealed an adjusted odds ratio of 1.32 (0.70-2.50).
However the authors state that despite the association shown further research was
needed to evaluate how independent this was from established risk factors.
86
1.4.12 Von Willebrand factor
Von Willebrand factor (vWF) is present in the plasma, platelets and endothelium and is
synthesized from endiothelial cells as well as from megakaryocytes. vWF is assembled as
high molecular weight multimers which are then cleaved by ADAMTS13, a
metalloproteinase at specific sites in the vWF molecule to smaller units. It initiates both
platelets adhesion and aggregation and so has an important role to play in the formation
of thrombus (151). Following damage to the vascular endothelium vWF binds to the
subendothelium exposed through injury, mainly collagen types I and III, triggering
platelets adhesion to the vessel wall (151).
In a meta-analysis by Whincup et al which included their own study (152) they reviewed
a total of six studies on von Willebrand factor. This gave a total of 1524 coronary heart
disease cases and 19,830 controls giving a combined odds ratio of 1.5 (95% CI 1.1-2.0).
They concluded that an association existed between vWF levels and the risk of coronary
heart disease in the future but further research was needed to assess whether this was
causal or not.
1.5 The acute phase response, venous thromboembolism and arterial thrombosis
From its first inception venous thromboembolism (VTE) was based upon Virchow’s triad
of stasis, changes in the vessel wall as well as thrombogenic changes. But since the

87
1970’s, there has been increasing evidence to suggest a link between VTE and
inflammation.
Under normal conditions the endothelium resists platelet adhesion, coagulation as well
as inflammation and leucocyte activation. It manages this through:
- the thrombomodulin production from the endothelium and protein C activation, which
prevents excessive thrombin formation.
- the expression of heparin and dermatan sulphate stimulating anti thrombin and
heparin cofactor activity, again preventing excess thrombin formation.
- tissue factor pathway inhibitor expression (TFPI) also prevents excess thrombin
formation.
- tissue plasminogen activator (tPA) and urokinase-type plasminogen activator
production locally, which stimulates fibrinolysis.
- secretion of nitrous oxide, prostacyclin and interleukin 10 which inhibit the adhesion
of leukocytes and platelets as well as producing vasodilatation (153).
This is in contrast to when there is an endothelial disturbance, either physical from
vascular trauma or functional as in sepsis. Here the endothelium supports a
prothrombotic and proinflammatory state of vasoconstriction (153). This results in
vessel vasoconstriction from the release of platelet activating factor (PAF) and
endothelium-1 (154). Von Willebrand factor (vWF), tissue factor (TF), plasminogen
activator inhibitor 1 (PAI-1) and coagulation factor V is also released promoting
thrombosis (153). The endothelial cells are also stimulated to express P-selectin and E-
selectin.

88
There is emerging evidence from epidemiological studies linking VTE, arterial
thromboembolism and atherosclerosis. The largest one of these to date by Sorensen et
al (2007) (155) demonstrated that patients with a deep vein thrombosis also had an
increased risk of suffering a MI (1.6) and stroke (2.6) compared to that of the control
group population. Those with a pulmonary embolism had a higher (2.6) risk of MI and for
stroke (2.93). The activation of inflammation and haemostasis also has a role to play in
atherosclerosis progression, plaque rupture and arterial thrombosis (156-158).
Following lower limb arthroplasty in orthopaedics, myocardial infarction is the most
common cause of death post-operatively (159), Parvizi et al examined the records of
over 30 000 patients who had undergone a total hip arthroplasty at their institution over
a 30 year time period looking specifically at those patients who had died within 30 days
of their index operation. Of the 90 who had died 21 (23%) of these were due to a
myocardial infarction, 14 (15%) due to a fatal pulmonary embolism and only 1 (0.01%)
patient died from a stroke. The highest incidence of deep vein thrombosis has been
shown to occur in those following elective total hip arthroplasty (160;161). But in
Mantilla’s paper (162) the results are subdivided into the incidence of myocardial
infarction, pulmonary emboli and deep vein thrombosis following total hip and knee
replacement and also bilateral knee replacement. His results show that the incidence of
myocardial infarction is comparable between the total hip replacement and knee
replacement group (05% and 0.3% respectively) but is highest in the bilateral knee group
(0.9%). Winemaker et al also confirmed that simultaneous bilateral total knee
replacements carried significantly higher risks post-operatively (42). A similar picture is
seen in the incidence of deep vein thrombosis (hip 1.3%, knee 1.5%, bilateral knee 2.2%)
and the pulmonary emboli rates (hip 0.6%, knee 0.5%, bilateral knee 1.6%).

89
Liel et al demonstrated from the Norwegian hip registry with over 67000 total hip
arthroplasties that the 60 day post-operative mortality was 0.79%, with vascular
diseases being the main cause of death in the early post-operative period (163). Several
years later Lie et al performed a similar study but looked at the risks of mortality after
both total hip and knee arthroplasty (164) but this time he combined the numbers from
the National Joint Replacement Registry of the Australian Orthopaedic Association as
well as the Norwegian Arthroplasty Register. The study included 81 856 patients with a
total knee replacement and 106 254 patients with a total hip replacement. He
demonstrated that in the first 26 days the mortality was increased at 0.187% (95% CI,
0.168% to 0.206%), and that mortality was significantly higher in men and for those
between their age group band of 71 to 81. They showed no significant difference in
mortality between hip and knee arthroplasties.
The Mayo Clinic (162;165) published their own results after looking at their own
database of over 10 000 patients over a 10 year period. Their numbers included 5 233
total hip replacements, 3 601 total knee replacements and 1 410 patients who
underwent simultaneous bilateral knee replacements. From this, 224 patients were
identified as having an adverse event within 30 days their surgery, which accounted for
2.2%. Of this 0.4% had had a myocardial infarction, 0.7% a pulmonary embolism, 1.5% a
deep venous thrombosis and 0.5% died. They also concurred with the Lie et al paper
(164) showing that myocardial infarction was more significant in the older age group
and in males.
The possible link between venous thrombo-embolism and atherosclerosis was first
highlighted in 2003 (158). Schulman and his associates followed up a large cohort of
patients for up to 10 years following an acute VTE and found that a significant
90
proportion had died from either a myocardial infarction or stroke, compared to that of
the general population (166). Hong et al (167) investigated the possible link between
venous thrombo-embolism and coronary atherosclerotic disease. This was done by
measuring the degree of calcification within the coronary arteries on computerised
tomography angiographic images. They demonstrated that the degree of calcium was
associated with VTE with and odds ratio of 4.3 (95% CI, 1.9-10.1). On a cohort of 23,796
autopsies performed in an urban Swedish population, Eliasson et al (168) demonstrated
an increased incidence of venous thrombo-embolism in patients with arterial thrombosis
(odds ratio of 1.4 adjusted for age and sex; 95% CI 1.3-1.5). Therefore the evidence
presented suggests a possible link between VTE and atherosclerosis but the exact nature
of this association is not clear.
Atherosclerosis can potentially promote the progression of thrombotic disorders (figure
1.6). The atherosclerotic process involves platelet activation and blood coagulation.
There is also an increased turnover of fibrin which could lead to thrombotic
complications. They may share similar mechanisms and or risk factors (figure 1.6).
There are several medical conditions which can give rise to both arterial and venous
thromboembolic disorders such as side effects of chemotherapy (169) and infection
from Chlamydia pneumoniae (170) and HIV infection (171).
Studies have shown an elevation of circulatory markers of activation of inflammation,
endothelium and coagulation in those who have or who are at risk of developing
coronary artery disease or stroke. Fibrinogen, vWF antigen, t-PA, D-dimer and factor VII
are all elevated in those who develop ischaemic coronary artery disease (172-177).

91
Lowe in 2006 (178) published a comprehensive review article looking at the above
associations and stated that these associations should not imply causation and further
work was needed to ascertain whether these associations were in his words ‘cause,
consequence or coincidence’. From prospective case-control studies such as the
European Concerted Action on Thrombosis deep vein thrombosis (ECAT-DVT) (179)
showed no association with fibrinogen or factor VII, whereas the Longitudinal
Investigation of Thromboembolism Etiology Study (LITE) (180) of clinical VTE showed
associations with factor VII (above 95th centile), vWF but not fibrinogen. It is possible
that the associations with fibrinogen and vWF are due to the consequences of previous
thrombosis but this does not explain the associations with fibrinogen. On the other hand
D-dimer has been linked with the risk of VTE both in case-control (181;182) and
prospective studies (179;183). Whereas t-PA has no association with VTE either in case-
control (184) or prospective studies (179;185).
Currently the exact role of fibrinogen in arterial thrombosis is uncertain. Although the
meta-analysis (Fibrinogen Studies Collaboration 2005) (175) showed an association with
coronary heart disease and stroke this was reduced once adjustment was made for
potential confounding factors such as obesity and alcohol. This association would more
than likely be further reduced if adjusted for socio-economic status as has been shown
in other studies (186). The role of factor VII is not certain as studies have produced
inconsistent results (172;187-191).
D-dimer levels have an association with coronary heart disease shown both by meta-
analysis (192) and from epidemiology studies (189;191). Whereas t-PA has only a
moderate association with coronary heart disease risk from meta-analysis (182).
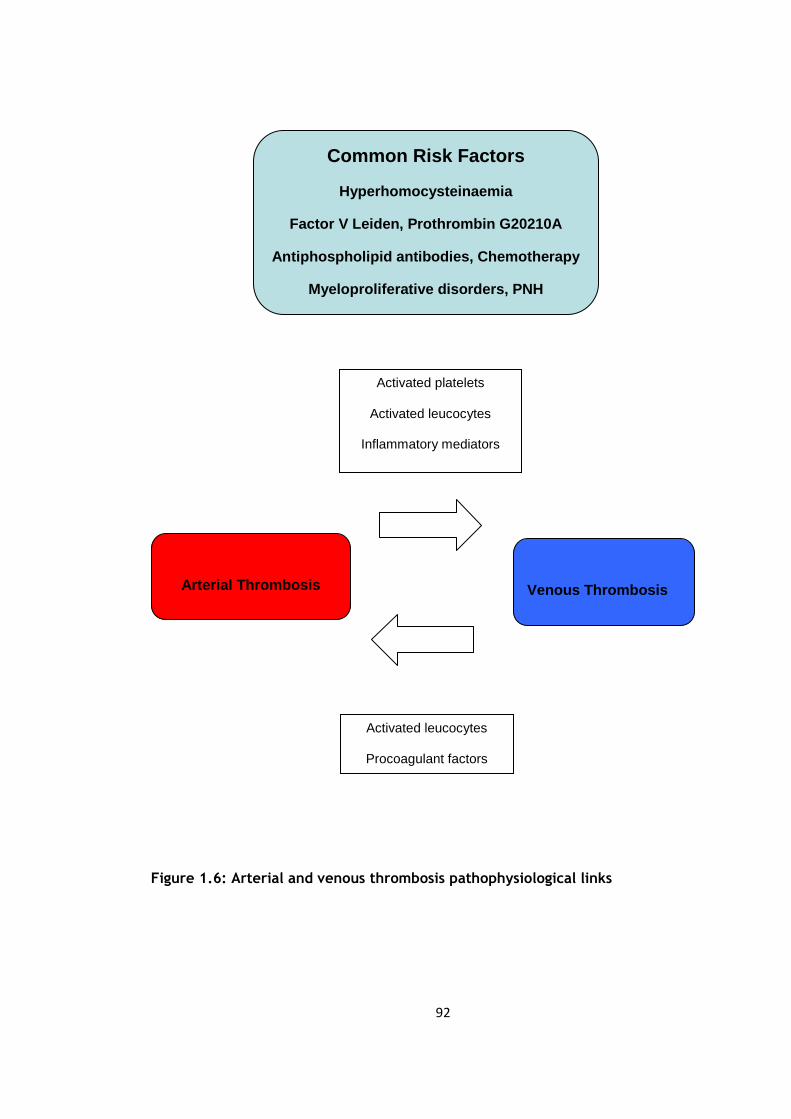
92
Figure 1.6: Arterial and venous thrombosis pathophysiological links
Common Risk Factors
Hyperhomocysteinaemia
Factor V Leiden, Prothrombin G20210A
Antiphospholipid antibodies, Chemotherapy
Myeloproliferative disorders, PNH
Chlamydia and HIV infection
Arterial Thrombosis
Venous Thrombosis
Activated platelets
Activated leucocytes
Inflammatory mediators
Activated leucocytes
Procoagulant factors
Inflammatory mediators

93
1.6 Activation of blood cells studied by flow cytometry
- Fluidics system
In addition to the measurement of circulating levels of activation markers, systemic
activation of blood platelets and leucocytes can be measured by flow cytometry.
Flow cytometry allows the particular properties of individual particles to be measured.
When the sample is first injected into the flow cytometer the particles for analysis are
randomly dispersed three-dimensionally. Then through a process known as
hydrodynamic focusing these particles are ordered into a single file. This is done by the
drag effect caused by the faster flowing fluid that is present in an outer sheath which
surrounds the central core into which the sample is injected. Theoretically under ideal
conditions the central core fluid will not mix with the outer sheath fluid (figure 1.7).
This then allows single particles to be analysed one at a time.
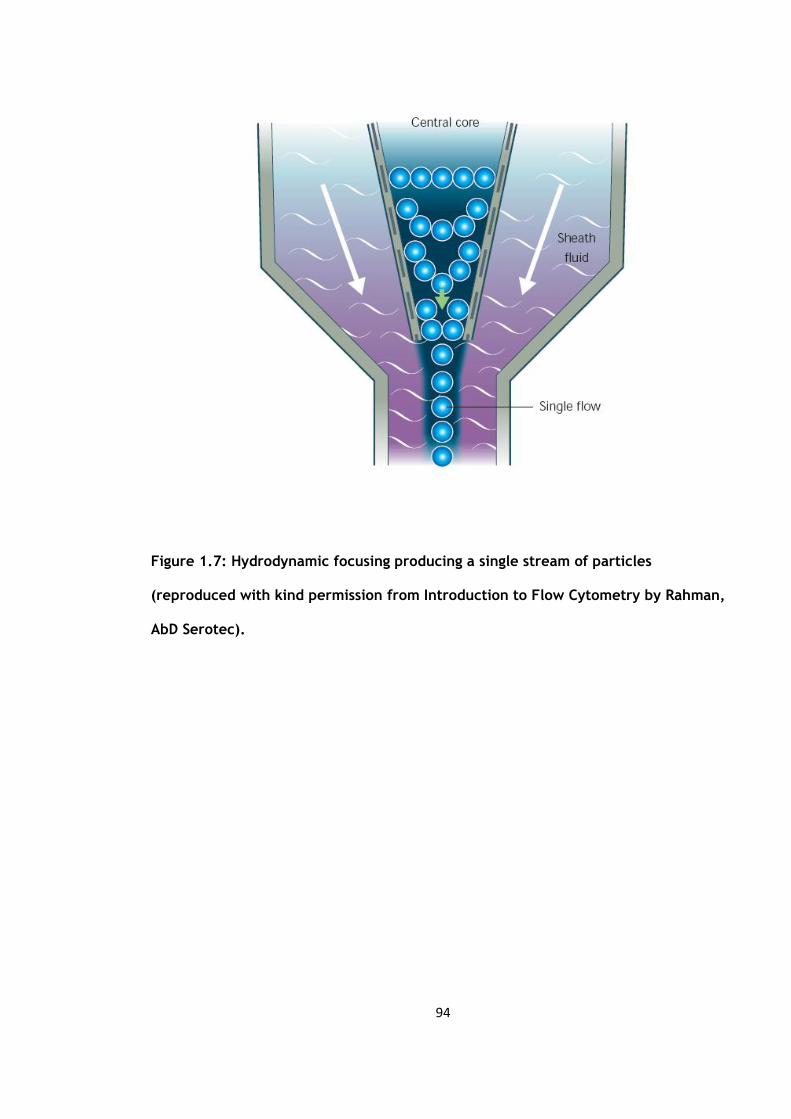
94
Figure 1.7: Hydrodynamic focusing producing a single stream of particles
(reproduced with kind permission from Introduction to Flow Cytometry by Rahman,
AbD Serotec).

95
- Optics and detection
This single stream of particles then is passed through one or more beams of light
emitted from a laser or arc lamp. The light scattering as well as the fluorescence
emission (if labelled with a fluorochrome) gives specific information about the
properties of the particles studied. The light can be scattered in one of two ways,
either in a forward or at a 90o angle direction. This is then picked up by one of two lens
known as the forward scatter channel (FSC) and the side scatter channel (SSC)
respectively. The FSC processes information on the size of the particle but can also
distinguish between debris and living cells and the SSC give information regarding the
granular content. This information allows for differentiation between cells types.
If labelled with a fluorochrome then fluorescence measurements can be taken at
different wavelengths. This can give specific information on surface receptors, DNA and
cytokines. Three main filter are used to allow the detection of specific wavelenghts:
(Figure 1.8)
- ‘long pass’ filters allow light above a cut-off wavelength through
- ‘short pass’ ones allow light below a cut-off wavelength through
- ‘band pass’ only allows light within a specified narrow range of wavelength
through
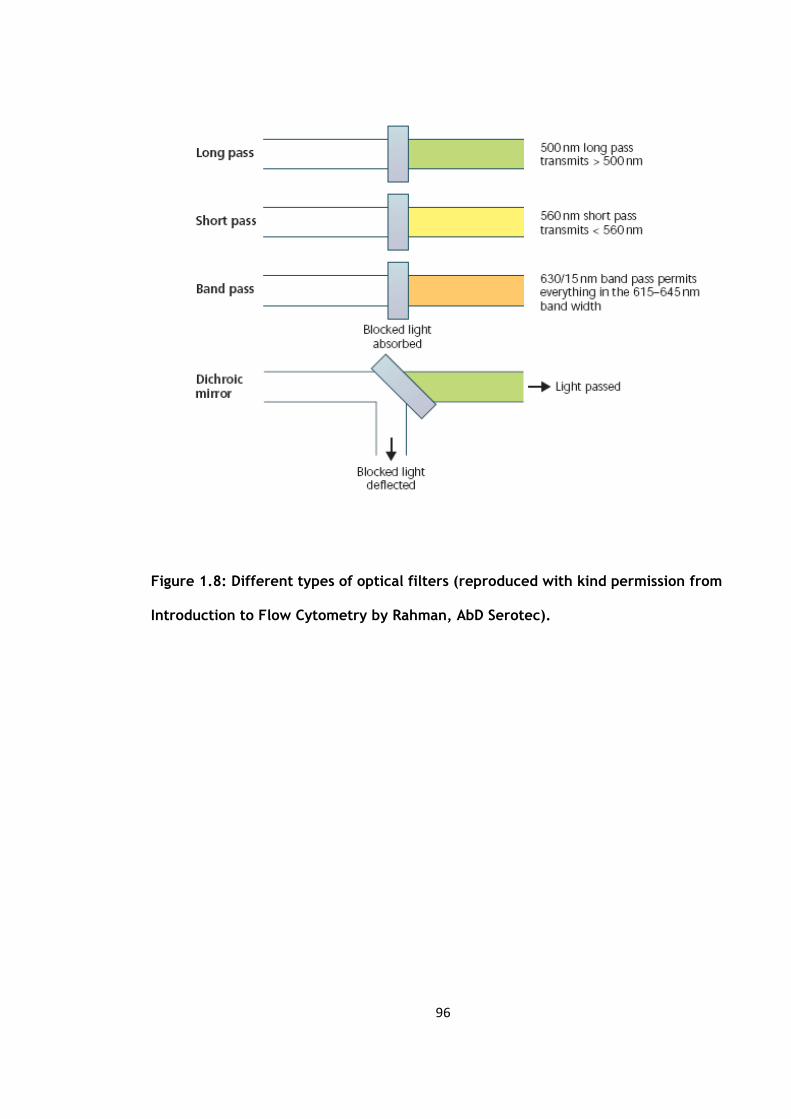
96
Figure 1.8: Different types of optical filters (reproduced with kind permission from
Introduction to Flow Cytometry by Rahman, AbD Serotec).

97
These filters block light by absorption. Also as demonstrated above if the filter is placed
at a 45o angle it becomes a dichroic filter / mirror. This means that the filters perform
two functions, firstly they allow light of a specific wavelength to pass through in a
forward direction and secondly they deflect the blocked light to a 90o angle.
- Processing of the signals
A small current proportional to the number of light photons is generated when they
strike the photodetector.This is then amplified and converted to an electrical signal
which can then be plotted. The measurement from each detector is called a
‘parameter’ and the data in each parameter are known as ‘events’ corresponding to the
number of cell detected.
- Electrostatic cell sorting
The main application of flow cytometry is its ability to identify and separate cells
depending on their subtype or epitope expression. This is done through a process known
as cell sorting or fluorescence-activated cell sorting (FACSTM) analysis. As the sample is
orderd into single file it is passed through a beam of light. The information generated
from the scatter and fluorescence is then compared against a set a predetermined
criteria. If it matches then the fluid is electrically charged and passed though an
electromagnetic field allowing the particle to be sorted (figure 1.9).
98
- Fluorochromes and Stokes shift
As mentioned previously, fluorochromes can be used to identify specific cells.
Fluorochromes are dyes which will absorb light at a specific wavelength and releases it
at a longer wavelength through a process known as fluorescence. As the light is
absorbed by the fluorochrome, the electrons absorb the energy and move from its
normal resting state to a more excited state. The amount of energy for this to happen
will differ for each fluorochrome (shown as Eexcitation in figure 1.10). The excited states
lasts only for 1-10 nanoseconds before the energy is released as heat and the electrons
fall back down to a less excited state known as the ‘relaxed electronic singlet state’
(shown by 3 in figure 1.10) then as the electron move back to its original state the
remaining energy is released as fluorescence (shown by Eemission in figure 1.10).

99
As this Eemission contains less energy it appears as a different colour of light to the
Eexcitation. This difference is called the Stokes shift.
Figure 1.9: Electrostatic flow sorting (reproduced with kind permission from
Introduction to Flow Cytometry by Rahman, AbD Serotec).
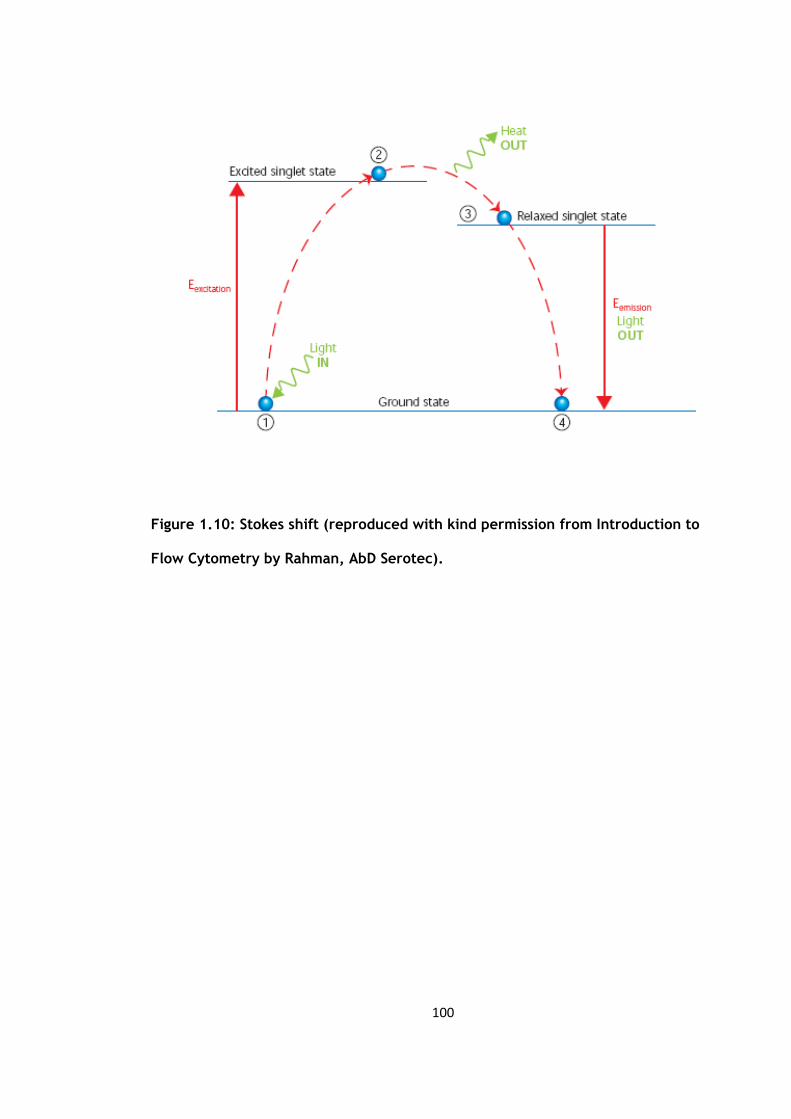
100
Figure 1.10: Stokes shift (reproduced with kind permission from Introduction to
Flow Cytometry by Rahman, AbD Serotec).
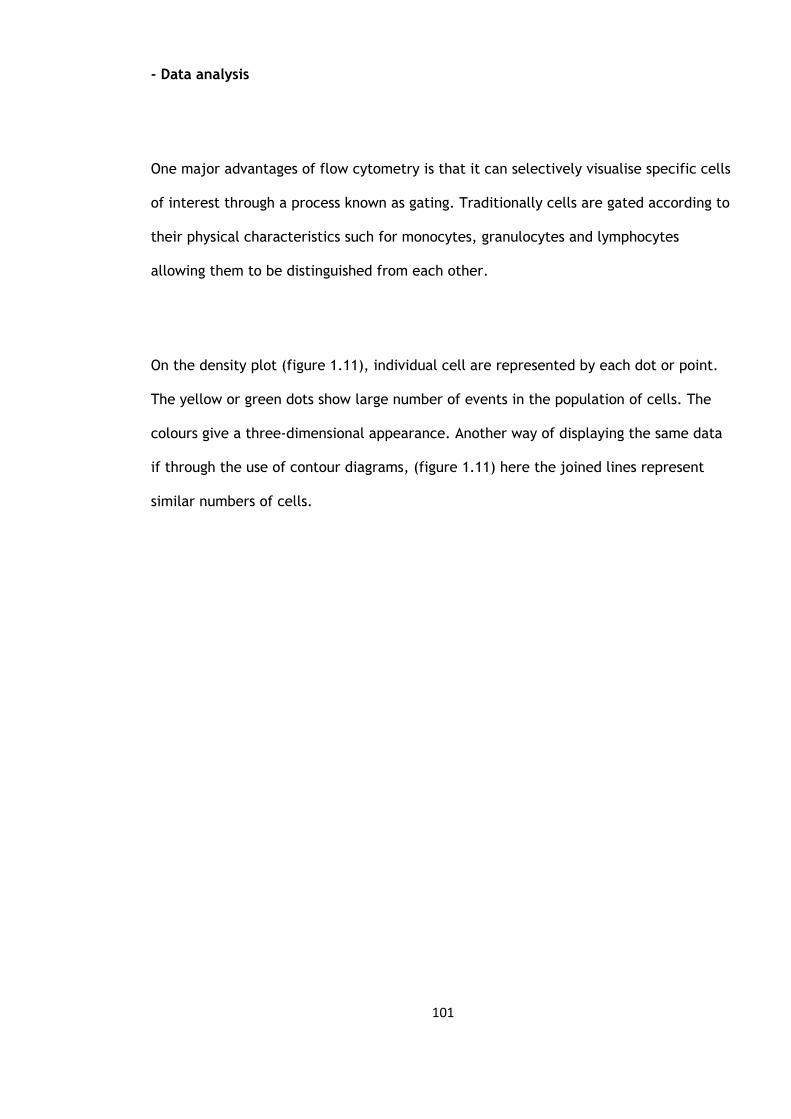
101
- Data analysis
One major advantages of flow cytometry is that it can selectively visualise specific cells
of interest through a process known as gating. Traditionally cells are gated according to
their physical characteristics such for monocytes, granulocytes and lymphocytes
allowing them to be distinguished from each other.
On the density plot (figure 1.11), individual cell are represented by each dot or point.
The yellow or green dots show large number of events in the population of cells. The
colours give a three-dimensional appearance. Another way of displaying the same data
if through the use of contour diagrams, (figure 1.11) here the joined lines represent
similar numbers of cells.

102
Figure 1.11: Analysis of lysed whole blood using forward and side scatter
(reproduced with kind permission from Introduction to Flow Cytometry by Rahman,
AbD Serotec).

103
Figure 1.12: Lysed whole blood analysis using scatter and fluorescene scatter
(reproduced with kind permission from Introduction to Flow Cytometry by Rahman,
AbD Serotec).
104
In figure 1.12 on the left hand side is a forward and side scatter plot of lysed whole
human blood. The lymphocytes are represented in region 1 (R1), the monocytes in
region 2 (R2) and the granulocytes in region 3 (R3). The term ‘region’ is used to refer to
the region in the plot which shows the data from the flow cytometer. On the graph on
the right the same sample of lysed human whole blood has been plotted but this time
CD45 has been added. CD45 is expressed to different degrees by all white blood cells
but not by red blood cells. In this plot we see region 4 (R4) representing the
lymphocytes (low SSC and high CD45 count), region 6 (R6) showing the granulocytes
(high SSC and low CD5 count) and the monocytes in between in region 5 (R5). The main
difference between the lymphocytes gated in region 1 and region 4 is the absence of
red blood cells in R4.
The data can also be displayed as single or double parameter histograms. A single-
parameter histogram is one that displays a single measurement such fluorescence or
light scatter intensity on the one axis and the number of events (cell count) on the
other (figure 1.13).
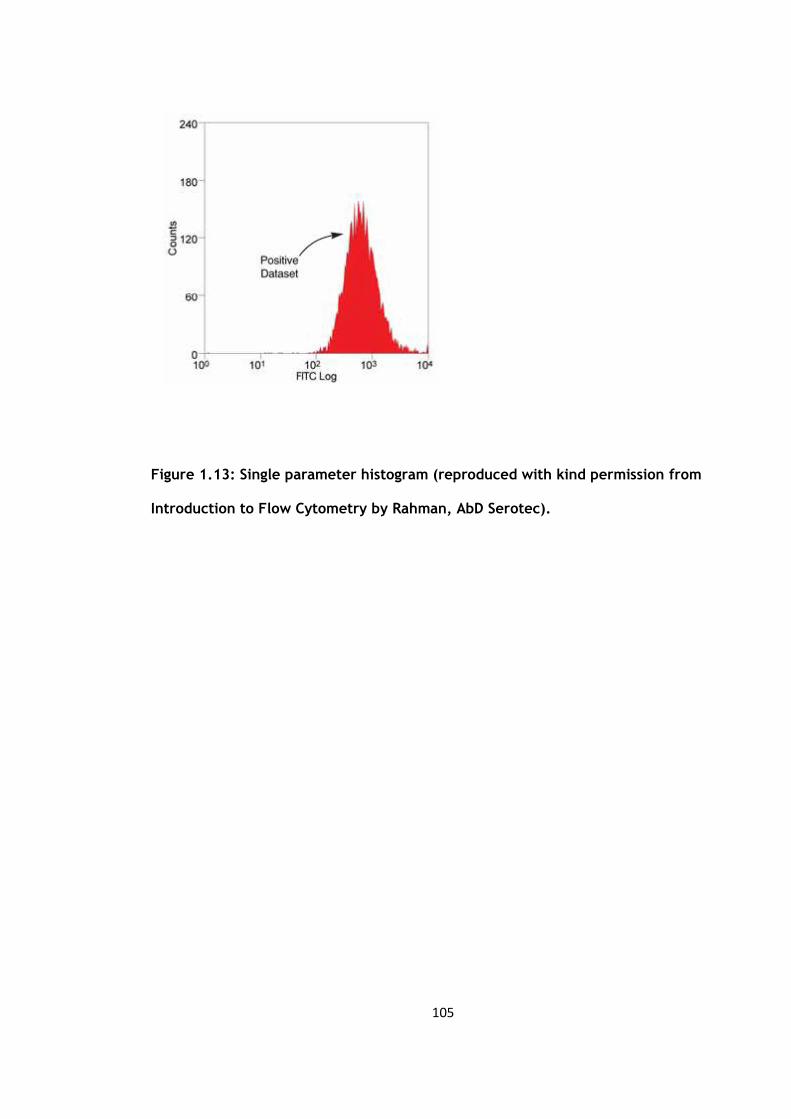
105
Figure 1.13: Single parameter histogram (reproduced with kind permission from
Introduction to Flow Cytometry by Rahman, AbD Serotec).

106
This type of histogram is useful for quickly assessing the total number of events of
inetrest. These selected cells are known as the positive dataset.
The two-parameter histogram displays two measurement parameters, one on the x-axis
and y-axis with the cell count as a density (dot) plot or contour map. The parameters
could be SSC, FSC or fluorescence (figure 1.14).
In the figure above, the lymphocytes have been stained with anti-CD3 in FITC channel
(x-axis), and anti-HLA-DR in the PE channel (y-axis) which are markers for T cells and B
cells respectively. Here the R2 reflects the PE-labelled B cells and R5 contains the FITC-
labelled T cells. The cells that stains for both markers are reflected in region 3 (R3) and
finally R4 contains cells negative for both markers.
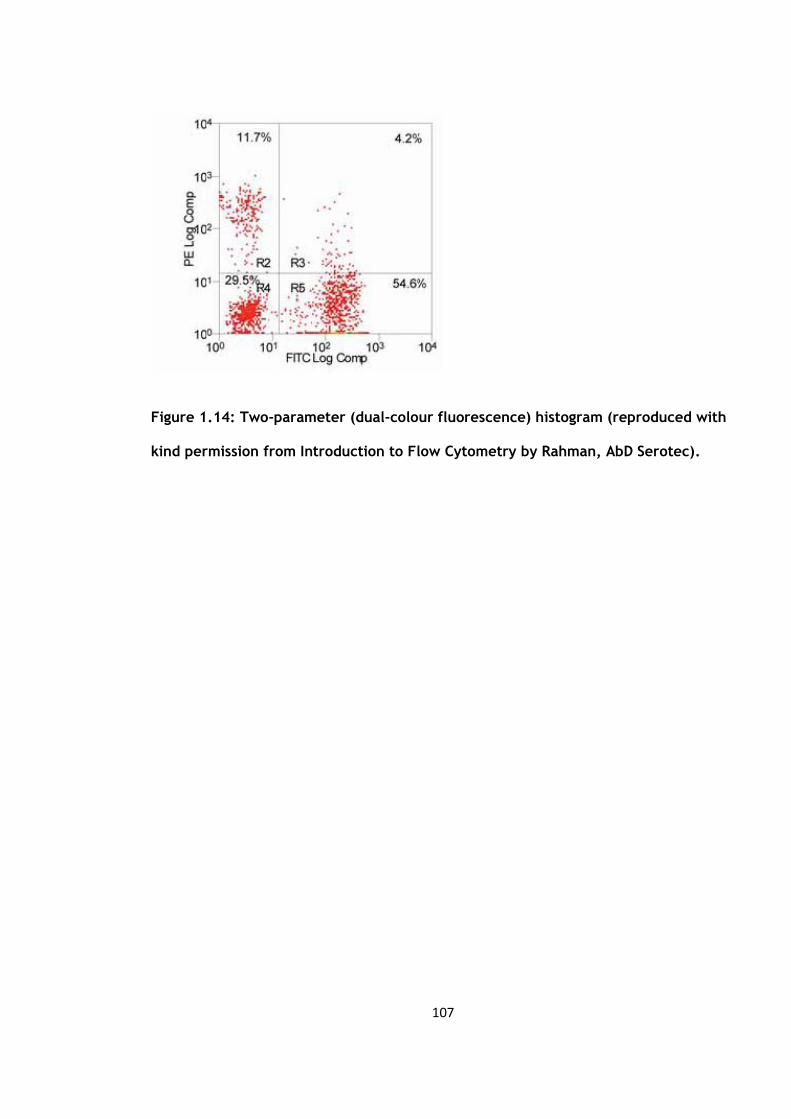
107
Figure 1.14: Two-parameter (dual-colour fluorescence) histogram (reproduced with
kind permission from Introduction to Flow Cytometry by Rahman, AbD Serotec).

108
1.7 Polymethylmethacrylate Bone Cement
Polymethylmethacrylate (PMMA) has been used in orthopaedic surgery now for over 60
years. The word cement is often used along with PMMA but strictly speaking it is a grout
rather than cement. As the orthopaedic speciality has advanced so has our
understanding of its properties and it has indirectly helped enhance implant design,
tribology and biomechanics.
PMMA was first introduced in 1843 and initially known as ‘acide acrylique’ due to the
acrid smell of the monomer (193). In 1936 it was discovered that the mixture of monomr
and polymer gave a substance that for period a time could be moulded and
manipulated. Its early use was in dentistry but Scales and Herschell in 1945 (194) and
Judet and Judet in 1950 (195) used it to mould a femoral head prostheses of in the
treatment of arthritis. It current use as a grout was first pioneered in 1953 by Haboush
(196). The major breakthrough was when it was adapted for orthopaedic use by Sir John
Charnley (197;198) and even now remains an integral part of modern orthopaedic
practice.
The methylmethacrylate monomer polymerises at room temperature to produce the
solid PMMA (199). In its commercial states it consists of packs of the polymer, including
additives (table 1.4). The molecular weight of PMMA will vary depending on the brand
and the method of sterilisation. For instance gamma radiation for sterilisation will
shorten the polymer chains which does not occur with ethylene oxide sterilisation (200).

109
Table 1.4: Constituents of bone cement
Constituent Role
Powder components
Polymer Polymethylmethacrylate
Co-polymers e.g. MM-MMA Alters physical properties of cement
Barium sulphate or zirconium dioxide Radio-opacifiers
Antibiotics Antimicrobial prophylaxis
Dye e.g. chlorophyll Distinguishes cement from bone
Liquid components
Monomer Methylmethacrylate monomer
N,N-dimethyl-p-toluidine (DMPT) Initiates cold curing of polymer
Benzoyl peroxide Reacts with DMPT to catalyse
polymerisation
Hydroquinone Stabiliser to prevent premature
polymerisation
Dye e.g. chlorophyll Distinguishes cement from bone
MA-MMA = methacrylate-methylmethacrylate
110
The polymerisation process is an exothermic one (201). The catalysts form free radicals
allowing the breaking of the carbon to carbon bonds of the monomer. This can bind to
the polymer increasing its length. This process produces heat in the order of 1.4 to 1.7
x108 J/m3 of cement (201). This heat production has been studied both in vitro and in
vivo (202). In vitro, the heat produced increases with higher room temperatures, an
increased monomer to polymer ratio and when a thicker cement mantle is used (203).
The temperatures recorded range from 70°C to 120°C and as collagen denaturing at
temperatures above 56ºC, several authors have raised the potential risk of thermal
damage to bone (204;205).
However, lower temperatures have been sown in vivo studies (201). Reckling and Dillon
(206) in 1977 measured the bone cement interface temperature in 20 total hip
replacements. The maximum temperature they found was only 48°C but they attributed
this to the possible cooling effects of the blood supply, the large surface are of a
metallic stem and the poor thermalconduction of the cement. Others authors have
recorded temperatures above 56°C but only for two to three minutes (207).
This exothermic process already been shown to activate the complement system (208).
Ritter et al demonstrated that the addition of polymethylmethacrylate contributes to
the overall mortality following total hip and knee arthroplasty (209) through measuring
levels of gamma-glutamyl-transpeptidase which was significantly elevated compared to
a control group of hip fracture fixation using no cement. The methylmethacrylate
monomer is an organic solvent which has been shown to be cytotoxic (210). It may act
on the pulmonary endothelium to enhancing the procoagulant factors already present
adding to its hypercoagulability possibly resulting in the development of DVT (211).
111
An animal study by Dahl et al (212) compared the frequency of postoperative deep vein
thrombosis in eight pigs who underwent a hemiarthroplasty with and without cement
(n=16). The levels of thrombin-antithrombin complexes rose substantially during bone
preparation followed by a rise in tissue plasminogen activator levels and a gradual fall
in plasminogen activator inhibitor activity, with the higher rises seen in those
undergoing a cemented prosthesis. Post-operative electron microscope scanning showed
femoral vein thrombi in 62% of the animals in the cemented group compared to 25% in
the uncemented group. They concluded that bone preparation during surgery induced a
significant stimulation of the coagulation pathway and resulted in higher rates of deep
vein thrombosis in the proximal veins, more so if cement was used for prosthesis
fixation.
1.8 Effect of elective general and orthopaedic surgery on inflammation and
endothelial markers
An early study by Cruickshank et al in 1990 investigated the IL-6 response to a variety of
elective surgical procedures such as cholecystectomy, cemented total hip arthroplasty
and major vascular surgery. They demonstrated a relationship between the duration of
surgery and the IL-6 response (r = 0.8, p < 0.001) and concluded that IL-6 was a
sensitive marker of tissue damage and that this response increased with greater surgical
trauma (41).
In 2000, Pape et al (172) in a prospective non randomised study investigated 105
patients admitted to their unit for a variety of lower limb orthopaedic procedures.
112
These were then categorised into four groups. Group 1 represented a group of
polytrauma patients with an Injury Severity Score of 18, group 2 were those with a
isolated femoral diaphyseal fractures treated with unreamed femoral nailing, group 3
were those with a diagnosis of osteoarthritis admitted for uncemented total hip
arthroplasty and the final group 4 were those who had sustained an isolated ankle
fracture for open reduction and internal fixation with a plate.
The baseline values of IL-6 and TNFα were sampled from the venous circulation on skin
incision and then at insertion of prosthesis i.e. the femoral component of a total hip
arthroplasty, insertion of a femoral nail and the application of a plate. They found that
the TNFα levels increased the most significantly in the group of polytrauma patients at
all time points and although the levels increased in the total hip arthroplasty group, this
did not reach statistical significance. The IL-6 levels showed a statistically significant
rise at insertion of the femoral component in the total hip arthroplasty group and these
rises were of similar magnitude to that of the femoral nailing group, showing a
correlation between the groups (r = 5.83; p = 0.0004).
The authors conceded that the study did not focus solely on skeletal operations. It also
did not address the possibility of activation of inflammatory mediators by the
methylmethacrylate from the bone cement used (173).
Similar significant rises in IL-6 levels were also reported by Krohn et al (174) but they
only looked at 8 adolescents (12-19 yrs) undergoing corrective surgery for thoracic
scoliosis. The IL-6 levels were sampled from both the arterial blood as well as blood
obtained from drains, the levels in the drained blood reaching much higher levels. Again

113
as in the previous study, several samples were taken at different time points, pre-
operatively and at 1, 2, 4 and 6 hours post-operatively. IL-6 showed a continual rise
throughout all the sample points.
They did not demonstrate a significant change in the TNFα apart from a rise during
wound closure. They explained their results as possibly due to its short biological half-
life. Others have also shown no significant rises in the TNFα levels in the case of total
hip arthroplasties (213;214) but Andres et al demonstrated significant levels of local
TNFα in surgical drains post-operatively (215).
Other studies have looked into the effects of total knee arthroplasty on monocytes-
platelet expression as well as the expression of CD40L on platelets, using flow
cytometry. Kageyama et al (175) recruited 24 patients into their study who were then
randomised into two groups, one with and the other without the use of a tourniquet
intra-operatively. Two patients (one from each group) were excluded due to
anaesthetic difficulties resulting in the operation being cancelled. The remaining 22
subjects had venous and arterial blood sampled before and at the end of surgery.
Samples were also taken 6 hours then again at 24 hours following surgery. They found
that monocytes-platelet expression levels peaked at around 2.5 hours following skin
incision and then returned to baseline levels at 24 hours. A similar picture was also seen
in CD40 expression with a maximal change of around 25% from baseline levels. They
found that circulating levels of sCD40L increased in proportion with levels obtained by
flow cytometry (p<0.05). These results were increased in the group with tourniquet
inflation, however the authors failed to mention if this was statistically significant or
not. The authors concluded that their results after total knee arthroplasty may highlight
an important role for blood cell activation in the pathogenesis of hypercoagulability and
114
venous thrombosis. But the numbers of this study are small (n=22) and although an
attempt was made to look at the difference with the use of an inflated tourniquet no
mention is made as to whether their differences seen were statistically significant but
he went on to state that his results support the hypothesis that the use of a tourniquet
causes the retention of blood flow, increases the coagulation activity as well as
disrupting the vascular endothelium contributing to venous thrombosis. This hypothesis
is supported by several smaller studies (216-218).
There is more evidence for elective cemented total hip arthroplasty as previous studies
have demonstrated an increase in the thromboplastin activity of monocytes (219). Dahl
et al (220) showed that the thromboplastin activity was confined to the cell surface of
the monocytes where fibrin formation occurred. This in turn may contribute to the
increased coagulability that is induced when blood passes the lung (221). These
pericellular fibrin deposits may allow the monocytes to attach to the vessel walls
promoting thrombus formation. This may occur more so in an environment where the
endothelial surface is already stimulated due to local mechanical, chemical (bone
cement) or biochemical factors. As well as this the activated monocytes may have an
increased expression of cell surface adhesion molecules e.g. selectins. Therefore this
may contribute to the higher frequency of DVT observed in patients receiving cemented
hip prostheses (160).
Another study also looked at the levels of CD40L and expression of monocytes-platelets
but in subjects undergoing cemented total hip arthroplasty. Ray et al (74) recruited 45
subjects. Their aim was to look at a possible link between CD40L expression and
cardiovascular complications 30 days following surgery. Sampling was taken through an
arterial line before and then one hour following completion of surgery for flow
115
cytometry analysis. The recorded adverse cardiovascular events were two patients with
non-ST elevation myocardial infarction (NSTEMI), two with atrial fibrillation and another
two patients with both and NSTEMI and atrial fibrillation. They found that these 6
patients compared to those with no complications (n=39) were more likely to be
diabetic (2/6 versus 1/39, p=0.04) and had a past medical history of cardiovascular
disease (3/6 versus 4/39, p=0.04). Flow cytometry revealed that the CD40L expression
on platelets before surgery was a median of 11% (IQR 7.9-12.8) in patients with a history
of cardiovascular disease compared to 4.7% (IQR 1.9-6.6) for those with none (p=0.001).
The increase in CD40L expression in both groups at one hour post procedure was
statistically significant.
Bagry et al looked at the effect on the inflammatory response of a continuous
peripheral nerve block following a primary total knee arthroplasty in 12 patients (222).
All underwent a spinal anaesthetic and were then randomized to either patient-
controlled analgesia using morphine (n =6) or lumbar plexus and sciatic nerve blocks
with ropivacaine (0.2%) for 48 hours. Venous blood was sampled at specific time points
up to 48 hours post-operatively. They found that both leucocyte and CRP levels were
significantly lower in those with the continuous nerve block, which therefore
attenuated the inflammatory response. The reduction in the inflammatory response can
improve the functional recovery by reducing the injury-induced immunosuppression
(223) with prolonged elevation of CRP and IL-6 following hip arthroplasty being
associated with poor mobilisation and rehabilitation. Other have carried out similar
studies with epidural anaesthesia but have not found a significant reduction in the
inflammatory response (224) which Bagry et al stated was due to the blocking of both
the afferent and efferent fibres innervating the surgical area, preventing primary and
secondary hyperalgesia which is not possible with epidural anaesthesia. Bagry et al did
however concede that the systemic effect of the local anaesthetic could not be
116
excluded as research has demonstrated that the use of local anaesthetics either given
locally or systemically will affect the inflammatory response in animals (225). However
the local attenuation of the inflammatory response has been shown in vitro by Su et al
(49).
From this review of the current literature it appears that elective orthopaedic surgery
including total knee arthroplasty does activate inflammation, endothelium and blood
coagulation, as measured both by circulating levels of activation markers and by flow
cytometry. These effects may be influenced by the use of bone cement, by local
anaesthetic infiltration intra-operatively or the use of post-operative drains and may
also be related to the increased post-operative risks of arterial and venous thrombosis.
To date no systematic study has been reported comparing the effects of bone cement,
local anaesthetic infiltration and post-operative drains in elective total knee
arthroplasty.

117
AIM
The aim of the studies reported in this thesis is to examine and compare the effects of 4
different aspects of elective orthopaedic total knee arthroplasty on the activation of
selected circulating markers of inflammation, endothelium, coagulation and fibrinolysis:
- IL-6 inflammatory cytokine
- TNFα inflammatory cytokine
- CRP sensitive inflammatory marker
- e-selectin endothelial marker
- sCD40L general marker of inflammation
- tPA endothelial marker
- vWF endothelial marker
As well as this I will study the effects of the 4 aspects of elective orthopaedic total knee
arthroplasty on blood cell activation of selected cytokines:
- expression of CD40 on monocytes
- expression of the CD14 / CD42a dyad on monocytes

118
Four study groups will be compared:
1) Patients undergoing elective uncemented total knee arthroplasty
2) Patients undergoing elective cemented total knee arthroplasty, to investigate any
additional response to the exothermic reaction of the PMMA cement.
3) Patients undergoing uncemented total knee arthroplasty, with local infiltration of
local anaesthetic intra-operatively.
4) Patients undergoing uncemented total knee arthroplasty, with the use of a drain
post-operatively
In order to quantify the effect of the use of cement, intra-operative local anaesthetic
infiltration or a drain I will be comparing the following groups:
1) Cemented group versus uncemented group to assess any additional effect the cement
may have on the inflammatory or endothelial response.
2) Uncemented group versus the group with local anaesthetic infiltration to assess
whether the local anaesthetic would dampen the inflammatory and endothelial
response.

119
3) Uncemented group versus the group with a surgical drain to assess any effect this
would have on the inflammatory and endothelial response.

120
CHAPTER 2
SUBJECTS AND METHODS

121
2.1 Subjects
All patients attending Monklands Hospital assessed for an elective cemented or
uncemented total knee arthroplasty were identified. They were then approached at the
pre-assessment clinic (which routinely took place a week before their intended
operation date) by the author where the study was explained to them, and they were
invited to take part in the study. After informed consent was obtained a patient history
was taken which included the history of the presenting complaint, past medical history,
drug and social history. The patient’s case notes were then reviewed and if they were
eligible for the study they were recruited at that point. (Table 2.1) Following
recruitment into the study, patients were excluded if they developed a post-operative
infection confirmed by bacteriological sampling.
As part of the consent, subjects were told that the average length of hospital stay
following a total knee arthroplasty was around 5 to 7 days. This meant that usually by
the time the last blood sample was due to be taken, there would a high likelihood that
they would have been discharged home. So subjects were only enrolled into the study if
they agreed to a home visit by the author at day 7 post operation in order to obtain the
third and final sample.

122
Table 2.1: Inclusion criteria for the study
Subjects were recruited into the study if they met all the following
requirements:
- no history of uncontrolled hypertension
- no history of ischaemic heart disease
- were able to give informed consent in the opinion of the researcher
123
An information sheet (Annex 1) outlining the study along with contact details was given
to the subject and a copy of the information sheet was attached to the patient’s
casenotes to indicate their participation. A cover letter (Annex 2) and information sheet
was sent to their general practitioner. Ethical approval (Annex 3) was obtained from the
Local Research Ethics Committee.
The subjects were admitted into the elective orthopaedic ward at Monklands Hospital
the day before their surgery. They were approached by the author and any questions
that had arisen from the previous consultation were addressed. As well as this, a pre-
operative electrocardiogram was taken.
The day after their total knee replacement (day 1 post-operation) the second set of
blood samples were taken as pre-operatively. A record was also taken of the
anaesthetic sheet to note the blood pressure readings during the time of surgery and a
post-operative electrocardiogram was done.
At day 7 post total knee arthroplasty if the subject was still in the ward the final set of
blood samples were taken as pre-operatively. If they had been discharged home the
subject was contacted at home and a suitable time was agreed for the author to visit
and take the final samples.

124
2.2 Blood sampling, handling and laboratory assays
Following enrolment into the study the first of three sets of blood sample was taken.
These pre-operative blood samples were collected in the BD Vacutainer system. (Table
2.2) Two BD Vacutainers, SST II Advance (yellow top bottles) were taken and sent to the
biochemistry laboratory for routine urea and electrolytes, liver function tests,
cholesterol and C-reactive protein. One BD Vacutainer, K3E 7.2mg EDTA (purple top
bottle) was sent to the haematology laboratory for a full blood count as well as for a
differential white cell count, and one BD Vacutainer, 9NC 0.109M trisodium citrate
(light blue top bottle) for coagulation profile. A further two EDTA bottles were taken for
flow cytometry analysis and one citrate and a SST bottle for the endothelial markers.

125
Table 2.2: Overview of BD Vacutainer systems
Colour of
bottle top
Volume
(ml)
System Additives
Yellow 5 BD Vacutainer, SST II
Advance
Spray coated silica and polymer
gel for serum separation
Purple 4 BD Vacutainer, K3E
7.2mg EDTA
Spray coated K3 EDTA –
anticoagulant
Light Blue 2.7 BD Vacutainer, 9NC
0.109M
3.2% buffered trisodium citrate
anticoagulant

126
The samples for flow cytometry were taken directly to the Haematology laboratory. The
peripheral blood was labelled with combinations of FITC-conjugated anti CD14; PE-
conjugated anti CD42a and PE-conjugated and anti CD40 (AbD Serotec, Kidlington, UK).
After incubation red cells were lysed using EasyLyse ammonium chloride RBC lysing
solution (Dako,Denmark). Data acquisition and analysis was performed on a FACS Canto
II flow cytometer (Becton Dickinson, San Jose, CA). Monocytes were identified from
light scatter properties and a gate applied. 10000 events within the monocyte gate were
collected. Number of gated events, mean fluorescence intensity and percentage
positive events were recorded. Isotype FITC and PE controls were analysed on each
sample to determine background fluorescence. All samples were processed within 24-
48hrs.
The citrate and SST bottles were also taken to the Haematology laboratory where they
were centrifuged at 1500g for 10 minutes. The plasma was then separated as follows:
- plasma from the citrate bottle was decanted into two 1 ml aliquots
- serum was decanted into two 1 ml aliquots
The samples were then stored in a -40°C degree freezer. All samples were centrifuged
and stored within three hours of venepuncture. All samples were stored in the freezer
until such time that they could be transferred by the author to the University
Department of Medicine laboratory at Glasgow Royal Infirmary for analysis.
127
Soluble CD40 ligand (sCD40L), e-selectin and interleukin 6 (IL6) were assayed by high-
sensitivity enzyme-linked immunoasorbent assay (ELISA) kits from R&D systems, Oxford,
United Kingdom.
Plasma von Willebrand factor (vWF) antigen levels were measured with an in-house
enzyme linked immunoasorbent assay (ELISA), using rabbit anti-human polyclonal
antibodies (DAKO plc, High Wycombe, UK). Tissue plasminogen activator levels were
measured with a commercially available enzyme-linked immunoasorbent assay (ELISA)
(Trinity Biotech, Sulhampstead, UK).
In the laboratory the intra- and inter-assay coefficient of variations (CV) for IL6 was
7.5% and 8.9% respectively, 4.2% and 3.3% for vWF, 6.6% and 6.5 % for tPA, 5.9% and
8.6% for e-selectin, ~12.6% for TNFα and ~6.0% for sCD40L.
2.3 Statistical Analysis
A Shapiro-Wilk test was done to test for normaility. All variables except for the CD40,
CD1442a and e-selectin count were normally distributed. For the parametric data
results are presented as mean, SD and SEM. Differences between the three time points
(pre-operative, day 1 and day 7) were analysed using pair sampled t-tests. This was
done for all the four groups. Independent sample t-tests were used to look for
differences between groups. The non-parametric data results are presented as median
and IQR. The differences between the three time points were analysed using Wilcoxon

128
signed rank tests. Mann-Whitney U tests were used to look for differences between the
groups.
Advice on statistical analyses was sought from the Robertson Centre for Biostatistics,
The University of Glasgow.

129
Chapter 3
The effect of elective uncemented total knee
arthroplasty on the activation of markers of
inflammation, endothelium and coagulation

130
3.1 Subject Characteristics
There were 20 patients recruited into this study, one patient developed a post-
operative deep wound infection with positive wound cultures. This required a second
procedure in the form of a wound washout and exchange of the polyethylene liner and
was therefore removed from the study, leaving 19 patients. The mean body mass index
(BMI) was 30.3kg/m2, standard deviation 5.1. There were 10 males (mean age 65.3
years, standard deviation 7.36) and 9 females (mean age 67.8 years, standard deviation
8.97). A total of 6 total knee arthroplasties were carried out on the left and 13 on the
right.
3.2 Blood cell count and CRP
The mean values, standard deviations and standard error of means of blood cell counts
and CRP are summarised in table 3.1.
Each of these variables were compared over three time periods, from pre-operative
values to day 1 post-operation (P1-D1), from day 1 to day 7 post-operation (D1-D7) and
from pre-operative to day 7 post-operation (P1-D7).
There were significant changes at all three time points for the platelets (Plat) (Figure
3.1), white cell count (WCC) (Figure 3.2) and neutrophils (Neutro) (Figure 3.3), with an

131
initial rise then fall except for the platelets which had an initial fall in their levels. The
monocytes (Mono) (Figure 3.4) also had a significant rise but just failed to reach
significance when their levels dropped at day 7. C-reactive protein (CRP) showed a
significant rise in the first 24 hours and remained significantly elevated at day 7 (Figure
3.5).
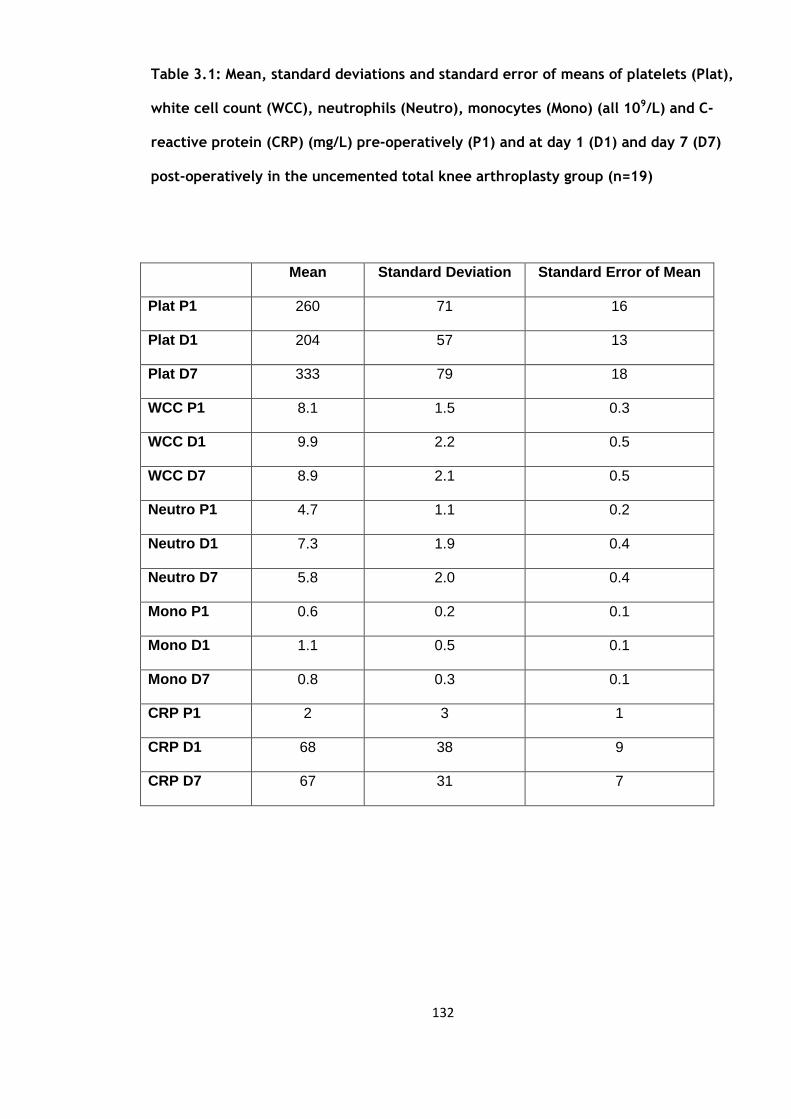
132
Table 3.1: Mean, standard deviations and standard error of means of platelets (Plat),
white cell count (WCC), neutrophils (Neutro), monocytes (Mono) (all 109/L) and C-
reactive protein (CRP) (mg/L) pre-operatively (P1) and at day 1 (D1) and day 7 (D7)
post-operatively in the uncemented total knee arthroplasty group (n=19)
Mean Standard Deviation Standard Error of Mean
Plat P1 260 71 16
Plat D1 204 57 13
Plat D7 333 79 18
WCC P1 8.1 1.5 0.3
WCC D1 9.9 2.2 0.5
WCC D7 8.9 2.1 0.5
Neutro P1 4.7 1.1 0.2
Neutro D1 7.3 1.9 0.4
Neutro D7 5.8 2.0 0.4
Mono P1 0.6 0.2 0.1
Mono D1 1.1 0.5 0.1
Mono D7 0.8 0.3 0.1
CRP P1 2 3 1
CRP D1 68 38 9
CRP D7 67 31 7
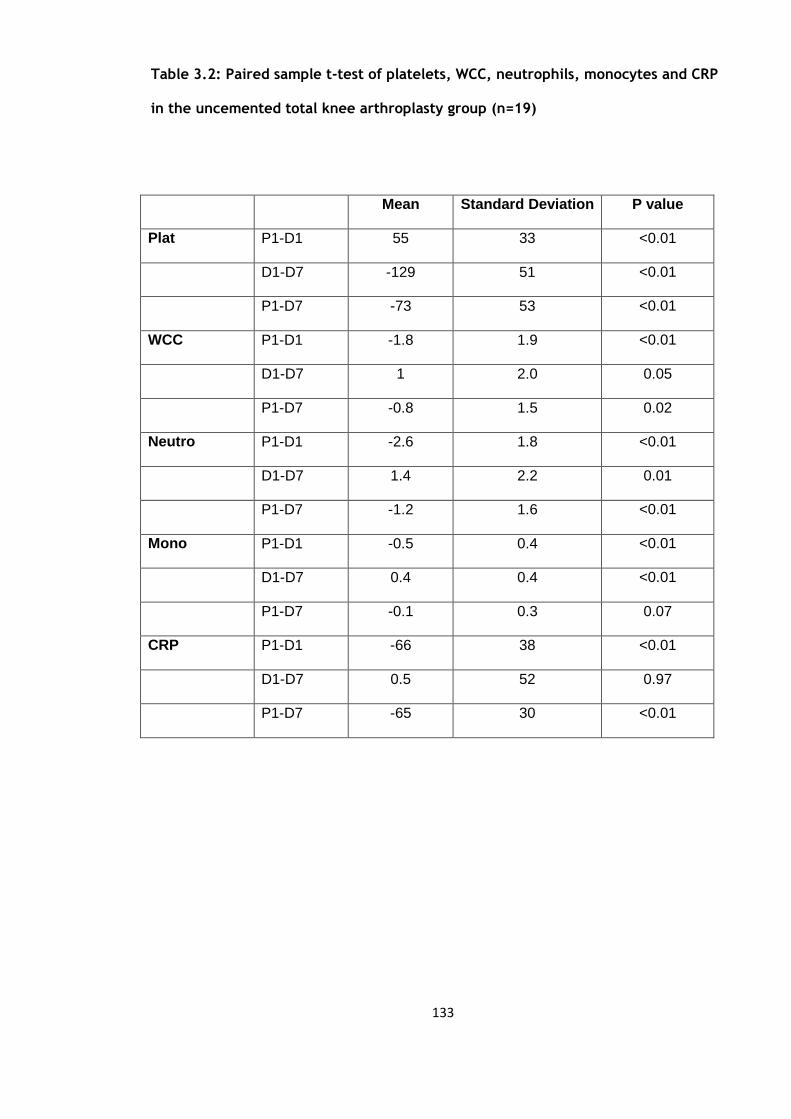
133
Table 3.2: Paired sample t-test of platelets, WCC, neutrophils, monocytes and CRP
in the uncemented total knee arthroplasty group (n=19)
Mean Standard Deviation P value
Plat P1-D1 55 33 <0.01
D1-D7 -129 51 <0.01
P1-D7 -73 53 <0.01
WCC P1-D1 -1.8 1.9 <0.01
D1-D7 1 2.0 0.05
P1-D7 -0.8 1.5 0.02
Neutro P1-D1 -2.6 1.8 <0.01
D1-D7 1.4 2.2 0.01
P1-D7 -1.2 1.6 <0.01
Mono P1-D1 -0.5 0.4 <0.01
D1-D7 0.4 0.4 <0.01
P1-D7 -0.1 0.3 0.07
CRP P1-D1 -66 38 <0.01
D1-D7 0.5 52 0.97
P1-D7 -65 30 <0.01
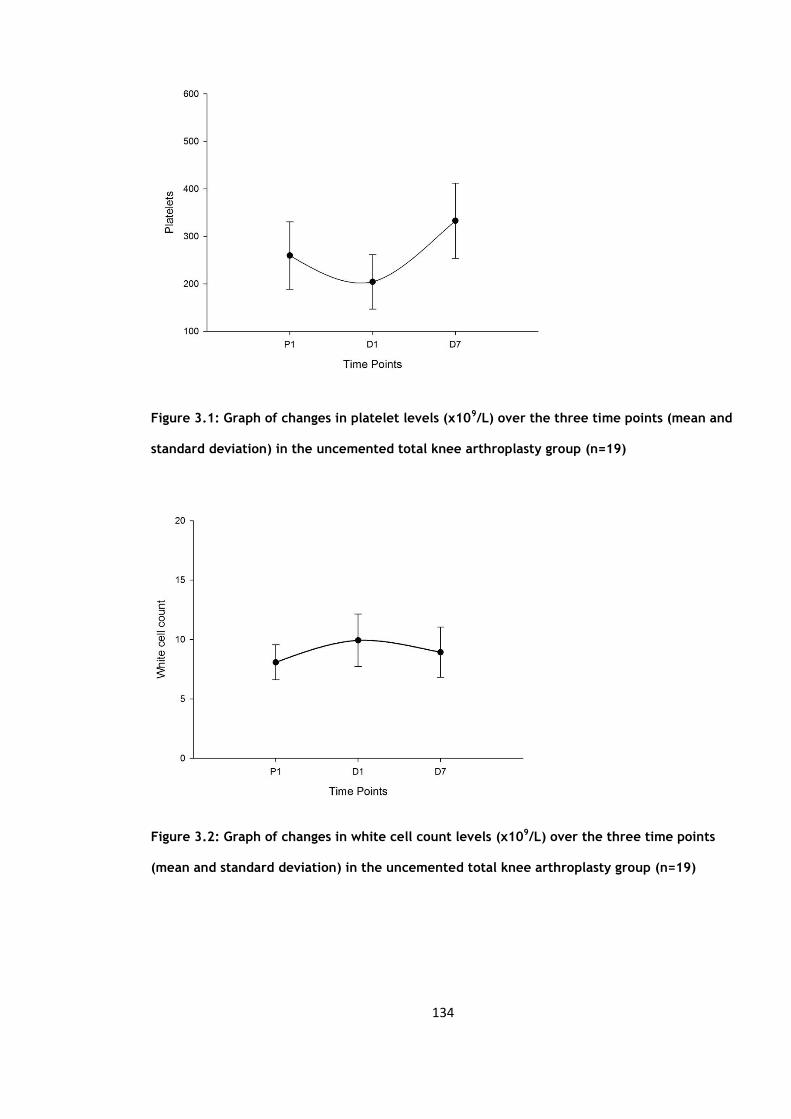
134
Figure 3.1: Graph of changes in platelet levels (x109/L) over the three time points (mean and
standard deviation) in the uncemented total knee arthroplasty group (n=19)
Figure 3.2: Graph of changes in white cell count levels (x109/L) over the three time points
(mean and standard deviation) in the uncemented total knee arthroplasty group (n=19)
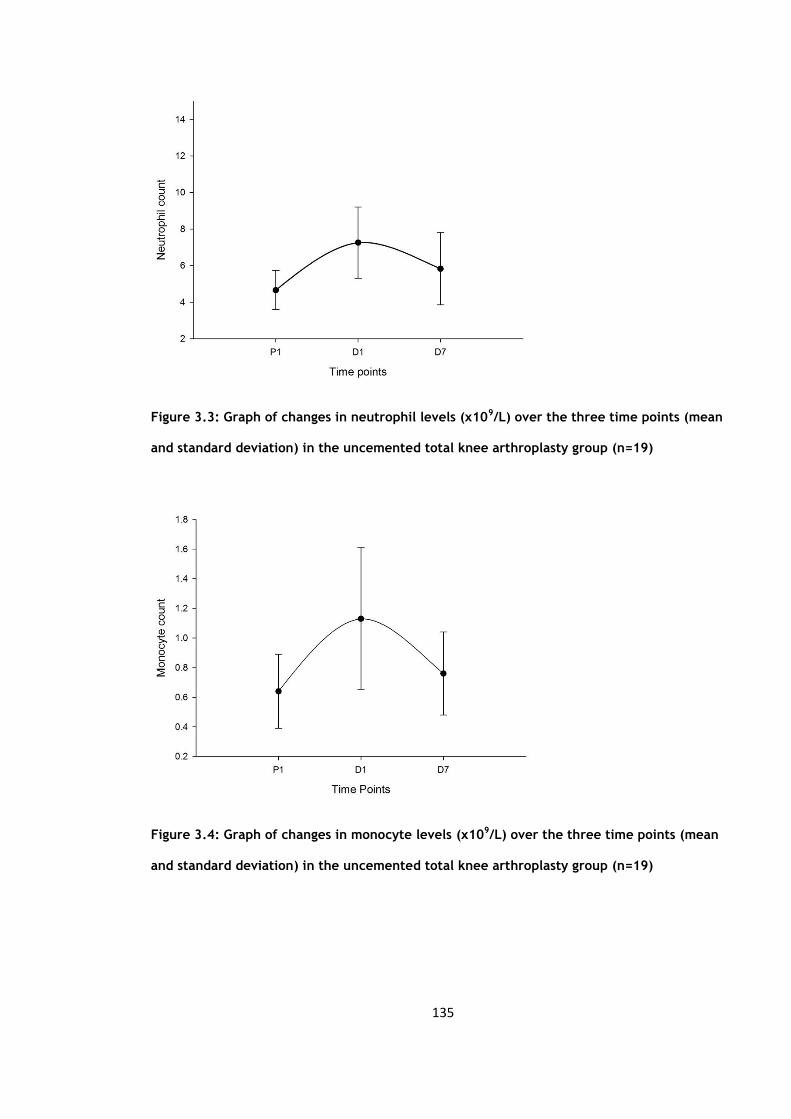
135
Figure 3.3: Graph of changes in neutrophil levels (x109/L) over the three time points (mean
and standard deviation) in the uncemented total knee arthroplasty group (n=19)
Figure 3.4: Graph of changes in monocyte levels (x109/L) over the three time points (mean
and standard deviation) in the uncemented total knee arthroplasty group (n=19)

136
Figure 3.5: Graph of changes in C-reactive protein levels (mg/L) over the three time points
(mean and standard deviation) in the uncemented total knee arthroplasty group (n=19)

137
3.3 Circulating activation markers
The mean, standard deviations and standard error of means of tissue plasminogen
activator (t-PA), Von Willebrand factor (vWF), soluble CD40 ligand (sCD40L), interleukin
6 (IL6), tumour necrosis factor (TNFα) and e-selectin are summarised in table 3.3.
Each variable was then compared over the three time points from pre-operative values
to day 1 post-operation (P1-D1), from day 1 to day 7 post-operation (D1-D7) and from
pre-operative to day 7 post-operation (P1-D7) (Table 3.4).
The t-PA levels showed a non-significant rise in the first 24 hours (p=0.06) but by day 7
there was a significant rise from the pre-operative levels (p=0.01) (Figure 3.6). The vWF
levels rose significantly in the first 24 hours (p=0.00) and remained higher at day 7
(Figure 3.7). The sCD40L showed a significant fall from pre-operative levels and rose
from day 1 levels to day 7 (p=<0.01) (Figure 3.8). IL 6 rose and fell significantly (Figure
3.9). TNFα rose significantly at day 7 (Figure 3.10). The e-selectin levels did not show
any significant changes at any of the time points (Figure 3.11).

138
Table 3.3a: Mean, standard deviations and standard error of means of tissue
plasminogen activator (t-PA) (ng/ml), von Willebrand factor (vWF) (IU/dl), soluble
CD40 ligand (sCD40L) (pg/ml), interleukin 6 (IL6) (pg/ml) and tumour necrosis factor
(TNFα) (pg/ml) in the uncemented total knee arthroplasty group (n=19)
Mean Standard Deviation Standard Error Mean
t-PA P1 11.5 4.5 1.1
t-PA D1 14.4 6.0 1.4
t-PA D7 15.1 7.1 1.7
vWF P1 119 38 9.
vWF D1 197 73 18
vWF D7 206 45 11
sCD40L P1 3300 2020 476
sCD40L D1 2803 2227 525
sCD40L D7 4282 2417 570
IL6 P1 4.3 2.6 0.6
IL6 D1 173.3 113.9 26.8
IL6 D7 31.9 47.9 12.0
TNFα P1 1.8 0.8 0.3
TNFα D1 2.2 1.0 0.3
TNFα D7 2.3 1.0 0.3

139
Table 3.3b: Median and Inter-quartile ranges (IQR) of e-selectin (ng/ml) in the
uncemented total knee arthroplasty group (n=19)
Percentiles
25th 50th (Median) 75th
E-selectin P1 15.5
24.5 35.1
D1 15.0 26.2 29.1
P1 13.7 23.9 27.1

140
Table 3.4a: Paired sample t-test of tissue plasminogen activator (t-PA) (ng/ml), von
Willebrand factor (vWF) (IU/dl), soluble CD40 ligand (sCD40L) (pg/ml), interleukin 6
(IL6) (pg/ml) and tumour necrosis factor (TNFα) (pg/ml) in the uncemented total
knee arthroplasty group (n=19)
Mean Standard Deviation P value
t-PA P1-D1 -2.8 6.0 0.06
D1-D7 -0.8 7.1 0.65
P1-D7 -3.61 5.31 0.01
vWF P1-D1 -77 71 <0.01
D1-D7 -9 69 0.60
P1-D7 -82 38 <0.01
sCD40L P1-D1 497 2047 0.32
D1-D7 -1480 1973 <0.01
P1-D7 -983 1735 0.03
IL6 P1-D1 -169.0 113.4 <0.01
D1-D7 146.2 139.2 <0.01
P1-D7 -27.8 48.0 0.03
TNFα P1-D1 -0.4 0.8 0.13
D1-D7 -0.1 0.9 0.69
P1-D7 -0.5 0.3 <0.01
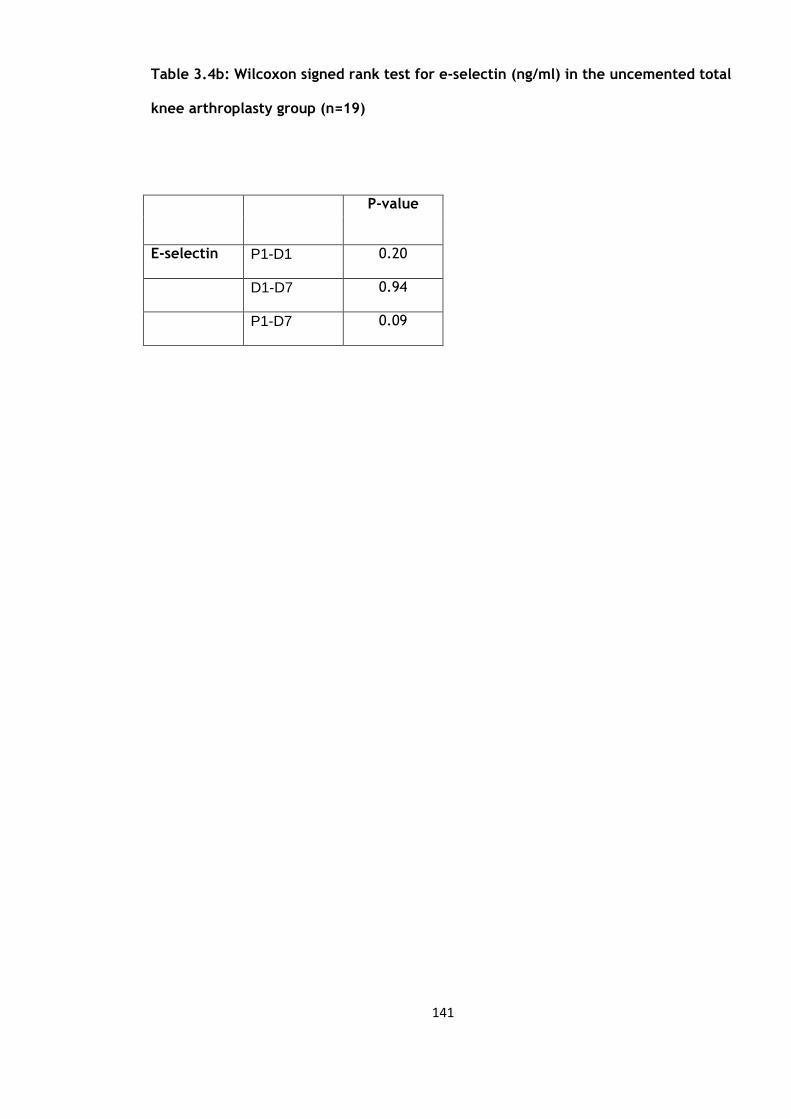
141
Table 3.4b: Wilcoxon signed rank test for e-selectin (ng/ml) in the uncemented total
knee arthroplasty group (n=19)
P-value
E-selectin P1-D1 0.20
D1-D7 0.94
P1-D7 0.09

142
Figure 3.6: Graph of changes in tissue plasminogen activator levels (ng/ml) over the three
time points (mean and standard deviation) in the uncemented total knee arthroplasty group
(n=19)
Figure 3.7: Graph of changes in von Willebrand factor levels (IU/dL) over the three time
points (mean and standard deviation) in the uncemented total knee arthroplasty group
(n=19)

143
Figure 3.8: Graph of changes in soluble CD40 ligand levels (pg/ml) over the three time points
(mean and standard deviation) in the uncemented total knee arthroplasty group (n=19)
Figure 3.9: Graph of changes in soluble interleukin 6 levels (pg/ml) over the three time
points (mean and standard deviation) in the uncemented total knee arthroplasty group
(n=19)
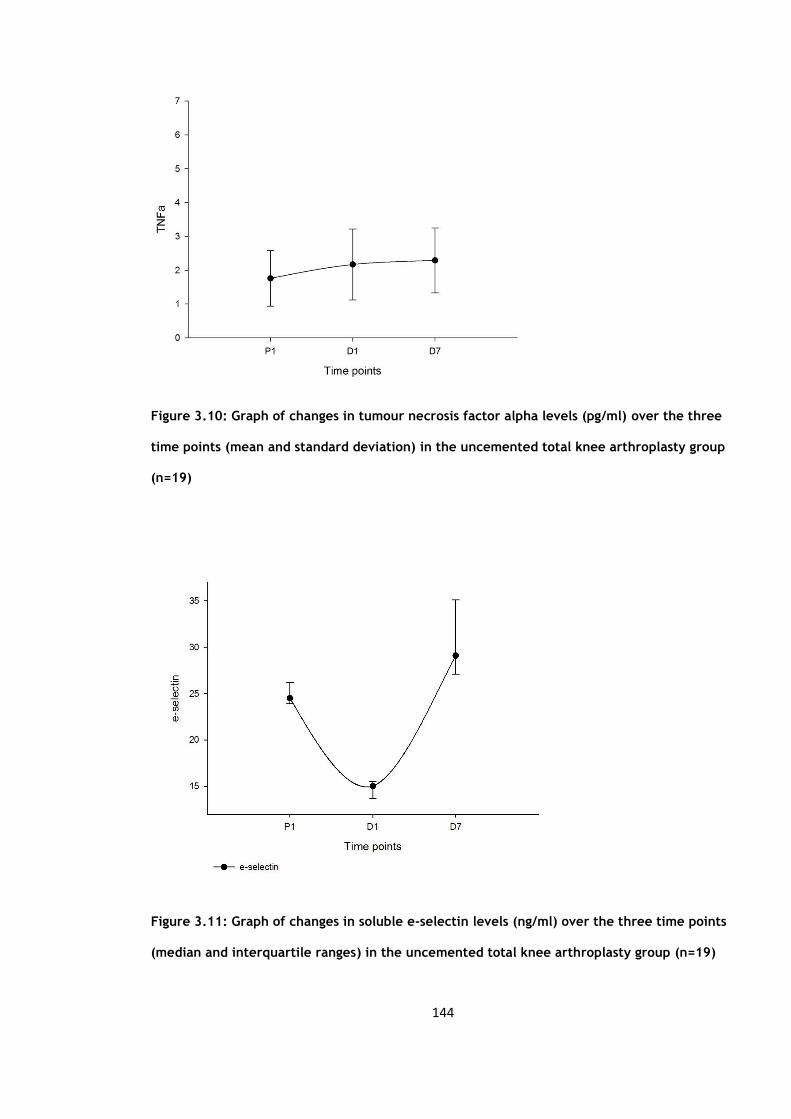
144
Figure 3.10: Graph of changes in tumour necrosis factor alpha levels (pg/ml) over the three
time points (mean and standard deviation) in the uncemented total knee arthroplasty group
(n=19)
Figure 3.11: Graph of changes in soluble e-selectin levels (ng/ml) over the three time points
(median and interquartile ranges) in the uncemented total knee arthroplasty group (n=19)
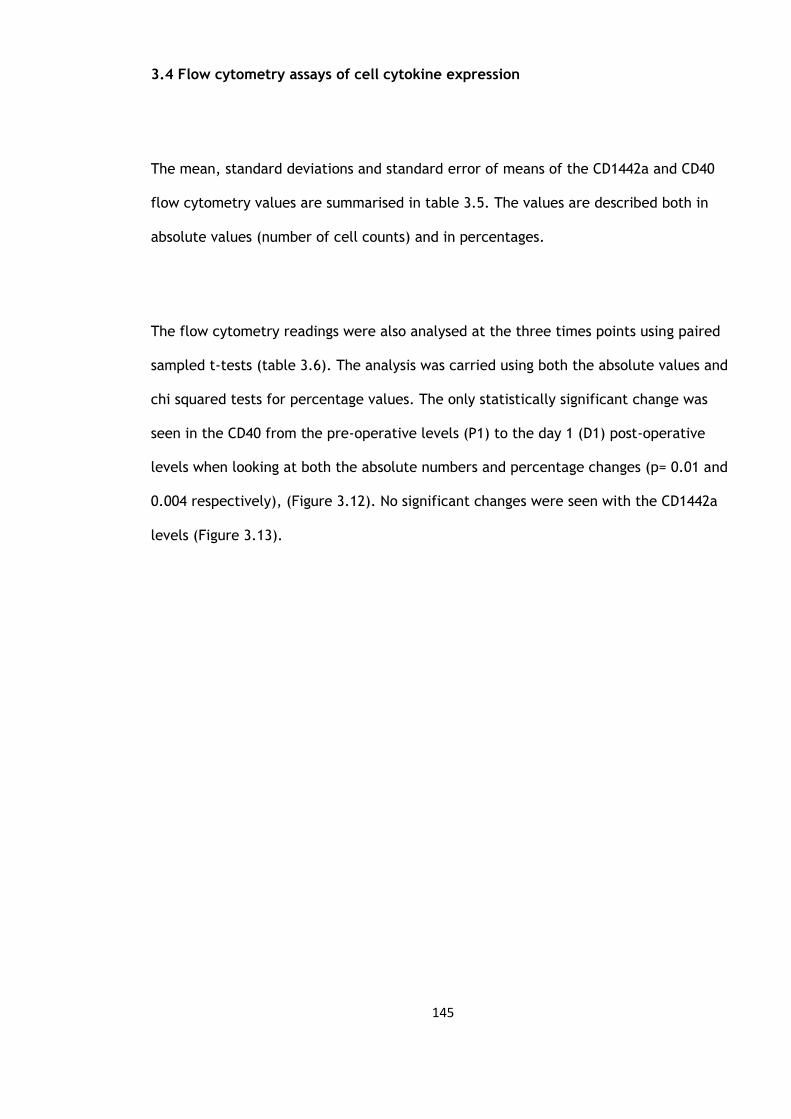
145
3.4 Flow cytometry assays of cell cytokine expression
The mean, standard deviations and standard error of means of the CD1442a and CD40
flow cytometry values are summarised in table 3.5. The values are described both in
absolute values (number of cell counts) and in percentages.
The flow cytometry readings were also analysed at the three times points using paired
sampled t-tests (table 3.6). The analysis was carried using both the absolute values and
chi squared tests for percentage values. The only statistically significant change was
seen in the CD40 from the pre-operative levels (P1) to the day 1 (D1) post-operative
levels when looking at both the absolute numbers and percentage changes (p= 0.01 and
0.004 respectively), (Figure 3.12). No significant changes were seen with the CD1442a
levels (Figure 3.13).
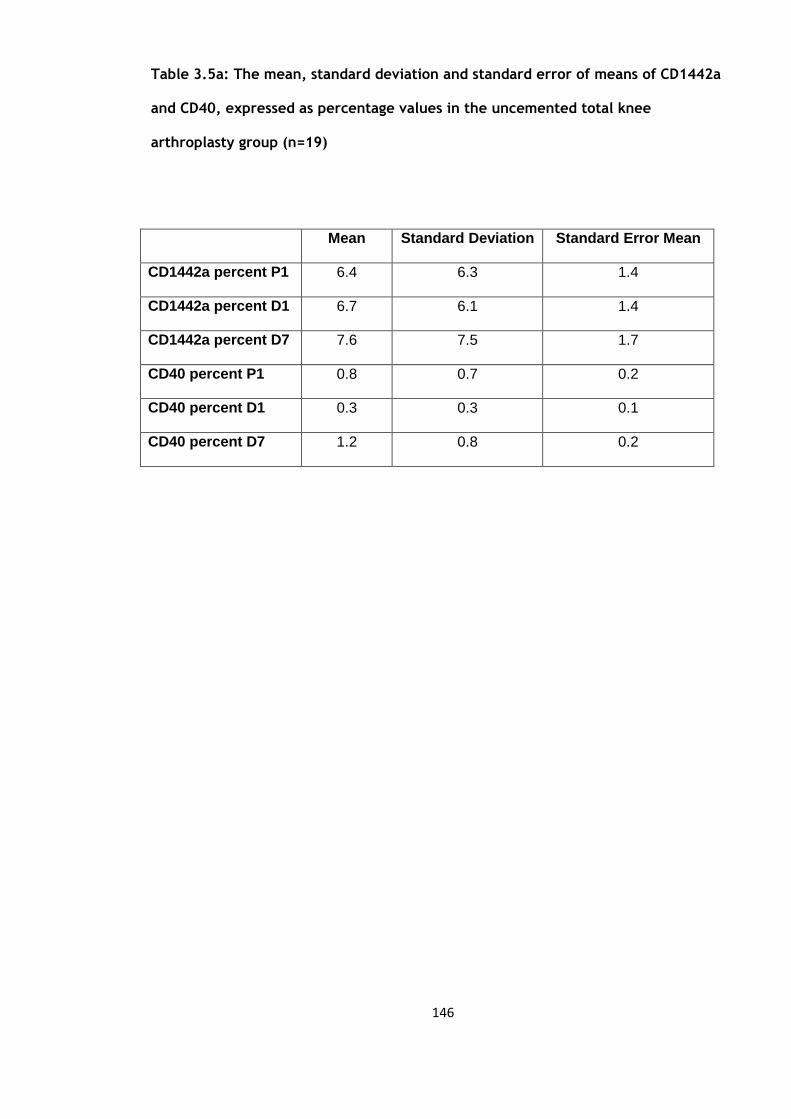
146
Table 3.5a: The mean, standard deviation and standard error of means of CD1442a
and CD40, expressed as percentage values in the uncemented total knee
arthroplasty group (n=19)
Mean Standard Deviation Standard Error Mean
CD1442a percent P1 6.4 6.3 1.4
CD1442a percent D1 6.7 6.1 1.4
CD1442a percent D7 7.6 7.5 1.7
CD40 percent P1 0.8 0.7 0.2
CD40 percent D1 0.3 0.3 0.1
CD40 percent D7 1.2 0.8 0.2

147
Table 3.5b: Median and Inter-quartile ranges (IQR) of CD1442a and CD40, expressed
as absolute values in the uncemented total knee arthroplasty group (n=19)
Percentiles
25th 50th (Median) 75th
CD1442a P1 254 456 1362
D1 185 492 1006
P7 158 352 1250
CD40 P1 20 50 146
D1 10 32 54
P7 62 89 200

148
Table 3.6a: Mean, standard deviation and p values of CD1442a andCD40 (mean and
SD) in the uncemented total knee arthroplasty group (n=19)
Mean Standard deviation P value
CD1442a
percentage
P1-D1 -0.4 3.9 0.67
D1-D7 -0.9 5.6 0.50
P1-D7 -1.2 5.4 0.33
CD40
percentage
P1-D1 0.4 0.5 0.04
D1-D7 -0.8 0.6 <0.01
P1-D7 -0.4 0.7 0.21
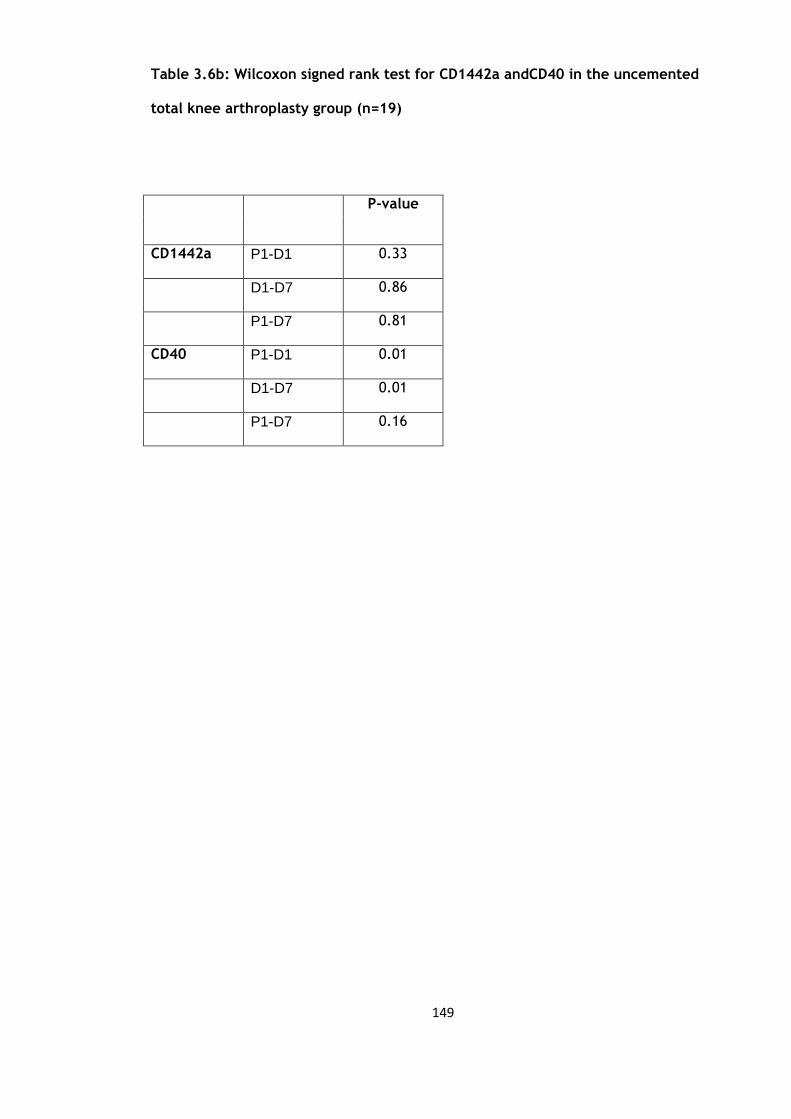
149
Table 3.6b: Wilcoxon signed rank test for CD1442a andCD40 in the uncemented
total knee arthroplasty group (n=19)
P-value
CD1442a P1-D1 0.33
D1-D7 0.86
P1-D7 0.81
CD40 P1-D1 0.01
D1-D7 0.01
P1-D7 0.16

150
Figure 3.12: Graph of changes in CD40 counts over the three time points (median and
interquartile ranges) in the uncemented total knee arthroplasty group (n=19)
Figure 3.13: Graph of changes in CD1442a counts over the three time points (median and
interquartile ranges) in the uncemented total knee arthroplasty group (n=19)

151
3.5 Discussion
The transient rise in the white cell count, neutrophils, monocytes and platelets supports
the existing literature on the acute phase response following surgery (226).
The CRP levels responded mainly in the first 24 hours and even at 7 days remained
significantly risen reflecting the ongoing surgical stimulus. This may be predominantly
due to the continued high levels of IL6 which remained significantly elevated throughout
the 7 days reflecting the ongoing inflammatory process. The IL6 levels reflect the
degree of surgical trauma (40) and in most instances the secretion of IL6 is brief and
self-limiting lasting from 48-72 hours (41) but this demonstrates that the stimulus of the
surgical trauma continues at least up to 7 days post-operatively.
Following the surgical trauma to the tissues and vessels the vascular endothelium
becomes procoagulant with the release of several factors including vWF. In response to
the thrombus formation t-PA is released from the endothelium (127) and our results
reflect this with significant levels of both vWF and t-PA in the first 24 hours with levels
remaining significantly elevated to at least 7 days.
The TNFα levels are significant at day 7 possibly reflecting the ongoing inflammatory
response and its role in initiating the cytokine cascade, increasing vascular permeability
and in recruiting macrophages and neutrophils. The e-selectin levels did not
demonstrate a significant change in this study.

152
The CD40 expression showed a significant change from the pre-operative levels up to
day 7 post-operatively. This reflects the release from the endothelium in the vessels
within the inflamed tissue in the operative field (84).But the CD1442a changes remained
insignificant.
It is not possible to compare these results to the current literature as there has not
been a study to date to allow a direct comparison. There have been several studies that
have looked at the CRP and IL6 response following trauma (41;227) but these have been
in heterogeneous groups comprising of general surgical as well as orthopaedic cases and
the orthopaedics cases included trauma as well other elective cases such as ankle
fixation and total hip replacements. This study does show a significant rise in the TNFα
levels at day 7, the current literature has demonstrated that no significant changes
occur but these studies were only carried out on those undergoing a total hip
replacement (213;214).
No comparison is possible in terms of the CD40 and CD1442a changes as no study has
specifically looked at these following either total hip or total knee replacement.

153
CHAPTER 4
The effect of elective cemented total knee
arthroplasty on the activation of markers of
inflammation, endothelium and coagulation

154
4.1 Subject characteristics
There were 20 patients recruited into this study, one patient was subsequently excluded
due to a deep vein thrombosis confirmed on ultrasound leaving 19 patients in this
cohort. The patient was excluded as the deep vein thrombosis would have contributed
to the inflammatory response. The mean body mass index (BMI) was 30.5kg/m2,
standard deviation 5.2. There were 6 males (mean age 60.3 years, standard deviation
12.74) and 13 females (mean age 70.7 years, standard deviation 8.57). A total of 9 total
knee arthroplasties were carried out on the left and 10 on the right. None of these
characteristics was significantly different from the uncemented group in Chapter 3.
4.2 Blood cell counts and CRP
The mean values and standard deviations and standard error of mean of white cell
count (WCC), neutrophils (Neutro), monocytes (Mono) and C-reactive protein (CRP) are
summarised in table 4.1.
Each of these variables were compared over three time periods, from pre-operative
values to day 1 post-operation (P1-D1), from day 1 to day 7 post-operation (D1-D7) and
from pre-operative to day 7 post-operation (P1-D7), the results of which are
summarised in table 4.2. The paired sample t-tests revealed a significant decrease then
increase for the platelet count (Figure 4.1) and a significant increase then decrease for
the white cell count (Figure 4.2). Neutrophils (Figure 4.3), monocytes (Figure 4.4) and

155
C-reactive protein (CRP) levels (Figure 4.5) showed a significant rise in the first 24 hour
period and remained significantly elevated at day 7.
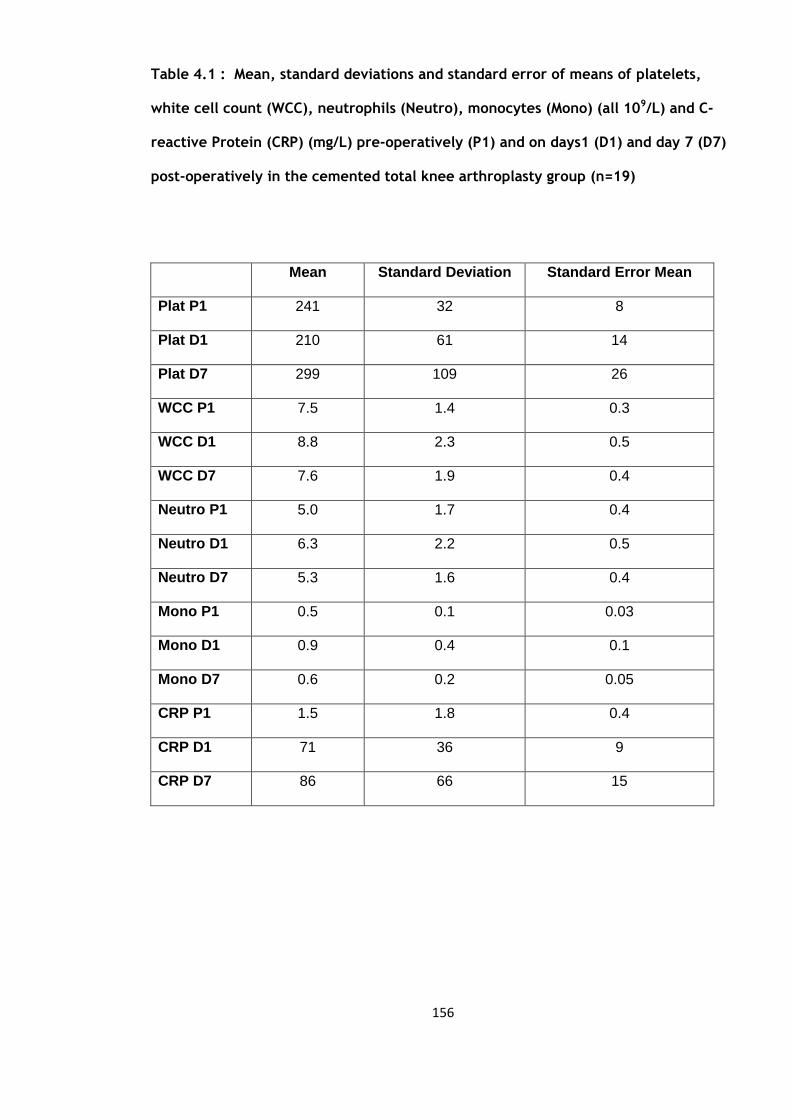
156
Table 4.1 : Mean, standard deviations and standard error of means of platelets,
white cell count (WCC), neutrophils (Neutro), monocytes (Mono) (all 109/L) and C-
reactive Protein (CRP) (mg/L) pre-operatively (P1) and on days1 (D1) and day 7 (D7)
post-operatively in the cemented total knee arthroplasty group (n=19)
Mean Standard Deviation Standard Error Mean
Plat P1 241 32 8
Plat D1 210 61 14
Plat D7 299 109 26
WCC P1 7.5 1.4 0.3
WCC D1 8.8 2.3 0.5
WCC D7 7.6 1.9 0.4
Neutro P1 5.0 1.7 0.4
Neutro D1 6.3 2.2 0.5
Neutro D7 5.3 1.6 0.4
Mono P1 0.5 0.1 0.03
Mono D1 0.9 0.4 0.1
Mono D7 0.6 0.2 0.05
CRP P1 1.5 1.8 0.4
CRP D1 71 36 9
CRP D7 86 66 15
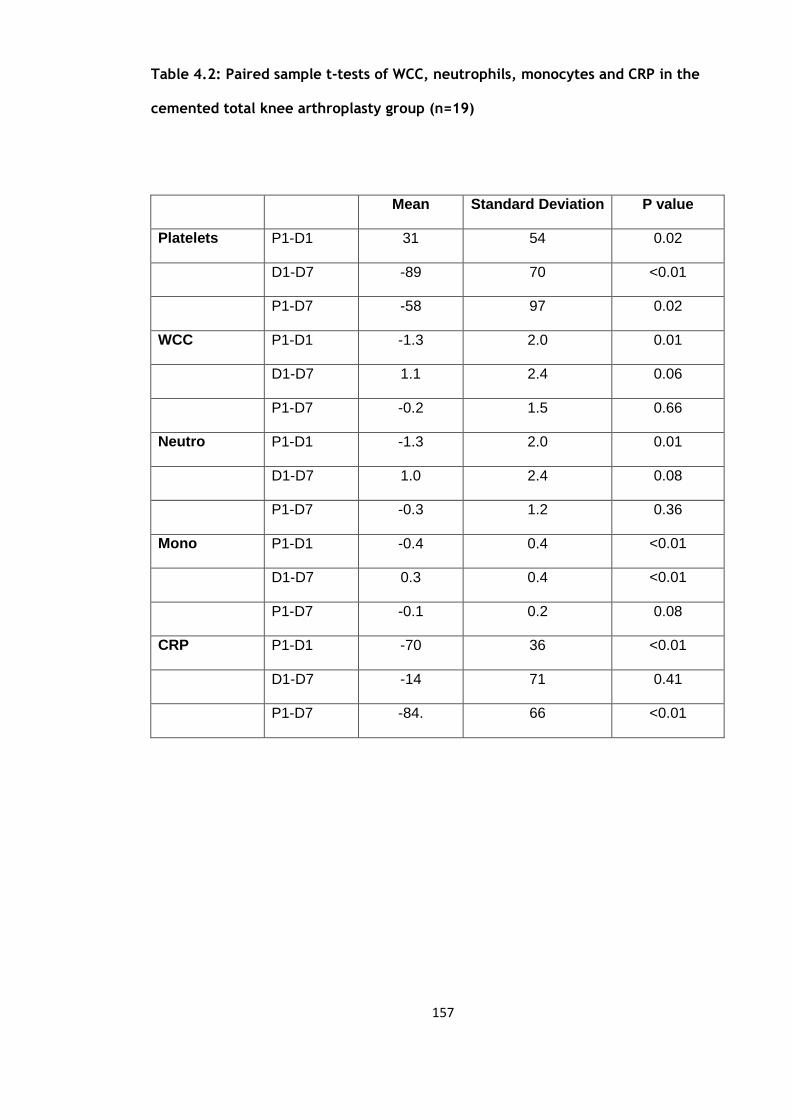
157
Table 4.2: Paired sample t-tests of WCC, neutrophils, monocytes and CRP in the
cemented total knee arthroplasty group (n=19)
Mean Standard Deviation P value
Platelets P1-D1 31 54 0.02
D1-D7 -89 70 <0.01
P1-D7 -58 97 0.02
WCC P1-D1 -1.3 2.0 0.01
D1-D7 1.1 2.4 0.06
P1-D7 -0.2 1.5 0.66
Neutro P1-D1 -1.3 2.0 0.01
D1-D7 1.0 2.4 0.08
P1-D7 -0.3 1.2 0.36
Mono P1-D1 -0.4 0.4 <0.01
D1-D7 0.3 0.4 <0.01
P1-D7 -0.1 0.2 0.08
CRP P1-D1 -70
36 <0.01
D1-D7 -14 71 0.41
P1-D7 -84. 66 <0.01
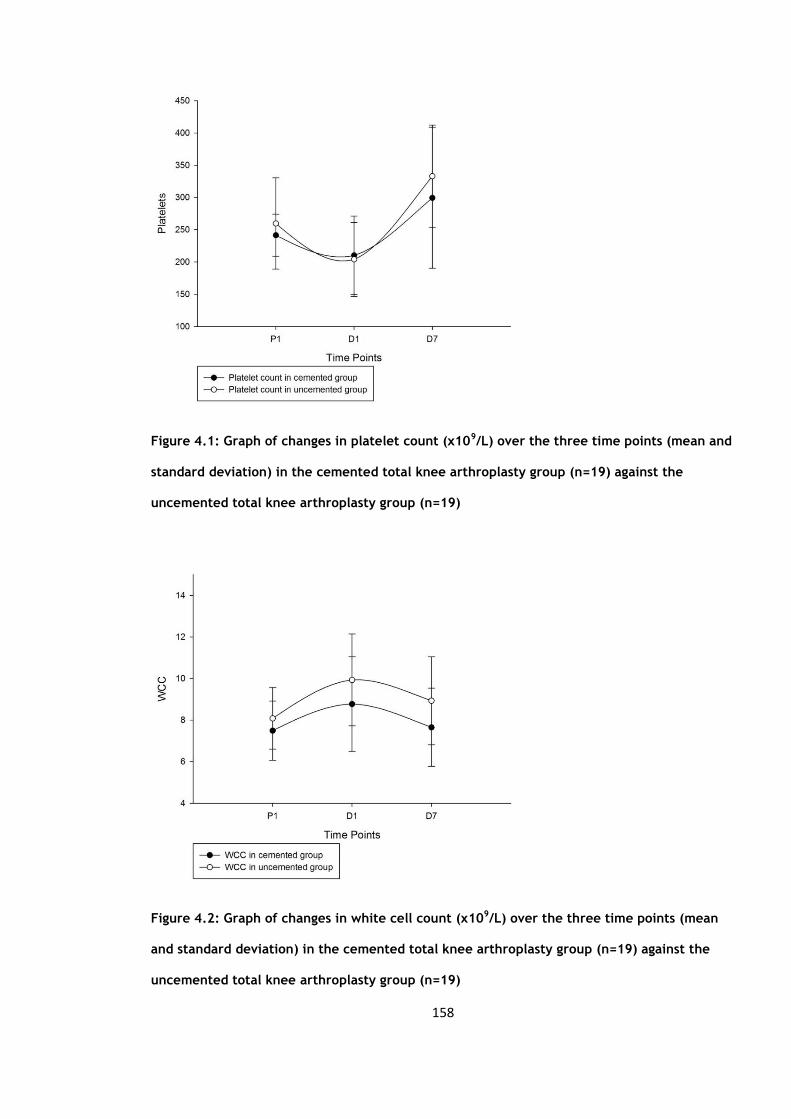
158
Figure 4.1: Graph of changes in platelet count (x109/L) over the three time points (mean and
standard deviation) in the cemented total knee arthroplasty group (n=19) against the
uncemented total knee arthroplasty group (n=19)
Figure 4.2: Graph of changes in white cell count (x109/L) over the three time points (mean
and standard deviation) in the cemented total knee arthroplasty group (n=19) against the
uncemented total knee arthroplasty group (n=19)
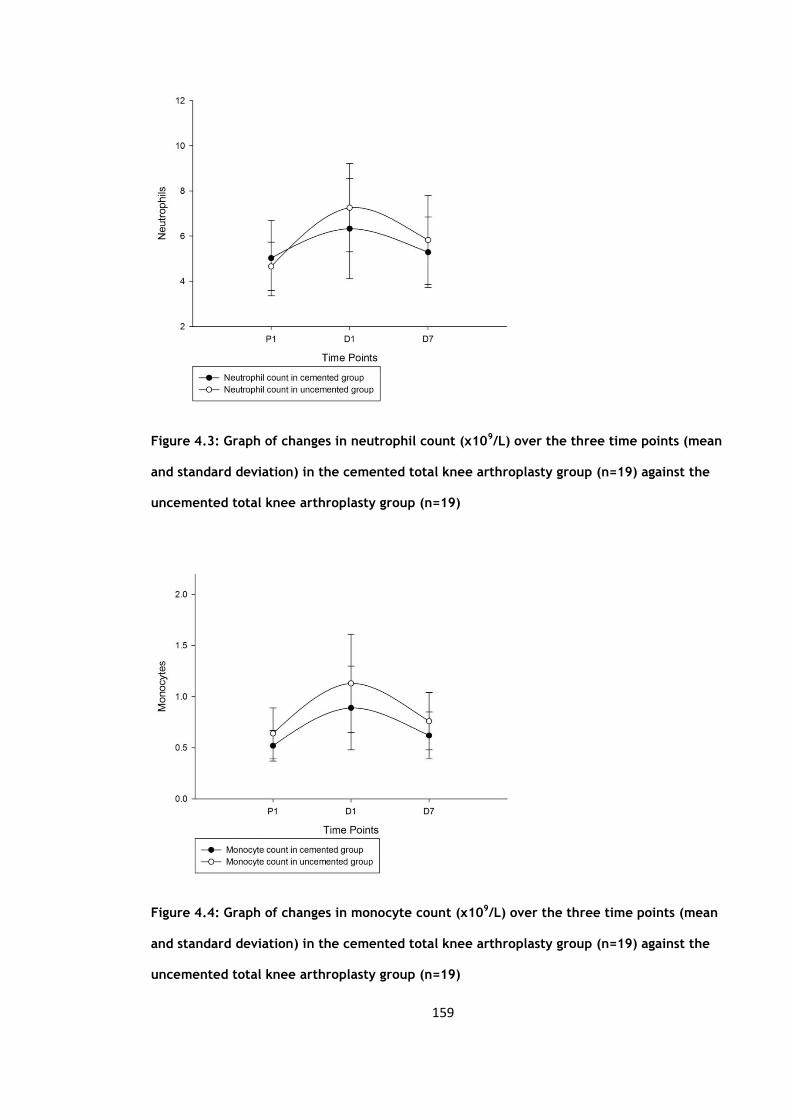
159
Figure 4.3: Graph of changes in neutrophil count (x109/L) over the three time points (mean
and standard deviation) in the cemented total knee arthroplasty group (n=19) against the
uncemented total knee arthroplasty group (n=19)
Figure 4.4: Graph of changes in monocyte count (x109/L) over the three time points (mean
and standard deviation) in the cemented total knee arthroplasty group (n=19) against the
uncemented total knee arthroplasty group (n=19)
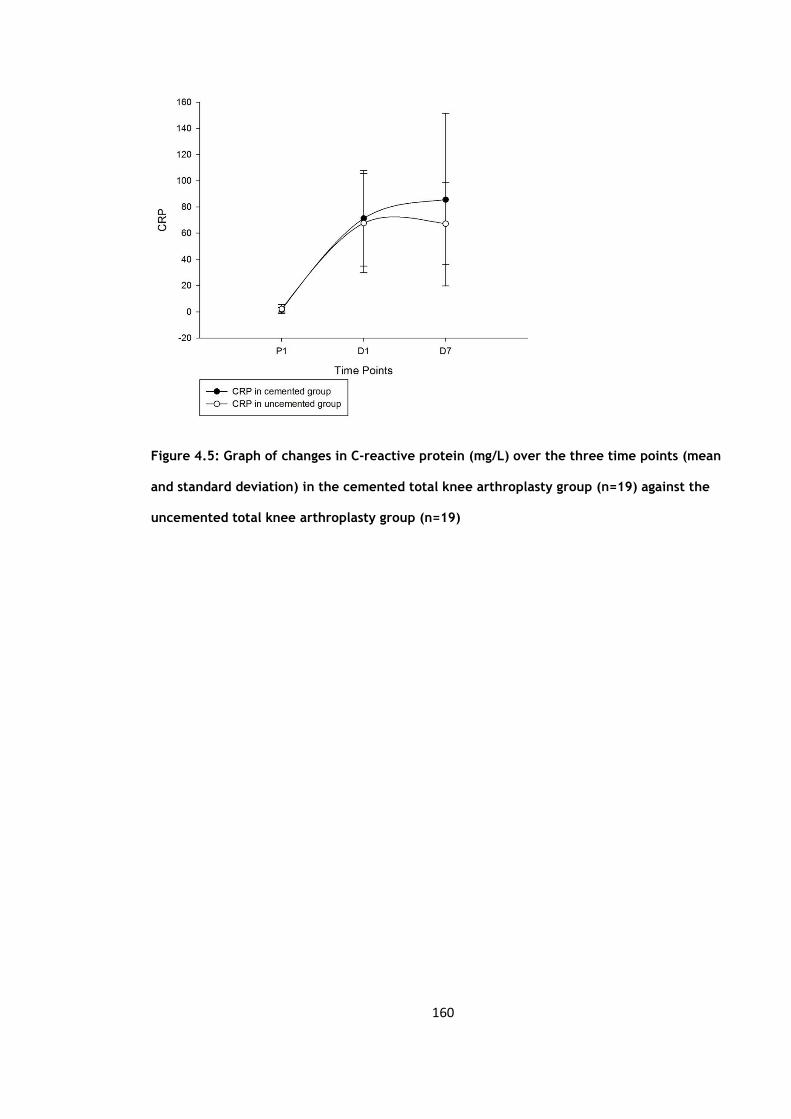
160
Figure 4.5: Graph of changes in C-reactive protein (mg/L) over the three time points (mean
and standard deviation) in the cemented total knee arthroplasty group (n=19) against the
uncemented total knee arthroplasty group (n=19)

161
4.3 Circulating activation markers
The mean, standard deviations and standard error of means of tissue plasminogen
activator (t-PA), von Willebrand factor (vWF), soluble CD40 ligand (sCD40L), interleukin
6 (IL6), tumour necrosis factor (TNFα) and e-selectin are summarised in table 4.3.
Each variable was then compared over the three time points (Table 4.4). The t-PA levels
showed a non-significant rise initially but did become significant at day 7 post-
operatively (p=0.04) (Figure 4.6). The vWF levels showed similar changes becoming
significant after 24 hours and remaining so at day 7 (<0.01) (Figure 4.7). The sCD40L
levels were significantly lower by 24 hours and remained so at day 7 (Figure 4.8). The
IL- 6 levels rose and fell significantly (Figure 4.9). TNFα levels did not initially show a
significant rise but by day 7 their levels had significantly risen compared to the pre-
operative (Figure 4.10). E-selectin levels fell significantly by day 7 (Figure 4.11).

162
Table 4.3a: Mean, standard deviations and standard error of means of tissue
plasminogen activator (t-PA) (ng/ml), von Willebrand factor (vWF) (IU/dl), soluble
CD40 ligand (sCD40L) (pg/ml), interleukin 6 (IL6) (pg/ml) and tumour necrosis factor
(TNFα) in the cemented total knee arthroplasty group (n=19)
Mean Standard Deviation Standard Error Mean
t-PA P1 12.3 2.4 0.7
t-PA D1 14.8 5.9 1.9
t-PA D7 17.4 6.9 2.1
vWF P1 153 72 19
vWF D1 187 68 18
vWF D7 233 60 15
sCD40L P1 4243 2594 693
sCD40L D1 3052 2366 632
sCD40L D7 4638 2076 536
IL6 P1 4.5 2.3 0.6
IL6 D1 189.2 160.1 41.3
IL6 D7 61.3 80.0 20.0
TNFα P1 2.7 0.7 0.3
TNFα D1 3.5 1.3 0.6
TNFα D7 3.7 1.0 0.5

163
Table 4.3b: Median and Inter-quartile ranges (IQR) of e-selectin (ng/ml) in the
cemented total knee arthroplasty group (n=19)
Percentiles
25th 50th (Median) 75th
E-selectin P1 23.8 35.8 46.5
D1 21.3 30.3 35.3
P1 23.88 30.3 34.3
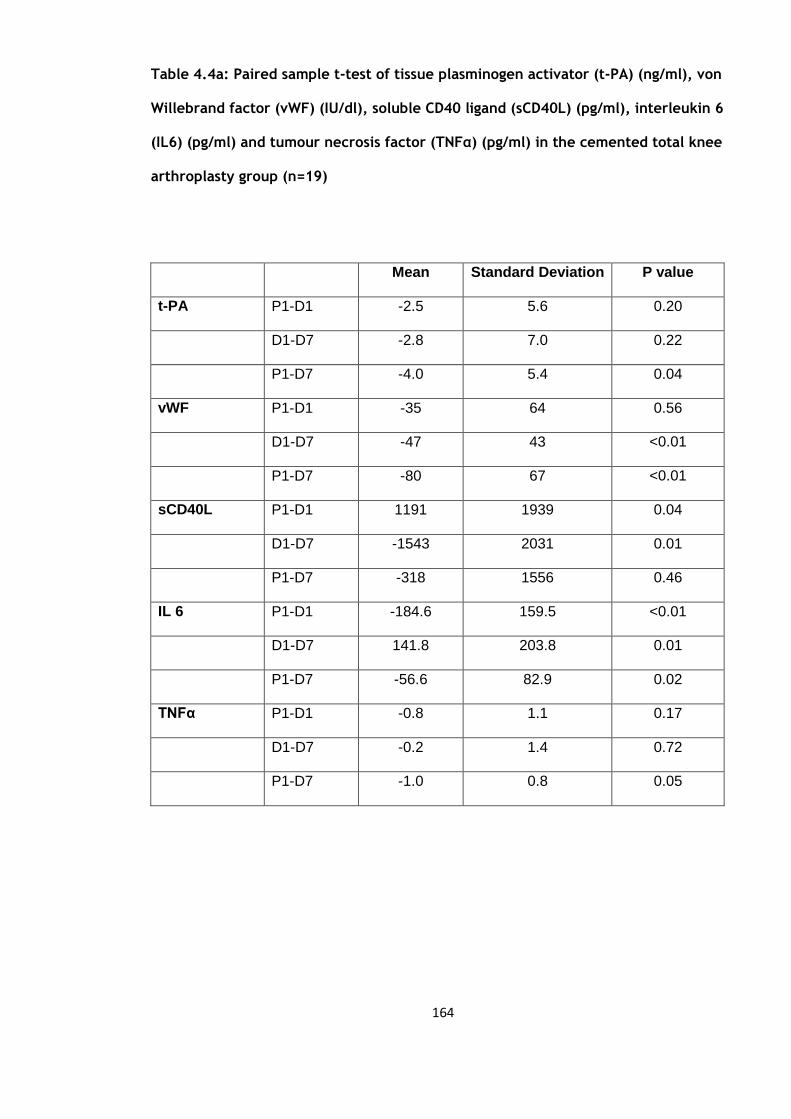
164
Table 4.4a: Paired sample t-test of tissue plasminogen activator (t-PA) (ng/ml), von
Willebrand factor (vWF) (IU/dl), soluble CD40 ligand (sCD40L) (pg/ml), interleukin 6
(IL6) (pg/ml) and tumour necrosis factor (TNFα) (pg/ml) in the cemented total knee
arthroplasty group (n=19)
Mean Standard Deviation P value
t-PA P1-D1 -2.5 5.6 0.20
D1-D7 -2.8 7.0 0.22
P1-D7 -4.0 5.4 0.04
vWF P1-D1 -35 64 0.56
D1-D7 -47 43 <0.01
P1-D7 -80 67 <0.01
sCD40L P1-D1 1191 1939 0.04
D1-D7 -1543 2031 0.01
P1-D7 -318 1556 0.46
IL 6 P1-D1 -184.6 159.5 <0.01
D1-D7 141.8 203.8 0.01
P1-D7 -56.6 82.9 0.02
TNFα P1-D1 -0.8 1.1 0.17
D1-D7 -0.2 1.4 0.72
P1-D7 -1.0 0.8 0.05

165
Table 4.4b: Wilcoxon signed rank test for e-selectin (ng/ml) in the cemented total
knee arthroplasty group (n=19)
P-value
E-selectin P1-D1 0.42
D1-D7 0.80
P1-D7 0.18

166
Figure 4.6: Graph of changes in tissue plasminogen activator levels (ng/ml) over the three
time points (mean and standard deviation) in the cemented total knee arthroplasty group
(n=19) against the uncemented total knee arthroplasty group (n=19)
Figure 4.7: Graph of changes in von Willebrand Factor (vWF) (IU/dl) over the three time
points (mean and standard deviation) in the cemented total knee arthroplasty group (n=19)
against the uncemented total knee arthroplasty group (n=19)

167
Figure 4.8: Graph of changes in soluble CD40 ligand levels (pg/ml) over the three time points
(mean and standard deviation) in the cemented total knee arthroplasty group (n=19) against
the uncemented total knee arthroplasty group (n=19)
Figure 4.9: Graph of changes in interleukin 6 levels (pg/ml) over the three time points (mean
and standard deviation) in the cemented total knee arthroplasty group (n=19) against the
uncemented total knee arthroplasty group (n=19)
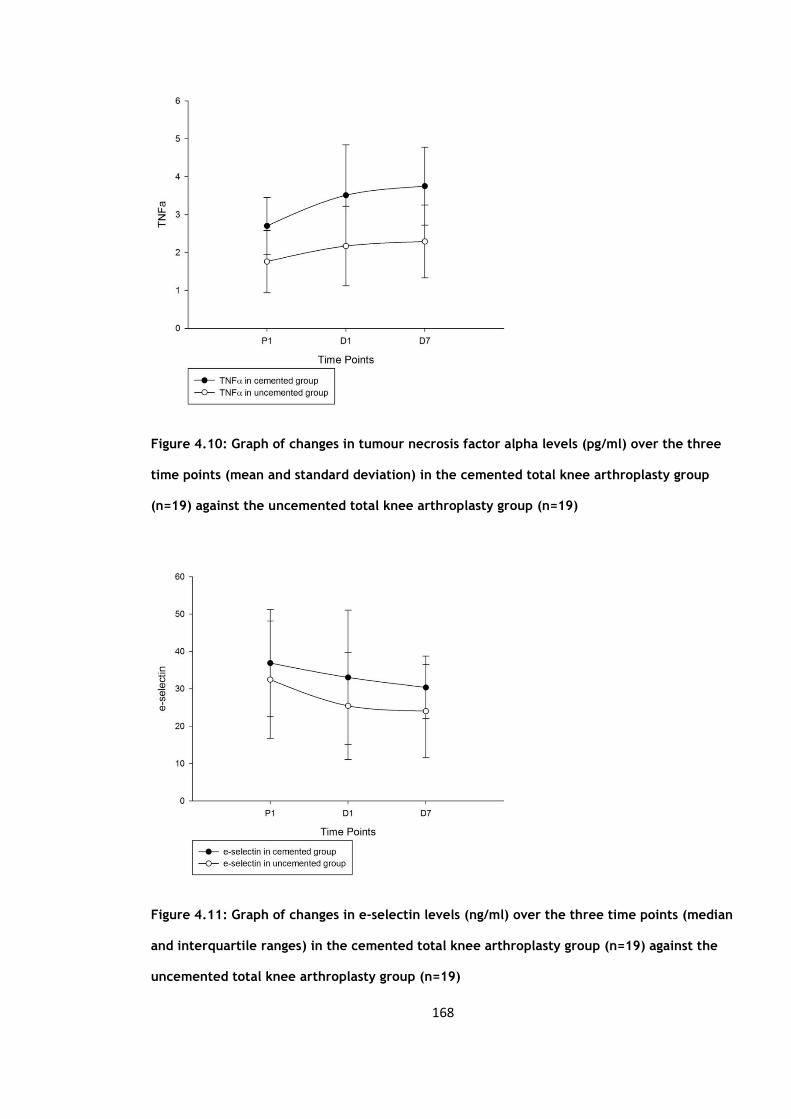
168
Figure 4.10: Graph of changes in tumour necrosis factor alpha levels (pg/ml) over the three
time points (mean and standard deviation) in the cemented total knee arthroplasty group
(n=19) against the uncemented total knee arthroplasty group (n=19)
Figure 4.11: Graph of changes in e-selectin levels (ng/ml) over the three time points (median
and interquartile ranges) in the cemented total knee arthroplasty group (n=19) against the
uncemented total knee arthroplasty group (n=19)
169
4.4 Flow cytometry assays of cell cytokine expression
The mean, standard deviations and standard error of means of the CD1442a and CD40
flow cytometry values are summarised in table 4.5. The values are described both in
absolute values (cell count) and in percentages. The flow results were then analysed to
look at changes between the three time points, the results of which are summarised in
table 4.6.
The CD1442a counts showed a statistically significant fall in the first 24 hours (p=0.022),
then rose by day 7 which is also statistically significant at day 7 and also when
compared to the pre-operative levels (p=0.006 and 0.025 respectively) (Figure 4.12).
These changes are also mirrored when we look at the percentage changes. The CD40
counts on the other hand showed a significant change from pre-operative to day 1 and
from day 1 to day 7, for the absolute values (p=0.01 and 0.04) and the percentage
values showed a significant change from day 1 to day 7 only (p=0.027) (Figure 4.13).
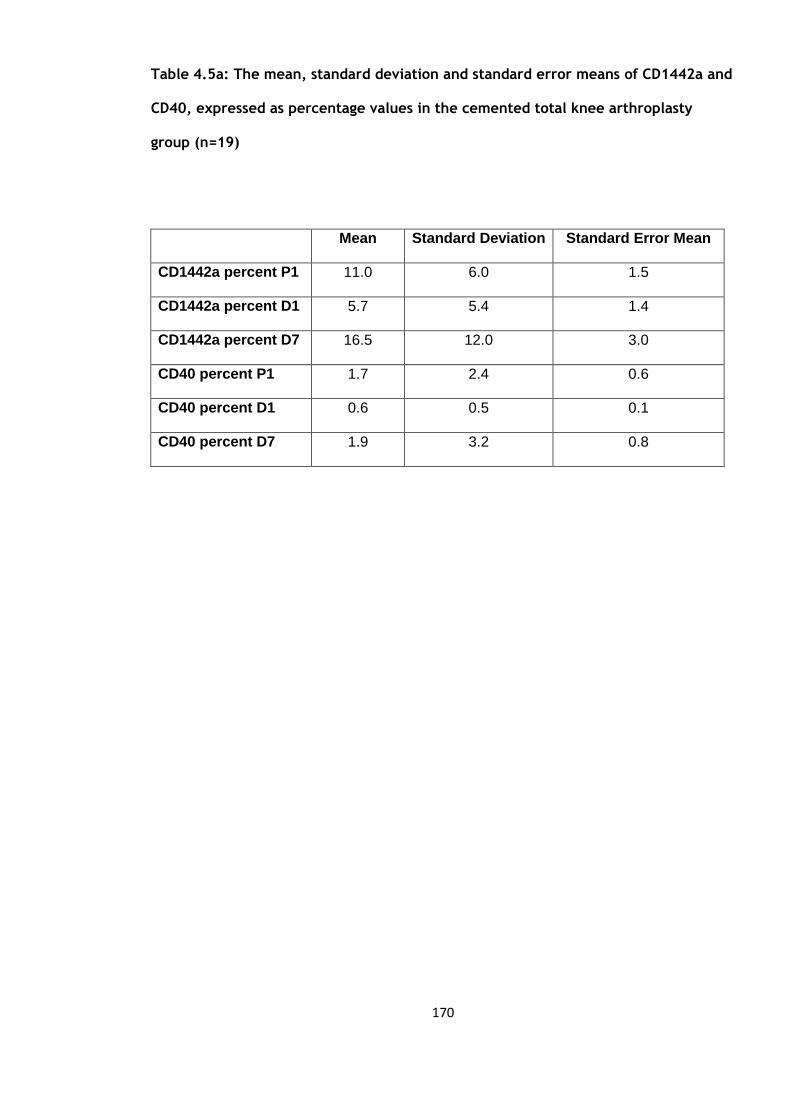
170
Table 4.5a: The mean, standard deviation and standard error means of CD1442a and
CD40, expressed as percentage values in the cemented total knee arthroplasty
group (n=19)
Mean Standard Deviation Standard Error Mean
CD1442a percent P1 11.0 6.0 1.5
CD1442a percent D1 5.7 5.4 1.4
CD1442a percent D7 16.5 12.0 3.0
CD40 percent P1 1.7 2.4 0.6
CD40 percent D1 0.6 0.5 0.1
CD40 percent D7 1.9
3.2 0.8
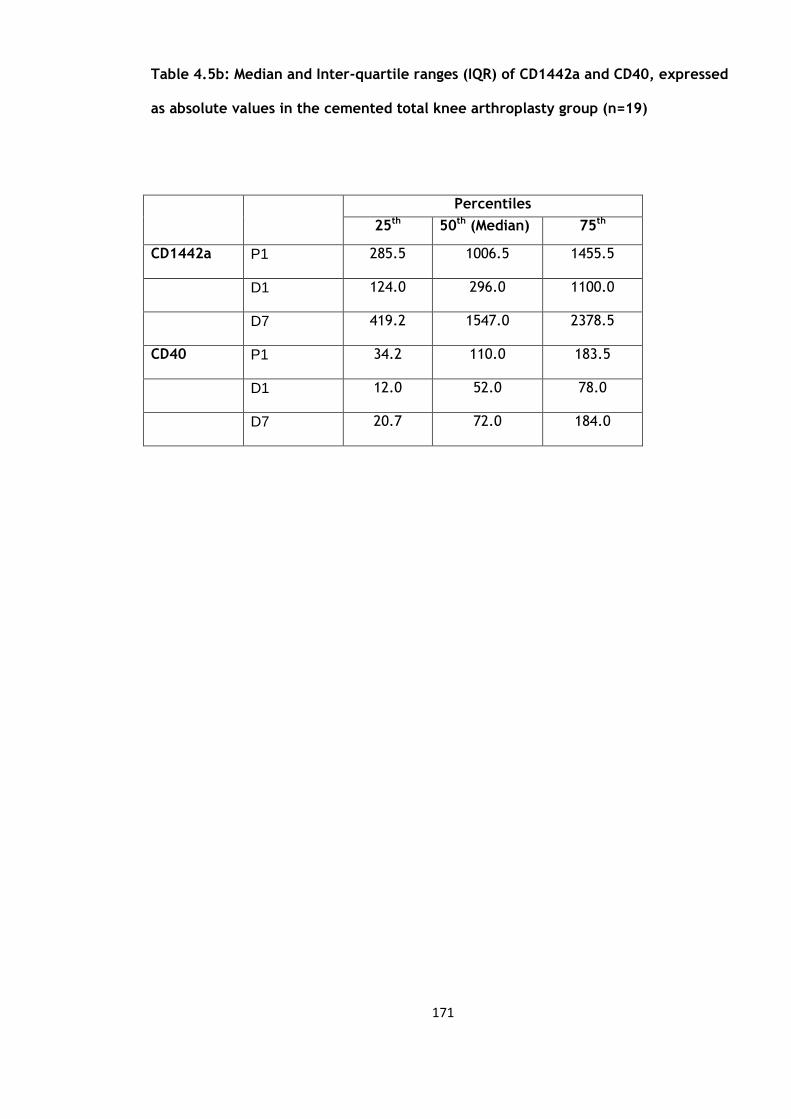
171
Table 4.5b: Median and Inter-quartile ranges (IQR) of CD1442a and CD40, expressed
as absolute values in the cemented total knee arthroplasty group (n=19)
Percentiles
25th 50th (Median) 75th
CD1442a P1 285.5 1006.5 1455.5
D1 124.0 296.0 1100.0
D7 419.2 1547.0 2378.5
CD40 P1 34.2 110.0 183.5
D1 12.0 52.0 78.0
D7 20.7 72.0 184.0

172
Table 4.6a: Mean, standard deviation and p values of CD1442a and CD40 expressed
as percentage values in the cemented total knee arthroplasty group (n=19)
Mean Standard deviation P value
CD1442a
percentage
P1-D1 5.3 6.0 <0.01
D1-D7 -11.1 13.0 <0.01
P1-D7 -5.6 10.3 0.04
CD40
percentage
P1-D1 1.1 2.4 0.09
D1-D7 -1.3 3.1 0.10
P1-D7 -0.8 2.9 0.26

173
Table 4.6b: Wilcoxon signed rank test for CD1442a andCD40 absolute values in the
cemented total knee arthroplasty group (n=19)
P-value
CD1442a P1-D1 0.02
D1-D7 0.01
P1-D7 0.01
CD40 P1-D1 0.01
D1-D7 0.04
P1-D7 0.74
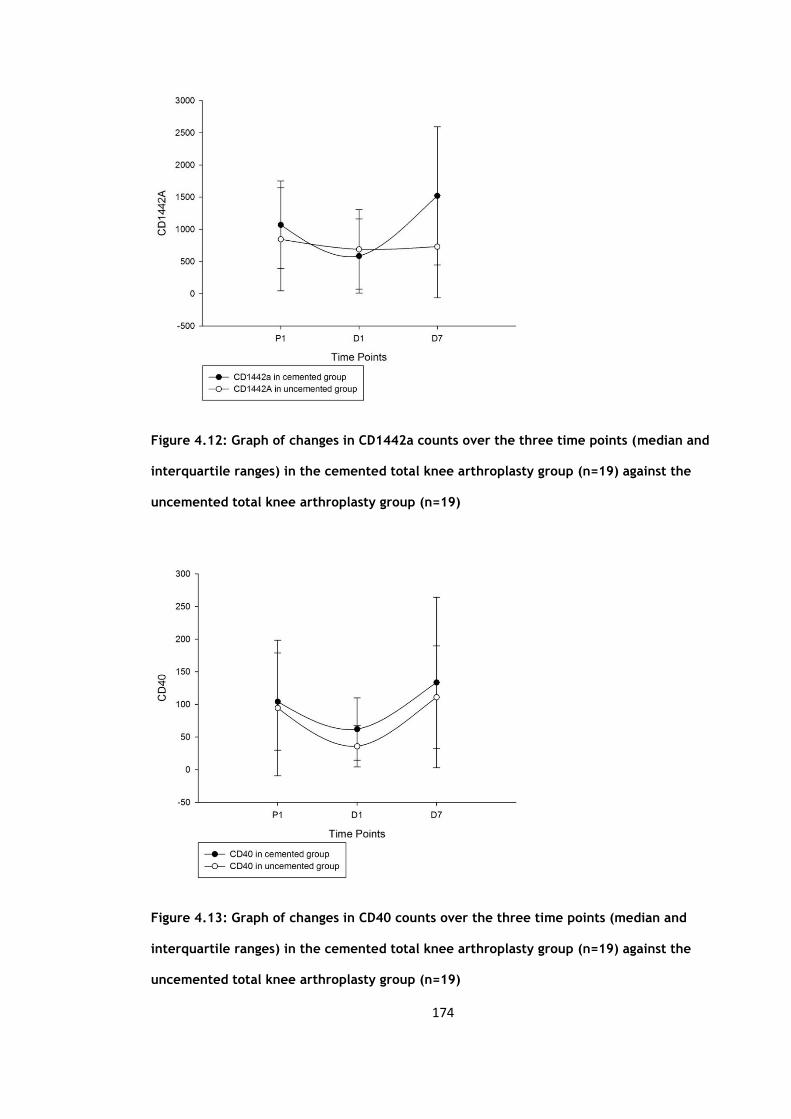
174
Figure 4.12: Graph of changes in CD1442a counts over the three time points (median and
interquartile ranges) in the cemented total knee arthroplasty group (n=19) against the
uncemented total knee arthroplasty group (n=19)
Figure 4.13: Graph of changes in CD40 counts over the three time points (median and
interquartile ranges) in the cemented total knee arthroplasty group (n=19) against the
uncemented total knee arthroplasty group (n=19)
175
4.5 Comparison of cemented versus uncemented groups
The groups were compared using independent sample t-test to look for significant
differences in the inflammatory and endothelial response with the additional use of
cement (polymethylmethacrylate). Table 4.7 below summarises the results.
There was a statistically significant difference in the platelets response between the
cemented and uncemented groups with respect to the time period between day 1 and
day 7 (D1-D7) (p=0.05). From the table 4.7 we see that for the period from day 1 to day
7 there is less of a rise in the platelet levels in the cemented group. There is also a
similar difference in the neutrophil levels which rose less in the cemented group (Figure
4.3). There was also no statistical difference between the two groups with respect to
the changes in the white cell count. There was no difference with regards to the
monocytes and C-reactive protein changes between the two groups.
Table 4.8 (below) is a summary of the results when we compare the tissue plasminogen
activator (t-PA), von Willebrand factor (vWF), soluble CD40 ligand (sCD40L), interleukin
6 (IL6), tumour necrosis factor alpha (TNFα) and e-selectin levels.
None of the variables demonstrated a statistically significant difference between the
cemented and uncemented groups.
Comparing the flow cytometry counts between the two groups (Table 4.9) showed a
significant difference in the CD1442a levels both for the absolute values and percentage

176
changes from day 1 to day 7 (D1-D7) (p=0.03 and 0.02 respectively) (Figure 4.12). There
were also significant differences in the first 24 hours (P1-D1) when we look at the
percentage changes (<0.01). There was no significant difference between the two
groups for the CD40 levels.
The only parameter which demonstrated a more significant change in the cemented
group compared to that of the uncemented group was that of the CD1442a levels. This
showed a more statistically significant change not only in the first 24 hours but also in
the period between day 1 to day 7 (<0.01 and p=0.02 respectively).
We can therefore conclude from these results that the use of bone cement does cause a
statistically significant rise in CD1442a levels in this group of patients which occurs in
the first 24 hours and continues to at least day 7 post-operatively. The exact relevance
is not clear as the actual role played by CD1442a is not well understood and is thought
to reflect the inflammatory and thrombotic processes or in fact contribute directly to
the ongoing atherothrombogenesis (101).

177
Table 4.7: Mean difference, standard error difference and significance of blood
parameters between the cemented total knee arthroplasty group (n=19) and
uncemented total knee arthroplasty group (n=19)
Mean difference Standard error difference P value
Platelets P1-D1 -24 15 0.11
D1-D7 40 20 0.05
P1-D7 15 25 0.55
White Cell
Count
P1-D1 0.6 0.6 0.39
D1-D7 0.6 0.7 0.93
P1-D7 1.1 0.6 0.09
Neutrophils P1-D1 1.3 0.6 0.48
D1-D7 -0.4 0.7 0.54
P1-D7 1.1 0.5 0.03
Monocytes P1-D1 0.1 0.1 0.40
D1-D7 -0.8 0.1 0.55
P1-D7 0.1 0.1 0.76
C-reactive
protein
P1-D1 -4 12. 0.71
D1-D7 -15 20 0.47
P1-D7 -19 17 0.25
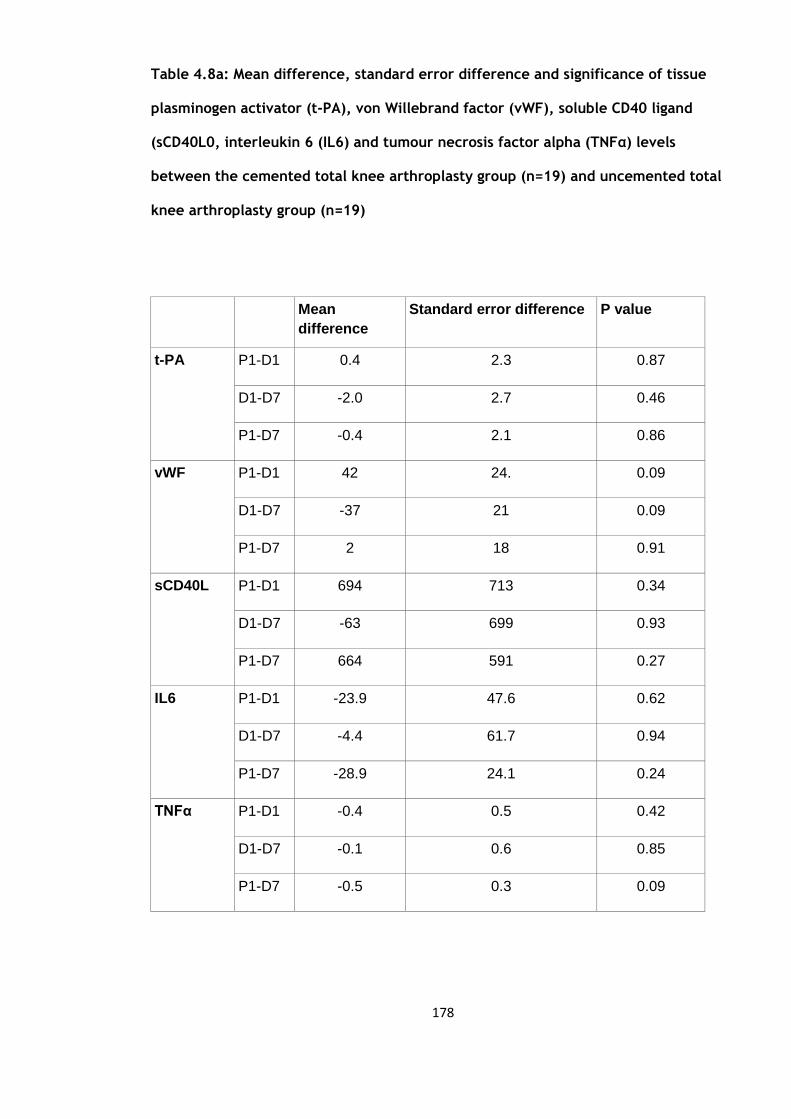
178
Table 4.8a: Mean difference, standard error difference and significance of tissue
plasminogen activator (t-PA), von Willebrand factor (vWF), soluble CD40 ligand
(sCD40L0, interleukin 6 (IL6) and tumour necrosis factor alpha (TNFα) levels
between the cemented total knee arthroplasty group (n=19) and uncemented total
knee arthroplasty group (n=19)
Mean
difference
Standard error difference P value
t-PA P1-D1 0.4 2.3 0.87
D1-D7 -2.0 2.7 0.46
P1-D7 -0.4 2.1 0.86
vWF P1-D1 42 24. 0.09
D1-D7 -37 21 0.09
P1-D7 2 18 0.91
sCD40L P1-D1 694 713 0.34
D1-D7 -63 699 0.93
P1-D7 664 591 0.27
IL6 P1-D1 -23.9 47.6 0.62
D1-D7 -4.4 61.7 0.94
P1-D7 -28.9 24.1 0.24
TNFα P1-D1 -0.4 0.5 0.42
D1-D7 -0.1 0.6 0.85
P1-D7 -0.5 0.3 0.09

179
Table 4.8b: Mann-Whitney U test for e-selectin (ng/ml) between the cemented total
knee arthroplasty group (n=19) and uncemented total knee arthroplasty group
(n=19)
Percentiles
P-value
25th
50th (Median)
(Median
75th
E-selectin P1-D1 -6.3 -4.3 1.5 0.84
D1-D7 -3.4 0.1 3.6 0.82
P1-D7 -9.9 -2.7 1.9 0.84
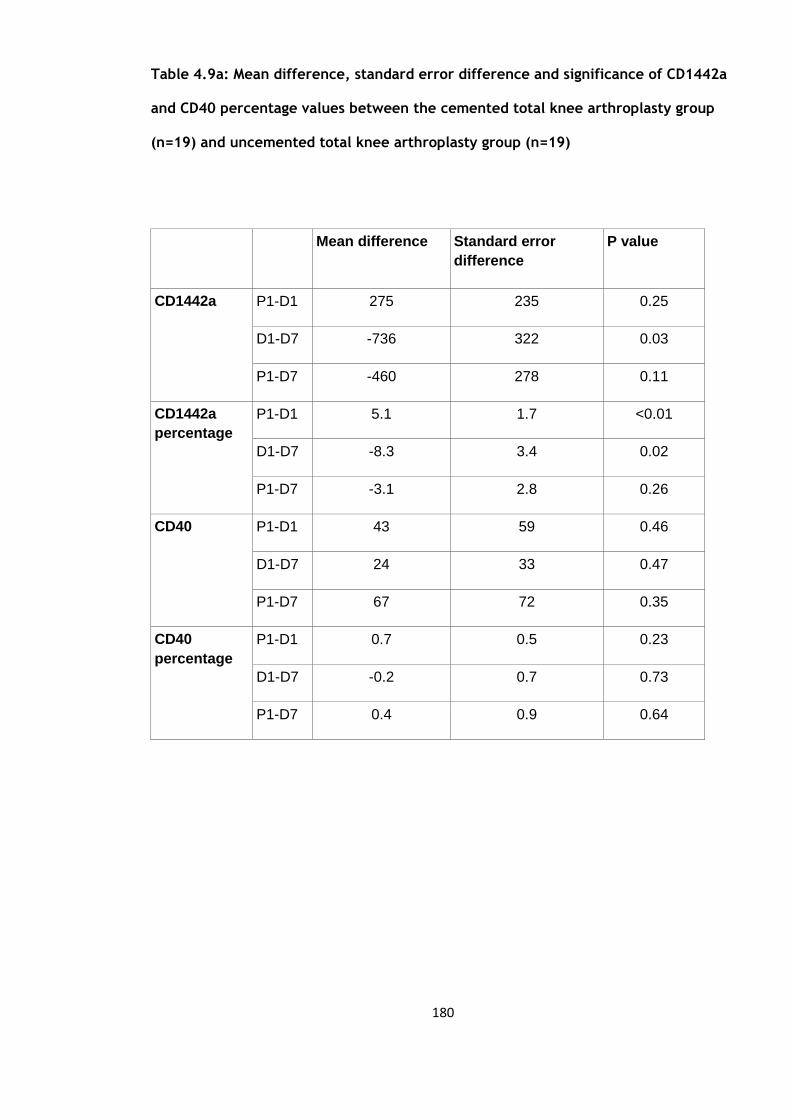
180
Table 4.9a: Mean difference, standard error difference and significance of CD1442a
and CD40 percentage values between the cemented total knee arthroplasty group
(n=19) and uncemented total knee arthroplasty group (n=19)
Mean difference Standard error
difference
P value
CD1442a P1-D1 275 235 0.25
D1-D7 -736 322 0.03
P1-D7 -460 278 0.11
CD1442a
percentage
P1-D1 5.1 1.7 <0.01
D1-D7 -8.3 3.4 0.02
P1-D7 -3.1 2.8 0.26
CD40 P1-D1 43 59 0.46
D1-D7 24 33 0.47
P1-D7 67 72 0.35
CD40
percentage
P1-D1 0.7 0.5 0.23
D1-D7 -0.2 0.7 0.73
P1-D7 0.4 0.9 0.64

181
Table 4.9b: Mann-Whitney U test for CD1442a and CD40 absolute values between
the cemented total knee arthroplasty group (n=19) and uncemented total knee
arthroplasty group (n=19)
Percentiles
P-value
25th
50th (Median)
(Median
75th
CD1442a P1-D1 -719 -177 41 0.15
D1-D7 -112 358 1206 0.04
P1-D7 -286 171 720 0.07
CD40 P1-D1 -114 -54 -4 0.93
D1-D7 16 64 169 0.17
P1-D7 -32 19 130 0.35
182
4.6 Discussion
This study differs from the previous one in that bone cement (PMMA) was used to
‘cement’ in the knee prosthesis. We see a rise in the CRP levels which is significant in
the first 24 hours as well as at day 7 post-operatively. This is accompanied by a
significant rise in IL-6 levels at all three time points which mirrors the response seen in
the previous study. When we look at the changes in the t-PA and vWF levels one might
have expected a significant rise in the first 24 hours from the surgical trauma and
assumed exothermic trauma from the cement to the surrounding tissues and
vasculature. But there was not a significant rise in the first 24 hours and the vWF levels
only became significant after 24 hours from day 1 to day 7 and remained significantly
elevated at day 7 compared to the pre-operative levels. The t-PA levels again did not
show a significant rise in the first 24 hours and only became significant at day 7
compared to the pre-operative levels. None of these changes were statistically
significant between the uncemented and cemented groups.
The TNFα levels were similar to the previous study in that the levels were not
significantly elevated until at day 7. In contrast the e-selectin levels were significant at
day 7 which may be attributed to the exothermic reaction of the bone cement and
relevant due to e-selectin’s role in mediating leucocyte rolling and its role in conversion
of rolling to firm adhesion but this was not statistically different to that of the
uncemented group.
The sCD40L levels reduced significantly in the first 24 hours occurring earlier than the
group without cement which only became significantly reduced after the initial 24
183
hours. The levels in the cemented group continued to rise significantly from day 1 to
day 7 reflecting a more acute rise in its levels possibly due to the cement used. This
may also reflect a more acute rise in the CD154 levels.
The release of CD40 from the endothelium rose significantly from day 1 to day 7 as
opposed to only the first 24 hours in the uncemented group, reflecting a prolonged and
gradual rise in its levels from the exothermic reaction of the bone cement. In contrast
to the uncemented group where there was no significant rise in the CD1442a levels at
any of the time points, the levels in the cemented group demonstrated a significant rise
at all time points. This was the only variable which was statistically different between
the uncemented and cemented groups.
Our current understanding of the exact role of CD1442a is not clearly understood.
Whether it reflects the inflammatory and thrombotic process or in fact directly
contributes to the ongoing atherothrombogenesis (101). Either way it appears that the
used of bone cement here has a significant effect on its levels albeit the relevance at
this current time is unknown.
A review of the current literature highlights that this is the only study so far to
specifically look at the potential effect of polymethylmethacrylate on markers of
inflammation, endothelium and coagulation.

184
CHAPTER 5
Effect of local anaesthetic infiltration intra-
operatively on the activation of markers of
inflammation, endothelium and coagulation after
uncemented total knee arthroplasty
185
5.1 Subject characteristics
There were 20 patients recruited into this study, 2 patients were excluded one due to
wound dehiscence which required to be taken back to theatre for a wound lavage and
secondary closure and the other patient fell during rehabilitation sustaining a humeral
fracture. Both these patients were excluded due to the potential effects of further
tissue trauma and the ‘second hit’ phenomenom of the humeral fracture on the stress
response. The mean body mass index (BMI) was 30.35kg/m2, standard deviation 6.1.
There were 7 males (mean age 62.3 years, standard deviation 12.08) and 11 females
(mean age 67.5 years, standard deviation 8.74). A total of 10 total knee arthroplasties
were carried out on the left and 8 on the right. None of these characteristics were
significantly different from the patients in the uncemented total knee arthroplasty
group in Chapter 3.
5.2 Blood cell counts and CRP
The mean values, standard deviations and standard error of means of the white cell
count (WCC), neutrophils (Neutro), monocytes (Mono) and C-reactive protein (CRP) are
summarised below in table 5.1.
Each of these variables where compared over three time periods, from pre-operative
values to day 1 post-operation (P1-D1), from day 1 to day 7 post-operation (D1-D7) and

186
from pre-operative to day 7 post-operation (P1-D7), the results of which are
summarised in table 5.2.
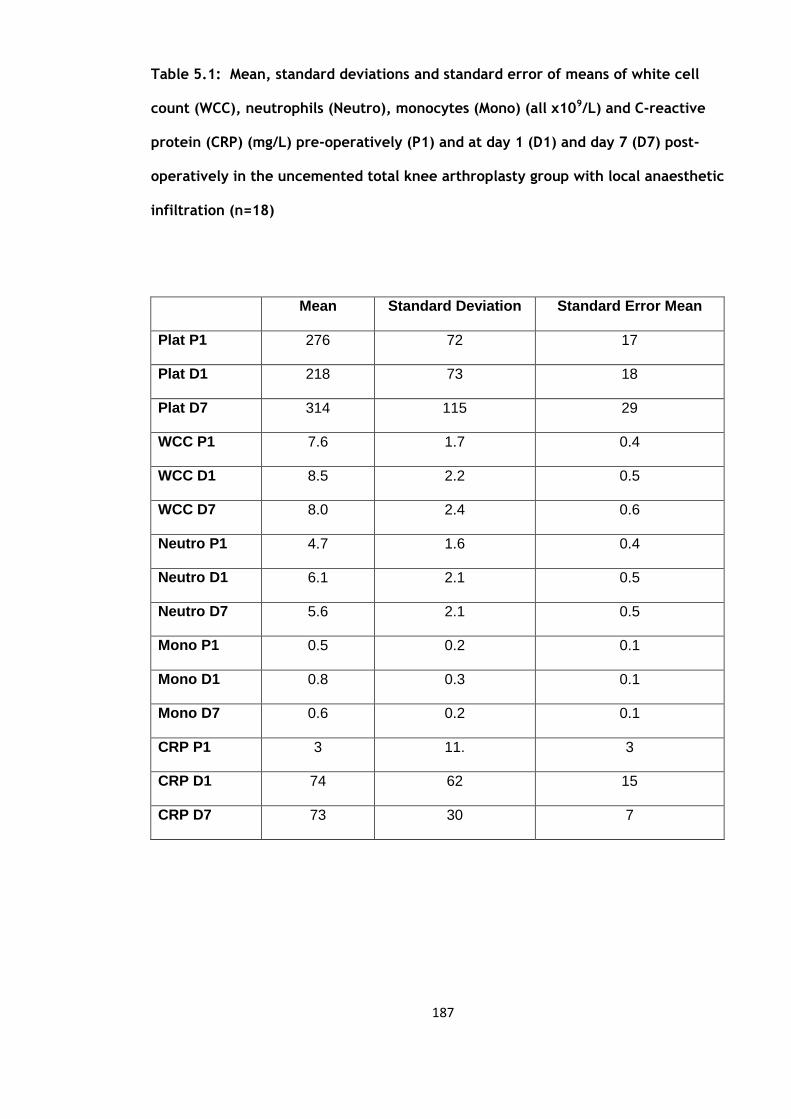
187
Table 5.1: Mean, standard deviations and standard error of means of white cell
count (WCC), neutrophils (Neutro), monocytes (Mono) (all x109/L) and C-reactive
protein (CRP) (mg/L) pre-operatively (P1) and at day 1 (D1) and day 7 (D7) post-
operatively in the uncemented total knee arthroplasty group with local anaesthetic
infiltration (n=18)
Mean Standard Deviation Standard Error Mean
Plat P1 276 72 17
Plat D1 218 73 18
Plat D7 314 115 29
WCC P1 7.6 1.7 0.4
WCC D1 8.5 2.2 0.5
WCC D7 8.0 2.4 0.6
Neutro P1 4.7 1.6 0.4
Neutro D1 6.1 2.1 0.5
Neutro D7 5.6 2.1 0.5
Mono P1 0.5 0.2 0.1
Mono D1 0.8 0.3 0.1
Mono D7 0.6 0.2 0.1
CRP P1 3 11. 3
CRP D1 74 62 15
CRP D7 73 30 7
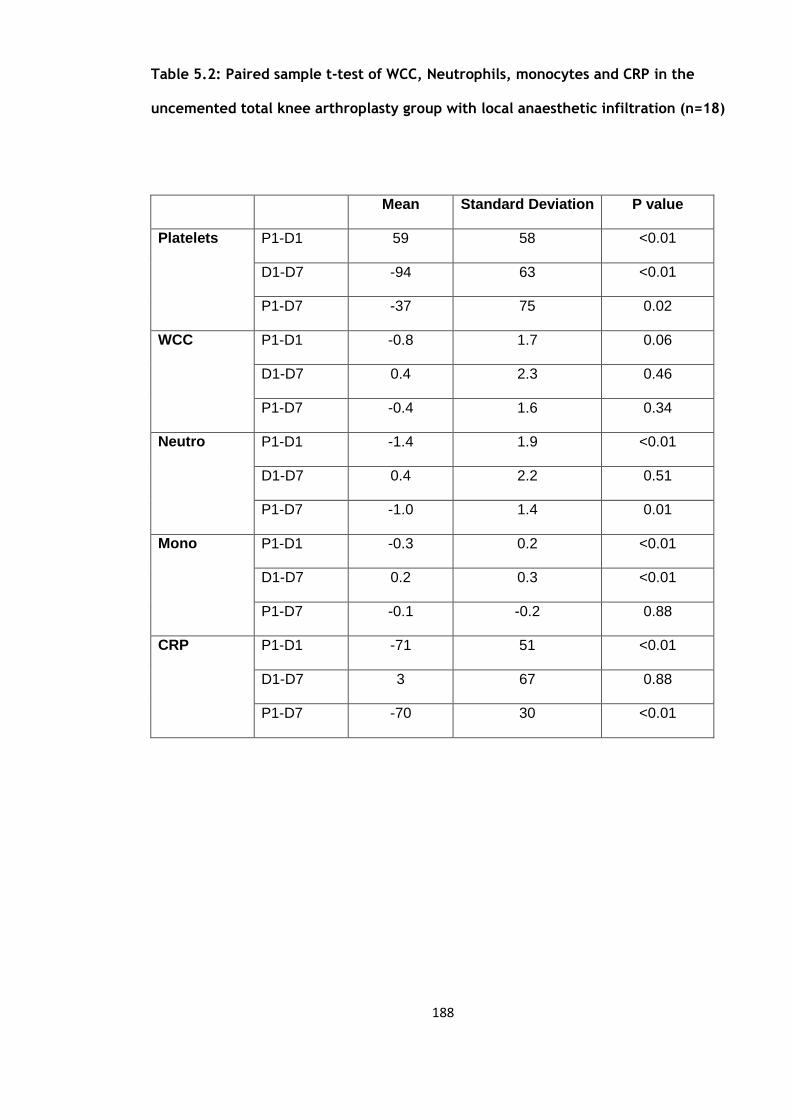
188
Table 5.2: Paired sample t-test of WCC, Neutrophils, monocytes and CRP in the
uncemented total knee arthroplasty group with local anaesthetic infiltration (n=18)
Mean Standard Deviation P value
Platelets P1-D1 59 58 <0.01
D1-D7 -94 63 <0.01
P1-D7 -37 75 0.02
WCC P1-D1 -0.8 1.7 0.06
D1-D7 0.4 2.3 0.46
P1-D7 -0.4 1.6 0.34
Neutro P1-D1 -1.4 1.9 <0.01
D1-D7 0.4 2.2 0.51
P1-D7 -1.0 1.4 0.01
Mono P1-D1 -0.3 0.2 <0.01
D1-D7 0.2 0.3 <0.01
P1-D7 -0.1 -0.2 0.88
CRP P1-D1 -71 51 <0.01
D1-D7 3 67 0.88
P1-D7 -70 30
<0.01
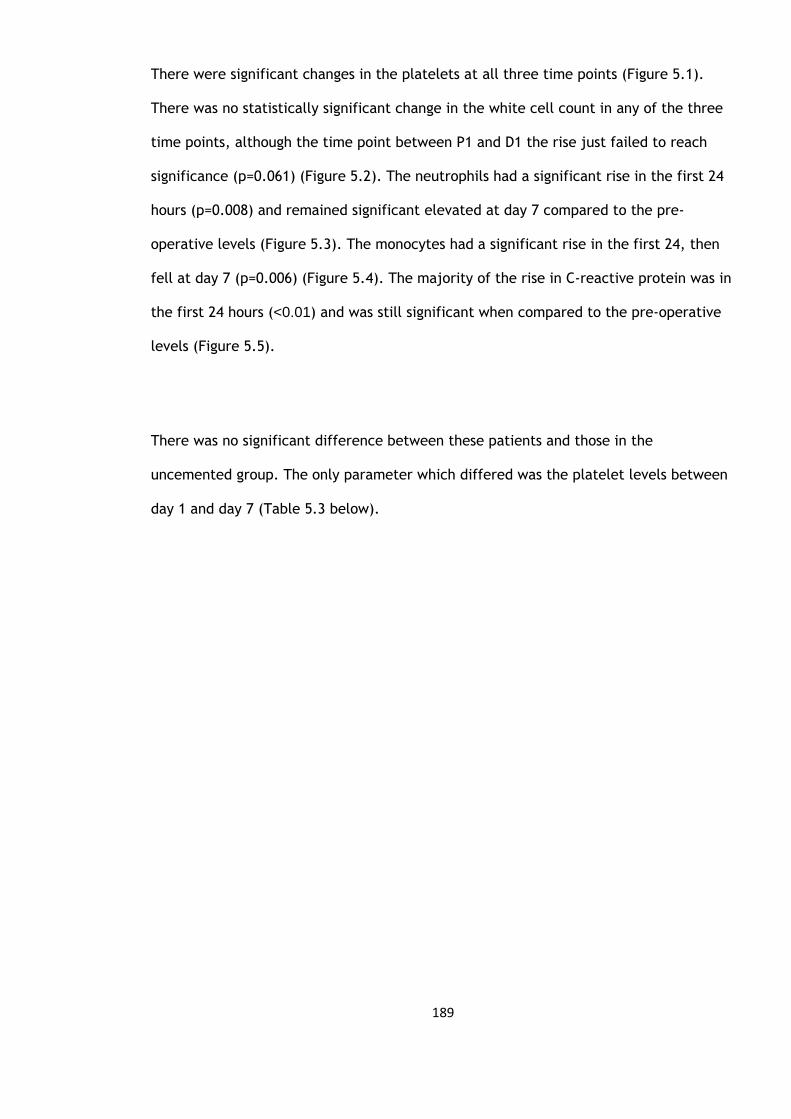
189
There were significant changes in the platelets at all three time points (Figure 5.1).
There was no statistically significant change in the white cell count in any of the three
time points, although the time point between P1 and D1 the rise just failed to reach
significance (p=0.061) (Figure 5.2). The neutrophils had a significant rise in the first 24
hours (p=0.008) and remained significant elevated at day 7 compared to the pre-
operative levels (Figure 5.3). The monocytes had a significant rise in the first 24, then
fell at day 7 (p=0.006) (Figure 5.4). The majority of the rise in C-reactive protein was in
the first 24 hours (<0.01) and was still significant when compared to the pre-operative
levels (Figure 5.5).
There was no significant difference between these patients and those in the
uncemented group. The only parameter which differed was the platelet levels between
day 1 and day 7 (Table 5.3 below).
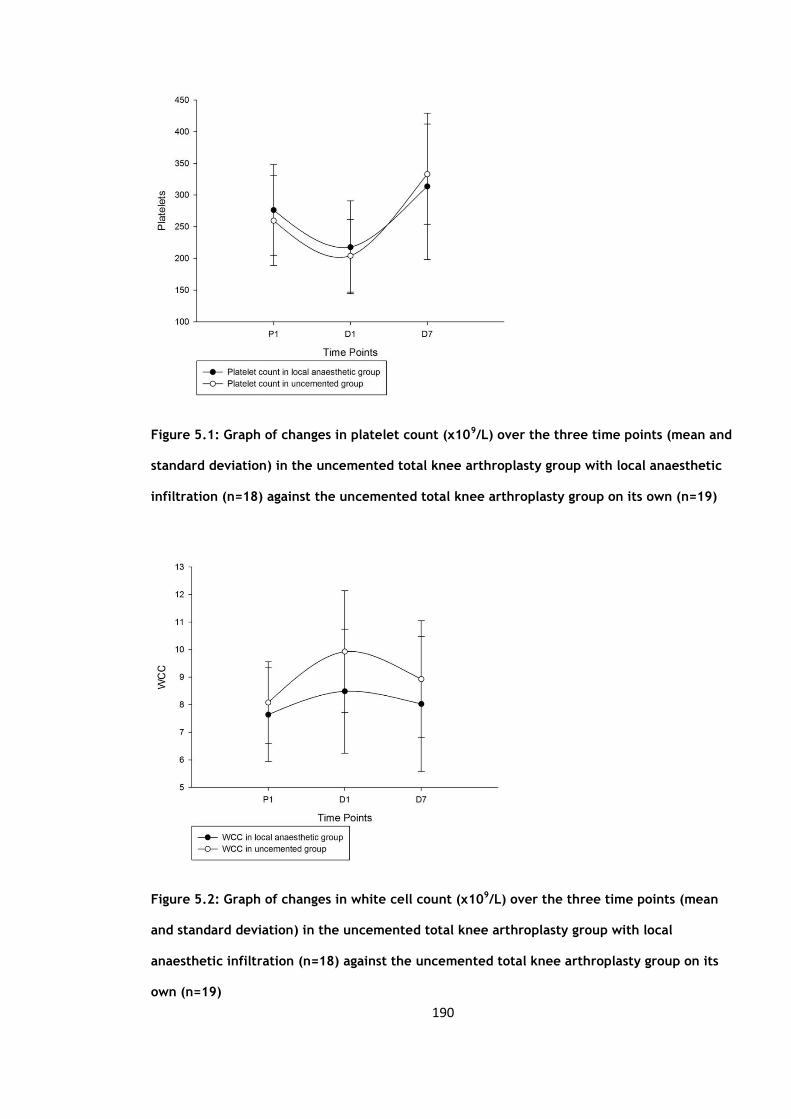
190
Figure 5.1: Graph of changes in platelet count (x109/L) over the three time points (mean and
standard deviation) in the uncemented total knee arthroplasty group with local anaesthetic
infiltration (n=18) against the uncemented total knee arthroplasty group on its own (n=19)
Figure 5.2: Graph of changes in white cell count (x109/L) over the three time points (mean
and standard deviation) in the uncemented total knee arthroplasty group with local
anaesthetic infiltration (n=18) against the uncemented total knee arthroplasty group on its
own (n=19)

191
Figure 5.3: Graph of changes in neutrophil count (x109/L) over the three time points (mean
and standard deviation) in the uncemented total knee arthroplasty group with local
anaesthetic infiltration (n=18) against the uncemented total knee arthroplasty group on its
own (n=19)
Figure 5.4: Graph of changes in monocyte count (x109/L) over the three time points (mean
and standard deviation) in the uncemented total knee arthroplasty group with local
anaesthetic infiltration (n=18) against the uncemented total knee arthroplasty group on its
own (n=19)

192
Figure 5.5: Graph of changes in C-reactive protein count (mg/L) over the three time points
(mean and standard deviation) in the uncemented total knee arthroplasty group with local
anaesthetic infiltration (n=18) against the uncemented total knee arthroplasty group on its
own (n=19)

193
Table 5.3: Mean difference, standard error difference and significance of blood
parameters between cemented and uncemented group in the uncemented total
knee arthroplasty group with local anaesthetic infiltration (n=18)
Mean difference Standard error
difference
P value
Platelets P1-D1 3 16 0.84
D1-D7 51 24 0.04
P1-D7 54 32 0.09
White Cell
Count
P1-D1 1 0.6 0.11
D1-D7 0.1 0.8 0.9
P1-D7 0.9 0.7 0.19
Neutrophils P1-D1 1.2 0.6 0.06
D1-D7 -0.7 0.8 0.43
P1-D7 0.5 0.6 0.38
Monocytes P1-D1 0.2 0.1 0.12
D1-D7 -0.1 0.1 0.41
P1-D7 0.1 0.1 0.45
C-reactive
protein
P1-D1 -5 15 0.72
D1-D7 4 19 0.83
P1-D7 -1 10 0.91
194
5.3 Circulating activation markers
The mean, standard deviations and standard error of means of tissue plasminogen
activator (t-PA), von Willebrand factor (vWF), soluble CD40 ligand (sCD40L), interleukin
6 (IL6), tumour necrosis factor (TNFα) and e-selectin (median and IQRs) are summarised
in table 5.4a & b.
Each variable was then compared over the three time points from pre-operative values
to day 1 post-operation (P1-D1), from day 1 to day 7 post-operation (D1-D7) and from
pre-operative to day 7 post-operation (P1-D7) (Table 5.5).
The increase in t-PA levels just failed to reach significance in the first 24 hours (p=0.06)
but became significant at day 7 (p=0.01) (Figure 5.6). VWF levels were significantly
higher at days 1 and 7 (Figure 5.7). The sCD40L levels showed a significant fall in the
day 1 (p=0.04) rising by day 7 (p=0.07) (Figure 5.8). IL 6 levels were significantly
elevated at day 1 and fell by day 7 (p=0.37) (Figure 5.9). E-selectin was significantly
lower at day 1 (p=0.01) (Figure 5.10). TNFα could not be arranged in this study due to
exhaustion of laboratory funding. Comparing these results with the uncemented group
(Table 5.6) we see that the vWF level from day 1 to day 7 is the only parameter which
has shown a statistically significant difference between the two groups.

195
Table 5.4a: Mean, standard deviations and standard error of means of tissue
plasminogen activator (t-PA) (ng/ml), von Willebrand factor (vWF) (IU/dl), soluble
CD40 ligand (sCD40L) (pg/ml), interleukin 6 (IL6) (pg/ml) and tumour necrosis
factor (TNFα) (pg/ml) in the uncemented total knee arthroplasty group with local
anaesthetic infiltration (n=18)
Mean Standard Deviation Standard Error Mean
t-PA P1 11.6 4.1 1.2
t-PA D1 13.5 4.5 1.4
t-PA D7 16.5 6.5 2.0
vWF P1 110 42 10
vWF D1 152 45 11
vWF D7 212 42 10
sCD40L P1 6047 1998 499
sCD40L D1 4583 1926 481
sCD40L D7 6218 2208 570
IL6 P1 6.1 7.0 1.7
IL6 D1 170.8 111.4 27.0
IL6 D7 49.0 77.0 18.7
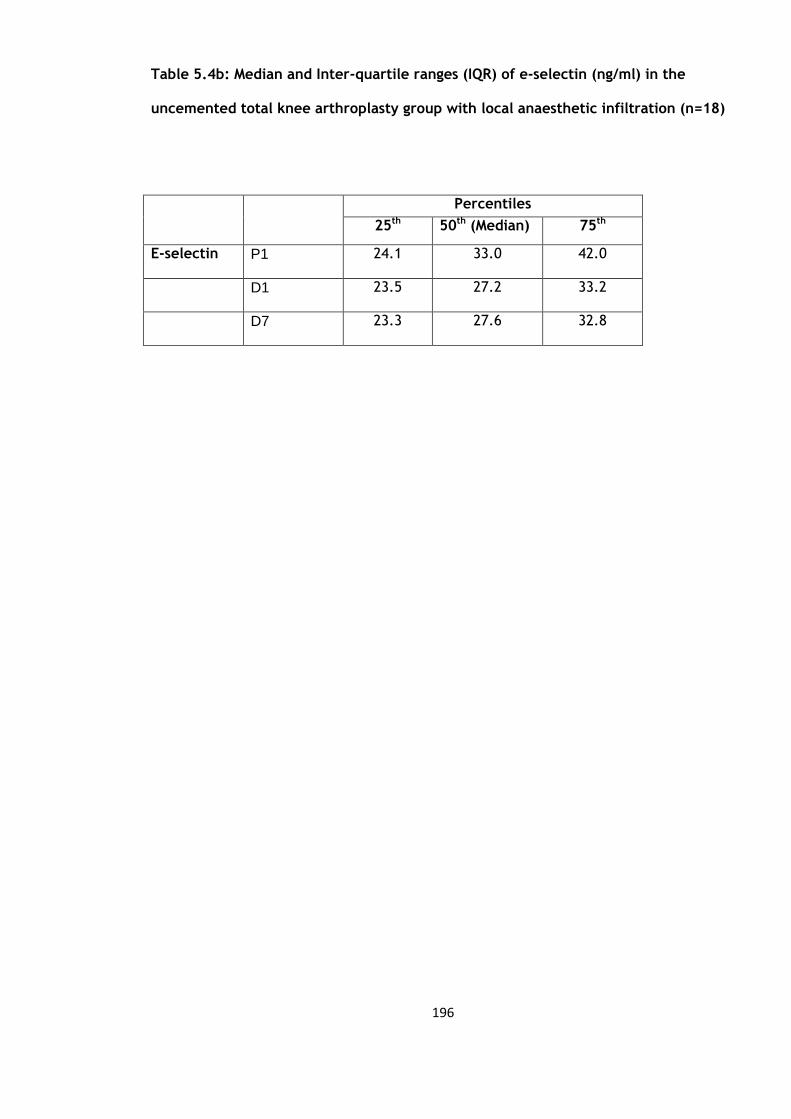
196
Table 5.4b: Median and Inter-quartile ranges (IQR) of e-selectin (ng/ml) in the
uncemented total knee arthroplasty group with local anaesthetic infiltration (n=18)
Percentiles
25th 50th (Median) 75th
E-selectin P1 24.1 33.0 42.0
D1 23.5 27.2 33.2
D7 23.3 27.6 32.8
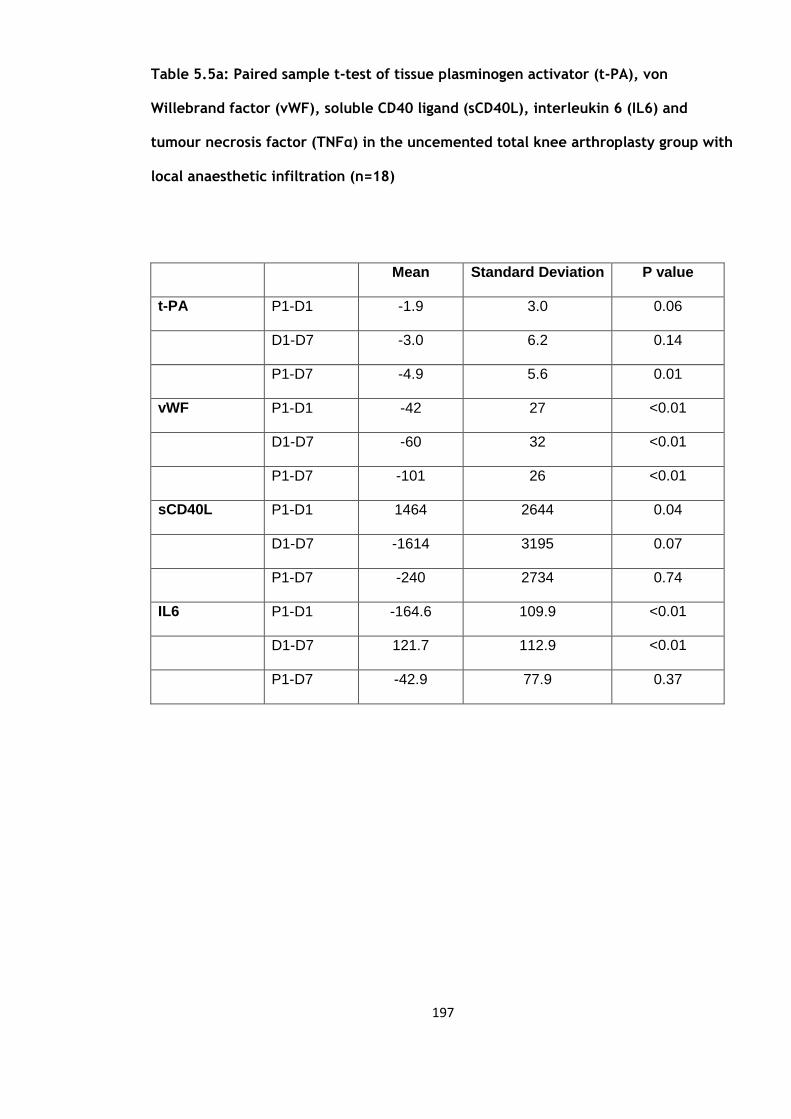
197
Table 5.5a: Paired sample t-test of tissue plasminogen activator (t-PA), von
Willebrand factor (vWF), soluble CD40 ligand (sCD40L), interleukin 6 (IL6) and
tumour necrosis factor (TNFα) in the uncemented total knee arthroplasty group with
local anaesthetic infiltration (n=18)
Mean Standard Deviation P value
t-PA P1-D1 -1.9 3.0 0.06
D1-D7 -3.0 6.2 0.14
P1-D7 -4.9 5.6 0.01
vWF P1-D1 -42 27 <0.01
D1-D7 -60 32 <0.01
P1-D7 -101 26 <0.01
sCD40L P1-D1 1464 2644 0.04
D1-D7 -1614 3195 0.07
P1-D7 -240 2734 0.74
IL6 P1-D1 -164.6 109.9 <0.01
D1-D7 121.7 112.9 <0.01
P1-D7 -42.9 77.9 0.37

198
Table 5.5b: Wilcoxon signed rank test for e-selectin (ng/ml) in the uncemented total
knee arthroplasty group with local anaesthetic infiltration (n=18)
P-value
E-selectin P1-D1 0.01
D1-D7 0.28
P1-D7 0.29

199
Figure 5.6: Graph of changes in tissue plasminogen activator level (ng/ml) over the three
time points (mean and standard deviation) in the uncemented total knee arthroplasty group
with local anaesthetic infiltration (n=18) against the uncemented total knee arthroplasty
group on its own (n=19)
Figure 5.7: Graph of changes in von Willebrand Factor level (IU/dl) over the three time
points (mean and standard deviation) in the uncemented total knee arthroplasty group with
local anaesthetic infiltration (n=18) against the uncemented total knee arthroplasty group on
its own (n=19)

200
Figure 5.8: Graph of changes in soluble CD40 ligand levels (pg/ml) over the three time points
(mean and standard deviation) in the uncemented total knee arthroplasty group with local
anaesthetic infiltration (n=18) against the uncemented total knee arthroplasty group on its
own (n=19)
Figure 5.9: Graph of changes in interleukin 6 levels (pg/ml) over the three time points (mean
and standard deviation) in the uncemented total knee arthroplasty group with local
anaesthetic infiltration (n=18) against the uncemented total knee arthroplasty group on its
own (n=19)

201
Figure 5.10: Graph of changes in e-selectin levels (ng/ml) over the three time points (median
and interquartile ranges) in the uncemented total knee arthroplasty group with local
anaesthetic infiltration (n=18) against the uncemented total knee arthroplasty group on its
own (n=19)
202
5.4 Flow cytometry assays of cell cytokine expression
The mean, standard deviations and standard error of means of the CD1442a and CD40
flow cytometry values are summarised in table 5.6 a & b. The values are described both
in absolute values (cell counts) and in percentages.
The flow results were then analysed to look at changes between the three time points,
the results of which are summarised in table 5.7a & b.
The CD1442a count fell significantly in the first 24 hours and rose significantly in the
time period between day 1 and day 7 (p=0.04, <0.01) but was not significantly elevated
at day 7 compared to the pre-operative levels (Figure 5.11). This is reflected when we
look at percentage changes over the same time period (p=0.01 and p=0.05 respectively).
The CD40 counts on the other hand decreased significantly in the first 24 hour period
(P1-D1) with respect to both the absolute values and percentage changes (p=0.00 and
0.01 respectively) (Figure 5.12) and then rose significantly to day 7 (p=0.01)
The CD1442a levels fell significantly and then rose significantly at day 7 compared to
the patients in the uncemented group (Table 5.10a &b).
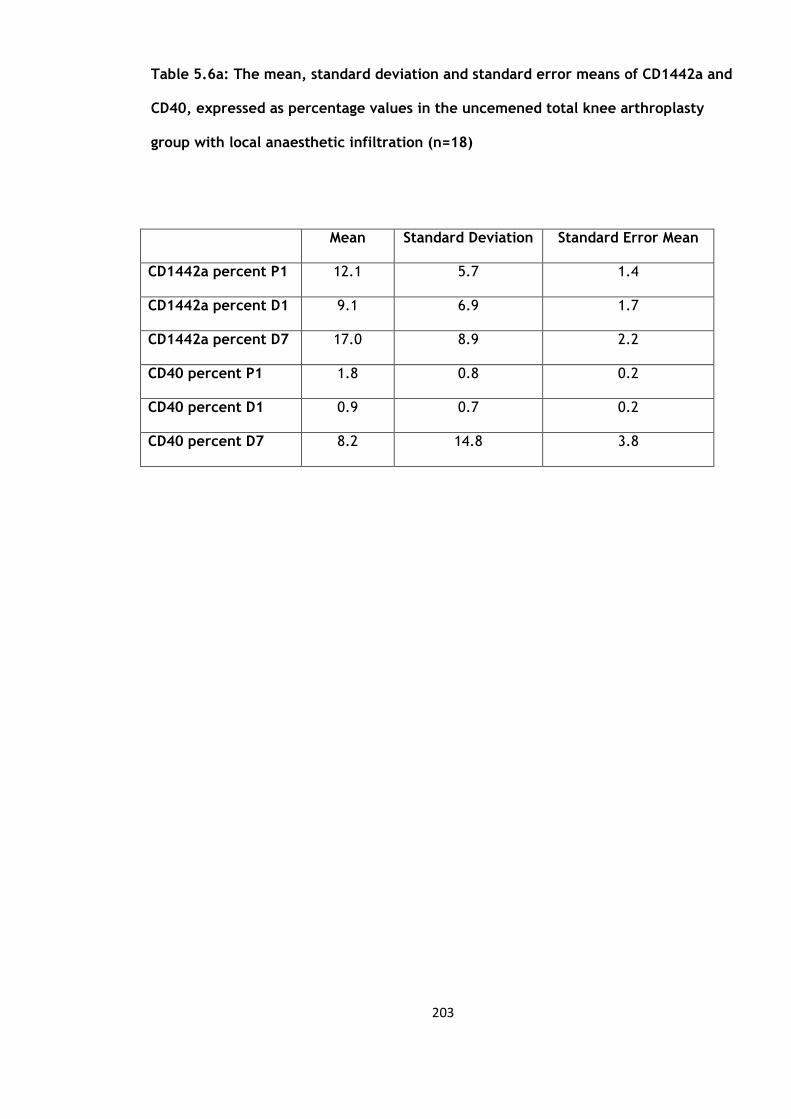
203
Table 5.6a: The mean, standard deviation and standard error means of CD1442a and
CD40, expressed as percentage values in the uncemened total knee arthroplasty
group with local anaesthetic infiltration (n=18)
Mean Standard Deviation Standard Error Mean
CD1442a percent P1 12.1 5.7 1.4
CD1442a percent D1 9.1 6.9 1.7
CD1442a percent D7 17.0 8.9 2.2
CD40 percent P1 1.8 0.8 0.2
CD40 percent D1 0.9 0.7 0.2
CD40 percent D7 8.2 14.8 3.8

204
Table 5.6b: Median and Inter-quartile ranges (IQR) of CD1442a and CD40, expressed
as absolute values in the uncemened total knee arthroplasty group with local
anaesthetic infiltration (n=18)
Percentiles
25th 50th (Median) 75th
CD1442a P1 897 1232 1578
D1 185 758 1231
P1 939 1915 2508
CD40 P1 121 168 236
D1 48 67 116
D7 132 240 362
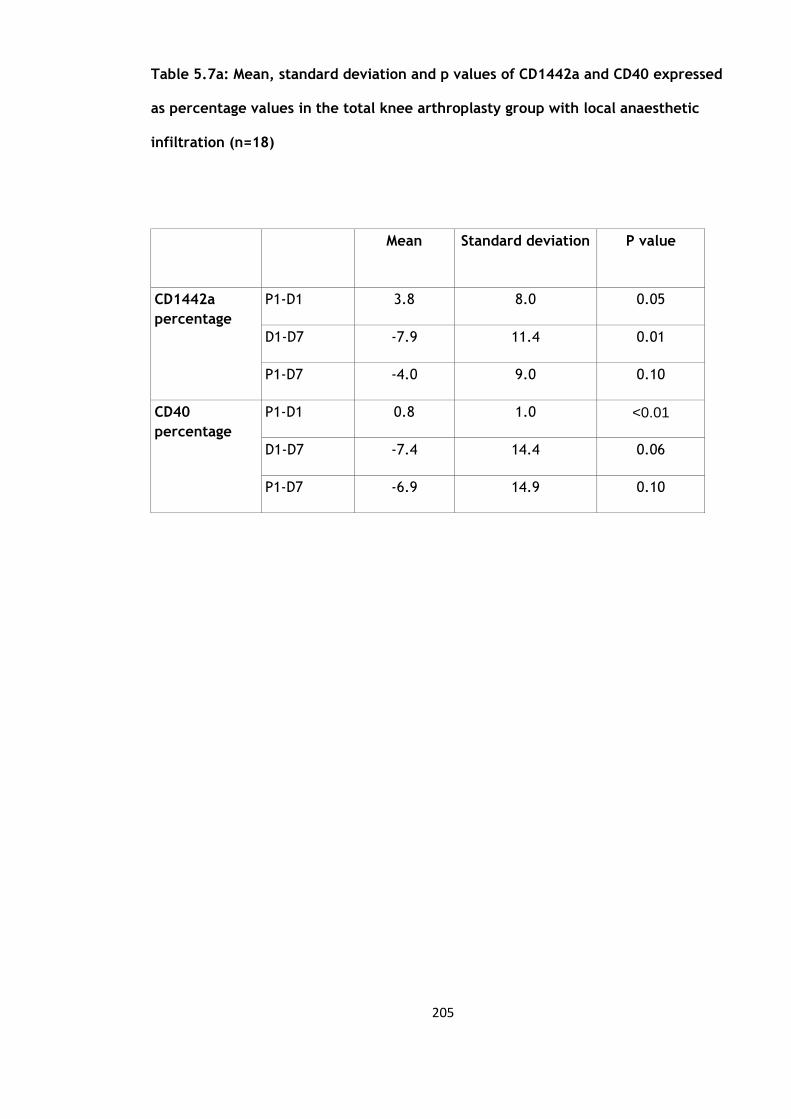
205
Table 5.7a: Mean, standard deviation and p values of CD1442a and CD40 expressed
as percentage values in the total knee arthroplasty group with local anaesthetic
infiltration (n=18)
Mean Standard deviation P value
CD1442a
percentage
P1-D1 3.8 8.0 0.05
D1-D7 -7.9 11.4 0.01
P1-D7 -4.0 9.0 0.10
CD40
percentage
P1-D1 0.8 1.0 <0.01
D1-D7 -7.4 14.4 0.06
P1-D7 -6.9 14.9 0.10
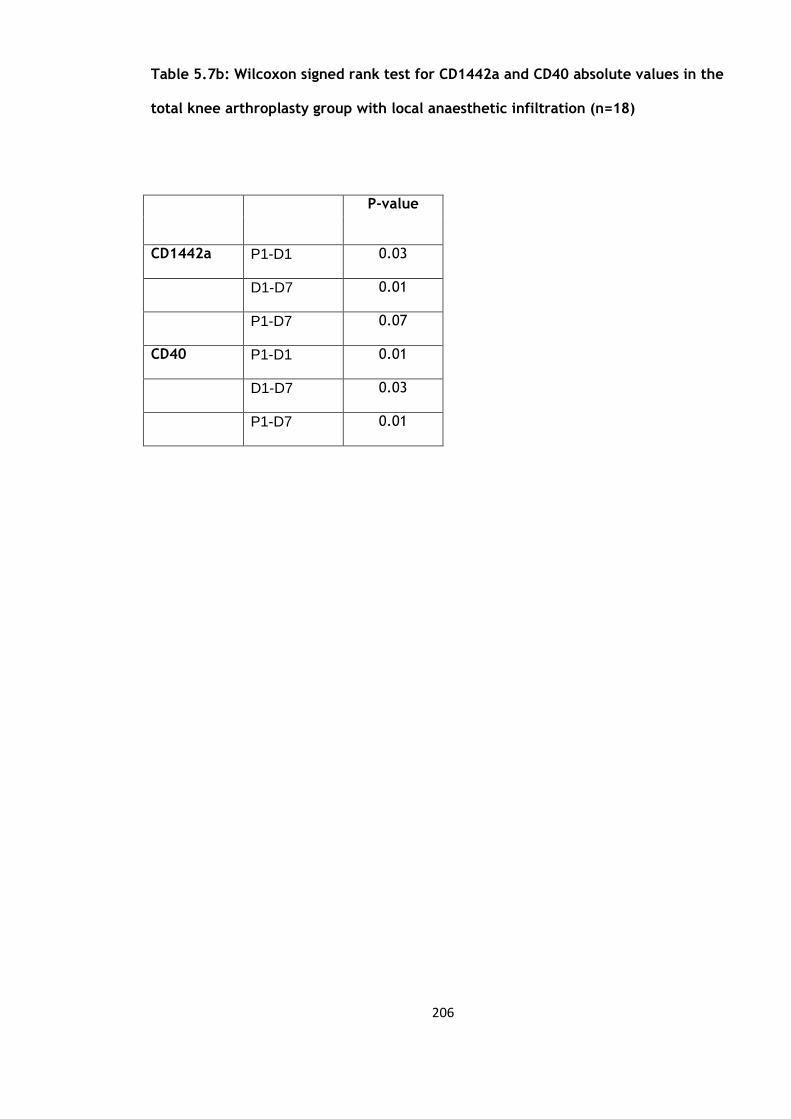
206
Table 5.7b: Wilcoxon signed rank test for CD1442a and CD40 absolute values in the
total knee arthroplasty group with local anaesthetic infiltration (n=18)
P-value
CD1442a P1-D1 0.03
D1-D7 0.01
P1-D7 0.07
CD40 P1-D1 0.01
D1-D7 0.03
P1-D7 0.01
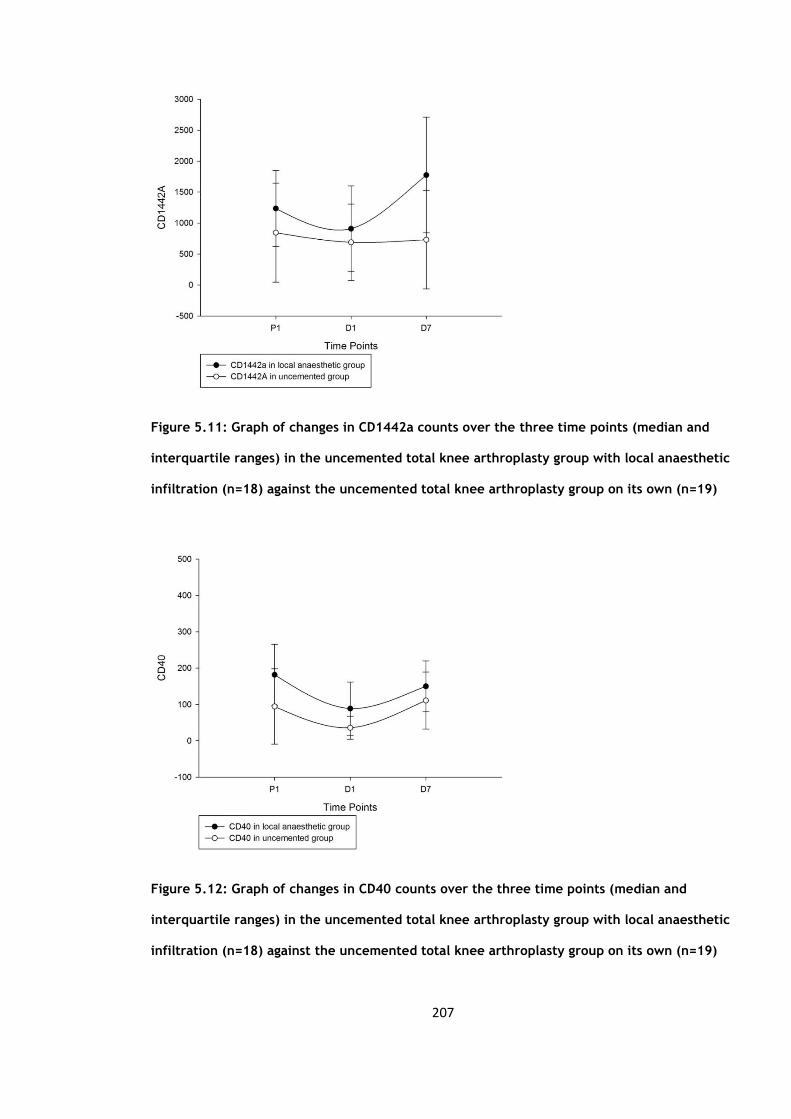
207
Figure 5.11: Graph of changes in CD1442a counts over the three time points (median and
interquartile ranges) in the uncemented total knee arthroplasty group with local anaesthetic
infiltration (n=18) against the uncemented total knee arthroplasty group on its own (n=19)
Figure 5.12: Graph of changes in CD40 counts over the three time points (median and
interquartile ranges) in the uncemented total knee arthroplasty group with local anaesthetic
infiltration (n=18) against the uncemented total knee arthroplasty group on its own (n=19)

208
5.5 Uncemented versus local anaesthetic infiltration group to assess whether the
local anaesthetic would dampen the inflammatory and endothelial response
The groups were compared to look for significant differences in the inflammatory and
endothelial response with the additional use of local anaesthetic infiltration intra-
operatively into the joint capsule and surrounding soft tissues (40ml 0.25% Chirocaine
with 10ml 1:100 000 adrenaline). The table below summarises the results (Table 5.8).
When we compare the blood parameters we see that there is a significant difference
between the uncemented group and the group which received the local anaesthetic
infiltration with reference to the changes in the platelet counts from day 1 to day 7
(p=0.04) (Figure 5.13), here the platelets levels rose less in the local anaesthetic group.
The changes in the neutrophil counts in the first 24 hours (P1-D1) just failed to reach
significance (p=0.06). There was no significant difference with regards to the white cell
count and C-reactive protein.
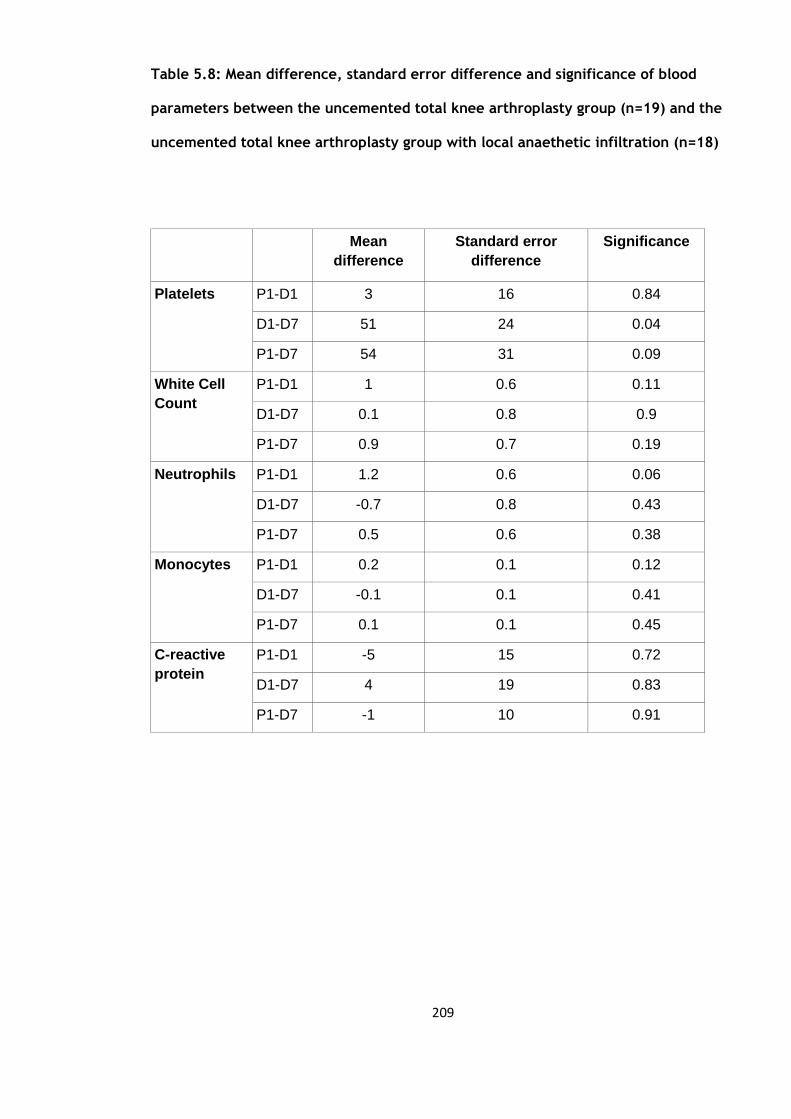
209
Table 5.8: Mean difference, standard error difference and significance of blood
parameters between the uncemented total knee arthroplasty group (n=19) and the
uncemented total knee arthroplasty group with local anaethetic infiltration (n=18)
Mean
difference
Standard error
difference
Significance
Platelets P1-D1 3 16 0.84
D1-D7 51 24 0.04
P1-D7 54 31 0.09
White Cell
Count
P1-D1 1 0.6 0.11
D1-D7 0.1 0.8 0.9
P1-D7 0.9 0.7 0.19
Neutrophils P1-D1 1.2 0.6 0.06
D1-D7 -0.7
0.8 0.43
P1-D7 0.5 0.6 0.38
Monocytes P1-D1 0.2 0.1 0.12
D1-D7 -0.1 0.1 0.41
P1-D7 0.1 0.1 0.45
C-reactive
protein
P1-D1 -5 15 0.72
D1-D7 4 19 0.83
P1-D7 -1 10 0.91
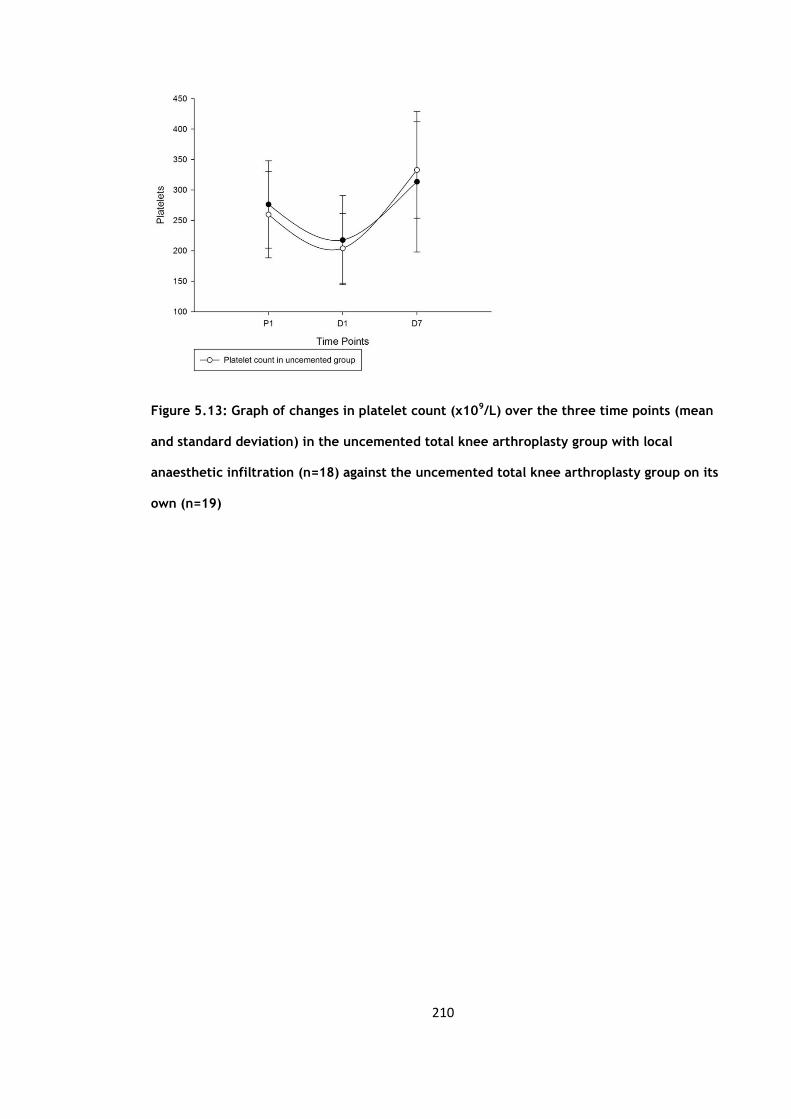
210
Figure 5.13: Graph of changes in platelet count (x109/L) over the three time points (mean
and standard deviation) in the uncemented total knee arthroplasty group with local
anaesthetic infiltration (n=18) against the uncemented total knee arthroplasty group on its
own (n=19)

211
The table below (table 5.9a & b) is a summary of the results when we compare the
tissue plasminogen activator (t-PA), von Willebrand factor (vWF), soluble CD40 ligand
(sCD40L0, interleukin 6 (IL-6) and e-selectin levels.
The only variable to show a significant difference was the levels of von Willebrand
factor from day 1 to day 7 when comparing between the two groups (p=0.01) here the
levels rose significantly less than the uncemented group (Figure 5.7)
The results of the flow cytometry are outlined in table 5.11. There were significant
differences between the two groups with regards to the CD1442a counts for both the
absolute values and percentage changes up to day 7 (Figure 5.11). From the figure
below we see that the CD1442a levels fall and then rise more significantly than the
uncemented group.

212
Table 5.9a: Mean difference, standard error difference and significance of tissue
plasminogen activator (t-PA), von Willebrand factor (vWF), soluble CD40 ligand
(sCD40L0, interleukin 6 (IL6) and tumour necrosis factor alpha (TNFα) levels
between the uncemented total knee arthroplasty group with local anaesthetic
infiltration (n=18) and the uncemented total knee arthroplasty group on its own
(n=19)
Mean
difference
Standard error difference P value
t-PA P1-D1 0.9 2.0 0.65
D1-D7 -2.2 2.6 0.40
P1-D7 -1.3 2.1 0.54
vWF P1-D1 35 18 0.06
D1-D7 -51 18 0.01
P1-D7 -19 11 0.09
sCD40L P1-D1 966 806 0.24
D1-D7 -135 908 0.88
P1-D7 742 784 0.35
IL6 P1-D1 41.5 59.8 0.49
D1-D7 -24.4 44.0 0.58
P1-D7 30.3 53.4 0.57
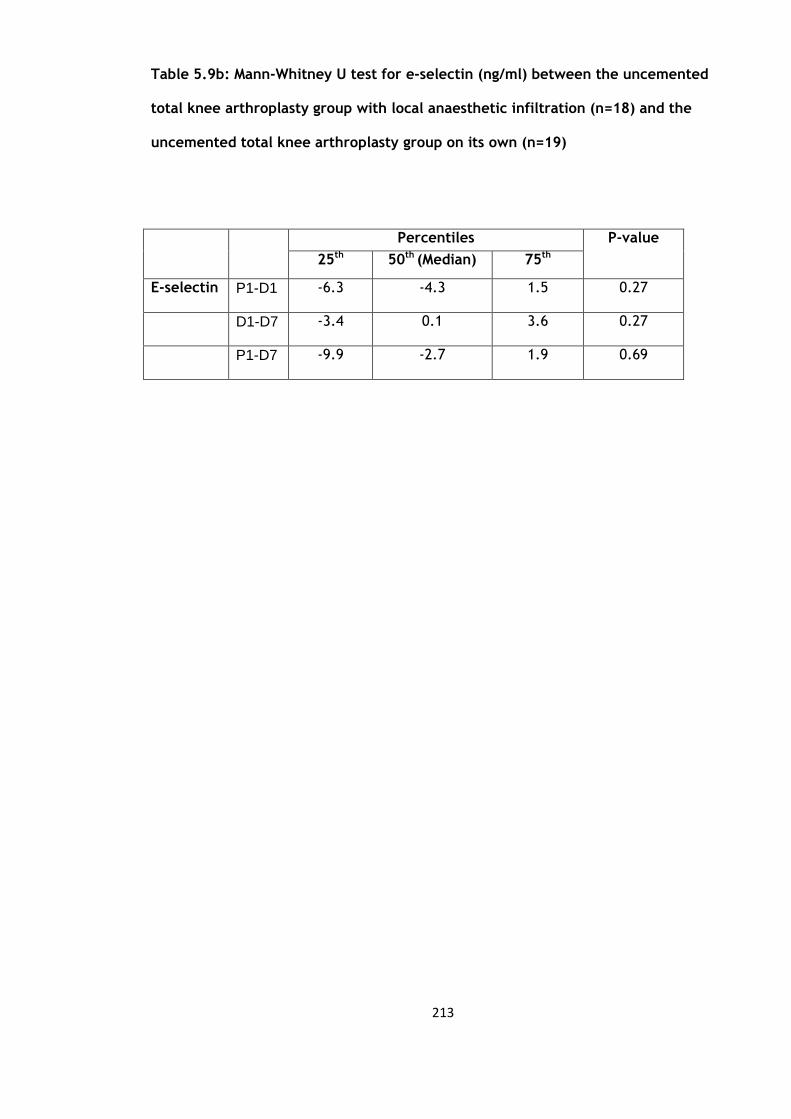
213
Table 5.9b: Mann-Whitney U test for e-selectin (ng/ml) between the uncemented
total knee arthroplasty group with local anaesthetic infiltration (n=18) and the
uncemented total knee arthroplasty group on its own (n=19)
Percentiles
P-value
25th
50th (Median)
(Median
75th
E-selectin P1-D1 -6.3 -4.3 1.5 0.27
D1-D7 -3.4 0.1 3.6 0.27
P1-D7 -9.9 -2.7 1.9 0.69

214
Table 5.10a: Mean difference, standard error difference and significance of
CD1442a and CD40 percentage values between the uncemented total knee
arthroplasty group (n=19) and the uncemented total knee arthroplasty group with
local anaethetic infiltration (n=18)
Mean difference Standard error
difference
P value
CD1442a
percentage
P1-D1 4.2 2.0 0.05
D1-D7 -7.0 3.0 0.02
P1-D7 -2.7 2.5 0.28
CD40
percentage
P1-D1 0.4 0.3 0.15
D1-D7 -4.2 4.2 0.32
P1-D7 -3.9 4.2 0.36

215
Table 5.10b: Mann-Whitney U test for CD1442a and CD40 absolute values between
the uncemented total knee arthroplasty group (n=19) and the uncemented total
knee arthroplasty group with local anaethetic infiltration (n=18)
Percentiles
P-value
25th
50th (Median)
(Median
75th
CD1442a P1-D1 -719 -177 41 0.18
D1-D7 -112 358 1206 0.02
P1-D7 -286 171 720 0.06
CD40 P1-D1 -114 -54 -4 0.07
D1-D7 16 64 169 0.22
P1-D7 -32 19 130 0.33
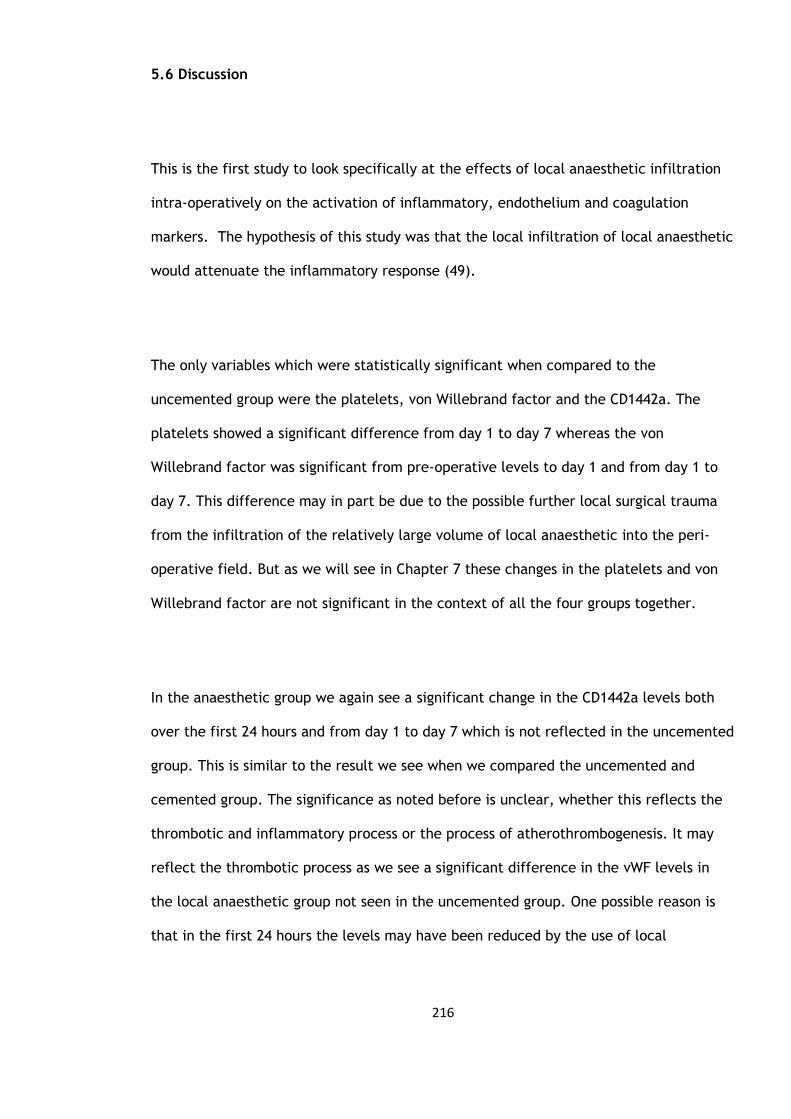
216
5.6 Discussion
This is the first study to look specifically at the effects of local anaesthetic infiltration
intra-operatively on the activation of inflammatory, endothelium and coagulation
markers. The hypothesis of this study was that the local infiltration of local anaesthetic
would attenuate the inflammatory response (49).
The only variables which were statistically significant when compared to the
uncemented group were the platelets, von Willebrand factor and the CD1442a. The
platelets showed a significant difference from day 1 to day 7 whereas the von
Willebrand factor was significant from pre-operative levels to day 1 and from day 1 to
day 7. This difference may in part be due to the possible further local surgical trauma
from the infiltration of the relatively large volume of local anaesthetic into the peri-
operative field. But as we will see in Chapter 7 these changes in the platelets and von
Willebrand factor are not significant in the context of all the four groups together.
In the anaesthetic group we again see a significant change in the CD1442a levels both
over the first 24 hours and from day 1 to day 7 which is not reflected in the uncemented
group. This is similar to the result we see when we compared the uncemented and
cemented group. The significance as noted before is unclear, whether this reflects the
thrombotic and inflammatory process or the process of atherothrombogenesis. It may
reflect the thrombotic process as we see a significant difference in the vWF levels in
the local anaesthetic group not seen in the uncemented group. One possible reason is
that in the first 24 hours the levels may have been reduced by the use of local

217
anaesthetic to a level so that as their levels rose back up again it became significant.
There is no difference as regards the changes in the CD40 level changes.
218
CHAPTER 6
The effect of using of a drain post-operatively on
the activation of markers of inflammation,
endothelium and coagulation after uncemented
total knee arthroplasty

219
6. Results
There were 20 patients recruited into this study, 2 patients were excluded from the
study due to superficial wound infections, leaving 18 patients. Both of the excluded
patients had positive wound cultures. One was successfully treated with antibiotics but
the other patient required a secondary procedure in the form of a wound wash-out.
These patients were excluded due to possible effects of the wound infection and wound
wash-out would have on the inflammatory response. The mean body mass index (BMI)
was 28.37kg/m2 with a standard deviation of 6.1. There were 6 males (mean age 70.3
years, standard deviation 3.98) and 12 females (mean age 64 years, standard deviation
10.32). A total of 6 total knee arthroplasties were carried out on the left and 12 on the
right. None of these characteristics was significantly different from the patients in the
uncemented group in Chapter 3.
6.1 Blood cell counts and CRP
The mean values, standard deviation and standard error of means of the white cell
count (WCC), neutrophils (Neutro), monocytes (Mono) and C-reactive protein (CRP) are
summarised below in table 6.1. Each of those variables were compared over three time
periods, from pre-operative values to day 1 post-operation (P1-D1), from day 1 to day 7
post-operation (D1-D7) and from pre-operative to day 7 post-operation (P1-D7), the
results of which are summarised in table 6.2.

220
The platelet count fell then rose significantly (Figure 6.1). The white cell count rose
then fell significantly (Figure 6.2) but the neutrophils did not show a significant change
(Figure 6.3). The monocytes showed a significant rise in the first 24 hours and were still
significantly higher than the pre-operative levels at day 7 (p=0.00) (Figure 6.4). C-
reactive protein levels (Figure 6.5), which were significantly higher at day 1 and 7.
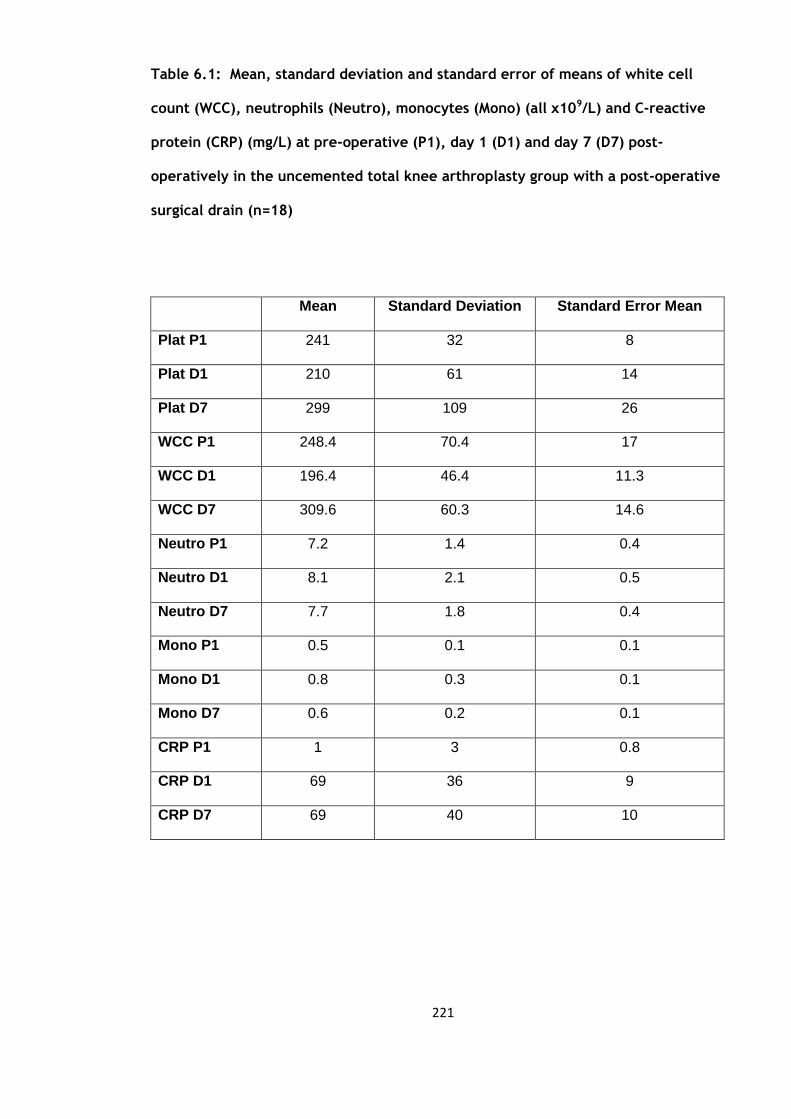
221
Table 6.1: Mean, standard deviation and standard error of means of white cell
count (WCC), neutrophils (Neutro), monocytes (Mono) (all x109/L) and C-reactive
protein (CRP) (mg/L) at pre-operative (P1), day 1 (D1) and day 7 (D7) post-
operatively in the uncemented total knee arthroplasty group with a post-operative
surgical drain (n=18)
Mean Standard Deviation Standard Error Mean
Plat P1 241 32 8
Plat D1 210 61 14
Plat D7 299 109 26
WCC P1 248.4 70.4 17
WCC D1 196.4 46.4 11.3
WCC D7 309.6 60.3 14.6
Neutro P1 7.2 1.4 0.4
Neutro D1 8.1 2.1 0.5
Neutro D7 7.7 1.8 0.4
Mono P1 0.5 0.1 0.1
Mono D1 0.8 0.3 0.1
Mono D7 0.6 0.2 0.1
CRP P1 1 3 0.8
CRP D1 69 36 9
CRP D7 69 40 10

222
Table 6.2: Paired sample t-tests of WCC, neutrophils, monocytes and CRP in the
uncemented total knee arthroplasty group with a post-operative surgical drain
(n=18)
Mean Standard Deviation P value
Plat P1-D1 31 54 0.02
D1-D7 89 70 <0.01
P1-D7 58 97 0.02
WCC P1-D1 52.0 34.6 <0.01
D1-D7 -113.2 49.2 <0.01
P1-D7 -61.2 57.7 <0.01
Neutro P1-D1 -0.9 2.1 0.09
D1-D7 0.5 2.3 0.42
P1-D7 -0.4 1.4 0.23
Mono P1-D1 -1.6 2.1 0.01
D1-D7 0.6 1.9 0.24
P1-D7 -1.0 1.3 0.01
CRP P1-D1 -68 37 <0.01
D1-D7 0.1 61 0.99
P1-D7 -68 40 <0.01
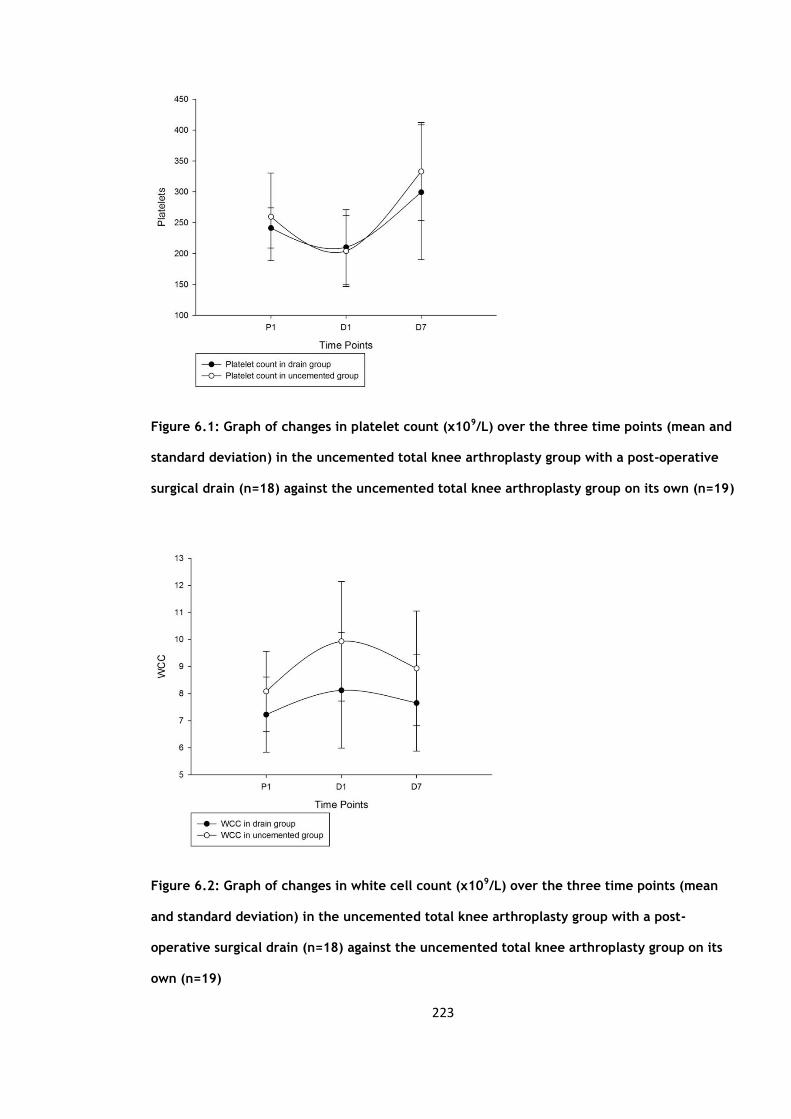
223
Figure 6.1: Graph of changes in platelet count (x109/L) over the three time points (mean and
standard deviation) in the uncemented total knee arthroplasty group with a post-operative
surgical drain (n=18) against the uncemented total knee arthroplasty group on its own (n=19)
Figure 6.2: Graph of changes in white cell count (x109/L) over the three time points (mean
and standard deviation) in the uncemented total knee arthroplasty group with a post-
operative surgical drain (n=18) against the uncemented total knee arthroplasty group on its
own (n=19)
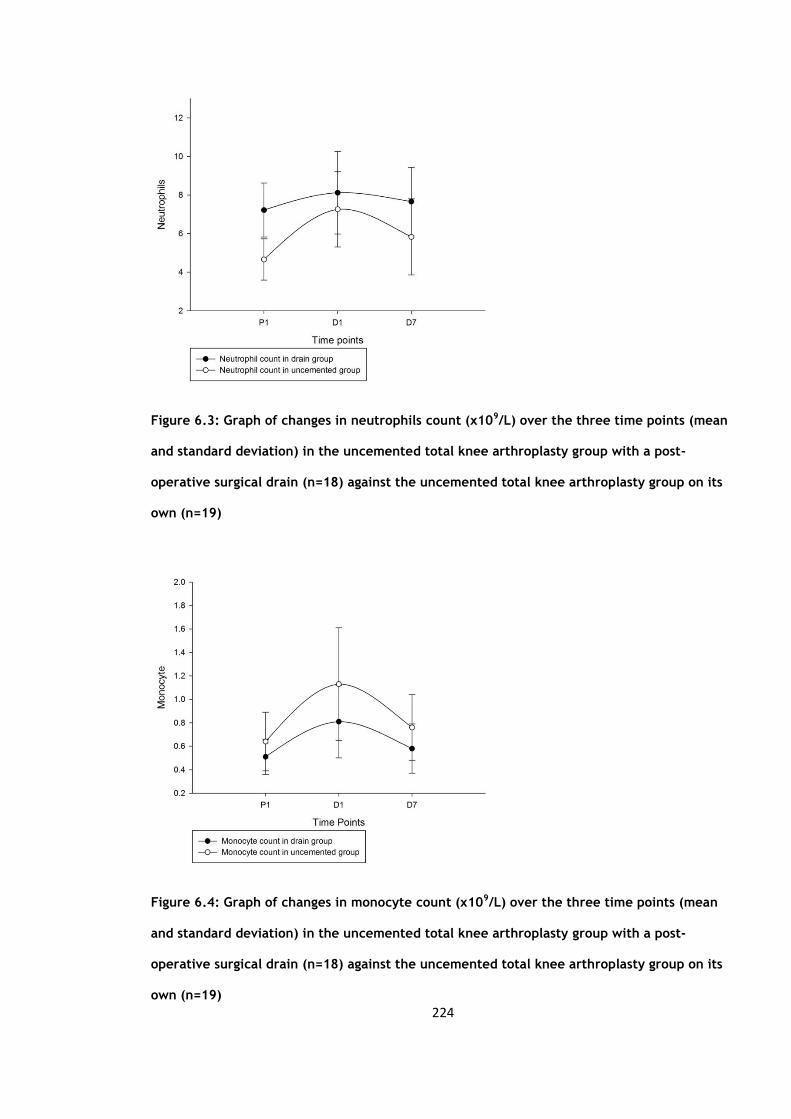
224
Figure 6.3: Graph of changes in neutrophils count (x109/L) over the three time points (mean
and standard deviation) in the uncemented total knee arthroplasty group with a post-
operative surgical drain (n=18) against the uncemented total knee arthroplasty group on its
own (n=19)
Figure 6.4: Graph of changes in monocyte count (x109/L) over the three time points (mean
and standard deviation) in the uncemented total knee arthroplasty group with a post-
operative surgical drain (n=18) against the uncemented total knee arthroplasty group on its
own (n=19)

225
Figure 6.5: Graph of changes in C-reactive protein (mg/l) level over the three time points
(mean and standard deviation) in the uncemented total knee arthroplasty group with a post-
operative surgical drain (n=18) against the uncemented total knee arthroplasty group on its
own (n=19)
226
6.3 Circulating activation markers
The mean, standard deviations and standard error of means of tissue plasminogen
activator (t-PA), von Willebrand factor (vWF), soluble CD40 ligand (sCD40L), interleukin
6 (IL-6), tumour necrosis factor (TNFα) and e-selectin are summarised in table 6.3a & b.
Each variable was then compared over the three time points from pre-operative values
to day 1 post-operation (P1-D1), from day 1 to day 7 post-operation (D1-D7) and from
pre-operative to day 7 post-operation (P1-D7) (Table 6.4a & b).

227
Table 6.3a: Mean, standard deviations and standard error of means of tissue
plasminogen activator (t-PA) (ng/ml), von Willebrand factor (vWF) (IU/dl), soluble
CD40 ligand (sCD40L) (pg/ml), interleukin 6 (IL6) (pg/ml) and tumour necrosis factor
(TNFα) (pg/ml) in the uncemented total knee arthroplasty group with a post-
operative surgical drain (n=18)
Mean Standard Deviation Standard Error Mean
t-PA P1 13.1 3.6 0.9
t-PA D1 13.5 4.4 1.2
t-PA D7 17.3 7.7 2.0
vWF P1 125 47 12
vWF D1 192 81 21
vWF D7 222 64 17
sCD40L P1 5233 2383 615
sCD40L D1 3605 2106 544
sCD40L D7 6000 2711 699
IL6 P1 3.9 2.0 0.5
IL6 D1 137.8 88.5 22.8
IL6 D7 42.9 84.4 21.8

228
Table 6.3b: Median and Inter-quartile ranges (IQR) of e-selectin (ng/ml) in the
uncemented total knee arthroplasty group with a post-operative surgical drain
(n=18)
Percentiles
25th 50th (Median) 75th
E-selectin P1 21.3 24.9 39.1
D1 17.0 25.9 31.2
D7 20.7 25.8 32.9
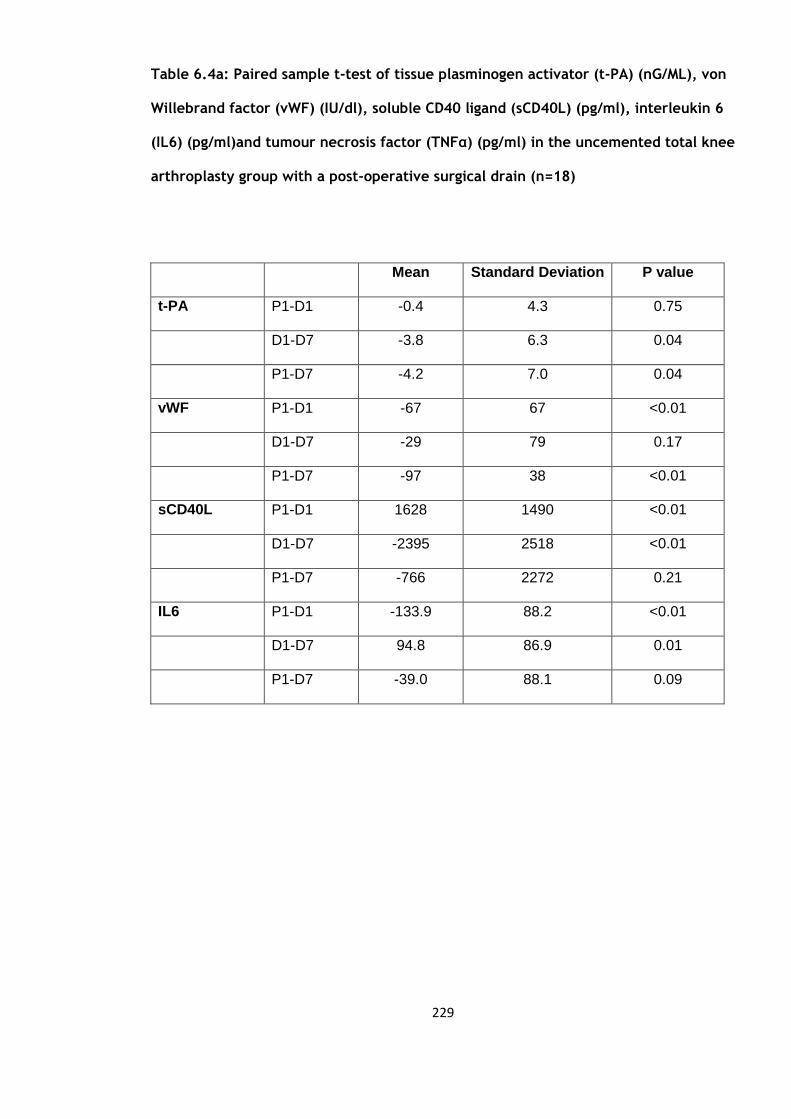
229
Table 6.4a: Paired sample t-test of tissue plasminogen activator (t-PA) (nG/ML), von
Willebrand factor (vWF) (IU/dl), soluble CD40 ligand (sCD40L) (pg/ml), interleukin 6
(IL6) (pg/ml)and tumour necrosis factor (TNFα) (pg/ml) in the uncemented total knee
arthroplasty group with a post-operative surgical drain (n=18)
Mean Standard Deviation P value
t-PA P1-D1 -0.4 4.3 0.75
D1-D7 -3.8 6.3 0.04
P1-D7 -4.2 7.0 0.04
vWF P1-D1 -67 67 <0.01
D1-D7 -29 79 0.17
P1-D7 -97 38 <0.01
sCD40L P1-D1 1628 1490 <0.01
D1-D7 -2395 2518 <0.01
P1-D7 -766 2272 0.21
IL6 P1-D1 -133.9 88.2 <0.01
D1-D7 94.8 86.9 0.01
P1-D7 -39.0 88.1 0.09

230
Table 6.4b: Wilcoxon signed rank test for e-selectin (ng/ml) in the uncemented total
knee arthroplasty group with a post-operative surgical drain (n=18)
P-value
E-selectin P1-D1 0.06
D1-D7 0.30
P1-D7 0.92

231
The t-PA levels showed a rise which was maintained to day 7 (p=0.04) (Figure 6.6). The
vWF was significant at 24 hours and remained so at day 7 when compared to the pre-
operative levels (p=0.00) (Figure 6.7). The levels of sCD40L fell significantly in the first
24 hours and rose from day 1 to day 7 (p=0.00) (Figure 6.8). IL6 levels rose significantly
to day 7 (p=0.00) (Figure 6.9). E-selectin did not change significantly (Figure 6.10).
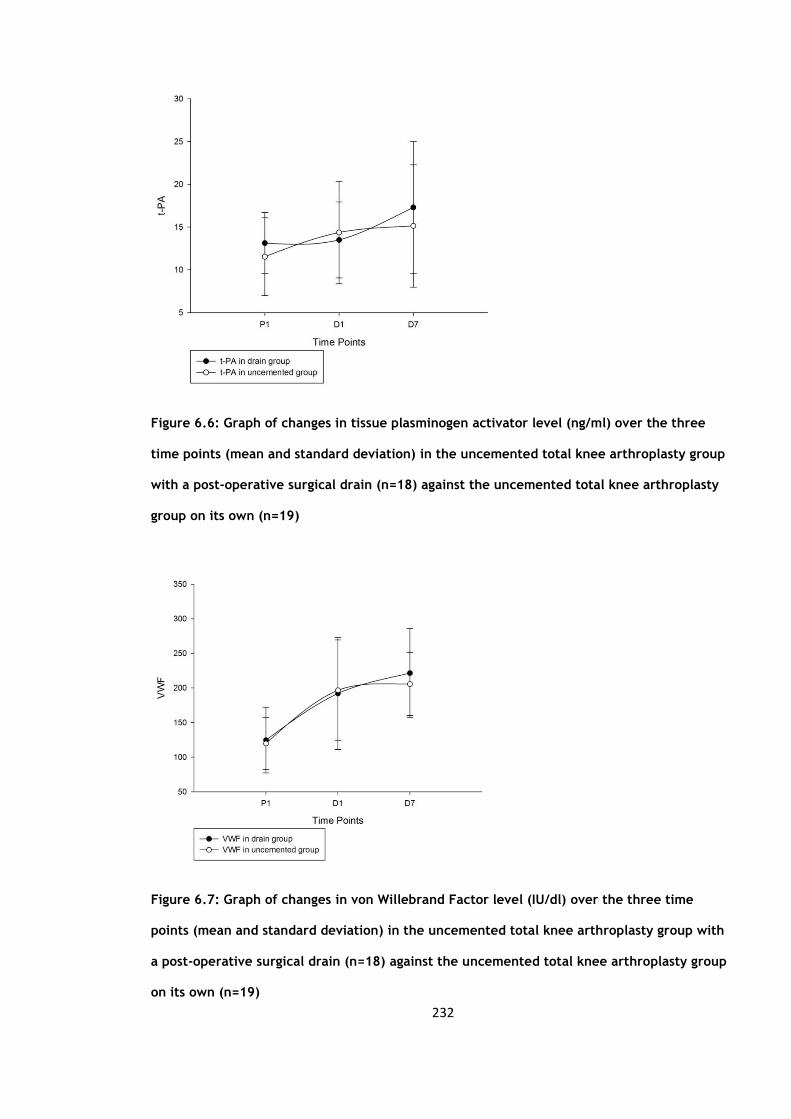
232
Figure 6.6: Graph of changes in tissue plasminogen activator level (ng/ml) over the three
time points (mean and standard deviation) in the uncemented total knee arthroplasty group
with a post-operative surgical drain (n=18) against the uncemented total knee arthroplasty
group on its own (n=19)
Figure 6.7: Graph of changes in von Willebrand Factor level (IU/dl) over the three time
points (mean and standard deviation) in the uncemented total knee arthroplasty group with
a post-operative surgical drain (n=18) against the uncemented total knee arthroplasty group
on its own (n=19)

233
Figure 6.8: Graph of changes in soluble CD40 ligand level (pg/ml) over the three time points
(mean and standard deviation) in the uncemented total knee arthroplasty group with a post-
operative surgical drain (n=18) against the uncemented total knee arthroplasty group on its
own (n=19)
Figure 6.9: Graph of changes in interleukin 6 level (pg/ml) over the three time points (mean
and standard deviation) in the uncemented total knee arthroplasty group with a post-
operative surgical drain (n=18) against the uncemented total knee arthroplasty group on its
own (n=19)
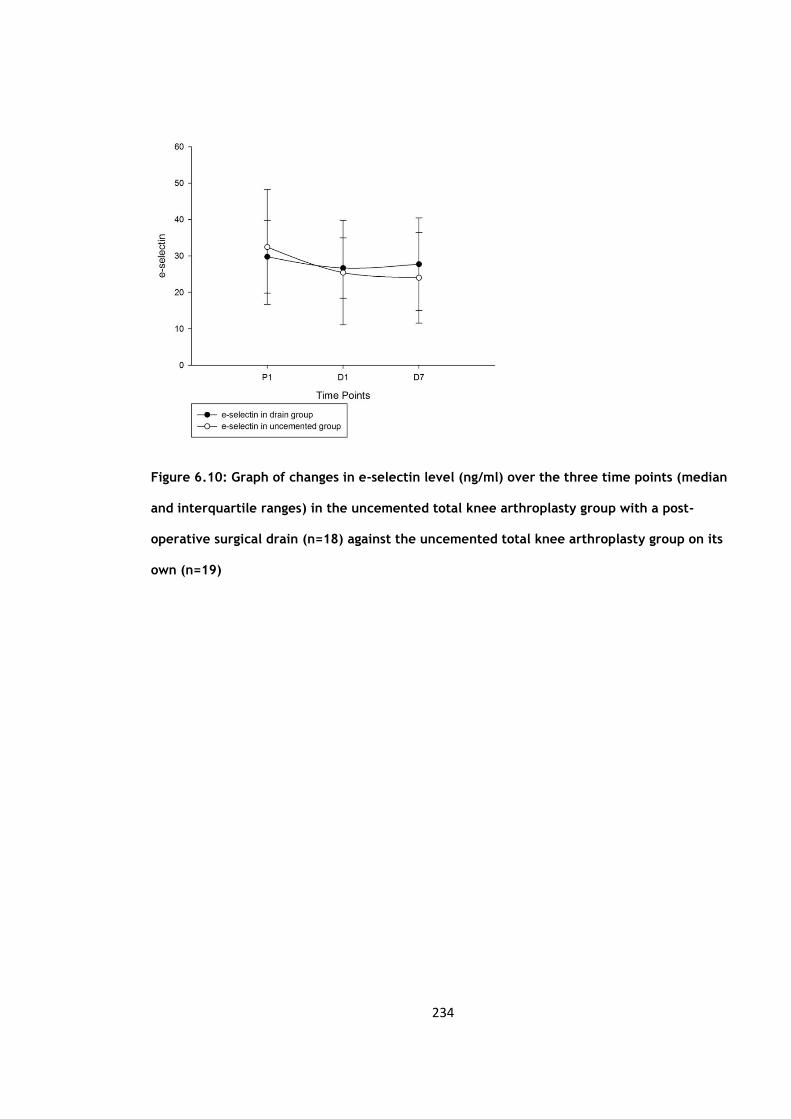
234
Figure 6.10: Graph of changes in e-selectin level (ng/ml) over the three time points (median
and interquartile ranges) in the uncemented total knee arthroplasty group with a post-
operative surgical drain (n=18) against the uncemented total knee arthroplasty group on its
own (n=19)

235
6.4 Flow cytometry assays of cell cytokine expression
The mean, standard deviation and standard error of mean of the CD1442a and CD40
levels are summarised in table 6.6a & b for both absolute (cell counts) and percentage
values.
The flow results were then analysed to look at changes between the three time points,
the results of which are summarised in table 6.7a & b.
There were no significant changes in the CD1442a counts at any of the three time points
for either the absolute or percentage levels (Figure 6.11). The CD40 counts fell
significantly in the first 24 hours (P1 to D1) only (p=0.009) (Figure 6.12).
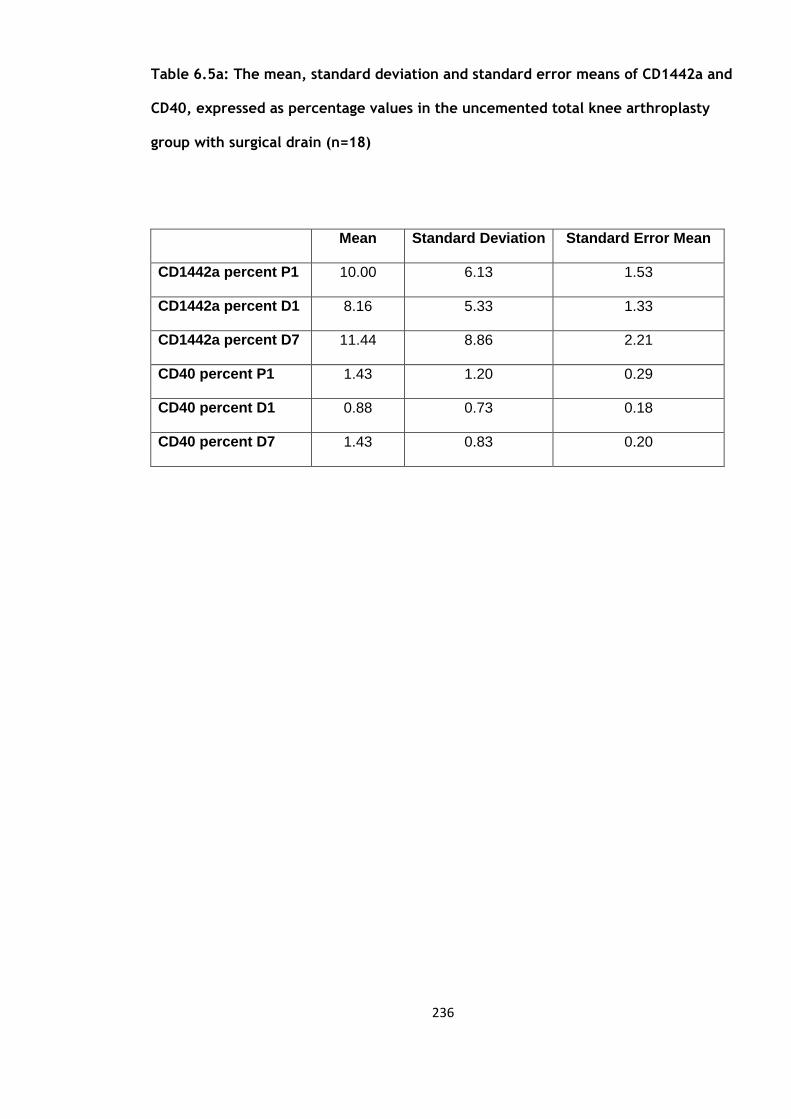
236
Table 6.5a: The mean, standard deviation and standard error means of CD1442a and
CD40, expressed as percentage values in the uncemented total knee arthroplasty
group with surgical drain (n=18)
Mean Standard Deviation Standard Error Mean
CD1442a percent P1 10.00 6.13 1.53
CD1442a percent D1 8.16 5.33 1.33
CD1442a percent D7 11.44 8.86 2.21
CD40 percent P1 1.43 1.20 0.29
CD40 percent D1 0.88 0.73 0.18
CD40 percent D7 1.43 0.83 0.20

237
Table 6.5b: Median and Inter-quartile ranges (IQR) of CD1442a and CD40, expressed
as absolute values in the uncemented total knee arthroplasty group with surgical
drain (n=18)
Percentiles
25th 50th (Median) 75th
CD1442a P1 527 1262 1533
D1 181 1022 1188
D7 399 1118 2154
CD40 P1 62 122 186
D1 42 58 131
D7 73 129 303

238
Table 6.6a: Mean, standard deviation and p values of CD1442a and CD40 expressed
as percentage values in the uncemented total knee arthroplasty group with surgical
drain (n=18)
Mean Standard deviation P value
CD1442a
percentage
P1-D1 1.8 5.2 0.18
D1-D7 -3.3 7.4 0.09
P1-D7 -1.4 6.3 0.37
CD40
percentage
P1-D1 0.5 0.8 0.01
D1-D7 -0.5 0.7 >0.01
P1-D7 -0.01 0.9 0.99

239
Table 6.6b: Wilcoxon signed rank test for CD1442a andCD40 absolute values in the
uncemented total knee arthroplasty group with surgical drain (n=18)
P-value
CD1442a P1-D1 0.05
D1-D7 0.20
P1-D7 0.27
CD40 P1-D1 0.01
D1-D7 <0.01
P1-D7 0.18

240
Figure 6.11: Graph of changes in CD1442a counts over the three time points (median and
interquartile ranges) in the uncemented total knee arthroplasty group with surgical drain
(n=18) against the uncemented total knee arthroplasty group on its own (n=19)
Figure 6.12: Graph of changes in CD40 counts over the three time points (median and
interquartile ranges) in the uncemented total knee arthroplasty group with surgical drain
(n=18) against the uncemented total knee arthroplasty group on its own (n=19)

241
6.5 Uncemented group versus the group with a surgical drain to assess any effect
this would have on the inflammatory and endothelial response.
The groups were compared using independent sample t-test to look for significant
differences in the inflammatory and endothelial response with the additional use of a
surgical drain post-operatively for 24 hours.
The table below summarises the results of the independent sample t-tests for the blood
parameters (table 6.9).
The only blood parameter which was significantly different between the two groups was
the change in monocyte counts in the first 24 hours (p=0.04) (Figure 6.13). Here the
monocytes rose less significantly then the uncemented group.

242
Table 6.7: Mean difference, standard error difference and significance of blood
parameters between uncemented total knee arthroplasty group with surgical drain
(n=18) and the uncemented total knee arthroplasty group on its own (n=19).
Mean difference Standard error
difference
P value
Platelets P1-D1 -4 13 0.76
D1-D7 16 17 0.36
P1-D7 34 28 0.23
White Cell
Count
P1-D1 1.5 0.9 0.08
D1-D7 -0.6 0.7 0.43
P1-D7 1.0 0.7 0.18
Neutrophils P1-D1 1.4 0.8 0.07
D1-D7 -0.9 0.7 0.19
P1-D7 0.5 0.6 0.41
Monocytes P1-D1 0.2 0.1 0.04
D1-D7 -0.1 0.1 0.25
P1-D7 0.1 0.1 0.29
C-reactive
protein
P1-D1 1 13 0.91
D1-D7 -0.4 18 0.98
P1-D7 1 12 0.93
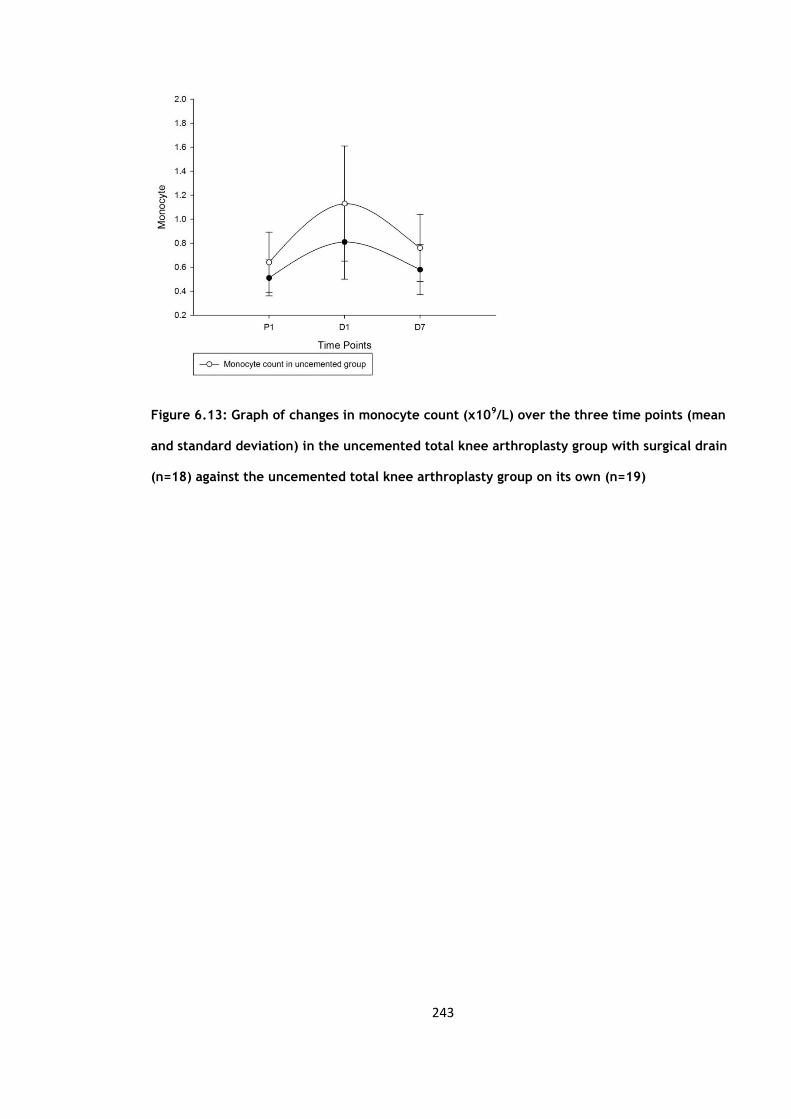
243
Figure 6.13: Graph of changes in monocyte count (x109/L) over the three time points (mean
and standard deviation) in the uncemented total knee arthroplasty group with surgical drain
(n=18) against the uncemented total knee arthroplasty group on its own (n=19)

244
The table below (Table 6.8a & b) is a summary of the results when we compare the
tissue plasminogen activator (t-PA), von Willebrand factor (vWF), soluble CD40 ligand
(sCD40L), interleukin 6 (IL-6), tumour necrosis factor alpha (TNFα) and e-selectin levels
between the two groups. There does not appear to have been a statistically significant
difference with the additional usage of a post-operative drain.
In terms of the flow cytometry results (Table 6.9a & b) there were no significant
difference between the uncemented group and the group with the additional use of a
surgical drain. The changes in the drain group did not show a statistically significant
difference with regards to the CRP levels, although the IL-6 levels in this group were
only significantly elevated from day 1 to day 7 the changes in their levels were not
significantly different to that of the uncemented group.
There was no difference in the t-PA, vWF and e-selectin levels. The sCD40L showed a
significant change in the first 24 hours and from day1 to day 7, similar to that of the
cemented group. But when we look at the difference in the levels between the three
time point we se that there is no difference between the drain and uncemented group.
There was also no difference in the change in the CD1442a and CD40 levels.
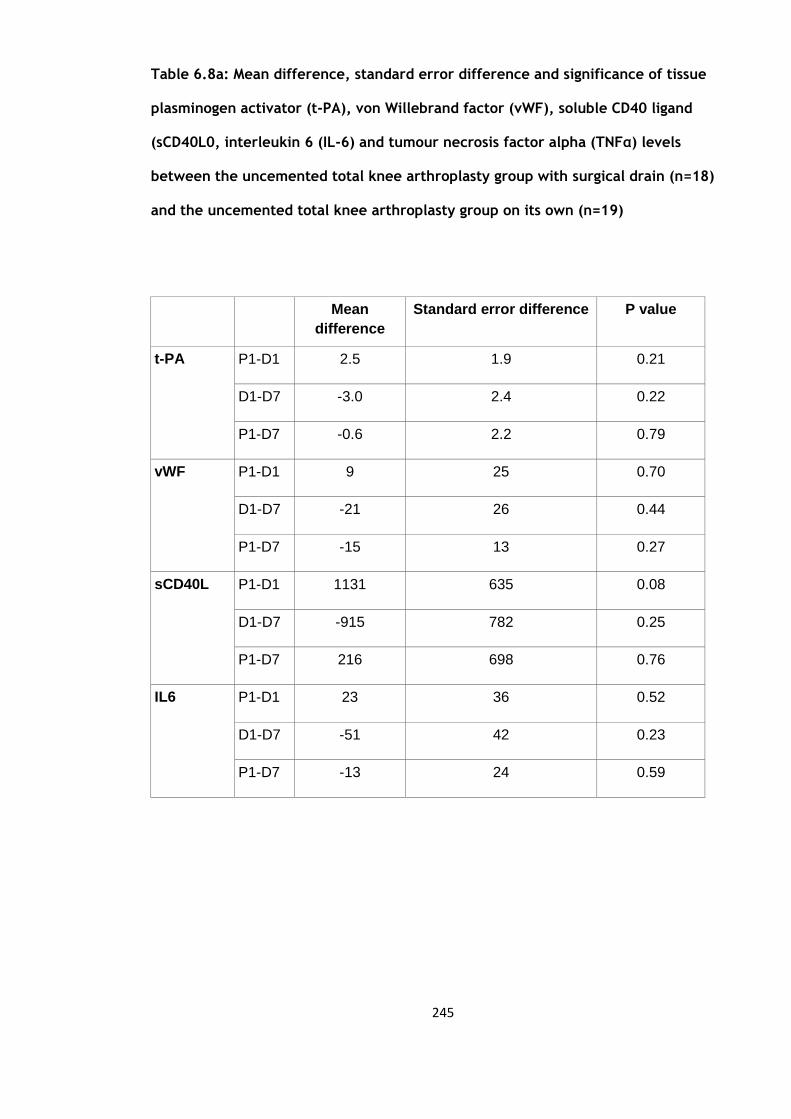
245
Table 6.8a: Mean difference, standard error difference and significance of tissue
plasminogen activator (t-PA), von Willebrand factor (vWF), soluble CD40 ligand
(sCD40L0, interleukin 6 (IL-6) and tumour necrosis factor alpha (TNFα) levels
between the uncemented total knee arthroplasty group with surgical drain (n=18)
and the uncemented total knee arthroplasty group on its own (n=19)
Mean
difference
Standard error difference P value
t-PA P1-D1 2.5 1.9 0.21
D1-D7 -3.0 2.4 0.22
P1-D7 -0.6 2.2 0.79
vWF P1-D1 9 25 0.70
D1-D7 -21 26 0.44
P1-D7 -15 13 0.27
sCD40L P1-D1 1131 635 0.08
D1-D7 -915 782 0.25
P1-D7 216 698 0.76
IL6 P1-D1 23 36 0.52
D1-D7 -51 42 0.23
P1-D7 -13 24 0.59

246
Table 6.8b: Mann-Whitney U test for e-selectin (ng/ml) between the uncemented
total knee arthroplasty group with surgical drain (n=18) and the uncemented total
knee arthroplasty group on its own (n=19)
Percentiles
P-value
25th
50th (Median)
(Median
75th
E-selectin P1-D1 -6.3 -4.3 1.5 0.52
D1-D7 -3.4 0.1 3.6 0.56
P1-D7 -9.9 -2.7 1.9 0.29

247
Table 6.9a: Mean difference, standard error difference and significance of CD1442a
and CD40 percentage values between the uncemented total knee arthroplasty group
with surgical drain (n=18) and the uncemented total knee arthroplasty group on its
own (n=19).
Mean difference Standard error
difference
P value
CD1442a
percentage
P1-D1 2.2 1.5 0.16
D1-D7 -2.4 2.2 0.28
P1-D7 -0.2 2.0 0.93
CD40
percentage
P1-D1 0.2 0.2 0.48
D1-D7 -6.1 3.4 0.07
P1-D7 -5.9 3.3 0.09
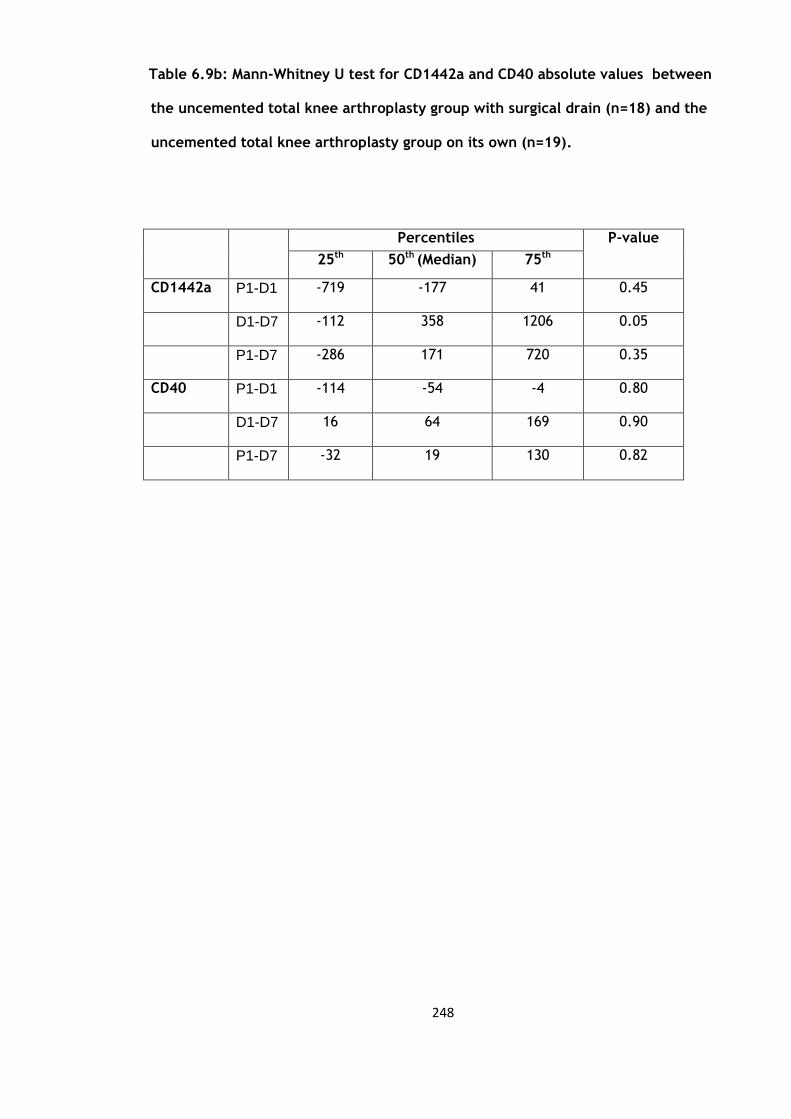
248
Table 6.9b: Mann-Whitney U test for CD1442a and CD40 absolute values between
the uncemented total knee arthroplasty group with surgical drain (n=18) and the
uncemented total knee arthroplasty group on its own (n=19).
Percentiles
P-value
25th
50th (Median)
(Median
75th
CD1442a P1-D1 -719 -177 41 0.45
D1-D7 -112 358 1206 0.05
P1-D7 -286 171 720 0.35
CD40 P1-D1 -114 -54 -4 0.80
D1-D7 16 64 169 0.90
P1-D7 -32 19 130 0.82

249
6.6 Discussion
This is the first study to specifically look at the effect of the use of a post-operative
drain on the activation of markers of inflammation, endothelium and coagulation in TKA
patients. The hypothesis of this study was that the use of a surgical drain would allow
for the local inflammatory mediators such as IL-6 and TNFα to drain away from the
operative site and so attenuate the local inflammatory response (215)
In this group this use of a drain post-operatively did not affect the CRP response which
was similar to that of the uncemented group. However the IL6 response was different in
that there was no significant rise in the first 24 hours and rose significantly from day 1
to day 7, even then the levels reached were not significantly higher that those of the
pre-operative levels. Therefore there is some suggestion that the use of a drain may
somehow dampen the local IL-6 response although this was not statistically different to
the uncemented group or all four groups combined (Chapter 7).
Both the CD1442a and CD40 levels show similar changes but was not statistically
different when compared to the uncemented group.

250
CHAPTER 7
Comparison of the four study groups and
collaboration of the results

251
7.1 Introduction
During the data collection and following analysis of the variables in the previous
chapters we can see that although there were significant changes following total knee
arthroplasty there was no significance when the groups were compared, except for the
flow cytometry comparison with the cemented group.
This aim of this chapter was to formally compare the changes in those variables across
all four groups. These will then be collated to present the effects of total knee
arthroplasty on the activation of markers of endothelium, inflammation and coagulation
in 76 patients, which will be the single largest study to date to report these findings.
7.2 Statistical analysis
For the parametric data repeated measures ANOVA was used to look for statistical
difference in the variables between groups. A p value of less than or equal to 0.05 was
considered to be significant. The group was analysed as a whole, utilising repeated
measures ANOVA with group (cemented, uncemented, local anaesthetic and drain) as a
between subjects factor and time as a within subjects factor. Age, sex and BMI were
covariates. A Bonferroni correction for multiple comparisons was performed.
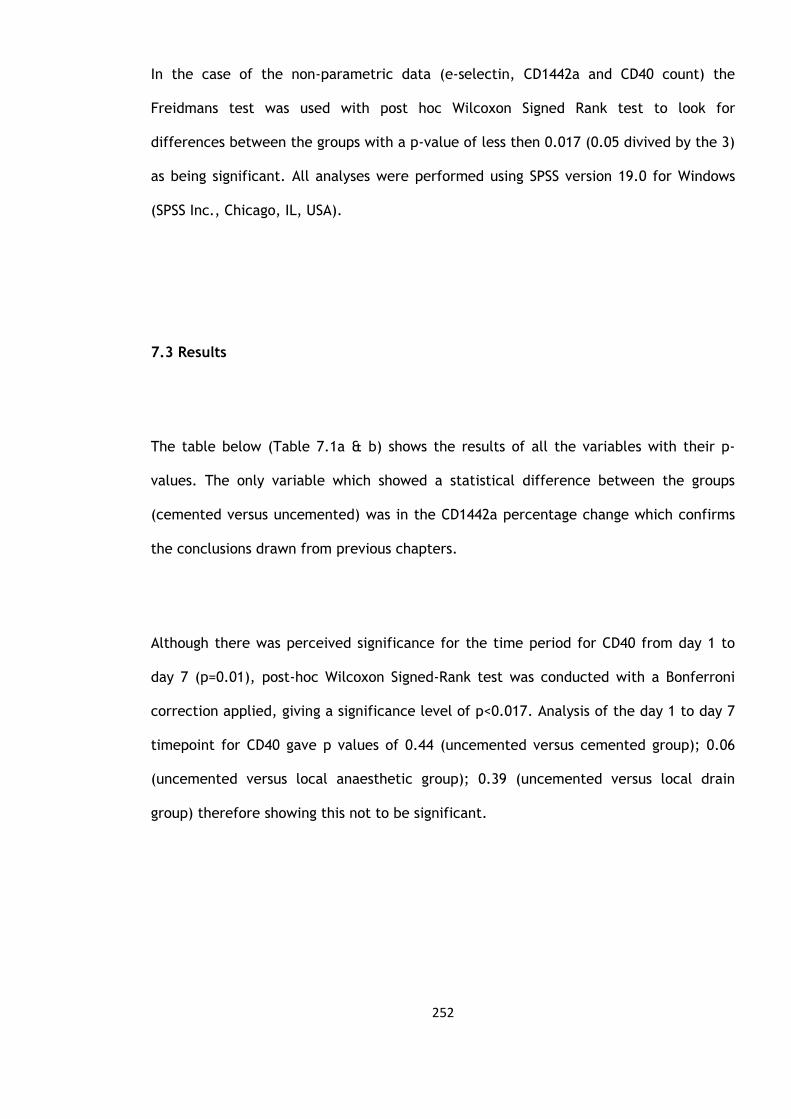
252
In the case of the non-parametric data (e-selectin, CD1442a and CD40 count) the
Freidmans test was used with post hoc Wilcoxon Signed Rank test to look for
differences between the groups with a p-value of less then 0.017 (0.05 divived by the 3)
as being significant. All analyses were performed using SPSS version 19.0 for Windows
(SPSS Inc., Chicago, IL, USA).
7.3 Results
The table below (Table 7.1a & b) shows the results of all the variables with their p-
values. The only variable which showed a statistical difference between the groups
(cemented versus uncemented) was in the CD1442a percentage change which confirms
the conclusions drawn from previous chapters.
Although there was perceived significance for the time period for CD40 from day 1 to
day 7 (p=0.01), post-hoc Wilcoxon Signed-Rank test was conducted with a Bonferroni
correction applied, giving a significance level of p<0.017. Analysis of the day 1 to day 7
timepoint for CD40 gave p values of 0.44 (uncemented versus cemented group); 0.06
(uncemented versus local anaesthetic group); 0.39 (uncemented versus local drain
group) therefore showing this not to be significant.
253
Table 7.1a: Results of repeated measures ANOVA with p-values in all four total knee
arthroplasty groups except e-selectin and CD40 count (n=74)
Variables P value
Platelets 0.31
White cell count 0.62
Neutrophils 0.24
Monocytes 0.29
CRP 0.74
TPA 0.93
vWF 0.14
Soluble CD40L 0.75
IL6 0.99
TNF 0.84
CD1442a % <0.01
CD40 % 0.49
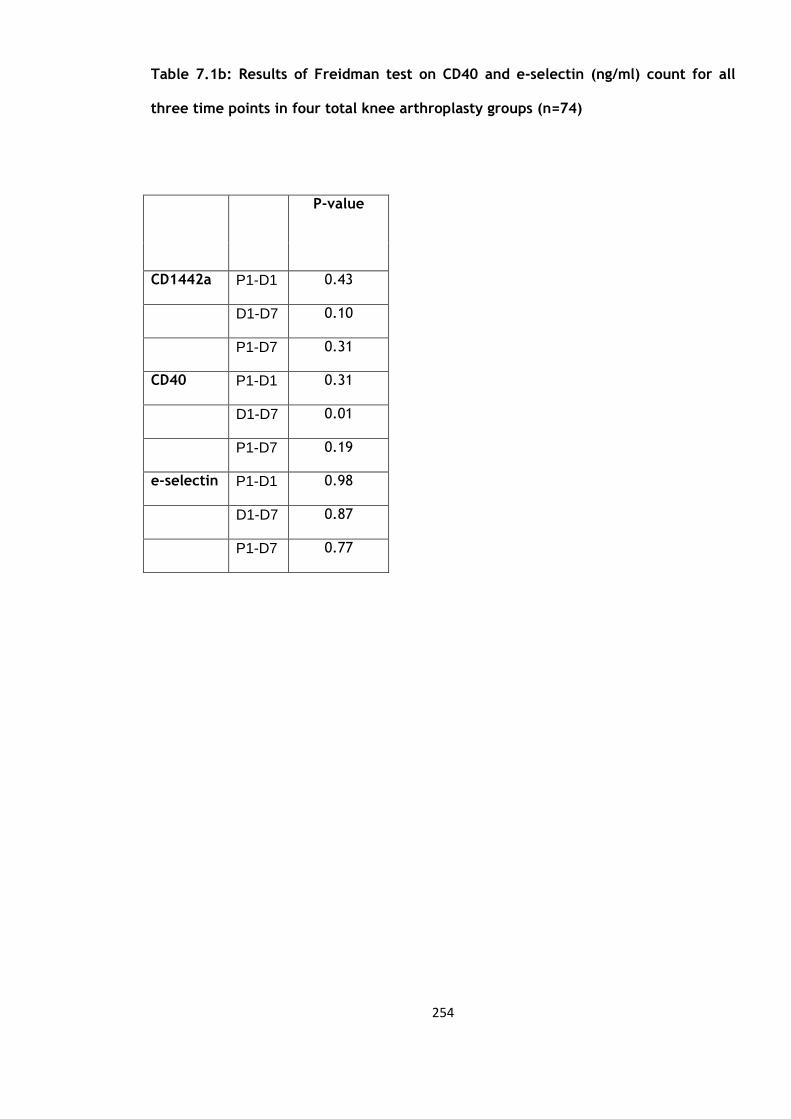
254
Table 7.1b: Results of Freidman test on CD40 and e-selectin (ng/ml) count for all
three time points in four total knee arthroplasty groups (n=74)
P-value
CD1442a P1-D1 0.43
D1-D7 0.10
P1-D7 0.31
CD40 P1-D1 0.31
D1-D7 0.01
P1-D7 0.19
e-selectin P1-D1 0.98
D1-D7 0.87
P1-D7 0.77

255
The data was then combined (excluding the data on CD1442a) and analysed to report
the changes between each of the three time points for the 76 patients (the only
exception was in the analysis of TNFα in only 40 patients). The mean, standard
deviation and standard error of mean are shown below in table 7.2a and the median and
IQRs for CD40 and e-selectin count in table 7.2b.
Table 7.3a & b demonstrates that all variables show a significant changes at all three
time point apart from e-selectin and C-reactive protein at the day 1 to day 7 time
period and interleukin 6 for the pre-operative to day 7 time period, reflecting and
confirming the results of the previous chapters. Graphs 7.1 to 7.12 are graphical
representations of the changes in table 7.3.
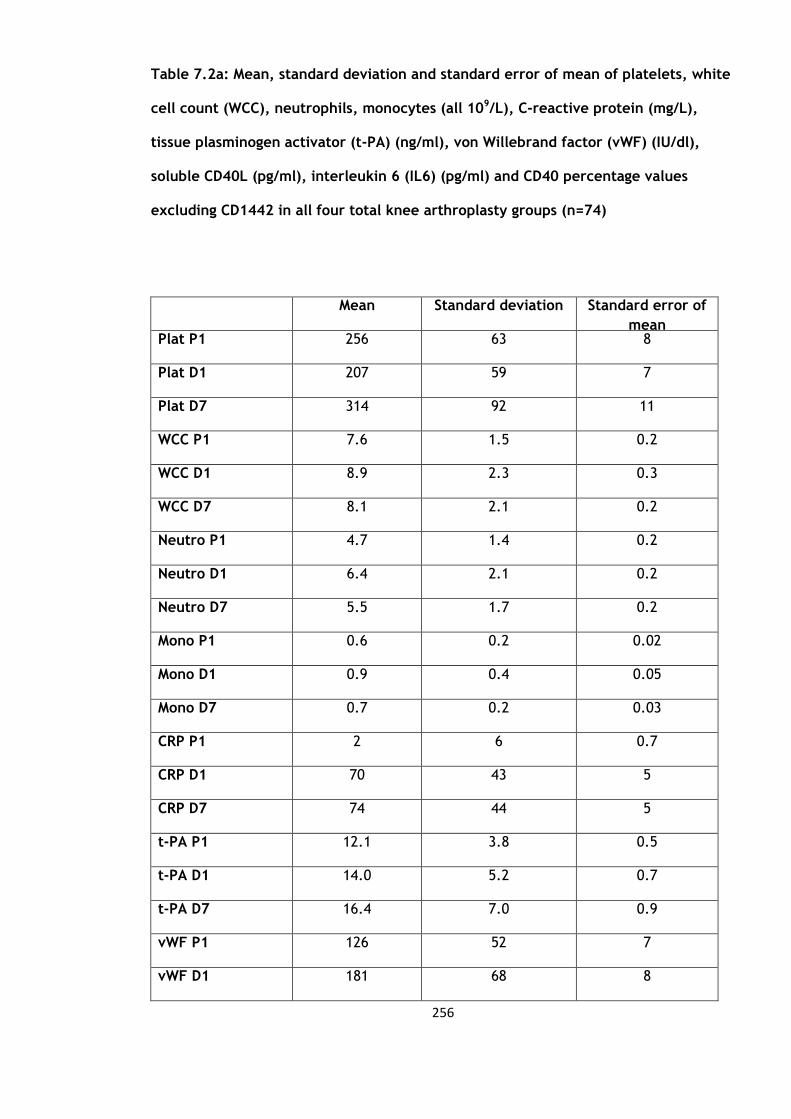
256
Table 7.2a: Mean, standard deviation and standard error of mean of platelets, white
cell count (WCC), neutrophils, monocytes (all 109/L), C-reactive protein (mg/L),
tissue plasminogen activator (t-PA) (ng/ml), von Willebrand factor (vWF) (IU/dl),
soluble CD40L (pg/ml), interleukin 6 (IL6) (pg/ml) and CD40 percentage values
excluding CD1442 in all four total knee arthroplasty groups (n=74)
Mean Standard deviation Standard error of
mean Plat P1 256 63 8
Plat D1 207 59 7
Plat D7 314 92 11
WCC P1 7.6 1.5 0.2
WCC D1 8.9 2.3 0.3
WCC D7 8.1 2.1 0.2
Neutro P1 4.7 1.4 0.2
Neutro D1 6.4 2.1 0.2
Neutro D7 5.5 1.7 0.2
Mono P1 0.6 0.2 0.02
Mono D1 0.9 0.4 0.05
Mono D7 0.7 0.2 0.03
CRP P1 2 6 0.7
CRP D1 70 43 5
CRP D7 74 44 5
t-PA P1 12.1 3.8 0.5
t-PA D1 14.0 5.2 0.7
t-PA D7 16.4 7.0 0.9
vWF P1 126 52 7
vWF D1 181 68 8
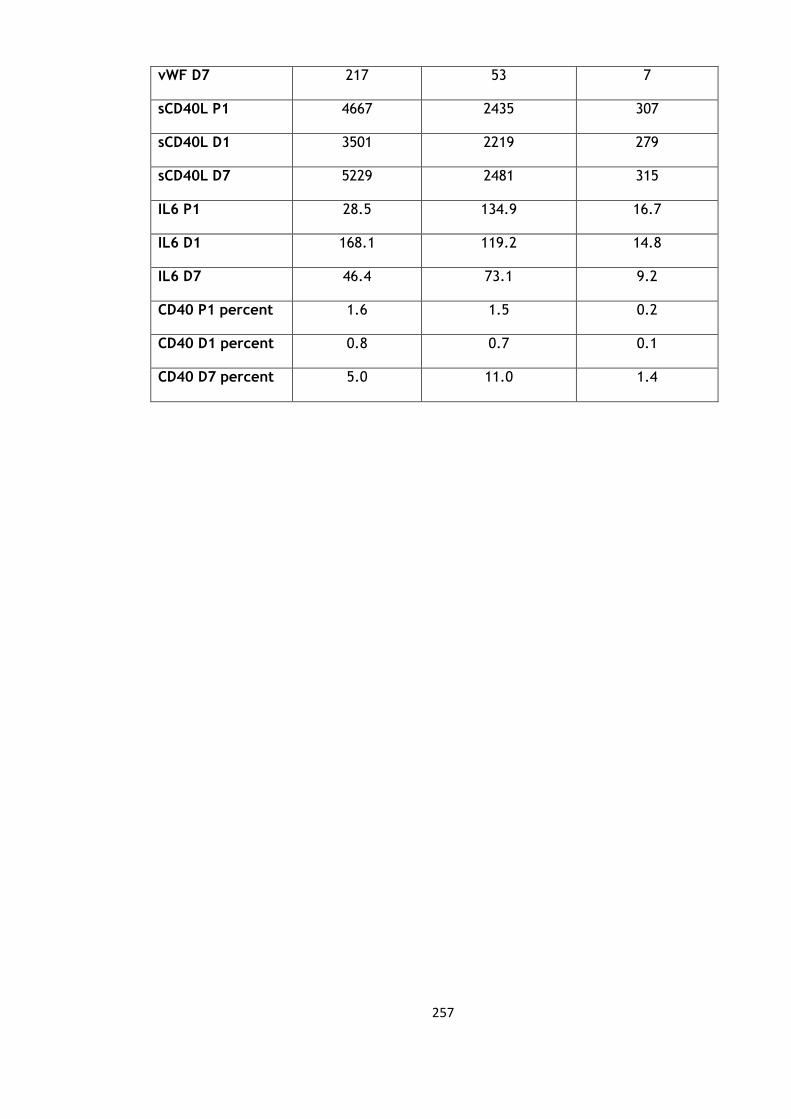
257
vWF D7 217 53 7
sCD40L P1 4667 2435 307
sCD40L D1 3501 2219 279
sCD40L D7 5229 2481 315
IL6 P1 28.5 134.9 16.7
IL6 D1 168.1 119.2 14.8
IL6 D7 46.4 73.1 9.2
CD40 P1 percent 1.6 1.5 0.2
CD40 D1 percent 0.8 0.7 0.1
CD40 D7 percent 5.0 11.0 1.4

258
Table 7.2b: Median and Inter-quartile ranges (IQR) of e-selectin (ng/ml) and CD40
count in all four total knee arthroplasty groups (n=74)
Percentiles
25th 50th (Median) 75th
E-selectin P1 -6.3 -4.3 1.5
D1 -3.4 0.1 3.6
D7 -9.9 -2.7 1.9
CD40 P1 -112.5 -49.0 -4.0
D1 16.0 66.0 174.0
D7 -18.0 24.0 139.0

259
Table 7.3a: Mean difference, standard error difference and significance of platelets,
white cell count, neutrophils, monocytes, C-reactive protein, tissue plasminogen
activator (t-PA), von Willebrand Factor (vWF), soluble CD40 ligand and CD40
percentage values in all four total knee arthroplasty groups (n=74)
Mean Standard deviation P value
Platelets P1-D1 49 46 <0.01
D1-D7 -107 60 <0.01
P1-D7 -58 80 <0.01
White Cell
Count
P1-D1 -1.2 1.9 <0.01
D1-D7 0.8 2.2 <0.01
P1-D7 -0.5 1.5 0.01
Neutrophils P1-D1 -1.7 2.0 <0.01
D1-D7 0.9 2.2 <0.01
P1-D7 -0.9 1.4 <0.01
Monocytes P1-D1 -0.4 0.3 <0.01
D1-D7 0.3 0.4 <0.01
P1-D7 -0.1 0.3 <0.01
C-reactive
protein
P1-D1 -68 40 <0.01
D1-D7 -3 62 0.70
P1-D7 -72 44 <0.01
t-PA P1-D1 -1.9 5.0 0.01
D1-D7 -2.4 6.6 0.01
P1-D7 -4.1 5.7 <0.01
vWF P1-D1 -55 61 <0.01
D1-D7 -69 61 <0.01
P1-D7 -90 44 <0.01
sCD40L P1-D1 1166 2082 <0.01
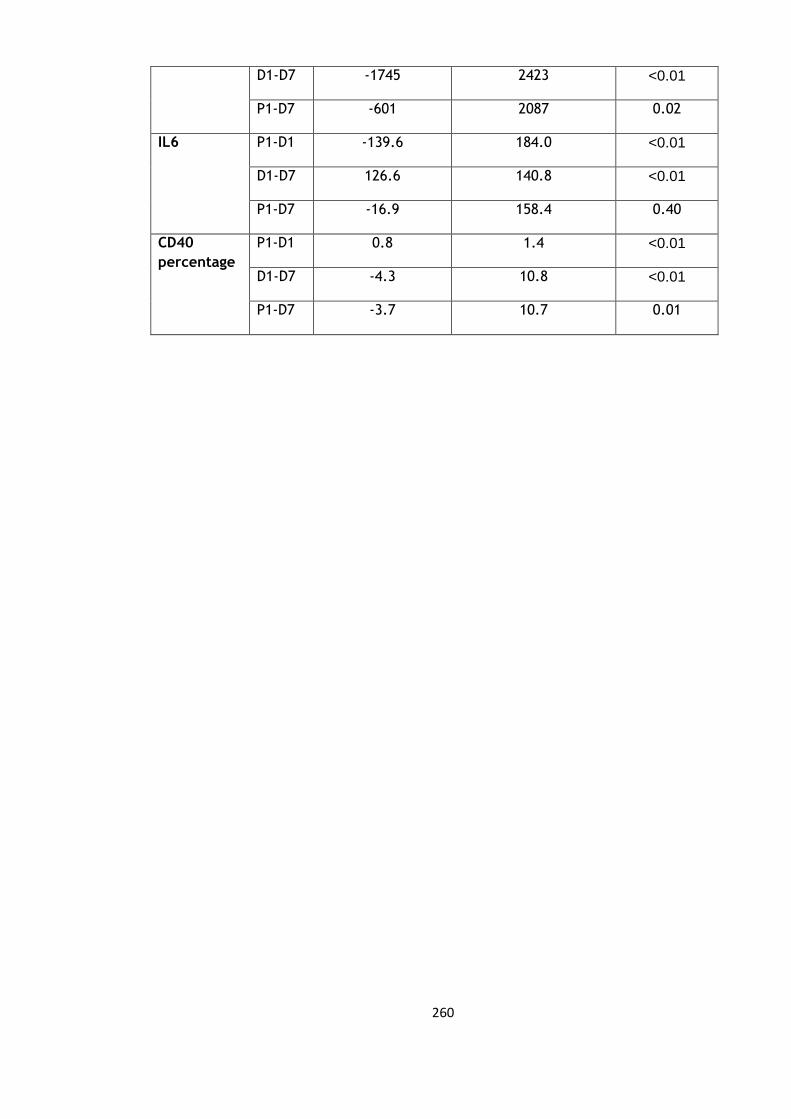
260
D1-D7 -1745 2423 <0.01
P1-D7 -601 2087 0.02
IL6 P1-D1 -139.6 184.0 <0.01
D1-D7 126.6 140.8 <0.01
P1-D7 -16.9 158.4 0.40
CD40
percentage
P1-D1 0.8 1.4 <0.01
D1-D7 -4.3 10.8 <0.01
P1-D7 -3.7 10.7 0.01

261
Table 7.4b: Wilcoxon signed rank test for eselectin and CD40 absolute values in all
four total knee arthroplasty groups (n=74)
P-value
e-selectin P1-D1 0.03
D1-D7 <0.01
P1-D7 0.99
CD40 P1-D1 <0.01
D1-D7 <0.01
P1-D7 <0.01

262
Figure 7.1: Graph of changes in platelet counts over the three time points (mean and
standard deviation) in all four total knee arthroplasty groups (n=74)
Figure 7.2: Graph of changes in white cell counts over the three time points (mean and
standard deviation) in all four total knee arthroplasty groups (n=74)

263
Figure 7.3: Graph of changes in neutrophil counts over the three time points (mean and
standard deviation) in all four total knee arthroplasty groups (n=74)
Figure 7.4: Graph of changes in monocyte counts over the three time points (mean and
standard deviation) in all four total knee arthroplasty groups (n=74)
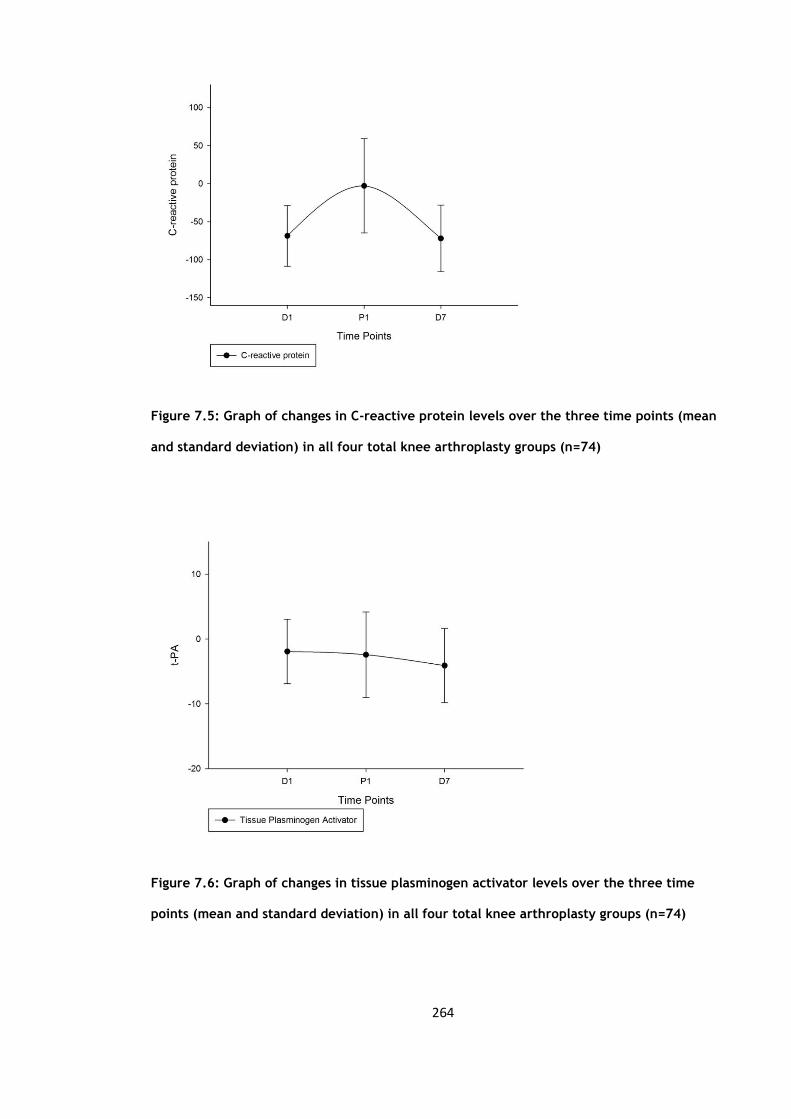
264
Figure 7.5: Graph of changes in C-reactive protein levels over the three time points (mean
and standard deviation) in all four total knee arthroplasty groups (n=74)
Figure 7.6: Graph of changes in tissue plasminogen activator levels over the three time
points (mean and standard deviation) in all four total knee arthroplasty groups (n=74)
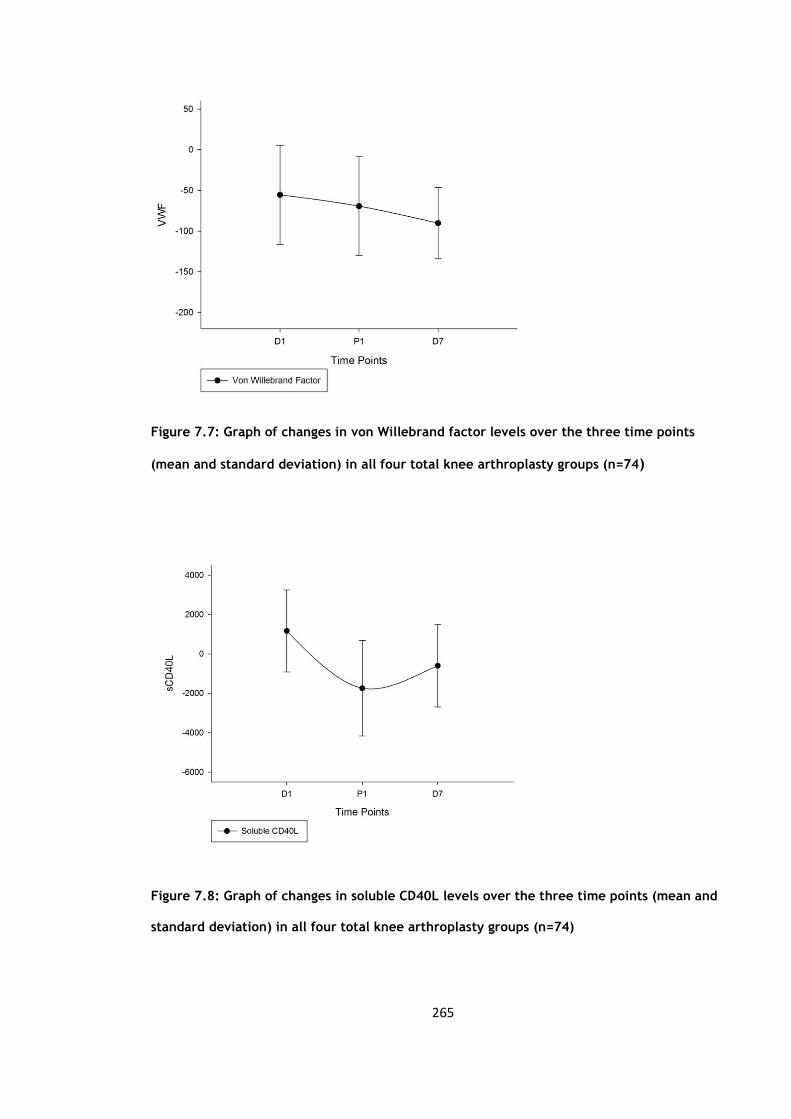
265
Figure 7.7: Graph of changes in von Willebrand factor levels over the three time points
(mean and standard deviation) in all four total knee arthroplasty groups (n=74)
Figure 7.8: Graph of changes in soluble CD40L levels over the three time points (mean and
standard deviation) in all four total knee arthroplasty groups (n=74)

266
Figure 7.9: Graph of changes in interleukin 6 levels over the three time points (mean and
standard deviation) in all four total knee arthroplasty groups (n=74)
Figure 7.10: Graph of changes in e-selectin levels over the three time points (median and
interquartile ranges) in all four total knee arthroplasty groups (n=74)

267
Figure 7.11: Graph of changes in CD40 levels over the three time points (median and
interquartile ranges) in all four total knee arthroplasty groups (n=74)
Figure 7.12: Graph of changes in CD40 percentage over the three time points (mean and
standard deviation) in all four total knee arthroplasty groups (n=74)
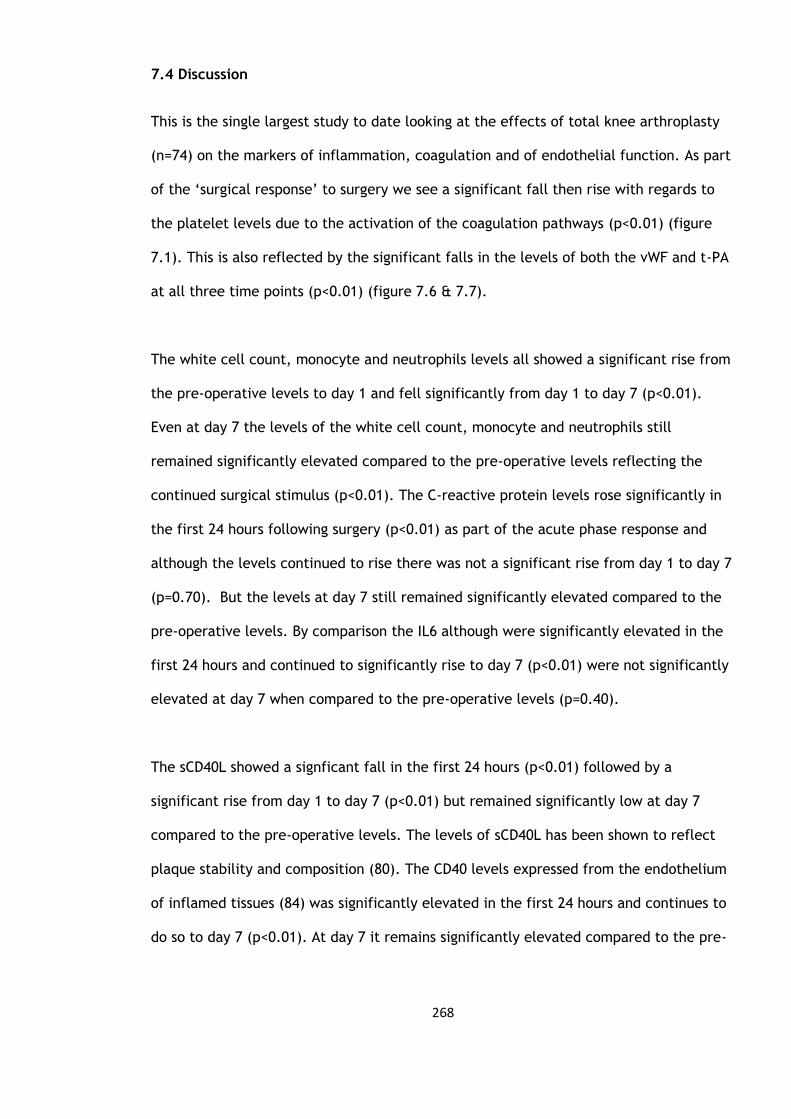
268
7.4 Discussion
This is the single largest study to date looking at the effects of total knee arthroplasty
(n=74) on the markers of inflammation, coagulation and of endothelial function. As part
of the ‘surgical response’ to surgery we see a significant fall then rise with regards to
the platelet levels due to the activation of the coagulation pathways (p<0.01) (figure
7.1). This is also reflected by the significant falls in the levels of both the vWF and t-PA
at all three time points (p<0.01) (figure 7.6 & 7.7).
The white cell count, monocyte and neutrophils levels all showed a significant rise from
the pre-operative levels to day 1 and fell significantly from day 1 to day 7 (p<0.01).
Even at day 7 the levels of the white cell count, monocyte and neutrophils still
remained significantly elevated compared to the pre-operative levels reflecting the
continued surgical stimulus (p<0.01). The C-reactive protein levels rose significantly in
the first 24 hours following surgery (p<0.01) as part of the acute phase response and
although the levels continued to rise there was not a significant rise from day 1 to day 7
(p=0.70). But the levels at day 7 still remained significantly elevated compared to the
pre-operative levels. By comparison the IL6 although were significantly elevated in the
first 24 hours and continued to significantly rise to day 7 (p<0.01) were not significantly
elevated at day 7 when compared to the pre-operative levels (p=0.40).
The sCD40L showed a signficant fall in the first 24 hours (p<0.01) followed by a
significant rise from day 1 to day 7 (p<0.01) but remained significantly low at day 7
compared to the pre-operative levels. The levels of sCD40L has been shown to reflect
plaque stability and composition (80). The CD40 levels expressed from the endothelium
of inflamed tissues (84) was significantly elevated in the first 24 hours and continues to
do so to day 7 (p<0.01). At day 7 it remains significantly elevated compared to the pre-

269
operative levels (p=0.01). CD40 has been shown to be involved in a variety of functions
from immunity to inflammation (84).
This study demonstrates that elective total knee arthroplasty results in significant
changes in the markers of inflammation, coagulation and of endothelial function.

270
CHAPTER 8
Discussion and Future Research
271
8.1 Discussion
There is very little in the current literature which investigates the effect of total knee
replacement on the markers of inflammation, endothelium and coagulation. The aim of
the studies undertaken in this thesis were to investigate such a potential association.
Although the instrumentation to undertake the knee replacement is generally
standardised there are variations which exits. Traditionally ‘bone cement’ would be
used to ‘cement in’ the prosthesis but an option now exists to implant these
uncemented. Some surgeons regularly use a post-operative surgical drain for 24-48
hours and with the current drive to increase efficiency and workload through the
National Health Service, local anaesthetic infiltration has been used intra-operatively to
improve post-operative pain control and patient mobilisation to allow for early
discharge. The other three studies in this thesis specifically examines the use of bone
cement, surgical drain and local anaesthetic and the effect on the markers of
inflammation, endothelium and coagulation.
In chapter 4 the cemented and uncemented groups were directly compare to one
another. The only parameter which showed a significant difference between the groups
was the CD1442a levels. The levels were significantly different in the first 24 hours
(p<0.01) and from day 1 to day 7 post-operatvely. The exact role of CD1442a is not
known, so the difference between these two groups with respect to the CD1442a levels
may reflect the impact that the cement has on the inflammatory and thrombotic
process or on its contribution to the ongoing atherothrombogenesis. A comparison
between the uncemented and local anaesthetic group (Chapter 5) revealed that both
the platelet and von Willebrand factor levels rose less significantly from day 1 to day 7.
There was no difference in the IL-6 levels between the groups which does not support

272
the in vitro studies which demonstrate that local anaesthetic results in attenuation of
the inflammatory response (49). When a comparison was made to the surgical drain
group the monocytes rose less from pre-operative levels to day 1 (p=0.04). The IL-6
levels compared to the uncemented group also showed a significant difference. Here
there was no significant rise in the first 24 hours as was seen in the uncemented group
and although the levels rose thereafter the day 7 levels were not significant compared
to the pre-operative levels. This would possibly support the hypothesis that the use of
the surgical drain allows the local IL-6 accumulation to drain away (215) and so
contribute less to the systemic response. The only variable which showed a statistically
significant difference in all three of the comparison groups was the CD1442a count. The
exact role of CD1442a is not clearly understood, whether it reflects the inflammatory
and thrombotic process or in fact directly contributes to the ongoing
atherothrombogenesis (103). This would fit well with the hypothesis that the
exothermic reaction of the bone cement in the cemented group would have caused
additional inflammatory and thrombotic response. Unfortunately there is no current
literature to support or refute this.
It was during the writing up of the results in the previous chapters when it was noted
that it seemed that the majority of the variables demonstrated similar changes
throughout all the four study groups. In chapter 7 an ANOVA and Friedman analysis was
undertaken which showed that in fact all but one of the variables, the CD1442a count,
showed no statistical difference between all the groups. These variables were then
combined to present the single largest cohort to date investigating the effects of total
knee replacement on the markers of inflammation, endothelium and coagulation. This
showed that all variables (except CD1442a) showed a significant change at all three
time points following total knee replacement. The only exceptions to these were the
273
changes in e-selectin from day 1 to day 7, C-reactive protein from day 1 to day 7 and
IL6 levels from pre-operative to day 7.
No direct comparison to any current literature is possible as although there has been
smaller studies looking at some of these changes in heterogeneous cohorts. Cruickshank
et al (41) looked at other surgical procedures as well as total hip arthroplasty and found
a correlation between the IL-6 response and the duration as well as the severity of the
surgical trauma. In our cohort all patients were operated on by one of four consultant
surgeons all using the standard approach and the same instrumentation with no
significant variation in surgical operating time. Other studies have looked at changes in
the IL-6 response following total knee arthroplasty. Lisowska et al in 2009 studied 40
patients all with a history of rheumatoid arthritis undergoing total knee arthropasty
(228). Their study comprised of 35 females and 5 males with an average age of 58.9 +/-
8.5 years. All subjects received a spinal anaesthetic and a tourniquet was used. Venous
samples were taken pre-operatively and up to 36 hours post-operatively. They showed
significant rises in both the IL-6 and CRP responses with CRP peaking at 36 hours but the
IL-6 response not being significant at 36 hours. Our study differs in that samples were
taken at day 7 post-operatively with the CRP levels remaining significantly raised at day
7 and with a continued significant rise from day 1 to day 7 of the IL-6 levels. The
authors did also state in their results that they could find no correlation between the
tourniquet time and the IL-6 and CRP response. There was no mention of whether bone
cement was used or not. Our results support that of Honsawck et al in 2011 who looked
at the IL-6 and CRP response following cemented total knee arthroplasty (229). All
patients (n=49) had either a general or spinal anaesthetic with a post-operative drain
used for 24 hours afterwards. Venous samples were taken pre and post-operatively as
well as at 2, 6, 14 and 26 weeks later. They found that it took up to 2 weeks for the
levels to return to their pre-operative levels.

274
Hughes et al undertook a small study of only 10 patients (mean age 77) in 2010, this
comprised of mxture of 5 total knee and 5 total hip arthroplasties (230). All patients
underwent a general anaesthetic and had venous blood sampling up to day 5 post-
operatively. They demonstrated significant rises in both groups with regards to the
white cell count which peaked after 24 hours and returned to baseline at day 5
(p<0.05). Whereas in our sample the white cell count levels remained significantly
elevated at day 7 (p=0.01). This correlates with a study by Defi et al who studied 24
patients (19 females; 5 males) undergoing a total hip arthroplasty with sampling up to 1
week post-operatively (231). They demonstrated significant rises in both the white cell
count and CRP levels up to 1 week post-operatively The neutrophil count rose
significantly at day 3 in the hip arthroplasty group (p<0.05) and at day 1 in the knee
arthroplasty group (p<0.05) with levels returning to baseline at day 5. The monocyte
and VWF levels did not show a significant change in the hip arthroplasty group and
peaked at day 1 and day 3 respectively in the knee arthroplasty group, again returning
to baseline levels at day 5. Both the neutrophil, monocyte and VWF levels in our study
remained significant up to day 7. Hughes et al also conducted a similar albeit shorter
study looking at upper limb surgery in 2010 (232) (n=10). Samples were taken for both
CRP and VWF levels but only up to 15 minutes post-procedure. They demonstrated a
significant rise in the CRP levels only (p<0.05).
Pape et al in 2000 looked at a heterogeneous group ranging from polytrauma to ankle
fixation (227) and found that a significant rise in TNFα following femoral nailing but not
in total hip arthroplasty. In his conclusion he stated that he was not able to comment on
the effect of the bone cement on the markers measured in his study. Due to a limitation
of resources we were unable to carry out the TNFα analysis on the local anaesthetic and
surgical drain group but they were carried out in the cemented and uncemented group
with the uncemented group demonstrating a significant change at day 7. This correlates

275
with a study by Reikeraas et al in 2005 who studied 7 patients (4 female; 3 male)
undergoing and uncemented total knee arthroplasty. Samples were taked up to day 6
post-operatively. They demonstrated significant changes on the TNFα levels up to day 6.
Krohn et al (1999) also looked at changes to the TNFα levels following thoracic spinal
surgery (n=8), 6 females; 2 males with a mean age of 15 (233). He found that TNFα
levels significantly increased in the blood sampling but did not show a significant rise in
the drained blood. He also showed that the levels of IL-6 in the drained blood were of a
greater concentration (by the order of 10) compared to the levels in the venous blood.
This has been reflected in other studies such as the one by Arnold et al (1995) who
measured the IL-6 levels in the wound drainage blood following total hip arthroplasty
(n=10) (234), he also showed significant levels of IL-6 in the wound drainage blood.
Bastian et al also found that levels of both IL-6 and TNFα in the wound drainage blood
was significantly higher than the levels found systemically (n=7) in those undergoing a
total hip replacement (235).
Other studies have demonstrated significant changes in t-PA levels following total hip
arthroplasty, this is the first study to confirm that similar changes also occur following
total knee arthroplasty (219).Our results correlate with that of Kageyama et al (226)
who showed a significant expression of CD40 as well as correlation with sCD40L
following total knee arthroplasty. His paper did highlight the possible effect of the use
of a tourniquet but the numbers involved were too small. All our subjects were
operated on by consultants with an operating time ranging from sixty to ninety minutes
with no significant variation in the operating time between all four groups. A pneumatic
tourniquet was used for all subjects. There has been some evidence to suggest that the
use of a tourniquet induces blood hypercoagulability due to the retention of blood flow

276
and disorders of the vascular endothelium (216-218). The potential ‘effect’ of the
tourniquet has been negated by the fact that all the subjects in the studies had a
tourniquet but the possible effects that its use may have had on the results cannot be
assessed or quantified.
Currently there are no published studies to compare our findings as regards the sCD40L
changes seen following total knee arthroplasty. There have been studies into sCD40L but
not in orthopaedics. Antoniades et al found that in coronary bypass graft surgery the
pre-operative levels of sCD40L were predictive of the chances of developing post-
operative atrial fibrillation (236) in 144 patients. Desideri et al conducted an
observational prospective study of 300 patients over 24 months following haemodialysis
and found that higher levels of sCD40L were associated with a significant risk of
cardiovascular morbidity and mortality (237)
The strength of our studies are the fact that they were all conducted in a single centre.
All the operations were undertaken by one of four surgeons using the same basic
approach and instrumentation. There was no significant difference in the tourniquet or
operating time and the blood sampling was undertaken as per protocol. The potential
weaknesses are the unknown effect that the tourniquet may have had on the study
results. As some of the variables had a short half-life significant changes may have been
missed as the first sampling following the operation was taken 24 hours later. Also the
patients in this study were operated on by one of four surgeons with surgeons operating
on patients from each of the 4 study groups. The effect that this may have on the
results is difficult to quantify but with all four surgeons using the standard approach
with the same instrumentation and same knee prosthesis this would minimize the
potential impact of this.
277
In conclusion these studies demonstrate that total knee arthroplasty results in the
activation of common markers of inflammation, endothelium and coagulation. These
changes may explain the increased incidence of venous thrombosis and
thromboembolism post-operatively as well as a potential increased risk of arterial
thrombosis and sequelae from atherosclerotic plaque rupture.
8.2 Future direction
Future research would be needed to further investigate these issues. This would involve
a single centred randomized large cohort study involving just one surgeon. To fully
assess the potential effect of the tourniquet a large study group would be needed which
would be randomized into either a with or without tourniquet group performed by the
one surgeon. If this did not show a significant difference then this group as a whole
could be compared to a second single surgeon group undergoing a cemented total knee
arthrplasty group to assess the effects of the bone cement on the markers of
inflammation, coagulation and of endothelial dysfunction. If however a difference is
demonstrated by the use of the tourniquet then a single surgeon study would be needed
with randomization into either a cemented or uncemented total knee arthroplasty with
no tourniquet.
278
Reference List
(1) Cuthbertson DP. Observations on the disturbance of metabolism produced by
injury to the limbs. Q J Med 1932;(I):233-46.
(2) Little RA, Girolami A. Trauma metabolism - ebb and flow revisited. Br J
Intensive Care 1999;(9):142-6.
(3) Desborough JP, Hall GM. Endocrine response to surgery. Anaethesia Review
1993;10:131-48.
(4) Edwards R. Thyroid and parathyroid disease. Int Anesthesiol Clin 1997;35(4):63-
83.
(5) Sheeran P, Hall GM. Cytokines in anaesthesia. Br J Anaesth 1997;78(2):201-19.
(6) EGDAHL RH. Pituitary-adrenal response following trauma to the isolated leg.
Surgery 1959 Jul;46(1):9-21.
(7) Spink J, Cohen J. Synergy and specificity in induction of gene activity by
proinflammatory cytokines: potential therapeutic targets. Shock 1997;7(6):405-
12.
(8) Jameson P, Desborough JP, Bryant AE, Hall GM. The effect of cortisol
suppression on interleukin-6 and white blood cell responses to surgery. Acta
Anaesthesiol Scand 1997;41(2):304-8.
(9) Banner DW, D'Arcy A, Janes W, Gentz R, Schoenfeld HJ, Broger C, et al.
Crystal structure of the soluble human 55 kd TNF receptor-human TNF beta
complex: implications for TNF receptor activation. Cell 1993 May 7;73(3):431-
45.
(10) Gordon JR, Galli SJ. Release of both preformed and newly synthesized tumor
necrosis factor alpha (TNF-alpha)/cachectin by mouse mast cells stimulated via
the Fc epsilon RI. A mechanism for the sustained action of mast cell-derived
TNF-alpha during IgE-dependent biological responses. J Exp Med 1991 Jul
1;174(1):103-7.
(11) Massague J, Pandiella A. Membrane-anchored growth factors. Annu Rev
Biochem 1993;62:515-41.
(12) Noble NA, Harper JR, Border WA. In vivo interactions of TGF-beta and
extracellular matrix. Prog Growth Factor Res 1992;4(4):369-82.
(13) EM ON, Puri P, Reen DJ. Early induction of IL-1 receptor antagonist (IL-1Ra) in
infants and children undergoing surgery. Clin Exp Immunol 1993 Aug;93(2):218-
22.
(14) Hansson GK. Inflammation, atherosclerosis, and coronary artery disease. N Engl
J Med 2005 Apr 21;352(16):1685-95.

279
(15) Dinarello CA. Interleukin-1 and interleukin-1 antagonism. Blood
1991;77(8):1627-52.
(16) Sims JE, Gayle MA, Slack JL, Alderson MR, Bird TA, Giri JG, et al. Interleukin
1 signaling occurs exclusively via the type I receptor. Proc Natl Acad Sci U S A
1993;90(13):6155-9.
(17) Stylianou E, O'Neill LA, Rawlinson L, Edbrooke MR, Woo P, Saklatvala J.
Interleukin 1 induces NF-kappa B through its type I but not its type II receptor in
lymphocytes. J Biol Chem 1992;267(22):15836-41.
(18) Dembic Z, Loetscher H, Gubler U, Pan YC, Lahm HW, Gentz R, et al. Two
human TNF receptors have similar extracellular, but distinct intracellular, domain
sequences. Cytokine 1990;2(4):231-7.
(19) Aderka D, Engelmann H, Shemer-Avni Y, Hornik V, Galil A, Sarov B, et al.
Variation in serum levels of the soluble TNF receptors among healthy
individuals. Lymphokine Cytokine Res 1992;11(3):157-9.
(20) Van Zee KJ, Kohno T, Fischer E, Rock CS, Moldawer LL, Lowry SF. Tumor
necrosis factor soluble receptors circulate during experimental and clinical
inflammation and can protect against excessive tumor necrosis factor alpha in
vitro and in vivo. Proc Natl Acad Sci U S A 1992;89(11):4845-9.
(21) Aderka D, Wysenbeek A, Engelmann H, Cope AP, Brennan F, Molad Y, et al.
Correlation between serum levels of soluble tumor necrosis factor receptor and
disease activity in systemic lupus erythematosus. Arthritis Rheum
1993;36(8):1111-20.
(22) Andus T, Gross V, Holstege A, Ott M, Weber M, David M, et al. High
concentrations of soluble tumor necrosis factor receptors in ascites. Hepatology
1992;16(3):749-55.
(23) Digel W, Porzsolt F, Schmid M, Herrmann F, Lesslauer W, Brockhaus M. High
levels of circulating soluble receptors for tumor necrosis factor in hairy cell
leukemia and type B chronic lymphocytic leukemia. J Clin Invest
1992;89(5):1690-3.
(24) Clemens MJ. Adenylate cylcase and cyclic AMP. How do cytokines work?
Oxford: Bios Scientific Publishers; 1991. p. 42-3.
(25) Clemens MJ. Inositol phosphate and the control of intracellular calcium. How do
cytokines work? Oxford: Bios Scientific Publishers; 1991. p. 44-6.
(26) Clemens MJ. Diacylglycerols and protein kinase C. How do cytokines work?
Oxford: Bios Scientific Publishers; 1991. p. 46-7.
(27) Minty A, Chalon P, Derocq JM, Dumont X, Guillemot JC, Kaghad M, et al.
Interleukin-13 is a new human lymphokine regulating inflammatory and immune
responses. Nature 1993 Mar 18;362(6417):248-50.
280
(28) Tsujimoto M, Vilcek J. Tumor necrosis factor receptors in HeLa cells and their
regulation by interferon-gamma. J Biol Chem 1986;261(12):5384-8.
(29) Beutler B, Cerami A. The common mediator of shock, cachexia, and tumor
necrosis. Adv Immunol 1988;42:213-31.
(30) Pujol-Borrell R, Todd I, Doshi M, Bottazzo GF, Sutton R, Gray D, et al. HLA
class II induction in human islet cells by interferon-gamma plus tumour necrosis
factor or lymphotoxin. Nature 1987;326(6110):304-6.
(31) Waage A, Halstensen A, Espevik T. Association between tumour necrosis factor
in serum and fatal outcome in patients with meningococcal disease. Lancet
1987;1(8529):355-7.
(32) Vilcek J, Lee TH. Tumor necrosis factor. New insights into the molecular
mechanisms of its multiple actions. J Biol Chem 1991;266(12):7313-6.
(33) Girardin E, Roux-Lombard P, Grau GE, Suter P, Gallati H, Dayer JM. Imbalance
between tumour necrosis factor-alpha and soluble TNF receptor concentrations in
severe meningococcaemia. The J5 Study Group. Immunology 1992;76(1):20-3.
(34) Dinarello CA, Thompson RC. Blocking IL-1: interleukin 1 receptor antagonist in
vivo and in vitro. Immunol Today 1991;12(11):404-10.
(35) Esmon CT. Possible involvement of cytokines in diffuse intravascular
coagulation and thrombosis. Baillieres Clin Haematol 1994;7(3):453-68.
(36) Re F, Muzio M, De Rossi M, Polentarutti N, Giri JG, Mantovani A, et al. The
type II "receptor" as a decoy target for interleukin 1 in polymorphonuclear
leukocytes: characterization of induction by dexamethasone and ligand binding
properties of the released decoy receptor. J Exp Med 1994;179(2):739-43.
(37) Ridker PM, Rifai N, Stampfer MJ, Hennekens CH. Plasma concentration of
interleukin-6 and the risk of future myocardial infarction among apparently
healthy men. Circulation 2000 Apr 18;101(15):1767-72.
(38) Hibi M, Murakami M, Saito M, Hirano T, Taga T, Kishimoto T. Molecular
cloning and expression of an IL-6 signal transducer, gp130. Cell
1990;63(6):1149-57.
(39) Narazaki M, Yasukawa K, Saito T, Ohsugi Y, Fukui H, Koishihara Y, et al.
Soluble forms of the interleukin-6 signal-transducing receptor component gp130
in human serum possessing a potential to inhibit signals through membrane-
anchored gp130. Blood 1993;82(4):1120-6.
(40) Taga T, Hibi M, Hirata Y, Yamasaki K, Yasukawa K, Matsuda T, et al.
Interleukin-6 triggers the association of its receptor with a possible signal
transducer, gp130. Cell 1989;58(3):573-81.
(41) Cruickshank AM, Fraser WD, Burns HJ, Van Damme J, Shenkin A. Response of
serum interleukin-6 in patients undergoing elective surgery of varying severity.
Clin Sci (Lond) 1990;79(2):161-5.

281
(42) Winemaker M, Petruccelli D, Shaughnessy S, Butcher M, Piccirillo L, Weening
B, et al. Interleukin-6 as a marker for surgical trauma in total knee arthroplasty.
Current Orthopaedic Practice 2011 Jan 11;22(6):538-44.
(43) Giannoudis PV, Smith RM, Banks RE, Windsor AC, Dickson RA, Guillou PJ.
Stimulation of inflammatory markers after blunt trauma. Br J Surg
1998;85(7):986-90.
(44) Liuzzo G, Biasucci LM, Rebuzzi AG, Gallimore JR, Caligiuri G, Lanza GA, et
al. Plasma protein acute-phase response in unstable angina is not induced by
ischemic injury. Circulation 1996 Nov 15;94(10):2373-80.
(45) Biasucci LM, Liuzzo G, Colizzi C, Rizzello V. Clinical use of C-reactive protein
for the prognostic stratification of patients with ischemic heart disease. Ital Heart
J 2001 Mar;2(3):164-71.
(46) Pradhan AD, Manson JE, Rifai N, Buring JE, Ridker PM. C-reactive protein,
interleukin 6, and risk of developing type 2 diabetes mellitus. JAMA
2001;286(3):327-34.
(47) Barbul A, Regan MC. The regulatory role of T lymphocytes in wound healing. J
Trauma 1990 Dec;30(12 Suppl):S97-100.
(48) Engquist A, Brandt MR, Fernandes A, Kehlet H. The blocking effect of epidural
analgesia on the adrenocortical and hyperglycemic responses to surgery. Acta
Anaesthesiol Scand 1977;21(4):330-5.
(49) Su D, Gu Y, Wang Z, Wang X. Lidocaine attenuates proinflammatory cytokine
production induced by extracellular adenosine triphosphate in cultured rat
microglia. Anesth Analg 2010 Sep;111(3):768-74.
(50) Bone RC, Balk RA, Cerra FB, Dellinger RP, Fein AM, Knaus WA, et al.
Definitions for sepsis and organ failure and guidelines for the use of innovative
therapies in sepsis. The ACCP/SCCM Consensus Conference Committee.
American College of Chest Physicians/Society of Critical Care Medicine. Chest
1992;101(6):1644-55.
(51) Giannoudis PV, Dinopoulos H, Chalidis B, Hall GM. Surgical stress response.
Injury 2006;37 Suppl 5:S3-S9.
(52) Keel M, Ecknauer E, Stocker R, Ungethum U, Steckholzer U, Kenney J, et al.
Different pattern of local and systemic release of proinflammatory and anti-
inflammatory mediators in severely injured patients with chest trauma. J Trauma
1996;40(6):907-12.
(53) Ertel W, Keel M, Bonaccio M, Steckholzer U, Gallati H, Kenney JS, et al.
Release of anti-inflammatory mediators after mechanical trauma correlates with
severity of injury and clinical outcome. J Trauma 1995;39(5):879-85.
(54) Tan LR, Waxman K, Scannell G, Ioli G, Granger GA. Trauma causes early
release of soluble receptors for tumor necrosis factor. J Trauma 1993;34(5):634-
8.

282
(55) Giannoudis PV, Smith RM, Bellamy MC, Morrison JF, Dickson RA, Guillou PJ.
Stimulation of the inflammatory system by reamed and unreamed nailing of
femoral fractures. An analysis of the second hit. J Bone Joint Surg Br
1999;81(2):356-61.
(56) Ono S, Tsujimoto H, Hiraki S, Takahata R, Kinoshita M, Mochizuki H. Sex
differences in cytokine production and surface antigen expression of peripheral
blood mononuclear cells after surgery. Am J Surg 2005;190(3):439-44.
(57) Schneider CP, Schwacha MG, Chaudry IH. Influence of gender and age on T-cell
responses in a murine model of trauma-hemorrhage: differences between
circulating and tissue-fixed cells. J Appl Physiol 2006;100(3):826-33.
(58) Slewa-Younan S, Green AM, Baguley IJ, Gurka JA, Marosszeky JE. Sex
differences in injury severity and outcome measures after traumatic brain injury.
Arch Phys Med Rehabil 2004;85(3):376-9.
(59) Libby P. Molecular bases of the acute coronary syndromes. Circulation
1995;91(11):2844-50.
(60) Richardson PD, Davies MJ, Born GV. Influence of plaque configuration and
stress distribution on fissuring of coronary atherosclerotic plaques. Lancet
1989;2(8669):941-4.
(61) Loree HM, Kamm RD, Stringfellow RG, Lee RT. Effects of fibrous cap thickness
on peak circumferential stress in model atherosclerotic vessels. Circ Res
1992;71(4):850-8.
(62) Amento EP, Ehsani N, Palmer H, Libby P. Cytokines and growth factors
positively and negatively regulate interstitial collagen gene expression in human
vascular smooth muscle cells. Arterioscler Thromb 1991;11(5):1223-30.
(63) Sukhova GK, Schonbeck U, Rabkin E, Schoen FJ, Poole AR, Billinghurst RC, et
al. Evidence for increased collagenolysis by interstitial collagenases-1 and -3 in
vulnerable human atheromatous plaques. Circulation 1999;99(19):2503-9.
(64) Cybulsky MI, Iiyama K, Li H, Zhu S, Chen M, Iiyama M, et al. A major role for
VCAM-1, but not ICAM-1, in early atherosclerosis. J Clin Invest
2001;107(10):1255-62.
(65) De Caterina R, Libby P, Peng HB, Thannickal VJ, Rajavashisth TB, Gimbrone
MA, Jr., et al. Nitric oxide decreases cytokine-induced endothelial activation.
Nitric oxide selectively reduces endothelial expression of adhesion molecules and
proinflammatory cytokines. J Clin Invest 1995;96(1):60-8.
(66) Gimbrone MA, Jr., Topper JN, Nagel T, Anderson KR, Garcia-Cardena G.
Endothelial dysfunction, hemodynamic forces, and atherogenesis. Ann N Y Acad
Sci 2000;902:230-9.
(67) Gerszten RE, Garcia-Zepeda EA, Lim YC, Yoshida M, Ding HA, Gimbrone MA,
Jr., et al. MCP-1 and IL-8 trigger firm adhesion of monocytes to vascular
endothelium under flow conditions. Nature 1999;398(6729):718-23.
283
(68) Brown BG, Zhao XQ, Chait A, Fisher LD, Cheung MC, Morse JS, et al.
Simvastatin and niacin, antioxidant vitamins, or the combination for the
prevention of coronary disease. N Engl J Med 2001;345(22):1583-92.
(69) Boring L, Gosling J, Cleary M, Charo IF. Decreased lesion formation in CCR2-/-
mice reveals a role for chemokines in the initiation of atherosclerosis. Nature
1998;394(6696):894-7.
(70) Clinton SK, Underwood R, Hayes L, Sherman ML, Kufe DW, Libby P.
Macrophage colony-stimulating factor gene expression in vascular cells and in
experimental and human atherosclerosis. Am J Pathol 1992;140(2):301-16.
(71) Henn V, Slupsky JR, Grafe M, Anagnostopoulos I, Forster R, Muller-Berghaus
G, et al. CD40 ligand on activated platelets triggers an inflammatory reaction of
endothelial cells. Nature 1998 Feb 5;391(6667):591-4.
(72) Mach F, Schonbeck U, Sukhova GK, Atkinson E, Libby P. Reduction of
atherosclerosis in mice by inhibition of CD40 signalling. Nature
1998;394(6689):200-3.
(73) Schonbeck U, Sukhova GK, Shimizu K, Mach F, Libby P. Inhibition of CD40
signaling limits evolution of established atherosclerosis in mice. Proc Natl Acad
Sci U S A 2000;97(13):7458-63.
(74) Ray MJ, Calabro LJ, Sirisena T, Crawford SA, Crawford RW, Walters DL. Pre-
operative platelet-bound CD40 ligand is probably associated with peri-operative
cardiac events in hip and knee arthroplasty. European Journal of Clinical
Investigation 2010 Jun;40(6):497-503.
(75) Libby P. Inflammation in atherosclerosis. Nature 2002 Dec 19;420(6917):868-74.
(76) Ahn ER, Lander G, Jy W, Bidot CJ, Jimenez JJ, Horstman LL, et al. Differences
of soluble CD40L in sera and plasma: implications on CD40L assay as a marker
of thrombotic risk. Thromb Res 2004;114(2):143-8.
(77) Heeschen C, Dimmeler S, Hamm CW, van den Brand MJ, Boersma E, Zeiher
AM, et al. Soluble CD40 ligand in acute coronary syndromes. N Engl J Med 2003
Mar 20;348(12):1104-11.
(78) Varo N, de Lemos JA, Libby P, Morrow DA, Murphy SA, Nuzzo R, et al.
Soluble CD40L: risk prediction after acute coronary syndromes. Circulation
2003;108(9):1049-52.
(79) de Lemos JA, Zirlik A, Schonbeck U, Varo N, Murphy SA, Khera A, et al.
Associations between soluble CD40 ligand, atherosclerosis risk factors, and
subclinical atherosclerosis: results from the Dallas Heart Study. Arterioscler
Thromb Vasc Biol 2005;25(10):2192-6.
(80) Blake GJ, Ridker PM. Novel clinical markers of vascular wall inflammation. Circ
Res 2001;89(9):763-71.
284
(81) Choudhury A, Chung I, Panja N, Patel J, Lip GYH. Soluble CD40 ligand, platelet
surface CD40 ligand, and total platelet CD40 ligand in atrial fibrillation -
Relationship to soluble P-selectin, stroke risk factors, and risk factor intervention.
Chest 2008 Sep;134(3):574-81.
(82) Mason PJ, Chakrabarti S, Albers AA, Rex S, Vitseva O, Varghese S, et al.
Plasma, serum, and platelet expression of CD40 ligand in adults with
cardiovascular disease. American Journal of Cardiology 2005 Nov
15;96(10):1365-9.
(83) Varo N, Nuzzo R, Natal C, Libby P, Schonbeck U. Influence of pre-analytical
and analytical factors on soluble CD40L measurements. Clinical Science 2006
Nov;111(5):341-7.
(84) Hollenbaugh D, Mischel-Petty N, Edwards CP, Simon JC, Denfeld RW, Kiener
PA, et al. Expression of functional CD40 by vascular endothelial cells. J Exp
Med 1995 Jul 1;182(1):33-40.
(85) Wright SD, Ramos RA, Tobias PS, Ulevitch RJ, Mathison JC. CD14, a receptor
for complexes of lipopolysaccharide (LPS) and LPS binding protein. Science
1990;249(4975):1431-3.
(86) Pugin J, Heumann ID, Tomasz A, Kravchenko VV, Akamatsu Y, Nishijima M, et
al. CD14 is a pattern recognition receptor. Immunity 1994;1(6):509-16.
(87) Ruppert J, Friedrichs D, Xu H, Peters JH. IL-4 decreases the expression of the
monocyte differentiation marker CD14, paralleled by an increasing accessory
potency. Immunobiology 1991;182(5):449-64.
(88) Cosentino G, Soprana E, Thienes CP, Siccardi AG, Viale G, Vercelli D. IL-13
down-regulates CD14 expression and TNF-alpha secretion in normal human
monocytes. J Immunol 1995;155(6):3145-51.
(89) Landmann R, Ludwig C, Obrist R, Obrecht JP. Effect of cytokines and
lipopolysaccharide on CD14 antigen expression in human monocytes and
macrophages. J Cell Biochem 1991;47(4):317-29.
(90) Hamon G, Mulloy RH, Chen G, Chow R, Birkenmaier C, Horn JK. Transforming
growth factor-beta 1 lowers the CD14 content of monocytes. J Surg Res
1994;57(5):574-8.
(91) Beekhuizen H, Blokland I, Corsel-van Tilburg AJ, Koning F, van Furth R. CD14
contributes to the adherence of human monocytes to cytokine-stimulated
endothelial cells. J Immunol 1991;147(11):3761-7.
(92) Fingerle-Rowson G, Auers J, Kreuzer E, Fraunberger P, Blumenstein M, Ziegler-
Heitbrock LH. Expansion of CD14+CD16+ monocytes in critically ill cardiac
surgery patients. Inflammation 1998;22(4):367-79.
(93) Fingerle G, Pforte A, Passlick B, Blumenstein M, Strobel M, Ziegler-Heitbrock
HW. The novel subset of CD14+/CD16+ blood monocytes is expanded in sepsis
patients. Blood 1993;82(10):3170-6.

285
(94) Brauner A, Lu Y, Hallden G, Hylander B, Lundahl J. Difference in the blood
monocyte phenotype between uremic patients and healthy controls: its relation to
monocyte differentiation into macrophages in the peritoneal cavity. Inflammation
1998;22(1):55-66.
(95) Schmitz G, Herr AS, Rothe G. T-lymphocytes and monocytes in atherogenesis.
Herz 1998;23(3):168-77.
(96) Schlitt A, Heine GH, Blankenberg S, Espinola-Klein C, Dopheide JF, Bickel C,
et al. CD14+CD16+ monocytes in coronary artery disease and their relationship
to serum TNF-alpha levels. Thromb Haemost 2004;92(2):419-24.
(97) Arber N, Berliner S, Pras E, Arber L, Fishelson Z, Kahn Y, et al. Heterotypic
leukocyte aggregation in the peripheral blood of patients with leukemia,
inflammation and stress. Nouv Rev Fr Hematol 1991;33(3):251-5.
(98) Rinder HM, Bonan JL, Rinder CS, Ault KA, Smith BR. Dynamics of leukocyte-
platelet adhesion in whole blood. Blood 1991;78(7):1730-7.
(99) Neumann FJ, Zohlnhofer D, Fakhoury L, Ott I, Gawaz M, Schomig A. Effect of
glycoprotein IIb/IIIa receptor blockade on platelet-leukocyte interaction and
surface expression of the leukocyte integrin Mac-1 in acute myocardial infarction.
J Am Coll Cardiol 1999;34(5):1420-6.
(100) Hayward R, Campbell B, Shin YK, Scalia R, Lefer AM. Recombinant soluble P-
selectin glycoprotein ligand-1 protects against myocardial ischemic reperfusion
injury in cats. Cardiovasc Res 1999;41(1):65-76.
(101) Sarma J, Laan CA, Alam S, Jha A, Fox KA, Dransfield I. Increased platelet
binding to circulating monocytes in acute coronary syndromes. Circulation
2002;105(18):2166-71.
(102) Furman MI, Barnard MR, Krueger LA, Fox ML, Shilale EA, Lessard DM, et al.
Circulating monocyte-platelet aggregates are an early marker of acute myocardial
infarction. J Am Coll Cardiol 2001 Oct;38(4):1002-6.
(103) Pepys MB, Baltz ML. Acute phase proteins with special reference to C-reactive
protein and related proteins (pentaxins) and serum amyloid A protein. Adv
Immunol 1983;34:141-212.
(104) Shine B, de Beer FC, Pepys MB. Solid phase radioimmunoassays for human C-
reactive protein. Clin Chim Acta 1981;117(1):13-23.
(105) Vigushin DM, Pepys MB, Hawkins PN. Metabolic and scintigraphic studies of
radioiodinated human C-reactive protein in health and disease. J Clin Invest
1993;91(4):1351-7.
(106) Thompson D, Pepys MB, Wood SP. The physiological structure of human C-
reactive protein and its complex with phosphocholine. Structure 1999;7(2):169-
77.

286
(107) Ballou SP, Lozanski G. Induction of inflammatory cytokine release from cultured
human monocytes by C-reactive protein. Cytokine 1992 Sep;4(5):361-8.
(108) Ridker PM, Cannon CP, Morrow D, Rifai N, Rose LM, McCabe CH, et al. C-
reactive protein levels and outcomes after statin therapy. N Engl J Med 2005 Jan
6;352(1):20-8.
(109) Kuller LH, Tracy RP, Shaten J, Meilahn EN. Relation of C-reactive protein and
coronary heart disease in the MRFIT nested case-control study. Multiple Risk
Factor Intervention Trial. Am J Epidemiol 1996;144(6):537-47.
(110) Ridker PM, Cushman M, Stampfer MJ, Tracy RP, Hennekens CH. Inflammation,
aspirin, and the risk of cardiovascular disease in apparently healthy men. N Engl J
Med 1997;336(14):973-9.
(111) Koenig W, Sund M, Frohlich M, Fischer HG, Lowel H, Doring A, et al. C-
Reactive protein, a sensitive marker of inflammation, predicts future risk of
coronary heart disease in initially healthy middle-aged men: results from the
MONICA (Monitoring Trends and Determinants in Cardiovascular Disease)
Augsburg Cohort Study, 1984 to 1992. Circulation 1999;99(2):237-42.
(112) Danesh J, Whincup P, Walker M, Lennon L, Thomson A, Appleby P, et al. Low
grade inflammation and coronary heart disease: prospective study and updated
meta-analyses. BMJ 2000;321(7255):199-204.
(113) Danesh J, Wheeler JG, Hirschfield GM, Eda S, Eiriksdottir G, Rumley A, et al.
C-reactive protein and other circulating markers of inflammation in the prediction
of coronary heart disease. N Engl J Med 2004;350(14):1387-97.
(114) Kaptoge S, Di AE, Lowe G, Pepys MB, Thompson SG, Collins R, et al. C-
reactive protein concentration and risk of coronary heart disease, stroke, and
mortality: an individual participant meta-analysis. Lancet 2010 Jan
9;375(9709):132-40.
(115) Perez C, Albert I, DeFay K, Zachariades N, Gooding L, Kriegler M. A
nonsecretable cell surface mutant of tumor necrosis factor (TNF) kills by cell-to-
cell contact. Cell 1990;63(2):251-8.
(116) Kagan BL, Baldwin RL, Munoz D, Wisnieski BJ. Formation of ion-permeable
channels by tumor necrosis factor-alpha. Science 1992;255(5050):1427-30.
(117) Murray J, Barbara JA, Dunkley SA, Lopez AF, Van Ostade X, Condliffe AM, et
al. Regulation of neutrophil apoptosis by tumor necrosis factor-alpha:
requirement for TNFR55 and TNFR75 for induction of apoptosis in vitro. Blood
1997;90(7):2772-83.
(118) Janeway C, Travers P, Walport M, Capra J. Immunobiology : The Immune
System in Health and Disease. New York: Gartland Publishers; 1999.
(119) Bevilacqua M, Butcher E, Furie B, Furie B, Gallatin M, Gimbrone M, et al.
Selectins: a family of adhesion receptors. Cell 1991;67(2):233.

287
(120) Pober JS, Bevilacqua MP, Mendrick DL, Lapierre LA, Fiers W, Gimbrone MA,
Jr. Two distinct monokines, interleukin 1 and tumor necrosis factor, each
independently induce biosynthesis and transient expression of the same antigen
on the surface of cultured human vascular endothelial cells. J Immunol
1986;136(5):1680-7.
(121) Ley K, Allietta M, Bullard DC, Morgan S. Importance of E-selectin for firm
leukocyte adhesion in vivo. Circ Res 1998;83(3):287-94.
(122) Milstone DS, Fukumura D, Padgett RC, O'Donnell PE, Davis VM, Benavidez OJ,
et al. Mice lacking E-selectin show normal numbers of rolling leukocytes but
reduced leukocyte stable arrest on cytokine-activated microvascular endothelium.
Microcirculation 1998;5(2-3):153-71.
(123) Keelan ET, Licence ST, Peters AM, Binns RM, Haskard DO. Characterization of
E-selectin expression in vivo with use of a radiolabeled monoclonal antibody.
Am J Physiol 1994;266(1 Pt 2):H278-H290.
(124) Picker LJ, Kishimoto TK, Smith CW, Warnock RA, Butcher EC. ELAM-1 is an
adhesion molecule for skin-homing T cells. Nature 1991;349(6312):796-9.
(125) Graves BJ, Crowther RL, Chandran C, Rumberger JM, Li S, Huang KS, et al.
Insight into E-selectin/ligand interaction from the crystal structure and
mutagenesis of the lec/EGF domains. Nature 1994;367(6463):532-8.
(126) Rosenberg RD, Aird WC. Vascular-bed--specific hemostasis and
hypercoagulable states. N Engl J Med 1999;340(20):1555-64.
(127) Emeis JJ. Regulation of the acute release of tissue-type plasminogen activator
from the endothelium by coagulation activation products. Ann N Y Acad Sci
1992;667:249-58.
(128) Hoylaerts M, Rijken DC, Lijnen HR, Collen D. Kinetics of the activation of
plasminogen by human tissue plasminogen activator. Role of fibrin. J Biol Chem
1982;257(6):2912-9.
(129) Plow EF, Felez J, Miles LA. Cellular regulation of fibrinolysis. Thromb Haemost
1991;66(1):32-6.
(130) Nordenhem A, Wiman B. Tissue plasminogen activator (tPA) antigen in plasma:
correlation with different tPA/inhibitor complexes. Scand J Clin Lab Invest
1998;58(6):475-83.
(131) Narita M, Bu G, Herz J, Schwartz AL. Two receptor systems are involved in the
plasma clearance of tissue-type plasminogen activator (t-PA) in vivo. J Clin
Invest 1995;96(2):1164-8.
(132) Chandler WL, Trimble SL, Loo SC, Mornin D. Effect of PAI-1 levels on the
molar concentrations of active tissue plasminogen activator (t-PA) and t-PA/PAI-
1 complex in plasma. Blood 1990;76(5):930-7.

288
(133) van den Eijnden-Schrauwen Y, Kooistra T, de Vries RE, Emeis JJ. Studies on the
acute release of tissue-type plasminogen activator from human endothelial cells
in vitro and in rats in vivo: evidence for a dynamic storage pool. Blood
1995;85(12):3510-7.
(134) Hanss M, Collen D. Secretion of tissue-type plasminogen activator and
plasminogen activator inhibitor by cultured human endothelial cells: modulation
by thrombin, endotoxin, and histamine. J Lab Clin Med 1987;109(1):97-104.
(135) Shi GY, Hau JS, Wang SJ, Wu IS, Chang BI, Lin MT, et al. Plasmin and the
regulation of tissue-type plasminogen activator biosynthesis in human endothelial
cells. J Biol Chem 1992;267(27):19363-8.
(136) Levin EG, Santell L. Stimulation and desensitization of tissue plasminogen
activator release from human endothelial cells. J Biol Chem 1988;263(19):9360-
5.
(137) Huber D, Cramer EM, Kaufmann JE, Meda P, Masse JM, Kruithof EK, et al.
Tissue-type plasminogen activator (t-PA) is stored in Weibel-Palade bodies in
human endothelial cells both in vitro and in vivo. Blood 2002;99(10):3637-45.
(138) Emeis JJ, van den Eijnden-Schrauwen Y, van den Hoogen CM, de Priester W,
Westmuckett A, Lupu F. An endothelial storage granule for tissue-type
plasminogen activator. J Cell Biol 1997;139(1):245-56.
(139) Knop M, Gerke V. Ca2+ -regulated secretion of tissue-type plasminogen
activator and von Willebrand factor in human endothelial cells. Biochim Biophys
Acta 2002;1600(1-2):162-7.
(140) Jern C, Selin L, Tengborn L, Jern S. Sympathoadrenal activation and muscarinic
receptor stimulation induce acute release of tissue-type plasminogen activator but
not von Willebrand factor across the human forearm. Thromb Haemost
1997;78(2):887-91.
(141) Labinjoh C, Newby DE, Dawson P, Johnston NR, Ludlam CA, Boon NA, et al.
Fibrinolytic actions of intra-arterial angiotensin II and bradykinin in vivo in man.
Cardiovasc Res 2000;47(4):707-14.
(142) van den Eijnden-Schrauwen Y, Atsma DE, Lupu F, de Vries RE, Kooistra T,
Emeis JJ. Involvement of calcium and G proteins in the acute release of tissue-
type plasminogen activator and von Willebrand factor from cultured human
endothelial cells. Arterioscler Thromb Vasc Biol 1997;17(10):2177-87.
(143) Keber D. Mechanism of plasminogen activator release during venous occlusion.
Fibrinolysis 1988;2 (Supplement 2):96-103.
(144) Wall U, Jern C, Jern S. High capacity for tissue-type plasminogen activator
release from vascular endothelium in vivo. J Hypertens 1997;15(12 Pt 2):1641-7.
(145) Newby DE, Wright RA, Dawson P, Ludlam CA, Boon NA, Fox KA, et al. The L-
arginine/nitric oxide pathway contributes to the acute release of tissue
plasminogen activator in vivo in man. Cardiovasc Res 1998;38(2):485-92.

289
(146) Burke AP, Farb A, Malcom GT, Liang YH, Smialek J, Virmani R. Coronary risk
factors and plaque morphology in men with coronary disease who died suddenly.
N Engl J Med 1997;336(18):1276-82.
(147) Davies MJ, Woolf N, Rowles PM, Pepper J. Morphology of the endothelium over
atherosclerotic plaques in human coronary arteries. Br Heart J 1988;60(6):459-64.
(148) Held C, Hjemdahl P, Rehnqvist N, Wallen NH, Bjorkander I, Eriksson SV, et al.
Fibrinolytic variables and cardiovascular prognosis in patients with stable angina
pectoris treated with verapamil or metoprolol. Results from the Angina Prognosis
study in Stockholm. Circulation 1997;95(10):2380-6.
(149) Hoffmeister HM, Jur M, Ruf-Lehmann M, Helber U, Heller W, Seipel L.
Endothelial tissue-type plasminogen activator release in coronary heart disease:
Transient reduction in endothelial fibrinolytic reserve in patients with unstable
angina pectoris or acute myocardial infarction. J Am Coll Cardiol
1998;31(3):547-51.
(150) Lowe GD, Danesh J, Lewington S, Walker M, Lennon L, Thomson A, et al.
Tissue plasminogen activator antigen and coronary heart disease. Prospective
study and meta-analysis. Eur Heart J 2004;25(3):252-9.
(151) Mendolicchio GL, Ruggeri ZM. New perspectives on von Willebrand factor
functions in hemostasis and thrombosis. Semin Hematol 2005;42(1):5-14.
(152) Whincup PH, Danesh J, Walker M, Lennon L, Thomson A, Appleby P, et al. von
Willebrand factor and coronary heart disease: prospective study and meta-
analysis. Eur Heart J 2002;23(22):1764-70.
(153) Becker BF, Heindl B, Kupatt C, Zahler S. Endothelial function and hemostasis. Z
Kardiol 2000 Mar;89(3):160-7.
(154) Gross PL, Aird WC. The endothelium and thrombosis. Semin Thromb Hemost
2000;26(5):463-78.
(155) Sorensen HT, Horvath-Puho E, Pedersen L, Baron JA, Prandoni P. Venous
thromboembolism and subsequent hospitalisation due to acute arterial
cardiovascular events: a 20-year cohort study. Lancet 2007 Nov
24;370(9601):1773-9.
(156) Fowkes FG, Lowe GD, Housley E, Rattray A, Rumley A, Elton RA, et al. Cross-
linked fibrin degradation products, progression of peripheral arterial disease, and
risk of coronary heart disease. Lancet 1993 Jul 10;342(8863):84-6.
(157) Ross R. Atherosclerosis--an inflammatory disease. N Engl J Med 1999 Jan
14;340(2):115-26.
(158) Tzoulaki I, Murray GD, Price JF, Smith FB, Lee AJ, Rumley A, et al. Hemostatic
factors, inflammatory markers, and progressive peripheral atherosclerosis: the
Edinburgh Artery Study. Am J Epidemiol 2006 Feb 15;163(4):334-41.

290
(159) Parvizi J, Johnson BG, Rowland C, Ereth MH, Lewallen DG. Thirty-day
mortality after elective total hip arthroplasty. Journal of Bone and Joint Surgery-
American Volume 2001 Oct;83A(10):1524-8.
(160) Nillius AS, Nylander G. Deep vein thrombosis after total hip replacement: a
clinical and phlebographic study. Br J Surg 1979 May;66(5):324-6.
(161) Stamatakis JD, Kakkar VV, Sagar S, Lawrence D, Nairn D, Bentley PG. Femoral
vein thrombosis and total hip replacement. Br Med J 1977 Jul 23;2(6081):223-5.
(162) Mantilla CB, Horlocker TT, Schroeder DR, Berry DJ, Brown DL. Frequency of
myocardial infarction, pulmonary embolism, deep venous thrombosis, and death
following primary hip or knee arthroplasty. Anesthesiology 2002
May;96(5):1140-6.
(163) Lie SA, Engesaeter LB, Havelin LI, Furnes O, Vollset SE. Early postoperative
mortality after 67,548 total hip replacements: causes of death and
thromboprophylaxis in 68 hospitals in Norway from 1987 to 1999. Acta Orthop
Scand 2002 Aug;73(4):392-9.
(164) Lie SA, Pratt N, Ryan P, Engesaeter LB, Havelin LI, Furnes O, et al. Duration of
the increase in early postoperative mortality after elective hip and knee
replacement. J Bone Joint Surg Am 2010 Jan;92(1):58-63.
(165) Mantilla CB, Horlocker TT, Schroeder DR, Berry DJ, Brown DL. Frequency of
myocardial infarction, pulmonary embolism, deep venous thrombosis, and death
following primary hip or knee arthroplasty (vol 96, pg 140, 2002).
Anesthesiology 2002 Aug;97(2):531.
(166) Schulman S, Lindmarker P, Holmstrom M, Larfars G, Carlsson A, Nicol P, et al.
Post-thrombotic syndrome, recurrence, and death 10 years after the first episode
of venous thromboembolism treated with warfarin for 6 weeks or 6 months. J
Thromb Haemost 2006;4(4):734-42.
(167) Hong C, Zhu F, Du D, Pilgram TK, Sicard GA, Bae KT. Coronary artery
calcification and risk factors for atherosclerosis in patients with venous
thromboembolism. Atherosclerosis 2005;183(1):169-74.
(168) Eliasson A, Bergqvist D, Bjorck M, Acosta S, Sternby NH, Ogren M. Incidence
and risk of venous thromboembolism in patients with verified arterial thrombosis:
a population study based on 23,796 consecutive autopsies. J Thromb Haemost
2006;4(9):1897-902.
(169) Levine MN. Prevention of thrombotic disorders in cancer patients undergoing
chemotherapy. Thromb Haemost 1997;78(1):133-6.
(170) Maraha B, Peeters MF, van Aken BE, den Heijer M. Chlamydia pneumoniae,
systemic inflammation and the risk of venous thrombosis. Diagn Microbiol Infect
Dis 2002;42(3):153-7.
291
(171) Lijfering WM, Ten Kate MK, Sprenger HG, van der Meer J. Absolute risk of
venous and arterial thrombosis in HIV-infected patients and effects of
combination antiretroviral therapy. J Thromb Haemost 2006;4(9):1928-30.
(172) Meade TW, Mellows S, Brozovic M, Miller GJ, Chakrabarti RR, North WR, et
al. Haemostatic function and ischaemic heart disease: principal results of the
Northwick Park Heart Study. Lancet 1986;2(8506):533-7.
(173) Thompson SG, Kienast J, Pyke SD, Haverkate F, van de Loo JC. Hemostatic
factors and the risk of myocardial infarction or sudden death in patients with
angina pectoris. European Concerted Action on Thrombosis and Disabilities
Angina Pectoris Study Group. N Engl J Med 1995;332(10):635-41.
(174) Miller GJ, Bauer KA, Barzegar S, Cooper JA, Rosenberg RD. Increased
activation of the haemostatic system in men at high risk of fatal coronary heart
disease. Thromb Haemost 1996;75(5):767-71.
(175) Danesh J. Plasma fibrinogen level and the risk of major cardiovascular diseases
and nonvascular mortality: An individual participant meta-analysis (vol 294, pg
1799, 2005). Jama-Journal of the American Medical Association 2005 Dec
14;294(22):2848.
(176) Whincup PH, Danesh J, Walker M, Lennon L, Thomson A, Appleby P, et al. von
Willebrand factor and coronary heart disease: prospective study and meta-
analysis. Eur Heart J 2002;23(22):1764-70.
(177) Danesh J, Wheeler JG, Hirschfield GM, Eda S, Eiriksdottir G, Rumley A, et al.
C-reactive protein and other circulating markers of inflammation in the prediction
of coronary heart disease. N Engl J Med 2004;350(14):1387-97.
(178) Lowe GDO. Can haematological tests predict cardiovascular risk? The 2005
Kettle Lecture. British Journal of Haematology 2006 May;133(3):232-50.
(179) Lowe GD, Haverkate F, Thompson SG, Turner RM, Bertina RM, Turpie AG, et
al. Prediction of deep vein thrombosis after elective hip replacement surgery by
preoperative clinical and haemostatic variables: the ECAT DVT Study. European
Concerted Action on Thrombosis. Thromb Haemost 1999 Jun;81(6):879-86.
(180) Tsai AW, Cushman M, Rosamond WD, Heckbert SR, Polak JF, Folsom AR.
Cardiovascular risk factors and venous thromboembolism incidence: the
longitudinal investigation of thromboembolism etiology. Arch Intern Med 2002
May 27;162(10):1182-9.
(181) Andreescu AC, Cushman M, Rosendaal FR. D-dimer as a risk factor for deep
vein thrombosis: the Leiden Thrombophilia Study. Thromb Haemost 2002
Jan;87(1):47-51.
(182) Lowe G, Woodward M, Vessey M, Rumley A, Gough P, Daly E. Thrombotic
variables and risk of idiopathic venous thromboembolism in women aged 45-64
years - Relationships to hormone replacement therapy. Thrombosis and
Haemostasis 2000 Apr;83(4):530-5.

292
(183) Cushman M, Folsom AR, Wang L, Aleksic N, Rosamond WD, Tracy RP, et al.
Fibrin fragment D-dimer and the risk of future venous thrombosis. Blood 2003
Feb 15;101(4):1243-8.
(184) Balendra PR. Deep vein thrombosis of the leg: natural history and haemostatic
variables Queen's University of Belfast; 1990.
(185) Ridker PM, Vaughan DE, Stampfer MJ, Manson JE, Shen C, Newcomer LM, et
al. Baseline fibrinolytic state and the risk of future venous thrombosis. A
prospective study of endogenous tissue-type plasminogen activator and
plasminogen activator inhibitor. Circulation 1992 May;85(5):1822-7.
(186) Lawlor DA, Smith GD, Rumley A, Lowe GD, Ebrahim S. Associations of
fibrinogen and C-reactive protein with prevalent and incident coronary heart
disease are attenuated by adjustment for confounding factors. British Women's
Heart and Health Study. Thromb Haemost 2005 May;93(5):955-63.
(187) Junker R, Heinrich J, Schulte H, van de Loo J, Assmann G. Coagulation factor
VII and the risk of coronary heart disease in healthy men. Arterioscler Thromb
Vasc Biol 1997 Aug;17(8):1539-44.
(188) Smith FB, Lee AJ, Fowkes FG, Price JF, Rumley A, Lowe GD. Hemostatic
factors as predictors of ischemic heart disease and stroke in the Edinburgh Artery
Study. Arterioscler Thromb Vasc Biol 1997 Nov;17(11):3321-5.
(189) Smith A, Patterson C, Yarnell J, Rumley A, Ben-Shlomo Y, Lowe G. Which
hemostatic markers add to the predictive value of conventional risk factors for
coronary heart disease and ischemic stroke? The Caerphilly Study. Circulation
2005 Nov 15;112(20):3080-7.
(190) Cooper JA, Miller GJ, Bauer KA, Morrissey JH, Meade TW, Howarth DJ, et al.
Comparison of novel hemostatic factors and conventional risk factors for
prediction of coronary heart disease. Circulation 2000 Dec 5;102(23):2816-22.
(191) Lowe GD, Rumley A, McMahon AD, Ford I, O'Reilly DS, Packard CJ.
Interleukin-6, fibrin D-dimer, and coagulation factors VII and XIIa in prediction
of coronary heart disease. Arterioscler Thromb Vasc Biol 2004 Aug;24(8):1529-
34.
(192) Danesh J, Whincup P, Walker M, Lennon L, Thomson A, Appleby P, et al. Fibrin
D-dimer and coronary heart disease - Prospective study and meta-analysis.
Circulation 2001 May 15;103(19):2323-7.
(193) Hendriks JG, van Horn JR, van der Mei HC, Busscher HJ. Backgrounds of
antibiotic-loaded bone cement and prosthesis-related infection. Biomaterials
2004;25(3):545-56.
(194) Scales JF, Herschell W. Perspex (methylemthacrylate) in orthopaedics. Br Med J
1945;245-9.
(195) JUDET J, JUDET R. The use of an artificial femoral head for arthroplasty of the
hip joint. J Bone Joint Surg Br 1950;32-B(2):166-73.

293
(196) HABOUSH EJ. A new operation for arthroplasty of the hip based on
biomechanics, photoelasticity, fast-setting dental acrylic, and other
considerations. Bull Hosp Joint Dis 1953;14(2):242-77.
(197) Charnley J. Low Friction Arthroplasty of the Hip: Theory and Practice. Berlin,
Heidelberg: Springer-Verlag; 1979.
(198) Charnley J. Acrylic Cement in Orthopaedic Surgery. Edinburgh, London:
Churchill Livingstone; 1972.
(199) Nussbaum DA, Gailloud P, Murphy K. The chemistry of acrylic bone cements
and implications for clinical use in image-guided therapy. J Vasc Interv Radiol
2004;15(2 Pt 1):121-6.
(200) Lewis G, Mladsi S. Effect of sterilization method on properties of Palacos R
acrylic bone cement. Biomaterials 1998;19(1-3):117-24.
(201) Kuhn KD. Bone cement: up-to-date comparison of physical and chemical
properties of commercial interests. Berlin: Springer; 2000.
(202) Hansen E. Modelling heat transfer in a bone-cement-prosthesis system. J
Biomech 2003;36(6):787-95.
(203) Meyer PR, Jr., Lautenschlager EP, Moore BK. On the setting properties of acrylic
bone cement. J Bone Joint Surg Am 1973;55(1):149-56.
(204) DiPisa JA, Sih GS, Berman AT. The temperature problem at the bone-acrylic
cement interface of the total hip replacement. Clin Orthop Relat Res
1976;(121)(121):95-8.
(205) Mjoberg B, Pettersson H, Rosenqvist R, Rydholm A. Bone cement, thermal
injury and the radiolucent zone. Acta Orthop Scand 1984;55(6):597-600.
(206) Reckling FW, Dillon WL. The bone-cement interface temperature during total
joint replacement. J Bone Joint Surg Am 1977;59(1):80-2.
(207) Harving S, Soballe K, Bunger C. A method for bone-cement interface
thermometry. An in vitro comparison between low temperature curing cement
Palavit, and Surgical Simplex P. Acta Orthop Scand 1991;62(6):546-8.
(208) Noordin S, Shortkroff S, Sledge CB, Spector M. Investigation of the activation of
a human serum complement protein, C3, by orthopedic prosthetic particulates.
Biomaterials 2004 Oct;25(23):5347-52.
(209) Ritter MA, Gioe TJ, Sieber JM. Systemic effects of polymethylmethacrylate.
Increased serum levels of gamma-glutamyltranspeptidase following arthroplasty.
Acta Orthop Scand 1984 Aug;55(4):411-3.
(210) Wong KC, Martin WE, Kennedy WF, Akamatsu TJ, Convery RF, Shaw CL.
Cardiovascular effects of total hip placement in man. With observations on the
effects of methylmethacrylate on the isolated rabbit heart. Clin Pharmacol Ther
1977 Jun;21(6):709-14.

294
(211) Dahl OE, Molnar I, Ro JS, Vinje A. Global tests on coagulation and fibrinolysis
in systemic and pulmonary circulation accompanying hip arthroplasty with
acrylic cement. Thromb Res 1988 Jun 15;50(6):865-73.
(212) Dahl OE, Aspelin T, Lyberg T. The role of bone traumatization in the initiation of
proximal deep vein thrombosis during cemented hip replacement surgery in pigs.
Blood Coagul Fibrinolysis 1995 Dec;6(8):709-17.
(213) Hogevold HE, Lyberg T, Kahler H, Haug E, Reikeras O. Changes in plasma IL-1
beta, TNF-alpha and IL-6 after total hip replacement surgery in general or
regional anaesthesia. Cytokine 2000 Jul;12(7):1156-9.
(214) Kristiansson M, Soop M, Sundqvist KG, Soop A, Suontaka AM, Blomback M.
Local vs. systemic immune and haemostatic response to hip arthroplasty.
European Journal of Anaesthesiology 1998 May;15(3):260-70.
(215) Andres BM, Taub DD, Gurkan I, Wenz JF. Postoperative fever after total knee
arthroplasty: the role of cytokines. Clin Orthop Relat Res 2003 Oct;(415):221-31.
(216) Parmet JL, Horrow JC, Pharo G, Collins L, Berman AT, Rosenberg H. The
incidence of venous emboli during extramedullary guided total knee arthroplasty.
Anesth Analg 1995 Oct;81(4):757-62.
(217) Nishiguchi M, Takamura N, Abe Y, Kono M, Shindo H, Aoyagi K. Pilot study on
the use of tourniquet: a risk factor for pulmonary thromboembolism after total
knee arthroplasty? Thromb Res 2005;115(4):271-6.
(218) Katsumata S, Nagashima M, Kato K, Tachihara A, Wauke K, Saito S, et al.
Changes in coagulation-fibrinolysis marker and neutrophil elastase following the
use of tourniquet during total knee arthroplasty and the influence of neutrophil
elastase on thromboembolism. Acta Anaesthesiol Scand 2005 Apr;49(4):510-6.
(219) Nygaard OP, Unneberg K, Reikeras O, Osterud B. Thromboplastin activity of
blood monocytes after total hip replacement. Scand J Clin Lab Invest 1990
Apr;50(2):183-6.
(220) Dahl OE, Pedersen T, Kierulf P, Westvik AB, Lund P, Arnesen H, et al.
Sequential intrapulmonary and systemic activation of coagulation and fibrinolysis
during and after total hip replacement surgery. Thromb Res 1993 Jun
15;70(6):451-8.
(221) Lyberg T. Clinical significance of increased thromboplastin activity on the
monocyte surface--a brief review. Haemostasis 1984;14(5):430-9.
(222) Bagry H, Fontaine JCDL, Asenjo JF, Bracco D, Carli F. Effect of a continuous
peripheral nerve block on the inflammatory response in knee arthroplasty.
Regional Anesthesia and Pain Medicine 2008 Jan;33(1):17-23.
(223) Hall GM, Peerbhoy D, Shenkin A, Parker CJR, Salmon P. Relationship of the
functional recovery after hip arthroplasty to the neuroendocrine and inflammatory
responses. Br J Anaesth 2001 Oct;87(4):537-42.

295
(224) Moore CM, Desborough JP, Powell H, Burrin JM, Hall GM. Effects of
Extradural Anesthesia on Interleukin-6 and Acute-Phase Response to Surgery. Br
J Anaesth 1994 Mar;72(3):272-9.
(225) Beloeil H, Asehnoune K, Moine P, Benhamou D, Mazoit JX. Bupivacaine's
action on the carrageenan-induced inflammatory response in mice: Cytokine
production by leukocytes after ex-vivo stimulation. Anesthesia and Analgesia
2005 Apr;100(4):1081-6.
(226) Kageyama K, Nakajima Y, Shibasaki M, Hashimoto S, Mizobe T. Increased
platelet, leukocyte, and endothelial cell activity are associated with increased
coagulability in patients after total knee arthroplasty. J Thromb Haemost
2007;5(4):738-45.
(227) Pape HC, Schmidt RE, Rice J, van Griensven M, das Gupta R, Krettek C, et al.
Biochemical changes after trauma and skeletal surgery of the lower extremity:
quantification of the operative burden. Crit Care Med 2000;28(10):3441-8.
(228) Lisowska B, Maldyk P. Perioperative inflammatory response in patients with
rheumatoid arthritis undergoing orthopaedic surgery. Archives of Medical
Science 2009;5:248-54.
(229) Honsawek S, Deepaisarnsakul B, Tanavalee A, Sakdinakiattikoon M, Ngarmukos
S, Preativatanyou K, et al. Relationship of serum IL-6, C-reactive protein,
erythrocyte sedimentation rate, and knee skin temperature after total knee
arthroplasty: a prospective study. Int Orthop 2011 Jan;35(1):31-5.
(230) Hughes S, Hendricks B, Middleton J. Total hip and knee replacement surgery
results in changes in leukocyte and endothelial markers. Journal of Inflammation
2010;7(2).
(231) Defi IR, Yamazaki C, Kameo S, Kobayashi K, Nakazawa M, Shinya Y, et al.
Acute phase response of selenium status and glutathione peroxidase activity in
blood plasma before and after total knee arthroplasty surgery. Biol Trace Elem
Res 2011 Dec;144(1-3):388-95.
(232) Hughes S, Hendricks B, Middleton J. Tourniquet-Applied Upper Limb
Orthopaedic Surgery Results in Increased Inflammation and Changes to
Leukocyte, Coagulation and Endothelial Markers. PLOS One 2010.
(233) Krohn CD, Reikeras O, Aasen AO. The cytokines IL-1beta and IL-1 receptor
antagonist, IL-2 and IL-2 soluble receptor-alpha, IL-6 and IL-6 soluble receptor,
TNF-alpha and TNF soluble receptor I, and IL10 in drained and systemic blood
after major orthopaedic surgery. Eur J Surg 1999;165(2):101-9.
(234) Arnold JP, Haeger M, Bengtson JP, Bengtsson A, Lisander B. Release of
inflammatory mediators in association with collection of wound drainage blood
during orthopaedic surgery. Anaesth Intensive Care 1995 Dec;23(6):683-6.
(235) Bastian D, Shegarfi H, Rolstad B, Naper C, Lyngstadaas SP, Reikeras O.
Investigation of lipopolysaccharide receptor expression on human monocytes
after major orthopaedic surgery. Eur Surg Res 2008;40(2):239-45.

296
(236) Antoniades C, Van-Assche T, Shirodaria C, Diesch J, Antonopoulos AS, Lee J, et
al. Preoperative sCD40L levels predict risk of atrial fibrillation after off-pump
coronary artery bypass graft surgery. Circulation 2009 Sep 15;120(11
Suppl):S170-S176.
(237) Desideri G, Panichi V, Ghiadoni L. Soluble CD40 ligand is predictive of
combined cardiovascular morbidity and mortality in patients on haemodialysis at
a relatively short-term follow-up. Nephrology Dialysis Transplantation
2010;26(9):2983-8.
297
ANNEX 1
Participant Information Sheet
NON-INVASIVE MARKERS OF ENDOTHELIAL FUNCTION IN ADULTS
UNDERGOING TOTAL KNEE REPLACEMENT
You are being invited to take part in a research study. Before you decide, it is important that you
should understand why this research is being done, and what it will involve. Please take time to read
this information sheet and to discuss it with family or friends if you wish. Please ask about anything
you are not clear about or do not understand.
What is the purpose of the study?
The main purpose of the study is to examine the effects of joint replacement on blood vessels. It is
already known that a small number of people who present with broken bones or undergo joint
replacement are at risk of developing some complications after their operation like heart disease or
stroke. Inflammation in the blood vessels may contribute to these problems. This study aims to look at
whether joint replacement may cause inflammation in blood vessels.
Why have I been chosen? Do I have to take part?
You have been invited to take part because you are undergoing a total knee replacement. The decision
to take part or not is entirely up to you. If you do decide to take part, you are free to withdraw at any
time.

298
What does the study involve?
You will be asked to sign the consent form attached to this Information Sheet. Some of your medical
details will be discussed with you to ensure that you are eligible for the study.
At the pre-assessment clinic at the same time as your routine blood samples are being taken some
additional blood tubes will be collected so that no additional needles are needed. The total amount of
extra blood collected will be about 30ml (six teaspoonfuls) of blood. In addition to this you will also
undergo a tracing of your heart (otherwise known as an ECG) and a test of the blood vessels in your
arms and legs (otherwise known as ABPI). The ABPI test involves measuring the blood pressure in all
your arms and legs.
At days number 1 and 7 after your operation, again whilst you are getting your normal bloods checked
we shall also take off another 30 mls of blood.
What are the risks or side effects of taking part?
There are no foreseeable risks. Blood will be taken, which would be taken anyway.
What are the possible benefits of taking part? Will I be paid?
If the tracing of your heart or the test of the blood vessels in your arms/legs reveals any abnormalities
we shall refer you onto the appropriate specialists.
You will not be paid for taking part in the study.
Confidentiality
If you decide to take part in this study, we will inform your GP. This is so that all doctors involved in
your care are fully informed. Otherwise, no information about you will leave the Department of
Orthopaedics. Confidential records will be kept secure.
A scientific paper will be prepared using results from the study, and it is likely that this will be
published in a medical journal. You will not be identifiable from any report.

299
Who is organising and funding this research?
The chief investigator is Mr Alec Campbell of the Department of Orthopaedics at Monklands
Hospital, using research funds belonging to the Department
Further information
You can discuss this study with the clinical investigator who will be carrying out the study:
Mr Kenneth Cheng
Department of Orthopaedics,
Monklands Hospital,
Airdrie
Page 419
You can speak to someone who is able to give independent advice about the study:
Mr I McLeod, Consultant Orthopaedic Surgeon
Department of Orthopaedics,
Monklands Hospital,
Airdrie
01236-712-294

300
CONSENT FORM
Title of Project: NON-INVASIVE MARKERS OF ENDOTHELIAL FUNCTION IN ADULTS
UNDERGOING TOTAL KNEE REPLACEMENT
Names of Researchers: Mr A Campbell
Mr K Cheng
Please initial each statement
1. I confirm that I have read and understand the information sheet dated
18/06/07 for this study and have had the opportunity to ask questions. ____
2. I understand that my participation is voluntary and that I am free to withdraw
at any time without giving any reason, without my medical care or legal rights
being affected. ____
3. I understand that sections of any of my medical notes may be looked at by
responsible individuals from regulatory authorities where it is relevant to my
taking part in research. I give permission for these individuals to have access
to my records. ____
4. I understand that my general practitioner will be informed of my participation ____
in this study
5. I agree to take part in the above study. ____

301
Name of Subject Date Signature
Name of person taking consent Date Signature
(if different from researcher)
Name of Researcher Date Signature
1 for patient, 1 for researcher, 1 to be kept with hospital notes

302
ANNEX 2
Department of Orthopaedic Surgery,
Monklands Hospital,
Monkscourt Avenue
Airdrie
ML6 0JS
Dear Dr,
For your information, the above patient has agreed to take part in a research study based here at the
Department of Orthopaedics. I enclose a copy of the patient information sheet for your perusal.
If you wish to discuss this further please feel free to contact me.
Yours sincerely,
Mr Kenneth Cheng
Orthopaedic SpR
Phone 07803203888
E-mail: [email protected]
303
ANNEX 3
Lanarkshire Local Research Ethics Committee
Lanarkshire NHS Board
14 Beckford St
Hamilton
ML3 OTA
Telephone: 01698 281313
Facsimile:
11 January 2008
Mr A Campbell
Consultant Orthopaedic Surgeon
Monklands Hospital
Monkscourt Avenue
Airdrie
Dear Mr Campbell
Full title of study: Non invasive markers of endothelial function in adults
undergoing total knee replacement
REC reference number: 07/S1001/51
Thank you for your letter responding to the Committee’s request for further information on the
above research and submitting revised documentation.
The further information has been considered on behalf of the Committee by the Chair.
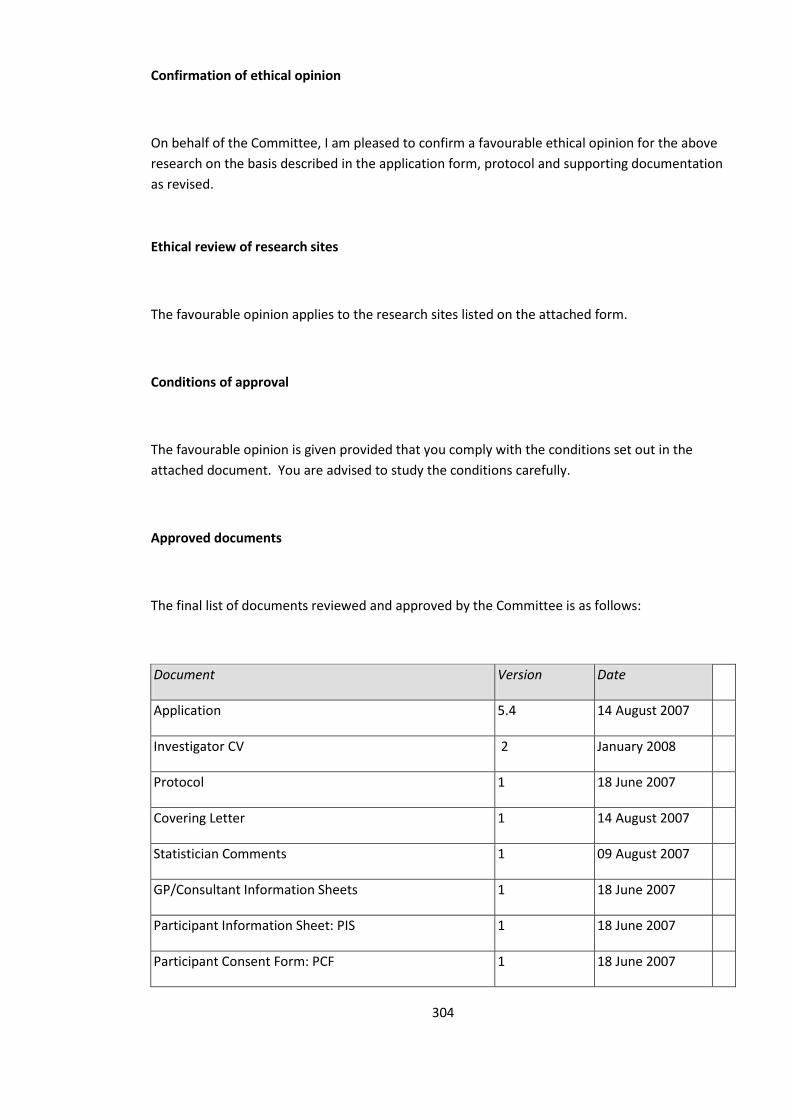
304
Confirmation of ethical opinion
On behalf of the Committee, I am pleased to confirm a favourable ethical opinion for the above
research on the basis described in the application form, protocol and supporting documentation
as revised.
Ethical review of research sites
The favourable opinion applies to the research sites listed on the attached form.
Conditions of approval
The favourable opinion is given provided that you comply with the conditions set out in the
attached document. You are advised to study the conditions carefully.
Approved documents
The final list of documents reviewed and approved by the Committee is as follows:
Document Version Date
Application 5.4 14 August 2007
Investigator CV 2 January 2008
Protocol 1 18 June 2007
Covering Letter 1 14 August 2007
Statistician Comments 1 09 August 2007
GP/Consultant Information Sheets 1 18 June 2007
Participant Information Sheet: PIS 1 18 June 2007
Participant Consent Form: PCF 1 18 June 2007

305
R&D approval
All researchers and research collaborators who will be participating in the research at NHS sites
should apply for R&D approval from the relevant care organisation, if they have not yet done so.
R&D approval is required, whether or not the study is exempt from SSA. You should advise
researchers and local collaborators accordingly.
Guidance on applying for R&D approval is available from
http://www.rdforum.nhs.uk/rdform.htm.
Statement of compliance
The Committee is constituted in accordance with the Governance Arrangements for Research
Ethics Committees (July 2001) and complies fully with the Standard Operating Procedures for
Research Ethics Committees in the UK.
After ethical review
Now that you have completed the application process please visit the National Research Ethics
Website > After Review
Here you will find links to the following
a) Providing feedback. You are invited to give your view of the service that you have received
from the National Research Ethics Service on the application procedure. If you wish to
make your views known please use the feedback form available on the website.
b) Progress Reports. Please refer to the attached Standard conditions of approval by
Research Ethics Committees.
c) Safety Reports. Please refer to the attached Standard conditions of approval by Research
Ethics Committees.
d) Amendments. Please refer to the attached Standard conditions of approval by Research
Ethics Committees.
e) End of Study/Project. Please refer to the attached Standard conditions of approval by
Research Ethics Committees.

306
We would also like to inform you that we consult regularly with stakeholders to improve our
service. If you would like to join our Reference Group please email
07/S1001/51 Please quote this number on all correspondence
With the Committee’s best wishes for the success of this project
Yours sincerely
MRS. P. CONWAY
SECRETARY TO THE GROUP
Enclosures: Standard approval conditions [SL-AC1 for CTIMPs, SL-AC2 for other studies]
Site approval form

1
Lanarkshire Local Research Ethics Committee
LIST OF SITES WITH A FAVOURABLE ETHICAL OPINION
For all studies requiring site-specific assessment, this form is issued by the main REC to the Chief Investigator and sponsor with the favourable opinion letter and
following subsequent notifications from site assessors. For issue 2 onwards, all sites with a favourable opinion are listed, adding the new sites approved.
REC reference number:
07/S1001/51
Issue number:
0
Date of issue:
11 January 2008
Chief Investigator: Mr A Campbell
Full title of study:
Non invasive markers of endothelial function in adults undergoing total knee replacement
This study was given a favourable ethical opinion by Lanarkshire Local Research Ethics Committee on 11 January 2008. The favourable opinion is extended to each
of the sites listed below. The research may commence at each NHS site when management approval from the relevant NHS care organisation has been confirmed.
Principal Investigator
Post
Research site
Site assessor
Date of favourable
opinion for this site
Notes (1)

2
(1) The notes column may be used by the main REC to record the early closure or withdrawal of a site (where notified by the Chief Investigator or sponsor), the
suspension of termination of the favourable opinion for an individual site, or any other relevant development. The date should be recorded
Mr A Campbell Consultant Orthopaedic
surgeon
Monklands Hospital -
NHS Lanarkshire
Lanarkshire Local
Research Ethics
Committee
11/01/2008
Approved by the Chair on behalf of the REC:
.……………………………………………… (Signature of Chair/Co-ordinator)
(delete as applicable)
………………………………………………. (Name)

3