Embed Size (px)
Citation preview

• • • • • • •
•••
Copyright 2007, 1790 Analytics, LLC
The Effect of E-Resources on Technology Development
Concert 2007 – November 15, 2007
Anthony Breitzman, Ph.D
1790 Analytics130 Haddon Ave. Haddonfield, NJ 08033www.1790analytics.com

2• • • • • • •
•••
Copyright 2007, 1790 Analytics, LLC
Introduction
Developments in technology are visible as trends in the patent system.
In the last 20 years, the number of references from patents to scientific and technical papers has increased dramatically.
This suggests that either scientific developments are linked more closely with technology developments, or else that connection is merely becoming more visible.
Whatever the reason for the increased linkage, electronic availability of white papers, technical reports, and especially journal articles and conference papers deserves at least some of the credit.
3• • • • • • •
•••
Copyright 2007, 1790 Analytics, LLC
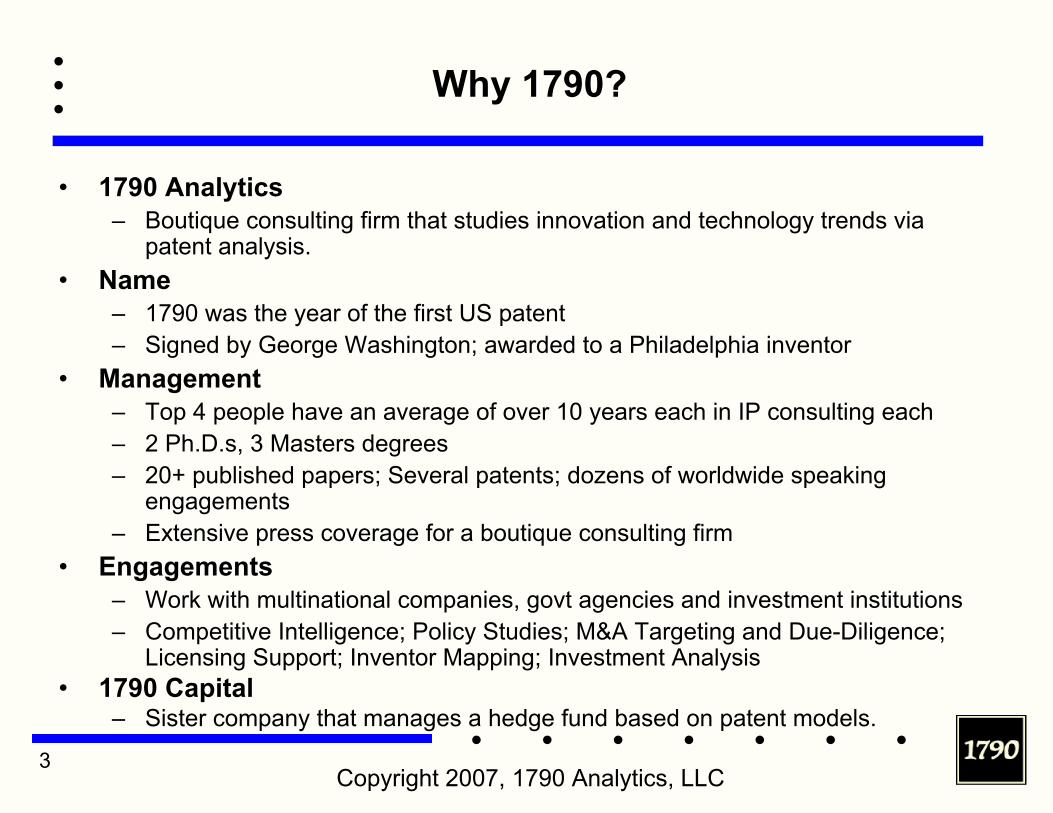
Why 1790?
• 1790 Analytics– Boutique consulting firm that studies innovation and technology trends via
patent analysis.• Name
– 1790 was the year of the first US patent– Signed by George Washington; awarded to a Philadelphia inventor
• Management– Top 4 people have an average of over 10 years each in IP consulting each– 2 Ph.D.s, 3 Masters degrees– 20+ published papers; Several patents; dozens of worldwide speaking
engagements– Extensive press coverage for a boutique consulting firm
• Engagements– Work with multinational companies, govt agencies and investment institutions– Competitive Intelligence; Policy Studies; M&A Targeting and Due-Diligence;
Licensing Support; Inventor Mapping; Investment Analysis• 1790 Capital
– Sister company that manages a hedge fund based on patent models.
4• • • • • • •
•••
Copyright 2007, 1790 Analytics, LLC
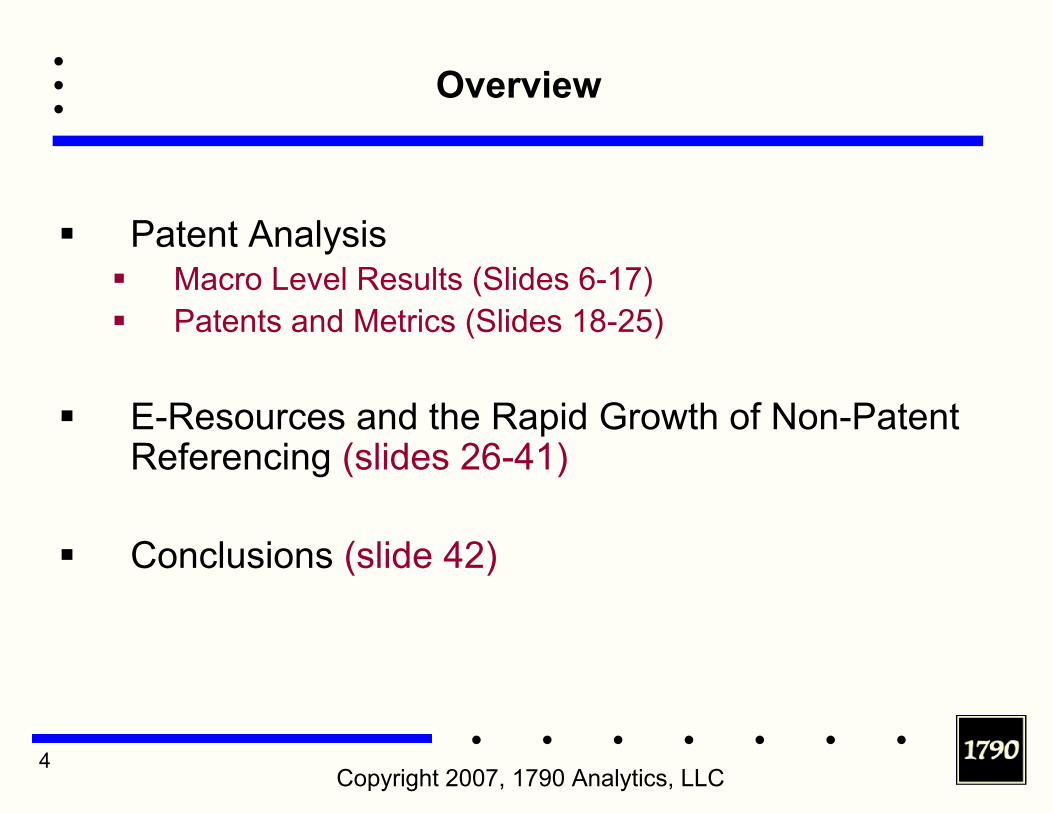
Overview
Patent Analysis Macro Level Results (Slides 6-17)Patents and Metrics (Slides 18-25)
E-Resources and the Rapid Growth of Non-Patent Referencing (slides 26-41)
Conclusions (slide 42)
5• • • • • • •
•••
Copyright 2007, 1790 Analytics, LLC
Why Analyze Patents?
• The high-tech economies of the US, Japan, and others are increasingly built upon patents.
• IBM’s patent portfolio is far more valuable than all of its plants and equipment.
• In fact, most of the value of companies like Microsoft, Intel, Sony, Canon, Philips etc. comes not from tangible assets such as plants and equipment, but from intangible assets like patents, trademarks, copyrights, know-how, etc.
• Patents are the most tangible of intangible assets.• Patent protection encourages innovation.• 196,000+ US patents issued in 2006.• On average, every business day 2000 US patents are
applied for and 900 are issued; 15 per day are issued to IBM alone.

6• • • • • • •
•••
Copyright 2007, 1790 Analytics, LLC
Some Results of Patent Analyses
• Since many in the audience are not familiar with patent analysis we will take a quick detour and show some “macro” level results from an analysis of China and Taiwan before embarking on the main topic of the effect of E-Resources on technology development
• The following slides show some key results from the US patent system related to technology development
7• • • • • • •
•••
Copyright 2007, 1790 Analytics, LLC
The US Patent System is Global
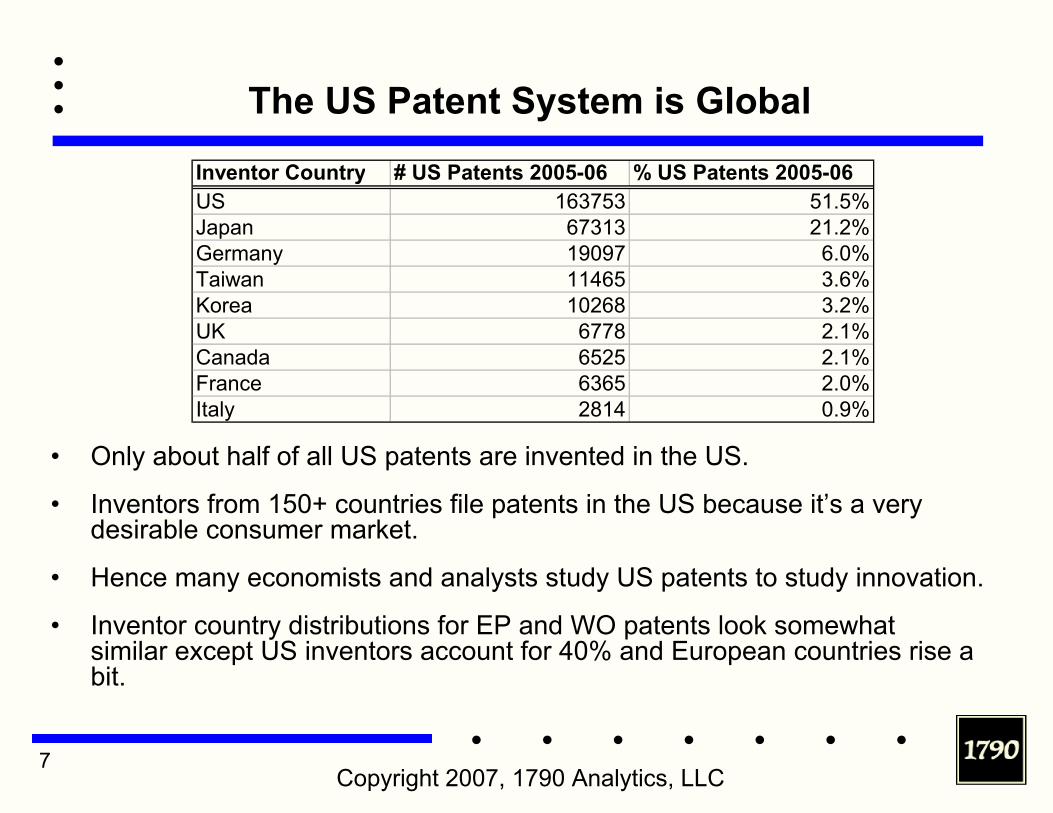
• Only about half of all US patents are invented in the US.
• Inventors from 150+ countries file patents in the US because it’s a very desirable consumer market.
• Hence many economists and analysts study US patents to study innovation.
• Inventor country distributions for EP and WO patents look somewhat similar except US inventors account for 40% and European countries rise a bit.
Inventor Country # US Patents 2005-06 % US Patents 2005-06US 163753 51.5%Japan 67313 21.2%Germany 19097 6.0%Taiwan 11465 3.6%Korea 10268 3.2%UK 6778 2.1%Canada 6525 2.1%France 6365 2.0%Italy 2814 0.9%

8• • • • • • •
•••
Copyright 2007, 1790 Analytics, LLC
Information and Communication Technology is a Large Fraction of US Patented Technology
(Distribution Of 2006 US Patents from all Inv. Countries)
Electrical8%
Industrial Processes/ Tools/Equip.
4%
Instruments/ Measuring, Testing & Control
10%
Mechanical8%
Other9%
Semic/ Computers/ Communic.
39%
Biotech/ Pharma/ Med.
Inst./ Health10%
Chemical8%
Building/ Constr./ Housing Materials
2%
Agric/Food2%

9• • • • • • •
•••
Copyright 2007, 1790 Analytics, LLC
Top 7 Fastest Growing Inventor Countries in US Patent System
9.93
7.567.33
4.393.853.43
0
1
2
3
4
5
6
7
8
9
10
1995 1996 1997 1998 1999 2000 2001 2002 2003 2004 2005Year
# U
S P
aten
ts /
# 19
95 U
S P
aten
ts(3
-Yea
r Ru
nnin
g Av
erag
e)
China (mainland)IndiaSingaporeHong KongKorea (South)TaiwanIreland
10• • • • • • •
•••
Copyright 2007, 1790 Analytics, LLC
Top Technologies for China, Hong Kong, Taiwan and US (1997-2005 US Patents)
3% 2% 3%5% 3%3%
2%
7%2% 8%
4%
2%3%
10%
5%
3%5%
7%
6%
9%13%
4%
3%
9%8% 7%
14%
11%4% 5% 20%5%10% 9%
8% 14%
22%14%
16% 6%
2%
0%
10%
20%
30%
40%
50%
60%
70%
80%
CN HK TW USInventor Country
% o
f US
Pate
nts
Electrical
Computer Hardware/Software
Semiconductors
Motor Vehicle/ Other Mechanical
Chemical
Communications/TelecomFurnitureSports/GamesMedical Devices
PharmaceuticalBiotechnologyTextiles

11• • • • • • •
•••
Copyright 2007, 1790 Analytics, LLC
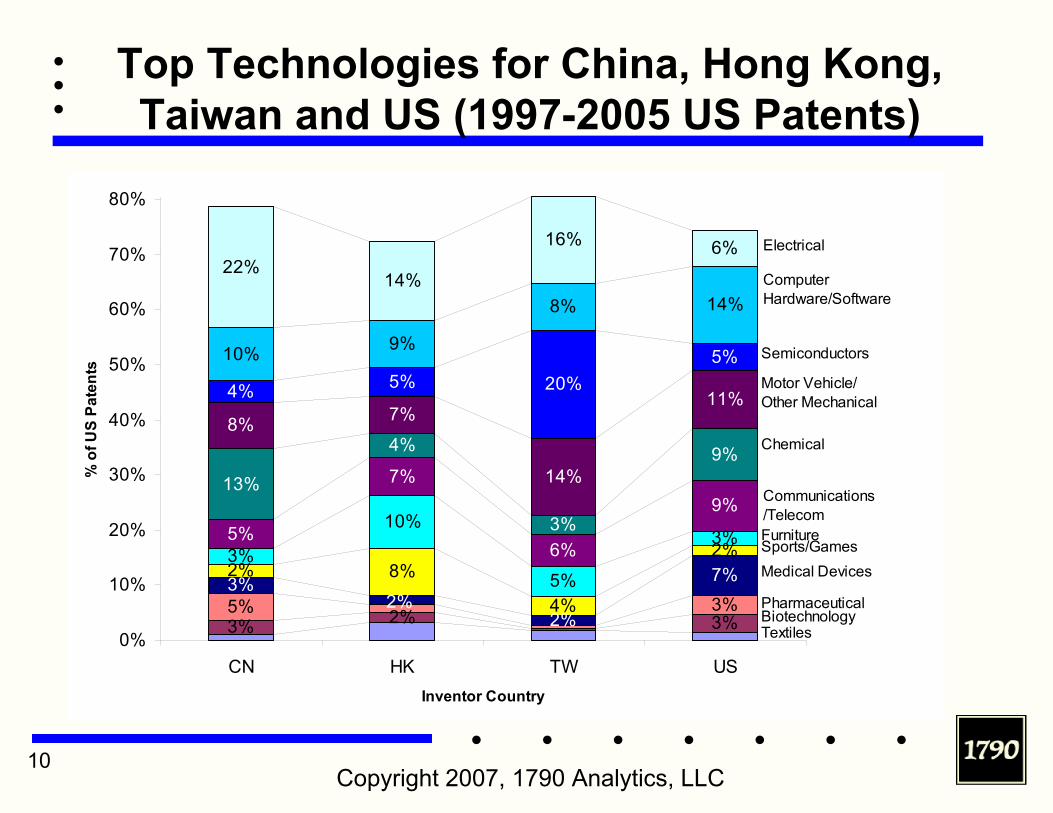
China, Hong Kong, and Taiwan have different patent profiles
• Taiwan’s patents are concentrated in a few areas.– Over 33% of Taiwanese invented patents are related to
information technology; 20% are in semiconductors; 14% are related to automotive and mechanical.
• 13% of Chinese invented patents are chemical related; it also has 11% of its patents in health related technologies.– This is higher than Taiwan and comparable to the US.
• Hong Kong has a surprising amount of invention related to furniture and home fixtures, as well as sports and games.

12• • • • • • •
•••
Copyright 2007, 1790 Analytics, LLC
Companies with largest number of Chinese Invented US Patents 1990-2005
202121212424262629313438394041
6583
108668
0 100 200 300 400 500 600 700 800
Bayer AG
Procter & Gamble
Winbond Electronics Corp
Haier Group Corp
Gem Services Inc
Johnson Electric SA
Tsinghua University
IBM
United Microelectronics Corp
Flying Dragon Development Ltd
Sae Magnetics (H K ) Ltd
Ningbo Beifa Group Co Ltd
C C & L Co Ltd
Great Neck Saw Mfg Inc
International Development Corp
Microsoft Corp
Inventec Corp
China Petrochem Corp (Sinopec)
Hon Hai Precision Co. Ltd.
# Patents invented in China
Taiwanese Company
German Company
Hong Kong based Company
US Company
Chinese Company

13• • • • • • •
•••
Copyright 2007, 1790 Analytics, LLC
Implications of Previous Slide
• China’s technology rise has a completely different pattern to those previously seen in Japan and Korea– Japan’s technology rise was associated with a rise among
Japanese patenting companies like Sony, Canon, Hitachi, Toshiba, Toyota, Honda, etc.
• China’s patent rise is largely due to multinational companies setting up labs within China.– The top assignee by a wide margin is Hon-Hai (a Taiwanese
company).– Companies with the most Chinese invented patents include
companies from US, Hong Kong, and Germany.– Chinese company with largest number of US patents is the
petroleum giant Sinopec.

14• • • • • • •
•••
Copyright 2007, 1790 Analytics, LLC
Companies with largest number of Taiwanese Invented US Patents
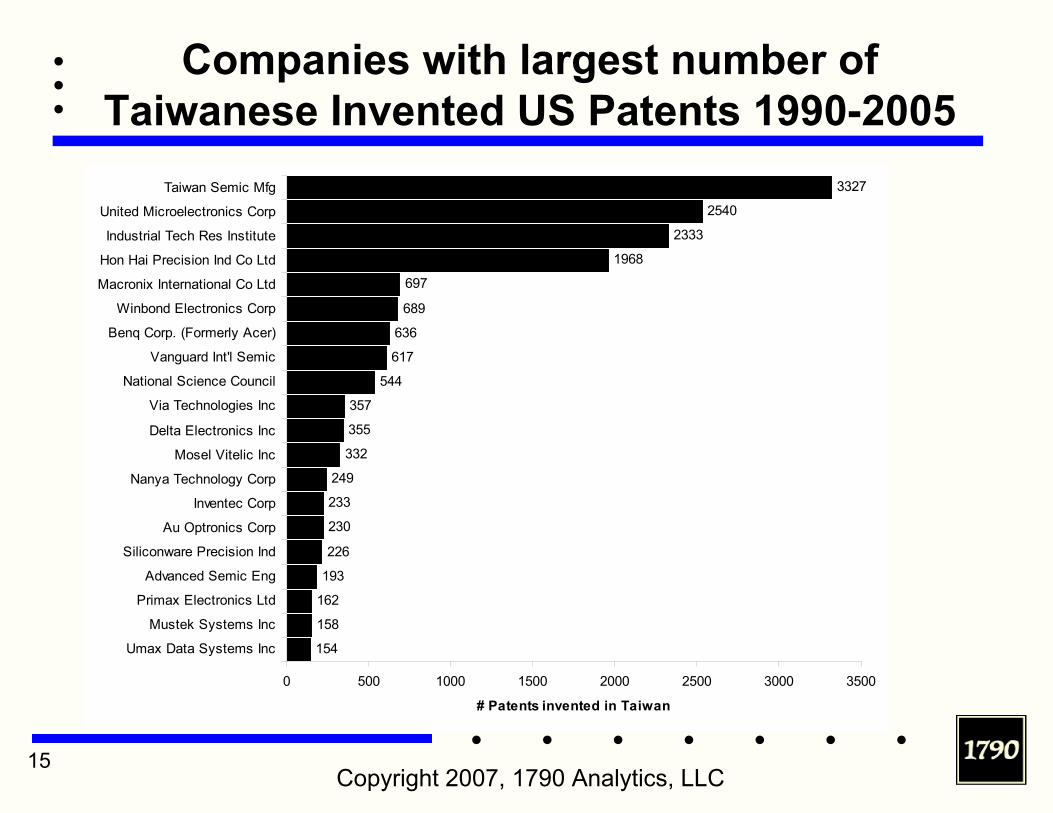
• We see in the next slide that the top patenting companies in Taiwan are all Taiwanese companies.
• This is very different to the top patenting companies in China shown previously.
• This is also similar to the rise of Japan 20 years ago.
• Note that almost all of the top 20 companies in the next slide are Information Technology and Semiconductor companies.
15• • • • • • •
•••
Copyright 2007, 1790 Analytics, LLC
Companies with largest number of Taiwanese Invented US Patents 1990-2005
154
158
162
193
226
230
233
249
332
355
357
544
617
636
689
697
1968
2333
2540
3327
0 500 1000 1500 2000 2500 3000 3500
Umax Data Systems Inc
Mustek Systems Inc
Primax Electronics Ltd
Advanced Semic Eng
Siliconware Precision Ind
Au Optronics Corp
Inventec Corp
Nanya Technology Corp
Mosel Vitelic Inc
Delta Electronics Inc
Via Technologies Inc
National Science Council
Vanguard Int'l Semic
Benq Corp. (Formerly Acer)
Winbond Electronics Corp
Macronix International Co Ltd
Hon Hai Precision Ind Co Ltd
Industrial Tech Res Institute
United Microelectronics Corp
Taiwan Semic Mfg
# Patents invented in Taiwan

16• • • • • • •
•••
Copyright 2007, 1790 Analytics, LLC
Companies with largest number of Hong Kong Invented US Patents
• The next slide shows that the top patenting companies in Hong Kong are mostly Hong Kong companies, with a few from the US, Netherlands, and Singapore.
• Unlike Taiwan, most of these companies are not particularly high-tech. These include flashlight, power tool, bath product, and appliance makers, mingled in with universities and other companies.
• This is different from the patent profile for both mainland China and Taiwan.

17• • • • • • •
•••
Copyright 2007, 1790 Analytics, LLC
Companies with largest number of Hong Kong Invented US Patents 1990-2005
23
25
25
28
28
28
29
30
30
31
32
33
35
38
41
41
54
67
69
113
0 20 40 60 80 100 120
Chartered Semic Mfg
Mass Technology Ltd
Choon Nang Electrical Appl
Asat Ltd
Hong Kong Polytechnic Univ
Brand New Technology Ltd
Sae Magnetics Ltd
The Brinkmann Corp
Nationalpak Ltd
Solar Wide Industrial Ltd
Alfa Technology Ltd
Pollyflame International Bv
C J Associates Ltd
Johnson Electric Sa
Hayco Manufacturing Ltd
Motorola Inc
Astec International Ltd
Hong Kong Univ Of S&T
Techtronic Industries
John Manufacturing Ltd
# Patents invented in Hong Kong
Hong Kong Based Company
Company Based in Singapore
US Company
Dutch Company
18• • • • • • •
•••
Copyright 2007, 1790 Analytics, LLC
Basic Idea of a Patent
"The patent system added the fuel of interest to the fire of genius."Abraham Lincoln – Only US President to obtain a patent.
The government grants a 20 year monopoly right in exchange for detailed disclosure of invention.
Must be: Novel, Useful, and Non-obvious
Encourages companies to divulge inventions so that others can build on them and improve the state the art.

19• • • • • • •
•••
Copyright 2007, 1790 Analytics, LLC
The Need for Patent Analytics
• Some patents are valuable:– 4,901,307 “Spread spectrum multiple access communication
system using satellite or terrestrial repeaters” (Qualcomm’s fundamental CDMA patent used by every cell phone in North America)
• Some are not:– 6,805,460 “Advanced dog collar flashlight”
• With more than a million patents issued in the last decade, a statistical method is necessary for identifying valuable patents among mostly non-valuable patents.
20• • • • • • •
•••
Copyright 2007, 1790 Analytics, LLC
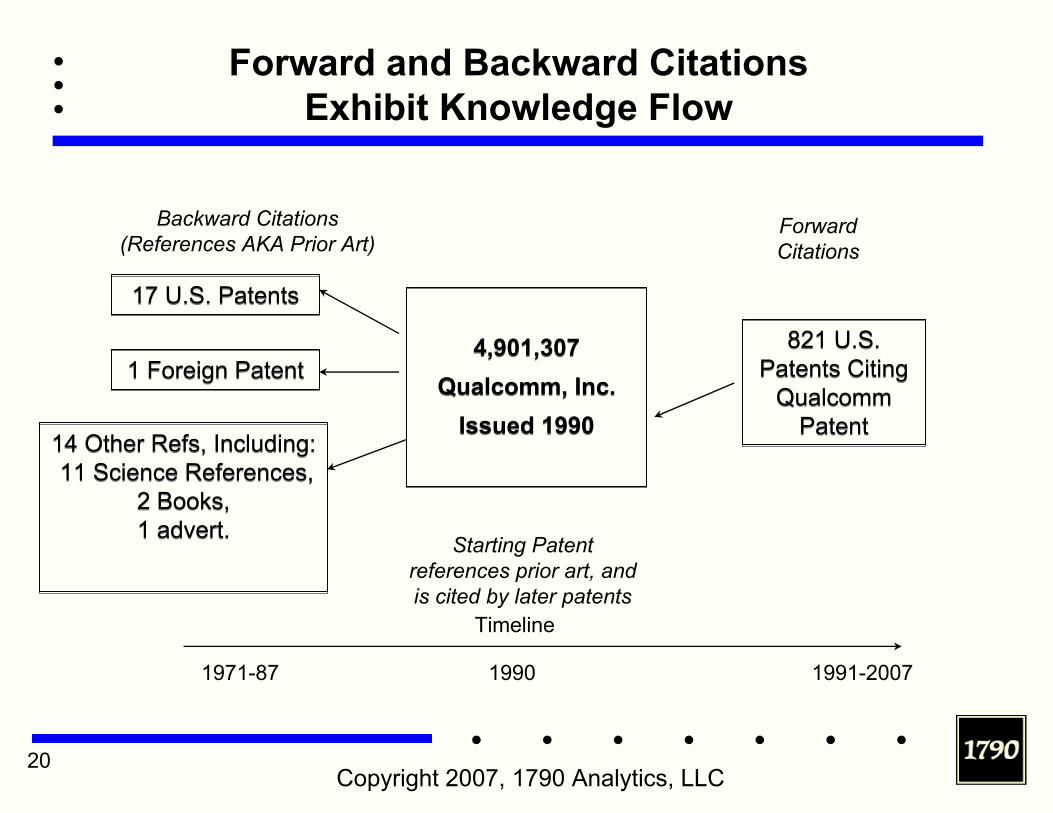
Forward and Backward Citations Exhibit Knowledge Flow
17 U.S. Patents17 U.S. Patents
1 Foreign Patent1 Foreign Patent4,901,307
Qualcomm, Inc.Issued 1990
4,901,307Qualcomm, Inc.
Issued 1990
821 U.S. Patents Citing
Qualcomm Patent
821 U.S. Patents Citing
Qualcomm Patent
14 Other Refs, Including:11 Science References,
2 Books,1 advert.
14 Other Refs, Including:11 Science References,
2 Books,1 advert.
Backward Citations (References AKA Prior Art)
Forward Citations
Timeline
1971-87 1990 1991-2007
Starting Patent references prior art, and is cited by later patents
21• • • • • • •
•••
Copyright 2007, 1790 Analytics, LLC
The Science Base
The Backward Citations represent the prior art. Current patents build upon and expand the utility of the prior art.
The Science Base is the portion of prior art consisting of scientific papers.
Patents with a strong science base tend to be more novel than those with only patent prior art.
E.g. a mousetrap that makes an incremental improvement on an earlier mechanism will reference a predecessor patent.A mousetrap that uses a new improved long-lasting material for the mechanism, will probably cite to a scientific paper.

22• • • • • • •
•••
Copyright 2007, 1790 Analytics, LLC
Forward Citations
Forward citations measure the impact of a patent or set of patents.A groundbreaking idea will often lead to a number of new patents that cite the original idea. E.g. When the LCD panel was developed it led to hundreds of new innovations as companies incorporated LCD’s into calculators, phones, microwaves, etc.Each new use or expansion will cite back to the original invention, so that citations can be used to measure a patent’s impact.Numerous validation studies have confirmed this intuitive idea:
Inventor awards correlated with high citation.Companies with many highly cited patents outperform other companies in the stock market.Pioneering Patents, Hall of Fame Patents, Historically Significant Patents, all cited 3-6 times more than patents from the same technology and era.

23• • • • • • •
•••
Copyright 2007, 1790 Analytics, LLC
Patent Metrics
Over the years a variety of metrics have been developed for measuring the impact and quality of patents, companies, inventors, etc.
Typically a study involves identifying a patent set in an industry or technology and then benchmarking it by company.
Following is an example scoreboard that appeared in IEEE Spectrum last November.
Boeing and others generated press releases touting their rankings after the magazine was published.
New version just appeared in the November 2007 Spectrum.
Benchmark studies of technologies and industries use the same type of scoreboards.

24• • • • • • •
•••
Copyright 2007, 1790 Analytics, LLC
Subset of Scoreboard from IEEE Spectrum Nov. 2006 (produced by 1790 Analytics)
25• • • • • • •
•••
Copyright 2007, 1790 Analytics, LLC
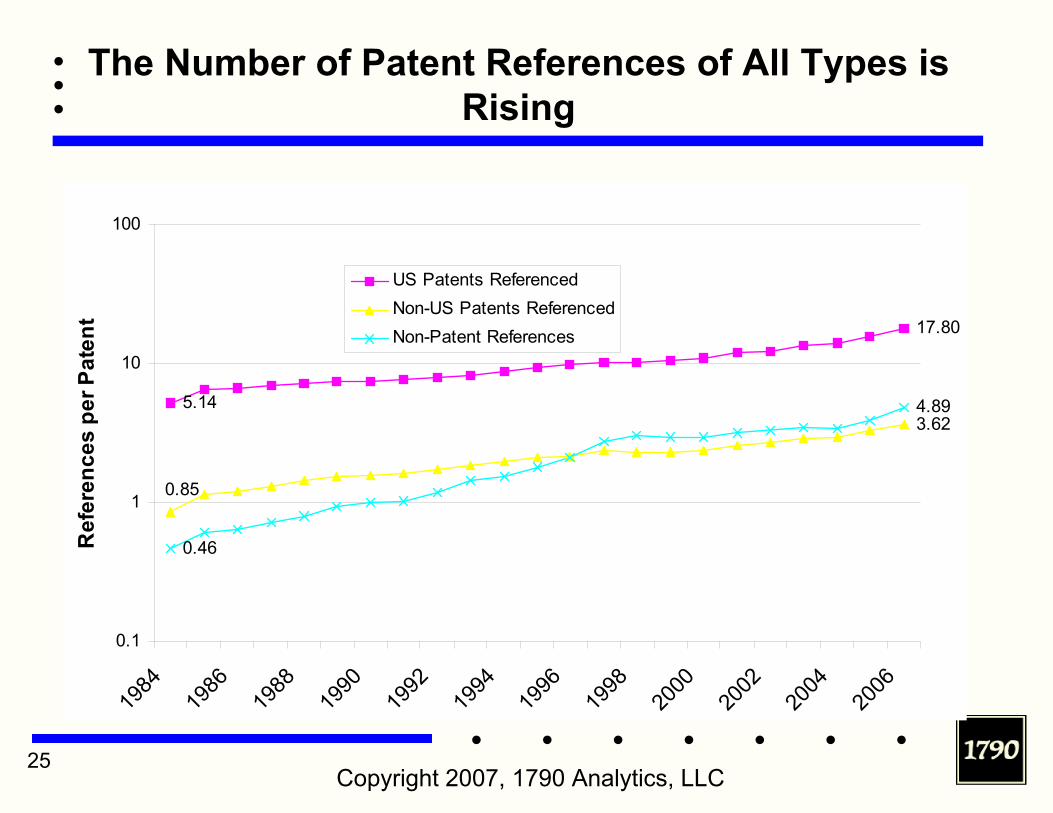
The Number of Patent References of All Types is Rising
5.14
17.80
0.85
3.62
0.46
4.89
0.1
1
10
100
1984
1986
1988
1990
1992
1994
1996
1998
2000
2002
2004
2006
Ref
eren
ces
per P
aten
t
US Patents ReferencedNon-US Patents ReferencedNon-Patent References

26• • • • • • •
•••
Copyright 2007, 1790 Analytics, LLC
References to Non-Patent Prior Art are Growing Fastest
3.46
4.25
10.65
0
2
4
6
8
10
12
1984
1985
1986
1987
1988
1989
1990
1991
1992
1993
1994
1995
1996
1997
1998
1999
2000
2001
2002
2003
2004
2005
2006
Ref
eren
ces/
Pat d
ivid
ed b
y 19
84 R
efer
ence
s/Pa
t
US Patents Referenced (Growth)Non-US Patents Referenced (Growth)Non-Patent References (Growth)
27• • • • • • •
•••
Copyright 2007, 1790 Analytics, LLC
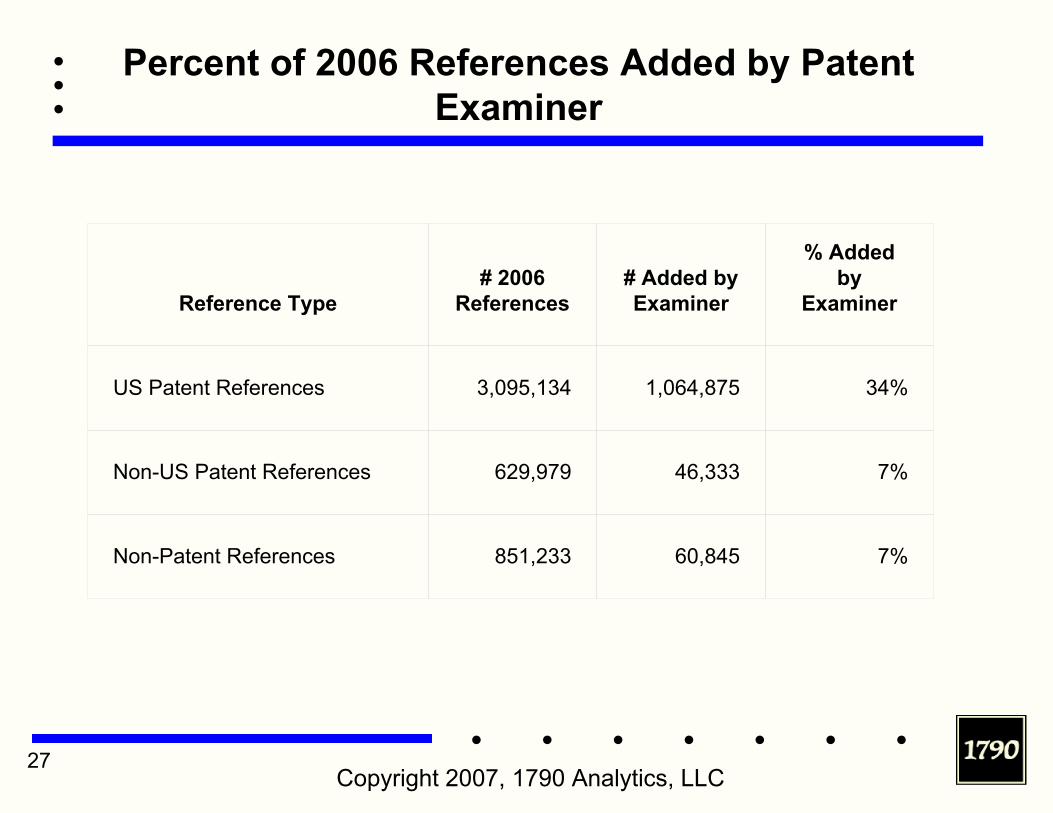
Percent of 2006 References Added by Patent Examiner
Reference Type# 2006
References# Added by Examiner
% Added by
Examiner
US Patent References 3,095,134 1,064,875 34%
Non-US Patent References 629,979 46,333 7%
Non-Patent References 851,233 60,845 7%
28• • • • • • •
•••
Copyright 2007, 1790 Analytics, LLC
Reference Growth Implications I
• All references are growing, but Non-Patent References (journal articles, technical reports, etc.) are growing at twice the rate of the others.
• There are several reasons why patents make references. 1. Inventor sees a paper or patent and thinks of a way to improve it.2. Inventor/company sees a successful product and attempts to ‘build-around’ the
product’s patent.3. Inventor, attorney, or examiner does a prior art search and adds references to
limit claims.
• It isn’t easy to determine which references are inspirational and whichwere added during a prior art search.
• The NPRs are more likely to be inspirational because much fewer are added by the examiner.
• In economic studies (such as Branstetter, 2003) empirical evidence has been presented that suggests that the nature of inventive activity has changed such that scientific articles are leading to more inventive activity.
29• • • • • • •
•••
Copyright 2007, 1790 Analytics, LLC
Reference Growth Implications II
• Branstetter (2003) suggests that knowledge spillovers from university science into patents are at least partially responsible for increases in R&D productivity.
• Articles, technical reports, product specifications, are all more available electronically, are seen by more people, including potential inventors, and are more efficiently incorporated into inventions.
• He points out that surging patent applications and grants that started in the 1980s, and still persist today, have far outpaced investments in both public and private R&D. One explanation is that more efficient use of scientific research has led to more innovations from fewer dollars than in the past.
• Bottom line:1. Availability of E-Resources one of the driving forces of the increased
references.2. In at least some of the cases the increased availability of E-Resources
likely inspired new patented technologies

30• • • • • • •
•••
Copyright 2007, 1790 Analytics, LLC
Reference Growth Implications III
• But, how come patent prior art is also increasing? Also likely due to E-Resources.
• In 1980’s patents only available on paper in patent repositories.
• Early 1990’s searchable CD-ROMs (available but somewhat expensive)
• Late 1990s PTO put up a limited web site of all US patents.
• Early 2000s other patent websites added like EPO online, Delphion, Google Pats, etc.

31• • • • • • •
•••
Copyright 2007, 1790 Analytics, LLC
NPRs Increasing In All Technologies
7.6
1.4
16.2
1.50.9
0.19
3.14
0.71
4.3
8.7
-1
1
3
5
7
9
11
13
15
1719
84
1985
1986
1987
1988
1989
1990
1991
1992
1993
1994
1995
1996
1997
1998
1999
2000
2001
2002
2003
2004
2005
2006
# N
PRS
Per P
aten
t
Building/Construction/Housing Materials and FixturesChemicalElectricalBiotech/Pharma/HealthMechanicalOtherSemiconductors/Computers/CommunicationInstruments/Measuring, Testing & ControlIndustrial Processes/Tools/EquipmentAgriculture/Husbandry/Food
32• • • • • • •
•••
Copyright 2007, 1790 Analytics, LLC
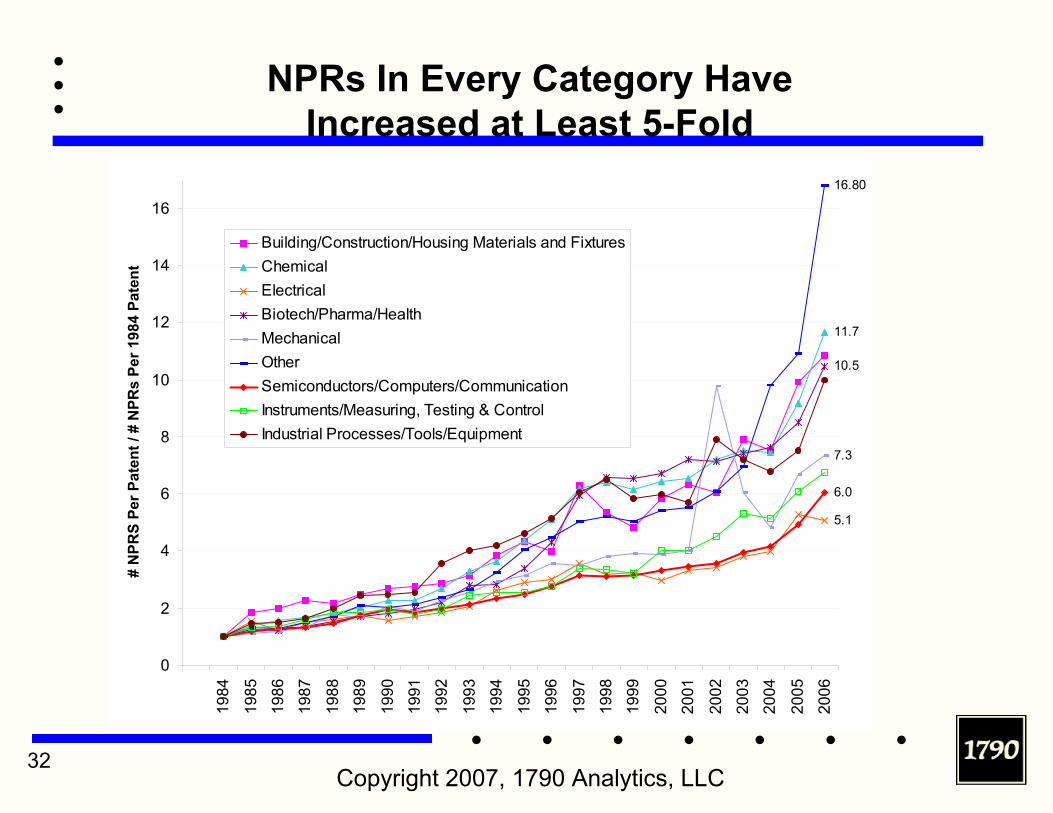
NPRs In Every Category Have Increased at Least 5-Fold
11.7
5.1
10.5
7.3
16.80
6.0
0
2
4
6
8
10
12
14
1619
84
1985
1986
1987
1988
1989
1990
1991
1992
1993
1994
1995
1996
1997
1998
1999
2000
2001
2002
2003
2004
2005
2006
# N
PRS
Per P
aten
t / #
NPR
s Pe
r 198
4 Pa
tent
Building/Construction/Housing Materials and FixturesChemicalElectricalBiotech/Pharma/HealthMechanicalOtherSemiconductors/Computers/CommunicationInstruments/Measuring, Testing & ControlIndustrial Processes/Tools/Equipment
33• • • • • • •
•••
Copyright 2007, 1790 Analytics, LLC
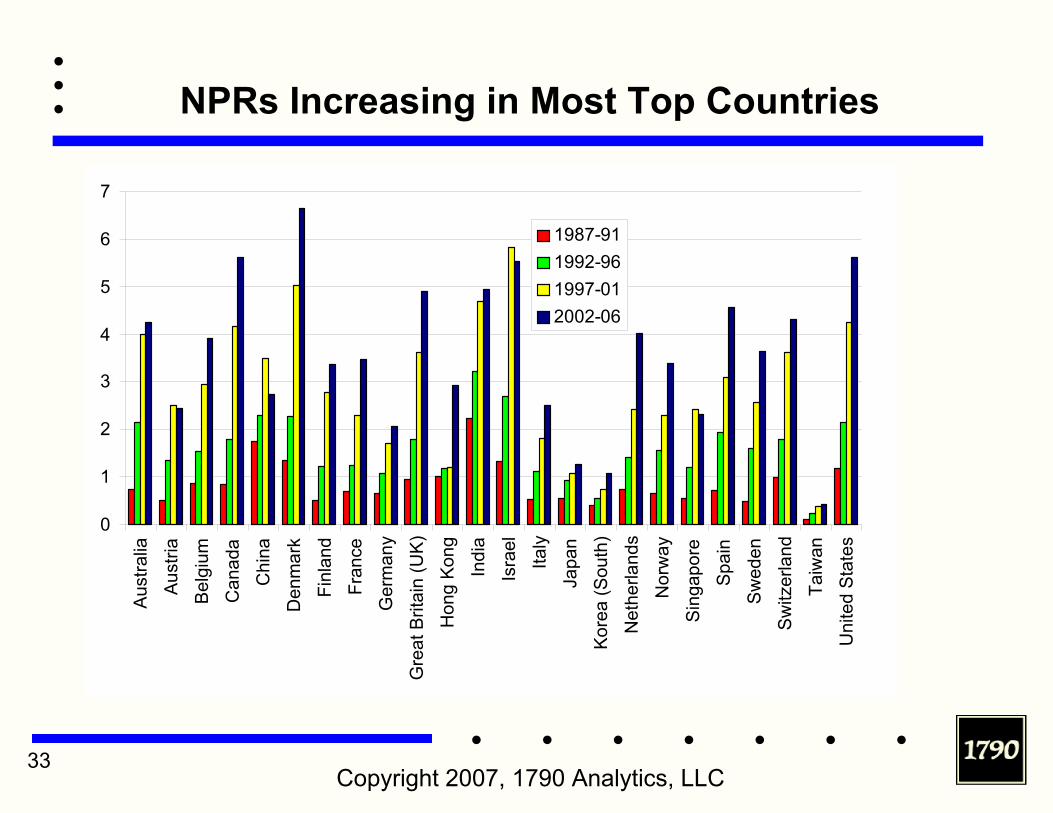
NPRs Increasing in Most Top Countries
0
1
2
3
4
5
6
7
Aus
tralia
Aus
tria
Bel
gium
Can
ada
Chi
na
Den
mar
k
Finl
and
Fran
ce
Ger
man
y
Gre
at B
ritai
n (U
K)
Hon
g K
ong
Indi
a
Isra
el
Italy
Japa
n
Kor
ea (S
outh
)
Net
herla
nds
Nor
way
Sin
gapo
re
Spa
in
Sw
eden
Sw
itzer
land
Taiw
an
Uni
ted
Sta
tes
1987-911992-961997-012002-06

34• • • • • • •
•••
Copyright 2007, 1790 Analytics, LLC
Notes on Previous Slides
• All categories have seen growth in NPRs.
• Health related categories have the most NPRs but not the highest growth.
• Different countries have different NPR growth patterns. Denmark has the highest average NPRs. It probably has a lot of life science patents. Taiwan has the lowest NPR rate; it hasa lot of Semiconductor patents.
• The remaining slides will be related to semiconductors, computer, and telecom patents aka Information and Communications Technology (ICT).
• ICT Patents have had 6-Fold increase in NPRs

35• • • • • • •
•••
Copyright 2007, 1790 Analytics, LLC
Distribution of ICT NPRs
0.93
1.47
0.35
0.64
0.480.43
0.210.150.10
0.060.00
0.20
0.40
0.60
0.80
1.00
1.20
1.40
1.60
1997 1998 1999 2000 2001 2002 2003 2004 2005 2006
# R
efer
ence
s Pe
r Pat
ent
Journal
Conference/ Seminar/Meeting
Patent Abstract/SearchReportInternet Article/W ebPage
Book Chapter
Corporate Document
Standards Document
TechnicalReport/NotesMagazine
Brochure
Press Release
IBM TechnicalDisclosure Bulletin
36• • • • • • •
•••
Copyright 2007, 1790 Analytics, LLC
Notes on Previous Slide
• The bulk of the ICT NPRs are Journal and Conference references.
• Although these are supposed to be Non-Patent References, they do include some references that are patent applications.
• Web pages and internet articles have seen the highest growth. None in 1997 to 0.43 per ICT patent in 2006.
37• • • • • • •
•••
Copyright 2007, 1790 Analytics, LLC
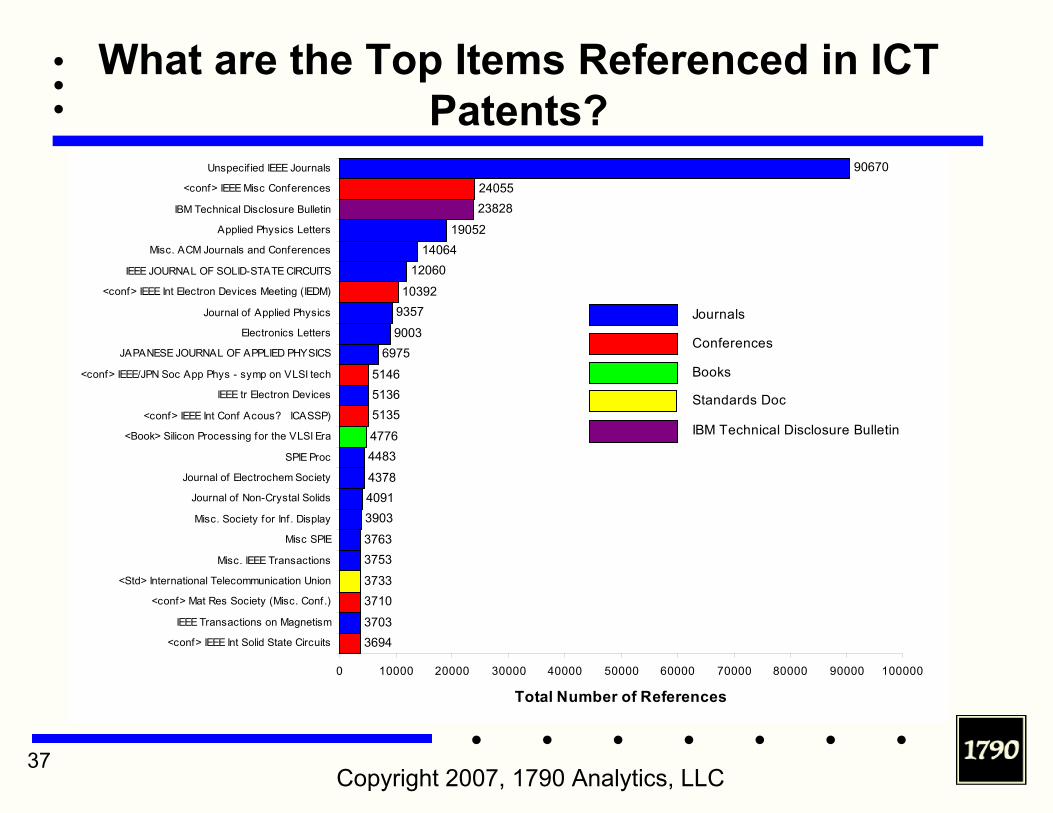
What are the Top Items Referenced in ICT Patents?
36943703
37103733
37533763
390340914378
44834776
513551365146
69759003
935710392
1206014064
19052
2382824055
90670
0 10000 20000 30000 40000 50000 60000 70000 80000 90000 100000
<conf> IEEE Int Solid State Circuits
IEEE Transactions on Magnetism
<conf> Mat Res Society (Misc. Conf.)
<Std> International Telecommunication Union
Misc. IEEE Transactions
Misc SPIE
Misc. Society for Inf . Display
Journal of Non-Crystal Solids
Journal of Electrochem Society
SPIE Proc
<Book> Silicon Processing for the VLSI Era
<conf> IEEE Int Conf Acous? ICASSP)
IEEE tr Electron Devices
<conf> IEEE/JPN Soc App Phys - symp on VLSI tech
JAPANESE JOURNAL OF APPLIED PHYSICS
Electronics Letters
Journal of Applied Physics
<conf> IEEE Int Electron Devices Meeting (IEDM)
IEEE JOURNAL OF SOLID-STATE CIRCUITS
Misc. ACM Journals and Conferences
Applied Physics Letters
IBM Technical Disclosure Bulletin
<conf> IEEE Misc Conferences
Unspecif ied IEEE Journals
Total Number of References
Journals
Conferences
Books
IBM Technical Disclosure Bulletin
Standards Doc

38• • • • • • •
•••
Copyright 2007, 1790 Analytics, LLC
Who are the Top Publishers Referenced in ICT Patents?
4830
488849805072
511351465475
565860997077
87701441615248
265783275236528
39937234693
0 50000 100000 150000 200000 250000
JOHN WILEY & SONS/WILEY-VERLAG/WILEY-LISS
MATERIALS RESEARCH SOCIETY
IEICE-INST ELEC INFO COMM ENG
Joint IEEE and ACM
ACS-AMER CHEMICAL SOC
IEEE/JPN Soc App Phys
AMERICAN PHYSICAL SOC
SID-Society for Information Display
ELECTROCHEMICAL SOC INC
INST PURE APPLIED PHYSICS
OPTICAL SOC AMER
SPIE-INT SOCIETY OPTICAL ENGINEERING
IEE-INST ELEC ENG
IBM CORP
ACM-ASSOC COMPUTING MACHINERY
AVS-AIP AMER INST PHYS
Reed/Elsevier/Pergamon/Academic Press
IEEE-INST ELEC ELECTRONICS ENG INC
Total # References

39• • • • • • •
•••
Copyright 2007, 1790 Analytics, LLC
Top Patenting Companies in US 2006(All Patents; not just ICT)
A s s ig n e e2 0 0 6 U S P a te n t
C o u n t 1 9 9 7 -2 0 0 6 U S P a te n t C o u n tIn te rn a tio n a l B u s in e s s M a c h in e s C o rp 3 6 6 6 3 0 5 2 8H ita c h i L td 3 1 5 9 1 9 3 6 2S a m s u n g E le c tro n ic s C o L td 2 7 4 2 1 5 3 1 8M a ts u s h ita E le c tr ic In d u s tr ia l C o . L td . 2 7 3 1 1 8 1 9 3C a n o n In c 2 4 7 7 2 0 3 2 4H e w le tt-P a c k a rd C o 2 1 9 5 1 5 5 4 5S o n y C o rp 2 1 6 2 1 6 4 0 2In te l C o rp o ra tio n 1 9 6 9 1 1 4 9 8T o s h ib a C o rp 1 9 0 2 1 3 9 8 7F u jits u L im ite d 1 6 8 8 1 3 5 5 7M ic ro s o ft C o rp o ra tio n 1 6 2 4 5 9 7 4M ic ro n T e c h n o lo g y In c . 1 6 2 3 1 3 4 9 7S ie m e n s A k tie n g e s e lls c h a ft 1 5 3 8 1 3 3 6 8G e n e ra l E le c tr ic C o m p a n y 1 3 8 9 1 2 5 1 5F u ji P h o to F ilm C o . L td 1 3 2 1 1 0 3 7 9S e ik o E p s o n C o rp o ra tio n 1 2 6 8 6 4 1 6N E C C o rp 1 1 0 0 1 5 8 5 8H o n d a M o to r C o . L td .(G ik e n K o g yo K K ) 1 0 2 9 6 7 6 2K o n in k lijk e P h ilip s E le c tro n ic s N .V . 1 0 1 5 1 1 1 8 8In f in e o n T e c h n o lo g ie s A G 9 4 4 4 3 5 6M o to ro la In c . 8 9 4 1 0 7 9 8T e x a s In s tru m e n ts In c 8 9 0 7 6 1 4A lc a te l-L u c e n t 8 8 8 1 1 9 5 7S h a rp C o rp 8 8 0 6 5 7 6N ip p o n d e n s o C o . L td . 8 2 1 5 7 7 1

40• • • • • • •
•••
Copyright 2007, 1790 Analytics, LLC
# Patent References from Top 25 Companies to Top 20 Publishers
96719 (38 .49% )
23132 (9 .21% )
17202 (6 .85% )
15833 (6 .30% )
10124 (4 .03% )
5638 (2 .24% )
4728 (1 .88% )
4707 (1 .87% )
3850 (1 .53% )
3789 (1 .51% )
3494 (1 .39% )
3437 (1 .37% )
3348 (1 .33% )
3184 (1 .27% )
2831 (1 .13% )
2761 (1 .10% )
2380 (0 .95% )
2277 (0 .91% )
1781 (0 .71% )
1702 (0 .68% )
0 2 0 0 0 0 4 0 0 0 0 6 0 0 0 0 8 0 0 0 0 1 0 0 0 0 0 1 2 0 0 0 0
IBM Corp
Spr inger /Spr inger W ien /Sp r inger -V er lag
S ID-Soc ie ty Fo r In f o rma tion Dis p lay
Optic a l Soc A mer
Ma te r ia ls Res ea rc h Soc ie ty
A mer ic an Phy s ic a l Soc
IEICE- Ins t Elec In f o Comm Eng
IEEE/Jpn Soc A pp Phy s
Genera l Elec tr ic Co .
Elec troc hemic a l Soc Inc
Ins t Pure A pp lied Phy s ic s
John W iley &Sons /W iley -V er lag /W iley -L is s
A CS-A mer Chemic a l Soc
IEE- Ins t Elec Eng
SPIE- In t Soc ie ty O p tic a l Eng ineer ing
US Dep t O f Energy
A CM-A s s oc Computing Mac h ine ry
A V S /A IP A m V ac Soc /A m Ins t Phy s
Reed /Els ev ie r /Pe rgamon/A c ad Pres s
IEEE
41• • • • • • •
•••
Copyright 2007, 1790 Analytics, LLC
A Tangentially Related Fact
• In a study we did for the National Institute of Standards (NIST) and the US Patent Office we found:
• Clusters of patents that represent emerging technologies tend to reference scientific journals more so than average patents.
• It follows that the increasing availability of E-Resources should lead to more and faster development of emerging technologies.
42• • • • • • •
•••
Copyright 2007, 1790 Analytics, LLC
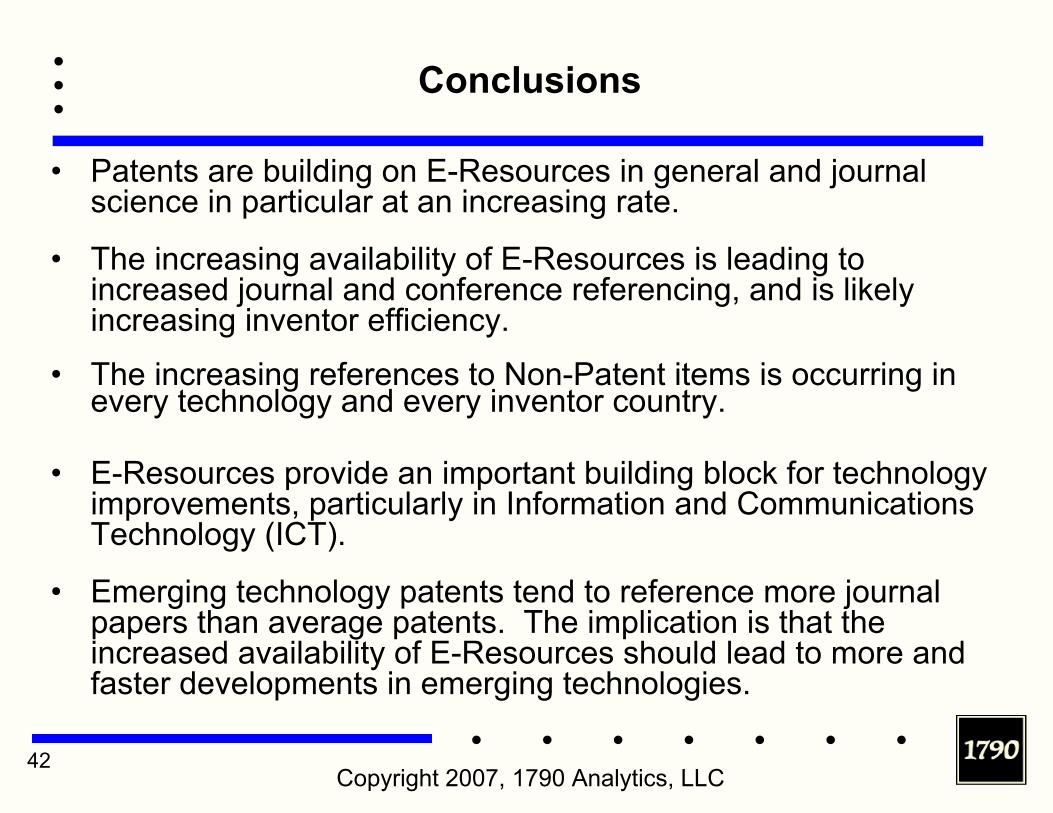
Conclusions
• Patents are building on E-Resources in general and journal science in particular at an increasing rate.
• The increasing availability of E-Resources is leading to increased journal and conference referencing, and is likely increasing inventor efficiency.
• The increasing references to Non-Patent items is occurring in every technology and every inventor country.
• E-Resources provide an important building block for technology improvements, particularly in Information and Communications Technology (ICT).
• Emerging technology patents tend to reference more journal papers than average patents. The implication is that the increased availability of E-Resources should lead to more and faster developments in emerging technologies.
43• • • • • • •
•••
Copyright 2007, 1790 Analytics, LLC
References
• Branstetter, Lee, 2003, “Is Academic Science Driving a Surge in Industrial Innovation? Evidence from Patent Citations,” Columbia Business School, Discussion Paper #28.
• Breitzman “Analysis of Patent Referencing to IEEE Papers, Conferences, and Standards,” 2006. 1790 Analytics, LLC
• Breitzman, “The Effect of E-Resources on Technology Development”, Concert Conference Paper, Taiwan, November 15, 2007.
44• • • • • • •
•••
Copyright 2007, 1790 Analytics, LLC
Thank you!
Anthony BreitzmanTel: 856-216-1790 x13
1790 Analytics130 Haddon Ave.
Haddonfield, NJ 08033