Embed Size (px)
Citation preview
THE EFFECT OF DOWNHILL RUNNING
ON IMPACT SHOCK AND ASYMMETRY
by
Megan Leigh Killian
A thesis submitted in partial fulfillment of the requirements for the degree
of
Master of Science
in
Health and Human Development
MONTANA STATE UNIVERSITY Bozeman, MT
April 2007

© COPYRIGHT
by
Megan Leigh Killian
2007
All Rights Reserved
ii
APPROVAL
of a thesis submitted by
Megan Leigh Killian
This thesis has been read by each member of the thesis committee and has been found to be satisfactory regarding content, English usage, format, citations, bibliographic style, and consistency, and is ready for submission to the Division of Graduate Education.
Michael E. Hahn, Ph.D.
Approved for the Department of Health and Human Development Craig Stewart, Ed.D.
Approved for the Division of Graduate Education
Carl Fox, Ph.D.
iii
STATEMENT OF PERMISSION TO USE
In presenting this thesis in partial fulfillment of the requirements for a master’s
degree at Montana State University, I agree that the Library shall make it available to
borrowers under rules of the Library.
If I have indicated my intention to copyright this thesis by including a copyright
notice page, copying is allowable only for scholarly purposes, consistent with “fair use”
as prescribed in the U.S. Copyright Law. Requests for permission for extended quotation
from or reproduction of this thesis in whole or in parts may be granted only by the
copyright holder.
Megan Leigh Killian April 2007
iv
TABLE OF CONTENTS
1. INTRODUCTION.........………………………………………...…………….. Development of Problem…………………………………………..... ……….. Impact Shock………………………………………………………………….. Asymmetry………………………………………………………….................. Downhill Running……………………………………………………………... Statement of Purpose………………………………………………………...... Primary Hypothesis……………………………………………………………. Secondary Hypothesis…………………………………………………………. Tertiary Hypothesis…………………………………………………………..... Assumptions…………………………………………………………………… Limitations…………………………………………………………………….. Operational Definitions………………………………………………………...
1
12244555666
2.
LITERATURE REVIEW………………….…………...……………………… Introduction……………………………………………………………………. Instrumentation……………………………………………………………….... Impact Shock…………………………………………………………………... Symmetry and Asymmetry…………………………………………………….. Limb Preference………………………………………………………………... Downhill Running……………………………………………………………… Summary………………………………………………………………………..
8
889
10131719
3.
METHODOLOGY……………………………………………………………... Subjects………………………………………………………………………… Informed Consent and Questionnaire…………………………………………... Data Collection…………………………………………………………………. Instrumentation…………………………………………………………………. Impact Shock Data Collections………………………………………………….Data analysis…………………………………………………………………….
21
212222252628
4.
RESULTS………………………………………………………………………. Subject Characteristics…………………………………………………………. Impact Shock Magnitudes……………………………………………………… Symmetry Indices……………………………………………………………….
30
303033
5.
DISCUSSION 39
v
TABLE OF CONTENTS- CONTINUED
Introduction……………………………………………………………………...Subject Characteristics………………………………………………………….. Tibial Impact Shock Measurements……………………………………………. Asymmetry Comparisons……………………………………………………….
39404243
6.
CONCLUSION…………………………………………………………………. 48
REFERENCES CITED………………………………………………………… APPENDICES…………………………………………………………………..
50
57
APPENDIX A: PREFERENCE AND SPEED ASSESSMENT…..………… APPENDIX B: DEMOGRAPHIC SURVEY.......…………………………... APPENDIX C: SUBJECT CONSENT FORM………………………………
58
60
62
vi
LIST OF TABLES
Table
Page
3.1 3.2 4.1 4.2 4.3 4.4 4.5 4.6
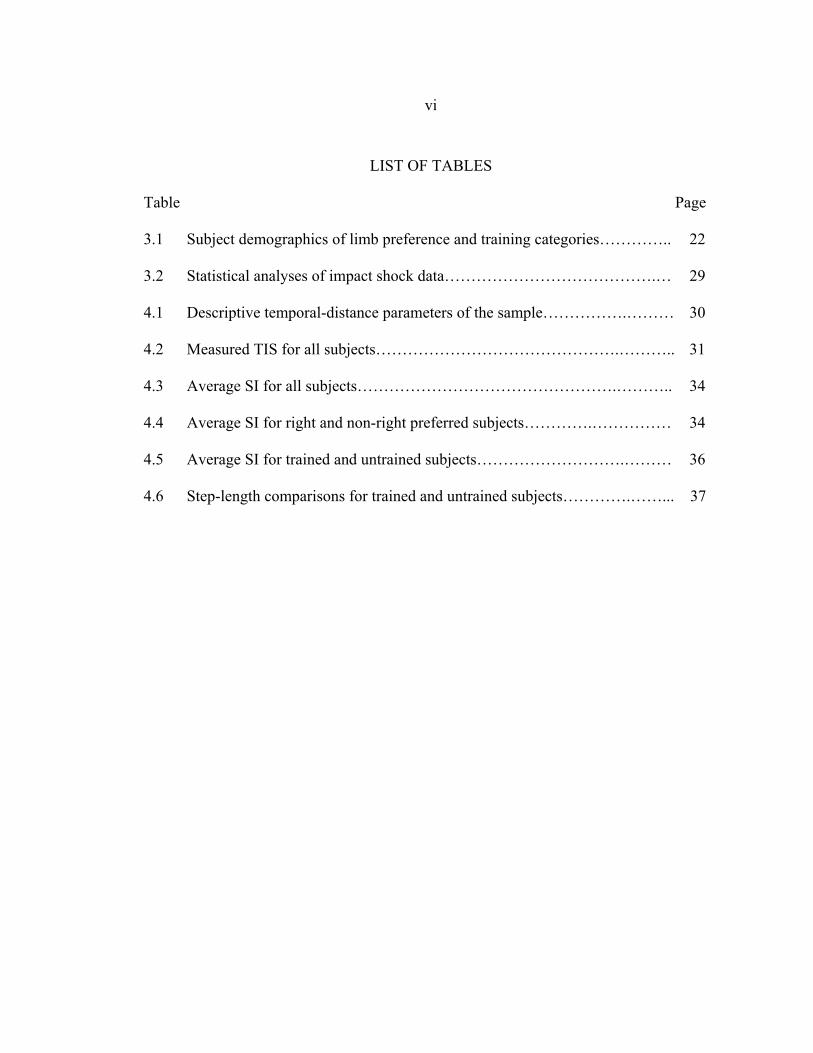
Subject demographics of limb preference and training categories………….. Statistical analyses of impact shock data………………………………….… Descriptive temporal-distance parameters of the sample…………….……… Measured TIS for all subjects……………………………………….……….. Average SI for all subjects………………………………………….……….. Average SI for right and non-right preferred subjects………….…………… Average SI for trained and untrained subjects……………………….……… Step-length comparisons for trained and untrained subjects………….……...
22 29 30 31 34 34 36 37
vii
LIST OF FIGURES
Figure
Page
3.1 3.2A 3.2B 3.3 3.4 4.1 4.2 4.3 4.4 4.5 4.6
Flow chart explanation of the reasoning for self-selection of speed…......... Orientation of accelerometer attached to anteromedial tibia using plastic backing and two-sided tape…………………………………..………...….. Post-wrapping using flexible wrap tape………………………...………..... Representation of impact shock peaks………………...……………...…… Representation of impact shock collections…………...…………...……… Example TIS peak for one subject……………………...……...………….. Tibial Impact Shock across running conditions for left and right limbs of all subjects………………………………………………......……………... Relative TIS acrossrunning conditions for left and right limbs of training groups. All values are relative to the left limb TIS value of the level condition…………………………………...……………………………..... Symmetry Index across grades for lower-limb preference groups….......… Symmetry Index across grades for training groups……………......………. Step length comparisons across grades for training groups……......………
24
25
25
26
27
31
32
33
35
36
38
viii
ABSTRACT
Biomechanical studies are important for the prevention and treatment of injuries.
Of special interest is running locomotion and its effect on impact shock. Impact shock magnitudes are often 2-3 times greater at the tibia during running compared to walking and have been reported to increase with decreasing grade conditions. The primary goal of this study was to determine the effect of downhill running on impact shock and asymmetry over varying grades. The secondary and tertiary goals of this study were to determine if there was significant symmetry difference between lower-limb preference groups and between training groups, respectively. Seventeen subjects (10 female, 7 male) were sampled from two populations with different types of downhill training (trained versus untrained) experience. The procedures included two visits, the first of treadmill familiarization and preference testing and the second for impact shock data collections. The data collection visit included a self-directed warm-up on the treadmill followed by a 16-minute running session that included four different running grade conditions (0%, -3%, -6% and -9%). Four samples of 5 consecutive tibial impact shock magnitudes (TIS) of each limb were collected at each running grade condition using piezoelectric accelerometers. Symmetry indices (SI) were calculated using TIS for left and right limbs from a previously established equation. The results indicate that measured SI was not significantly influenced by decreasing running grade conditions for all subjects. Also, there were no significant differences between preference groups across running grade conditions. A trend suggested differences between training groups across grade conditions, and analysis of covariance for stride length and step frequency indicated a significant difference between downhill trained and untrained subjects (p≤0.038). Post-hoc analysis indicated a significant difference in left and right step length for downhill trained runners across grade conditions (p<0.05). It is possible that a learned unilateral forward stepping technique is present for those who frequently incorporate steep downhill running in their training. Further research is needed to determine ways of reducing SI for preventative measures, as well as determining possible longitudinal affects of asymmetry.
1CHAPTER ONE
INTRODUCTION
Development of Problem
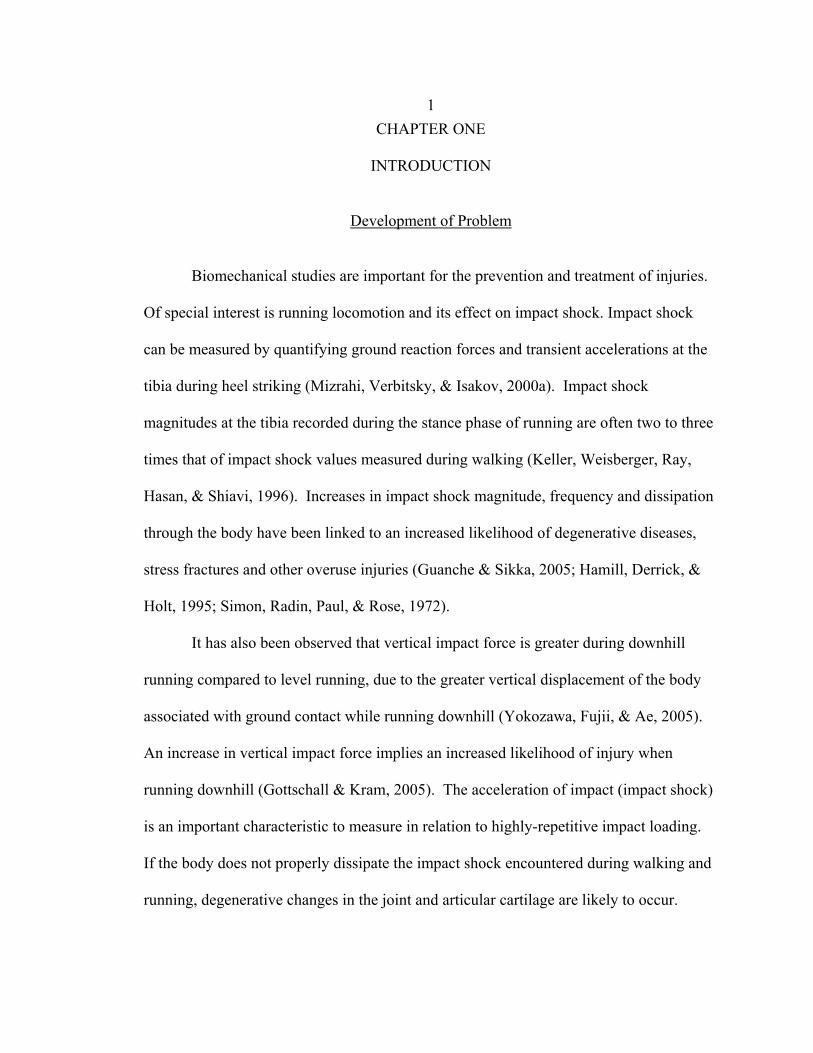
Biomechanical studies are important for the prevention and treatment of injuries.
Of special interest is running locomotion and its effect on impact shock. Impact shock
can be measured by quantifying ground reaction forces and transient accelerations at the
tibia during heel striking (Mizrahi, Verbitsky, & Isakov, 2000a). Impact shock
magnitudes at the tibia recorded during the stance phase of running are often two to three
times that of impact shock values measured during walking (Keller, Weisberger, Ray,
Hasan, & Shiavi, 1996). Increases in impact shock magnitude, frequency and dissipation
through the body have been linked to an increased likelihood of degenerative diseases,
stress fractures and other overuse injuries (Guanche & Sikka, 2005; Hamill, Derrick, &
Holt, 1995; Simon, Radin, Paul, & Rose, 1972).
It has also been observed that vertical impact force is greater during downhill
running compared to level running, due to the greater vertical displacement of the body
associated with ground contact while running downhill (Yokozawa, Fujii, & Ae, 2005).
An increase in vertical impact force implies an increased likelihood of injury when
running downhill (Gottschall & Kram, 2005). The acceleration of impact (impact shock)
is an important characteristic to measure in relation to highly-repetitive impact loading.
If the body does not properly dissipate the impact shock encountered during walking and
running, degenerative changes in the joint and articular cartilage are likely to occur.
2Furthermore, muscular damage and mechanical stress have been found to increase during
downhill running compared to level running (Mizrahi et al., 2000a).
Natural variations in one’s own gait, such as asymmetry, have been suggested to
heighten risks of injury (Subotnick, 1981). Such asymmetry can be quantified and used to
evaluate causation of injury and subsequent prescription of rehabilitation protocol, but
has also been observed in healthy gait (Maupus, Paysant, Datie, Martinet, & Andre,
2002).
Impact Shock
Impact shock can be defined as the magnitude that a body decelerates over a very
small period of time. Impact shock is often represented as a factor of gravitational
acceleration, g, in meters per second squared (9.81 m/s2). Impact shock magnitudes have
been used to evaluate gait parameters such as asymmetry (Chavet, Lafortune, & Gray,
1997; Zifchock, Davis, & Hamill, 2006).
Asymmetry
Gait symmetry is defined when both limbs behave identically (Sadeghi, Allard,
Prince, & Labelle, 2000). Gait symmetry is often assumed for simplicity of data
collections and analyses to reduce the evaluation of both limbs (Maupus et al., 2002).
However, asymmetry has been frequently reported for both pathological and able-bodied
gait (Sadeghi et al.,, 2000). Lower-limb asymmetry has been quantified for gait variables
using the following equation as proposed by Robinson, Herzog, & Nigg (1987):
3
%100)(5.0
)(×
+−
=XLXR
XLXRSI [1]
where SI represents the symmetry index, and XR and XL are the gait variables for the
right and left limb, respectively. An SI value of zero (0) indicates perfect gait symmetry
within the measured parameters.
Asymmetry in gait has been measured by previous researchers in many ways.
Maupus et al. (2002) measured angular changes of the knees using electrogoniometry.
Perttunen, Anttila, Södergård, Merikanto, & Komi (2004) used force platforms as well as
plantar pressure monitors and electromyography to determine asymmetry for people with
limb length discrepancies. Sadeghi, Allard & Duhaime (1997) measured muscle powers
and related mechanical energies using inverse dynamics to determine whether asymmetry
existed during able-bodied gait. For all three of these studies, it was concluded that
asymmetry between limbs existed in non-pathological, normal gait.
Many sports, such as competitive running, require symmetrical movements for
high levels of performance. Energy costs are known to increase as asymmetry increases
(Genthon & Rougier, 2005; Mattes, Martin, & Royer, 2000). Furthermore, lower-limb
asymmetry during running has been associated with the onset and recurrence of injury.
Zifchock et al. (2006) found that natural levels of kinetic asymmetry vary widely, and it
is unclear whether asymmetry causes injury or vice versa. Their study, however,
concluded that individuals with previous stress fractures have a greater peak impact
shock. Stress fractures have been suggested to arise from many different factors such as
overloading and increased impact shock (Beck, 1998; Kim & Voloshin, 1992).
4Downhill Running
It is unlikely in most mountainous regions that runners pursue routes that are
without climbs or downhill terrain (Mizrahi et al., 2000b; Yokozawa et al., 2005).
Different surfaces offer different kinetic responses during running (Kim & Voloshin,
1992). Unfortunately, research exploring the effects of downhill running on kinetic
characteristics is somewhat limited.
Highly repetitive impact loading may result in degenerative changes to the hip,
knee and ankle joints (Simon et al., 1972; Radin, Paul, & Rose, 1972; Collins & Whittle,
1989). Therefore, it is important to study the mechanics of downhill running which can
amplify the magnitude of vertical shock values. Impact force and loading rate are
expected to be larger during downhill running compared to level running due to the
greater potential energy of the body’s center of mass caused by decline grade (Yokozawa
et al., 2005).
Statement of Purpose
Researchers have reported an inverse relationship between impact shock
magnitude and decline terrain grade. The purpose of this study was to determine the
relationship between impact shock magnitude and lower-limb symmetry while running
on varying downhill grades.
5Primary Hypothesis
It was hypothesized that lower-limb asymmetry will increase with greater decline
grade running due to an amplification of inter-limb differences in impact shock caused by
downhill running.
H01: µ1=µ2=µ3=µ4
Ha1: µ1≠µ2≠µ3≠µ4
The notations µ1, µ2, µ3 and µ4 represent the population means of SI at level, - 3%,
- 6% and - 9% grade conditions, respectively.
Secondary Hypothesis
It was also hypothesized that SI values will be different between lower limb right
and non-right preferred running populations.
H02: µ1=µ2
Ha2: µ1≠µ2
The notations µ1 and µ2 represent the population means of symmetry index for
right preferred and non-right preferred running groups, respectively.
Tertiary Hypothesis
It was also hypothesized that SI values will be different between experienced and
inexperienced downhill running populations.
H02: µ1=µ2
Ha2: µ1≠µ2
6 The notations µ1 and µ2 represent the population means of symmetry index for
experienced and inexperienced downhill running groups, respectively.
Assumptions
It was assumed that all subjects were healthy at the onset of this study, and that
they are injury-free and aerobically fit. It was assumed that the subjects used in this study
represent an avid running population.
Limitations
A decreased generalizability of the study findings to the general population could
result due to the exclusive subject selection; specifically, the exclusion of those with less
than 20 miles per week training volume. Younger (under 18) and older (over 60) runners
were excluded and the results of this study may not be applicable to such populations.
Operational Definitions
The following definitions were adopted for the purposes of this study:
Accelerometry: measurement of impact shock magnitude using piezo-electric
quartz accelerometers attached to the anterior-medial tibia.
Impact shock: the sudden deceleration of a mass caused by collision
7Asymmetry: imbalance; inequality; a non-proportionate relationship between
kinetic measurements of opposite limbs
Symmetry Index (SI): %100)(5.0
)(×
+−
=XLXR
XLXRSI , where XR is the kinetic
measurement of the right limb, and XL is the kinetic measurement of the left limb.
Attenuation: The dissipation of heel-strike induced impact shock by means of soft
tissues, bones and joints.
Limb dominance: The central nervous system (CNS) phenomenon of default use
and superior performance of one side of the body compared to the other.
Limb preference: a subjective, preplanned choice of limb
8CHAPTER TWO
LITERATURE REVIEW
Introduction
Individuals involved in high-impact sports, particularly running, often have
training disruptions caused by lower extremity injuries. Stress fracture injury rates have
been reported to be as high as 72% for the running population (Mizrahi et al., 2000a).
Joint and cartilage degeneration is thought to occur because of long-term highly repetitive
lower limb loading demands (Radin et al., 1972; Simon et al., 1972). Tibial stress
fractures and medial tibial stress syndrome are injuries that cause immediate suspension
of training, and are suspected to be directly related to impact shock (Beck, 1998; Mizrahi,
et al., 2000a). Consequently, reduced activity involving impact shock is the most
common and effective recommendation for the healing of such injuries (Beck, 1998).
Such reductions in training can be detrimental for those whose psychological and
financial well-being depends on their performance; including professional athletes,
military recruits and even recreational runners. Therefore, it is of utmost importance to
develop mechanisms of prevention to reduce the likelihood of injury. In order to do so,
the mechanisms of injury must first be determined.
Instrumentation
Sensors provide an easy and beneficial means of collecting measurements for use
in biomechanical gait analysis. These measurements, represented as electronic voltage
9signals, can be filtered to reduce the effect of noise and transformed to reveal information
specific to walking and running gait.
Strain gauge force platforms have been used to measure ground reaction forces
along the vertical, anterior/posterior, and medial/lateral axes (Hamill, Bates, & Knutzen,
1984; Herzog, Nigg, Read, & Olsson, 1989). Very small changes in the resistance of a
strain gauge, caused by deformation of the length of the gauge wire (∆length/original
length), changes the voltage output of the device. This voltage change is read and
interpreted as a force measurement by use of an analog-to-digital converter.
Accelerometers have been used to measure deceleration of body segments as well
as dissipation of shock waves through the body (Derrick, Hamill, & Caldwell, 1998;
Mercer, Devita, Derrick, & Bates, 2003; Zifchock et al., 2006). Piezoelectric
accelerometers consist of a crystal that produces a voltage charge when compressed or
distorted. The use of accelerometry has been a common method for measuring impact
shock. The ease of use and portability of such devices are very valuable to the study of
impact biomechanics. Measured as factors of gravitational acceleration (g; 9.81m/s2),
normal impact shock values during running can range between 5-14 g’s (Flynn, Holmes
& Andrews, 2004).
Impact Shock
The sudden deceleration of the foot at heel strike transmits a strong shockwave
through the body. The magnitude of this impact shock at the tibia increases as stride
length increases (Mercer et al., 2003) and is usually 2-3 times greater during running
compared to walking (Nilsson & Thorstensson, 1989). During running and walking,
10shock is dissipated by bones and muscles before reaching the head to protect the brain
and maintain consistent environmental perception for the vestibular and visual systems
(Hamill et al., 1995). When comparing previously injured and injury-free runners,
Hreljac, Marshall, & Hume (2000) found that the injury-free runners demonstrated
significantly lower values of impact shock as well as vertical loading rates compared to
previously injured runners.
Kinematic alterations have been noted to affect kinetic responses during running,
especially impact shock. Mercer, Bezodis, Russell, Purdy & DeLion (2005) demonstrated
that preferred stride length increases as velocity increases. Increases in preferred stride
length and velocity have been related to increases in impact force and attenuation.
However, Mercer et al (2005) found that impact force and attenuation tends to stay the
same when stride length remains constant over varying velocities. Their findings suggest
that stride length is a strong factor in determining impact magnitudes and attenuations.
Symmetry and Asymmetry
Asymmetry, or bilateral variation, of gait is also an important criterion to consider
when evaluating running biomechanics. Gait symmetry is often thought to be critical for
many bipedal sports and activities. However, functional gait asymmetry may exist
naturally, without a higher likelihood of injury (Herzog et al., 1989; Maupus et al., 2002;
Zifchock et al., 2006). Unfortunately, studies rarely contain longitudinal components and
it is difficult to conclude if asymmetry causes injury or vice versa (Zifchock et al., 2006).
Lower-limb symmetry occurs when both limbs behave identically with respect to
a specific gait parameter, and previous researchers have suggested using the term when
11no statistically significant differences are seen between bilateral parametric
measurements (Sadeghi et al., 2000). Functional gait symmetry has been observed in
several studies. While studying bilateral kinematics, Hannah, Morrison, & Chapman
(1984) found that, for able-bodied subjects, joint motion symmetry was present during
walking between left and right hips in all three planes of motion as well as the knees in
the sagittal plane. Analysis of ground reaction forces (GRF) revealed symmetry during
healthy walking and running (Hamill et al., 1984). Herzog et al. (1989) also evaluated
ground reaction forces in relation to symmetry. Although no perfect intra-individual gait
symmetry was found, the average symmetry index (SI) for vertical GRF and stance time
of all subjects deviated less than 4% from zero. The right and left leg were not
determined to be used preferentially for gait variables associated with vertical GRF.
Therefore, Herzog et al.’s (1989) sample average SI was calculated to be zero.
Although previous research suggests the presence of functional gait symmetry,
there is more research that reports functional gait asymmetry. Previous studies have
reported that normal asymmetry ranges between SI values of 3 to 54% (Zifchock et al.,
2006). Pilot data from our group suggests the existence of asymmetry in measures of
impact shock for individual subjects range between SI = 18-42% (Killian, Nagashima &
Hahn, 2006). Angular asymmetry of the knees has been observed in healthy subjects
(Maupus et al., 2002). Ounpuu & Winters (1989) suggested that intra-individual analysis
of electromyography (EMG) was able to reveal bilateral differences. In their study, the
pooling of subjects and averaging of kinetic measurements suggested bilateral symmetry
for nearly all lower-limb muscles. However, nine of the ten subjects also provided
individual evidence of gait asymmetry. Although Chavet et al. (1997) suggested mean
12bilateral symmetry in measurements of external impact loading for a group of subjects,
their findings also revealed asymmetry in individual subjects. Thus, analysis of individual
results rather than pooled results may be more beneficial when evaluating bilateral gait
characteristics.
Structural inequalities of the lower limbs, such as limb length and muscle strength
differences, often result in gait asymmetry. It has been suggested that running on
cambered roads may lead to uneven loading of the lower limbs (O’Connor & Hamill,
2002). Such imbalance may result in unilateral injuries. Functional leg length inequalities
can occur because of the shortening or relaxation of soft tissue from compensatory
changes of the lower limb (Neely, 1998). Natural limb length discrepancies associated
with growth are often present among children and young adults (Perttunen et al., 2004;
Sutherland, 1997). Gait variables affected by limb-length inequalities, such as step
frequency and stride length, change often until gait maturation occurs (Sutherland, 1997).
Knutson (2005) studied natural incidences of limb-length inequalities for adults for
several different populations, determining that 99% of the population has some extent of
leg-length inequalities. Another study reported that one in every 1,000 people has a limb
length difference of 2 cm or more (Kaufman, Miller, & Sutherland, 1996), which may
increase the risks of pain and injury (Knutson, 2005).
Kinematic measurements have also been used to evaluate gait asymmetry. One
study used larger versus smaller gait measurements in the SI equation, rather than
left/right measurements, for patients with Chronic Fatigue Syndrome (Saggini, Pizzigallo,
Vecchiet, Macellari, & Giacomozzi, 1998). Toe-out angle and stride width revealed the
greatest asymmetry and were noted to be highly associated with balance. Holder-Powell
13& Rutherford (2000) discussed a relationship between unilateral balance and its decrease
following injury. Balance measurements were suggested to be useful in the assessment of
injury and recovery. They further concluded that maintenance of symmetrical lower limb
muscular strength provides better balance.
From this review, it is apparent that kinematic, kinetic, structural and neurological
measurements provide evidence that natural variations in gait are present in healthy
individuals. Reports of laterality in kinetic measurements raises the question as to
whether limb preference has an effect on the onset of injury.
Limb Preference
A few studies investigated the relationship between neurological function and
symmetry (Golomer & Mbongo, 2004; Hebbal & Mysorekar, 2003; Lenoir, Van
Overschelde, De Rycke, & Musch, 2005). Laterality is defined as a preference to use one
side more than the other, and has been linked to externally imposed tasks, the vestibular
system, and intrinsic preferences (Lenoir et al., 2005). Lower-limb dominance, detected
with tests of preferred foot such as run/walk leading and ball-kicking, has been studied
using kinematic and kinetic relationships. Golomer & Mbongo (2004) used motion
analysis and force platforms to measure variations of movements and center of pressure,
respectively. They found that balance on one foot could depend on footedness rather than
hemispheric visual asymmetry. They also suggested that differences between right- and
left-footers’ uni-podal postures could result from differences in equilibrium perception
and action (eg. left-footers’ posture controlled by re-equilibration and independent of
supporting foot; right-footers’ posture controlled by a rightward sway regardless of
14supporting foot). Using electromyography (EMG), Ounpuu & Winter (1989) found a
relationship between plantar flexor EMG and limb dominance. Differences between
dominant and non-dominant limb EMG indicate asymmetry during healthy gait.
However, this study was limited by small sample size. Neurological demands for
mobility and stability are assumed to be equivalent for lower limbs during bilateral
movement (Previc, 1991). However, for most bilateral tasks, neurological demands are
placed on the task of mobility (Sadeghi et al., 2000). Therefore, the dominant limb is
often associated with the limb primarily involved with mobility (i.e. kicking a ball).
More specific to this study, it has been suggested that local asymmetry in the lower limbs
can be attributed to the propulsive and supportive characteristics of the lower limbs
(Chavet et al., 1997; Sadeghi et al., 1997; Smak, Neptune, & Hull, 1999).
It is estimated that less than 10% of the human population is left-handed (Hebbal
& Mysorekar, 2003). Asymmetry may be revealed by handedness and footedness,
however the two are not perfectly related. Previous research suggests that while right
handedness and right footedness are strongly linked, left footedness is not as dependent
on left handedness (Peters & Durding, 1979; Hebbal and Mysorekar, 2003).
The literature has often used limb dominance and preference interchangeably.
However, the two have somewhat different definitions. Therefore, we must adequately
define the following terms: lateral dominance, preference/laterality, and asymmetry.
Lateral dominance is defined as the central nervous system (CNS) phenomenon of default
use and superior performance of one side of the body compared to the other (Coren &
Porac, 1978; Harris, 1958). Dominance is associated with the notion of the brain being
functionally asymmetric (Sadeghi et al., 2000). Sutherland, Olshen, Cooper, and Woo
15(1980) reported that a large majority of individuals with left-sided cerebral dominance
were right-footed. A scale has been established to measure lateral dominance in which
five parameters of the lower limb are used (Dusewicz and Kershner, 1969). However,
some of the parameters measured can be described as preferential and not inherent.
Preference, also known as laterality, is defined as a subjective, preplanned choice of limb
use (Touwen, 1972), such as the first foot used when climbing stairs, or the hand used to
carry a bag or hold a coffee cup. Asymmetry, as defined previously, is similar to
imbalance and inequality, and can be expressed as a non-proportionate relationship
between bilateral gait parameters. Sadeghi et al. (2000) have suggested that dominance
should be used in gait research in reference to the automatic reactionary response to an
action. However, the limb used for repetitive kicking of a ball or leading natural gait
should be defined as preferred rather than dominant because of possibly unknown CNS
contributions.
Functional asymmetry has been noted for able-bodied gait (Maupus et al., 2002;
Ounpuu & Winter, 1989; Sadeghi et al., 1997; Sadeghi, Sadeghi, Allard, Labelle &
Duhaime, 2001). When analyzing symmetry with respect to laterality, the preferred limb
often has a different magnitude of kinetic measurement than the non-preferred limb.
Functional differences have been observed for subjects concerning footedness (Sadeghi et
al., 2001). Their study concluded that, for right-footed subjects, the left limb’s main task
was control (power-absorption bursts) and the right limb’s main task was propulsion.
Gumustekin et al. (2004) found that bone mineral density was consistently greater in the
left hip for right-dominant subjects than the right hip, thus supporting the categorization
16of fine motor control for the dominant limb and strength and power for the non-dominant
limb (Sainburg, 2002).
Several researchers have studied associations between injury and limb dominance
with mixed results (Murphy, Connolly & Beynnon, 2003). Beynnon, Renstrom, Alosa,
Baumhauer & Vacek (2001) found no difference in the incidence of ankle injury between
left and right dominant subjects, which supports other research (Surve, Schwellnus,
Noakes & Lombard, 1994). However, some researchers have found that lower extremity
injuries to the dominant limb are prevalent in sports such as soccer and Australian
football (Ekstrand & Gillquist, 1983; Orchard, 2001).
Balance has also been studied concerning dominant and non-dominant lower-limb
injuries (Holder-Powell & Rutherford, 2000), where dominance was defined as the fine-
motor limb (i.e. kicking a ball). It was found that balance was greatly reduced for
individuals sustaining dominant limb injuries compared to those who experience non-
dominant limb injuries. The injuries sustained by the subjects in Holder-Powell’s study
were typical running injuries involving repetitive loading, such as fractures and
degenerative joint problems.
Limb dominance has been observed as the cause of several gait variations
including leading (preferred) leg, fine-motor control and balance. Favoritism of one limb
to the other is suggested to be derived from dominance and asymmetry (Hebbal &
Mysorekar, 2003), but can also be exacerbated by injury. Recent studies have both
supported (Gumustekin et al., 2004; McManus & Wysocki, 2005) and refuted (Sadeghi et
al., 2000) the notion that limb dominance is a factor for unilateral injury.

17During running, unilateral preference may be accentuated by varying terrain and
training history. For example, preference of leading and propulsion may be accentuated
to a greater extent with multiple obstacle clearance, such as roots and logs on trails, or
steep uphill and downhill terrain.
Downhill Running
Many distance runners use hill training as a means of improving aerobic fitness,
stamina and strength (Tulloh, 1998). Vertical impact force has been reported to be 14%
higher during downhill running compared to level running (Dick & Cavanagh, 1987) and
22% lower during uphill running (Gottschall & Kram, 2005). It has been suggested that
downhill running amplifies magnitudes of vertical ground reaction forces and impact
shock due to increased potential energy, stride lengthening and increased velocity
(Gottschall & Kram, 2005; Mizrahi, Verbitsky, & Isakov, 2001; Yokozawa, et al., 2005).
Logically, adaptations are required within an altered running environment in order to
improve performance and avoid injury (Derrick, 2004).
Impact shock transmission along the body has been reported to cause bone injury
and joint degeneration (Mizrahi, Verbitsky, & Isakov, 2000b). A greater attenuation of
impact shock between the shank and the sacrum was reported for downhill running
compared to level running. Such attenuation is thought to be associated with an increase
in muscle damage. This, in turn, may reduce dissipation and future attenuation of shock
by the muscle tissue. Although downhill running does not promote the development of
metabolic fatigue, fatigued running has been shown to increase tibial impact shock
18(Mizrahi, Verbitsky, Isakov, & Daily, 2000c). However, natural gait alterations are likely
to occur in order to compensate for impact shock demands.
A reduction in synergistic muscle control has been suggested to cause a decrease
in shock attenuation during metabolic fatigued running (Mizrahi, Voloshin, Russek,
Verbitsky & Isakov, 1997). Local fatigue of the quadriceps muscle has been previously
suggested to cause increases in impact shock transmission during downhill running
(Mizrahi, et al., 2001). However, Flynn et al. (2004) found that localized fatigue of the
gastrocnemius and tibialis anterior muscles resulted in a decrease in peak tibial
accelerations. It was suggested that an increase in localized muscular fatigue, indicated
by a decrease in maximum voluntary contraction by means of EMG, is associated with
decreased muscle stiffness. Such reduction in rigidity resulted in greater attenuation of
force and reduced peak accelerations.
Derrick (2004) reviewed previous research to evaluate impact shock in relation to
knee contact angle, impact accelerations and forces, and different adaptations that may
occur during environmental changes. Two suggested reasons for adapting to an altered
environment are avoidance of injury and increase in performance. Unusual environmental
conditions often lead to incremental changes in knee flexion. Peak impact acceleration of
the leg and attenuation increase in response to unusual environmental conditions, such as
decreased running grade and uneven terrain, but such increases do not always lead to an
increase in vertical ground reaction forces. Increasing knee flexion is often a metabolic
cost, and so such changes in kinematics are related to injury prevention mechanisms
rather than performance enhancement.
19Yokozawa et al.’s (2005) study showed a trend of increasing impact shock for
downhill running compared to level running when stride length and speed were
maintained. However, the trend, which implied that runners responded to increased
vertical displacement by means of kinematic changes, was not consistently linear.
Subjects increased their hip extension which allowed their foot to contact the ground
earlier, perhaps to reduce impact velocity. Knee angle alterations were also noted and
determined to be advantageous for the absorption of shock after heel strike. It was
suggested that gait adaptations allow runners to avoid excessive impact load (Yokozawa,
et al., 2005).
Chu and Caldwell (2004) observed different strategies for experienced male
runners while running on a treadmill at level and downhill grades. Two apparent groups
of runners existed within their findings, suggesting different strategies for individual’s
shock attenuation and control of upper-body center of mass. Half of the subjects in their
study decreased shock attenuation by increasing extension of body position, and the other
half decreased heelstrike velocities and implemented a more flexed heelstrike posture,
allowing them to maintain their attenuation. Such adaptations suggest variations in
impact shock and attenuation mechanisms within running population. Specific running
types (eg. ultramarathon trail runners, 5-kilometer road-specific racers, etc.) could result
in more consistent representations of adaptations.
Summary
Many different gait parameters can be measured in order to better understand
biomechanical influences on pain and injury. Of these, impact shock has been easily
20measured and analyzed. Accelerometry can effectively measure shock and attenuation,
which have been noted to have detrimental effects on bones and joints (Derrick, et al.,
1998; Hamill, et al., 1995; Mercer, Bates, Dufek, & Hreljac, 2003; Mercer, Devita, et al.,
2003; Mizrahi, et al., 2000a, b, & c; Radin, et al., 1972; Simon, et al., 1972; Zifchock, et
al., 2006). Long distance runs and races that include varying grade can be detrimental to a
runner’s bones, muscles and joints if precautions are not taken.
The study of gait asymmetry has often revealed that natural variations are present
in healthy individuals (Chavet, et al., 1997; Ounpuu & Winter, 1989; Sadeghi, et al.,
1997; Sadeghi, et al., 2000). It is important to understand the influence of impact shock
on asymmetry to improve prevention of injuries and treatments related to running.
21CHAPTER THREE
METHODOLOGY
Subjects
Seventeen subjects (10 females and 7 males) from the community of Bozeman,
Montana volunteered to participate in this study. The age of the subjects ranged from 22
to 63 (mean +/- SD: 35 +/- 14.1), mean body mass was 64 +/- 9.99 kg, and mean height
was 172.8 +/- 7.6 cm. Subjects were categorized as either right or non-right lower limb
preferred, as determined from responses to unilateral activities, outlined in Appendix A,
Table 3.1. Activities determining lower-limb preference included kicking a ball, stepping
up stairs, forward starting limb when running, preference for rolling a ball with the
forefoot and preference for picking up a small object with the forefoot. Non-right
preference referred to the performance of three or more unilateral activities with both or
primarily left lower limb.
Subjects were also categorized according to their training experience based on
each subjects’ response to a simple activity questionnaire and previous racing
qualifications (Appendix B, Table 3.1). The ‘trained’ category referred to those subjects
with downhill running experience, and included subjects who had previously completed
endurance trail races such as the Bridger Ridge Run, Old Gabe 25/50K or Devil’s
Backbone. The ‘untrained’ category referred to those subjects who did not intentionally
incorporate downhill running training in their training. Subjects were excluded if they
did not run twenty or more miles per week, if they had lower limb muscular or joint
22injury or pain at the time of collection or if they had raced in the previous seven days
prior to the date of collection.
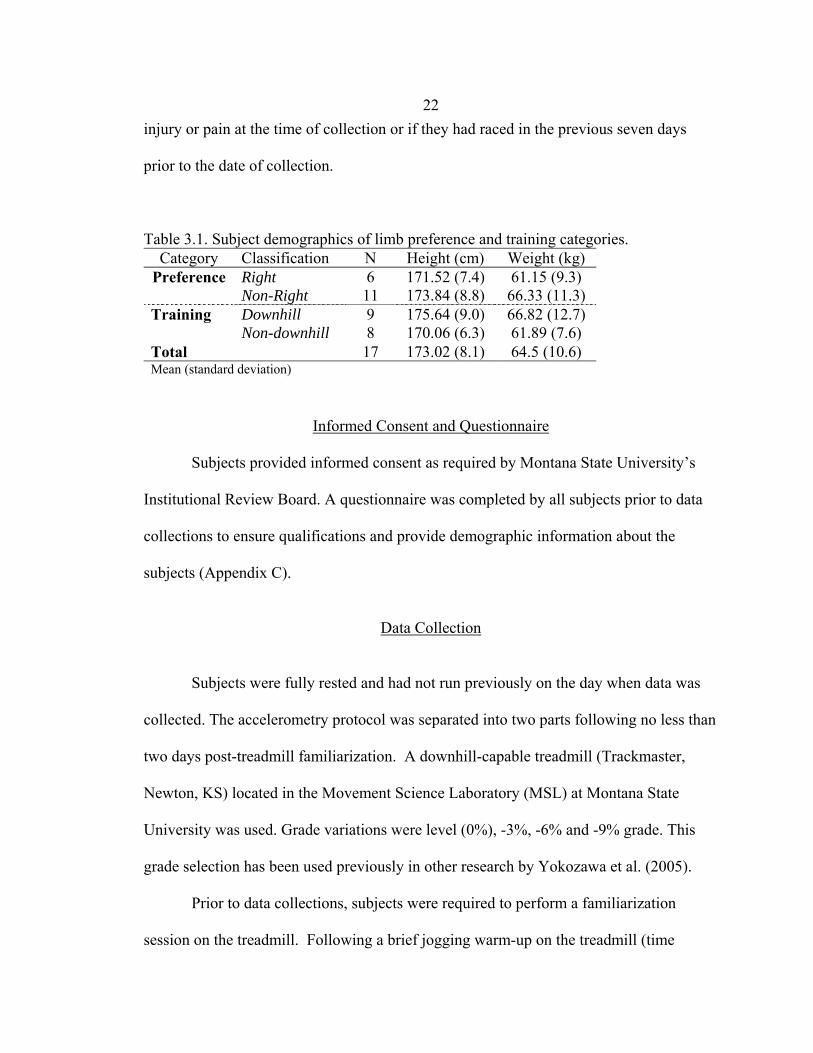
Table 3.1. Subject demographics of limb preference and training categories. Category Classification N Height (cm) Weight (kg)
Preference Right 6 171.52 (7.4) 61.15 (9.3) Non-Right 11 173.84 (8.8) 66.33 (11.3) Training Downhill 9 175.64 (9.0) 66.82 (12.7) Non-downhill 8 170.06 (6.3) 61.89 (7.6) Total 17 173.02 (8.1) 64.5 (10.6) Mean (standard deviation)
Informed Consent and Questionnaire
Subjects provided informed consent as required by Montana State University’s
Institutional Review Board. A questionnaire was completed by all subjects prior to data
collections to ensure qualifications and provide demographic information about the
subjects (Appendix C).
Data Collection
Subjects were fully rested and had not run previously on the day when data was
collected. The accelerometry protocol was separated into two parts following no less than
two days post-treadmill familiarization. A downhill-capable treadmill (Trackmaster,
Newton, KS) located in the Movement Science Laboratory (MSL) at Montana State
University was used. Grade variations were level (0%), -3%, -6% and -9% grade. This
grade selection has been used previously in other research by Yokozawa et al. (2005).
Prior to data collections, subjects were required to perform a familiarization
session on the treadmill. Following a brief jogging warm-up on the treadmill (time
23determined by the subject), subjects performed speed selection, which required self-
selection of a natural running pace at each of the four grades (decline running speed
within +/-5% level grade running speed). “Natural” was defined as a comfortable, steady
pace that can be maintained for approximately forty minutes of running. During pilot data
collections, the selected speeds for 0%, -3%, -6% and -9% grades were 2.27, 2.29, 2.35 &
2.38 m/s on average, respectively (Killian et al., 2006). Each subject’s speed was allowed
to vary minimally between grades to prevent shortening of stride lengths from level to
negative grades. Previous researchers reported that when allowed to select their preferred
running velocity for level and varying grades, subjects had no significant differences in
stride length between grades (Yokozawa, Fujii, & Ae, 2005). If speed were to remain the
same for each subject regardless of treadmill grade, it would be more likely that subjects
would alter their postural orientation at heelstrike (Chu & Caldwell, 2004). Altering
stride length has been reported to directly affect impact loading rate and shock despite
maintaining a constant velocity (Derrick, Hamill, & Caldwell, 1998; Mercer, Devita,
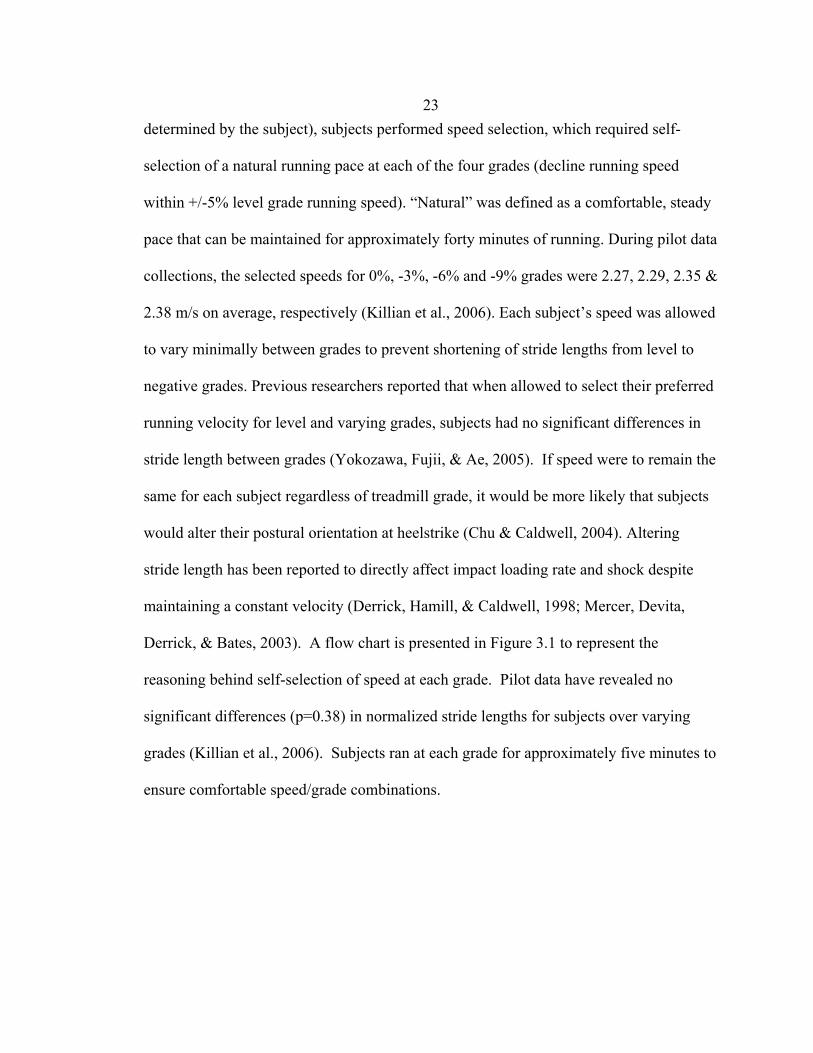
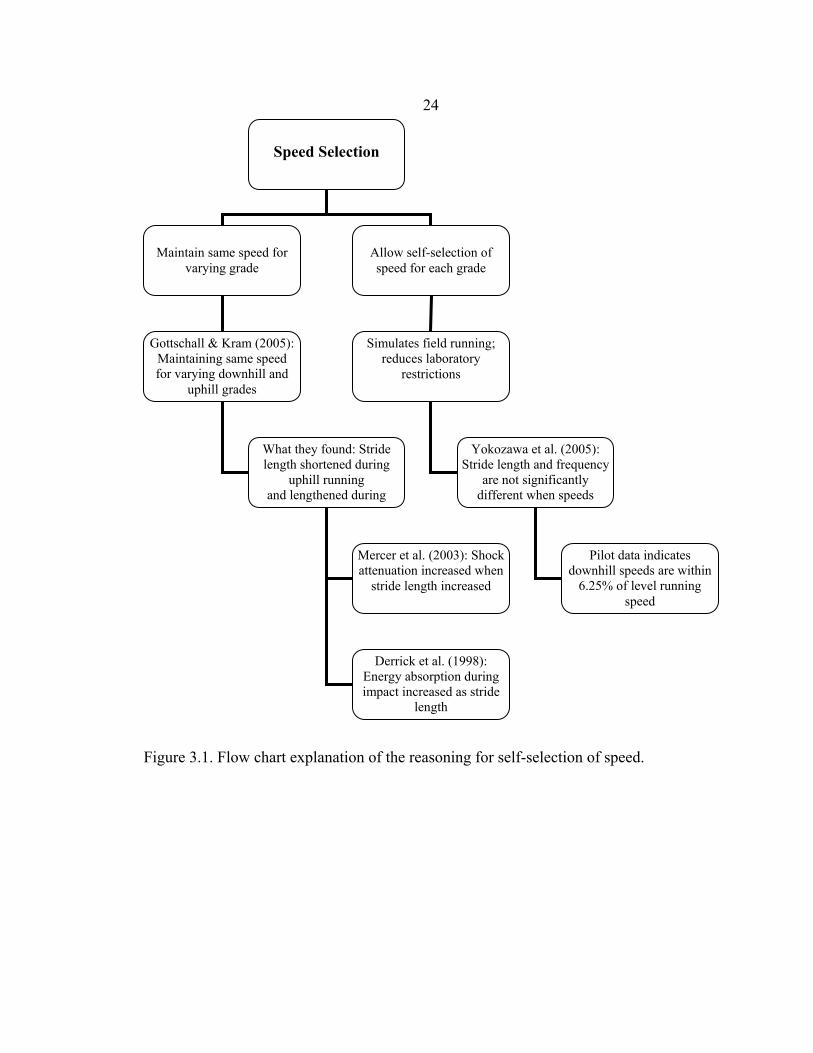
Derrick, & Bates, 2003). A flow chart is presented in Figure 3.1 to represent the
reasoning behind self-selection of speed at each grade. Pilot data have revealed no
significant differences (p=0.38) in normalized stride lengths for subjects over varying
grades (Killian et al., 2006). Subjects ran at each grade for approximately five minutes to
ensure comfortable speed/grade combinations.
24
Figure 3.1. Flow chart explanation of the reasoning for self-selection of speed.
Speed Selection
Maintain same speed for
varying grade
Allow self-selection of speed for each grade
Gottschall & Kram (2005): Maintaining same speed for varying downhill and
uphill grades
What they found: Stride length shortened during
uphill running and lengthened during
Mercer et al. (2003): Shockattenuation increased when
stride length increased
Derrick et al. (1998): Energy absorption during impact increased as stride
length
Simulates field running; reduces laboratory
restrictions
Yokozawa et al. (2005): Stride length and frequency
are not significantly different when speeds
Pilot data indicates downhill speeds are within
6.25% of level running speed
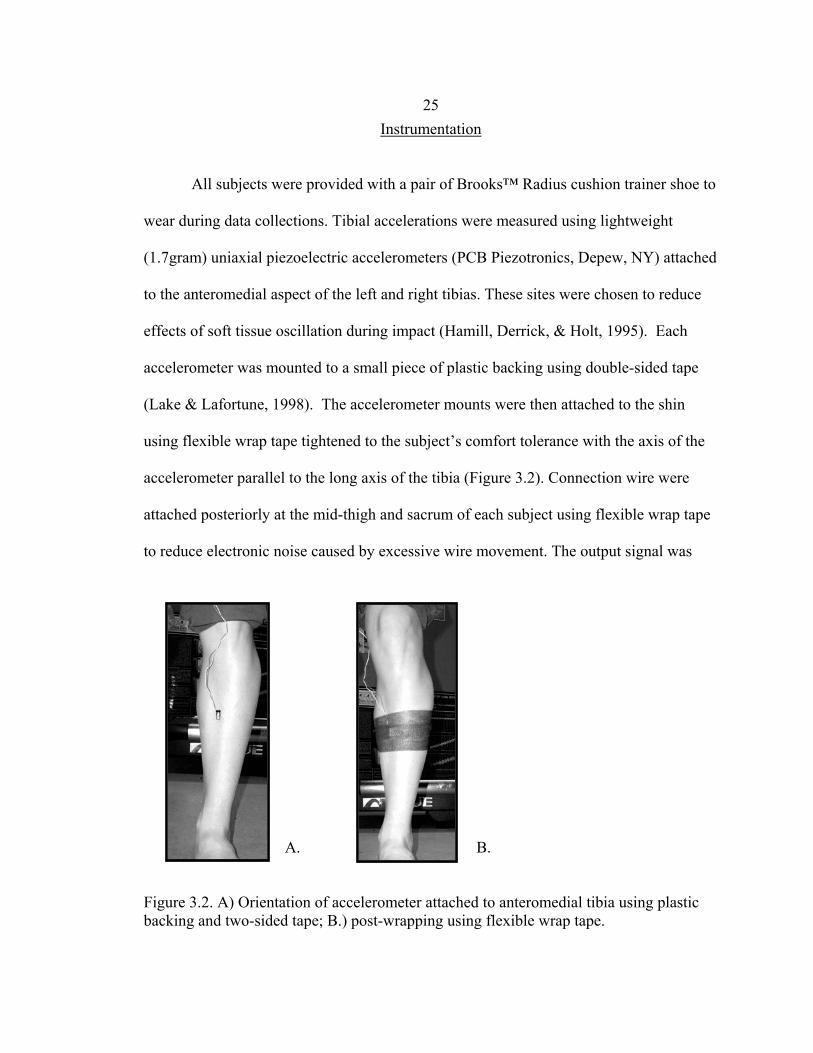
25Instrumentation
All subjects were provided with a pair of Brooks™ Radius cushion trainer shoe to
wear during data collections. Tibial accelerations were measured using lightweight
(1.7gram) uniaxial piezoelectric accelerometers (PCB Piezotronics, Depew, NY) attached
to the anteromedial aspect of the left and right tibias. These sites were chosen to reduce
effects of soft tissue oscillation during impact (Hamill, Derrick, & Holt, 1995). Each
accelerometer was mounted to a small piece of plastic backing using double-sided tape
(Lake & Lafortune, 1998). The accelerometer mounts were then attached to the shin
using flexible wrap tape tightened to the subject’s comfort tolerance with the axis of the
accelerometer parallel to the long axis of the tibia (Figure 3.2). Connection wire were
attached posteriorly at the mid-thigh and sacrum of each subject using flexible wrap tape
to reduce electronic noise caused by excessive wire movement. The output signal was
A.
Figure 3.2. A) Orientation of accelerometer attached to anteromedial tibia using plastic backing and two-sided tape; B.) post-wrapping using flexible wrap tape.
B.
26converted to electrical current by means of a corresponding coupler.
Impact Shock Data Collections
Impact shock data at level and decline grades were measured following speed
selection. Subjects ran for four minutes at each grade during impact shock collections. A
four-minute period allowed each subject to run consistently without fatigue at the grade
and matched predetermined running speed, as well as allowed enough time for
investigators to collect at least four impact shock samples. A counterbalanced technique
was used to determine grade order for each subject. Subjects performed each graded
running period continuously without rest between grade changes. Subjects were not
informed of when impact shock data sampling occurred in order to prevent possible gait
alterations.
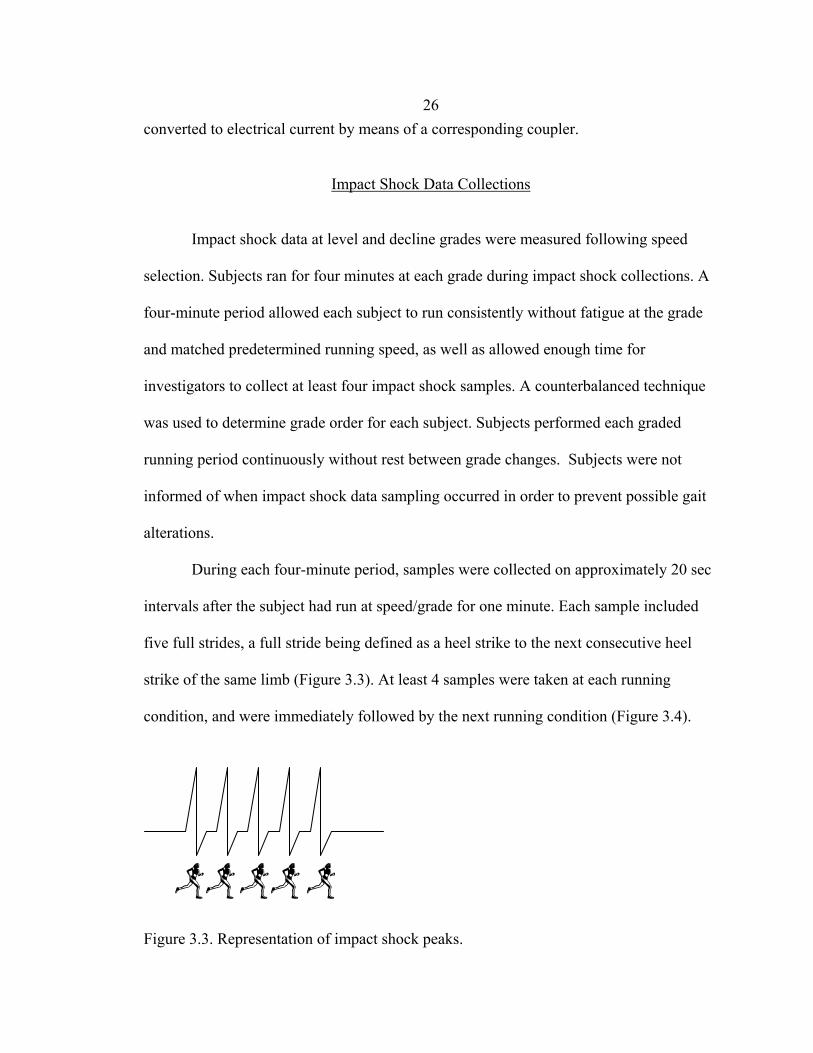
During each four-minute period, samples were collected on approximately 20 sec
intervals after the subject had run at speed/grade for one minute. Each sample included
five full strides, a full stride being defined as a heel strike to the next consecutive heel
strike of the same limb (Figure 3.3). At least 4 samples were taken at each running
condition, and were immediately followed by the next running condition (Figure 3.4).
Figure 3.3. Representation of impact shock peaks.
27
Stride length was calculated by taking the product of the belt speed in
meters/second and time between left limb impact shock peaks. Step frequency was
calculated in steps/minute using time between left limb impact shock peaks, assuming
low variability in frequency during grade and speed matched conditions.
Accelerometry data was collected using Vicon Workstation software (ViconPeak,
Lake Forest, CA) and analyzed using a custom Matlab program (V.7.1, The Mathworks,
Natick, MA). Consecutive impact shock peaks of both left and right tibias for all four
grades were analyzed. Such peaks represent the sudden deceleration of the shank at heel
strike. Gait symmetry was assessed using the SI equation [eq. 1]:
%100)(5.0
)(×
+−
=XLXR
XLXRSI
where SI represents the symmetry index, and XR and XL are the gait variables for the
right and left limb, respectively. An SI value of zero (0) indicates perfect gait symmetry
within the measured parameters.
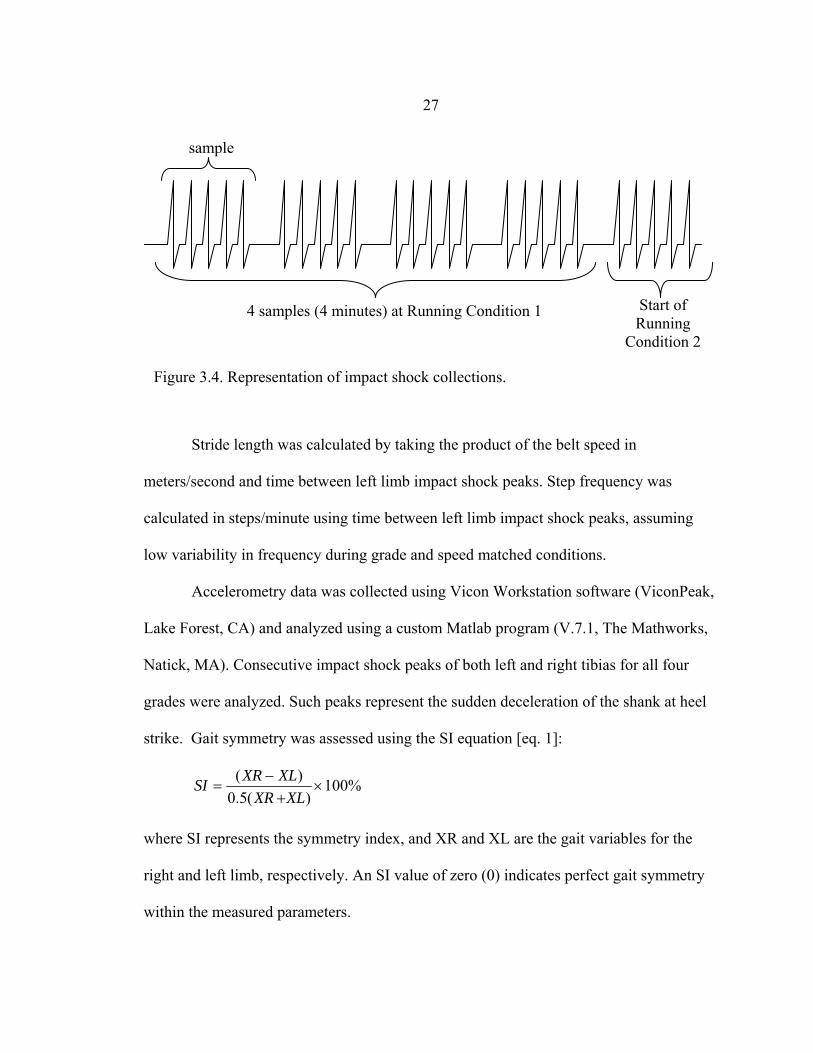
sample
4 samples (4 minutes) at Running Condition 1 Start of Running
Condition 2
Figure 3.4. Representation of impact shock collections.
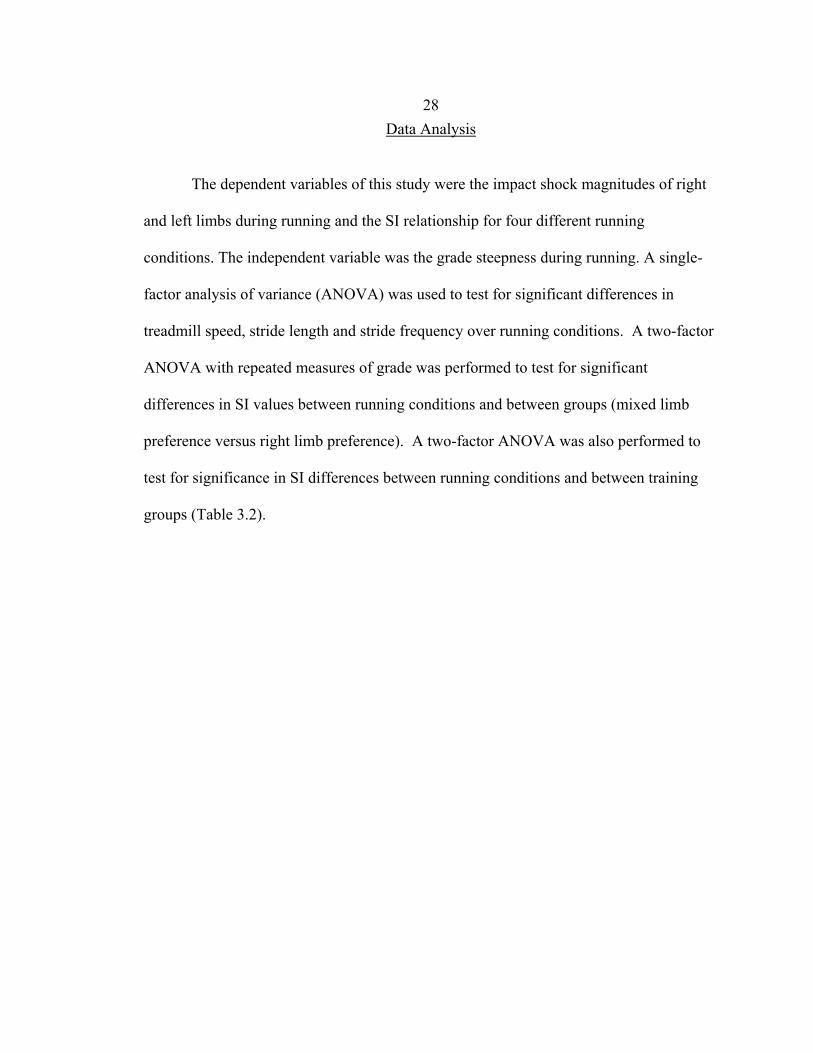
28Data Analysis
The dependent variables of this study were the impact shock magnitudes of right
and left limbs during running and the SI relationship for four different running
conditions. The independent variable was the grade steepness during running. A single-
factor analysis of variance (ANOVA) was used to test for significant differences in
treadmill speed, stride length and stride frequency over running conditions. A two-factor
ANOVA with repeated measures of grade was performed to test for significant
differences in SI values between running conditions and between groups (mixed limb
preference versus right limb preference). A two-factor ANOVA was also performed to
test for significance in SI differences between running conditions and between training
groups (Table 3.2).
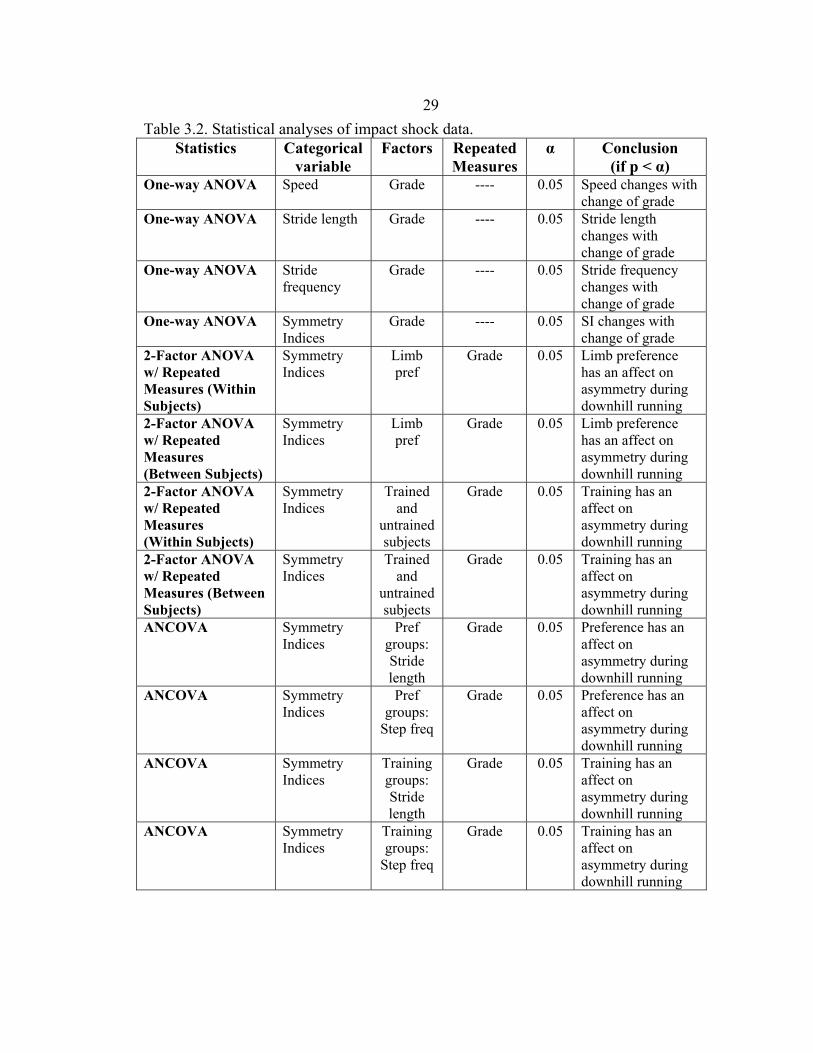
29Table 3.2. Statistical analyses of impact shock data.
Statistics Categorical variable
Factors Repeated Measures
α Conclusion (if p < α)
One-way ANOVA Speed Grade ---- 0.05 Speed changes with change of grade
One-way ANOVA Stride length Grade ---- 0.05 Stride length changes with change of grade
One-way ANOVA Stride frequency
Grade ---- 0.05 Stride frequency changes with change of grade
One-way ANOVA Symmetry Indices
Grade ---- 0.05 SI changes with change of grade
2-Factor ANOVA w/ Repeated Measures (Within Subjects)
Symmetry Indices
Limb pref
Grade 0.05 Limb preference has an affect on asymmetry during downhill running
2-Factor ANOVA w/ Repeated Measures (Between Subjects)
Symmetry Indices
Limb pref
Grade 0.05 Limb preference has an affect on asymmetry during downhill running
2-Factor ANOVA w/ Repeated Measures (Within Subjects)
Symmetry Indices
Trained and
untrained subjects
Grade 0.05 Training has an affect on asymmetry during downhill running
2-Factor ANOVA w/ Repeated Measures (Between Subjects)
Symmetry Indices
Trained and
untrained subjects
Grade 0.05 Training has an affect on asymmetry during downhill running
ANCOVA Symmetry Indices
Pref groups: Stride length
Grade 0.05 Preference has an affect on asymmetry during downhill running
ANCOVA Symmetry Indices
Pref groups:
Step freq
Grade 0.05 Preference has an affect on asymmetry during downhill running
ANCOVA Symmetry Indices
Training groups: Stride length
Grade 0.05 Training has an affect on asymmetry during downhill running
ANCOVA Symmetry Indices
Training groups:
Step freq
Grade 0.05 Training has an affect on asymmetry during downhill running
30CHAPTER FOUR
RESULTS
Subject Characteristics
Seventeen subjects (10 females and 7 males) from the community of Bozeman,
Montana volunteered to participate in this study. The age of the subjects ranged from 22
to 63 (mean +/- SD: 35 +/- 14.1 years), mean body mass was 64 +/- 9.99 kg, and mean
height was 172.8 +/- 7.6 cm. All subjects reported compliance with the inclusion and
exclusion criteria of this study.
Subjects were allowed to select their preferred running speed at each running
condition. However, gait speed for each running condition was restricted to vary no more
than 5% from level running speed. No significant differences in speed or step frequency
were detected over running conditions (Table 4.1). However, significant differences
were found over running for stride length (p=0.017).
Table 4.1. Descriptive temporal-distance parameters for the sample.
0% - 3% - 6% - 9% p-value Speed (m/s) 2.6 (0.3) 2.63 (0.3) 2.7 (0.36) 2.7 (0.36) 0.129 Step frequency (step/min) 169.8 (10.4) 168.3 (10.4) 166.0 (10.3) 165.4 (9.2) 0.051 Stride length (m) 1.84 (0.3) 1.9 (0.3) 1.9 (0.3) 2.0 (0.3) 0.017* Mean (standard deviation) * denotes significance (α = 0.05)
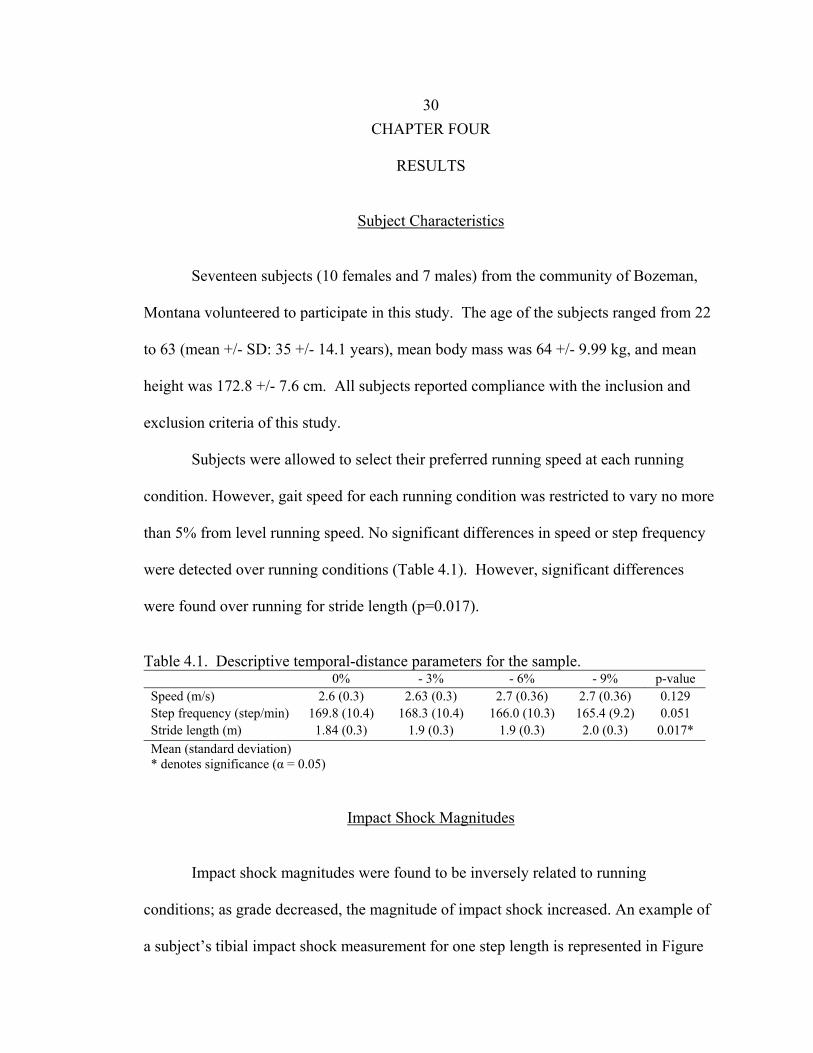
Impact Shock Magnitudes
Impact shock magnitudes were found to be inversely related to running
conditions; as grade decreased, the magnitude of impact shock increased. An example of
a subject’s tibial impact shock measurement for one step length is represented in Figure
314.1. The peak represents the magnitude of shock transmission recorded on the antero-
medial aspect of the tibia at heel-strike. Average peak tibial impact shock magnitudes
(TIS, reported in g’s, or multiples of gravity) for left and right limbs of all subjects are
shown in Figure 4.2 and Table 4.2. There were significant effects of grade for TIS in both
left and right limbs (p<0.001). There was no significant difference between left and right
TIS for the sample.
-4
0
4
8
12
time
Impa
ct S
hock
(g)
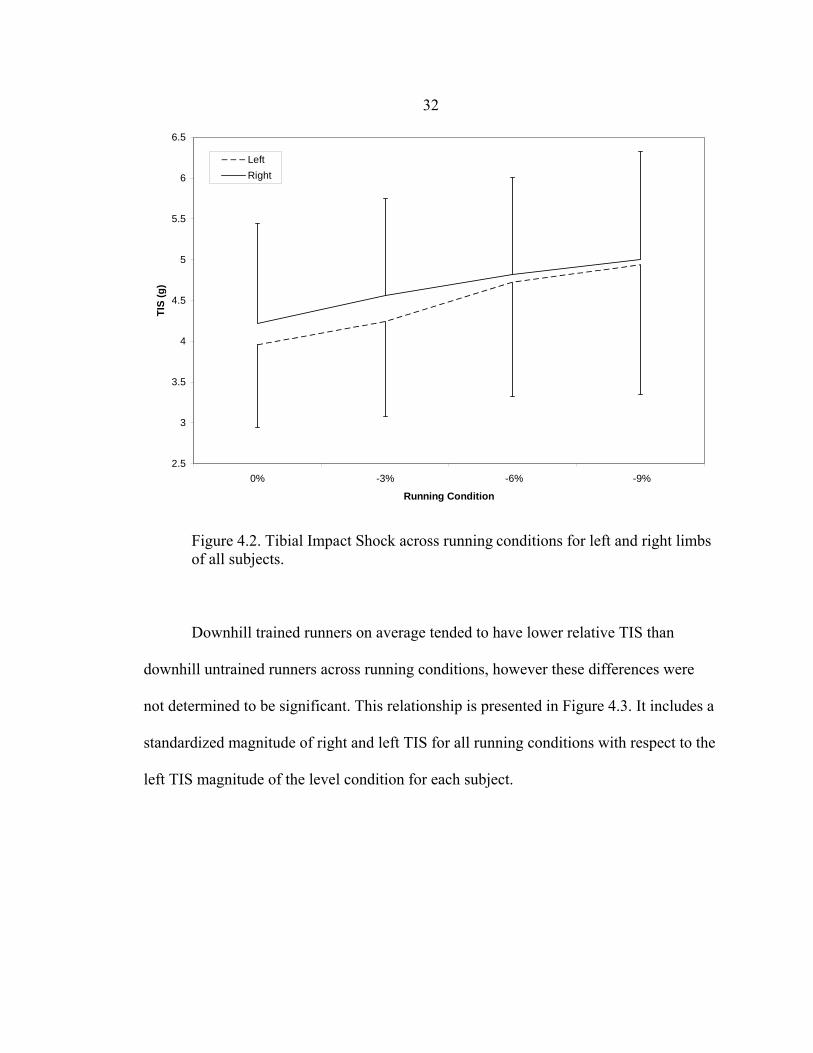
Figure 4.1. Example TIS peak for one subject. Table 4.2. Measured TIS for all subjects. 0% -3% -6% -9% Grade
Effect (p) TIS Left 3.95 (0.98) 4.23 (1.10) 4.71 (1.34) 4.94 (1.54) <0.001* (g) Right 4.16 (1.18) 4.54 (1.10) 4.77 (1.12) 4.86 (1.27) <0.001* g = gravitational acceleration, 9.81m/s2; Mean (standard deviation) * denotes significant (α=0.05)
32
2.5
3
3.5
4
4.5
5
5.5
6
6.5
0% -3% -6% -9%
Running Condition
TIS
(g)
LeftRight
Figure 4.2. Tibial Impact Shock across running conditions for left and right limbs of all subjects.
Downhill trained runners on average tended to have lower relative TIS than
downhill untrained runners across running conditions, however these differences were
not determined to be significant. This relationship is presented in Figure 4.3. It includes a
standardized magnitude of right and left TIS for all running conditions with respect to the
left TIS magnitude of the level condition for each subject.
33
0.7
0.8
0.9
1
1.1
1.2
1.3
1.4
1.5
1.6
1.7
0% -3% -6% -9%
Running Condition
Rel
ativ
e TI
SDownhill Trained- Right LimbDownhill Trained- Left LimbDownhill Untrained- Right LimbDownhill Untrained- Left Limb
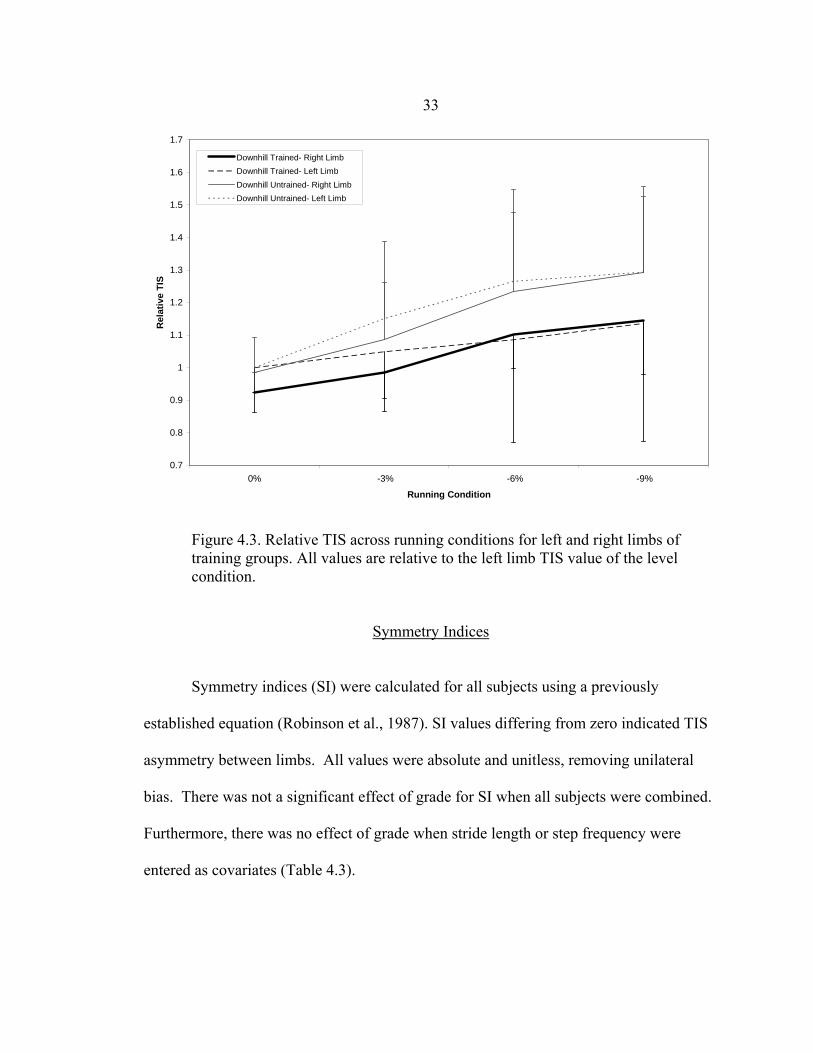
Figure 4.3. Relative TIS across running conditions for left and right limbs of training groups. All values are relative to the left limb TIS value of the level condition.
Symmetry Indices
Symmetry indices (SI) were calculated for all subjects using a previously
established equation (Robinson et al., 1987). SI values differing from zero indicated TIS
asymmetry between limbs. All values were absolute and unitless, removing unilateral
bias. There was not a significant effect of grade for SI when all subjects were combined.
Furthermore, there was no effect of grade when stride length or step frequency were
entered as covariates (Table 4.3).
34
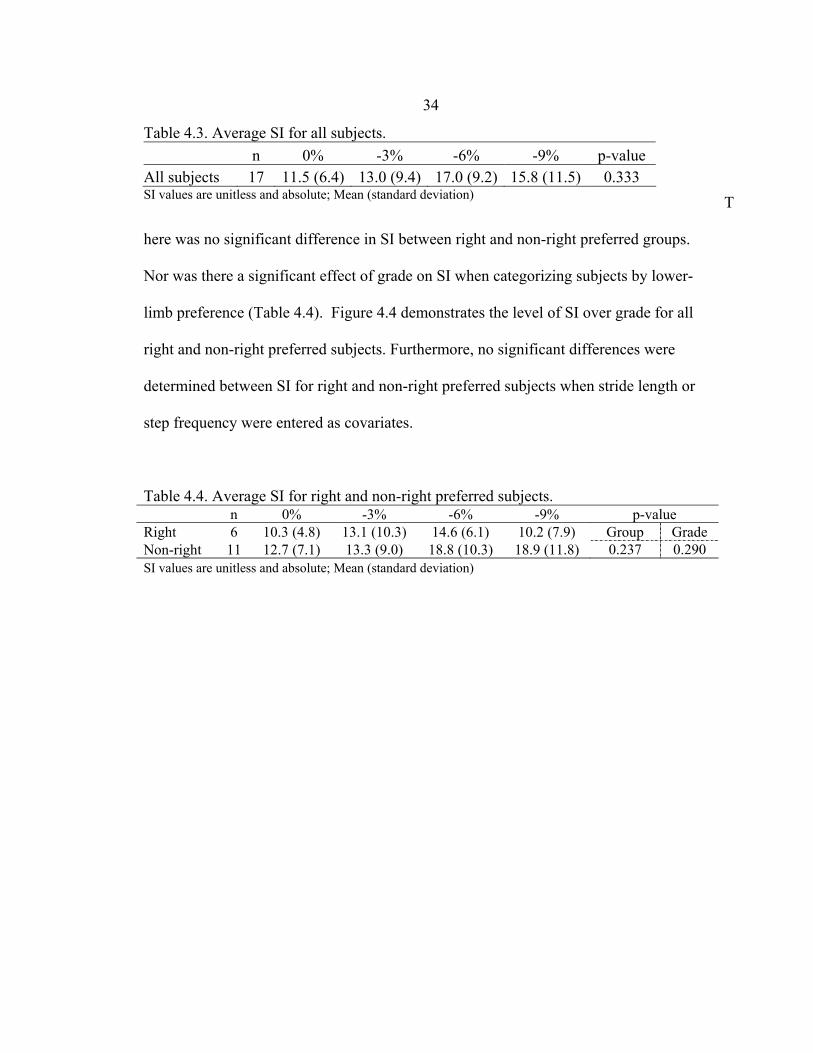
T
here was no significant difference in SI between right and non-right preferred groups.
Nor was there a significant effect of grade on SI when categorizing subjects by lower-
limb preference (Table 4.4). Figure 4.4 demonstrates the level of SI over grade for all
right and non-right preferred subjects. Furthermore, no significant differences were
determined between SI for right and non-right preferred subjects when stride length or
step frequency were entered as covariates.
Table 4.4. Average SI for right and non-right preferred subjects.
Table 4.3. Average SI for all subjects. n 0% -3% -6% -9% p-value
All subjects 17 11.5 (6.4) 13.0 (9.4) 17.0 (9.2) 15.8 (11.5) 0.333 SI values are unitless and absolute; Mean (standard deviation)
n 0% -3% -6% -9% p-value Right 6 10.3 (4.8) 13.1 (10.3) 14.6 (6.1) 10.2 (7.9) Group Grade Non-right 11 12.7 (7.1) 13.3 (9.0) 18.8 (10.3) 18.9 (11.8) 0.237 0.290 SI values are unitless and absolute; Mean (standard deviation)
35
0
5
10
15
20
25
30
35
0% -3% -6% -9%
Running Condition
Sym
met
ry In
dex
Right Preferred
Non-right Preferred
Figure 4.4. Symmetry Index across grades for lower-limb preference groups.
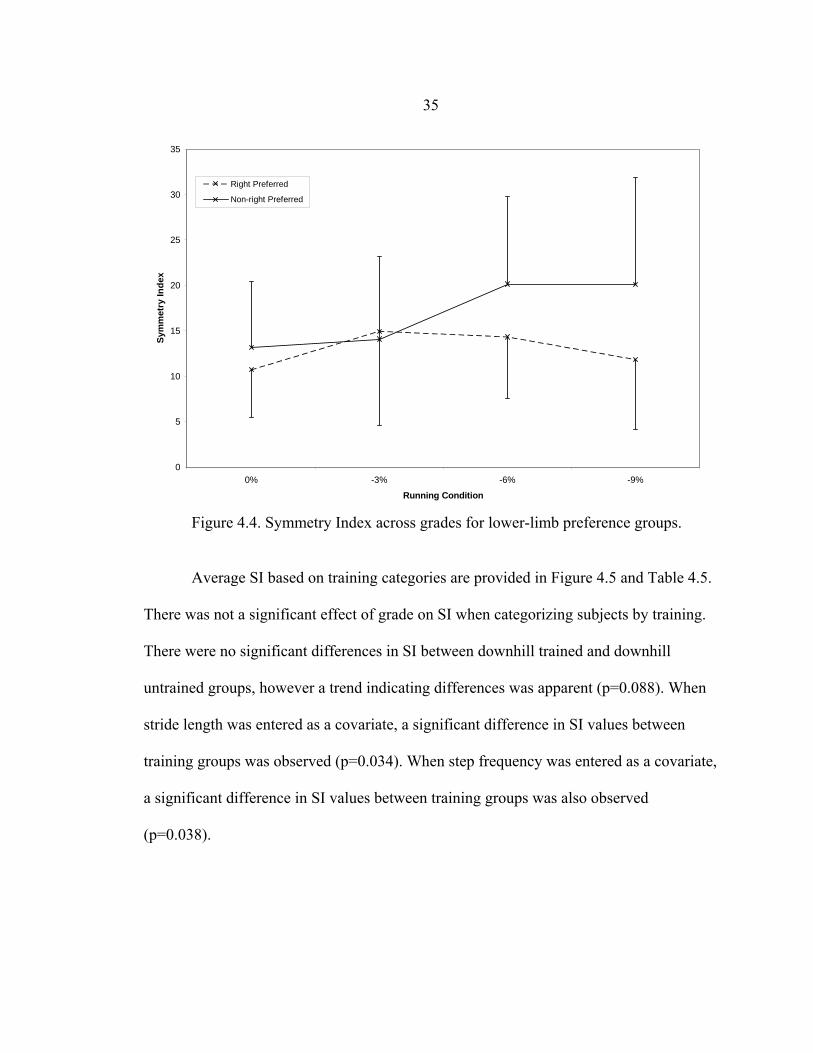
Average SI based on training categories are provided in Figure 4.5 and Table 4.5.
There was not a significant effect of grade on SI when categorizing subjects by training.
There were no significant differences in SI between downhill trained and downhill
untrained groups, however a trend indicating differences was apparent (p=0.088). When
stride length was entered as a covariate, a significant difference in SI values between
training groups was observed (p=0.034). When step frequency was entered as a covariate,
a significant difference in SI values between training groups was also observed
(p=0.038).
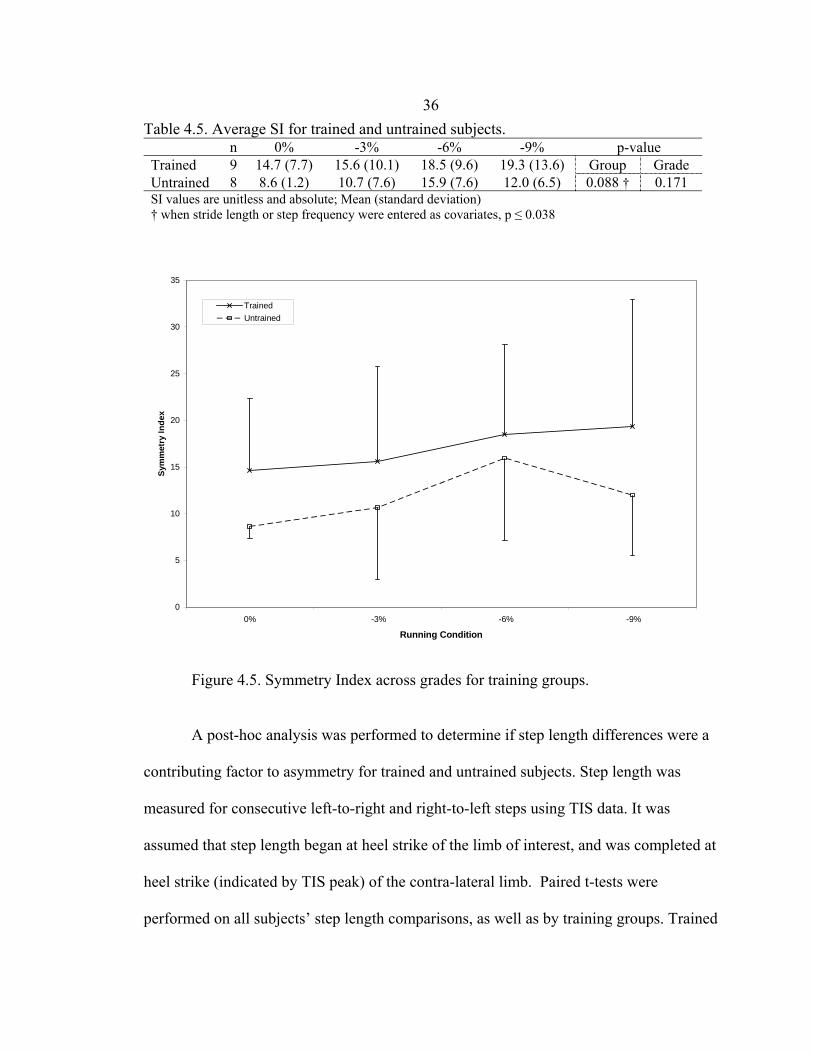
36Table 4.5. Average SI for trained and untrained subjects. n 0% -3% -6% -9% p-value Trained 9 14.7 (7.7) 15.6 (10.1) 18.5 (9.6) 19.3 (13.6) Group Grade Untrained 8 8.6 (1.2) 10.7 (7.6) 15.9 (7.6) 12.0 (6.5) 0.088 † 0.171 SI values are unitless and absolute; Mean (standard deviation) † when stride length or step frequency were entered as covariates, p ≤ 0.038
0
5
10
15
20
25
30
35
0% -3% -6% -9%
Running Condition
Sym
met
ry In
dex
TrainedUntrained
Figure 4.5. Symmetry Index across grades for training groups.
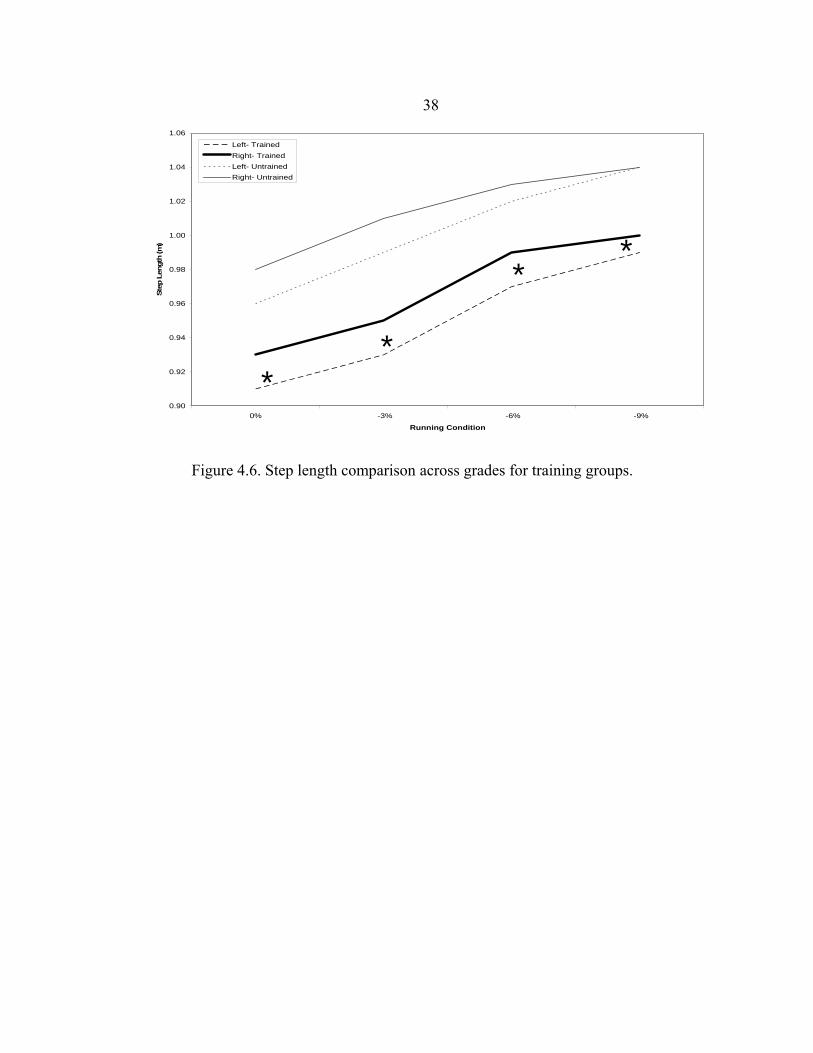
A post-hoc analysis was performed to determine if step length differences were a
contributing factor to asymmetry for trained and untrained subjects. Step length was
measured for consecutive left-to-right and right-to-left steps using TIS data. It was
assumed that step length began at heel strike of the limb of interest, and was completed at
heel strike (indicated by TIS peak) of the contra-lateral limb. Paired t-tests were
performed on all subjects’ step length comparisons, as well as by training groups. Trained

37subjects’ left and right step lengths were significantly different (p < 0.001). However,
step length was not significantly different in the untrained group when comparing left
step length to right step length (Table 4.6, Figure 4.6). To account for to a possible side
effect, the step length data from the untrained group were further sorted for comparisons
of larger to smaller step length. If a subject had one side with a noticeably greater step
length than the other (no more than one out of five samples being different), all
conditions for that particular subject were adjusted for comparisons of larger to smaller
step lengths. Only two sets of data from the six untrained subjects fit this description,
however the difference between larger and smaller step length was significant (p=0.01).
When trained subjects’ step length were modified for larger to smaller step length
comparisons, the differences remained significant, with no change in p-value (p<0.001).
Table 4.6. Step-length comparison for trained and untrained subjects. 0% -3% -6% -9% Untrained Speed (m/s) 2.72 (0.45) 2.76 (0.48) 2.81 (0.51) 2.86 (0.52) Left step length (m) 0.96 (0.14) 0.99 (0.17) 1.02 (0.16) 1.04 (0.16) Right step length (m) 0.98 (0.21) 1.01 (0.19) 1.03 (0.22) 1.04 (0.21)Trained Speed (m/s) 2.56 (0.23) 2.56 (0.25) 2.61 (0.25) 2.69 (0.24) Left step length (m)† 0.91 (0.09) 0.93 (0.09) 0.97 (0.09) 0.99 (0.11) Right step length (m)† 0.93 (0.11) 0.95 (0.11) 0.99 (0.12) 1.00 (0.13)† indicates significant difference between left and right step lengths
38
0.90
0.92
0.94
0.96
0.98
1.00
1.02
1.04
1.06
0% -3% -6% -9%
Running Condition
Step
Len
gth
(m)
Left- TrainedRight- TrainedLeft- UntrainedRight- Untrained
Figure 4.6. Step length comparison across grades for training groups.
**
**
39CHAPTER FIVE
DISCUSSION
Introduction
The primary goal of this study was to determine the effect of downhill running on
impact shock and asymmetry over varying grades. Specifically, it was hypothesized that
asymmetry would change with decreasing running grade. Asymmetry was assessed using
a previously established Symmetry Index (SI) score with bilateral tibial impact shock
magnitudes measured using uniaxial piezoelectric accelerometers.
The secondary and tertiary goals of this study were to determine if there was
significant symmetry difference between lower-limb preference groups and between
training groups, respectively. Subjects were categorized as either right or non-right lower
limb preferred, based on a series of unilateral assessments. Right preference referred to
subjects who performed at least three unilateral lower-limb preference tests with their
right foot. Non-right preference referred to subjects who performed three or more
unilateral lower-limb preference tests with their left foot or with both their left and right
feet. Subjects were also categorized as either downhill trained or non-downhill trained.
Downhill trained referred to subjects whose training consistently included downhill
“braking” specific training, and those who had participated in specific regional trail races
involving extensive downhill “braking” strategies, such as the Bridger Ridge Run,
Devil’s Backbone or the Old Gabe 25/50K. It was hypothesized that a difference in SI
measures would be present between the preference groups. It was also hypothesized that
a difference in SI measures would be present between the training groups.

40With respect to the primary goal, for all subjects, downhill running did not
significantly increase or decrease asymmetry. When grouped by preference or training,
there was no significant effect of grade for SI. For the right-preferred group, SI remained
fairly consistent across grades, whereas the SI of the non-right preferred group tended to
increase, though not significantly. For the downhill trained group, SI tended to increase
across grade conditions, but this difference was not significant, and the downhill
untrained group did not show a trend toward changing SI. Furthermore, there was no
significant difference in SI over grade conditions when comparing preference groups.
However, a divergence in mean SI values was seen between right and non-right preferred
runners. When accounting for variation in stride length or step frequency, a significant
difference in SI between downhill trained and untrained groups was observed.
Subject Characteristics
Seventeen subjects (10 female, 7 male) volunteered to participate in this study
from the community of Bozeman, Montana. Subjects were recruited for their limb
preference and training history (downhill or non-downhill running) and placed into
appropriate groups based on their responses to unilateral lower limb preference tests
(preference grouping, Appendix A) and a training questionnaire (training grouping,
Appendix B).
This recruitment technique resulted in more subjects being categorized in the
mixed-preference group than the right-preference group, which could be a limitation of
this study. Limb preference is subjective, and accurate determination of lower limb
preference may be limited by the number and type of tests performed in this study. This
41study adapted a scale which had been previously established to measure lateral
dominance in which five assessments of the lower limb function are used (Dusewicz and
Kershner, 1969). However, some of the parameters measured using this scale can be
described as preferential and not inherent. Preference, also known as laterality, is defined
as a subjective, preplanned choice of limb use (Touwen, 1972), such as the first foot used
when climbing stairs. Lateral dominance is defined as the central nervous system (CNS)
phenomenon of default use and superior performance of one side of the body compared
to the other (Coren & Porac, 1978; Harris, 1958). Sadeghi et al. (2000) have suggested
that dominance should be used in gait research in reference to the automatic reactionary
response to an action. However, the limb used for repetitive kicking of a ball or leading
natural gait should be defined as preferred rather than dominant because actual CNS
dominance is difficult to test for. Due to the difficulty of testing for dominance,
“preference” vocabulary, as opposed to “dominance,” was chosen in the present study.
Initially, it was desired to have an even number of subjects for the left and right
preference groups. However, it proved rather difficult to fulfill this goal. It has been
estimated that less than 10% of the human population is left-handed (Hebbal &
Mysorekar, 2003). Asymmetry may be revealed by handedness and footedness, however
the two are not perfectly related. Previous research suggests that while right handedness
and right footedness are strongly linked, left footedness is not as dependent on left
handedness (Peters & Durding, 1979; Hebbal and Mysorekar, 2003). This study may
therefore have been limited by possible cross-over between preference groups.
42Tibial Impact Shock Measurements
Orientation and attachment of the accelerometers on the anteromedial aspect of
the tibia was identical to the successful technique previously established by Hamill et al.
(1995). Magnitudes of TIS for the present study, ranging between 2.06-10.7g, are
comparable to previous findings (Flynn et al. 2004; Mercer, Vance, Hreljac & Hamill,
2002; Mizrahi et al., 2000b). It was assumed for the purposes of this study that the
orientation of the accelerometer at foot impact did not change with grade. Therefore, it
was further assumed that impact shock magnitudes were recorded with minimal angular
distortion of the uniaxial accelerometer. However, it is possible that angular changes at
the ankle and knee may distort the actual magnitude of shock experienced at the tibia.
Buczek and Cavanagh (1990) reported that as grade changed, knee and ankle angle
changed. The orientation of the tibia with respect to the ground at heel strike may be a
contributing factor to alterations in impact shock magnitudes with changing grade. Future
work should attempt to control for tibial orientation using kinematic analysis during
downhill running.
Footwear variations also need to be considered when measuring TIS magnitudes.
Butler, Davis and Hamill (2006) compared the effect of ‘motion control’ and ‘cushion
trainer’ shoes on kinematic parameters of running biomechanics, including tibial
accelerations. In their study, they found that peak tibial acceleration was reduced by 1.2g
for runners wearing the ‘cushion trainer’ shoes compared to when they wore ‘motion
control’ shoes. These differences indicate that shoe cushioning type can be a critical
factor in impact shock measurements at the shank. Therefore, it is imperative to use a
43consistent shoe model for all subjects during accelerometry measurements. In this study,
all subjects were equipped with identical gender-specific models of Brooks Radius™
cushioned trainers during data collections. The shoes were only worn during the
familiarization and data collections sessions and subjects indicated comfort and
appropriate shoe fit before data collections took place. However, a limitation of this study
could still be based on shoe model selection due to potential differences in foot type.
Those who have low arches or experience severe overpronation may be more susceptible
to injury while wearing cushion trainers during running, due to the lack of stability in
rearfoot motion. However, in this study, it was assumed that the familiarization and data
collection sessions were short enough in duration that the likelihood of altered gait was
minimal to null.
Asymmetry Comparisons
A divergence in SI between training groups was observed, and when accounting
for the covariates of stride length and step frequency, there was a significant difference
between downhill trained and untrained groups. Downhill trained groups showed more
asymmetry across running conditions than did their untrained counterparts. Such
asymmetry may be due in part to a specificity of training effect.
Further analyses indicated a significant difference in step length between left and
right steps for trained subjects, and a significant difference in step length between larger
and smaller steps for untrained subjects, which likely contributed to asymmetry
magnitudes. A unilateral forward stepping technique may explain this variation. Such a
technique consists of one limb primarily used for propulsion, indicative of a longer step
44length, and the opposite limb primarily used for balance with a shorter step length. The
‘balance’ limb may experience lower shock magnitude because of its reduced knee
extension and hip flexion (Derrick, 2004; Derrick et al, 1998). Hence, observed increases
in SI magnitude for the downhill trained group and the noticeable difference between SI
magnitudes of training groups may be explained by a possible training effect of repeated
downhill running sessions. Those who are habitual downhill runners, especially those
who run several races a year which include steep downhill running conditions, may tend
to pick a side that they typically favor for the forward step, and the opposite foot as the
trailing balance limb.
The idea of gait asymmetry being explained in light of a balance-propulsion
relationship has been previously suggested by others (Sadeghi, Allard & Duhaime, 2000).
For gait studies, Matsuska et al. (1985) reported that the left limb of subjects was
primarily responsible for controlling mediolateral balance. Similarly, Hirokawa (1989)
associated propulsion with the right limb and support with the left. When one step length
is longer than the other, as seen in individuals with limb length variations (and possibly
among those trained for downhill running), asymmetrical impact shock characteristics are
likely present. Variations in stride length have been reported in previous research to
contribute to changes in impact shock magnitude (Derrick, Hamill & Caldwell, 1998),
and individual step length variations may strongly contribute to changes in the magnitude
of asymmetry for individual subjects. Therefore, the present findings are in line with
previous research of impact shock characteristics of gait.
Subjects were allowed to choose their speed at each condition in order for them to
run at preferred stride length and frequency. However, they were somewhat restricted in
45that they were not allowed to deviate more than 5% from their level running speed.
Previous work by Buczek and Cavanagh (1990) demonstrated similar methodologies by
requiring their subjects to run at 4.5 m/s +/- 5% for both level and downhill running.
They reported a significant decrease in knee flexion angle during downhill running
compared to level running despite maintaining equivalent running speed. Yokozawa et
al. (2005) also noted that hip and knee flexion values were significantly altered following
heel strike while running downhill. Changes in gait kinematics are likely a natural
response for prevention of injury during downhill running. Also, such kinematic changes
may be the result of a decreased need for propulsion due to the assistance of gravity on a
runner’s forward motion. Specific changes in stride length have been suggested to
account for changes in measured TIS. Mercer et al. (2005) reported that when stride
length was kept constant over varying running speeds, impact force and attenuation did
not change. However, when allowed to select their own stride lengths, subjects tended to
select longer stride lengths at faster speeds, and impact force and attenuation both
increased as speed increased.
A limitation of the current study is that treadmill speed was allowed to vary
slightly from 0% grade to -9% grade. This alteration did not maintain control for stride
length, and the primary effect of downhill running may have been masked because of
stride length alterations. However, it is likely that subjects presented an increased stride
length at downhill grades because of comfort. Restricting speed and stride length may be
counter-intuitive when trying to establish natural effects of grade on impact shock and
asymmetry. Kinematic alterations are not consciously controlled by most runners over
varying terrain and running conditions. A protective effect of changing posture and joint
46angle kinematics may be intuitive for most runners in natural settings and restricting
these changes may increase the likelihood of injury, such as tibial stress fractures.
A difference in step length between limbs is strongly related to changes in
asymmetry, and it was apparent that as downhill grade increased, asymmetry increased
for those who were trained to run at steep downhill grades. It has been reported that
energy costs of downhill running are much less than that of level or uphill running
(Minetti, Moia, Roi, Susta & Ferretti, 2002). A reason for this may lie in the reduced
need for propulsion due to the assistance of gravity over downhill terrain. However,
Minetti et al. (2002) suggested a possible safety factor that contributes to decreased speed
at steep downhill grades that is not metabolically controlled. For example, downhill
racers do not tend to use their full aerobic capacity when running downhill. Reduced
downhill running speed may be caused by an inherent desire to reduce pain and damage
to joints and tissues. The reduction of knee flexion angle during downhill running has
been suggested to increase impact shock, which would subsequently increase the
likelihood of injury (Mercer et al., 2005). Reducing speed may be a subconsciously-
controlled mechanism for avoiding such injuries. Indeed, slower speeds have been
reported to reduce impact shock (Mercer et al., 2002). This tendency may be further
adapted with downhill running training. As runners become more familiar with downhill
terrain and conditions, they may develop better control of their body’s acceleration by
maintaining a moderate braking/propulsion mechanism while running downhill.
Neuromuscular control could be trained to tolerate steeper grades at faster speeds, and
unilateral braking patterns, as well as asymmetrical step lengths, appear to be some of the
effects of downhill-specific training.
47Previous researchers have suggested with strong conviction that use of bilateral
measurements is important in gait analysis techniques (Sadeghi et al., 1997; Sadeghi,
Allard et al., 2000). The measure of evaluating asymmetry in the present study has been
used frequently in previous works (Zifchock et al., 2006; Robinson et al., 1987). The
range of SI measures of the present study is similar to those of Zifchock et al. (2006) and
within the suggested range of normal asymmetry. The measure quantifies asymmetry as
an absolute percentage, and the difference between parameters is not characterized by
lateral preference. Some studies have used positive and negative evaluations of
asymmetry. For example, Perttunen et al. (2004) compared ground reaction force
asymmetry for subjects with limb length discrepancy. Also, Kim and Eng (2003)
measured asymmetry by kinetic means for persons with stroke, comparing paretic and
non-paretic limbs. It may be beneficial when comparing asymmetry of mixed preference
groups to use non-absolute measures of symmetry indices because of the possible effects
of laterality. However, when qualitatively comparing SI for preference groups in the
present study using non-absolute quantification, there did not appear to be a trend of
different asymmetry between groups. Also, the training groups were of both right and
non-right lower limb preference, and reducing the subject numbers to include only one of
these preference groups would reduce the power of the present study. The laterality tests
established for the present study may need to be modified for future work in the
assessment of asymmetry in regards to lower-limb preference. However, there may not be
an association between laterality and TIS sidedness (the laterality presented with
comparison of TIS magnitude), and assessment of which limb to measure kinematic and
kinetic parameters during unilateral gait analysis may need to be reevaluated.
48CHAPTER SIX
CONCLUSION
Researchers have reported an inverse relationship between impact shock
magnitude and decline grade. The purpose of this study was to determine the relationship
between impact shock magnitude and lower-limb symmetry while running on varying
downhill grades.
It was hypothesized that lower-limb asymmetry, as calculated with tibial impact
shock, will increase with greater decline grade running due to an amplification of inter-
limb differences. It was also hypothesized that SI values will be different between lower
limb right and non-right preferred running populations. It was also hypothesized that SI
values will be different between experienced and inexperienced downhill running
populations.
Results from this study indicate that asymmetry does not change as grade
decreases. Asymmetry did not significantly differ between limb preference groups.
However, when accounting for variation in stride length and step frequency, asymmetry
did show significant differences between downhill trained and untrained groups.
Downhill trained subjects tended to have a greater SI across running conditions compared
to untrained subjects. This is thought to be due to a learned habit of unilateral braking and
propulsion characteristics which may be unique to runners who specifically train for
downhill running.
A post-hoc step length analysis of the time differences between right and left TIS
for each subject at each grade condition revealed significant asymmetry. Changing stride
49length is known to affect TIS magnitude, and further differentiation between right and
left step lengths in this study has revealed a significant contribution to asymmetry. These
findings have implications for training and injury prevention for runners who are starting
a trail-running regimen or are consistently training on downhill terrain. Maintenance of
symmetry may reduce the likelihood of injury over an extended period of time. On the
other hand, a learned asymmetry may be beneficial for speed and performance when
running on steep downhill grades.
Future research should focus on methods of reducing SI by kinematic means.
Comparison of intra-limb TIS when maintaining step length may shed light on whether or
not other mechanisms cause downhill running asymmetry. Different groups should also
be compared, such as runners who primarily run on trails and those who primarily run on
roads. Longitudinal observational studies following distance runners should also be
performed to see if natural asymmetry leads to gait pathologies and increased stress on
bones of the lower limbs.
50REFERENCES CITED
Beck, B. R. (1998). Tibial stress injuries: An aetiological review for the purposes of guiding management. Sports Medicine 26(4), 265-279.
Beynnon, B. D., Renstrom, P. A., Alosa, D. M., Baumhauer, J. F., & Vacek, P. M.
(2001). Ankle ligament injury risk factors: a prospective study of college athletes. Journal of Orthopaedic Research, 19, 213-220.
Buczek, F. L. & Cavanagh, P. R. (1990). Stance phase knee and ankle kinematics and
kinetics during level and downhill running. Medicine and Science in Sports and Exercise, 22(5), 669-677.
Butler, R.J., Hamill, J., & Davis, I. (2006). Interaction of arch type and footwear on
running mechanics. American Journal of Sports Medicine, 34(12), 1998-2005. Chavet, P., Lafortune, M. A., & Gray, J. R. (1997). Asymmetry of lower extremity
responses to external impact loading. Human Movement Science, 16, 391-406. Chu, J. J., & Caldwell, G. E. (2004). Stiffness and damping responses associated with
shock attenuation in downhill running. Journal of Applied Biomechanics, 20, 291-308.
Collins, J. J., & Whittle, M. W. (1989). Impulsive forces during walking and their clinical
implications. Clinical Biomechanics, 4, 179-187. Coren, S., & Porac, C. (1978). The validity and reliability of self-report items for the
measurement of lateral preference. British Journal of Psychology, 69, 207-277. Derrick, T.R. (2004). The effects of knee contact angle on impact forces and
accelerations. Medicine and Science in Sports and Exercise, 36(5), 832-837. Derrick, T. R., Hamill, J., & Caldwell, G. E. (1998). Energy absorption of impacts during
running at various stride lengths. Medicine and Science in Sports and Exercise, 30(1), 128-135.
Dick, R. W., & Cavanagh, P. R. (1987). A comparison of ground reaction forces (GRF)
during level and downhill running at similar speeds (Abstract). Medicine and Science in Sports and Exercise, 19, S12.
Dusewicz, R. A. & Kershner, K. M. (1969). A scale for the measurement of lateral
dominance. Journal of Educational Measurement, 6(3), 187-188. Ekstrand, J., & Gillquist, J. (1983). Soccer injuries and their mechanics: a prospective
study. Medicine and Science in Sports and Exercise, 15(3), 267-270.
51Flynn, J. M., Holmes, J. D., & Andrews, D. M. (2004). The effect of localized leg muscle
fatigue on tibial impact acceleration. Clinical Biomechanics, 19(7), 726-732. Genthon, N., & Rougier, P. (2005). Influence of an asymmetrical body weight
distribution on the control of undisturbed upright stance. Journal of Biomechanics, 38, 2037-2049.
Golomer, E., & Mbongo, F. (2004). Does footedness or hemispheric visual asymmetry
influence centre of pressure displacements? Neuroscience Letters, 367, 148-151. Gottschall, J. S., & Kram, R. (2005). Ground reaction forces during downhill and uphill
running. Journal of Biomechanics, 38, 445-452. Guanche, C. A., & Sikka, R. S. (2005). Acetabular labral tears with underlying
chrondromalacia: A possible association with high-level running. Arthroscopy: The Journal of Arthroscopic and Related Surgery, 21(5), 580-585.
Gumustekin, K., Akar, S., Dane, S., Yildirim, M., Seven, B., & Varoglu, E. (2004).
Handedness and bilateral femoral bone densities in men and women. International Journal of Neuroscience, 114, 1533-1547.
Hamill, J., Bates, B. T., & Knutzen, K. M. (1984). Ground reaction forces during walking
and running. Research Quarterly for Exercise and Sport, 55(3), 289-293. Hamill, J., Derrick, T. R., & Holt, K. G. (1995). Shock attenuation and stride frequency
during running. Human Movement Science, 14, 45-60. Hannah, R. F., Morrison, J. B., & Chapman, A. E. (1984). Kinematic symmetry of the
lower limbs. Archives of Physical Medicine and Rehabilitation, 65, 155-158. Harris, A. J. (1958). The Harris Test of Lateral Dominance. (Vol. Third Edition). New
York, NY: The Psychology Corporation. Hebbal, G. V., & Mysorekar, V. R. (2003). Anatomical and behavioural asymmetries in
right and left handers from India. Annals of Anatomy, 185, 267-275. Herzog, W., Nigg, B. M., Read, L. J., & Olsson, E. (1989). Asymmetries in ground
reaction force patterns in normal human gait. Medicine and Science in Sports and Exercise, 21(1), 110-114.
Hirokawa, S. (1989). Normal gait characteristics under temporal and distance constraints.
Journal of Biomedical Engineering, 11, 449-456.
52Holder-Powell, H. M., & Rutherford, O. M. (2000). Unilateral lower-limb
musculoskeletal injury: Its long-term effect on balance. Archives of Physical Medicine and Rehabilitation, 81, 265-268.
Hreljac, A., Marshall, R. N., & Hume, P. A. (2000). Evaluation of lower extremity
overuse injury potential in runners. Medicine and Science in Sports and Exercise, 32(9), 1635-1641.
Kaufman, K. R., Miller, L. S., & Sutherland, D. H. (1996). Gait asymmetry in patients
with limb-length inequality. Journal of Pediatric Orthopaedics, 16(2), 144-150. Keller, T. S., Weisberger, A. M., Ray, J. L., Hasan, S. S., & Shiavi, R. G. (1996).
Relationship between vertical ground reaction force and speed during walking, slow jogging, and running. Clinical Biomechanics, 11(5), 253-259.
Killian, M. L., Nagashima, C. I., & Hahn, M.E. (2006). The effect of downhill running on
impact shock and asymmetry. Proceedings of the 30th Annual meeting of the American Society of Biomechanics, Virginia Technological University, Blacksburg, Virginia.
Kim, C. M., & Eng, J. J. (2003). Symmetry in vertical ground reaction force is
accompanied by symmetry in temporal but not distance variables of gait in persons with stroke. Gait and Posture, 18, 23-28.
Kim, W., & Voloshin, A. S. (1992). Dynamic loading during running on various surfaces.
Human Movement Science, 11, 675-689. Knutson, G. A. (2005). Anatomic and functional leg-length inequality: A review and
recommendation for clinical decision-making. Part I, anatomic leg-length inequality: prevalence, magnitude, effects and clinical significance. Chiropractic and Osteopathy, 13(11), online.
Lake, M. J., & Lafortune, M. A. (1998). Mechanical imputs related to perception of lower
extremity impact loading severity. Medicine and Science in Sports and Exercise, 30(1), 136-143.
Lenoir, M., Van Overschelde, S., De Rycke, M., & Musch, E. (2005). Intrinsic and
extrinsic factors of turning preferences in humans. Neuroscience Letters, 393, 179-183.
Mattes, S. J., Martin, P. E., & Royer, T. D. (2000). Walking symmetry and energy cost in
persons with unilateral transtibial amputations: Matching prosthetic and intact limb inertial properties. Archives of Physical Medicine and Rehabilitation, 81, 561-568.
53Maupus, E., Paysant, J., Datie, A. M., Martinet, N., & Andre, J. M. (2002). Functional
asymmetries of the lower limbs. A comparison between clinical assessment of laterality, isokinetic evaluation and electrogoniometric monitoring of knees during walking. Gait and Posture, 16, 304-312.
Matsuska, N., Fujita, M., Hamamura, A., Norimatsu, T., & Suzuki, R. (1985).
Relationship between right and left leg in human gait from a viewpoint of balance control. In: Winter, D.A., Norman, R., Wells, R., Hayes, K., Patla, A., editors. Biomechanics, IX-A. Champaign: Human Kinetics Publishers, 427-430.
McManus, I. C., & Wysocki, C. J. (2005). Left-handers have a lower prevalence of
arthritis and ulcer. Laterality, 10(2), 97-102. Mercer, J. A., Vance, J., Hreljac, A., & Hamill, J. (2002). Relationship between shock
attenuation and stride length during running at different velocities. European Journal of Applied Physiology, 87(4-5), 403-408.
Mercer, J. A., Bates, B. T., Dufek, J. S., & Hreljac, A. (2003). Characteristics of shock
attenuation during fatigued running. Journal of Sports Sciences, 21(11), 911-920. Mercer, J. A., Devita, P., Derrick, T. R., & Bates, B. T. (2003). Individual effects of
stride length and frequency on shock attenuation during running. Medicine and Science in Sports and Exercise, 35(2), 307-313.
Mercer, J. A., Bezodis, N. E., Russell, M., Purdy, A., & DeLion, D. (2005). Kinetic
consequences of constraining running behaviour. Journal of Sports Science and Medicine, 4, 144-152.
Minetti, A. E., Moia, C., Roi, G. S., Susta, D., & Ferretti, G. (2002). Energy cost of
walking and running at extreme uphill and downhill slopes. Journal of Applied Physiology, 93, 1039-1046.
Mizrahi, J., Verbitsky, O., & Isakov, E. (2000a). Fatigue-related loading imbalance on
the shank in running: A possible factor in stress fractures. Annals of Biomedical Engineering, 28, 463-469.
Mizrahi, J., Verbitsky, O., & Isakov, E. (2000b). Shock accelerations and attenuation in
downhill and level running. Clinical Biomechanics, 15, 15-20. Mizrahi, J., Verbitsky, O., Isakov, E., & Daily, D. (2000c). Effect of fatigue on leg
kinematics and impact acceleration in long distance running. Human Movement Science, 19, 139-151.
Mizrahi, J., Verbitsky, O., & Isakov, E. (2001). Fatigue-induced changes in decline
running. Clinical Biomechanics, 16, 207-212.
54Murphy, D. F., Connolly, D. A. J., & Beynnon, B. D. (2003). Risk factors for lower
extremity injury: a review of the literature. British Journal of Sports Medicine, 37, 13-29.
Neely, F. G. (1998). Biomechanical risk factors for exercise-related lower limb injuries.
Sports Medicine, 26(6), 395-413. Nilsson, J., & Thorstensson, A. (1989). Ground reaction forces at different speeds of
human walking and running. Acta Physiol Scandanavia, 136(2), 217-227. O'Connor, K., & Hamill, J. (2002). Does running on a cambered road predispose a runner
to injury? Journal of Applied Biomechanisc, 18, 3-14. Orchard, J. W. (2001). Intrinsic and extrinsic risk factors for muscle strains in Australian
football. The American Journal of Sports Medicine, 29(3), 300-304. Ounpuu, S., & Winter, D. (1989). Bilateral electromyographical analysis of the lower
limbs during walking in normal humans. Electroencephalography and Clinical Neurophysiology, 72, 429-438.
Perttunen, J. R., Anttila, E., Södergård, J., Merikanto, P., & Komi, P. V. (2004). Gait
asymmetry in patients with limb length discrepency. Scandinavian Journal of Medicine and Science in Sports, 14, 49-56.
Peters, M., & Durding, B. M. (1979). Footedness of left- and right-handers. American
Journal of Psychology, 92, 133-142. Previc, F. H. (1991). A general theory concerning the prenatal origins of cerebral
lateralization in humans. Psychological Review, 98(3), 299-334. Radin, E. L., Paul, I. L., & Rose, R. M. (1972). Role of mechanical factors in pathogensis
of primary osteoarthritis. Lancet, 4, 519-522. Robinson, R. O., Herzog, W., & Nigg, B. M. (1987). Use of force platform variables to
quantify the effects of chiropractic manipulation on gait symmetry. Journal of Manipulative Physiological Therapy, 10, 172-176.
Sadeghi, H., Allard, P., & Duhaime, M. (1997). Functional gait asymmetry in able-
bodied subjects. Human Movement Science, 16(2), 243-258. Sadeghi, H., Allard, P., Prince, F., & Labelle, H. (2000). Symmetry and limb dominance
in able-bodied gait: a review. Gait and Posture, 12, 34-45.

55Sadeghi, H., Allard, P., & Duhaime, M. (2000). Contributions of Lower-Limb Muscle
Power in Gait of People Without Impairments. Physical Therapy, 80(12), 1188-1196.
Sadeghi H., Allard P, Labelle H, Duhaime M. (2001). Lower Limb Muscle Power
Relationships in Bilateral Able-Bodied Gait. American Journal of Physical Medicine and Rehabilitation, 80(11), 821-830.
Saggini, R., Pizzigallo, E., Vecchiet, J., Macellari, V., & Giacomozzi, C. (1998).
Alteration of spatial-temporal parameters of gait in Chronic Fatigue Syndrome patients. Journal of Neurological Sciences, 154(1), 18-25.
Sainburg, R. L. (2002). Evidence for a dynamic-dominance hypothesis of handedness.
Experimental Brain Research, 142, 241-258. Simon, S. R., Radin, E. L., Paul, I. L., & Rose, R. M. (1972). The response of joints to
impact loading. II. In vivo behavior of subchondral bone. Journal of Biomechanics, 5, 267-272.
Smak, W., Neptune, R. R., & Hull, M. L. (1999). The influence of pedaling rate on
bilateral asymmetry in cycling. Journal of Biomechanics, 32, 899-906. Subotnick, S. I. (1981). Limb length discrepencies of the lower extremity (The short leg
syndrome). Journal of Orthopaedic and Sports Physical Therapy, 3, 11-16. Surve, I., Schwellnuss, M. P., Noakes, T., & Lombard, C. (1994). A fivefold reduction in
the incidence of recurrent ankle sprains in soccer players using the Sport-Stirrup orthosis. American Journal of Sports Medicine, 22(5), 601-606.
Sutherland, D. (1997). The development of mature gait. Gait and Posture, 6(2), 163-170. Sutherland, D. H., Olshen, R., Cooper, L., & Woo, S. L. (1980). The development of
mature gait. Journal of Bone and Joint Surgery, 62-A(3), 336-353. Touwen, B. (1972). Laterality and dominance. Developmental Medicine in Child
Neurology, 14, 747-755. Tulloh, B. (1998). The role of cross-country in the development of a runner. New Studies
in Athletics, 13, 9-11. Yokozawa, T., Fujii, N., & Ae, M. (2005). Kinetic characteristics of distance running on
downhill slope. International Journal of Sport and Health Science, 3, 35-45.
56Zifchock, R. A., Davis, I., & Hamill, J. (2006). Kinetic asymmetry in female runners with
and without retrospective tibial stress fractures. Journal of Biomechanics, 39(15), 2792-2797.

57
APPENDICES

58
APPENDIX A
PREFERENCE AND SPEED ASSESSMENT
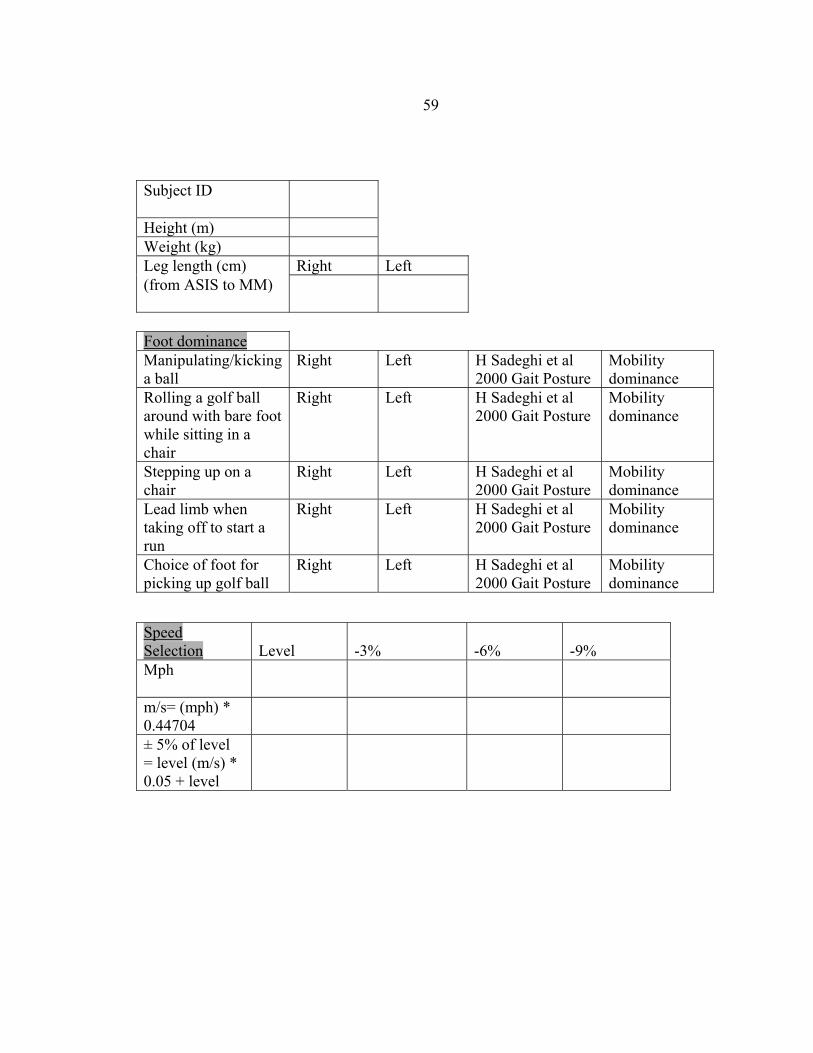
59
Subject ID
Height (m) Weight (kg) Leg length (cm) Right Left (from ASIS to MM)
Foot dominance Manipulating/kicking a ball
Right Left H Sadeghi et al 2000 Gait Posture
Mobility dominance
Rolling a golf ball around with bare foot while sitting in a chair
Right Left H Sadeghi et al 2000 Gait Posture
Mobility dominance
Stepping up on a chair
Right Left H Sadeghi et al 2000 Gait Posture
Mobility dominance
Lead limb when taking off to start a run
Right Left H Sadeghi et al 2000 Gait Posture
Mobility dominance
Choice of foot for picking up golf ball
Right Left H Sadeghi et al 2000 Gait Posture
Mobility dominance
Speed Selection
Level
-3%
-6%
-9%
Mph
m/s= (mph) * 0.44704
± 5% of level = level (m/s) * 0.05 + level

60
APPENDIX B
DEMOGRAPHIC SURVEY

61
Subject Reference Identification _____________ Age ______ Sex _____ Shoe size _______ Current running shoe model ________________ How many years have you been running? _____________________________ Approximately how many miles do you run per week? ___________________ Where do you usually run? ______________________________________________ ____________________________________________________________________ Does your regular weekly training volume contain downhill running? Yes / No If yes, how much?: ______________________________________________________ Have you raced recently (within the last two weeks)? Yes / No If yes, when and what race? _______________________________________________ Please rate your current muscle/joint soreness (1 = not sore; 10 = very sore) ___________ Do you currently have any injuries? Yes / No If yes, please list: ______________________________________________________ _____________________________________________________________________ Have you ever had a running-related injury? Yes / No If yes, please explain: ____________________________________________________ ______________________________________________________________________ Are you left/right/ambidextrously handed? _________________

62
APPENDIX C
SUBJECT CONSENT FORM
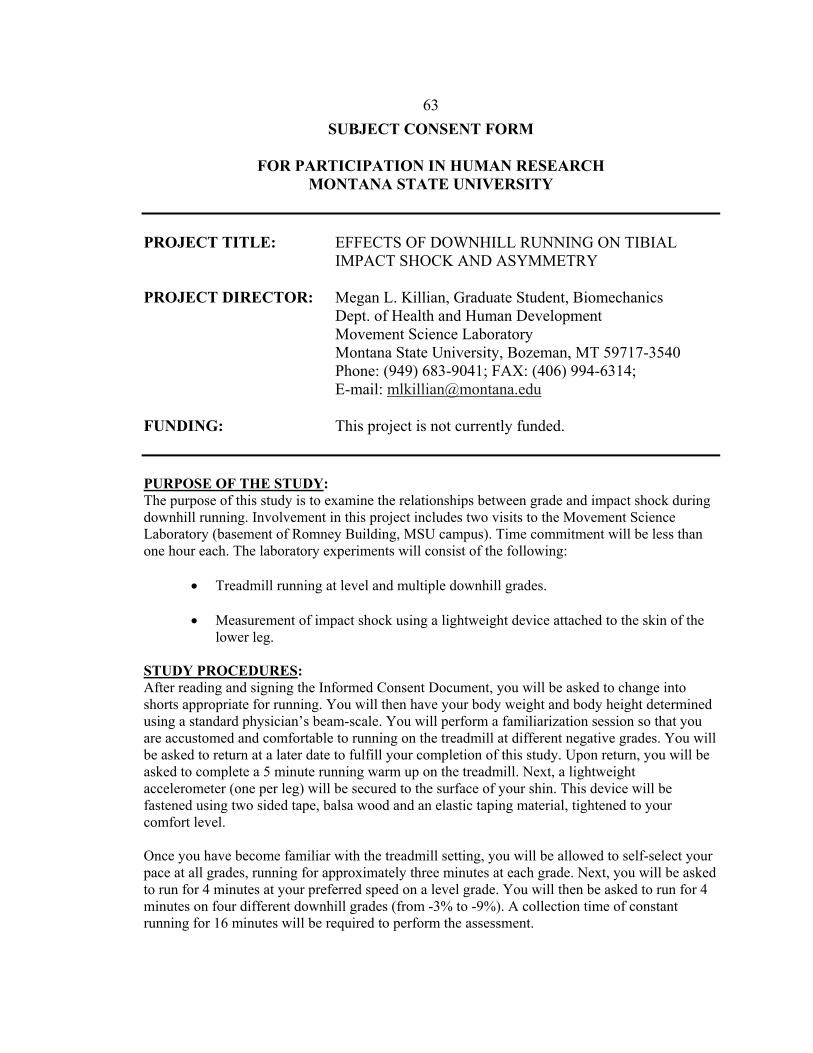
63SUBJECT CONSENT FORM
FOR PARTICIPATION IN HUMAN RESEARCH MONTANA STATE UNIVERSITY
PROJECT TITLE: EFFECTS OF DOWNHILL RUNNING ON TIBIAL
IMPACT SHOCK AND ASYMMETRY PROJECT DIRECTOR: Megan L. Killian, Graduate Student, Biomechanics Dept. of Health and Human Development Movement Science Laboratory Montana State University, Bozeman, MT 59717-3540 Phone: (949) 683-9041; FAX: (406) 994-6314;
E-mail: [email protected] FUNDING: This project is not currently funded. PURPOSE OF THE STUDY: The purpose of this study is to examine the relationships between grade and impact shock during downhill running. Involvement in this project includes two visits to the Movement Science Laboratory (basement of Romney Building, MSU campus). Time commitment will be less than one hour each. The laboratory experiments will consist of the following:
• Treadmill running at level and multiple downhill grades. • Measurement of impact shock using a lightweight device attached to the skin of the
lower leg. STUDY PROCEDURES: After reading and signing the Informed Consent Document, you will be asked to change into shorts appropriate for running. You will then have your body weight and body height determined using a standard physician’s beam-scale. You will perform a familiarization session so that you are accustomed and comfortable to running on the treadmill at different negative grades. You will be asked to return at a later date to fulfill your completion of this study. Upon return, you will be asked to complete a 5 minute running warm up on the treadmill. Next, a lightweight accelerometer (one per leg) will be secured to the surface of your shin. This device will be fastened using two sided tape, balsa wood and an elastic taping material, tightened to your comfort level. Once you have become familiar with the treadmill setting, you will be allowed to self-select your pace at all grades, running for approximately three minutes at each grade. Next, you will be asked to run for 4 minutes at your preferred speed on a level grade. You will then be asked to run for 4 minutes on four different downhill grades (from -3% to -9%). A collection time of constant running for 16 minutes will be required to perform the assessment.
64 POTENTIAL RISKS: It is possible that you may experience some discomfort in the placement of the accelerometer device. However, after the device is secured, any discomfort will be minimal. Throughout the testing session, if you feel uncomfortable with any procedure, you may feel free to stop the test at any time. BENEFITS: In addition to receiving personalized feedback on the impact shock patterns witnessed during your assessment, the results of this study may contribute to more effective prevention of injury in the general running population Additionally, study participants may request a summary of the study findings by contacting the Project Director, Megan Killian, by phone (949-683-9041) or by E-mail ([email protected]). CONFIDENTIALITY: The personal information, and all recorded data will be regarded as privileged and confidential materials. Any information that is obtained in connection with this study and that can be identified with you will remain confidential and will be disclosed only with your permission. Subject identities will be kept confidential by coding the data using subject pseudonyms. The code list will be kept separate and secure from the actual data files. FREEDOM OF CONSENT: Participation in this project is completely voluntary. You may withdraw consent for participation in writing, by telephone, or in person without prejudice or loss of benefits (as described above). Please contact the Project Director, Megan Killian, by phone (949-683-9041) or by E-mail ([email protected]) to discontinue participation. In the UNLIKELY event that your participation in the project results in physical injury to you, the Project Director will advise and assist you in receiving medical treatment. No compensation is available from Montana State University for injury, accidents, or expenses that may occur as a result of your participation in this project. Additionally, no compensation is available from Montana State University for injury, accidents, or expenses that may occur as a result of traveling to and from your appointments at the Movement Science / Human Performance Laboratory. Further information regarding medical treatment may be obtained by calling the Project Director, Megan Killian, at 949-683-9041. You are encouraged to express any questions, doubts or concerns regarding this project. The Project Director will attempt to answer all questions to the best of their ability prior to any testing. The Project Director fully intends to conduct the study with your best interest, safety and comfort in mind. Additional questions about the rights of human subjects can be answered by the Chairman of the Human Subjects Committee, Mark Quinn, at 406-994-5721.
65 PROJECT TITLE: EFFECTS OF DOWNHILL RUNNING ON TIBIAL IMPACT SHOCK
AND ASYMMETRY
STATEMENT OF AUTHORIZATION
I, the participant, have read the Informed Consent Document and understand the discomforts, inconvenience, risks, and benefits of this project. I, __________________________________ (print your name), agree to participate in the project described in the preceding pages. I understand that I may later refuse to participate, and that I may withdraw from the study at any time. I have received a copy of this consent form for my own records. Signed:______________________________ Age__________ Date________________ Subject’s Signature