Embed Size (px)
Citation preview
The Effect of Delhi Metro on Air Pollution in Delhi
Deepti Goel Delhi School of Economics
and Sonam Gupta
University of Florida
February 22, 2013, ISI Delhi
Research Question
Has the Delhi Metro (DM) resulted in an improvement in air quality
in the city?

MotivationAdverse health effects of air pollution
Block et al. (2012); Damage to central nervous system, cardiovascular disease, asthma
Currie & Walker (2011); Moretti and Neidell (2011);
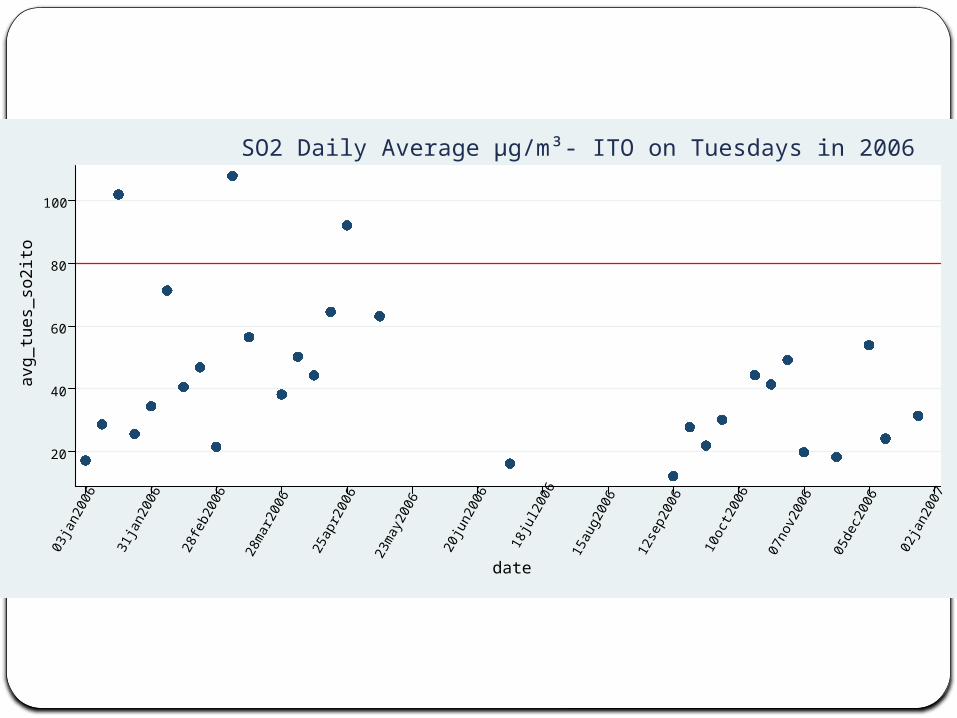
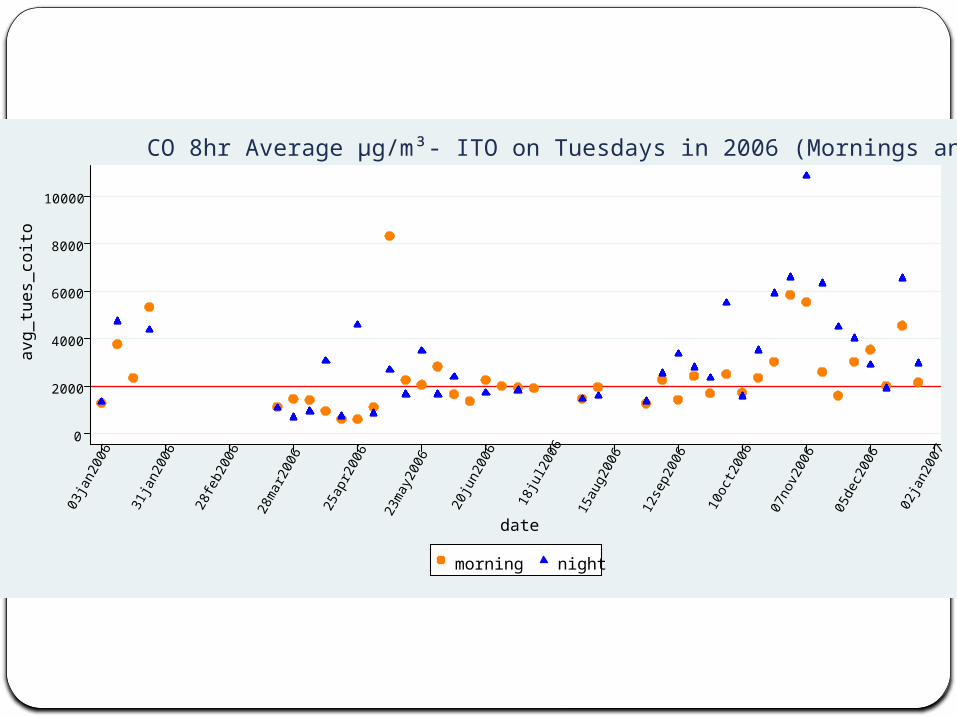
High levels of pollution in Delhi
Several criteria pollutants exceed national standards
Net effect of public transport ambiguousTraffic Diversion EffectTraffic Creation EffectPower Plants (in case of Delhi Metro (DM))

0
100
200
300
400
avg_
tues
_no2
ito
03ja
n200
6
31ja
n200
6
28fe
b200
6
28m
ar20
06
25ap
r200
6
23m
ay20
06
20ju
n200
6
18ju
l200
6
15au
g200
6
12se
p200
6
10oc
t200
6
07no
v200
6
05de
c200
6
02ja
n200
7
date
NO2 Daily Average µg/m³- ITO on Tuesdays in 2006
20
40
60
80
100
avg_
tues
_so2
ito
03ja
n200
6
31ja
n200
6
28fe
b200
6
28m
ar20
06
25ap
r200
6
23m
ay20
06
20ju
n200
6
18ju
l200
6
15au
g200
6
12se
p200
6
10oc
t200
6
07no
v200
6
05de
c200
6
02ja
n200
7
date
SO2 Daily Average µg/m³- ITO on Tuesdays in 2006
0
2000
4000
6000
8000
10000
avg_
tues
_coi
to
03ja
n200
6
31ja
n200
6
28fe
b200
6
28m
ar20
06
25ap
r200
6
23m
ay20
06
20ju
n200
6
18ju
l200
6
15au
g200
6
12se
p200
6
10oc
t200
6
07no
v200
6
05de
c200
6
02ja
n200
7
date
morning night
CO 8hr Average µg/m³- ITO on Tuesdays in 2006 (Mornings and Nights)
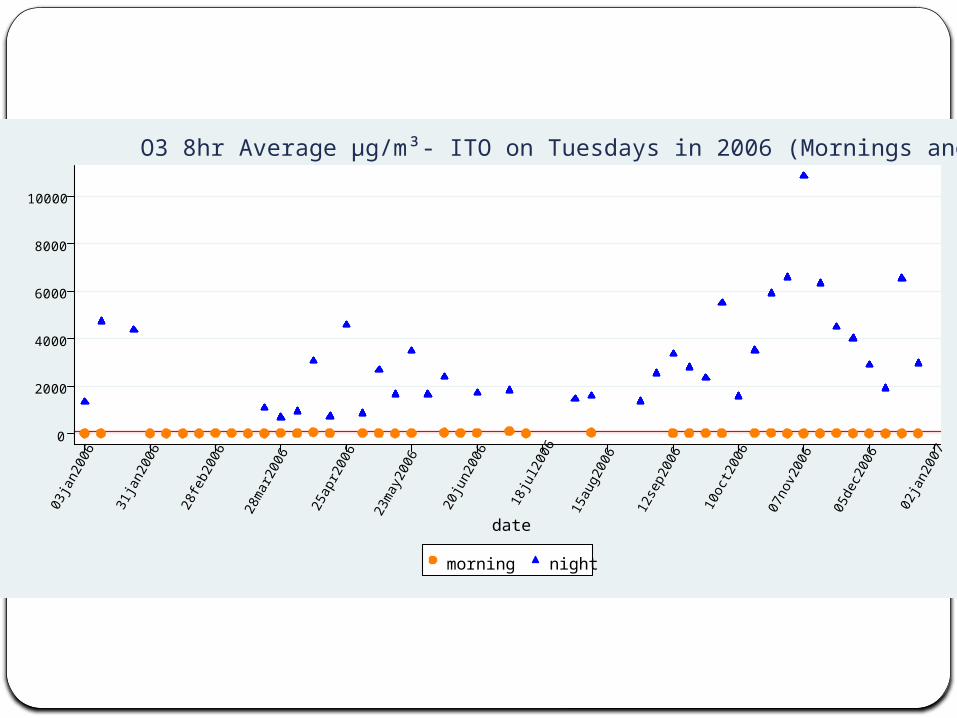
0
2000
4000
6000
8000
10000
03ja
n200
6
31ja
n200
6
28fe
b200
6
28m
ar20
06
25ap
r200
6
23m
ay20
06
20ju
n200
6
18ju
l200
6
15au
g200
6
12se
p200
6
10oc
t200
6
07no
v200
6
05de
c200
6
02ja
n200
7
date
morning night
O3 8hr Average µg/m³- ITO on Tuesdays in 2006 (Mornings and Nights)
Main Contributions
First study to econometrically analyze the effect of the Delhi Metro (DM) on air quality in Delhi
We identify the effect of several extensions of the DM rail network
We determine the cumulative effect of DM over a fifteen month period
Summary of Main Results
DM led to statistically significant decline in two main vehicular pollutants, nitrogen dioxide and carbon monoxide Suggestive of a traffic diversion effect

Rest of the Presentation
Identification Strategy
Graphical Presentation of Identification
Estimation Results
Robustness Checks
Conclusions
Identification StrategyOLS suffers from upward biasRegression Discontinuity Design
Outcome variable: Hourly air pollutant measure
Treatment: Operation of Delhi MetroAssignment Variable: Time
Main Identifying AssumptionIn the absence of the metro rail
extension, conditional on weather, we would observe a smooth time trend for the pollutant measure (Chen and Whalley, 2012)

Econometric Framework
Suppose is pollution in the absence of metro,
is pollution in the presence of metro.
tt
tt
t
YY
YY
tPYE
01
01
0 )(')(
tY0 tY1
This leads to the regression,
ttt DMtPY )('where
TtDM
TtDM
t
t
,0
,1
is when metro was extended
T

(Rough) Graphical Presentation of
Identification Strategy

100000
200000
300000
400000
500000
aver
age
daily
rid
ersh
ip
2004m3 2004m12 2005m7 2005m12 2006m4 2006m11year_month
2004
m1
2004
m4
2004
m7
2004
m10
2005
m1
2005
m4
2005
m7
2005
m10
2006
m1
2006
m4
2006
m7
2006
m10
2007
m1
2007
m4
year_month
Monthwise Average Daily Metro Ridership, 2004-2006

-20
0
20
40
60
80
%ch
ange
in a
vera
ge d
aily
rid
ersh
ip
2004m3 2004m12 2005m7 2005m12 2006m4 2006m11year_month
2004
m1
2004
m4
2004
m7
2004
m10
2005
m1
2005
m4
2005
m7
2005
m10
2006
m1
2006
m4
2006
m7
2006
m10
2007
m1
2007
m4
year_month
Monthwise Percentage Change in Average Daily Metro Ridership, 2004-2006

NO2 at ITO, Blue Line Second Extension4
4.5
55.
5
08oct2006 29oct2006 19nov2006 10dec2006date
Fitted values lno2ito_dailyavg
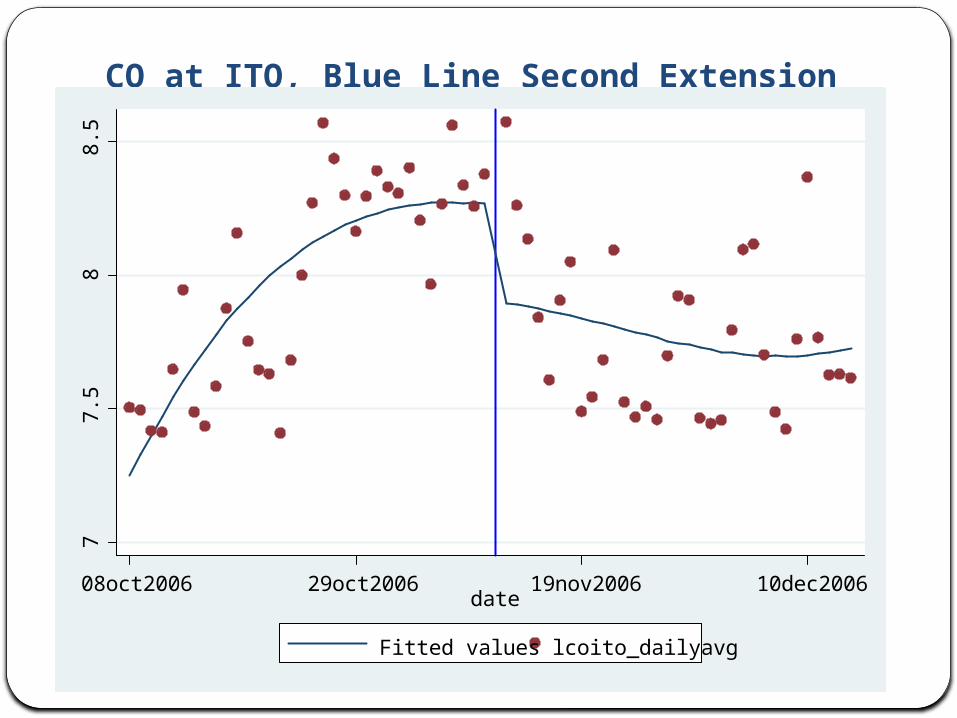
CO at ITO, Blue Line Second Extension7
7.5
88.
5
08oct2006 29oct2006 19nov2006 10dec2006date
Fitted values lcoito_dailyavg
EstimationData and Regression Results

Data and Study PeriodCPCB: Hourly Pollution Data from three different Monitoring Stations in Delhi (ITO, Sirifort, DCE)Four criterion pollutants: NO2, SO2, CO and O3
IMD: Hourly weather data for Delhi Temperature, Relative humidity, Rainfall and
Wind speedDMRC: Monthly Ridership Data
Overlapping data on pollution and weather only available for 2004-2006
Pollution data also suffers from missing observations
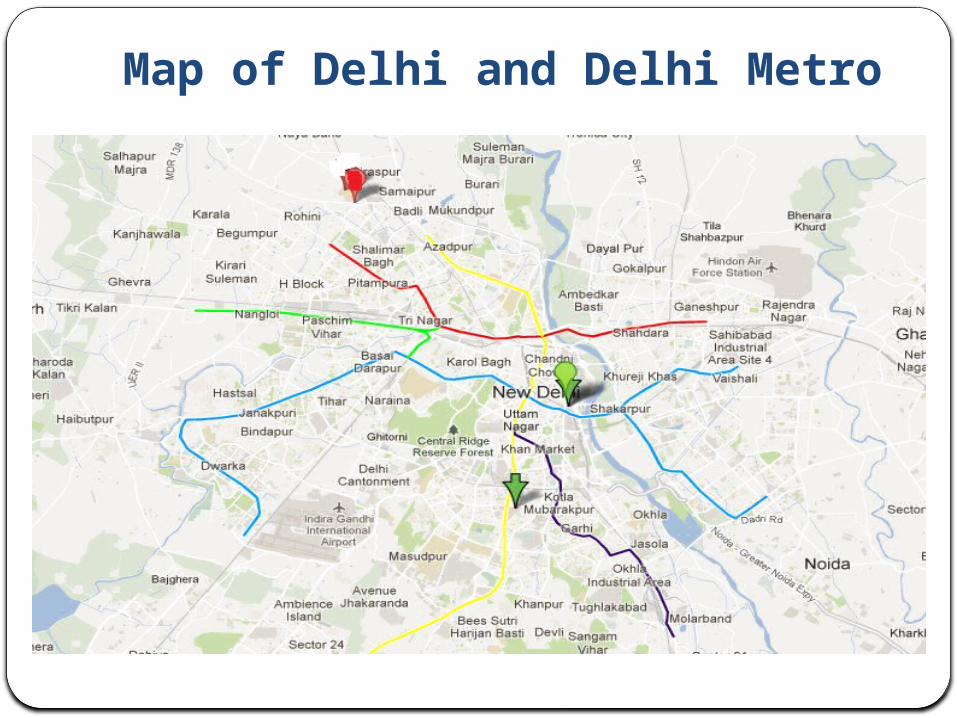
Map of Delhi and Delhi Metro
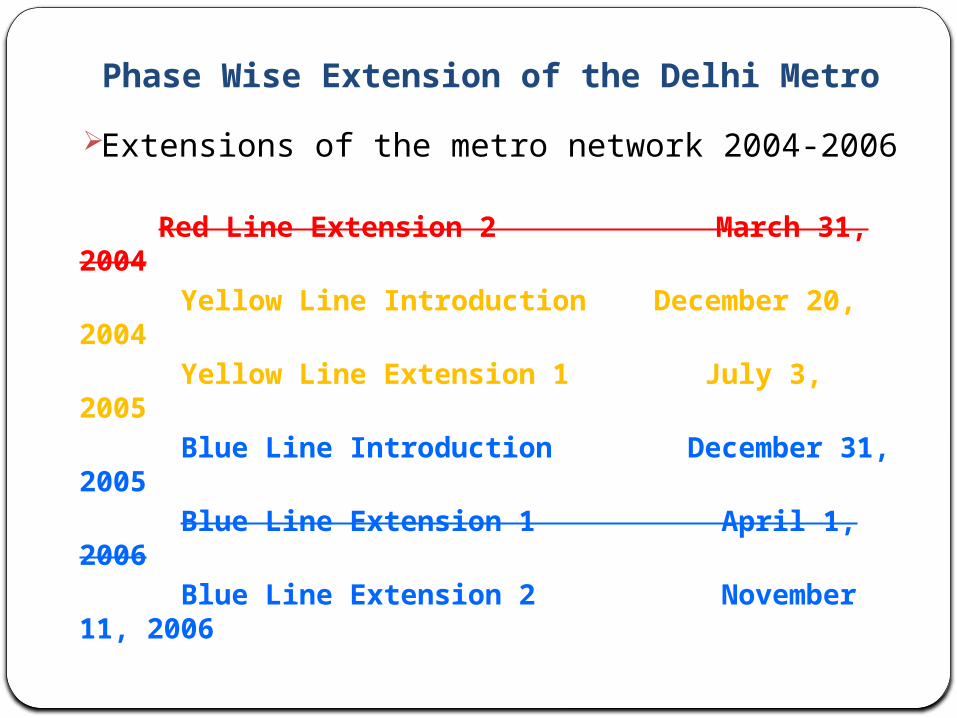
Phase Wise Extension of the Delhi Metro
Extensions of the metro network 2004-2006
Red Line Extension 2 March 31, 2004
Yellow Line Introduction December 20, 2004
Yellow Line Extension 1 July 3, 2005 Blue Line Introduction December 31,
2005 Blue Line Extension 1 April 1, 2006 Blue Line Extension 2 November
11, 2006

Estimation Equation
tttt u+P(t)'+x'+DM+=Y tY Observed Pollutant measure in logs
tDM 1 for time periods after extension and 0 otherwise
tx Quartic in current and 1 hour lags of humidity, rainfall, temperature, and wind speed ; hour of the day; weekday; and their interactions
P(t) Third order polynomial in time
Estimate for each extension of DM:
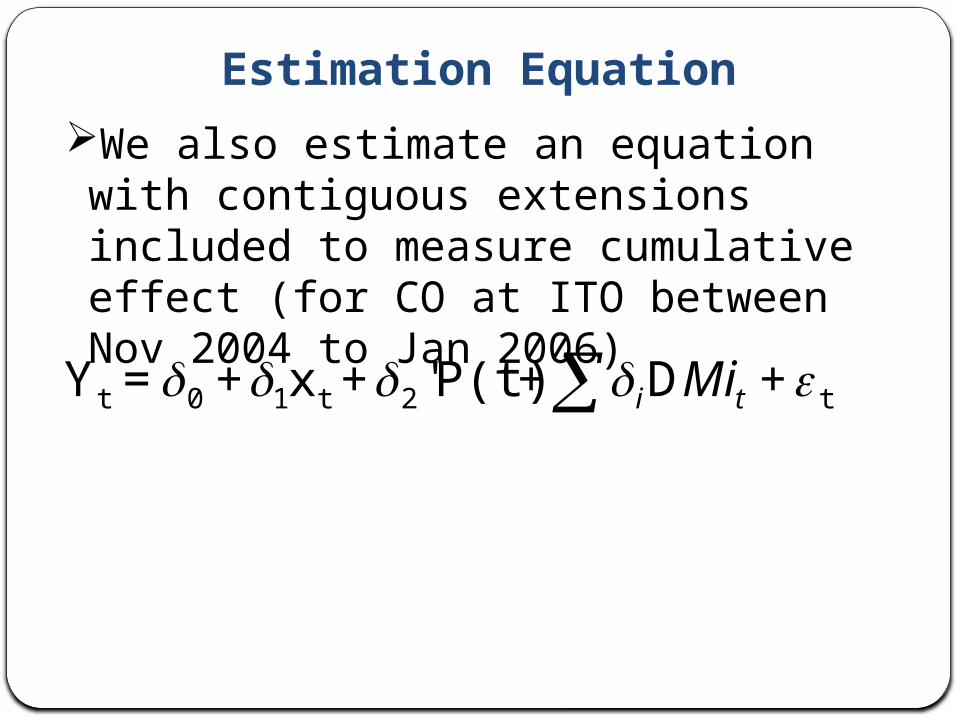
t2t10t +D+P(t)'+x+=Y ti Mi
We also estimate an equation with contiguous extensions included to measure cumulative effect (for CO at ITO between Nov 2004 to Jan 2006)
Estimation Equation

Missing Pollution Data
Focus on only those extensions that have at least four weeks of data on each side of the extension, with no more than 20 percent of observations missing
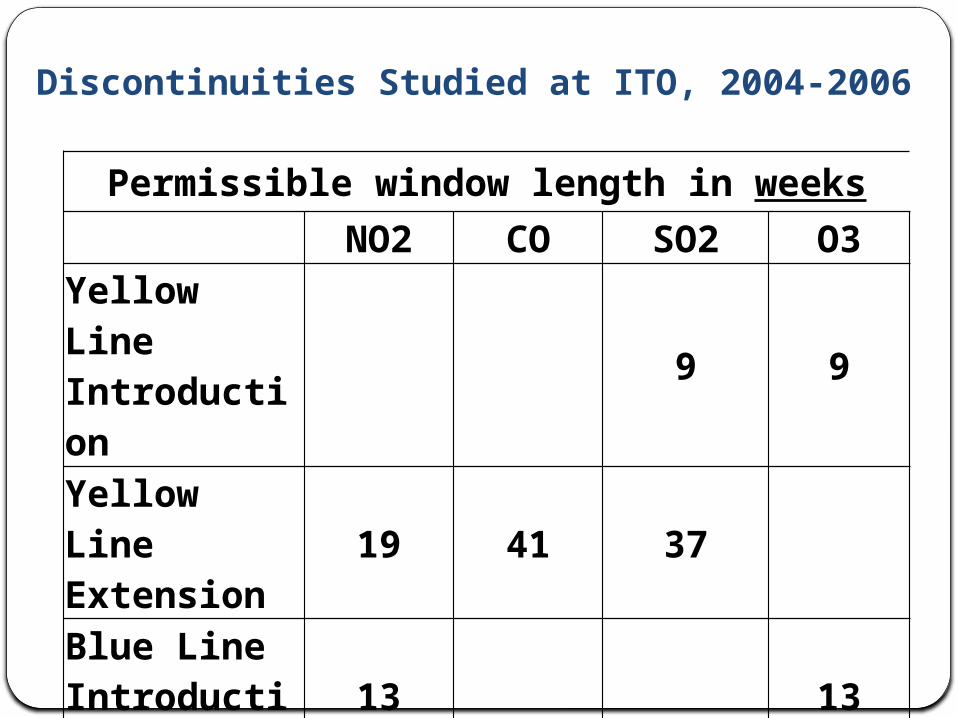
Discontinuities Studied at ITO, 2004-2006
Permissible window length in weeksNO2 CO SO2 O3
Yellow Line Introduction
9 9
Yellow Line Extension 19 41 37
Blue Line Introduction
13 13
Blue Line Extension 2
13 13 9
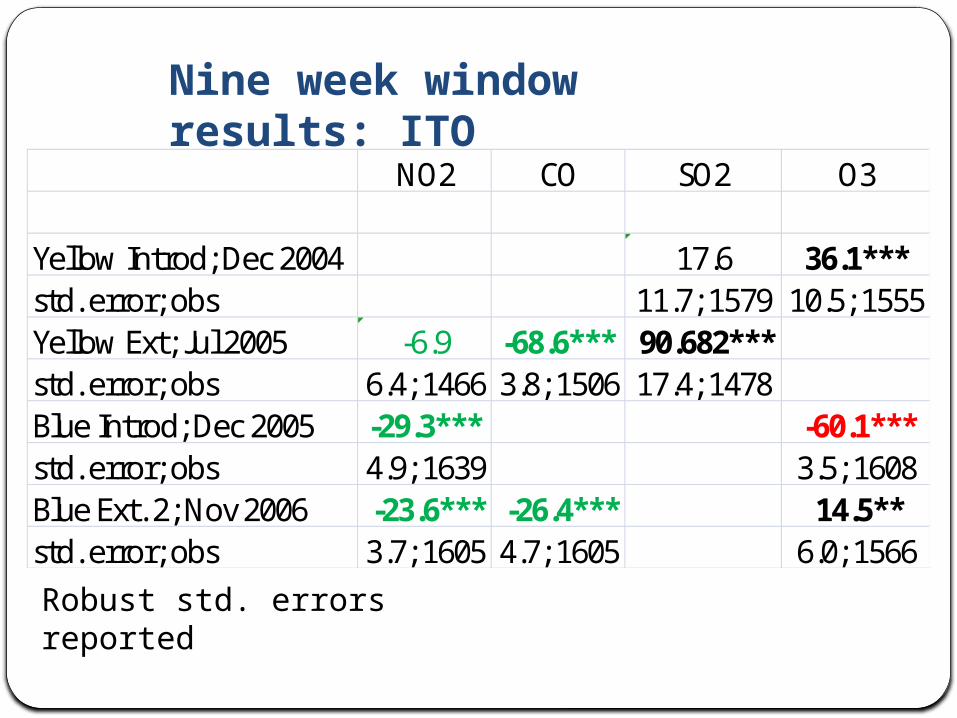
Nine week window results: ITO
NO2 CO SO2 O3
Yellow Introd; Dec 2004 17.6 36.1***std. error; obs 11.7; 1579 10.5; 1555Yellow Ext; Jul 2005 -6.9 -68.6*** 90.682***std. error; obs 6.4; 1466 3.8; 1506 17.4; 1478Blue Introd; Dec 2005 -29.3*** -60.1***std. error; obs 4.9; 1639 3.5; 1608Blue Ext. 2; Nov 2006 -23.6*** -26.4*** 14.5**std. error; obs 3.7; 1605 4.7; 1605 6.0; 1566
Robust std. errors reported

Nine week window results: Siri Fort
NO2 CO SO2 O3Yellow Introd; Dec 2004 -39.9*** -89.2*** 27.5**std. dev; obs 2.7; 1555 1.6; 1571 12.1; 1572Yellow Ext; Jul 2005std. dev; obsBlue Introd; Dec 2005 std. dev; obsBlue Ext. 2; Nov 2006 -37.3*** -22.0*** -34.6***std. dev; obs 3.5; 1601 6.3; 1532 5.2; 1557
Robust std. errors reported

Cumulative Effect for the period Nov 2004 to Jan 2006: CO at ITO
CO
Yellow Introd; Dec 2004 -15.4**std. error 6.6Yellow Ext; Jul 2005 -33.3***std. error 3.3Blue Introd; Dec 2005 -31.9***std. error 6observations 9914Robust std. errors reported
RD Design Validity
Other DiscontinuitiesShorter Window
Artificial Discontinuities TestAppropriate Polynomial OrderNon parametric or Local Linear Regression
RD Design Validity: Robustness Checks
Other DiscontinuitiesConstruction activity undertaken to
build DMRegulation that might cause
discontinuous changeManipulation of choice of extension
date
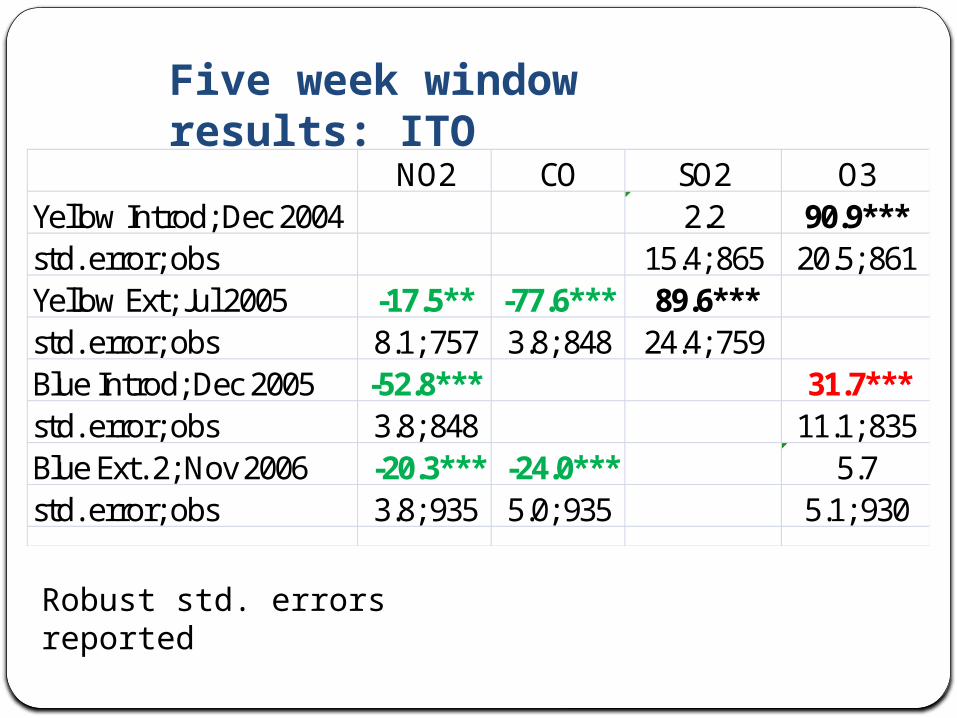
Five week window results: ITO
NO2 CO SO2 O3Yellow Introd; Dec 2004 2.2 90.9***std. error; obs 15.4; 865 20.5; 861Yellow Ext; Jul 2005 -17.5** -77.6*** 89.6***std. error; obs 8.1; 757 3.8; 848 24.4; 759Blue Introd; Dec 2005 -52.8*** 31.7***std. error; obs 3.8; 848 11.1; 835Blue Ext. 2; Nov 2006 -20.3*** -24.0*** 5.7std. error; obs 3.8; 935 5.0; 935 5.1; 930
Robust std. errors reported

Five week window results: Siri Fort
Robust std. errors reported
NO2 CO SO2 O3Yellow Introd; Dec 2004 -29.4*** -76.9*** -8.5std. dev; obs 4.4; 842 3.7; 854 12.4; 853Yellow Ext; Jul 2005std. dev; obsBlue Introd; Dec 2005 std. dev; obsBlue Ext. 2; Nov 2006 -34.2*** -21.9*** -25.3***std. dev; obs 3.4; 934 6.5; 871 5.2; 901
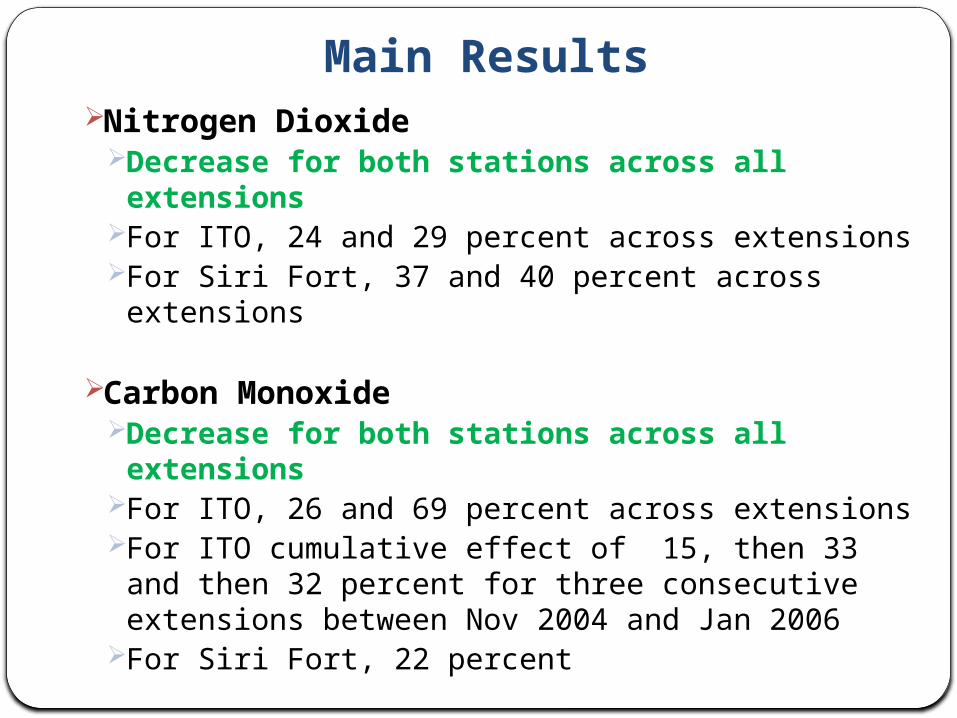
Main ResultsNitrogen Dioxide
Decrease for both stations across all extensions
For ITO, 24 and 29 percent across extensionsFor Siri Fort, 37 and 40 percent across extensions
Carbon MonoxideDecrease for both stations across all extensions
For ITO, 26 and 69 percent across extensionsFor ITO cumulative effect of 15, then 33 and
then 32 percent for three consecutive extensions between Nov 2004 and Jan 2006
For Siri Fort, 22 percent

Main ResultsSulphur Dioxide
For ITO, increase (90 percent)For Siri Fort, decrease (35 to 89 percent
across extensions)
OzoneFor ITO, sign flips across extensions for 9
week window(increase across extensions for 5 week window)
For Siri Fort, increase for 9 week window(insignificant for 5 week window)

Work Ahead Artificial discontinuities Test
Smoothness tests for residuals after controlling for weather
Different orders of time polynomial (AIC criteria)Non parametric Estimation with optimal bandwidth
Better Understand SO2 and O3 resultsObtain additional data
Vehicular registrations to support traffic diversion effect
Power generation by coal based power plants within Delhi


![SONAM TERM1[1]](https://img.pdfslide.us/doc/110x75/577d24b01a28ab4e1e9d1bc4/sonam-term11.jpg)