Embed Size (px)
Citation preview
* Corresponding author. Tel +358 9 191 58458; fax +358 9 191 58460 E-mail address: [email protected] (Eero Puolanne).
1
2
3
4
5
6
7
8
9
10
11
12
13
14
15
16
17
18
19
20
21
The effect of the cooling rate of beef: the significance of pH at
7 °C in relation to tenderness
Tapio Hannulaa and Eero Puolanne*
Department of Food Technology, Viikki E, PO Box 27, University of Helsinki, FIN 00014 Helsinki, Finland
a)Present address: HK-Ruokatalo Ltd, PO Box 49, FIN 01511 Vantaa, Finland
Abstract
To study the effects of cooling regime on beef tenderness, seven commercial beef
slaughterhouses with different cooling regimes were selected to obtain different carcass
cooling rates. The pH values and temperatures of 8 M. longissimus dorsi (LD) and M.
semimembranosus (SM) muscles from each slaughterhouse were monitored for 30 h. The
muscles of the monitored carcasses were excised and vacuum packed for Allo-Kramer shear
force (SF) determinations. Samples were kept at 3-4 °C for 5 or 21 d.
The slaughterhouses were grouped by their average pH values of the muscles, prevailing at the
moment when the temperature of the muscles reached 7 °C. The pH groups for LD were (i)
low (5.52-5.63) (ii) medium (5.84-5.97) and (iii) high (6.16-6.17). The highest shear forces
were in group (iii), being the toughest: 155 and 152 N/g, and the lowest in group (i) (the most
tender): 108 and 116 N/g, respectively. The regression equation for the shear force was SF= -
295.4 + 73.0*(pH at 7 °C); (R
1
2
3
4
5
6
7
8
9
10
11
12
13
2= 87%). There was no significant correlation between the
cooling rate and tenderness in SM, indicating that it is difficult to control the tenderness of all
the muscles by the same cooling regime. The ageing effect was more marked and the variation
in the shear forces smaller in the slaughterhouses with low pH values at 7 °C than in those
with the high ones.
It was concluded that a low cooling rate, or more specifically, the temperature/pH at the onset
of rigor mortis, is important for beef tenderness. The pH of LD must fall to values below 5.7
before/when the temperature reaches 7 °C.
Keywords: Cooling rate, pH, beef tenderness
2
1
2
3
4
5
6
7
8
9
10
11
12
13
14
15
16
17
18
19
20
21
22
23
Introduction
According to Miller et al., (1996) there are four main factors influencing the tenderness of
meat: 1) muscle shortening (the state of the actomyosin complex), 2) ageing (the action
enzymes [under longer period of time]), 3) the contents of connective tissue, and 4) marbling.
Toughness/tenderness is, however, much more complex (Dutson, review 1977; Greaser,
review 1986). There is increasing knowledge about the importance of the perimortal
phenomena which take place before the carcass has reached the ultimate temperature during
the cooling. The effects of calpains and their inhibitors immediately post mortem, all
depending on pH and temperature, have an influence on the tenderness (Dransfield,
review1994; Koohmaraie, 1996). Also the time of excision of muscles (meat) from bones
shoud take place two days post mortem or later (Taylor and Richardson 1998).
The phenomenon 'cold shortening' or 'cold induced toughening' has been intensively studied
since the 1960s (Locker, 1985). The great majority of the studies has dealt with beef and
lamb, and to a much lesser extend with pork and poultry. Bendall (1973a) recommended that
a beef carcass should not be cooled to below 12 °C faster than in 15 h, i.e. before the
completion of rigor mortis. He had suggested earlier a rule of thumb "The temperature should
not be below 10 °C faster than in 10 h". Olsson, Herzman and Tornberg (1994) suggested the
temperature of 7 °C as the upper limit for cold shortening.
The susceptability for cold shortening varies between animal species and between the muscle
types, predominantly red muscles being more susceptible than the white ones (Bendall,
3
1
2
3
4
5
6
7
8
9
10
11
12
13
14
15
16
17
18
19
20
21
22
23
24
1973a). Depending on the animal species and the location of the muscle, the time-temperature-
pH combinations are different in different muscles and also different in the different parts of
the same muscle. Puolanne and Ruusunen (1999) have also shown that in fixed muscle strips
the cold-induced shortening causes a lengthening of the sarcomeres in the warmer regions of
the muscle, especially in areas where the ATP consumption and consequently the rate of pH
fall are low (i.e. at about 15 ºC). Consequently, tenderness as well as shortening may vary in
different parts of the muscle. Therefore, conclusions for the whole carcass must be more or
less arbitrary, which renders it impossible to give exact recommendations for cooling to obtain
tender meat in each part of the carcass. It seems, however, that cold shortening and cold
toughening are not the same thing, but they may be inter-related: when carcasses are cooled
quickly, they may or may not shorten and became tough. However, cold induced toughening
is not always connected with shortening, which suggests the importance of proteolytic factors.
There is some evidence that the pH value/temperature combinations at the onset of rigor
mortis are of importance. Bendall (1973a) reviewed studies of cold shortening. The rate of
ATPase activity decreases with decreasing temperature between 38-0 ºC. It has also been
shown that the calcium binding capacity of the sarcoplasmic reticulum decreases strongly at
temperatures below 10 ºC, if the pH value is lower than 6.6 (Kanda, Pearson and Merkel,
1977). The content of free Pi is also relevant: at low contents, when ATP is still regenerated,
the calcium retention is higher than close to the onset of rigor, when the Pi content is ten times
higher (Newbold and Tume, 1977). Honikel, Ronchalés and Hamm (1983) showed that
bovine M. sternomandibularis is able to shorten several times, when cooled to 0 ºC, and relax
again, when warmed up to 20 ºC. Bendall (1973a) showed that at 2 ºC the cold shortening
creates in M. longissimus dorsi a work of 0.4 mJ/g, but the rigor shortening produces 3.1 mJ/g.
4
1
2
3
4
5
6
7
8
9
10
11
12
13
14
15
16
17
18
19
20
21
22
23
24
This means that the rigor shortening (formation of rigor) is far more important than the cold
shortening which takes place at higher pH values and ATP contents. In addition, the
formation of rigor mortis at low temperatures is more likely, in relation to the whole muscle
mass, than cold shortening that takes place usually only in the surface areas of the muscles of
beef carcasses. Finally, cooling regimes that cause cold shortening may later also cause cold
toughening due to rigor shortening, unless the temperatures are not elevated during the later
periods of cooling, as is done in some industrial practices (unpublished information from
slaughterhouses). The content of free calcium is very much based on the temperature and to a
lesser degree on the pH value (Kanda, Pearson & Merkel, 1977)
Goll, Geesink, Taylor and Thompson (1995) have presented a hypothesis that a shortening as
such does not cause the toughening, but it is caused by the circumstances prevailing during the
shortening. Locker and Daines (1976) moved beef muscles cooled 48h at 2 ºC but still in pre
rigor state, to 37 ºC and cooled them again after the onset of rigor. The treatment caused a
shortening of 30% compared to muscles kept at 15 ºC at rigor, but the meat was more tender
than muscles kept all the time at 2 ºC. According to Koohmaraie (review 1996) this is due to
the effects of differetn activities of proteolytic ezymes. Lochner, Kauffman and Marsh
(1980), Heinze, Naudé and van Rensburg (1986), Dransfield, Wakefield and Parkman (1992),
Olsson, Herzman and Tornberg (1994) and Bekken, Berg, Frøystein and Hildrum (1996) have
also shown that low temperatures at the end of the cooling cause a marked toughening of
meat, irrespective of the degree of (cold) shortening.
Based on the studies cited above it was assumed that the cooling regime should be selected
based on the pH-temperature course of the carcass, especially in those muscles that are usually
5

1
2
3
4
5
6
7
8
9
10
11
12
13
14
15
16
17
18
19
20
21
22
23
used as whole meat meals, such as steaks etc. To test the hypothesis formulated on the basis of
laboratory type studies we selected seven beef slaughterhouse with different cooling regimes
and measured the relationship between the rates of pH-fall and temperature fall, and
tenderness.
Materials and methods
Selection of the study material. Before the study all approved industrial beef slaughterhouses
in Finland (14) were questioned about their cooling regimes. On the basis of the interviews, 7
slaughterhouses which were most different from each other were selected for further studies.
Because the confidentiality of the interviews the details of the cooling system are not given,
except the cooling rate (Table 1).
Samples. In each of the selected seven slaughterhouses, 8-20 bull carcasses (in total 100) were
studied for their pH and temperature fall. The age of bulls was 18-20 months and the carcass
weight was on average 259 kg (standard deviation 38 kg). The temperature an pH
measurements were made from M. longissimus dorsi by the 13th vertebra and in M.
semimembranosus caudally above the pelvis (Os coxae).
Eight carcasses from each slaughterhouse were selected for tenderness measurements. From
each carcass longissimus dorsi and semimembranosus muscles were removed, vacuum
packaged and kept at 3-4 °C for 5 or 21 days. pH and temperature measurements were done
from the other side, and the intact muscles from the other side were used for tenderness
6

1
2
3
4
5
6
7
8
9
10
11
12
13
14
15
16
17
18
19
20
21
22
23
24
measurements. No muscles having a pHu higher than 5.80 were included. After a storage
period of 5 days, packages were opened and the samples were cut into two parts. One half
was used for tenderness measurements (shear force measurements and sensory evaluation),
and the other half was vacuum packaged again and kept for another 16 days for respective
analysis.
Temperature. The temperatures of the carcasses during cooling were measured by a KM 25
Foodcheck Thermometer (Comarck Ltd, England). The probe was adjusted to penetrate 40
mm deep from the surface. The first measurement was made at the time of weighing (time
0.00) which took place about 40 minutes after stunning. The measurements were repeated at
every 2 ... 8 hours (in the beginning more frequently than in the end of the period) until about
30 hours, when the cooling was completed and carcasses moved to a storage room.
pH-value. The samples for pH measurements were taken, at the same time when also the
temperature was measured, with a biopsy needle from a depth of 40 mm, close to the point
where the temperature reading was obtained. The sample (about 0.1 g) was inserted into a 1.5
ml Eppendorf tube with 0.9 ml sodium iodine acetate (5 mmol/l Na-I acetate and 150 mmol/l
KCl; Bendall, 1973b). The muscle sample was disrupted with a glass rod. The pH was
measured by Knick Portamess 752 Calimatic pH meter (Knick Elektronische Meβgeräte
GmbH, Germany) with Xerolyte Inlab 427 electrode.
Testing the shear force measurement. The correlation between sensory evaluations and Allo-
Kramer/Instron measurements was tested (Smith, Lyon and Fletcher, 1988). Previously in our
laboratory Warner-Bratzler shear force has been used for beef, but the Allo-Kramer method
7

1
2
3
4
5
6
7
8
9
10
11
12
13
14
15
16
17
18
19
20
21
22
23
24
for poultry. A panel of 9 experienced persons evaluated the tenderness of (method described
below) M. longissimus dorsi, semimembranosus, semitendinosus and infraspinatus, after
ageing for 21 days. The total correlation between means of the sensory evaluations and Allo-
Kramer/Instron measurements was 0.96, and the correlations between the means within the
individual muscles ranged from 0.70 (M. infraspinatus) to 0.99 (M. semimembranosus).
Shear force measurements. Muscle samples were cut into 30 mm thick pieces across the fibre
axis. The samples were packaged individually into small vacuum packages. They were
cooled to 4 °C and then cooked for 26 minutes at 80 °C to reach a core temperature of 71-75
°C and then cooled to 4 °C (AMSA, 1995). The shear force measurements were made by
Instron Model 6625 (Instron Co, USA). The shear force measurements and sensory
evaluations were performed within four days.
From the cooked samples 4-6 pieces of 30 mm *10 mm * thickness of the sample (before
cooking 30 mm) were cut. The pieces were weighed and then placed on an Allo-Kramer shear
shell and cut across the fibre axis. The results are given in Newtons/g cooked sample.
Sensory evaluation. About 6 mm thick samples, cut across the fibre axis, were given to the
panel members. The 11 panel members were experts in the evaluating of meat tenderness.
There were first 6 training sessions and then 28 sample sessions. For each session 2*4
samples were evaluated. The tenderness was rated on graphical intensity scale. The
evaluation form was a 140 mm long line, anchored at both ends (0=tough … 140=tender).
The assessors were asked to put a mark on the spot as she/he evaluated the sample.
8
Statistical analysis. The data were treated with Microsoft Excel 97 and tested with
Statsgraphic Plus 3.0. One-way analysis of variance, least significant differences and
regression equations were calculated.
1
2
3
4
5
6
7
8
9
10
11
12
13
14
15
16
17
18
19
20
21
22
23
Results and discussion
The pH-temperature curves of different carcasses in the same slaughterhouse were very
different during cooling (data not shown). Several different cooling rate/pH indicator values
were calculated on the basis of the primary data, but only the pH-temperature combination that
gave the best fit (the highest correlation with shear force) is reported. It was possible to find
significant differences in time/temperature curves and in pH values between the
slaughterhouses as shown in Table 1. M. semimembranosus cooled slower than M.
longissimus dorsi, and therefore indicator values are given for both muscles.
The average time to reach 20 °C in M. semimembranosus was 7 h 20 minutes, and there was a
significant difference between the slaugterhouses (p<0.001; Table 1). The shortest time to
cool to 20 °C was 5 h 56 min, and the longest 9 h 41 min. The lowest temperature by 24 h
were in 4 °C and the highest 10 °C, respectively, differing significantly between the
slaughterhouses (p<0.05). When the temperature was 20 °C, the pH of individual muscles
varied between 5.46 - 6.05.
The average time to reach 10 °C in M. longissimus dorsi was 7 h 45 min (4 h 25 min - 10 h 24
min. Five of seven slaughterhouses differed from each other (p< 0.05). When the temperature
9
was 7 °C, the pH was on average 5.89 and varied between 5.52 - 6.17. The slaughterhouses
formed three different groups, based on the pH at 7 ° C (p< 0.05; Table 1). In some
slaughterhouses the pH was close to the pH
1
2
3
4
5
6
7
8
9
10
11
12
13
14
15
16
17
18
19
20
21
22
23
24
u, but in some others only about a half of the pH
fall had taken place.
During that period the shear forces decreased 18% (M. longissimus dorsi) and 8% (M.
semimembranosus). By sensory evaluation the tenderness increased 24% and 0%,
respectively. (Results not shown).
Because the correlations between shear force measurements and sensory evaluation within the
slaughterhouses were on average -0.85 ranging from -0.78 to -0.85 for M. longissimus dorsi,
only the shear force measurements are discussed later. In M. semimembranosus the changes
were smaller and the correlations were lower, being -0.69 on average, and none or hardly any
tenderisation was found by ageing. Therefore, M. semimembranosus will not be discussed any
further below.
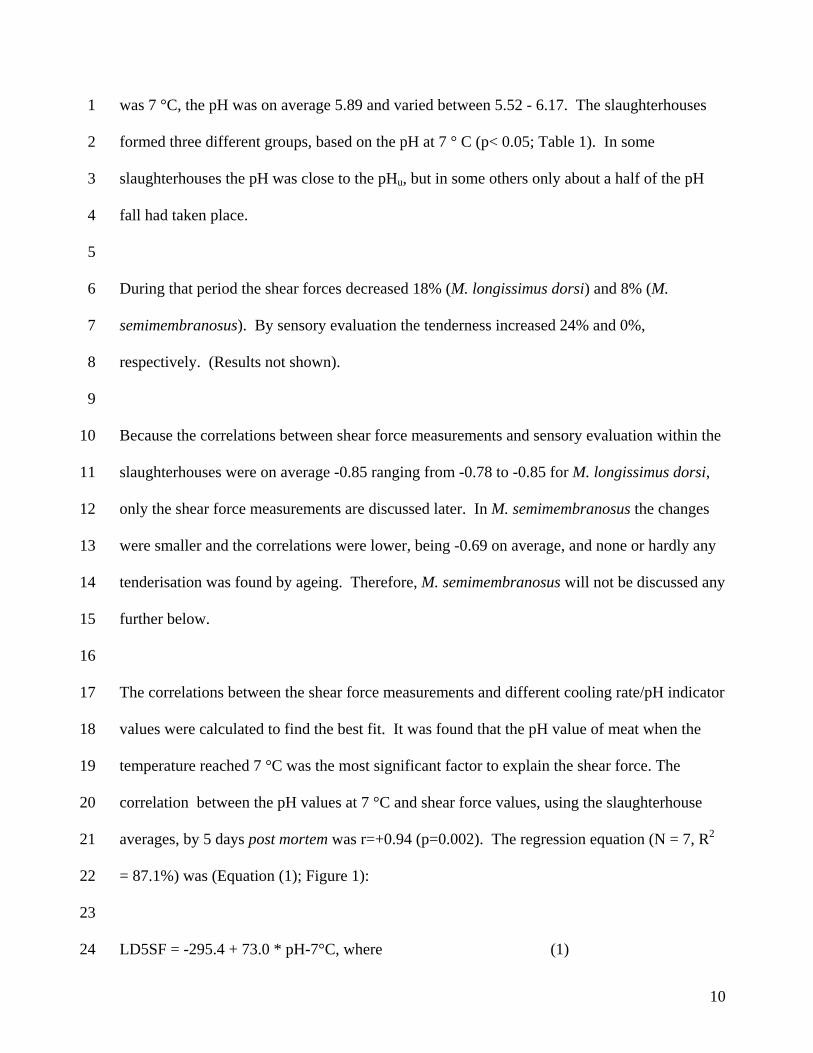
The correlations between the shear force measurements and different cooling rate/pH indicator
values were calculated to find the best fit. It was found that the pH value of meat when the
temperature reached 7 °C was the most significant factor to explain the shear force. The
correlation between the pH values at 7 °C and shear force values, using the slaughterhouse
averages, by 5 days post mortem was r=+0.94 (p=0.002). The regression equation (N = 7, R2
= 87.1%) was (Equation (1); Figure 1):
LD5SF = -295.4 + 73.0 * pH-7°C, where (1)
10
1
2
3
4
5
6
7
8
9
10
11
12
13
14
15
16
17
18
19
20
21
22
23
24
LD5SF = shear force of M. longissimus dorsi at 5 days post mortem
pH-7°C = the pH value when the temperature reached 7 °C.
By 21 days post mortem the respective values were r= +0.84 (p = 0.017) and for the regression
equation R2 = 71.0% (N = 7). If the correlations (r=0.50; p = 0.0002) were calculated by
individual carcasses, the equation was LD5SF = -124.3 + 43.8 * pH-7°C (N = 56, R2 =
25.0%). The results that are based on the slaughterhouse averages are practically more
important, because the cooling process cannot be controlled for individual carcasses.
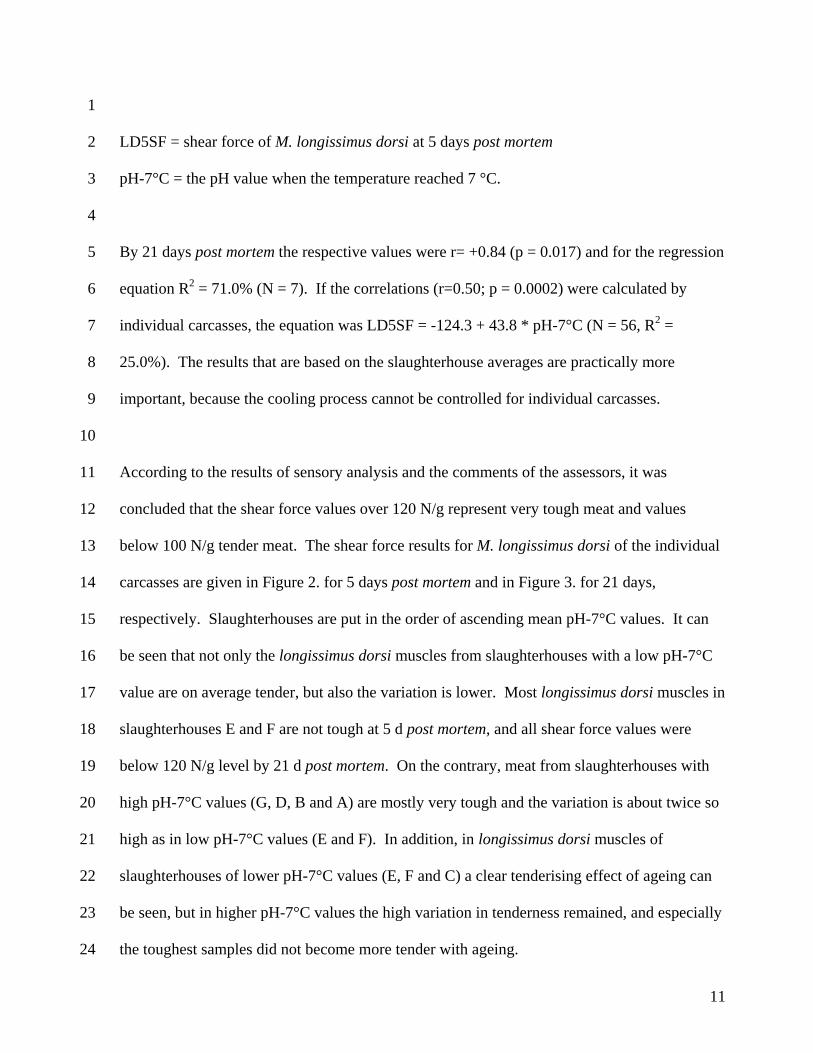
According to the results of sensory analysis and the comments of the assessors, it was
concluded that the shear force values over 120 N/g represent very tough meat and values
below 100 N/g tender meat. The shear force results for M. longissimus dorsi of the individual
carcasses are given in Figure 2. for 5 days post mortem and in Figure 3. for 21 days,
respectively. Slaughterhouses are put in the order of ascending mean pH-7°C values. It can
be seen that not only the longissimus dorsi muscles from slaughterhouses with a low pH-7°C
value are on average tender, but also the variation is lower. Most longissimus dorsi muscles in
slaughterhouses E and F are not tough at 5 d post mortem, and all shear force values were
below 120 N/g level by 21 d post mortem. On the contrary, meat from slaughterhouses with
high pH-7°C values (G, D, B and A) are mostly very tough and the variation is about twice so
high as in low pH-7°C values (E and F). In addition, in longissimus dorsi muscles of
slaughterhouses of lower pH-7°C values (E, F and C) a clear tenderising effect of ageing can
be seen, but in higher pH-7°C values the high variation in tenderness remained, and especially
the toughest samples did not become more tender with ageing.
11
1
2
3
4
5
6
7
8
9
10
11
12
13
14
15
16
17
18
19
20
21
22
23
24
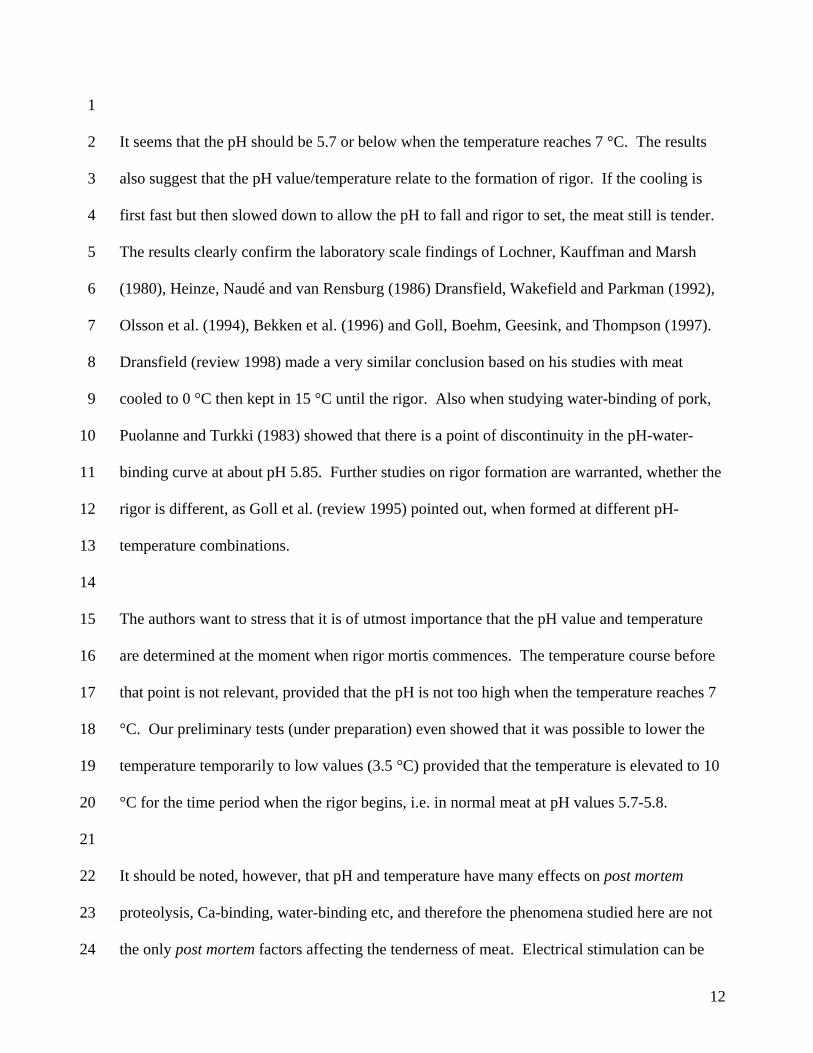
It seems that the pH should be 5.7 or below when the temperature reaches 7 °C. The results
also suggest that the pH value/temperature relate to the formation of rigor. If the cooling is
first fast but then slowed down to allow the pH to fall and rigor to set, the meat still is tender.
The results clearly confirm the laboratory scale findings of Lochner, Kauffman and Marsh
(1980), Heinze, Naudé and van Rensburg (1986) Dransfield, Wakefield and Parkman (1992),
Olsson et al. (1994), Bekken et al. (1996) and Goll, Boehm, Geesink, and Thompson (1997).
Dransfield (review 1998) made a very similar conclusion based on his studies with meat
cooled to 0 °C then kept in 15 °C until the rigor. Also when studying water-binding of pork,
Puolanne and Turkki (1983) showed that there is a point of discontinuity in the pH-water-
binding curve at about pH 5.85. Further studies on rigor formation are warranted, whether the
rigor is different, as Goll et al. (review 1995) pointed out, when formed at different pH-
temperature combinations.
The authors want to stress that it is of utmost importance that the pH value and temperature
are determined at the moment when rigor mortis commences. The temperature course before
that point is not relevant, provided that the pH is not too high when the temperature reaches 7
°C. Our preliminary tests (under preparation) even showed that it was possible to lower the
temperature temporarily to low values (3.5 °C) provided that the temperature is elevated to 10
°C for the time period when the rigor begins, i.e. in normal meat at pH values 5.7-5.8.
It should be noted, however, that pH and temperature have many effects on post mortem
proteolysis, Ca-binding, water-binding etc, and therefore the phenomena studied here are not
the only post mortem factors affecting the tenderness of meat. Electrical stimulation can be
12
1
2
3
4
5
6
7
8
9
10
11
12
13
14
15
16
17
18
19
20
21
22
used to increase the rate of the pH fall, but this will not necessarily produce more tender meat
by very fast chilling of all muscles, although the pH is low before low temperatures have been
reached. Tenderness would further benefit if the carcass are not cut before 48 h p.m.
(Eikelenboom and Smulders, 1998; Taylor and Richardson, 1998). - All evidence points to the
fact that there is no single factor explaining/controlling the tenderness of meat.
It can be concluded that when beef carcasses are cooled very fast to reduce the proliferation of
harmful surface microbes, the meat seems to be more tender and the ageing more effective if
the carcasses are kept at elevated (meat) temperatures (above 7-10 °C) until the onset of rigor,
i.e. pH 5.7. The pH-temperature relationship at the moment of the onset of rigor is the
decisive factor. The tenderness of all muscles of the carcasses cannot be controlled by the
same cooling regime.
References
AMSA (1995). Research guidelines for cookery, sensory evaluation and instrumental
tenderness of fresh meat. American Meat Science Association, Chicago.
Bekken, K. E., Berg, J., Frøystein, T. & Hildrum, K. I. (1996). Susceptibility of individual
beef carcasses to toughening by different chilling regimes. Proceedings of the 42nd
International Congress of Meat Science and Technology (pp. 392-393). Den Haag,
Holland.
Bendall, J. R. (1973a). The biochemistry of rigor mortis and cold-contracture. Proceedings of
the 19th European Meeting of Meat research Workers (pp 1-27). Paris, France.
13
Bendall, J. R. (1973b). Post mortem changes in muscle. In G. H. Bourne (ed.) Structure and
Function of Muscle (pp 244-309). London and New York: Academic Press.
1
2
3
4
5
6
7
8
9
10
11
12
13
14
15
16
17
18
19
20
21
22
23
Dransfield, E. (1994). Optimisation of tenderisation, ageing and tenderness. Meat Science,
36, 105-121.
Dransfield, E. (1998). Texture in very fast chilled beef. In: Dransfield, E & Ronchalés, P.
(ed.): Very Fast Chilling in Beef, 2. Muscle to Meat (pp. 17-22). EU Concerted Action
CT94-1881. University Bristol Press, Bristol, United Kingdom.
Dransfiel, E., Wakefield, D. K. & Parkman, I. D. (1992). Modelling post-mortem
tenderisation - 1: Texture of electrically stimulated and non-stimulated beef. Meat Science,
31, 57-73.
Dutson, T.R. (1977) Rigor onset before chilling. Proceedings of the 30th Annual Reciprocal
Meat Conference (pp. 79-86).
Eikelenboom, G. & Smulders, F. J. (1998) Research on electrical stimulation in the
Netherlands. In: Dransfield, E & Ronchalés, P. (ed.): Very Fast Chilling in Beef, 2. Muscle
to Meat (pp. 49-54). EU Concerted Action CT94-1881. University Bristol Press, Bristol,
United Kingdom.
Goll, D. E. , Boehm, M. L., Geesink, R. G. & Thompson, V. F. (1997). What causes
postmortem tenderization. Proceedings of the 50th Annual Reciprocal Meat Conference
(pp. 60-67).
Goll, D. E., Geesink, R. G., Taylor, R. G. & Thompson, V. F. (1995). Does proteolysis cause
all postmortem tenderization, or are other changes in the actin/myosin interaction involved?
Proceedings of the 41st International Congress of Meat Science and Technology (pp. 537-
544). San Antonio, USA.
14
Greaser, M.L. (1986) Conversion of muscle to meat. In : Muscle as Food, ed. P.J. Bechtel,
Academic Press, NY. (pp. 37-94).
1
2
3
4
5
6
7
8
9
10
11
12
13
14
15
16
17
18
19
20
21
22
Heinze, P. H., Naudé, R. T. van Rensburg, A. J. (1986). The effect of chilling temperature
and carcass mass on meat tenderness. Proceedings of 32nd European Meeting of Meat
Research Workers (pp. 95-98). Ghent, Belgium.
Honikel, K.O., Ronchalés, P. & Hamm, R. (1983). The influence of temperature on
shortening and rigor onset in beef muscle. Meat Science, 8, 221-241.
Kanda, T., Pearson, A. M. & Merkel, R. A. (1977). Influence of pH and temprature upon
calcium accumulation and release by bovine sarcoplasmic reticulum. Food Chemistry, 2,
253-266.
Koohmaraie, M. 1996. Biochemical factors regulating the toughening and tenderization
processes of meat. Meat Science, 43, 193-201.
Lochner, J. V., Kauffman, R. G. Marsh. B. B. (1980). Early-post-mortem cooling rate. Meat
Science, 4, 227-241.
Locker, R. H. (1985) Cold-induced toughness of meat. In Advances in Meat Research Vol. 1 -
Electric Stimulation, eds Pearson, A.M. & Dutson, T. R. AVI Publishing Co. Inc.
Westport, CT (pp. 1-44).
Locker, R.H. & Daines, G. J. (1976). Tenderness in relation to the temperature of rigor onset
in cold shortened beef. Journal of the Science of Food and Agriculture, 27, 193-196.
Miller, R. K., Taylor, J. F., Sanders, J. O., Lunt, D. K., Davis, S. K., Turner, J. W., Sawell, J.
W., Kallel, F., Ophir, J. & Lacey, R. E. (1997). Proceedings of the 49th Annual Reciprocal
Meat Research Conference (pp. 106-113).
15
Newbolt, R. B. (1980). Update: calcium uptake and release by skeletal muscle mitochondria
and sarcoplasmic reticulum. Proceedings of the 32
1
2
3
4
5
6
7
8
9
10
11
12
13
14
15
16
17
18
19
20
21
22
23
24
nd Annual Reciprocal Meat Conference
(pp 70-78). Brooking, South Dakota, USA.
Newbolt, R. B. & Tume, R. K. (1977). Effect of ortophosphate and oxalate on the cold
induced release of calcium from sarcoplasmic reticulum preparations from rabbit skeletal
muscle. Australian Biological Sciences, 30, 519. Ref. Newbold, 1980.
Olsson, U., Herzman, C. & Tornberg, E. (1994). The influence of low temperature, type of
muscle and electrical stimulation on the course of rigor mortis, ageing and tenderness on
beef muscles. Meat Science, 37, 115-131.
Puolanne, E. & Ruusunen, M. (1998). Effect of linear temperature gradient on sarcomere
lenght in pre-rigor meat strips. In: Dransfield, E & Ronchalés, P. (ed.): Very Fast Chilling
in Beef, 2. Muscle to Meat (pp. 31-36). EU Concerted Action CT94-1881. University
Bristol Press, Bristol, United Kingdom.
Puolanne, E. & Turkki, P. (1983). Effect of pre-rigor salting on the water-binding capacity of
pork. Proceedings of the 29th Meeting of Meat Research Workers (pp. 352-357). Parma,
Italy.
Smith, D. P., Lyon, C. E. & Fletcher, D. L. (1988). Comparison of the Allo-Kramer shear and
texture profile methods of broiler breast meat texture analysis. Poultry Science, 76, 1549-
1556.
Takahashi, K. (1999). Meachanism of meat tenderization during post-mortem ageing:
Calcium theory. Proceedings of the 46th International Congress of Meat Science and
Technology (pp. 230-235). Yokohama, Japan.
Taylor, A. A. & Richardson, R. I. (1998). Research on electrical stimulation in UK. In
Taylor, A. A. & Richardson, R. I. (ed.): Very Fast Chilling in Beef, 3. Eating Quality (pp.
16

1
2
11-17). EU Concerted Action CT94-1881. University Bristol Press, Bristol, United
Kingdom.
17
1
2
3
4
5
6
7
8
9
10
11
12
13
14
15
16
17
18
19
20
21
22
23
24
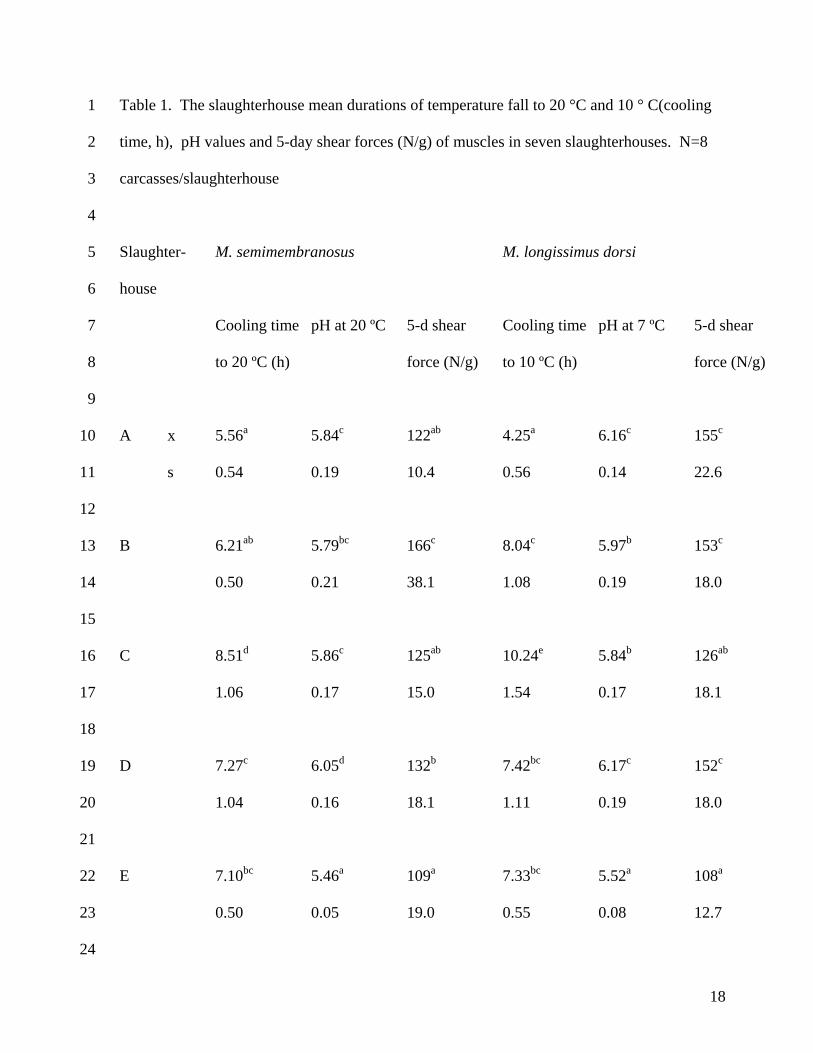
Table 1. The slaughterhouse mean durations of temperature fall to 20 °C and 10 ° C(cooling
time, h), pH values and 5-day shear forces (N/g) of muscles in seven slaughterhouses. N=8
carcasses/slaughterhouse
Slaughter- M. semimembranosus M. longissimus dorsi
house
Cooling time pH at 20 ºC 5-d shear Cooling time pH at 7 ºC 5-d shear
to 20 ºC (h) force (N/g) to 10 ºC (h) force (N/g)
A x 5.56a 5.84c 122ab 4.25a 6.16c 155c
s 0.54 0.19 10.4 0.56 0.14 22.6
B 6.21ab 5.79bc 166c 8.04c 5.97b 153c
0.50 0.21 38.1 1.08 0.19 18.0
C 8.51d 5.86c 125ab 10.24e 5.84b 126ab
1.06 0.17 15.0 1.54 0.17 18.1
D 7.27c 6.05d 132b 7.42bc 6.17c 152c
1.04 0.16 18.1 1.11 0.19 18.0
E 7.10bc 5.46a 109a 7.33bc 5.52a 108a
0.50 0.05 19.0 0.55 0.08 12.7
18
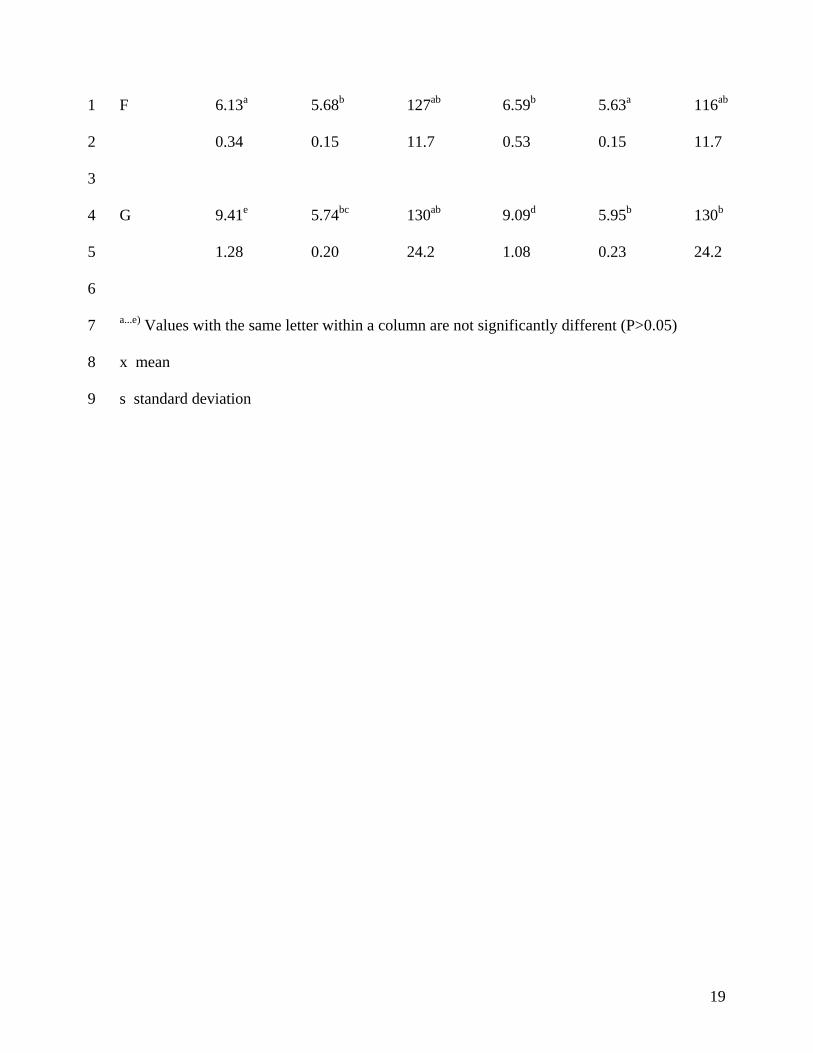
F 6.13a 5.68b 127ab 6.59b 5.63a 116ab1
2
3
4
5
6
7
8
9
0.34 0.15 11.7 0.53 0.15 11.7
G 9.41e 5.74bc 130ab 9.09d 5.95b 130b
1.28 0.20 24.2 1.08 0.23 24.2
a...e) Values with the same letter within a column are not significantly different (P>0.05)
x mean
s standard deviation
19
Figure 1. The regression line between the mean values of shear force and pH at 7 ºC in
slaughterhouses A...F. N=8/slaughterhouse. R
1
2
3
4
5
6
7
8
9
10
11
2= 87.1. LD5SF = shear force of M. longissimus
dorsi at 5 days post mortem; pH-7°C = the pH value when the temperature reached 7 °C.
Figure 2. Shear forces of individual M. longissimus dorsi muscles in slaughterhouses in
ascending order, at 5 d post mortem. Broken line = the mean of all samples.
Figure 3. Shear forces of individual M. longissimus dorsi muscles in slaughterhouses in
ascending order, at 21 d post mortem. Dotted line = the mean of all samples at 5 d post
mortem, broken line = 21 d post mortem.
20

Figure 1 1
2
3
4
0
30
60
90
120
150
180
5.4 5.5 5.6 5.7 5.8 5.9 6 6.1 6.2 6.3
pH
Shea
r for
ce N
/g
LD5SF = -295.4 + 73.0 * pH-7°C
G
A B
D C
F E
21
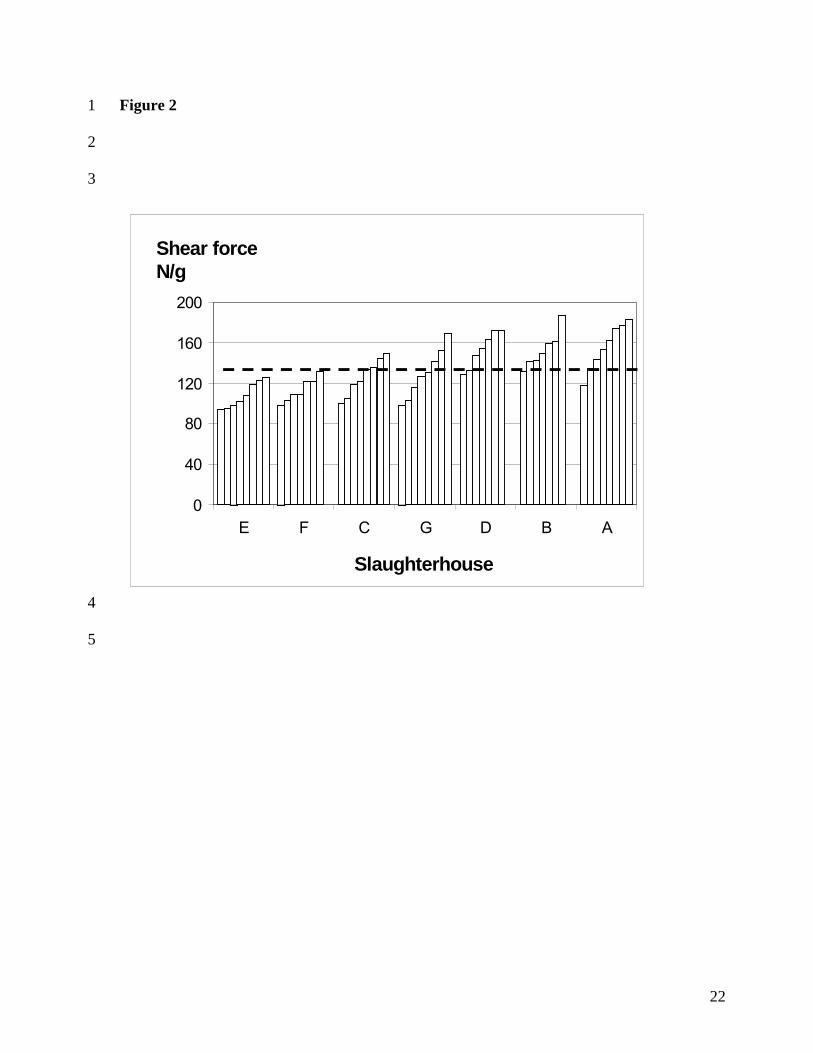
Figure 2 1
2
3
4
5
0
40
80
120
160
200
E F C G D B A
Slaughterhouse
Shear forceN/g
22
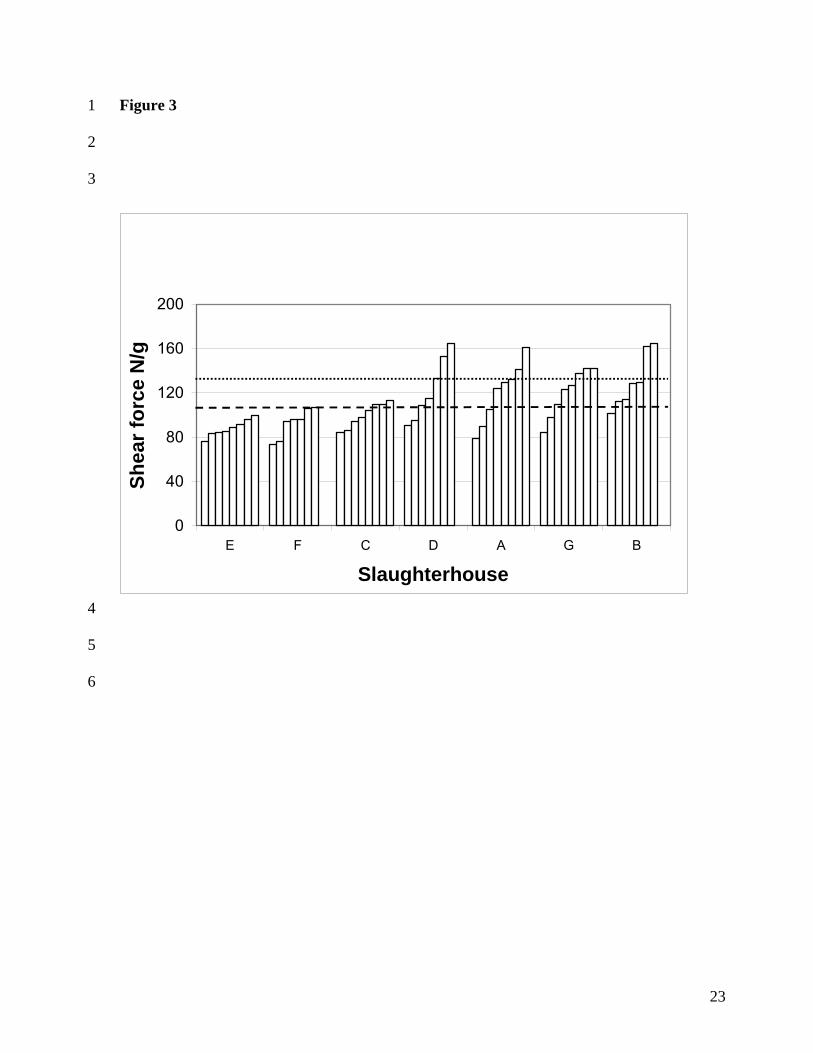
Figure 3 1
2
3
4
5
6
0
40
80
120
160
200
E F C D A G B
Slaughterhouse
Shea
r for
ce N
/g
23