Embed Size (px)
Citation preview
JOURNAL OF THE OPTICAL SOCIETY OF AMERICA
The Effect of Chromatic Adaptation on Achromaticity
HARRY HELSON AND WALTER C. MICHELSBryn Mawr College, Bryn Mawr, Pennsylvania
(Received June 2, 1948)
The tristimulus values of a small (foveal) spot which appears achromatic to an eye which isadapted to a uniform chromatic background have been found experimentally. Various colorshave been used for the background, and a considerable range of luminances has been employedfor both the background and the spot. It is found that the chromaticity coordinates of theachromatic spot can be predicted by interpolation between the coordinates of a "white point,"which is independent of the state of adaptation, and those of the background. An empiricalinterpolation formula, which expresses the effect of adaptation as a function of the tristimulusvalues of the background and the achromatic spot, is presented.
I. INTRODUCTION
THE problem of defining the achromatic orneutral point of the eye for all states of
adaptation has now become central for boththeory and practice of colorimetry and for fur-ther insight into the nature of the visual responsesystem. Modern colorimetry is based on a stand-ard observer viewing small colored patchesagainst a completely dark surround, hence undera single, restricted adaptation of the eye. Suchrepresentations as the I.C. I. trilinear mixturediagram are markedly successful in dealing withcolor specifications, particularly with referenceto color matches, under conditions which do notdepart too far from the original viewing condi-tions of the standard observer. On the otherhand, colors are generally observed against vari-ous backgrounds, often highly selective, and invarious illuminants which may differ consider-ably from daylight. In view of the great useful-ness of the I.C.I. mixture diagram and similarmethods of specifying colored stimuli, it seemsworth while to attempt to extend the system inorder to obtain a better correlation between colorspecification and perceived colors under all con-ditions of adaptation.
Previous studies of adaptation, with but fewexceptions, have been concerned with the effectsof small colored patches well within the macularregion. In this study the method of flooding thewhole retina with strongly chromatic light, asused by Helson and his co-workers'2 and by
' H. Helson, "Fundamental problems in color vision.I. The principle governing changes in hue, saturation, andlightness of non-selective samples in chromatic illumina-tion," J. Exp. Psychol. 23, 439 (1938).
2 H elson and V. B. Jeffers, "Hue, lightness and
Judd,' has been employed with important modi-fications. Whereas these writers were concernedwith the changes in colors of reflecting stimuli instrongly chromatic illuminants, here we shall beconcerned with the effect of general chromaticadaptation upon a foveal stimulus which isphysically independent of the background il-lumination in that it emits its own light andreflects no light. By determining the tri-stimulusvalues of this stimulus when it was adjusted toachromaticity with various hues and brightnessesof surround, it was possible to trace the move-ment of the achromatic point as a function ofchromatic adaptation.
II. THE COLORIMETER
The clorimeter used to produce the achro-matic spot follows a design suggested by Dr.Deane B. Judd. It consists of a metal sphericalshell, 25.0 cm. in diameter, coated on the insidewith sphere paint. A 1.5-cm. diameter holeserves as the exit pupil for the mixed light. Thislight is supplied from three lamp housings, sepa-rated by 1200 longitude and each 110° from apole at the exit pupil. Each lamp housing con-tains a 6-8-volt headlight lamp. Light from thelamps is admitted to the sphere through threefilters (red, blue, green) and through three"cat's eye" diaphragms which can be adjustedfrom zero opening to an opening of about foursquare inches in area.
After aging, a group of lamps were adjusted tosaturation of selective samples in chromatic illumination,"J. Exper. Psychol. 26, (1940).
3 D. B. Judd, "Hue, saturation, and lightness of surfacecolors with chromatic illumination," J. Opt. Soc. Am. 30,2 (1940).
1025
VOLUME 38, NUMBER 12 DECEMBER, 1948
H. HELSON AND W. C. MICHELS
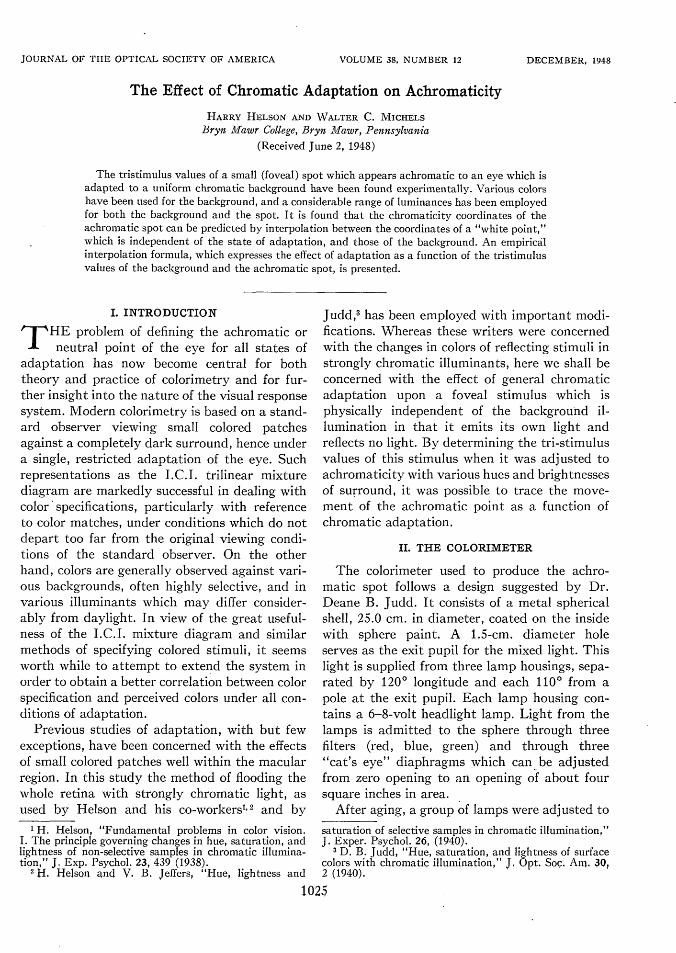
TABLE I. Characteristics of colorimeter sources(standard 40 division opening).
Source Tristimulus valuescolor (arbitrary units) Chromaticity coordinates
X Y z x y ZRed 1015 410 0 0.713 0.287 0.000Green 181 472 78 0.249 0.645 0.106Blue 192 75 1084 0.142 0.056 0.802
color temperature 28480K. The adjustment wasobtained by running spectral distribution curvesat several currents for each lamp with a photo-electric spectrophotometer, comparing with asimilar curve for two standard lamps, and inter-polating to find the correct current for 28480Koperation. Three lamps were found to give thiscolor temperature within ±420' when operatedat 1.036 ampere. These three were used in thecalorimeter and were operated in series duringthe subsequent measurements.
The three lamp-diaphragm combinations (with-out filters) were intercompared by visual pho-tometry, with the diaphrams set at a standardopening (40 scale divisions, almost wide open).An arbitrary unit of luminance was taken as theluminance of the lamp later used with the bluefilter. The diaphragms were then calibrated bymounting all three lamps, with their associateddiaphragms and filters, on the colorimeter andmeasuring the light output as a function ofdiaphragm opening.
The tristimulus values for each lamp filtercombination were calculated, using 100 selectedordinates for the red source and 20-A.U. inter-vals for the blue and green sources. These aregiven, for the standard diaphragm opening of 40scale divisions, in Table I along with the chroma-ticity coordinates of the three sources.
As a check on the clorimeter calibration,two spectral distribution curves of the lightemitted from the exit pupil with all three dia-phragms partially open were taken. The dia-phragm settings for the red, green, and bluesources, respectively, were 40:40:40 and 15:25:40. (The areas of the diaphragm openings varyapproximately as the square of the scale read-ings.) The curves obtained in this way werecompared with those calculated from the inde-pendent measurements on lamp intensity, filtertransmittance, and diaphragm opening. The ob-
served and calculated curves disagreed at nowave-length by more than five percent.
In order that the arbitrary Y values mightbe converted to luminance at the exit pupil, aseries of color matches of the light coming fromthe colorimeter to a background illuminated byincandescent light were made. At the same time,the background luminance was measured witha Macbeth illuminometer. The conversion factorfrom our tristimulus units to apparent foot-candles (or foot-lamberts) was found to be
1 Y unit= 0.00171 apparent footcandle4t2 percent.
All luminances given in this paper were calcu-lated from the tristimulus values and this con-version factor.
III. PROCEDURE
The conditions of observation were designedto provide a known, uniform field of stimulationfilling the whole eye with strongly chromaticlight to insure complete and thorough adapta-tion at various luminance levels. In the centerof the field was an aperture, the exit pupil of thecalorimeter, flush with the surround. A semi-cylindrical booth, four feet in diameter and sixfeet high, lined with fairly matt, non-selective,highly reflective cardboard (daylight white), wasthe means by which a uniform surround wasprovided. Observers sat facing the booth withineasy reach of the controls regulating the color-imeter diaphragms. The aperture, which was 1.5cm in diameter, subtended an angle of 1035' atthe eye and hence was within the limits of thefovea so far as the stationary eye was concerned.The chromatic field was provided by an in-candescent lamp and chromatic, glass-filter com-bination mounted in a light-tight housing aboveand behind the head of the observer. The lumi-nance of the surround was varied by insertingperforated cardboard filters between the lampsource and the glass filter. Current on the lampwas held constant, and measurements for chro-maticity and luminance of surround were madebefore the beginning of each observational periodby matching the aperture to the surround. Thechromaticity coordinates and luminances of thesurrounds given in Table III are averages ofseveral matchings by the three observers, Be-
1026
ACHROMATICITY
cause of the limitations of the colorimeter, amatch between the aperture and the surroundwas not possible in the case of the red and blueilluminants until a small admixture of incandes-cent-lamp light (2848°K) was added to the field.This was accomplished by means of a small slitin the lamp housing, directly above the chro-matic filter, which could be adjusted to give theminimum amount of incandescent-lamp lightnecessary for a match.
The chromaticity coordinates and the lumi-nance of the surround for each condition aregiven in Table III, from which it is seen thatfive luminance levels ranging from 8.63 to 0.10app.f.c. were employed with the yellow, fourlevels ranging from 0.76 to 0.03 app.f.c. withthe red, four levels ranging from 0.76 to 0.04with the green, and two levels, 0.06 and 0.014,with the blue. Since the lower limit of photopicvision is usually given as approximately 0.10app.f.c. it is seen that some of our field lumi-nances were at the scotopic level but, in spiteof this fact, results with these low luminancesare consistent with the photopic data. The factthat the whole retina was subjected to chromaticstimulation probably is responsible for effectiveadaptation at these low luminances. Observerswere required to view the surround for fiveminutes before making any settings. This periodof pre-adaptation, plus the use of strongly chro-matic surrounds that filled the eyes with uni-form stimulation, assured complete chromaticadaptation.
The task set the observers was to make thecentral spot (the exit pupil of the colorimeter)achromatic or neutral by turning the handleswhich regulated the amounts of light from thethree primaries of the colorimeter. After pre-liminary practice the following procedure inmaking the settings was adopted and was foundto yield reliable results both from the point ofview of individual consistency and inter-observervariation. All settings were made from an initialhigh, medium, or low luminance of the aperturespot by having the observers adjust the primariesto give scale readings of 45,45,45, or 25,25,25,or 15,15,15. At these positions the aperture colorwas rarely, if ever, anywhere near achromaticity,and the observers had to produce a satisfactoryneutral by readjusting the controls. Three de-
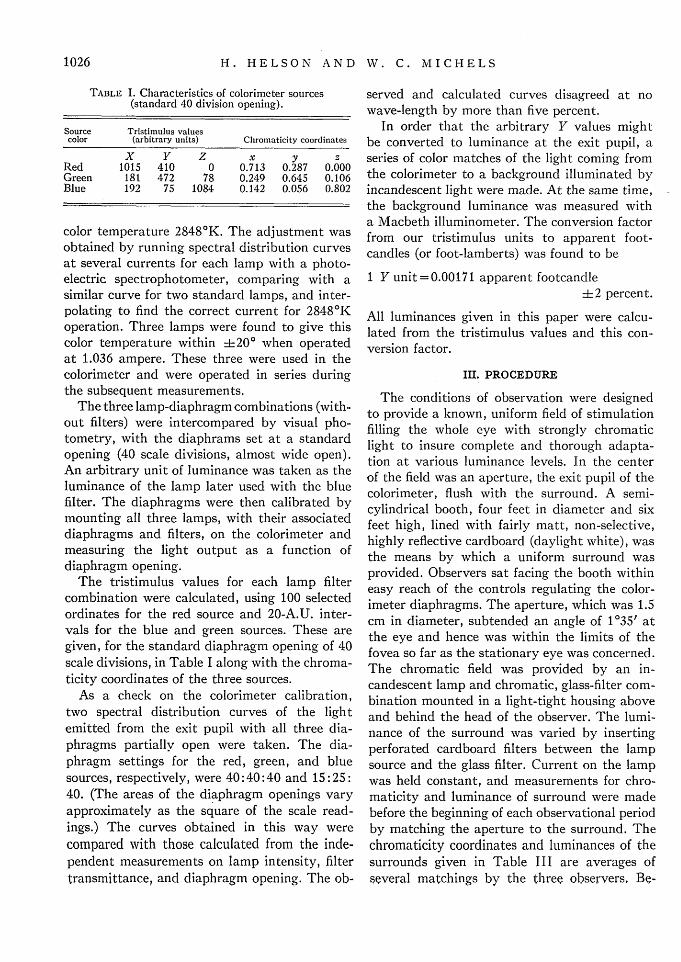
TABLE II. Settings of three observers for achromaticityof a small spot in a strongly chromatic (green) field atrelatively high, medium, and low luminance with fourfield luminances.
Background Achromatic spotluminance chromaticity luminance chromaticity(App.f.c.) coordinates (App.f.c.) coordinates observers
x y z x y z
0.78 0.243 0.616 0.141 0.99 0.272 0.499 0.229 G0.75 0.236 0.578 0.186 1.05 0.255 0.479 0.266 H0.77 0.249 0.645 0.106 1.04 0.227 0.443 0.330 J
0.78 0.243 0.616 0.141 0.35 0.249 0.639 0.112 G0.75 0.236 0.578 0.186 0.36 0.247 0.471 0.282 H0.77 0.249 0.645 0.106 0.36 0.211 0.430 0.359 J
0.78 0.243 0.616 0.141 0.12 0.252 0.636 0.112 G0.75 0.236 0.578 0.186 0.08 0.261 0.638 0.101 H0.77 0.249 0.645 0.106 0.12 0.252 0.636 0.112 J
0.26 0.243 0.628 0.129 1.17 0.270 0.371 0.359 G0.27 0.246 0.648 0.106 1.21 0.226 0.283 0.491 H0.26 0.246 0.649 0.105 1.25 0.230 0.269 0.501 J
0.26 0.243 0.628 0.129 0.47 0.272 0.470 0.258 G0.27 0.246 0.648 0.106 0.36 0.238 0.428 0.334 H0.26 0.246 0.649 0.105 0.41 0.217 0.307 0.476 J
0.26 0.243 0.628 0.129 0.12 0.275 0.567 0.158 G0.27 0.246 0.648 0.106 0.13 0.287 0.611 0.102 H0.26 0.246 0.649 0.105 0.12 0.252 0.635 0.113 J
0.09 0.244 0.628 0.128 1.17 0.246 0.280 0.474 G0.10 0.247 0.645 0.108 1.21 0.242 0.260 0.498 H0.10 0.248 0.647 0.105 1.32 0.254 0.270 0.476 J
0.09 0.244 0.628 0.128 0.60 0.258 0.304 0.438 G0.10 0.247 0.645 0.108 0.42 0.239 0.276 0.485 H0.10 0.248 0.647 0.105 0.45 0.242 0.272 0.486 J
0.09 0.244 0.826 0.128 0.25 0.257 0.379 0.364 G0.10 0.247 0.645 0.108 0.16 0.225 0.306 0.469 H0.10 0.248 0.647 0.105 0.14 0.239 0.327 0.434 J
0.04 0.250 0.639 0.111 1.30 0.248 0.270 0.482 G0.04 0.227 0.504 0.269 1.34 0.262 0.270 0.482 H0.03 0.234 0.594 0.172 1.32 0.276 0.263 0.461 J
0.04 0.250 0.639 0.111 0.46 0.248 0.271 0.481 G0.04 0.227 0.504 0.269 0.47 0.260 0.274 0.466 H0.03 0.234 0.594 0.172 0.44 0.250 0.226 0.524 J
0.04 0.250 0.639 0.111 0.15 0.246 0.276 0.477 G0.04 0.227 0.504 0.269 0.14 0.242 0.237 0.521 H0.03 0.234 0.594 0.172 0.17 0.246 0.243 0.511 J
terminations were made of the achromatic pointat each of these levels in random order with eachsurround. Since four different chromaticities atfrom two to five luminances were employed, thetotal number of conditions investigated, includ-ing the case of achromaticity with completelydark surround, was forty-seven. The total num-ber of determinations of the achromatic point isthus 423 if the three replications by the threeobservers are taken into account.
Before the final series of observations, ob-servers adjusted the aperture spot to achroma-ticity under a variety of conditions: dark sur-round, "white" surround with 2848°K illumina-tion, and some chromatic surrounds. At firstobservers were faced with the problem as towhat constituted a neutral or achromatic spot,since no standard could be furnished for com-
1027
H. H8LSON AND W. C. MICHELS
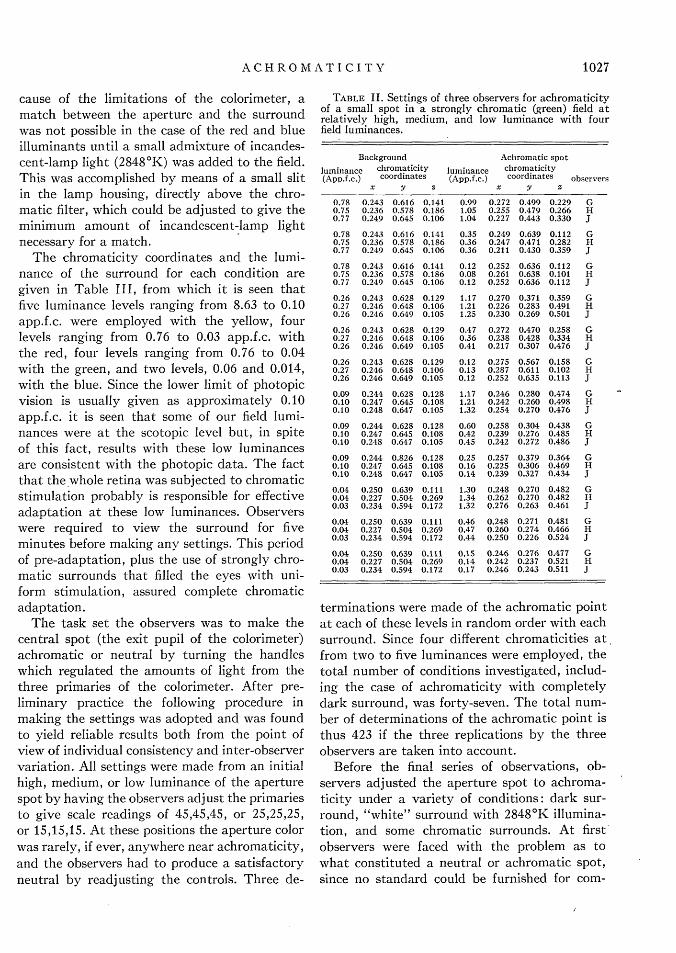
TABLE III. Average coordinates of achromatic spots,adaptation-ratio (r), and tri-stimulus sum ratio (R).
Background Achromatic spotluminance chromaticity luminance chromaticity(app.f.c.) coordinates (app.f.c.) coordinates
x y a x y z r R
8.63 0.587 0.385 0.027 1.62 0.555 0.409 0.036 1.01 0.181.14 0.594 0.374 0.032 0.96 0.09
2.65 1.68 0.548 0.415 0.037 0.92 0.590.66 0.566 0.401 0.033 1.04 0.240.25 0.579 0.390 0.031 1.00 0.10
0.81 1.79 0.425 0.316 0.259 0.45 2.710.75 0.542 0.393 0.064 1.03 0.870.34 0.569 0.397 0.034 1.01 0.41
0.21 1.68 0.328 0.272 0.400 0.19 10.20.64 0.388 0.288 0.324 0.20 3.900.23 0.526 0.371 0.103 0.82 1.11
0.10 1.42 0.308 0.263 0.429 0.10 20.30.63 0.327 0.254 0.419 0.05 9.30.22 0.364 0.248 0.388 0.10 3.30
0.76 0.698 0.291 0.012 1.12 0.545 0.271 0.184 0.64 1.580.41 0.630 0.297 0.073 0.86 0.520.10 0.681 0.293 0.026 0.98 0.13
0.24 2.11 0.426 0.338 0.256 0.41 7.90.57 0.456 0.251 0.293 0.40 2.630.13 0.680 0.312 0.008 0.98 0.52
0.070 1.48 0.332 0.266 0.402 0.14 22.80.71 0.351 0.262 0.387 0.18 11.20.19 0.512 0.295 0.193 0.58 2.63
0.031 1.32 0.298 0.256 0.446 0.06 49.50.58 0.292 0.221 0.487 0.00 25.20.22 0.381 0.277 0.342 0.26 7.6
0.76 0.241 0615 0.143 1.03 0.250 0.473 0.277 0.58 1.710.36 0.234 0.496 0.270 0.62 0.560.10 0.259 0.638 0.103 1.10 0.12
0.26 1.20 0.239 0.300 0.461 0.04 9.80.41 0.254 0.384 0.362 0.32 2.640.12 0.272 0.601 0.127 1.00 0.49
0.097 1.23 0.247 0.269 0.484 -0.04 30.00.49 0.235 0.282 0.473 0.00 11.40.18 0.243 0.342 0.415 0.17 3.41
0.038 1.32 0.262 0.269 0.469 -0.01 76.00.45 0.252 0.256 0.492 -0.06 27.30.16 0.266 0.296 0.438 0.08 8.1
0.062 0.166 0.068 0.766 1.08 0.276 0.233 0.491 0.13 5.20.47 0.242 0.186 0.572 0.34 2.830.22 0.218 0.146 0.636 0.56 1.66
0.014 1.34 0.277 0.265 0.458 0.03 24.60.55 0.262 0.242 0.496 0.10 11.20.18 0.273 0.215 0.512 0.16 4.03
parison. This problem is complicated by thewhite-gray-black question. Whether the spotappears "white,"4 gray, or "black" depends not
4 In accordance with modern trends, the terms whiteand black should be reserved for object colors or colorsseen to belong to surfaces and, therefore, having definitelocalization and a certain hardness and texture. Sometimesthe color perceived in the exit pupil of the clorimeter wvaslocalized in the plane of the surround and did seem topossess the hard, surfacy texture of object colors, so thatit would be proper in these cases to refer to them as whiteor black. However, the achromatic spots were not alwayswhite in the sense of possessing surface properties whenthey were very, very bright, or black in this sense whenthey were very, very dark. Hence references to white andblack in this study may include cases of extremely brightor dark aperture colors which were not white or black inthe above sense. No distinction by means of quotes will
only upon its own brightness but even more uponits relation to the surround. For this and otherreasons, the luminance of the surround wasvaried as well as its chromaticity, and observerswere asked to adjust to achromaticity at thethree levels mentioned previously. Hence thedata reported in this study represent achroma-ticities that are white, near-white, light gray,medium gray, dark gray, very, very dark gray,and, in one or two cases, black, depending uponthe brightness ratio of spot to surround. In spiteof variation from observer to observer and somelack of consistency within individual settings,the data yielded such clear regularities thataveraging of observers seemed justified. Inter-observer variation might have been reduced bycorrecting each observer for departure from I. C. I.specifications of some standard source. This wasnot done, and the data represent actual settingsin every case. Three observers completed ob-servations for all conditions, one of the authors(H), Miss Louise Gaus, graduate student inphysics (G), and Mr. Murray de Jersey, graduatestudent in psychology (J). Observations made bythe other author (M) were in every way con-firmatory of the data presented here but are notincluded because of incompleteness.
The achromatic settings with dark surroundagreed well, and the average chromaticity co-ordinates of the point were found to be
x= 0.26940.026,Yo = 0.269+4-0.040,
o= 0.462 40.057.
It is of interest that this white point with a darksurround approximates very closely the color ofa blackbody radiator at a temperature of15,0000K, and is considerably bluer than usuallyaccepted white points. It is, however, in theregion characteristic of an illuminant in whichnon-selective reflectances, whether high, medium,or low, should be achromatic, according to Judd(reference 3, p. 9).
IV. RESULTS AND DISCUSSION
A typical set of data, taken when the boothwas flooded with green light, is shown in TableII. It will be noticed that the consistency of the
be made hereafter between whites and blacks, on the onehand, and extremely bright and dark on the other.
1028
ACHROMATICITY
observers in determining the color of the back-ground is considerably better than that obtainedin determining the achromatic points. This isnot unexpected, since the former determinationis the result of a matching process, while thelatter depends on the judgments of achroma-,ticity, without reference to a physical standard.
In Table III, the results for four backgroundchromaticities, with two to five luminances foreach chromaticity, as obtained by three ob-servers, are summarized. The values of thechromaticity coordinates (x,y,z) given for eachbackground were obtained by averaging thetristimulus values (X, Y,Z) found by the threeobservers for a given luminance, and then byaveraging the chromaticity coordinates for thevarious luminances. Each observer made two orthree brightness and color matches. The lumi-nance of the background was likewise determinedby conversion from the average Y value foundby all observers. The luminance and chroma-ticity coordinates for each achromatic spot aresimilar averages of the values found by threeobservers. The coordinates of each spot thereforerepresent nine independent observations. Noattempt has been made to estimate the uncer-tainties of each set of coordinates, but a generalreview of the data indicates that the valuesgiven may vary by about 0.05 from those ofany observer.
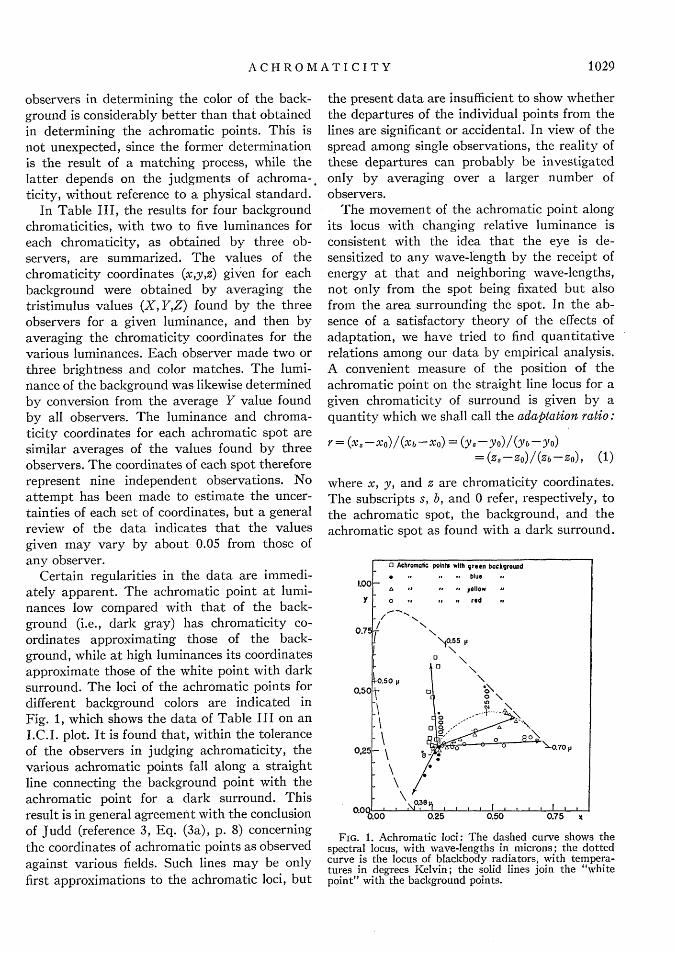
Certain regularities in the data are immedi-ately apparent. The achromatic point at lumi-nances low compared with that of the back-ground (i.e., dark gray) has chromaticity co-ordinates approximating those of the back-ground, while at high luminances its coordinatesapproximate those of the white point with darksurround. The loci of the achromatic points fordifferent background colors are indicated inFig. 1, which shows the data of Table III on anI.C.I. plot. It is found that, within the toleranceof the observers in judging achromaticity, thevarious achromatic points fall along a straightline connecting the background point with theachromatic point for a dark surround. Thisresult is in general agreement with the conclusionof Judd (reference 3, Eq. (3a), p. 8) concerningthe coordinates of achromatic points as observedagainst various fields. Such lines may be onlyfirst approximations to the achromatic loci, but
the present data are insufficient to show whetherthe departures of the individual points from thelines are significant or accidental. In view of thespread among single observations, the reality ofthese departures can probably be investigatedonly by averaging over a larger number ofobservers.
The movement of the achromatic point alongits locus with changing relative luminance isconsistent with the idea that the eye is de-sensitized to any wave-length by the receipt ofenergy at that and neighboring wave-lengths,not only from the spot being fixated but alsofrom the area surrounding the spot. In the ab-sence of a satisfactory theory of the effects ofadaptation, we have tried to find quantitativerelations among our data by empirical analysis.A convenient measure of the position of theachromatic point on the straight line locus for agiven chromaticity of surround is given by aquantity which we shall call the adaptation ratio:
r= (X.-X0)/(Xb-XO) = (ys-y0)/(Yb-Yo)= (Zs-ZO)/(Zb-ZO), (1)
where x, y, and z are chromaticity coordinates.The subscripts s, b, and 0 refer, respectively, tothe achromatic spot, the background, and theachromatic spot as found with a dark surround.
O Achromotic points with green background* , .. *- blue . *
1-00 'IIuo.OO a * a Ad ~~yellowY ° " A A red
0.75 / A
\0.55 1
000 0.50\
0.50~~~~~
0~
0.25 \ *8-070 p
\ Z
* 0.00 0.25 0.50 0.75 x
FIG. 1. Achromatic loci: The dashed curve shows thespectral locus, with wave-lengths in microns; the dottedcurve is the locus of blackbody radiators, with tempera-tures in degrees Kelvin; the solid lines join the "whitepoint" with the background points.
. . . . . . . . . . . . . . .
U.UC' ' ' N ' ' _' ' ' ' '_ ' ' ' ' '__' '
1029
H. HELSON AND W. C. MICHELS
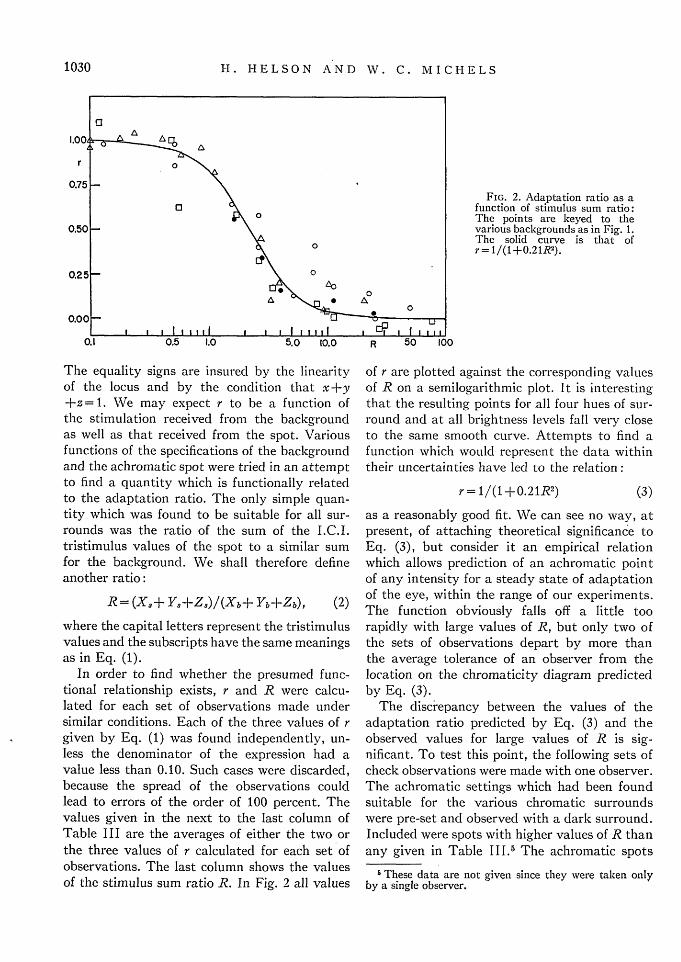
FIG. 2. Adaptation ratio as afunction of stimulus sum ratio:The points are keyed to thevarious backgrounds as in Fig. 1.The solid curve is that ofr= 1/(1+0.21R2 ).
The equality signs are insured by the linearityof the locus and by the condition that x+y+z=1. We may expect r to be a function ofthe stimulation received from the backgroundas well as that received from the spot. Variousfunctions of the specifications of the backgroundand the achromatic spot were tried in an attemptto find a quantity which is functionally relatedto the adaptation ratio. The only simple quan-tity which was found to be suitable for all sur-rounds was the ratio of the sum of the I.C.I.tristimulus values of the spot to a similar sumfor the background. We shall therefore defineanother ratio:
R = (Xa+ Ys+Zs)/(Xb+ Yb+Zb), (2)
where the capital letters represent the tristimulusvalues and the subscripts have the same meaningsas in Eq. (1).
In order to find whether the presumed func-tional relationship exists, r and R were calcu-lated for each set of observations made undersimilar conditions. Each of the three values of rgiven by Eq. (1) was found independently, un-less the denominator of the expression had avalue less than 0.10. Such cases were discarded,because the spread of the observations couldlead to errors of the order of 100 percent. Thevalues given in the next to the last column ofTable III are the averages of either the two orthe three values of r calculated for each set ofobservations. The last column shows the valuesof the stimulus sum ratio R. In Fig. 2 all values
of r are plotted against the corresponding valuesof R on a semilogarithmic plot. It is interestingthat the resulting points for all four hues of sur-round and at all brightness levels fall very closeto the same smooth curve. Attempts to find afunction which would represent the data withintheir uncertainties have led to the relation:
r= 1/(1+0.21R2 ) (3)
as a reasonably good fit. We can see no way, atpresent, of attaching theoretical significance toEq. (3), but consider it an empirical relationwhich allows prediction of an achromatic pointof any intensity for a steady state of adaptationof the eye, within the range of our experiments.The function obviously falls off a little toorapidly with large values of R, but only two ofthe sets of observations depart by more thanthe average tolerance of an observer from thelocation on the chromaticity diagram predictedby Eq. (3).
The discrepancy between the values of theadaptation ratio predicted by Eq. (3) and theobserved values for large values of R is sig-nificant. To test this point, the following sets ofcheck observations were made with one observer.The achromatic settings which had been foundsuitable for the various chromatic surroundswere pre-set and observed with a dark surround.Included were spots with higher values of R thanany given in Table JJ1.J The achromatic spots
5 These data are not given since they were taken onlyby a single observer.
100
1030

ACHROMATI CITY 1
which had been found for the red and yellowbackgrounds showed discernible chroma againstthe dark surround, even though the ahcromaticstimulus had been determined for values of Ras high as 80:1 for the red and 30:1 for theyellow. On the other hand, the achromatic pointsdetermined for the blue and green surrounds atvalues of R as low as 10: 1 remained achromaticwith a dark surround. As a further check thespot was adjusted to a high intensity of theachromatic setting for a dark surround and wasthen observed with low intensity of the fourchromatic surrounds. In each case the chroma ofthe spot was sufficiently low so that the observerwas willing to accept the spot as achromatic.
Because of the empirical nature of Eq. (3),and because of the surprising fact that theadaptation of the eye appears to be determinedby the I.C.I. stimulus sum ratio rather than theluminance ratio, attempts were made to apply toour data the equations which have been proposedby Judd (reference 3, Eq. (3), p. 8) and bySpencer6 to specify achromaticity. Judd's equa-tion can be modified to fit the conditions of thisstudy by replacing reflectances by luminances.The composite color stimulus tensor of Spencerwas defined for conditions essentially identicalwith those which we have used. Both of theseformulations agree qualitatively with our re-sults, but neither predicts the achromatic speci-fications as closely as does Eq. (3).
One interesting result of this study is the factthat the "white point," i.e., the achromaticpoint for a small spot of luminance much higherthan that of the background, seems to be almostindependent of the state of adaptation. If weaccept Eq. (3), all values of R greater than 10should result in a close approximation to thispoint. In the present data there are 117 indi-vidual observations, other than those with thedark surround, which satisfy the conditionR> 10. The white point, as determined byaveraging the chromaticity coordinates found inall of these observations, is given by
x0=0.287, yo=0. 254, z0 =0.459.
These values agree with the white point found
6 D. E. Spencer, "Adaptation in color space," J. Opt.Soc. Am. 33, 10 (1943).
with dark surround within the accuracy of thedeterminations of this point.
To test whether the state of adaptation is de-termined by the specification of the light reach-ing the eye, some observations were made with alow reflecting surround (daylight black). Inthese observations the intensity of the illuminantwas raised to sufficiently high levels that theluminance of the surround duplicated levels usedin the main body of experiments, with daylightwhite surround. In every case the results were inexcellent agreement with the data shown inTable I I I.
One effect which was noticed during the ob-servation of black and dark gray spots indicatesthat decreased sensitivity of the eye to wave-lengths coming from the surround is not the onlyeffect of adaptation. When the exit pupil of thecalorimeter was observed at very low bright-nesses, an annular ring which showed the com-plementary hue to that of the illuminant couldbe observed within the aperture. The addition ofsmall amounts of light of the hue of the sur-round compensated for this color without appre-ciably increasing the brightness of the spot. Itis probably this effect which allows a reasonablyprecise determination of the chromaticity co-ordinates of the very dark spots, which mightotherwise have been expected to be indeter-minate.
It is a matter of considerable interest that thedata obtained in this study with a luminous spotare in agreement with the conclusions whichhave been drawn from previous studies in whichreflecting samples were used. The qualitativegeneralization which has been drawn from thework of Helson, Helson and Jeffers, and Juddwith reflecting samples on non-selective sur-rounds can be stated: In every viewing situationthere is established an adaptation level suchthat samples with reflectances above this leveltend to take the hue of the illuminant, sampleswith lower reflectances take the after-imagecomplementary to the hue of the illuminant,and samples with reflectances near the adapta-tion level are either achromatic or weakly satu-rated. The same principle can be deduced di-rectly from Eq. (3), and from the observationsnoted in the preceding paragraph. In order that
1031
ROBERT E. STEPHENS
a highly reflecting sample remain achromatic, itis necessary that its spectral reflectance be suchthat, when multiplied by the spectral distribu-tion of the illuminant, it yield the specificationsof the corresponding achromatic point. Iighlyreflecting samples necessarily depart from thiscondition toward the hue of the illuminant.Similarly, according to Eq. (3), a sample of verylow reflectance would be achromatic only if itsspectral reflectance, multiplied by the spectraldistribution of the illuminant, were to yield thechromaticity coordinates of the surround. Thereflectance of selective samples can depart fromthis requirement in one of two ways, (a) favoringthe dominant wave-length of the illuminantand yielding high reflectance, and (b) favoringother wave-lengths, thus causing the color toshift toward the complement of the illuminant.This effect alone cannot explain the behaviorof non-selective samples of low reflectance. The
appearance of such samples must be due to theafter-image complementary effect noted withspots of low brightness. Our results thereforeagree with the qualitative principles obtainedfrom observations on reflecting samples.
V. ACKNOWLEDGMENTS
The authors wish to express their indebted-ness to Miss Louise Gaus, who did most of thework involved in the calibration of the color-imeter and who acted as an observer, and toMr. Murray de Jersey, whose help in setting upthe apparatus and in observing was of greatvalue. We also wish to thank Mr. Norman Powellfor the care and skill which he used in the con-struction of the colorimeter. This study wasassisted by a grant from the income of theCarnegie Corporation Endowment given toBryn Mawr College for the Coordination of theSciences.
JOURNAL OF THE OPTICAL SOCIETY OF AMERICA VOLUME 38, NUMBER 12 DECEMBER, .1948
The Design of Triplet Anastigmat Lenses of the Taylor TypeROBERT E. STEPHENS
Optical Instruments Section, National Bureau of Standards, Washington, D. C.(Received June 4, 1948)
Equations and methods are developed for computing the lens powers, separations, and lensshapes of preliminary thin lens designs of Taylor-type triplets. The three lens powers and twospaces are determined by specified values of equivalent power, Petzval sum, longitudinalchromatic aberration, lateral chromatic aberration, and spherical aberration. The three lensshapes are determined by desired values of the three Seidel sums relating to coma, astigmatism,and distortion. Procedures for replacement of thin lenses by equivalent thick lenses and forfinal trigonometric adjustment are outlined. The methods given are not limited to the case ofthe infinitely distant object, but may be used to determine a system for any specified magnifica-tion and having any moderate values of the eight independent variables.
I. INTRODUCTION
HE material so far published on the design-of triplet anastigmatsl-8 of the Taylor1 H. D. Taylor, British Patent 22607/93, also U. S.
Patents 540122 and 568052.2 H. D. Taylor, "Description of the Franklin-Adams
astrographic triplet." Monthly notices of the RoyalAstronomical Society, May 1904.
3 K. Schwarzschild, Untersuchungen zur GeometrischenOptik III (Weidmannsche Buchhandlung, Berlin, 1905)"Objectiv aus drei getrennten Linsen," p. 40.
4 Arthur Kerber, "Ein Taylor Objectiv fur astronomischeZweck," Zeits. f. Instrumentenk 35, 23 (1915).
5 Arthur Kerber, "Uber die Berechnung der Objectiv
type leaves much to be desired in several re-spects. The methods presented for the correctionof lateral chromatic aberration have dependedupon the treating of dispersion as a continuousvon grosserem Gesichtsfelde aus drei getrennten Linsen,"Zeits. f. Instrumentenk 36, 68 (1916).
G Arthur Kerber, "Ein Portratobjectiv aus drei ge-trennten Linsen," Zeits. f. Instrumentenk 36, 269 (1916).
7 Henri Chretien, "Cours de Calcul des CombinaisonsOptiques," Revue d'optique theoret. t instrument., 359(1938).
8 . Berek, Grundlagen der praktischen Optik (W. deGruyter and Company, Berlin and Leipzig, 1930), "Daseinfache Triplet," p. 123.
1032