Embed Size (px)
Citation preview
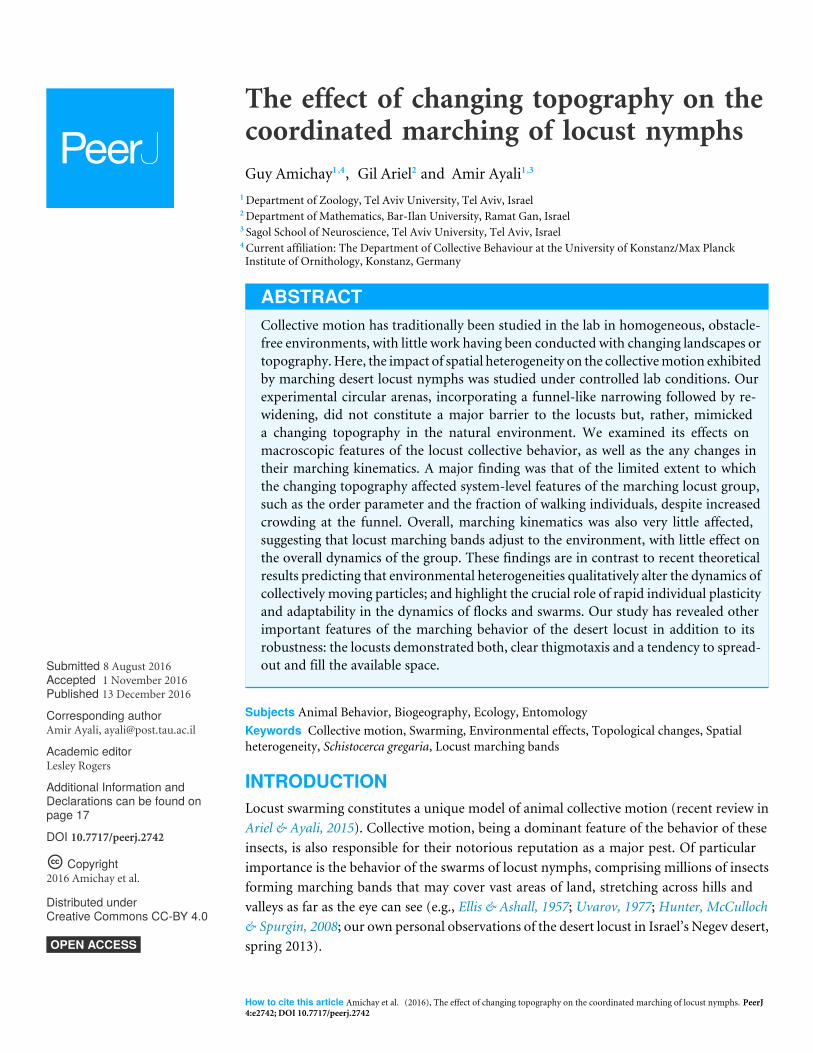
Submitted 8 August 2016Accepted 1 November 2016Published 13 December 2016
Corresponding authorAmir Ayali, [email protected]
Academic editorLesley Rogers
Additional Information andDeclarations can be found onpage 17
DOI 10.7717/peerj.2742
Copyright2016 Amichay et al.
Distributed underCreative Commons CC-BY 4.0
OPEN ACCESS
The effect of changing topography on thecoordinated marching of locust nymphsGuy Amichay1,4, Gil Ariel2 and Amir Ayali1,3
1Department of Zoology, Tel Aviv University, Tel Aviv, Israel2Department of Mathematics, Bar-Ilan University, Ramat Gan, Israel3 Sagol School of Neuroscience, Tel Aviv University, Tel Aviv, Israel4Current affiliation: The Department of Collective Behaviour at the University of Konstanz/Max PlanckInstitute of Ornithology, Konstanz, Germany
ABSTRACTCollective motion has traditionally been studied in the lab in homogeneous, obstacle-free environments, with little work having been conducted with changing landscapes ortopography.Here, the impact of spatial heterogeneity on the collectivemotion exhibitedby marching desert locust nymphs was studied under controlled lab conditions. Ourexperimental circular arenas, incorporating a funnel-like narrowing followed by re-widening, did not constitute a major barrier to the locusts but, rather, mimickeda changing topography in the natural environment. We examined its effects onmacroscopic features of the locust collective behavior, as well as the any changes intheir marching kinematics. A major finding was that of the limited extent to whichthe changing topography affected system-level features of the marching locust group,such as the order parameter and the fraction of walking individuals, despite increasedcrowding at the funnel. Overall, marching kinematics was also very little affected,suggesting that locust marching bands adjust to the environment, with little effect onthe overall dynamics of the group. These findings are in contrast to recent theoreticalresults predicting that environmental heterogeneities qualitatively alter the dynamics ofcollectively moving particles; and highlight the crucial role of rapid individual plasticityand adaptability in the dynamics of flocks and swarms. Our study has revealed otherimportant features of the marching behavior of the desert locust in addition to itsrobustness: the locusts demonstrated both, clear thigmotaxis and a tendency to spread-out and fill the available space.
Subjects Animal Behavior, Biogeography, Ecology, EntomologyKeywords Collective motion, Swarming, Environmental effects, Topological changes, Spatialheterogeneity, Schistocerca gregaria, Locust marching bands
INTRODUCTIONLocust swarming constitutes a unique model of animal collective motion (recent review inAriel & Ayali, 2015). Collective motion, being a dominant feature of the behavior of theseinsects, is also responsible for their notorious reputation as a major pest. Of particularimportance is the behavior of the swarms of locust nymphs, comprising millions of insectsforming marching bands that may cover vast areas of land, stretching across hills andvalleys as far as the eye can see (e.g., Ellis & Ashall, 1957; Uvarov, 1977; Hunter, McCulloch& Spurgin, 2008; our own personal observations of the desert locust in Israel’s Negev desert,spring 2013).
How to cite this article Amichay et al. (2016), The effect of changing topography on the coordinated marching of locust nymphs. PeerJ4:e2742; DOI 10.7717/peerj.2742
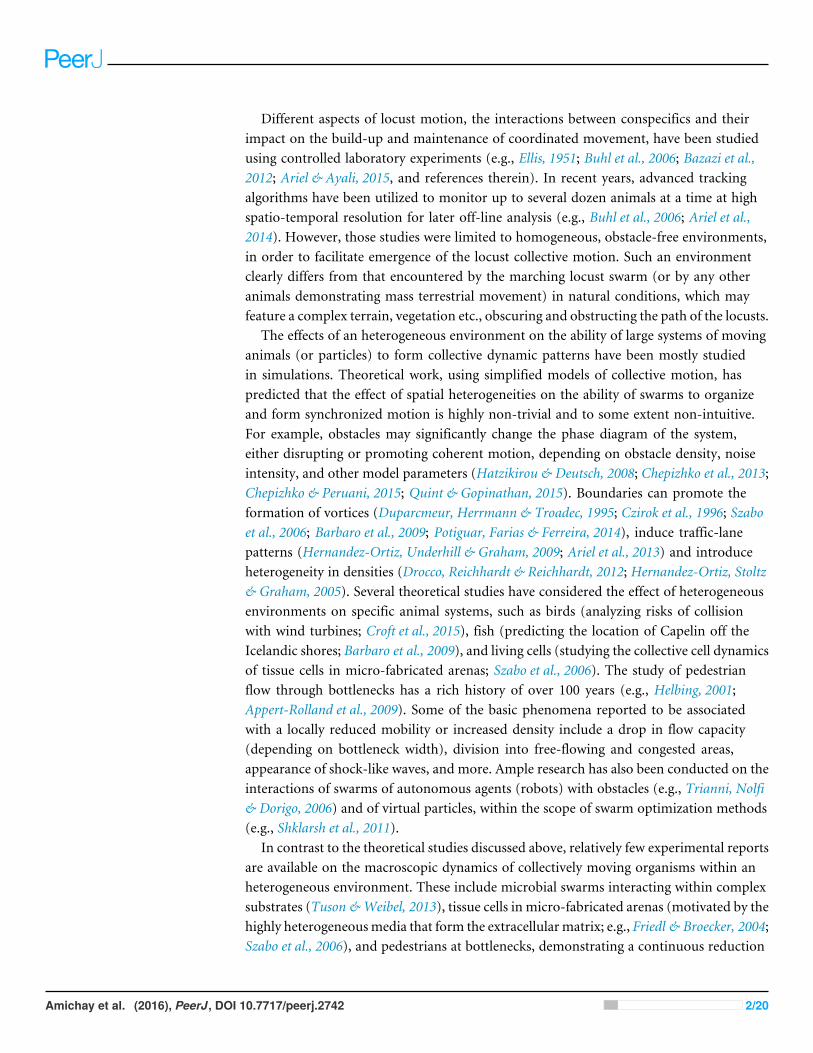
Different aspects of locust motion, the interactions between conspecifics and theirimpact on the build-up and maintenance of coordinated movement, have been studiedusing controlled laboratory experiments (e.g., Ellis, 1951; Buhl et al., 2006; Bazazi et al.,2012; Ariel & Ayali, 2015, and references therein). In recent years, advanced trackingalgorithms have been utilized to monitor up to several dozen animals at a time at highspatio-temporal resolution for later off-line analysis (e.g., Buhl et al., 2006; Ariel et al.,2014). However, those studies were limited to homogeneous, obstacle-free environments,in order to facilitate emergence of the locust collective motion. Such an environmentclearly differs from that encountered by the marching locust swarm (or by any otheranimals demonstrating mass terrestrial movement) in natural conditions, which mayfeature a complex terrain, vegetation etc., obscuring and obstructing the path of the locusts.
The effects of an heterogeneous environment on the ability of large systems of movinganimals (or particles) to form collective dynamic patterns have been mostly studiedin simulations. Theoretical work, using simplified models of collective motion, haspredicted that the effect of spatial heterogeneities on the ability of swarms to organizeand form synchronized motion is highly non-trivial and to some extent non-intuitive.For example, obstacles may significantly change the phase diagram of the system,either disrupting or promoting coherent motion, depending on obstacle density, noiseintensity, and other model parameters (Hatzikirou & Deutsch, 2008; Chepizhko et al., 2013;Chepizhko & Peruani, 2015; Quint & Gopinathan, 2015). Boundaries can promote theformation of vortices (Duparcmeur, Herrmann & Troadec, 1995; Czirok et al., 1996; Szaboet al., 2006; Barbaro et al., 2009; Potiguar, Farias & Ferreira, 2014), induce traffic-lanepatterns (Hernandez-Ortiz, Underhill & Graham, 2009; Ariel et al., 2013) and introduceheterogeneity in densities (Drocco, Reichhardt & Reichhardt, 2012; Hernandez-Ortiz, Stoltz& Graham, 2005). Several theoretical studies have considered the effect of heterogeneousenvironments on specific animal systems, such as birds (analyzing risks of collisionwith wind turbines; Croft et al., 2015), fish (predicting the location of Capelin off theIcelandic shores; Barbaro et al., 2009), and living cells (studying the collective cell dynamicsof tissue cells in micro-fabricated arenas; Szabo et al., 2006). The study of pedestrianflow through bottlenecks has a rich history of over 100 years (e.g., Helbing, 2001;Appert-Rolland et al., 2009). Some of the basic phenomena reported to be associatedwith a locally reduced mobility or increased density include a drop in flow capacity(depending on bottleneck width), division into free-flowing and congested areas,appearance of shock-like waves, and more. Ample research has also been conducted on theinteractions of swarms of autonomous agents (robots) with obstacles (e.g., Trianni, Nolfi& Dorigo, 2006) and of virtual particles, within the scope of swarm optimization methods(e.g., Shklarsh et al., 2011).
In contrast to the theoretical studies discussed above, relatively few experimental reportsare available on the macroscopic dynamics of collectively moving organisms within anheterogeneous environment. These include microbial swarms interacting within complexsubstrates (Tuson & Weibel, 2013), tissue cells in micro-fabricated arenas (motivated by thehighly heterogeneousmedia that form the extracellularmatrix; e.g., Friedl & Broecker, 2004;Szabo et al., 2006), and pedestrians at bottlenecks, demonstrating a continuous reduction
Amichay et al. (2016), PeerJ, DOI 10.7717/peerj.2742 2/20

in flow capacity following a reduction in bottleneck width (Hoogendoorn & Daamen, 2005;Appert-Rolland et al., 2009). Experiments using different species of ants have shown thattopology can have varying effects on the collective movement of the different species. Forexample, it has been shown that in Atta cephalotes (Burd et al., 2002), increased density dueto a reduction in trail width reduces the mean traveling speed and the flux of ants across abarrier. In contrast, the flow of black garden ants (Lasius niger) does not seem to depend ontrail width (Dussutour et al., 2004). To the best of our knowledge, locusts, as well as otheranimal models of collective motion, have been little studied in this respect. The movementof ants along trails fundamentally differs from that of locusts, as ants seldom turn whilewalking, being typically either non laden when exiting the nest, or laden when returningto it (Burd et al., 2002; Dussutour et al., 2004). In contrast, the frequency of turning (whenchanging from a standing to a walking state) has been found to be central in the ability oflocusts to form and maintain collective movement (Ariel et al., 2014).
This current study sought to investigate locust marching behavior in a changingtopography: in our case, a circular arena incorporating a funnel-like narrowing followed bya re-widening. This spatial heterogeneity did not constitute a major barrier to the locustsbut, rather, introduced certain simple features that are also found in natural environments,such as a path among large rocks or simply a narrowing gorge. We were interested inexamining the effects of such topographical changes on macroscopic features of the locustcollective behavior, such as the order parameter, as well as any resultant changes in statisticsof the marching behavior of individuals (e.g., speed, walking-bout duration etc.), and in thedynamics of local interactions between the insects, such as distance between neighboringmarching locusts, and how these, in turn, translate to swarm dynamics.
One of the key questions regarding the response of the individual to a changingenvironment is that of the effect of topography on the coordinated movement of thecrowd. Specifically, it is not clear whether such a response is universal, i.e., common to allswarms, from single cells to locusts and humans; or, alternatively, it significantly differsacross species. The main goal of the current study was to revisit previous experimentaland theoretical work and to provide novel insights into the effect of a specific type ofheterogeneous environment on the collective dynamics of marching locusts. In particular,we sought to unravel the mechanisms by which individual locusts alter their kinematicparameters in order to adjust to the changing environment and diminish its effect onthe swarm.
MATERIALS AND METHODSAnimalsDesert locusts, Schistocerca gregaria (Forskål), were obtained from our colony at theDepartment of Zoology, Tel Aviv University, Israel. The locusts, approaching the gregariousphase, were reared over many generations in 60-liter metal cages at a density of 100–160animals per cage, under a controlled temperature of 30 ◦C and 35–60% humidity, and a12D:12L cycle. Additional radiant heat was provided by 25W incandescent electric bulbsduring daytime to reach a final day temperature of 35–37 ◦C. The locusts were fed daily
Amichay et al. (2016), PeerJ, DOI 10.7717/peerj.2742 3/20

with wheat seedlings and dry oats. All experiments were performed on nymphs of the final(Vth) nymphal-instar (3–4 cm in length and ∼0.5 cm in width).
Behavioral setupWe conducted a series of experiments in each of which a group of nymphs was allowed tomove freely in a circular arena. The basic experimental arena was composed of a flat bluePerspex sheet circumscribed by an outer flexible blue plastic wall (60 cm diameter× 55 cmhigh). An inner circular wall made of similar plastic (diameter 30 cm) was inserted tocreate a ring shaped sphere (Fig. 1A). The different experimental conditions were achievedby either leaving the inner circle in the middle (no displacement), or moving it by 5 or10 cm sideways towards the outer wall (creating a funnel 10 or 5 cm wide, respectively;see Fig. 1B). The lower 10 cm of the arena walls were thinly coated with Fluon (WhitfordPlastics Ltd, Runcorn, UK) to prevent the nymphs from climbing. The arena was placed inour temperature-controlled room (30 ◦C) and lit from above by a 100 W ring bulb. Thepropensity of locusts to swarm in an experimental arena is highly sensitive to the numberof animals introduced into it (Buhl et al., 2006). Hence, fifty nymphs were introducedinto the arena in each experiment, which is a sufficiently high density to facilitate theformation of synchronized movement (Ellis, 1951; Buhl et al., 2006; Buhl et al., 2011; Arielet al., 2014), and also approximates the range of densities observed in the field (AAyali et al.,2013, unpublished data). The locusts were continuously monitored and their movementrecorded, using a Sony HDR-XR550E digital camera with a 30 fps rate, for later off-lineanalysis. Using a custom-designed continuous multiple-target tracking method (Ariel etal., 2014, Fig. 1C), we simultaneously tracked the movement of all individuals at highspatio-temporal resolution (full HD allowed a detailed analysis of the behavior of eachindividual). We conducted overall 15 experiments, 5 under each experimental condition(inner circle displacement of 0, 5, or 10 cm). Each experiment lasted approximately4 h, from which the last 200,000 frames were selected (ca. 2 h), for consistency betweenexperiments and to ensure that we had captured robust locust marching. These were thendivided into one hour blocks, providing ample data for statistics. A 10 min period (whichis several times longer than the typical resting or walking duration) at the end of eachblock was discarded to ensure that the blocks were independent of one another. Divisioninto a smaller number of blocks did not qualitatively change the results. Hence, we wereleft with two sections from each of the five experiments, under each of three experimentalcondition, totaling 30 experimental sections for further comparative analysis (n= 10 foreach experimental condition).
Analysis of behaviorAll data analysis was performed in the MATLAB environment (MathWorks, Natick,Massachusetts, USA). To minimize bias wherever possible, blinded methods were used toanalyze data. Following smoothing of trajectories as detailed in Ariel et al. (2014), specificattributes of the system and the individual locusts were defined and analyzed as follows.
Amichay et al. (2016), PeerJ, DOI 10.7717/peerj.2742 4/20
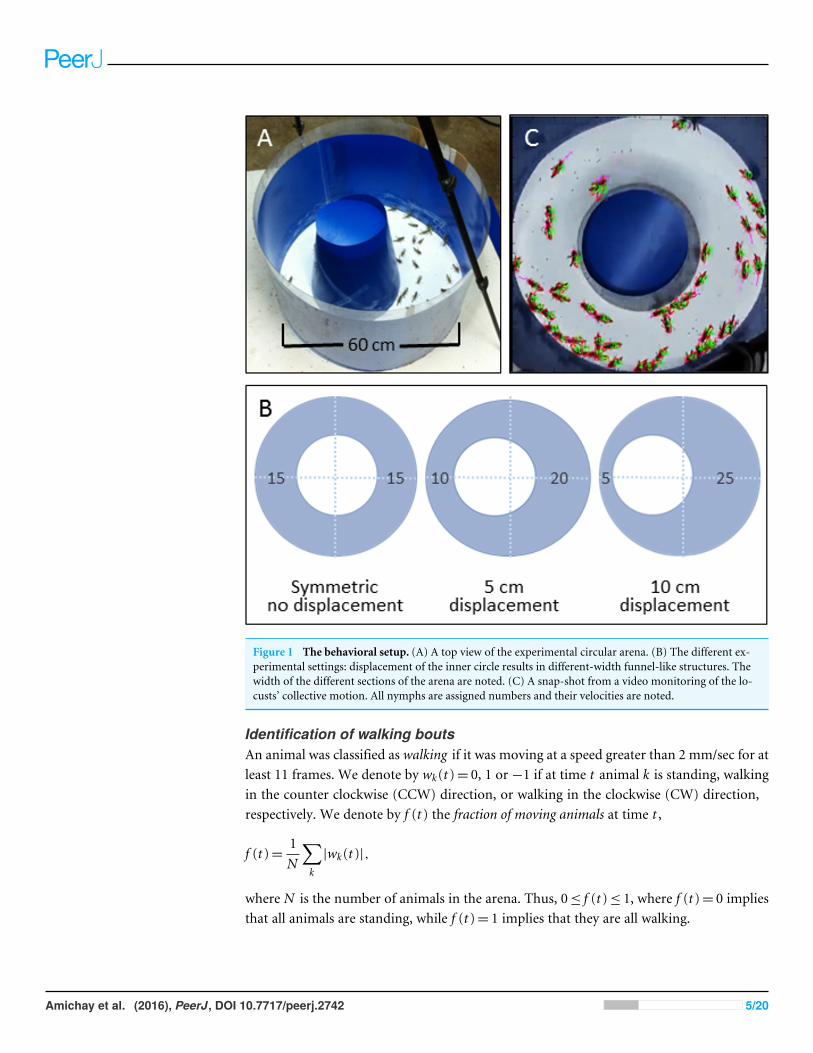
Figure 1 The behavioral setup. (A) A top view of the experimental circular arena. (B) The different ex-perimental settings: displacement of the inner circle results in different-width funnel-like structures. Thewidth of the different sections of the arena are noted. (C) A snap-shot from a video monitoring of the lo-custs’ collective motion. All nymphs are assigned numbers and their velocities are noted.
Identification of walking boutsAn animal was classified as walking if it was moving at a speed greater than 2 mm/sec for atleast 11 frames. We denote by wk(t )= 0, 1 or −1 if at time t animal k is standing, walkingin the counter clockwise (CCW) direction, or walking in the clockwise (CW) direction,respectively. We denote by f (t ) the fraction of moving animals at time t ,
f (t )=1N
∑k
|wk(t )|,
where N is the number of animals in the arena. Thus, 0≤ f (t )≤ 1, where f (t )= 0 impliesthat all animals are standing, while f (t )= 1 implies that they are all walking.
Amichay et al. (2016), PeerJ, DOI 10.7717/peerj.2742 5/20
For a given animal, the time series wk(t ) can be divided into periods of walking andresting, i.e., continuous segments in which eitherwk(t )= 1 or−1. Accordingly, we considerthe distribution of walking and resting durations, denoted twalk and trest, respectively.
Walking speedThe speed of animal k at time t is denoted vk(t ).
The order parameterTo quantify order and synchronization in the system, we defined the instantaneous orderparameter as the average direction (CW or CCW) of walking animals at time t . Moreprecisely,
φ(t )=1
Nf (t )
∑k
wk(t ). (1)
When no animals are moving, the system does not have a preferred direction and φ(t )= 0.Thus, |φ| is a measure of the level of coordination within the swarm; a value of |φ| close tozero indicates that the swarm is disorganized, with animals moving in random directions;while a value close to one indicates a highly synchronized state with all directions aligned.The sign of the order parameter indicates the direction of the swarm: positive φ refers toCCW motion, while negative φ indicates CW motion. Note thatφ here differs from theorder parameter used by many authors, since it depends only on walking animals.
Number of neighborsFor each frame, we collected all the locations of all locusts and calculated the number ofconspecifics up to a distance of 6 cm from each focal animal (corresponding to circa twolocust-body-lengths). The number of neighbors of animal k at time t is denoted nk(t ).
Number of close moving neighborsSimilar to the number of neighbors, ignoring standing animals. In other words, thenumber of moving neighbors, nmove,k(t ), defined only if animal k is moving at time t , isthe number of conspecifics walking within a distance of 6 cm from animal k. Both thenumber of neighbors and the number of moving neighbors describe the visual stimulusof an animal and have been previously shown to affect the propensity of animals to startmoving (Ariel et al., 2014).
Significance testsIn the comparison of the different arena types, the p-values (in parenthesis) report theprobability that the means of all three arenas are the same (an ANOVA analysis calculatedusing Matlab’s One-way analysis of variance function). In the comparison of the arenahalves, the p-values (in parenthesis) report the probability that the means obtained fromthe two halves are the same.
Correlation coefficientsThe correlation coefficient, ρ, where noted (between any pair of the measurementsdescribed above), is the Pearson coefficient using all data points. Correlations were
Amichay et al. (2016), PeerJ, DOI 10.7717/peerj.2742 6/20
considered as significant for |ρ|> 0.3, which, for n= 30 corresponds to a (one-sided)P-value of 0.05 or lower.
Heat map representationsAn image of the arena was divided into 248*248 pixels. For each pixel, we summed all thetimes that the center of a locust appeared in it (within one experiment). In order to accountfor differences between the experiments in terms of overall density, we summed the valuesfrom all the pixels together and divided the value of each pixel by that sum. In other words,each pixel now had a value representing the fraction of the animals in that experiment. Wevisualized this by representing each pixel, according to its value, with a specific color.
Because trajectories are smoothed, they are not as accurate as the raw resolution allows(the error is 3–5 pixels, corresponding to about 1 mm). Hence, the reduced resolutionused for heat-maps (and only for heat maps) allows convenient representation without anysignificant loss of accuracy.
Heat map of movementSimilar to the heat map, with only moving animals taken into account.
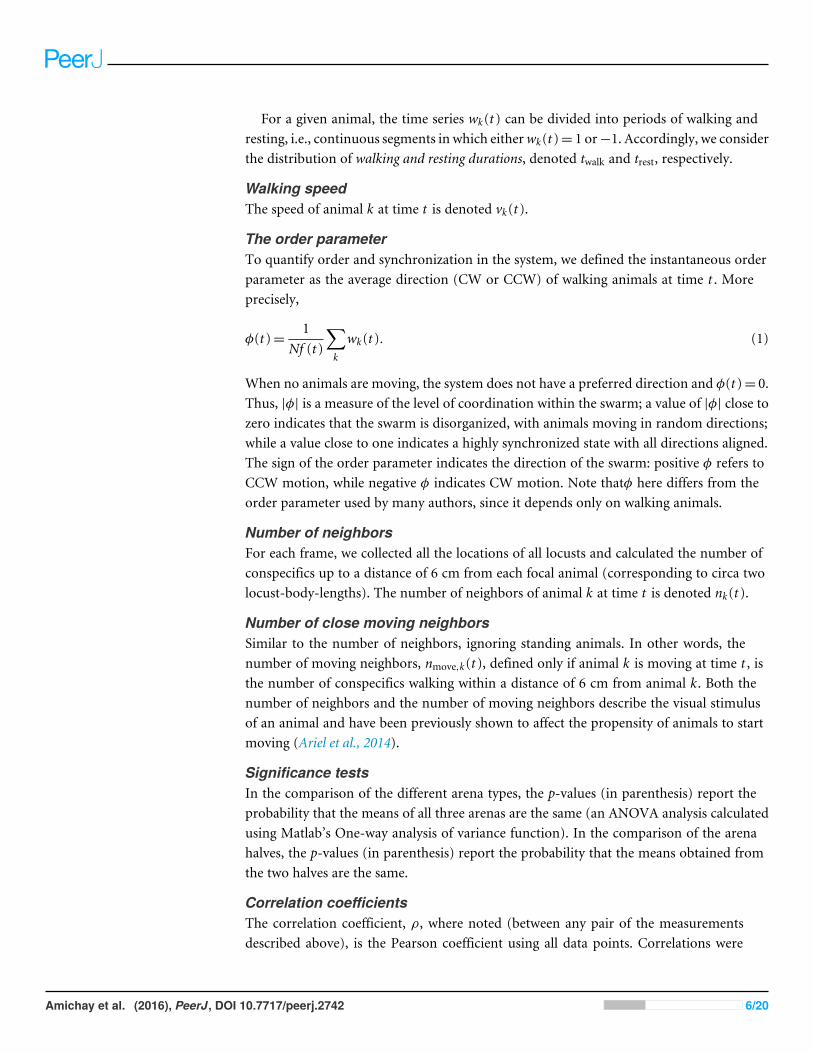
RESULTSChanging topography does not affect the global parameters of thelocust collective motionThe order parameter, φ(t ), is an accepted measure of synchronization in a system (Buhl etal., 2006; Ariel & Ayali, 2015). Fig. 2A presents two examples of the evolution of the orderparameter and the overall fraction of walking locusts, f (t ), during a 50 min time sectionin our experiments. In accordance with these examples, when plotting the average of |φ|against f in all experiments, they were consistently found to be highly correlated (Fig. 2B),confirming previous findings regarding the increased tendency of animals to join theirconspecifics as the number of walkers increases (Ariel et al., 2014). Neither this correlationnor the actual magnitude of ϕ and f were affected by the topography of the arena, i.e., theywere independent of the displacement of the inner circle, d (Figs. 2C and 2D, p-values 0.57and 0.53, respectively).
Other attributes of the overall kinematics of the marching locusts were also not affectedby the arena topography (Figs. 3). These include the average speed of all locusts in thearena (Fig. 3A, p-value 0.99), and the duration of a locust’s walking or pausing bout(Figs. 3C and 2D p-values 0.4 and 0.41). This is not surprising, as many of the marchingkinematics showed a significant correlation with ϕ and with f , again irrespective of thearena topography (see for example a plot of speed vs. f , Fig. 3B). No differences indensity-related parameters, such as the number of locusts or of marching locusts only,within a short range from a focal locust were found (Figs. 3E and 3F p-values 0.55 and 0.19).
Amichay et al. (2016), PeerJ, DOI 10.7717/peerj.2742 7/20
Figure 2 Global parameters of the locust collective motion. (A) The correlated changes in the orderparameter, ϕ (blue), and the overall fraction of walking locusts, f (red), during a 50 min section of twoexperiments. (B) The correlation between the size of the order parameter, |φ|, and the overall fractionof walking locusts, f , in all the experiments with the different arenas, as depicted in Fig. 1B: symmetrical(red), 5 cm (blue) and 10 cm displacement (black). N = 10 each. Linear regression is shown in solid linesand the significance of the regression is noted. (C) The overall fraction of walking locusts, f (C1) and thecalculated average order parameter, |φ| (C2) in the different arenas. No arena-type-related differenceswere found and the non-significant correlation is noted.
Effect of changes in topography as reflected by comparing differentparts of the arenasIn contrast to the above findings, a comparative investigation of the local environmentswithin the different experimental arenas (the wide vs. narrow half or, alternatively,the narrowing vs. re-widening section; Fig. 1B) revealed clear effects of the changingtopography. Each arena was divided into two equal-area halves. In the case of thesymmetrical condition this resulted in two similar-interchangeable halves. In theasymmetrical-heterogeneous conditions, one section contained the funnel and the othersection constituted the wider area (Fig. 1B; left and right halves of the arena, respectively).
Amichay et al. (2016), PeerJ, DOI 10.7717/peerj.2742 8/20
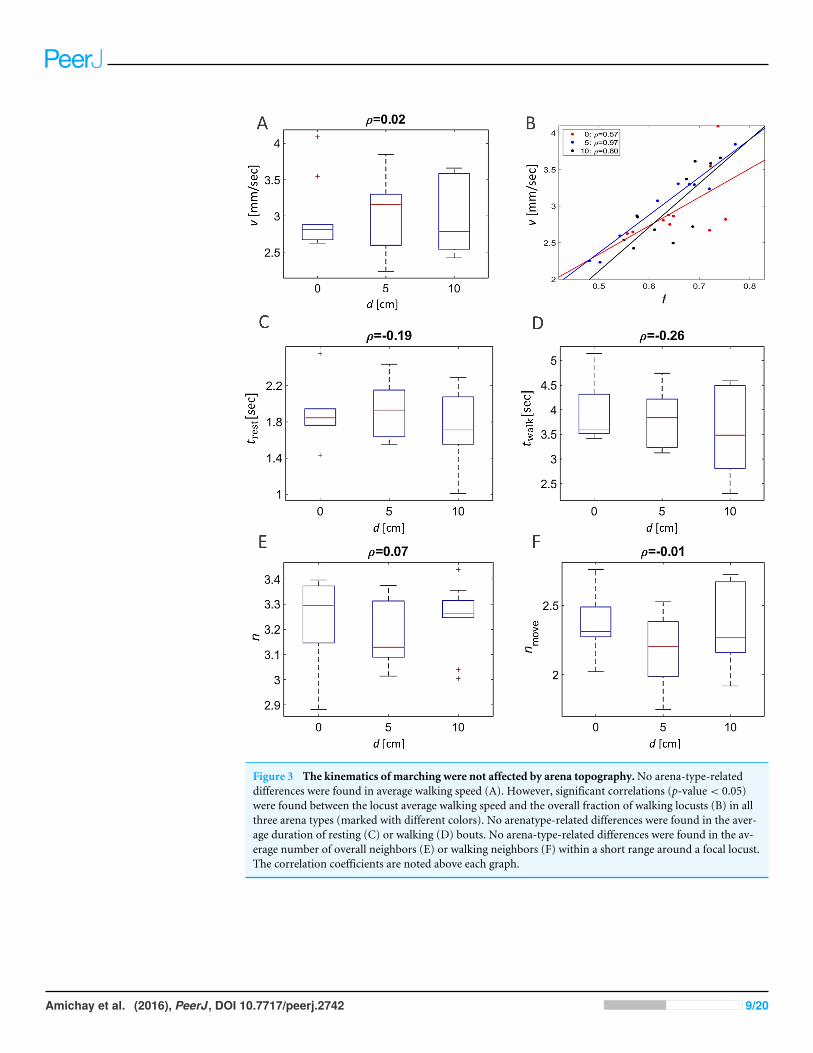
Figure 3 The kinematics of marching were not affected by arena topography.No arena-type-relateddifferences were found in average walking speed (A). However, significant correlations (p-value< 0.05)were found between the locust average walking speed and the overall fraction of walking locusts (B) in allthree arena types (marked with different colors). No arenatype-related differences were found in the aver-age duration of resting (C) or walking (D) bouts. No arena-type-related differences were found in the av-erage number of overall neighbors (E) or walking neighbors (F) within a short range around a focal locust.The correlation coefficients are noted above each graph.
Amichay et al. (2016), PeerJ, DOI 10.7717/peerj.2742 9/20
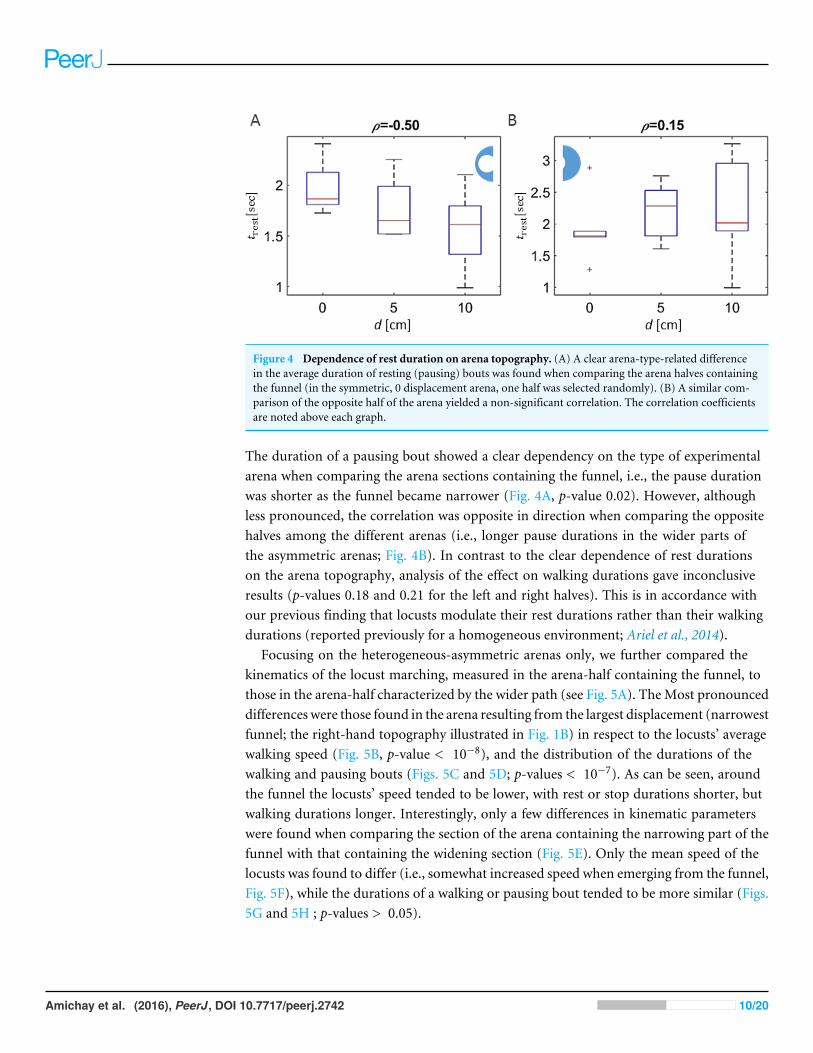
Figure 4 Dependence of rest duration on arena topography. (A) A clear arena-type-related differencein the average duration of resting (pausing) bouts was found when comparing the arena halves containingthe funnel (in the symmetric, 0 displacement arena, one half was selected randomly). (B) A similar com-parison of the opposite half of the arena yielded a non-significant correlation. The correlation coefficientsare noted above each graph.
The duration of a pausing bout showed a clear dependency on the type of experimentalarena when comparing the arena sections containing the funnel, i.e., the pause durationwas shorter as the funnel became narrower (Fig. 4A, p-value 0.02). However, althoughless pronounced, the correlation was opposite in direction when comparing the oppositehalves among the different arenas (i.e., longer pause durations in the wider parts ofthe asymmetric arenas; Fig. 4B). In contrast to the clear dependence of rest durationson the arena topography, analysis of the effect on walking durations gave inconclusiveresults (p-values 0.18 and 0.21 for the left and right halves). This is in accordance withour previous finding that locusts modulate their rest durations rather than their walkingdurations (reported previously for a homogeneous environment; Ariel et al., 2014).
Focusing on the heterogeneous-asymmetric arenas only, we further compared thekinematics of the locust marching, measured in the arena-half containing the funnel, tothose in the arena-half characterized by the wider path (see Fig. 5A). TheMost pronounceddifferences were those found in the arena resulting from the largest displacement (narrowestfunnel; the right-hand topography illustrated in Fig. 1B) in respect to the locusts’ averagewalking speed (Fig. 5B, p-value < 10−8), and the distribution of the durations of thewalking and pausing bouts (Figs. 5C and 5D; p-values < 10−7). As can be seen, aroundthe funnel the locusts’ speed tended to be lower, with rest or stop durations shorter, butwalking durations longer. Interestingly, only a few differences in kinematic parameterswere found when comparing the section of the arena containing the narrowing part of thefunnel with that containing the widening section (Fig. 5E). Only the mean speed of thelocusts was found to differ (i.e., somewhat increased speed when emerging from the funnel,Fig. 5F), while the durations of a walking or pausing bout tended to be more similar (Figs.5G and 5H ; p-values > 0.05).
Amichay et al. (2016), PeerJ, DOI 10.7717/peerj.2742 10/20
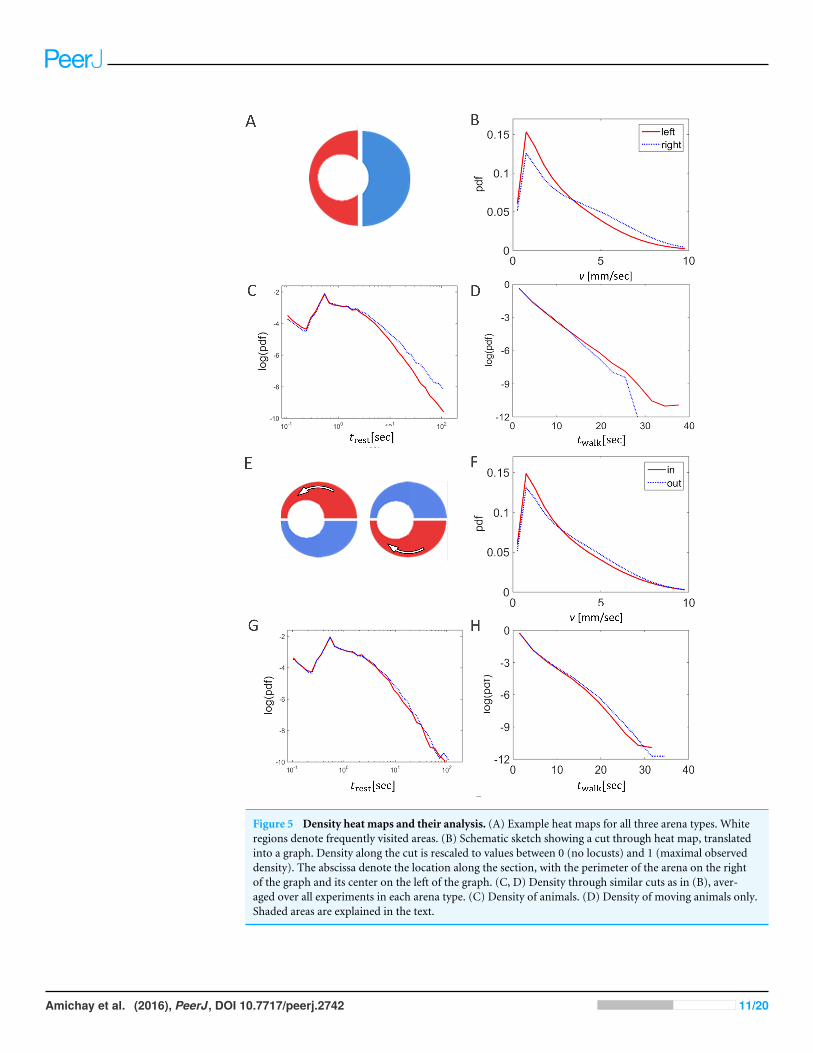
Figure 5 Density heat maps and their analysis. (A) Example heat maps for all three arena types. Whiteregions denote frequently visited areas. (B) Schematic sketch showing a cut through heat map, translatedinto a graph. Density along the cut is rescaled to values between 0 (no locusts) and 1 (maximal observeddensity). The abscissa denote the location along the section, with the perimeter of the arena on the rightof the graph and its center on the left of the graph. (C, D) Density through similar cuts as in (B), aver-aged over all experiments in each arena type. (C) Density of animals. (D) Density of moving animals only.Shaded areas are explained in the text.
Amichay et al. (2016), PeerJ, DOI 10.7717/peerj.2742 11/20
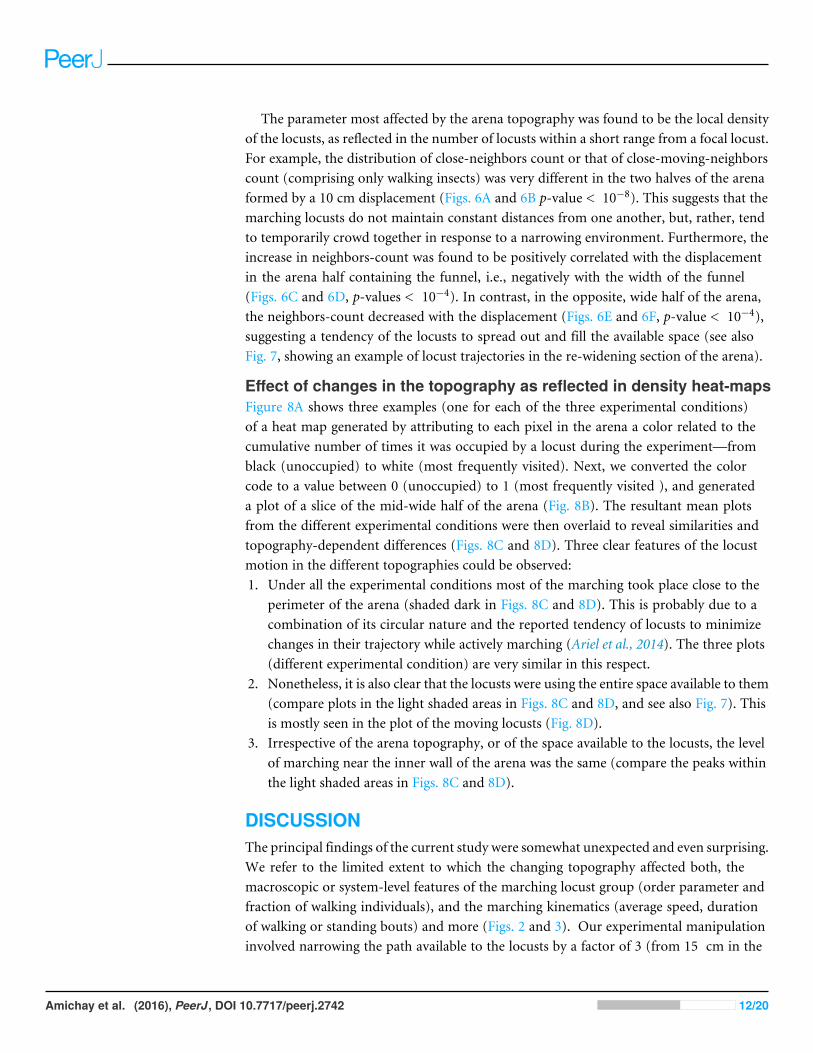
The parameter most affected by the arena topography was found to be the local densityof the locusts, as reflected in the number of locusts within a short range from a focal locust.For example, the distribution of close-neighbors count or that of close-moving-neighborscount (comprising only walking insects) was very different in the two halves of the arenaformed by a 10 cm displacement (Figs. 6A and 6B p-value < 10−8). This suggests that themarching locusts do not maintain constant distances from one another, but, rather, tendto temporarily crowd together in response to a narrowing environment. Furthermore, theincrease in neighbors-count was found to be positively correlated with the displacementin the arena half containing the funnel, i.e., negatively with the width of the funnel(Figs. 6C and 6D, p-values < 10−4). In contrast, in the opposite, wide half of the arena,the neighbors-count decreased with the displacement (Figs. 6E and 6F, p-value < 10−4),suggesting a tendency of the locusts to spread out and fill the available space (see alsoFig. 7, showing an example of locust trajectories in the re-widening section of the arena).
Effect of changes in the topography as reflected in density heat-mapsFigure 8A shows three examples (one for each of the three experimental conditions)of a heat map generated by attributing to each pixel in the arena a color related to thecumulative number of times it was occupied by a locust during the experiment—fromblack (unoccupied) to white (most frequently visited). Next, we converted the colorcode to a value between 0 (unoccupied) to 1 (most frequently visited ), and generateda plot of a slice of the mid-wide half of the arena (Fig. 8B). The resultant mean plotsfrom the different experimental conditions were then overlaid to reveal similarities andtopography-dependent differences (Figs. 8C and 8D). Three clear features of the locustmotion in the different topographies could be observed:1. Under all the experimental conditions most of the marching took place close to the
perimeter of the arena (shaded dark in Figs. 8C and 8D). This is probably due to acombination of its circular nature and the reported tendency of locusts to minimizechanges in their trajectory while actively marching (Ariel et al., 2014). The three plots(different experimental condition) are very similar in this respect.
2. Nonetheless, it is also clear that the locusts were using the entire space available to them(compare plots in the light shaded areas in Figs. 8C and 8D, and see also Fig. 7). Thisis mostly seen in the plot of the moving locusts (Fig. 8D).
3. Irrespective of the arena topography, or of the space available to the locusts, the levelof marching near the inner wall of the arena was the same (compare the peaks withinthe light shaded areas in Figs. 8C and 8D).
DISCUSSIONThe principal findings of the current study were somewhat unexpected and even surprising.We refer to the limited extent to which the changing topography affected both, themacroscopic or system-level features of the marching locust group (order parameter andfraction of walking individuals), and the marching kinematics (average speed, durationof walking or standing bouts) and more (Figs. 2 and 3). Our experimental manipulationinvolved narrowing the path available to the locusts by a factor of 3 (from 15 cm in the
Amichay et al. (2016), PeerJ, DOI 10.7717/peerj.2742 12/20

Figure 6 A comparison of locust densities in the narrow and wide halves of the arena. As expected, thenumber of neighbors (both total as well as walking only) within 6 cm of a moving focal animal is highlydependent on the displacement (type of arena). (A) Distribution of the number of neighbors (left) ormoving neighbors (right) in the arena with a 10 cm displacement (narrowest funnel; curve colors matchthe halves of the arena in the enclosed schematic drawing). (B) Average number of neighbors in each ex-periment (narrow half). (C) Average number of neighbors in each experiment (wide half). The correlationcoefficients are noted above each graph.
Amichay et al. (2016), PeerJ, DOI 10.7717/peerj.2742 13/20
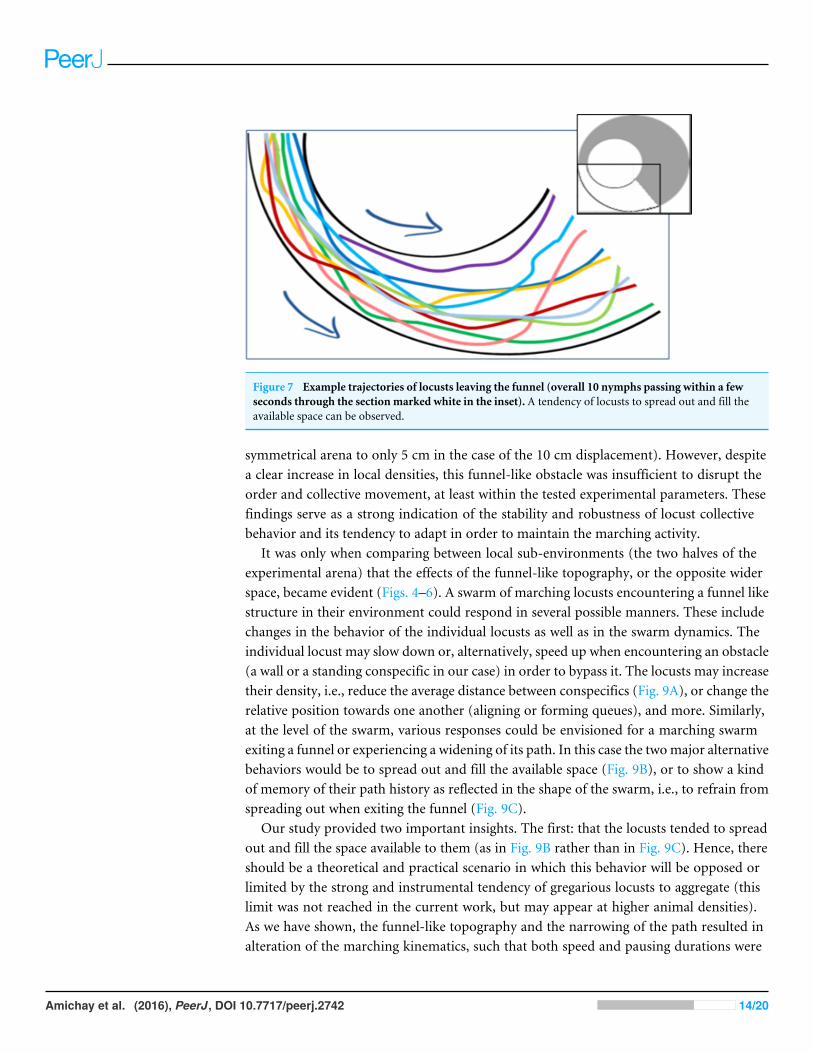
Figure 7 Example trajectories of locusts leaving the funnel (overall 10 nymphs passing within a fewseconds through the section marked white in the inset). A tendency of locusts to spread out and fill theavailable space can be observed.
symmetrical arena to only 5 cm in the case of the 10 cm displacement). However, despitea clear increase in local densities, this funnel-like obstacle was insufficient to disrupt theorder and collective movement, at least within the tested experimental parameters. Thesefindings serve as a strong indication of the stability and robustness of locust collectivebehavior and its tendency to adapt in order to maintain the marching activity.
It was only when comparing between local sub-environments (the two halves of theexperimental arena) that the effects of the funnel-like topography, or the opposite widerspace, became evident (Figs. 4–6). A swarm of marching locusts encountering a funnel likestructure in their environment could respond in several possible manners. These includechanges in the behavior of the individual locusts as well as in the swarm dynamics. Theindividual locust may slow down or, alternatively, speed up when encountering an obstacle(a wall or a standing conspecific in our case) in order to bypass it. The locusts may increasetheir density, i.e., reduce the average distance between conspecifics (Fig. 9A), or change therelative position towards one another (aligning or forming queues), and more. Similarly,at the level of the swarm, various responses could be envisioned for a marching swarmexiting a funnel or experiencing a widening of its path. In this case the twomajor alternativebehaviors would be to spread out and fill the available space (Fig. 9B), or to show a kindof memory of their path history as reflected in the shape of the swarm, i.e., to refrain fromspreading out when exiting the funnel (Fig. 9C).
Our study provided two important insights. The first: that the locusts tended to spreadout and fill the space available to them (as in Fig. 9B rather than in Fig. 9C). Hence, thereshould be a theoretical and practical scenario in which this behavior will be opposed orlimited by the strong and instrumental tendency of gregarious locusts to aggregate (thislimit was not reached in the current work, but may appear at higher animal densities).As we have shown, the funnel-like topography and the narrowing of the path resulted inalteration of the marching kinematics, such that both speed and pausing durations were
Amichay et al. (2016), PeerJ, DOI 10.7717/peerj.2742 14/20
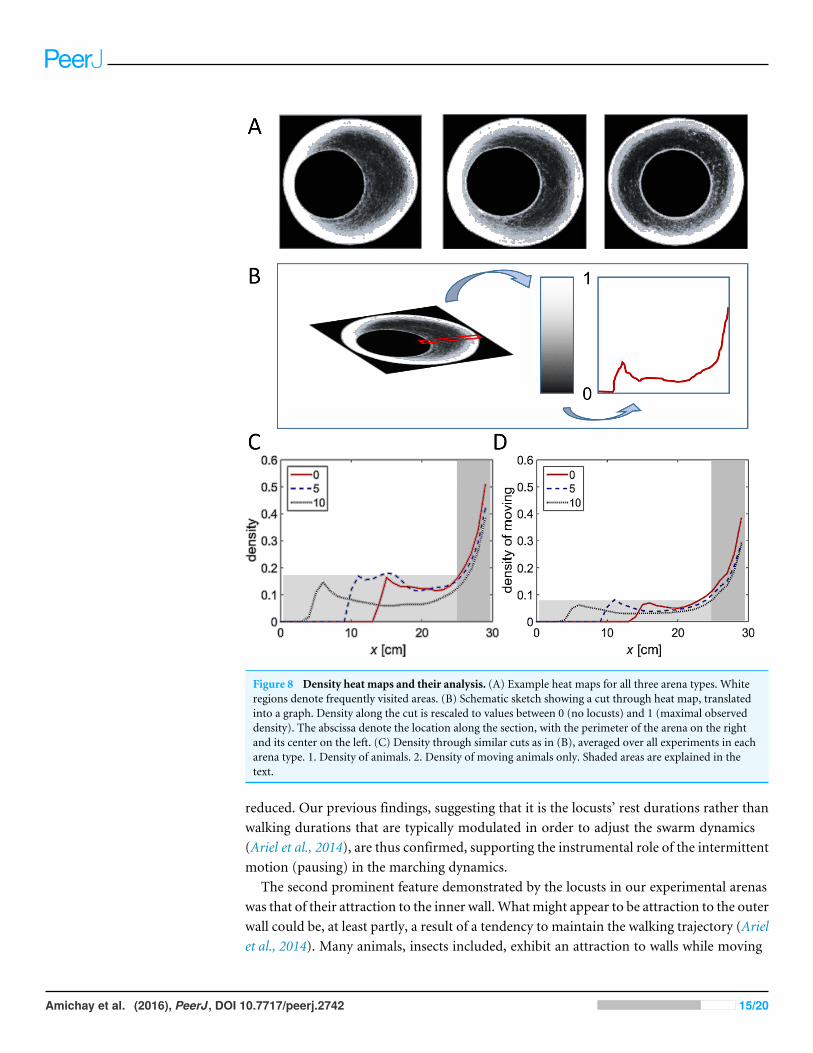
Figure 8 Density heat maps and their analysis. (A) Example heat maps for all three arena types. Whiteregions denote frequently visited areas. (B) Schematic sketch showing a cut through heat map, translatedinto a graph. Density along the cut is rescaled to values between 0 (no locusts) and 1 (maximal observeddensity). The abscissa denote the location along the section, with the perimeter of the arena on the rightand its center on the left. (C) Density through similar cuts as in (B), averaged over all experiments in eacharena type. 1. Density of animals. 2. Density of moving animals only. Shaded areas are explained in thetext.
reduced. Our previous findings, suggesting that it is the locusts’ rest durations rather thanwalking durations that are typically modulated in order to adjust the swarm dynamics(Ariel et al., 2014), are thus confirmed, supporting the instrumental role of the intermittentmotion (pausing) in the marching dynamics.
The second prominent feature demonstrated by the locusts in our experimental arenaswas that of their attraction to the inner wall.Whatmight appear to be attraction to the outerwall could be, at least partly, a result of a tendency to maintain the walking trajectory (Arielet al., 2014). Many animals, insects included, exhibit an attraction to walls while moving
Amichay et al. (2016), PeerJ, DOI 10.7717/peerj.2742 15/20
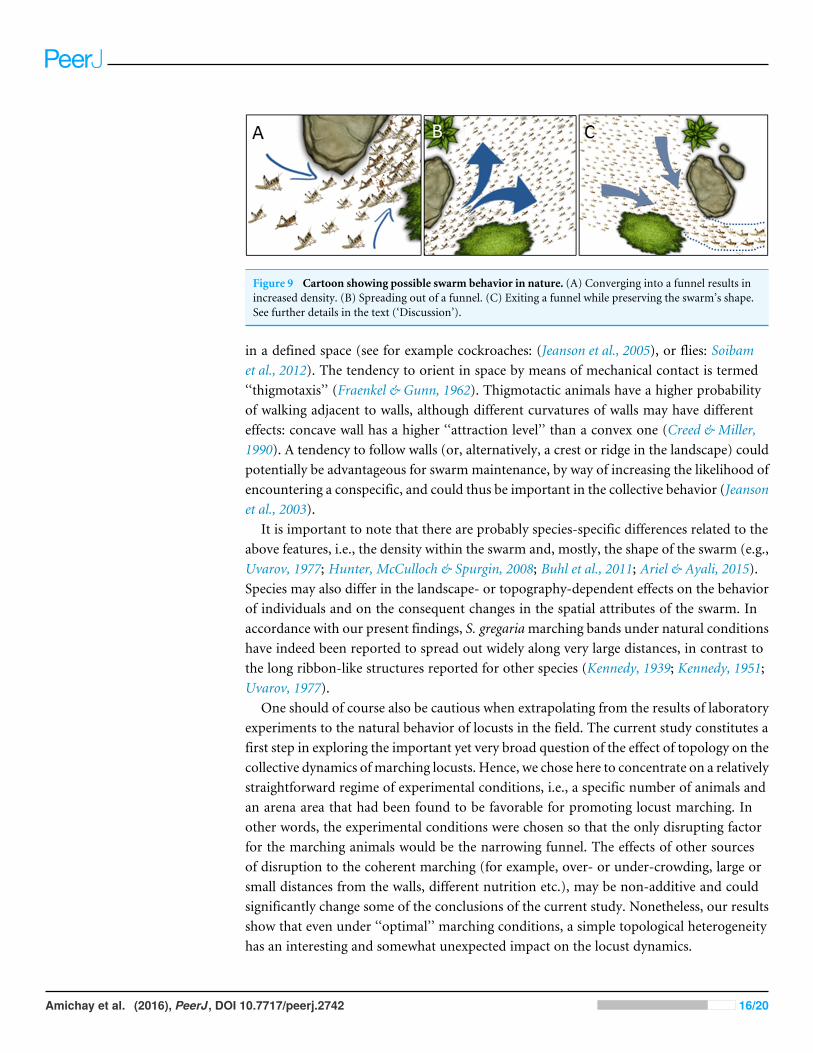
Figure 9 Cartoon showing possible swarm behavior in nature. (A) Converging into a funnel results inincreased density. (B) Spreading out of a funnel. (C) Exiting a funnel while preserving the swarm’s shape.See further details in the text (‘Discussion’).
in a defined space (see for example cockroaches: (Jeanson et al., 2005), or flies: Soibamet al., 2012). The tendency to orient in space by means of mechanical contact is termed‘‘thigmotaxis’’ (Fraenkel & Gunn, 1962). Thigmotactic animals have a higher probabilityof walking adjacent to walls, although different curvatures of walls may have differenteffects: concave wall has a higher ‘‘attraction level’’ than a convex one (Creed & Miller,1990). A tendency to follow walls (or, alternatively, a crest or ridge in the landscape) couldpotentially be advantageous for swarm maintenance, by way of increasing the likelihood ofencountering a conspecific, and could thus be important in the collective behavior (Jeansonet al., 2003).
It is important to note that there are probably species-specific differences related to theabove features, i.e., the density within the swarm and, mostly, the shape of the swarm (e.g.,Uvarov, 1977; Hunter, McCulloch & Spurgin, 2008; Buhl et al., 2011; Ariel & Ayali, 2015).Species may also differ in the landscape- or topography-dependent effects on the behaviorof individuals and on the consequent changes in the spatial attributes of the swarm. Inaccordance with our present findings, S. gregariamarching bands under natural conditionshave indeed been reported to spread out widely along very large distances, in contrast tothe long ribbon-like structures reported for other species (Kennedy, 1939; Kennedy, 1951;Uvarov, 1977).
One should of course also be cautious when extrapolating from the results of laboratoryexperiments to the natural behavior of locusts in the field. The current study constitutes afirst step in exploring the important yet very broad question of the effect of topology on thecollective dynamics of marching locusts. Hence, we chose here to concentrate on a relativelystraightforward regime of experimental conditions, i.e., a specific number of animals andan arena area that had been found to be favorable for promoting locust marching. Inother words, the experimental conditions were chosen so that the only disrupting factorfor the marching animals would be the narrowing funnel. The effects of other sourcesof disruption to the coherent marching (for example, over- or under-crowding, large orsmall distances from the walls, different nutrition etc.), may be non-additive and couldsignificantly change some of the conclusions of the current study. Nonetheless, our resultsshow that even under ‘‘optimal’’ marching conditions, a simple topological heterogeneityhas an interesting and somewhat unexpected impact on the locust dynamics.
Amichay et al. (2016), PeerJ, DOI 10.7717/peerj.2742 16/20
Finally, we emphasize our findings regarding the capacity of locusts to adapt theirresponse to their surroundings (the swarm dynamics) in order to compensate for barriersand bottlenecks in their path. Such behavioral strategies can explain the non-intuitiveindependence of the order parameter from the funnel width. This experimental findingcontradicts several previous theoretical predictions, which suggested that environmentalheterogeneities can qualitatively alter the dynamics of collectively moving particles in acomplex way—decreasing the flux through the bottleneck, promoting particular swarmingpatterns, and even changing the phase-behavior of the system (see Introduction fordetails). Our results show that, at least under the density regimes tested, persistent andstable dynamics can be promoted by means of individual adaptability. For example,whereas Shklarsh et al. (2011) demonstrated that individual adaptability can enhancesearch efficiency in swarm optimization methods, our results suggest that adaptabilitycan lead to an opposite effect and increase robustness and resilience. Future experimentaland theoretical studies should thus investigate organisms and models with performance-adaptable interactions.
ADDITIONAL INFORMATION AND DECLARATIONS
FundingThis work was supported by an Israel Ministry of Agriculture grant (891-0277-13) toProf. Amir Ayali and an NSF Research Network on kinetic equations (KI-Net) (1107444and 1107465) to Dr. Gil Ariel. The funders had no role in study design, data collection andanalysis, decision to publish, or preparation of the manuscript.
Grant DisclosuresThe following grant information was disclosed by the authors:Israel Ministry of Agriculture: 891-0277-13.NSF Research Network on kinetic equations (KI-Net): 1107444, 1107465.
Competing InterestsThe authors declare there are no competing interests.
Author Contributions• Guy Amichay performed the experiments, wrote the paper, prepared figures and/ortables, reviewed drafts of the paper.• Gil Ariel conceived and designed the experiments, analyzed the data, contributedreagents/materials/analysis tools, wrote the paper, prepared figures and/or tables,reviewed drafts of the paper.• Amir Ayali conceived and designed the experiments, wrote the paper, prepared figuresand/or tables, reviewed drafts of the paper.
Data AvailabilityThe following information was supplied regarding data availability:
Ayali, Amir (2016): Asymmetric arena.MTS. figshare.
Amichay et al. (2016), PeerJ, DOI 10.7717/peerj.2742 17/20
10.6084/m9.figshare.3545844.v1;Ayali, Amir (2016): Symmetric arena.MTS. figshare.10.6084/m9.figshare.3545841.v3.
REFERENCESAppert-Rolland C, Chevoir F, Gondret P, Lassarre S, Lebacque JP, SchreckenbergM
(eds.) 2009. Traffic and granular flow’07. Berlin, Heidelberg: Springer Science &Business Media.
Ariel G, Ayali A. 2015. Locust collective motion and its modeling. PLoS ComputationalBiology 11(12):e1004522 DOI 10.1371/journal.pcbi.1004522.
Ariel G, Ophir Y, Levi S, Ben-Jacob E, Ayali A. 2014. Individual pause-and-go motionis instrumental to the formation and maintenance of swarms of marching locustnymphs. PLoS ONE 9(7):e101636 DOI 10.1371/journal.pone.0101636.
Ariel G, Shklarsh A, Kalisman O, Ingham C, Ben-Jacob E. 2013. From organizedinternal traffic to collective navigation of bacterial swarms. New Journal of Physics15(12):125019 DOI 10.1088/1367-2630/15/12/125019.
Barbaro ABT, Taylor K, Trethewey PF, Youseff L, Birnir B. 2009. Discrete and contin-uous models of the dynamics of pelagic fish: application to the capelin.Mathematicsand Computers in Simulation 79:3397–3414 DOI 10.1016/j.matcom.2008.11.018.
Bazazi S, Bartumeus F, Hale JJ, Couzin ID. 2012. Intermittent motion in desert locusts:behavioral complexity in simple environments. PLoS Computational Biology8(5):e1002498 DOI 10.1371/journal.pcbi.1002498.
Buhl J, Sumpter DJ, Couzin ID, Hale JJ, Despland E, Miller ER, Simpson SJ. 2006.From disorder to order in marching locusts. Science 312(5778):1402–1406DOI 10.1126/science.1125142.
Buhl J, Sword GA, Clissold FJ, Simpson SJ. 2011. Group structure in locust migratorybands. Behavioral Ecology and Sociobiology 65(2):265–273DOI 10.1007/s00265-010-1041-x.
BurdM, Archer D, Aranwela N, Stradling DJ. 2002. Traffic dynamics of the leaf-cuttingant, Atta cephalotes. The American Naturalist 159(3):283–293 DOI 10.1086/338541.
Chepizhko O, Altmann EG, Peruani F. 2013. Optimal noise maximizes collective motionin heterogeneous media. Physical Review Letters 110(23):238101DOI 10.1103/PhysRevLett.110.238101.
Chepizhko O, Peruani F. 2015. Active particles in heterogeneous media displaynew physics. European Physical Journal—Special Topics 224(7):1287–1302DOI 10.1140/epjst/e2015-02460-5.
Creed Jr RP, Miller JR. 1990. Interpreting animal wall-following behavior. Experientia46(7):758–761 DOI 10.1007/BF01939959.
Croft S, Budgey R, Pitchford JW,Wood AJ. 2015. Obstacle avoidance in social groups:new insights from asynchronous models. Journal of the Royal Society Interface12:20150178 DOI 10.1098/rsif.2015.0178.
Amichay et al. (2016), PeerJ, DOI 10.7717/peerj.2742 18/20
Czirok A, Ben-Jacob E, Cohen I, Vicsek T. 1996. Formation of complex bacterialcolonies via self-generated vortices. Physical Review E 54:1791.
Drocco JA, Reichhardt CJO, Reichhardt C. 2012. Bidirectional sorting of flockingparticles in the presence of asymmetric barriers. Physical Review E 85:056102DOI 10.1103/PhysRevE.85.056102.
Duparcmeur YL, Herrmann H, Troadec JP. 1995. Spontaneous formation of vortex in asystem of self motorised particles. Journal de Physique I 5:1119–1128.
Dussutour A, Fourcassie V, Helbing D, Deneubourg JL. 2004. Optimal trafficorganization in ants under crowded conditions. Nature 428(6978):70–73DOI 10.1038/nature02345.
Ellis PE. 1951. The marching behaviour of hoppers of the african migratory locust(Locusta migratoria migratorioides R. & F.) in the laboratory. Anti-Locust Bulletin7:1–46.
Ellis PE, Ashall C. 1957. Field studies on diurnal behaviour, movement and aggregationin the Desert Locust (Schistocerca gregaria Forskål). Anti-Locust Bulletin 25:1–94.
Fraenkel GS, Gunn DL. 1962. The orientation of animals: Kineses, taxes and compassreactions. New York: Dover.
Friedl P, Broecker EB. 2004. The biology of cell locomotion within a three dimensionalextracellular matrix. Cellular and Molecular Life Sciences 57:41–64.
Hatzikirou H, Deutsch A. 2008. Cellular automata as microscopic models of cellmigration in heterogeneous environments. Current Topics in Developmental Biology81:401–434 DOI 10.1016/S0070-2153(07)81014-3.
Helbing D. 2001. Traffic and related self-driven many-particle systems. Reviews ofModern Physics 73(4):1067–1141 DOI 10.1103/RevModPhys.73.1067.
Hernandez-Ortiz JP, Stoltz CG, GrahamMD. 2005. Transport and collective dynamicsin suspensions of confined swimming particles. Physical Review Letters 95:204501DOI 10.1103/PhysRevLett.95.204501.
Hernandez-Ortiz JP, Underhill PT, GrahamMD. 2009. Dynamics of confined suspen-sions of swimming particles. Journal of Physics: Condensed Matter 21:204107.
Hoogendoorn SP, DaamenW. 2005. Pedestrian behavior at bottlenecks. Transportation,Science 39(2):147–159 DOI 10.1287/trsc.1040.0102.
Hunter DM,McCulloch L, Spurgin PA. 2008. Aerial detection of nymphal bands ofthe Australian plague locust (Chortoicetes terminifera (Walker)) (Orthoptera:Acrididae). Crop Prot. 27(1):118–123.
Jeanson R, Blanco S, Fournier R, Deneubourg JL, Fourcassié V, Theraulaz G. 2003.A model of animal movements in a bounded space. Journal of Theoretical Biology225(4):443–451 DOI 10.1016/S0022-5193(03)00277-7.
Jeanson R, Rivault C, Deneubourg JL, Blanco S, Fournier R, Jost C, Theraulaz G.2005. Self-organized aggregation in cockroaches. Animal Behavior 69(1):169–180DOI 10.1016/j.anbehav.2004.02.009.
Kennedy JS. 1939. The behaviour of the Desert Locust (Schistocerca gregaria (Forsk.))(Orthopt.) in an outbreak centre. Transactions of the Entomological Society of London89(10):385–542.
Amichay et al. (2016), PeerJ, DOI 10.7717/peerj.2742 19/20
Kennedy JS. 1951. The migration of the Desert Locust (Schistocerca gregaria Forsk.). I.The behaviour of swarms. II. A theory of long-range migrations. Philosophical Trans-actions of the Royal Society of London 235(625):163–290 DOI 10.1098/rstb.1951.0003.
Potiguar FQ, Farias GA, FerreiraWP. 2014. Self-propelled particle transport in regulararrays of rigid asymmetric obstacles. Physical Review E 90:012307.
Quint DA, Gopinathan A. 2015. Topologically induced swarming phase transition on a2D percolated lattice. Physical Biology 12:046008 DOI 10.1088/1478-3975/12/4/046008.
Shklarsh A, Ariel G, Schneidman E, Ben-Jacob E. 2011. Smart swarms of bacteria-inspired agents with performance adaptable interactions. PLoS ComputationalBiology 7(9):e1002177 DOI 10.1371/journal.pcbi.1002177.
Soibam B, Goldfeder RL, Manson-Bishop C, Gamblin R, Pletcher SD, Shah S, Gu-naratne GH, Roman GW. 2012.Modeling Drosophila positional preferences in openfield arenas with directional persistence and wall attraction. PLoS ONE 7(10):e46570DOI 10.1371/journal.pone.0046570.
Szabo B, Szollosi GJ, Gonci B, Juranyi ZS, Selmeczi D, Vicsek T. 2006. Phase transitionsin the collective migration of tissue cells: experiment and model. Physical Review E74:061908 DOI 10.1103/PhysRevE.74.061908.
Trianni V, Nolfi S, DorigoM. 2006. Cooperative hole avoidance in a swarm-bot. Roboticsand Autonomous Systems 54(2):97–103 DOI 10.1016/j.robot.2005.09.018.
Tuson HH,Weibel DB. 2013. Bacteria–surface interactions. Soft Matter 9(17):4368–4380DOI 10.1039/c3sm27705d.
Uvarov B. 1977. Grasshoppers and locusts. In: A handbook of general acridology.Behaviour, ecology, biogeography, population dynamics, Vol. 2. London: Centre forOverseas Pest Research.
Amichay et al. (2016), PeerJ, DOI 10.7717/peerj.2742 20/20