Embed Size (px)
Citation preview
Coastal Carolina UniversityCCU Digital Commons
Electronic Theses and Dissertations College of Graduate Studies and Research
1-1-2017
The Effect of Artificial Light Pollution onOrientation of Hatchling Loggerhead Sea Turtles(Caretta caretta) in the Grand Strand Region,South CarolinaEmily S. AspCoastal Carolina University
Follow this and additional works at: https://digitalcommons.coastal.edu/etd
Part of the Other Ecology and Evolutionary Biology Commons
This Thesis is brought to you for free and open access by the College of Graduate Studies and Research at CCU Digital Commons. It has been acceptedfor inclusion in Electronic Theses and Dissertations by an authorized administrator of CCU Digital Commons. For more information, please [email protected].
Recommended CitationAsp, Emily S., "The Effect of Artificial Light Pollution on Orientation of Hatchling Loggerhead Sea Turtles (Caretta caretta) in theGrand Strand Region, South Carolina" (2017). Electronic Theses and Dissertations. 2.https://digitalcommons.coastal.edu/etd/2

THE EFFECT OF ARTIFICIAL LIGHT POLLUTION ON ORIENTATION OF
HATCHLING LOGGERHEAD SEA TURTLES (CARETTA CARETTA) IN THE
GRAND STRAND REGION, SOUTH CAROLINA
By
Emily S. Asp
Submitted in Partial Fulfillment of the
Requirements for the Degree of Master of Science in
Coastal Marine and Wetland Studies in the
School of Coastal and Marine System Science
Coastal Carolina University
2017
_________________________
Dr. Louis Keiner, Major Professor
_________________________
Dr. H. Erin Rickard, Committee Member
_________________________
Dr. Richard Viso, SCMSS Director
_________________________
Dr. Scott Parker, Major Professor
_________________________
Dr. Michael Roberts, Dean

ii
Copyright © 2017 by Emily S. Asp
All Rights Reserved.
iii
Dedication Page
I would like to dedicate this thesis to my advisor, mentor, confidant, and friend
Dr. Eric T. Koepfler (July 17, 1955- March 7, 2017) who none of this would have been
possible without.
I first spoke with Dr. Koepfler about a year before I decided to join the program
here at CCU. I was looking into schools and professors that I would like to work with if
given the opportunity. When I first contacted Dr. Koepfler, I could tell right away that he
was different from other professors I had spoken with. Just in our first short email he
demonstrated a care and interest in his students and his work that was unprecedented. We
arranged a phone call for the next day (which he ended up forgetting about- another piece
of his personality) to discuss what I was hoping to get from this experience and what sort
of work I wanted to do. We spoke for quite a while about what I could do for my thesis,
what sort of stuff I should do in the meantime, and how he would help me in the future. I
remember hanging up with him and feeling a real sense of peace with him and this
opportunity that was being placed in front of me. I kept thinking how he would be a great
advisor and mentor because he cared so much about my future and my work already,
after just meeting me. Later I would understand that that’s just how he was. He had the
biggest heart and cared so deeply for each of his students, often putting their needs well
before his own. Dr. Koepfler gave me a chance when others did not and I know that I
would not be in the place I am today without him.
As an advisor he had a very hands off approach. He really believed in personal
inquiry and discovery, something that could be frustrating at times, but in fact, I enjoyed
and respected. His approach really encouraged me to work out problems on my own and
trust in myself, with him available for advice along the way. He constantly stood by my
side and supported me when I had to obtain several permits to conduct my research, and
the various hoops I had to jump though to make it possible to even collect data. I knew he
always had my very best intentions at heart and would support me in anything. Even
when Dr. Koepfler was absent from the university, he still tried his best to stay in contact
with me and ask about my project despite what was going on in his own life.
For these reasons and so many more I want to thank Dr. Koepfler for being such a
wonderful advisor and mentor. Thank you for teaching me all that you did during the
time I had with you, from the intricate details of sea turtle biology, to how an office
should never be organized. Thank you for believing in me enough to bring me on as a
graduate student, and for the trusting me to figure it out along the way. Thank you for
pushing me to be the best person and researcher that I can be, and for providing me with
the tools to do it. Thank you for bringing me along to conduct research in Costa Rica, and
for expanding my horizons. Thank you for putting your heart and soul into my success.
Thank you for listening to all my concerns and helping me to resolve them. Thank you
for being my friend. I am honored to have known you and I will miss you dearly.

iv
Acknowledgements
I want to thank my advisor Dr. Eric T. Koepfler for his unwavering assistance
throughout my graduate experience. I would also like to thank my original committee
members, Dr. Louis Keiner and Dr. H. Erin Rickard, for the immense amount of support
you provided through this process. Both of you ended up taking on a far greater role than
was originally anticipated and I really appreciate you stepping up and always having my
best intentions at heart. I would also like to thank the newest member of my committee,
Dr. Scott L. Parker, for agreeing to join in and really step up last minute to ensure the
successful completion of this project. I would not have been able to do this without the
time, devotion, support, and guidance from all of you.
A grateful thank you to my funding sources for which this project would not have
been made possible without: South Carolina Space Grant and South Carolina Sea Grant
Kathryn Sullivan Earth and Marine Science Fellowship, Savannah Presbytery M.K.
Pentecost Ecology Fund, and Coastal Marine and Wetland Studies Program at Coastal
Carolina University.
Thank you to the South Carolina Department of Natural Resources for permitting
me a research grant for this study. Through their support I was able to work alongside
numerous local sea turtle nesting permit holders and volunteers, who’s help in detecting
nests and monitoring activity was crucial to the success of my project. In particular I
would like to thank Jeff McClary, Terry Graham, Mari Armstrong, Betsy Brabson, Mary
Schneider, Karen Fuss, Barbara Demusz, Mike Walker, Ann Wilson, Bill Raley and
Kathy Raley for all of your support in making this study a success.
I would also like to thank my nine undergraduate interns, John Moore, Jaime
Williams, Jasmine Smith, Abbey Chaney, Cassie Davin, Erin Dempsey, Samantha
Fallone, Ashley Ferrell, and Lisa Asaro, who worked countless nights on the beach
waiting for sea turtle nests to hatch. I would also like to thank the forty-seven
undergraduate volunteers and eleven graduate/community volunteers that assisted in
gathering data during the course of this project.
Lastly, I would like to thank the constant support of my family and friends, in
particular my mom, dad, sister, and boyfriend for their endless support and prayers during
this entire process. I really don’t believe I would have gotten to this point without each
and every one of you and for that I am extremely thankful. Thank you mom for always
checking in on me to see how my work is progressing, encouraging me when it seems
like too much to handle, and for supporting me in every decision I make. Wooley, thank
you for taking time out of your schedule to sit with me all night on the beach for weeks
straight, for keeping me sane when I am beyond sleep deprived, for allowing me to
bounce ideas off of you, for really taking my issues to heart and thinking of a logical (and
scientific) solution, for checking over my work when I need another set of eyes, and for
being my rock. I love and appreciate you more than you could ever know.

v
Table of Contents
I. Title Page ……………………………………………………….…….. pg. i
II. Copyright ………………………………………………………..…… pg. ii
III. Dedication Page ………………………………………………....…… pg. iii
IV. Acknowledgements …………………………………………….…….. pg. iv
V. List of Figures ……………………………………………….……….. pg. vi.
VI. CHAPTER 1: Introduction …………………………………..….….. pg. 1
i. Loggerhead Natural History …………………………………... pg. 1
ii. Nesting Biology ……………………………………………..… pg. 2
iii. Development …………………………………………………... pg. 3
iv. Orientation …………………………………………………….. pg. 4
v. Light Influence ………..…………………………………….… pg. 5
vi. Objectives ………………………………….………………….. pg. 6
vii. References …………………………………………………….. pg. 6
VII. CHAPTER 2: Turtle Tracking Algorithm as a
Non-Invasive Means to Track Hatchlings upon Emergence ……… pg. 8
i. Abstract ……………………………………………………..… pg. 9
ii. Introduction ………………………………………………..….. pg. 10
iii. Methods ……………………………………………………..… pg. 14
iv. Results ……………………………………………………..….. pg. 19
v. Discussion …………………………………………………..… pg. 20
vi. Acknowledgments …………………………………………….. pg. 25
vii. References ………………………………………………..…… pg. 26
VIII. CHAPTER 3: The Effect of Artificial Light on
Hatchling Orientation …………………………………………..…… pg. 40
i. Abstract ……………………………………………………..… pg. 41
ii. Introduction ………………………………………………..….. pg. 42
iii. Methods …………………………………………………..…… pg. 46
iv. Results ……………………………………………………..….. pg. 53
v. Discussion …………………………………………………..… pg. 55
vi. Acknowledgments …………………………………………….. pg. 65
vii. References ………………………………………………..…… pg. 65
IX. CHAPTER 4: General Conclusions ………………………..………. pg. 79
i. Summary ………………………………………………..…….. pg. 79
ii. Future Research ………………………………………..……… pg. 80
iii. References ……………………………………………………... pg. 84
X. Appendices ……………………………………………………..…….. pg. 86
i. Appendix A: Abbreviations …………………………………… pg. 86
ii. Appendix B: Study Site ……………………………………….. pg. 87
iii. Appendix C: Satellite Data ……………………………………. pg. 88
iv. Appendix D: Orientation Diagrams …………………………… pg. 90
vi
List of Figures
I. CHAPTER 2: Turtle Tracking Algorithm as a Non-Invasive Means to
Track Hatchlings upon Emergence
i. Fig. 1. Camera view ……………………………………………… pg. 29
ii. Fig. 2. Demo grid used to correct fisheye distortion ……………... pg. 30
iii. Fig. 3. Measurements of known 1.5 m markers ………………….. pg. 31
iv. Fig. 4. Final tracked images for a given nest …………………...... pg. 32
v. Fig. 5. Combined final tracked images …………………………... pg. 33
vi. Fig. 6. Region of interest bounding box …………………………. pg. 34
vii. Fig. 7. Orientation Deviation using MATLAB algorithm ……….. pg. 35
viii. Fig. 8. ImageJ plugin video adjustments ………………………… pg. 36
ix. Fig. 9. Comparable tracks produced in MATLAB and
ImageJ platforms …………………………………………..……… pg. 37
x. Fig. 10. Variable tracks produced in MATLAB and
ImageJ platforms ………………………………………………….. pg. 38
xi. Fig. 11. Individual track quality produced in MATLAB
and ImageJ platforms ……………………………………………... pg. 39
II. CHAPTER 3: The Effect of Artificial Light on Hatchling Orientation
i. Fig. 1. Schematic diagram of camera setup ……………………... pg. 68
ii. Fig. 2. Tracking image using MATLAB algorithm ……………... pg. 69
iii. Fig. 3. Artificial and total radiance groupings …………………... pg. 70
iv. Fig. 4. Hatchling activity levels influenced by observed
artificial radiance conditions ……………………………………... pg. 71
v. Fig. 5. Hatchling activity significantly influenced by
artificial radiance groups ………………………………………… pg. 72
vi. Fig. 6. Hatchling activity levels influenced by observed
total radiance conditions …………………………………………. pg. 73
vii. Fig. 7. Hatchling activity significantly influenced by
total radiance groups ……………………………………………... pg. 74
viii. Fig. 8. Circular histograms under observed artificial and
total radiance conditions …………………………………………. pg. 75
ix. Fig. 9. Hatchling orientation diagrams under observed
artificial and total radiance conditions …………………………… pg. 76
x. Fig. 10. Varying circular histograms and hatchling orientation
diagrams under high artificial radiance …………………………... pg. 77
xi. Fig. 11. Environmental factors influencing hatchling
activity levels under observed artificial and total radiance
conditions ………………………………………………………… pg. 78
1
CHAPTER 1: Introduction
Loggerhead sea turtle (Caretta caretta) populations are currently listed as
threatened in the United States under the Endangered Species Act (ESA) and endangered
by global standards (Ruckdeschel & Shoop 2006) as a result of both direct and indirect
anthropogenic influences. Loggerheads have been harvested for consumption of both
their eggs and meat, as well as for ornamental purposes to construct jewelry from their
shells. Numerous turtles have been caught as a result of bycatch from commercial and
recreational fisherman, and increased human development along the coast have altered
nesting habitats by increasing levels of artificial light present and increasing coastal
erosion of dunes (Salmon 2003). Increased pollutants in the ocean are ingested by
loggerheads mistaking the items for food, and internal parasites and infections such as
lungworm and flatworms have resulted in the death of several individuals (Manire 2000).
Increases in any of these threats for a given area could lead to significant effects in the
population since loggerheads are a long lived species and take several years to reach
sexual maturity (Wood & Bjorndal 2000), meaning that a rebound in the population may
not be observed for a long time despite conservation efforts.
Loggerhead Natural History: Loggerhead sea turtles belong to the family
Cheloniidae, which diverged from the other extant sea turtle family Dermochelyidae
roughly 100 million years ago (Witherington & Witherington 2015). Six of the seven
modern species of sea turtle belong to the family Cheloniidae, all of which have a hard
outer shell covered with scutes. Loggerheads are distinctive in appearance with a broad
head, two pairs of prefrontal scales on their head, five lateral scutes on either side of the
midline of the carapace and three infra-marginal scutes on their plastron (Witherington &
2
Witherington 2015). The carapace of an adult loggerhead is reddish brown in appearance
and ranges in size from roughly 83-122 cm long with an overall weight of 176-440 lbs. In
contrasts the carapace of hatchlings is much darker, almost black in appearance and
ranges in size from 3-5 cm long with an overall weight of 22 g (Spotila 2004;
Ruckdeschel & Shoop 2006). This species is found globally in temperate waters and nests
across the globe. Hatchlings and juveniles are pelagic, with those emerging from the east
coast of the United States taking advantage of the North Atlantic Gyre system,
completing several rotations in the Sargasso Sea before moving into coastal waters as
young adults. Here the subadults develop further, growing in size until they are able to
reproduce. At various portions of their lifecycle, loggerheads are distributed in the Pacific
Ocean along the western portion of the United States down to Central America and
around eastern Asia, the Philippines, and eastern Australia. Populations are also
distributed within the Atlantic Ocean off the western coast of Europe and Africa, and
over to the eastern coast of North and South America (Spotila 2004; Ruckdeschel &
Shoop 2006).
Nesting Biology: It takes several years for marine turtles to reach a size capable of
supporting the extensive energy requirements necessary to produce eggs. For this reason,
loggerheads typically do not reproduce every year, but rather follow an intraseasonal
nesting pattern where they return every 2-4 years (Webster & Cook 2001; Spotila 2004).
During an active nesting season, loggerhead females will lay five or more clutches over
two week intervals from May to August on the east coast of the United States
(Witherington & Witherington 2015). Each clutch will contain 115 eggs on average
(Witherington & Witherington 2015), for a reproductive output of approximately 575
3
eggs per nesting season. Loggerheads can display high nest fidelity, with some females
returning year after year to areas within five kilometers from a previous nest location,
while others travel over large sections of the female’s range (Bolton & Witherington
2003). Often times the slope of the beach has the greatest influence on selection, with
females choosing a wider beach with a gradual slope, conditions that favor low egg
mortality (Kraemer & Bell 1980; Garmestani et al. 2000; Wood & Bjorndal 2000).
Females also characteristically choose to nest on darker beaches as opposed to developed
beaches, with significantly less nests laid in high white light areas (Witherington 1992).
In urban locations where lighting conditions are elevated, the presence of tall objects near
a nesting location will prompt a greater density of nests as opposed to areas with low
elevation objects in the background (Salmon et al. 1995a).
Development: Eggs remain buried in the nest chamber for an incubation period of
roughly 50-60 days, dependent upon environmental conditions (Witherington &
Witherington 2015). During this stage of development, the embryos are susceptible to
extremes in the nesting environment and must maintain optimal levels of gas exchange,
moisture, and temperature (Bolton & Witherington 2003). Perhaps the most stringent
parameter on hatchling success is temperature. Successful loggerhead incubation lies
within 26-32 degrees Celsius, with hatchlings at the upper end of the range exhibiting a
faster growth rate, larger body mass and increased activity levels (Kuroyanagi &
Kamezaki 1993). Loggerheads exhibit Temperature-Dependent Sex Determination (TSD)
in which temperatures present during the middle third of the incubation cycle determines
the sex of the developing hatchlings. Colder temperatures produce more male hatchlings
while warmer temperatures produce more female hatchlings (Spotila 2004). The pivotal
4
temperature to produce a 50:50 ratio of males to females is 29 degrees Celsius, however,
nesting locations and population dynamics favor a ratio that is not equal to 1:1. Values
above this pivotal temperature will be skewed to produce more female hatchlings, which
is the common nest profile, while values below this pivotal temperature will be skewed to
produce more male hatchlings (Mrosovsky 1988). Within a single nest that is exposed to
the same ambient environmental conditions, both sexes can develop in eggs adjacent to
one another based on the location of the egg within the clutch (Lutz et al. 2003; Spotila
2004).
Several days before emergence, hatchlings break through their turgid eggs by use
of their modified egg tooth in a process called pipping (Witherington & Witherington
2015). As a mass, the hatchlings will begin to ascend towards the surface, pushing sand
down around them and traveling up the neck of the egg chamber. Ascending the nest can
take several days because hatchlings have to wait for oxygen to diffuse through the sand,
which is why this period is characterized by intermittent movement and rest (Bolton &
Witherington 2003; Witherington & Witherington 2015). Hatchlings will remain under
the surface of the sand and wait for cooler temperatures of night (often between dusk and
midnight) before they emerge in a large mass, defined as a boil, towards the ocean
(Salmon et al. 1995b; Salmon 2003). Additional waves of minor emergences can occur
over the next few nights.
Orientation: Hatchling sea turtles utilize three senses upon emergence at the nest
in order to prompt proper orientation. Sight is utilized first in order to navigate across the
beach, followed by wave orientation in which the hatchling use cues from wave orbitals
to move off shore, and finally the earth’s magnetic field guides hatchlings once they
5
reach open water (Lohmann & Lohmann 1996). On the beach hatchlings rely on a
combination of light intensity and elevation cues in order to locate the ocean within their
cone of acceptance (Witherington & Witherington 2015) or field of view, moving
towards a brighter light source and away from higher elevations (Salmon et al. 1995b).
The ability to successful identify the ocean as proper seaward direction is crucial to
survival since increased time on the beach can lead to mortality by means of predation,
dehydration, or exhaustion. Several studies have examined the effects high levels of
artificial lights near nesting locations have on hatchling orientation through the means of
measuring tracks the next morning post emergence (Witherington 1992), controlled field
releases in beach arenas (Salmon et al. 1995b; Lorne & Salmon 2007), and controlled
laboratory experiments where hatchlings are tethering to an arena (Salmon et al. 1995b).
Light Influence: The moon can be used as an aid to distinguish proper orientation
in hatchlings since it acts as an indicator of absolute direction for many nocturnal species
under normal circumstances (Salmon 2003). The light from celestial bodies is scattered
throughout the atmosphere, uniformly illuminating objects and reducing directivity. In
contrast, artificial lights are not scattered through the atmosphere since they are in close
proximity to the ground and thus can be highly directional, illuminating areas that would
be naturally dim (Salmon 2003; Tuxbury & Salmon 2005). High levels of background
light can cause all objects within view to appear at the same illumination, making it
difficult for hatchlings to detect the brightest light source, leading to disorientation in
which hatchlings aimlessly wander in search of proper seaward direction (Salmon 2003;
Tuxbury & Salmon 2005). A few strong lights close to a nesting location can also be a
problem because hatchlings will perceive these lights as the brightest light source on the
6
beach, leading to misorientation in which hatchlings move in a distinct path away from
the ocean (Salmon 2003; Tuxbury & Salmon 2005). Hatchlings affected by disorientation
and misorientation are less likely to locate the ocean.
Objectives: The aim of this study was to use a noninvasive means to track discrete
hatchling movements from emergence of the nest under present lighting conditions. A
non-illuminating infrared camera and computer algorithms designed in both MATLAB
and ImageJ platforms were used to determine parameters associated with individual
hatchling a) speed, b) orientation deviation, and c) range of movement to determine if
there is a threshold of light permissible before orientation of hatchlings is negatively
affected. The presence of this threshold may inform future management practices on
acceptable total radiance levels suitable at nesting habitats without negatively impacting
hatchling orientation. This information could contribute to current management practices
to enhance survival efforts at the northern extent of loggerhead distribution where the
majority of male hatchlings emerge from.
LITERATURE CITED
Bolton, A.B., Witherington, B.E. (2003). Loggerhead Sea Turtles. Washington D.C.:
Smithsonian Institution Press.
Garmestani, A.S., Percival, H.F., Portier, K.M., Rice, K.G. (2000). Nest-site selection by
the loggerhead sea turtle in Florida’s ten thousand islands. Journal of
Herpetology, 34, 504-510.
Kraemer, J.E., Bell, R. (1980). Rain-induced mortality of eggs and hatchlings of
loggerhead sea turtles (Caretta caretta) on the Georgia coast. Herpetologica, 36,
72-77.
Kuroyanagi, K., Kamezaki, N. (1993). Growth of loggerhead hatchlings incubated at
different temperatures. Echolocation, 14, 5-6.
7
Lohmann, K.J., Lohmann, C.M.F. (1996). Orientation and open-sea navigation in sea
turtles. Journal of Experimental Biology, 199, 73-81.
Lorne, J.K., Salmon, M. (2007). Effects of exposure to artificial lighting on orientation of
hatchling sea turtles on the beach and in the ocean. Endangered Species Research,
3, 23-30.
Lutz, P.L., Musick, J.A., Wyneken, J. (2003). The Biology of Sea Turtles (Volume II).
Boca Raton, FL: CRC Press.
Manire, C.A., Kinsel, M.J., Anderson, E.T., Clauss, T.M., Byrd, L. (2008). Lungworm
infection in three loggerhead sea turtles (Caretta caretta), Journal of Zoology and
Wildlife Medicine, 39, 92-98.
Mrosovsky, N. (1988). Pivotal temperatures for loggerhead turtles (Caretta caretta) from
northern and southern nesting beaches. Canadian Journal of Zoology, 60, 661-
669.
Ruckdeschel, C., Shoop, C.R. (2006). Sea turtles. Athens, GA: The University of Georgia
Press.
Salmon, M. (2003). Artificial night lighting and sea turtles. Biologist, 50, 163-168.
Salmon, M., Reiners, R., Lavin, C., Wyneken, J. (1995a). Behavior of loggerhead sea
turtles on an urban beach correlates of nest placement. Journal of Herpetology,
29, 560-567.
Salmon, M., Tolbert, M.G., Painter, D.P., Goff, M., Reiners, R. (1995b). Behavior of
loggerhead sea turtles on an urban beach hatchling orientation. Journal of
Herpetology, 29, 568-576.
Spotila, J.R. (2004). Sea Turtles a complete guide to their biology, behavior, and
conservation. Baltimore, MD: The Johns Hopkins University Press.
Tuxbury, S.M., Salmon, M. (2005). Competitive interactions between artificial lighting
and natural cues during seafinding by hatchling marine turtles. Biological
Conservation, 121, 311-316.
Webster, W.M.D., Cook, K.A. (2001) Intraseasonal nesting activity of loggerhead sea
turtles (Caretta caretta) in southeastern North Carolina. American Midland
Naturalist, 145, 66-73.
Witherington, B.E. (1992). Behavioral responses of nesting sea turtles to artificial
lighting. Herpetologica, 48, 31-39.
Witherington, B.E., & Witherington, D. (2015). Our Sea Turtles. Sarasota, FL: Pineapple
Press, Inc.
Wood, D.W., Bjorndal, K.A. (2000). Relation of temperature, moisture, salinity, and
slope to nest site selection in loggerhead sea turtles. Copeia, 1, 119-128.
8
CHAPTER 2:
Turtle Tracking Algorithm as a Non-Invasive Means to Track Hatchlings
upon Emergence
Emily S. Asp1, Eric Koepfler2, Louis Keiner3, Scott L. Parker4, H. Erin Rickard5
TURTLE TRACKING ALGORITHM
Key words: tracking, orientation, MATLAB, ImageJ, sea turtles, Caretta caretta
1 Department of Coastal Marine and Wetland Studies, 100 Chanticleer Dr E, Coastal Carolina University, Conway, South Carolina 29528; Email: [email protected]. Send reprint requests to this address.
2Department of Marine Science, 100 Chanticleer Dr E, Coastal Carolina University, Conway,
South Carolina 29528.
3Department of Physics and Marine Science, 100 Chanticleer Dr E, Coastal Carolina University, Conway, South Carolina 29528; Email: [email protected].
4Department of Biology, 100 Chanticleer Dr E, Coastal Carolina University, Conway, South Carolina 29528; Email: [email protected].
5Department of Computing Sciences, 100 Chanticleer Dr E, Coastal Carolina University, Conway, South Carolina 29528; Email: [email protected].
deceased March 7, 2017
9
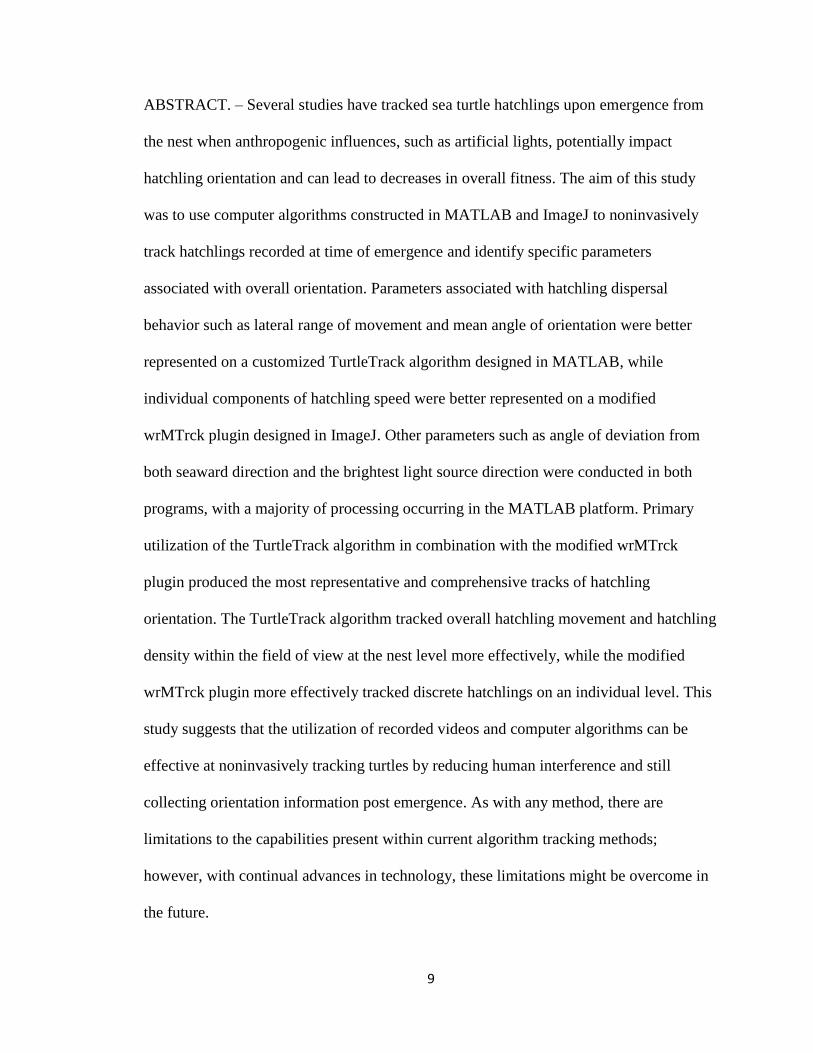
ABSTRACT. – Several studies have tracked sea turtle hatchlings upon emergence from
the nest when anthropogenic influences, such as artificial lights, potentially impact
hatchling orientation and can lead to decreases in overall fitness. The aim of this study
was to use computer algorithms constructed in MATLAB and ImageJ to noninvasively
track hatchlings recorded at time of emergence and identify specific parameters
associated with overall orientation. Parameters associated with hatchling dispersal
behavior such as lateral range of movement and mean angle of orientation were better
represented on a customized TurtleTrack algorithm designed in MATLAB, while
individual components of hatchling speed were better represented on a modified
wrMTrck plugin designed in ImageJ. Other parameters such as angle of deviation from
both seaward direction and the brightest light source direction were conducted in both
programs, with a majority of processing occurring in the MATLAB platform. Primary
utilization of the TurtleTrack algorithm in combination with the modified wrMTrck
plugin produced the most representative and comprehensive tracks of hatchling
orientation. The TurtleTrack algorithm tracked overall hatchling movement and hatchling
density within the field of view at the nest level more effectively, while the modified
wrMTrck plugin more effectively tracked discrete hatchlings on an individual level. This
study suggests that the utilization of recorded videos and computer algorithms can be
effective at noninvasively tracking turtles by reducing human interference and still
collecting orientation information post emergence. As with any method, there are
limitations to the capabilities present within current algorithm tracking methods;
however, with continual advances in technology, these limitations might be overcome in
the future.
10
INTRODUCTION
Various tracking methods have been used to study each of the three primary
senses sea turtle hatchlings utilize upon emergence for proper orientation. To date, most
of these methods require the collection and/or storage of hatchlings for a period of time
prior to treatment (Salmon & Witherington 1995; Irwin & Lohmann 2003; Tuxbury &
Salmon 2005; Lorne & Salmon 2007). Researchers try to reduce the amount of time
hatchlings are stored, so if a nest is expected to emerge that evening, hatchlings are often
collected in the late afternoon (Salmon et al. 1995; Tuxbury & Salmon 2005; Lorne &
Salmon 2007; Whelan & Wyneken 2007) and stored in a light eliminating, temperature
controlled environment. At the conclusion of the study, hatchlings are released later the
same night from a dark beach (Salmon & Witherington 1995; Irwin & Lohmann 2003;
Kawamura et al. 2009).
Various methods have been implemented to track movement during the first stage
of orientation when sight is the primary sense guiding hatchlings from the nest to the surf
zone. On the beach, hatchlings are in close proximity to human activity which allows for
ease of access to noninvasively study tracks post emergence; however, this also means
the hatchlings are highly susceptible to anthropogenic influences during this stage of
orientation (Witherington 1992; Salmon & Witherington 1995; Bourgeois et al. 2009).
During early morning beach surveys, tracks are traced and measurements made without
interacting with the hatchlings at all. This is a completely noninvasive means for tracking
orientation; however, since the hatchlings are not present and researchers are solely
relying on imprints in the sand, some data can be lost depending on the time of night that
11
the nest emerges as well as the weather conditions. Animals present on the beach at night
time, the height of high tide, strong winds, and rain storms can disrupt tracks or erase
them completely before the researchers get a chance to examine them (Witherington
1992).
Other sight orientation studies are more invasive, requiring collection of
hatchlings and subjecting them to either field or laboratory arena studies (Salmon &
Witherington 1995; Tuxbury & Salmon 2005; Lorne & Salmon 2007; Kawamura et al.
2009). In field studies, a beach arena is made in the sand and one to two hatchlings are
released in the center of the arena and monitored to observe orientation under ambient
light conditions. Tracks of hatchlings are then traced in the sand to measure orientation
relative to the ocean (Salmon & Witherington 1995; Salmon et al. 1995; Kawamura et al.
2009). Alternatively, hatchlings may also be attached to the beach arena tether with
monofilament line in the field to observe controlled short duration crawls without the
need to recollect hatchlings post crawl (Lorne & Salmon 2007). Arenas with tether
systems are also used in the lab to measure short duration crawls under controlled
environmental conditions where variables can be easily manipulated (Salmon et al. 1995;
Tuxbury & Salmon 2005). Each of these means of sight orientation detection are efficient
at gathering individual hatchling orientation parameters. However, since hatchlings are
released post collection, activity levels may not be the same as observed under natural
hatchling emergence. In addition, the release of a few hatchlings may not accurately
simulate nest emergence where multiple hatchlings leave the nest simultaneously
(Demmer 1981; Christens 1990; Witherington & Witherington 2015). As a result,
12
orientation studies based on a small number of hatchlings may not account for interactive
effects of multiple hatchlings leaving a nest on orientation behavior.
Once hatchlings enter the surf zone of the beach they become wave oriented
(Salmon & Lohmann 1989; Lohmann & Lohmann 1996). The primary way in which
researchers measure wave orientation in hatchlings is by means of a “Witherington float”
(Witherington & Salmon 1992). This device consists of a pointed wooden dowel fastened
with a weight to prevent flipping and fastened with a light to indicate location. The dowel
is attached to the hatchling’s carapace by a thin cotton thread and floats in the water
column behind the hatchling (Lorne & Salmon 2007; Whelan & Wyneken 2007). This
device does slow swimming speed but has no effect on orientation, allowing researchers
to observe how hatchlings move as they start to head offshore. Under normal
circumstances hatchlings swim into approaching waves, however, in the absence of
waves hatchlings swim at random (Wyneken et al. 1990).
Once offshore, magnetic orientation guides hatchlings around the gyre systems
(Carr 1986; Light et al. 1993; Lohmann et al. 2001). Studies have examined the effects of
magnetic orientation by attaching hatchlings to a nylon-Lycra harness and tethering they
harness to a tracker arm by means of monofilament line (Lohmann & Lohmann 1996;
Irwin & Lohmann 2003). As a result of these studies, scientists have found that
loggerhead hatchlings, like birds, use inclination compasses rather than a polarity
compass (north/south) to determine location (Wiltschko & Wiltschko 1972; Light et al.
1993). In these laboratory experiments magnets are used to manipulate the earth’s
magnetic field to see the direction hatchlings move based on their “perceived” location.
Each of these methods; however, require attaching an item to the hatchling which could
13
make them more susceptible to predation in the field or later exhaustion when released
post experimentation.
Several programs have been developed and modified in more recent years to track
movement of multiple objects on video such as cars (Dellaert & Thorpe 1997; Eliceiri et
al. 2012; Nehemiah 2014), humans (Siebel & Maybank 2002; Nehemiah 2014) and
worms (Nussbaum-Krammer et al. 2005; Orlov et al. 2007). Movement of large
discernable objects such as humans or cars can be tracked using stationary cameras and
computerized data processing to discern patterns. The MATLAB computing environment
platform was developed by Mathworks Inc. for algorithm development, visualization,
numeric computation and data analysis (Mathworks Company Overview 2017). In
particular, the Computer Vision toolbox in MATLAB has been utilized to track traffic
flow through Gaussian mixture models. These models differentiate stationary objects in
the background and moving objects in the foreground so that foreground (items of
interest) are isolated and identified (Dellaert & Thorpe 1997; Siebel & Maybank 2002;
Nehemiah 2014). In addition, some algorithms constructed in MATLAB can identify
particular characteristics associated with the object of interest to identify distinct
attributes such as facial features or a specific car make and model.
Since detection and tracking technology exists to track large objects for security
purposes, it is reasonable that these same algorithms can be modified to track smaller
objects for multidisciplinary scientific research purposes. Smaller conspicuous objects
like worms, C. elegans, have been tracked to monitor behavior in different environmental
media using ImageJ, a program developed by the National Institute of Health (Eliceiri et
al. 2012; ImageJ Image Processing and Analysis in Java). Videos suitable for tracking
14
include high quality clips with a good contrast between the animal in question and the
background, high frame rate (around 15 fps or higher), and duration lasting about one
minute. These videos are then loaded into ImageJ where the wrMTrck plugin
(Nussbaum-Krammer et al. 2005) tracks individuals from a variety of media to quantify
variables associated with movement. This same application could be used to track other
animals as long as stationary footage from high quality cameras are utilized.
The aim of this study was to use a noninvasive means to track discrete hatchling
movements from emergence of the nest under natural conditions without human
interference and under non-manipulated conditions to document unaltered hatchling
behavior. A non-illuminating infrared camera was used to record nest emergences which
was later analyzed by computer algorithms designed in both MATLAB and ImageJ.
These programs calculated parameters associated with individual hatchling orientation to
measure how overall orientation is influenced by different lighting conditions.
MATERIALS AND METHODS
Data Collection. – During the 2016 sea turtle nesting season, a Geovision GV-
FER5303 camera (5MP H.264 WDR Infrared Fisheye Rugged IP, Geovision Inc.,
Taiwan), recorded hatchling emergences from twenty-one nests in the Grand Strand
Region in Horry and Georgetown Counties of South Carolina. At each nest site, the
camera was attached to an external deep cycle marine battery and wireless router to relay
live video footage to the research team monitoring the nest. The research team monitored
the nest in real-time using the Geovision smartphone application program to remotely
15
interact with the camera in real time while remaining out of the camera field of view
(15.2 m diameter). Digital movie footage of each hatchling emergence was downloaded
from the camera’s mini SD card using a Linux computer system.
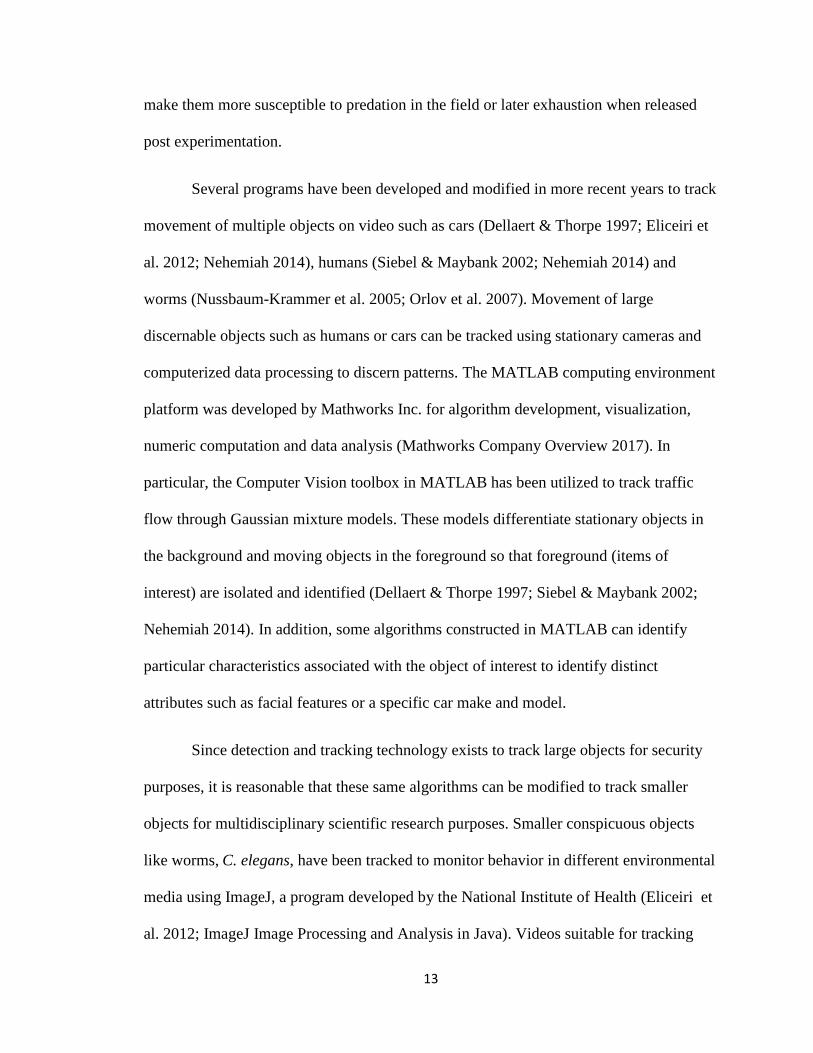
Correcting Fisheye. – Distortion produced by the fisheye lens associated with this
camera was corrected by first converting raw video files into a set of sequential grayscale
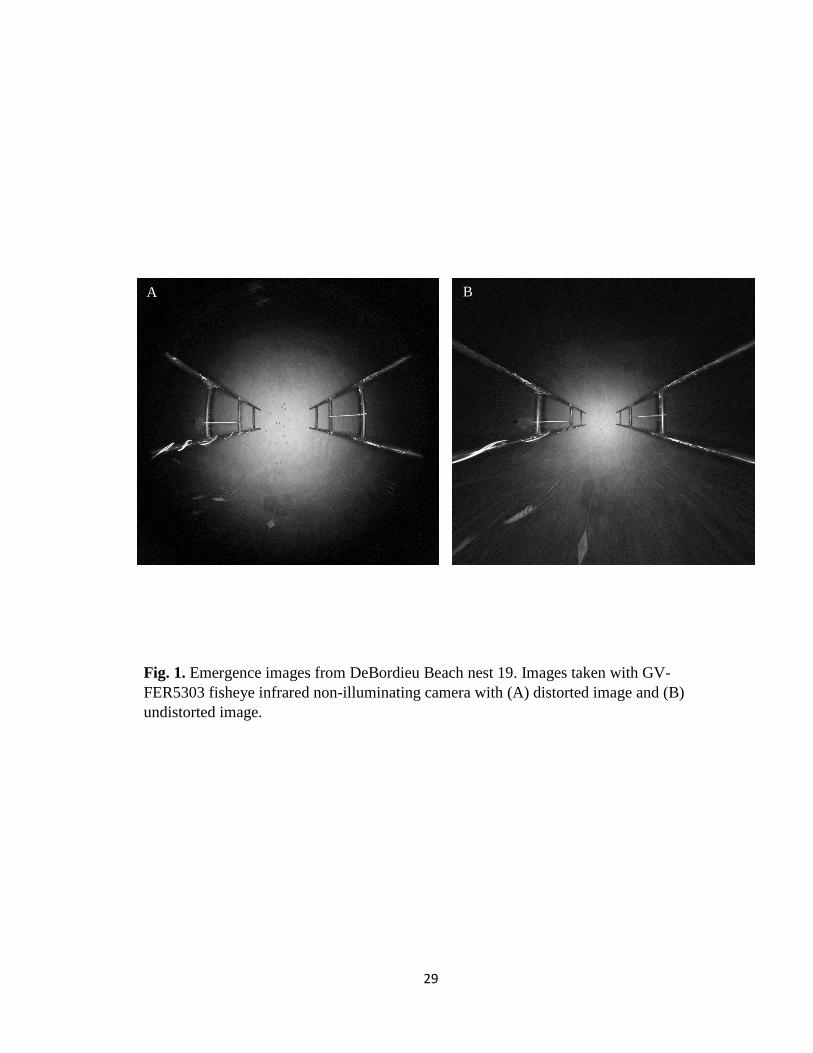
tiff files in the MATLAB platform at a rate of 15 frames per second (fps) (Fig. 1A). Each
image was then run through an algorithm in Photoshop in order to geometrically correct
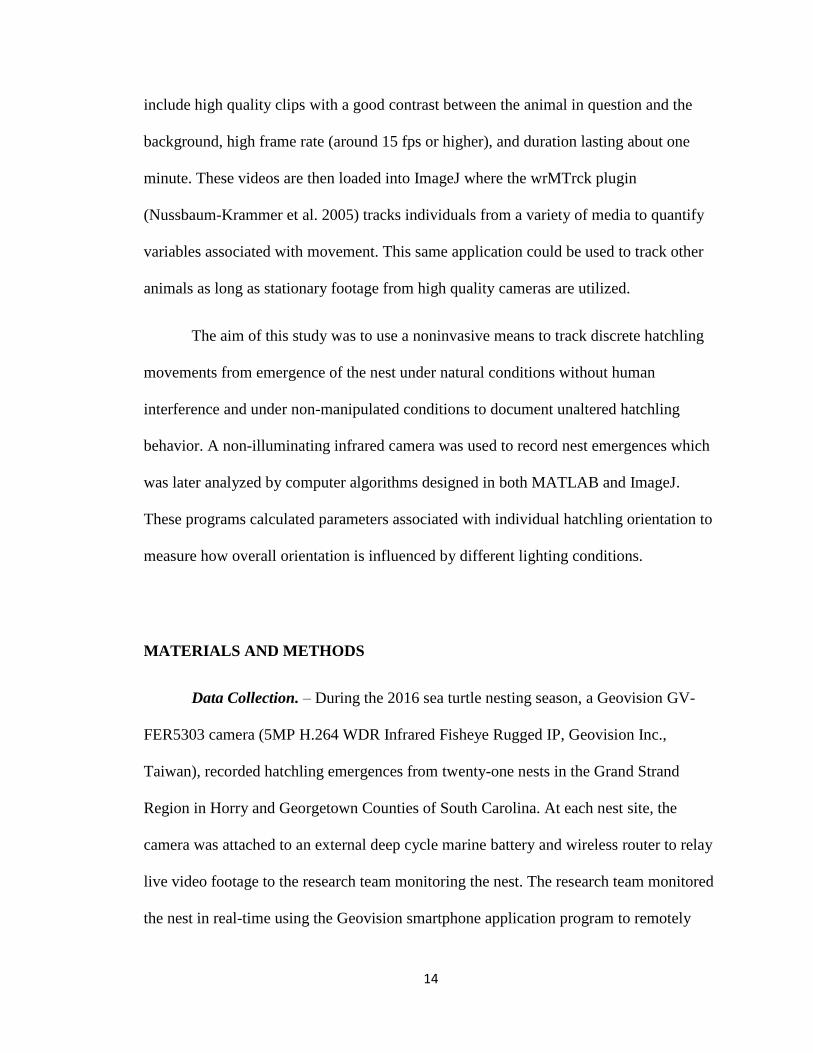
the image based on a grid overlay. Images of the overlay was obtained in the same
manner as video of the hatchlings; however, instead of being deployed on the beach, the
camera was deployed in the center of an 18 m by 18 m grid network with markers every
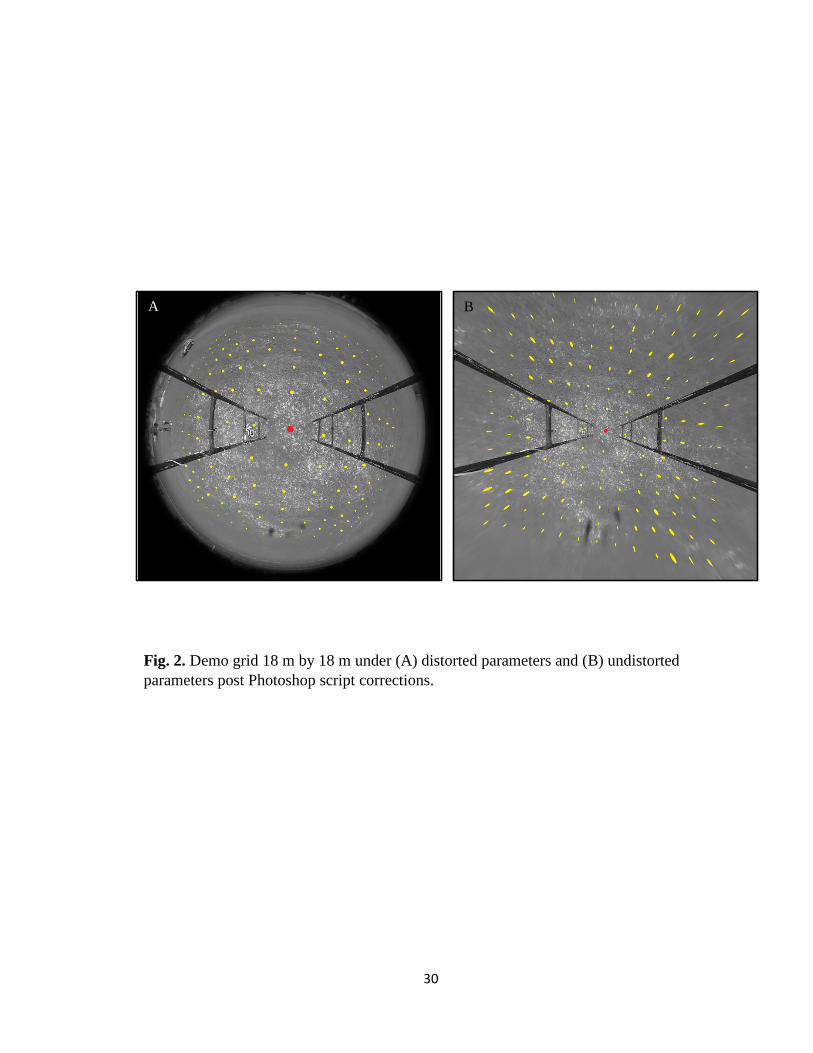
1.5 meters (Fig. 2A). An Action was created in Photoshop based on the lens correction
parameters for a Parrot Bebop Drone 2.0 with a geometric distortion removal value of
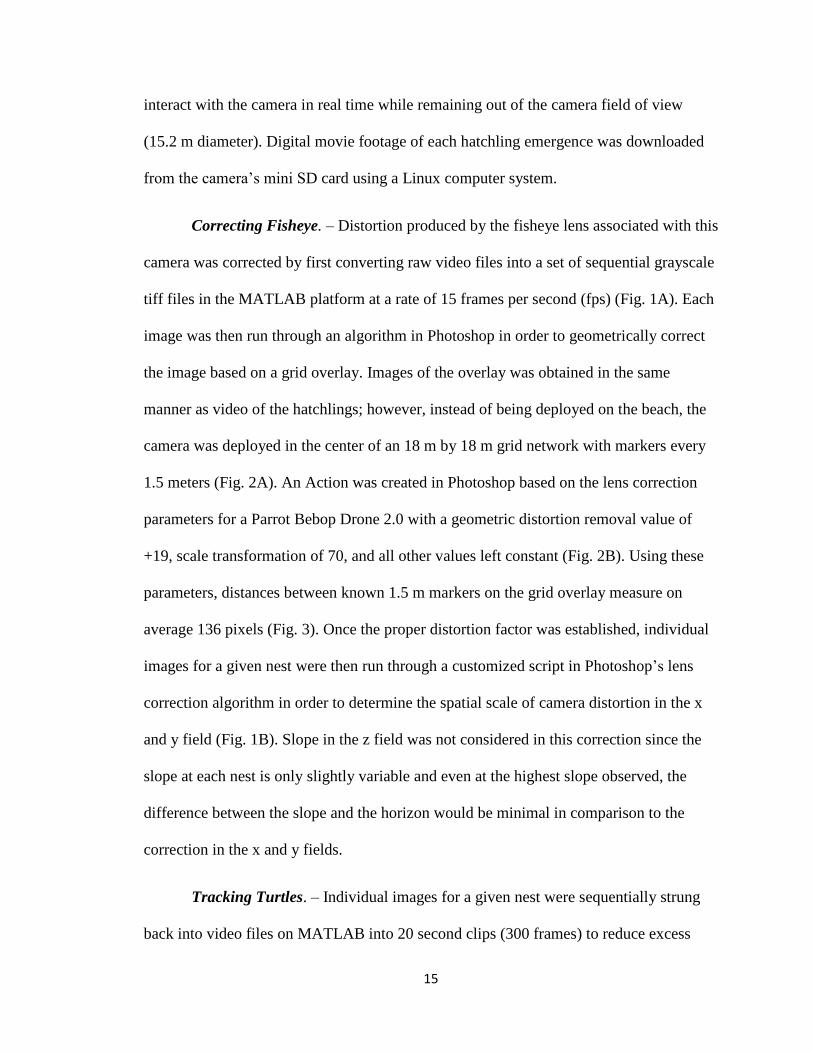
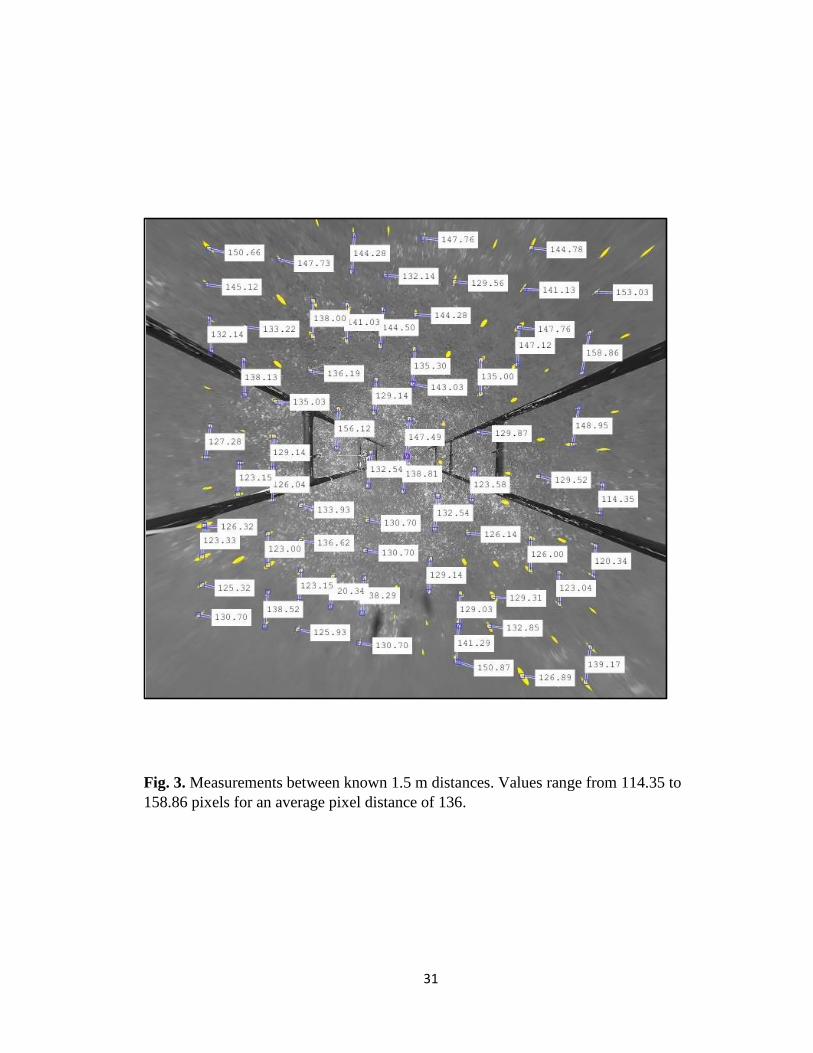
+19, scale transformation of 70, and all other values left constant (Fig. 2B). Using these
parameters, distances between known 1.5 m markers on the grid overlay measure on
average 136 pixels (Fig. 3). Once the proper distortion factor was established, individual
images for a given nest were then run through a customized script in Photoshop’s lens
correction algorithm in order to determine the spatial scale of camera distortion in the x
and y field (Fig. 1B). Slope in the z field was not considered in this correction since the
slope at each nest is only slightly variable and even at the highest slope observed, the
difference between the slope and the horizon would be minimal in comparison to the
correction in the x and y fields.
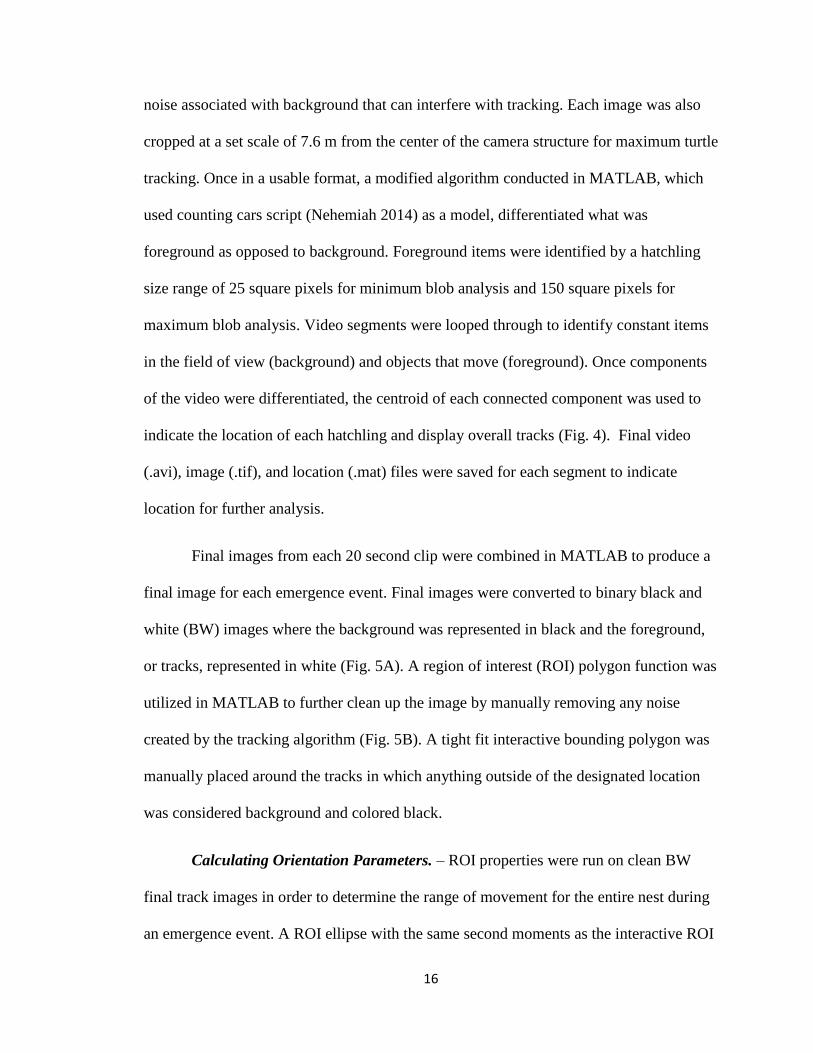
Tracking Turtles. – Individual images for a given nest were sequentially strung
back into video files on MATLAB into 20 second clips (300 frames) to reduce excess
16
noise associated with background that can interfere with tracking. Each image was also
cropped at a set scale of 7.6 m from the center of the camera structure for maximum turtle
tracking. Once in a usable format, a modified algorithm conducted in MATLAB, which
used counting cars script (Nehemiah 2014) as a model, differentiated what was
foreground as opposed to background. Foreground items were identified by a hatchling
size range of 25 square pixels for minimum blob analysis and 150 square pixels for
maximum blob analysis. Video segments were looped through to identify constant items
in the field of view (background) and objects that move (foreground). Once components
of the video were differentiated, the centroid of each connected component was used to
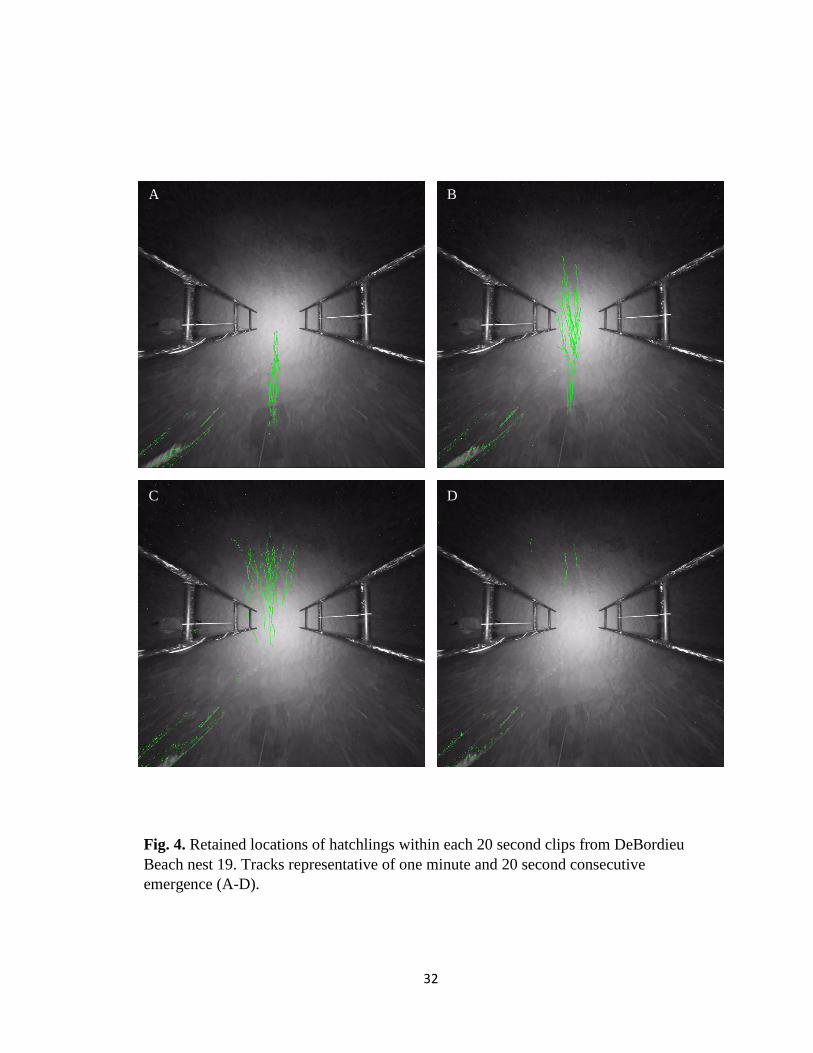
indicate the location of each hatchling and display overall tracks (Fig. 4). Final video
(.avi), image (.tif), and location (.mat) files were saved for each segment to indicate
location for further analysis.
Final images from each 20 second clip were combined in MATLAB to produce a
final image for each emergence event. Final images were converted to binary black and
white (BW) images where the background was represented in black and the foreground,
or tracks, represented in white (Fig. 5A). A region of interest (ROI) polygon function was
utilized in MATLAB to further clean up the image by manually removing any noise
created by the tracking algorithm (Fig. 5B). A tight fit interactive bounding polygon was
manually placed around the tracks in which anything outside of the designated location
was considered background and colored black.
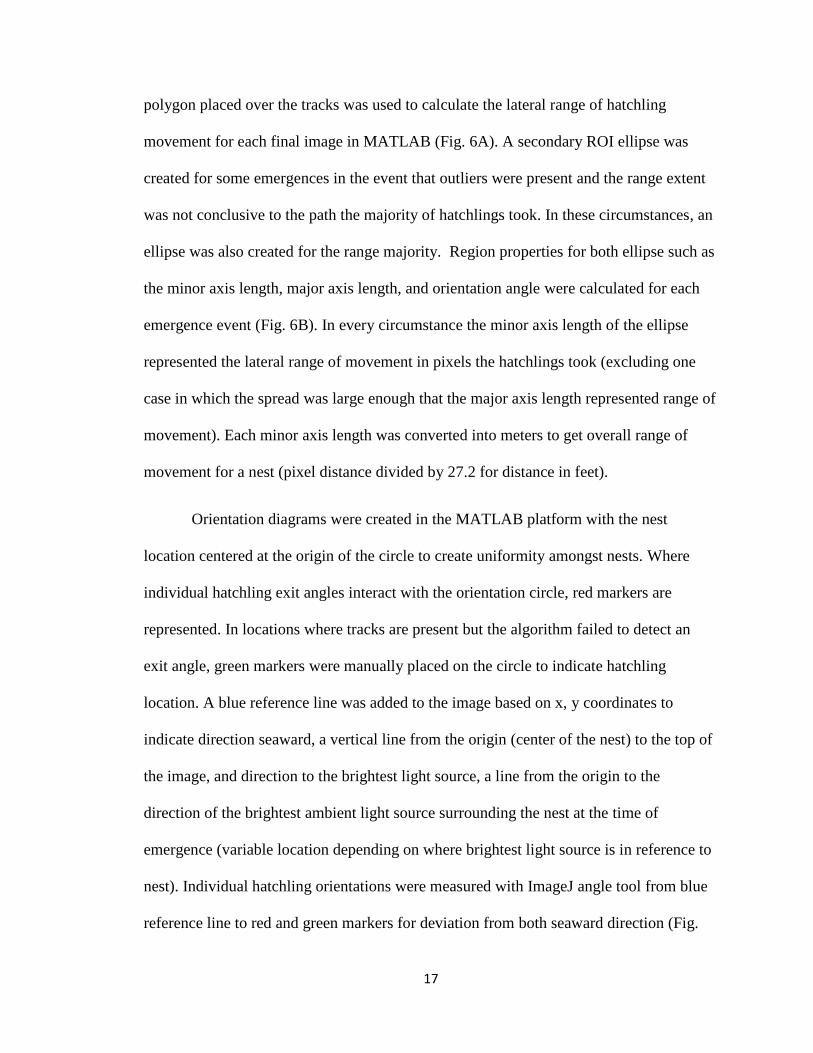
Calculating Orientation Parameters. – ROI properties were run on clean BW
final track images in order to determine the range of movement for the entire nest during
an emergence event. A ROI ellipse with the same second moments as the interactive ROI
17
polygon placed over the tracks was used to calculate the lateral range of hatchling
movement for each final image in MATLAB (Fig. 6A). A secondary ROI ellipse was
created for some emergences in the event that outliers were present and the range extent
was not conclusive to the path the majority of hatchlings took. In these circumstances, an
ellipse was also created for the range majority. Region properties for both ellipse such as
the minor axis length, major axis length, and orientation angle were calculated for each
emergence event (Fig. 6B). In every circumstance the minor axis length of the ellipse
represented the lateral range of movement in pixels the hatchlings took (excluding one
case in which the spread was large enough that the major axis length represented range of
movement). Each minor axis length was converted into meters to get overall range of
movement for a nest (pixel distance divided by 27.2 for distance in feet).
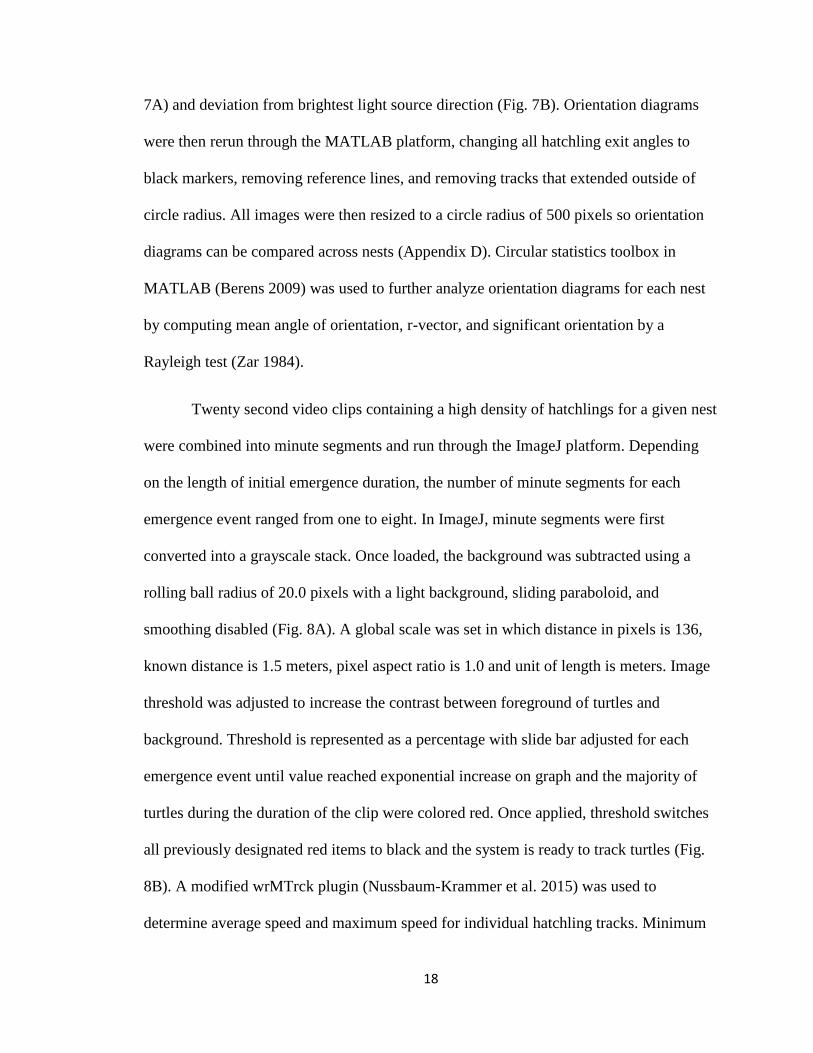
Orientation diagrams were created in the MATLAB platform with the nest
location centered at the origin of the circle to create uniformity amongst nests. Where
individual hatchling exit angles interact with the orientation circle, red markers are
represented. In locations where tracks are present but the algorithm failed to detect an
exit angle, green markers were manually placed on the circle to indicate hatchling
location. A blue reference line was added to the image based on x, y coordinates to
indicate direction seaward, a vertical line from the origin (center of the nest) to the top of
the image, and direction to the brightest light source, a line from the origin to the
direction of the brightest ambient light source surrounding the nest at the time of
emergence (variable location depending on where brightest light source is in reference to
nest). Individual hatchling orientations were measured with ImageJ angle tool from blue
reference line to red and green markers for deviation from both seaward direction (Fig.
18
7A) and deviation from brightest light source direction (Fig. 7B). Orientation diagrams
were then rerun through the MATLAB platform, changing all hatchling exit angles to
black markers, removing reference lines, and removing tracks that extended outside of
circle radius. All images were then resized to a circle radius of 500 pixels so orientation
diagrams can be compared across nests (Appendix D). Circular statistics toolbox in
MATLAB (Berens 2009) was used to further analyze orientation diagrams for each nest
by computing mean angle of orientation, r-vector, and significant orientation by a
Rayleigh test (Zar 1984).
Twenty second video clips containing a high density of hatchlings for a given nest
were combined into minute segments and run through the ImageJ platform. Depending
on the length of initial emergence duration, the number of minute segments for each
emergence event ranged from one to eight. In ImageJ, minute segments were first
converted into a grayscale stack. Once loaded, the background was subtracted using a
rolling ball radius of 20.0 pixels with a light background, sliding paraboloid, and
smoothing disabled (Fig. 8A). A global scale was set in which distance in pixels is 136,
known distance is 1.5 meters, pixel aspect ratio is 1.0 and unit of length is meters. Image
threshold was adjusted to increase the contrast between foreground of turtles and
background. Threshold is represented as a percentage with slide bar adjusted for each
emergence event until value reached exponential increase on graph and the majority of
turtles during the duration of the clip were colored red. Once applied, threshold switches
all previously designated red items to black and the system is ready to track turtles (Fig.
8B). A modified wrMTrck plugin (Nussbaum-Krammer et al. 2015) was used to
determine average speed and maximum speed for individual hatchling tracks. Minimum
19
object area of 25 square pixels, maximum object area of 150 square pixels, maximum
velocity of 10 pixels/frame, maximum area change of 50%, minimum track length of 100
frames, bend threshold of 0.5 for a turn, and bin size of zero (disabled) parameters were
used for each emergence event. Display settings on the plugin were selected to show
paths, measure path lengths, enable smoothing, and display summary of tracking. Bend
detect was set to 2 for aspect ratio, frames per second set at 15 and threshold mode max
entropy. Values for distance, time, average speed, and maximum speed were obtained for
most hatchlings observed on the video footage. Given camera structure obstructions or
small periods of hatchling immobility, one hatchling may be broken into two separate
tracks or tracks from some hatchlings may not detected at all. However, since
identification of specific hatchlings (i.e. ‘A’ vs ‘B’) are not compared across orientation
parameters, segmented tracks are not an issue since overall hatchling behavior is the
focus.
RESULTS
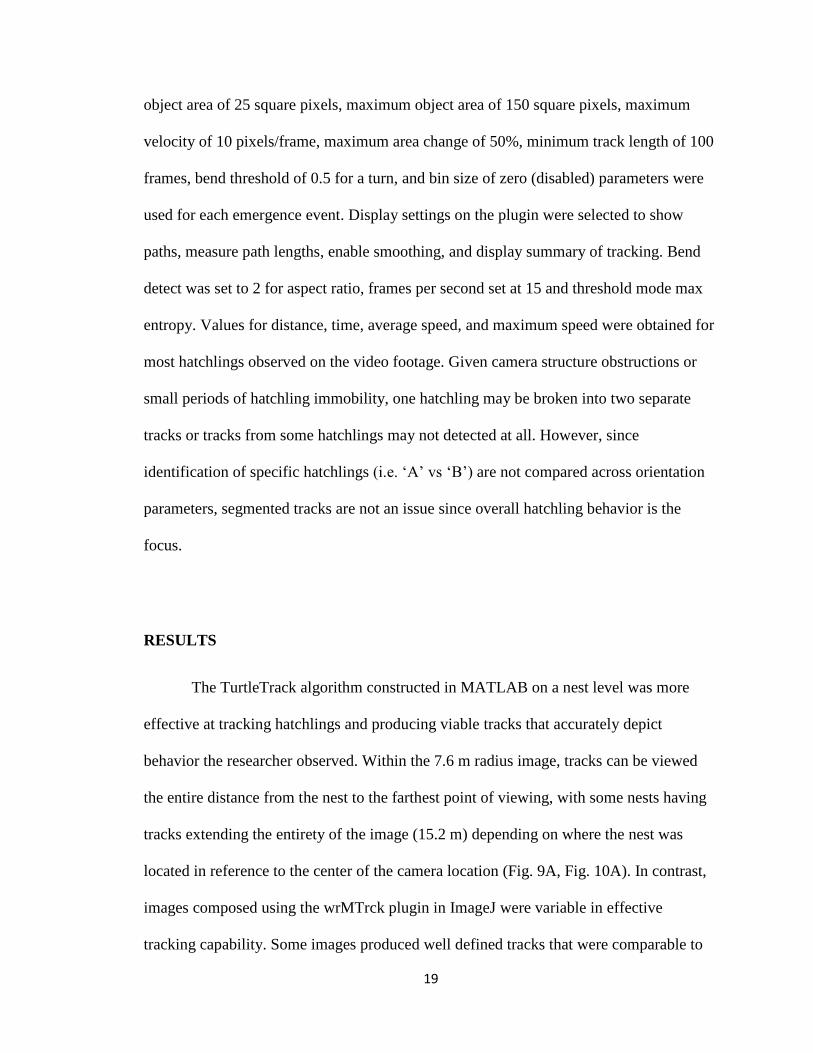
The TurtleTrack algorithm constructed in MATLAB on a nest level was more
effective at tracking hatchlings and producing viable tracks that accurately depict
behavior the researcher observed. Within the 7.6 m radius image, tracks can be viewed
the entire distance from the nest to the farthest point of viewing, with some nests having
tracks extending the entirety of the image (15.2 m) depending on where the nest was
located in reference to the center of the camera location (Fig. 9A, Fig. 10A). In contrast,
images composed using the wrMTrck plugin in ImageJ were variable in effective
tracking capability. Some images produced well defined tracks that were comparable to
20
those produced in the MATLAB platform (Fig. 9B). However, in most cases the images
produced using ImageJ only tracked hatchlings in a small section of the field of view, not
extending the distance covered by tracked images created in the MATLAB platform and
thus lose a lot of valuable information (Fig. 10B).
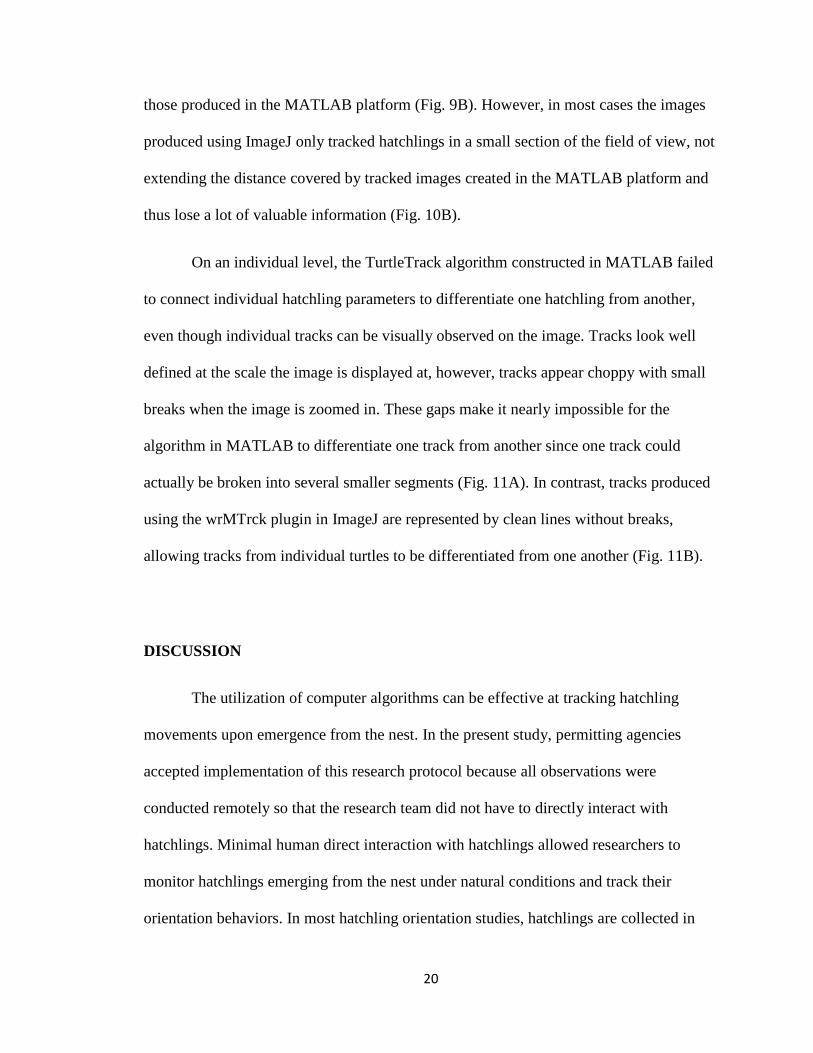
On an individual level, the TurtleTrack algorithm constructed in MATLAB failed
to connect individual hatchling parameters to differentiate one hatchling from another,
even though individual tracks can be visually observed on the image. Tracks look well
defined at the scale the image is displayed at, however, tracks appear choppy with small
breaks when the image is zoomed in. These gaps make it nearly impossible for the
algorithm in MATLAB to differentiate one track from another since one track could
actually be broken into several smaller segments (Fig. 11A). In contrast, tracks produced
using the wrMTrck plugin in ImageJ are represented by clean lines without breaks,
allowing tracks from individual turtles to be differentiated from one another (Fig. 11B).
DISCUSSION
The utilization of computer algorithms can be effective at tracking hatchling
movements upon emergence from the nest. In the present study, permitting agencies
accepted implementation of this research protocol because all observations were
conducted remotely so that the research team did not have to directly interact with
hatchlings. Minimal human direct interaction with hatchlings allowed researchers to
monitor hatchlings emerging from the nest under natural conditions and track their
orientation behaviors. In most hatchling orientation studies, hatchlings are collected in
21
the field and orientation behaviors measured either in the field or under laboratory
conditions (Witherington 1992; Lohmann & Lohmann 1996; Salmon 2003; Lorne &
Salmon 2007). Filming hatchling emergence using a remote camera system followed by
computational analysis of hatchling orientation behavior eliminates the need to collect the
hatchlings from natural populations, therefore reducing stress associated with transport.
In addition, recording events with an infrared camera reduces the amount of
attention the research team would draw to the nest. Although a large frame was used to
hold the camera in place, the infrared light used to illuminate the nest was often not
noticed by people walking along the beach at night. Because this monitoring set-up is
relatively inconspicuous, there is less probability of attracting attention of beachgoers
which could disturb emergence of hatchlings. The camera system also reduced the need
to use artificial lights on the beach (including red lights) during an emergence, since
researchers did not need to see specific hatchling movements at time of observation and
environmental conditions could be recorded post emergence.
One limitation of these collection methods is that hatchlings can only be tracked a
certain distance depending on the field of view of the camera. The camera had to be
suspended high enough over the nest that the path of hatchlings can be monitored to the
high tideline, but not so high to prevent individual hatchlings from being distinguished
from one another. For this reason the maximum track distance is 15.2 m if the camera
structure is halfway between the nest and the high tideline (although most tracks range
more from 7.6-12 m). Since emergences were recorded under natural environmental
conditions, hatchlings did not always emerge under high tide conditions. In these
circumstances, hatchlings could exit the field of view of the camera and continue on
22
course or change course drastically. A few of the orientation diagrams do not completely
depict the path hatchlings took to reach the ocean because emergence occurred during
low tide and hatchlings could travel a larger distance down the beach, entering the ocean
30-150 m away from the nest location in some circumstances. This limitation is not
specific to this methodology, but rather is a limitation experienced by most field studies
with a set size, including beach arenas (some only as large as 4 m; Salmon et al. 1995).
Unless the hatchling is tethered to the location in some way, hatchlings can continue to
move past the set study area (if researchers allow them to) where they may continue on
course or drastically alter their course altogether.
In general, the TurtleTrack algorithm constructed in MATLAB is an effective
platform at tracking hatchlings at the time of emergence as well as producing viable
parameters associated with orientation that can be statistically tested. The MATLAB
computing environment is highly interactive with extensive examples and documentation
shared on the MathWorks website. Collective sharing and understandable programming
syntaxes allows for previously written code to be modified fairly easily to fit research
objectives (Eliceiri et al. 2012). The ImageJ platform is also an effective tool at tracking
hatchlings, in particular calculating parameters associated with movement. This program
is in the public domain, freely accessible, highly user friendly and updates frequently
(Eliceiri et al. 2012). In addition, both platforms have a variety of accessible toolboxes or
plugins that run a number of operating functions which allows the researcher to
completely tailor the information produced.
As a result of this study it appears primary utilization of the TurtleTrack
algorithm run in the MATLAB computing environment in combination with the
23
wrMTrck plugin run in the ImageJ platform is most effective at tracking turtles and
measuring discrete parameters associated with hatchling orientation. In general, tracks
produced in the MATLAB platform displayed a more comprehensive image of hatchling
movement when compared with video footage of the emergence. Despite some
limitations in the ImageJ platform, tracks produced in both programs are unique from
tracks produced in other orientation studies because they take into account hatchling
position at each second within the frame of the view from the nest to the tideline and can
produce highly curved and variable tracks. Other orientation studies have recorded full
tracks after hatchling emergence; however, these are recorded several hours after
hatching emergence (Witherington 1992; Bourgeois et al. 2009) or require collection and
release of hatchlings under controlled arenas (Salmon et al. 1995; Salmon &
Witherington 1995; Lorne & Salmon 2007). In other instances hatchling tracks
representative of each second of movement are unobtainable and thus incremental
measurements are taken at certain positions with lines connecting measured positions
(Lorne & Salmon 2007). This means of tracking is effective at detecting overall
movement, however, it can also eliminate some data associated with hatchling
orientation.
Algorithms developed in both programs are also effective at measuring different
parameters associated with hatchling orientation, and in combination, measurements
made on both programs displayed what was visually observed. Measurements made on
group parameters such as range of movement for the entire nest and mean angle of
orientation for the nest are easily calculated using the TurtleTrack algorithm in MATLAB
since the group dynamics are very well defined. If group dynamics were attempted on the
24
wrMTrck plugin in ImageJ the final measurements would fall short of what actually
happened, with only a section of the event accurately displayed. In contrast,
measurements made on individual hatchling parameters such as average speed and track
distance are easily calculated using the wrMTrck plugin in ImageJ since individual tracks
are well defined and easily distinguishable from one another. If individual dynamics were
attempted on the TurtleTrack algorithm in MATLAB small segments of the same line
would be calculated as a different track and no real comprehensive data could be
extracted since segments may only be a few pixels long. Other parameters of orientation
are not categorical, using one program over another for analysis, but rather requiring
utilization of both MATLAB and ImageJ platforms to produce final measurements. In
order to measure orientation deviation, individual hatchling exit angles are placed on an
interactive circle created in the MATLAB platform. The angle created by the individual
exit angle to the reference line (either seaward or brightest light direction) is then easily
measured in the ImageJ platform.
Despite the benefits of noninvasively tracking hatchlings through use of an
infrared camera and primary analysis in MATLAB, there are some limitations to this
approach not present with invasive methods associated with sight orientation studies.
When tracking hatchlings with the algorithm, small gaps or breaks are present in the
tracks. These could indicate the hatchling could have stopped to take a break and thus
movement was not detected, another object could be obstructing the view of the
hatchling, the algorithm failed to pick up movement for some reason, or the means of
tracking at the pixel level naturally creates these small gaps. In contrast if the hatchling is
released in a control beach arena (Salmon et al. 1995; Salmon & Witherington 1995) or
25
tethered to a tracking arm (Tuxbury & Salmon 2005; Lorne & Salmon 2007), individual
tracks can be traced and then mapped together, rather than trying to differentiate tracks
from a large number of hatchings emerging in a span of a few minutes. However, with
continued advances in technology allowing for improvements in tracking software over
time, gaps in individual hatchling tracks may be reduced or eliminated altogether.
Moving forward, modifications to this code or implementation of additional codes
with improvements in technology could be extremely beneficial at refining the tracking
process and ultimately reducing processing time. Being able to differentiate turtle ‘A’
from turtle ‘B’ throughout the video and being able to predict locations of turtles even
when they are not visible, would produce well defined tracks that could relay information
on individual hatchling parameters in the MATLAB platform. In addition, software
utilized in this study could be modified from its current application and applied to a
variety of other behavioral studies dealing with a number of taxa. Given the wide range
of camera and algorithm capabilities, small invertebrates as well as large vertebrates can
be studied in a variety of environments with ease.
ACKNOWLEDGMENTS
Funding for this study was provided by: SC Space Grant and SC Sea Grant
Kathryn Sullivan Earth and Marine Science Fellowship, Savannah Presbytery M.K.
Pentecost Ecology Fund, and Coastal Carolina University. Data collection made possible
by: International Animal Care and Use Committee (permit 2015.04), South Carolina
Department of Natural Resources (permit MTP-2016-011), South Carolina State Park
26
Service (permit N-7-16), local sea turtle nesting permit holders, undergraduate interns
and student/community volunteers.
LITERATURE CITED
Berens, P. (2009). CircStat: A Matlab Toolbox for Circular Statistics. Journal of
Statistical Software, 31, 1-21.
Bourgeois, S., Gilot-Fromont, E., Viallefont, A., Boussamba, F., Deem, S.L. (2009).
Influence of artificial lights, logs and erosion on leatherback sea turtle hatchling
orientation at Pongara National Park, Gabon. Biological Conservation, 142, 85-
93.
Carr, A. (1986). Rips, FADS, and little loggerheads. Bioscience, 36, 92-100.
Christens, E. (1990). Nest emergence lag in loggerhead sea turtles. Journal of
Herpetology, 24, 400.
Dellaert, F., Thorpe, C. (1997). Robust car tracking using Kalman filtering and Bayesian
templates. In Conference on intelligent transportation systems, 1, 1-12.
Demmer, R.J. (1981). The hatchling and emergence of loggerhead turtle (Caretta caretta)
hatchlings, Master’s Thesis, University of Central Florida, Orlando, FL.
Eliceiri, K.W., Berthold, M.R., Goldberg, I.G., Ibáñez, L., Manjunath, B.S., Martone, M.
E., Murphy, R.F., Peng, H., Plant, A.L., Roysam, B., Stuurman, N., Swedlow,
J.R., Tomancak, P., Carpenter, A.E. (2012). Biological imaging software tools.
Nature methods, 9, 697-710.
ImageJ Image Processing and Analysis in Java. Retrieved from https://imagej.nih.gov/ij/
docs/intro.html
Irwin, W.P., Lohmann, K.J. (2003). Magnet-induced disorientation in hatchling
loggerhead sea turtles. Journal of Experimental Biology, 206, 497-501.
Kawamura, G., Naohara, T., Tanaka, Y., Nishi, T., Anraku, K. (2009). Near-ultraviolet
radiation guides the emerged hatchlings of loggerhead turtles Caretta caretta
(Linnaeus) from a nesting beach to the sea at night. Marine and Freshwater
Behaviour and Physiology, 42, 19-30.
Light, P., Salmon, M., Lohmann, K.J. (1993). Geomagnetic orientation of loggerhead sea
turtles: Evidence for an inclination compass. Journal of Experimental Biology,
182, 1-10.
Lohmann, K.J., Lohmann, C.M.F. (1996). Orientation and open-sea navigation in sea
turtles. Journal of Experimental Biology, 199, 73-81.
27
Lohmann, K.J., Cain, S.D., Dodge, S.A., Lohmann, C.M.F. (2001). Regional magnetic
fields as navigational markers for sea turtles. Science, 294, 364-366.
Lorne, J.K., Salmon, M. (2007). Effects of exposure to artificial lighting on orientation of
hatchling sea turtles on the beach and in the ocean. Endangered Species Research,
3, 23-30.
Mathworks Company Overview. (2017). Retrieved from https://www.mathworks.com/
company/aboutus.html
Nehemiah, A. (2014). Computer vision made easy. Computer Vision with MATLAB,
Retrieved 2016.
Nussbaum-Krammer, C.I., Neto, M F., Brielmann, R.M., Pedersen, J.S., Morimoto, R.I.
(2015). Investigating the Spreading and Toxicity of Prion-like Proteins Using the
Metazoan Model Organism C. elegans. Journal of Visualized Experiments (95),
e52321, doi:10.3791/52321.
Orlov, N., Johnston, J., Macura, T., Shamir, L., Goldberg, I. (2007). Computer vision for
microscopy applications. In Vision Systems: Segmentation and Pattern
Recognition. InTech .221-242.
Salmon, M. (2003). Artificial night lighting and sea turtles. Biologist, 50, 163-168.
Salmon, M., Lohmann, K.J. (1989). Orientation cues used by hatchling loggerhead sea
turtles (Caretta caretta) during their offshore migration. Ethology, 83, 215-228.
Salmon, M., Witherington, B.E. (1995). Artificial lighting and seafinding by loggerhead
hatchlings: evidence for lunar modulation. Copeia, 4, 931-938.
Salmon, M., Tolbert, M.G., Painter, D.P., Goff, M., Reiners, R. (1995). Behavior of
loggerhead sea turtles on an urban beach hatchling orientation. Journal of
Herpetology, 29, 568-576.
Siebel, N.T., Maybank, S. (2002). Fusion of multiple tracking algorithms for robust
people tracking. In European Conference on Computer Vision. Berlin,
Heidelberg: Springer, 373-387.
Tuxbury, S.M., Salmon, M. (2005). Competitive interactions between artificial lighting
and natural cues during seafinding by hatchling marine turtles. Biological
Conservation, 121, 311-316.
Whelan, C.L., Wyneken, J. (2007). Estimating predation levels and site-specific survival
of hatchling loggerhead seaturtles (Caretta caretta) from south Florida beaches.
Copeia, 3, 745-754.
Wiltschko, W., Wiltschko, R. (1972). Magnetic compass of European robins. Science,
176, 62.
Witherington, B.E. (1992). Behavioral responses of nesting sea turtles to artificial
lighting. Herpetologica, 48, 31-39.
28
Witherington, B.E., Salmon, M. (1992). Predation on loggerhead turtle hatchlings after
entering the sea. Journal of Herpetology, 26, 226-228.
Witherington, B.E., & Witherington, D. (2015). Our Sea Turtles. Sarasota, FL: Pineapple
Press, Inc.
Wyneken, J., Salmon, M., Lohmann, K.J. (1990). Orientation by hatching loggerhead sea
turtles Caretta caretta L. in a wave tank. Journal of Experimental Marine Biology
and Ecology, 139, 43-50.
Zar, J.H. (1984). Biostatistical analysis. Englewood Cliffs, NJ: Prentice-Hall, Inc.
29
Fig. 1. Emergence images from DeBordieu Beach nest 19. Images taken with GV-
FER5303 fisheye infrared non-illuminating camera with (A) distorted image and (B)
undistorted image.
A B
30
Fig. 2. Demo grid 18 m by 18 m under (A) distorted parameters and (B) undistorted
parameters post Photoshop script corrections.
B A
31
Fig. 3. Measurements between known 1.5 m distances. Values range from 114.35 to
158.86 pixels for an average pixel distance of 136.
32
Fig. 4. Retained locations of hatchlings within each 20 second clips from DeBordieu
Beach nest 19. Tracks representative of one minute and 20 second consecutive
emergence (A-D).
A B
C D
33
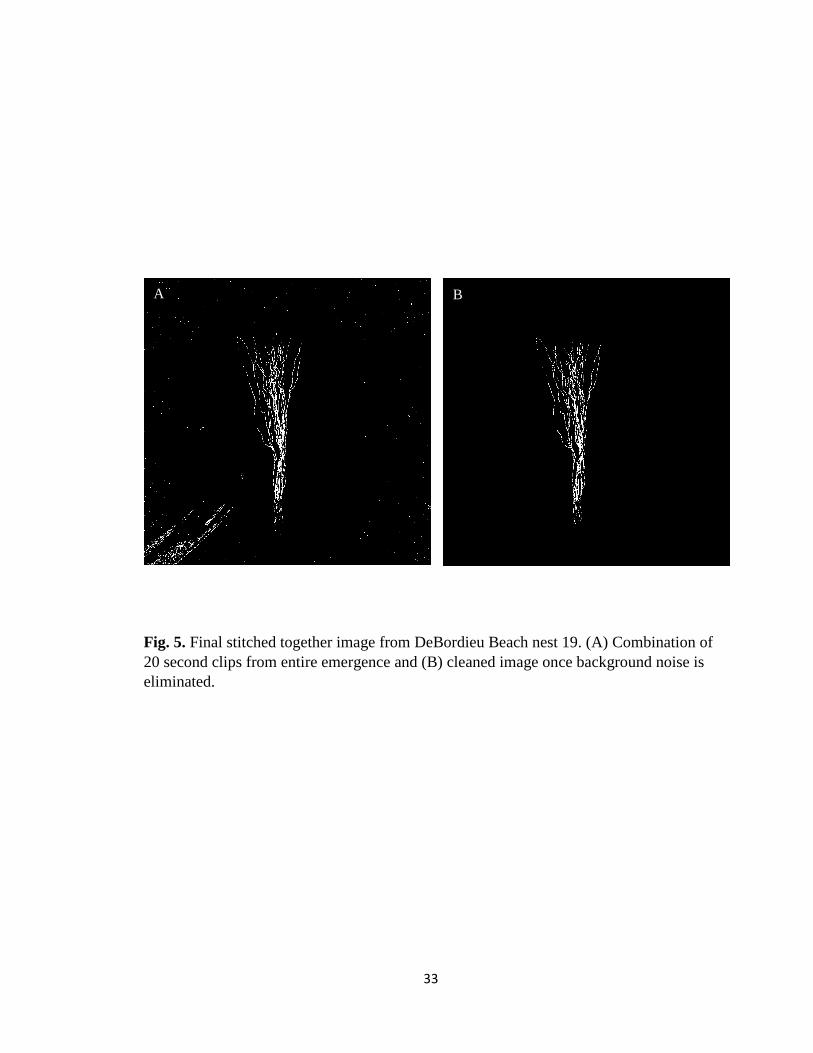
Fig. 5. Final stitched together image from DeBordieu Beach nest 19. (A) Combination of
20 second clips from entire emergence and (B) cleaned image once background noise is
eliminated.
A B
34
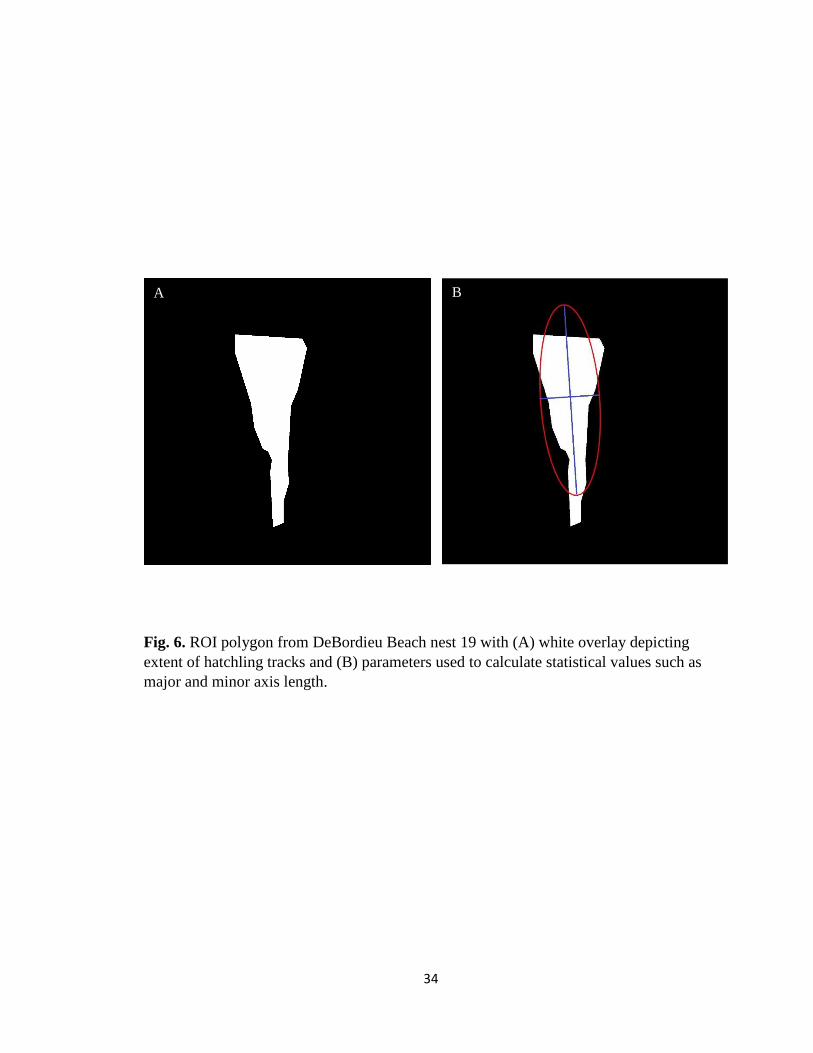
Fig. 6. ROI polygon from DeBordieu Beach nest 19 with (A) white overlay depicting
extent of hatchling tracks and (B) parameters used to calculate statistical values such as
major and minor axis length.
B A
35
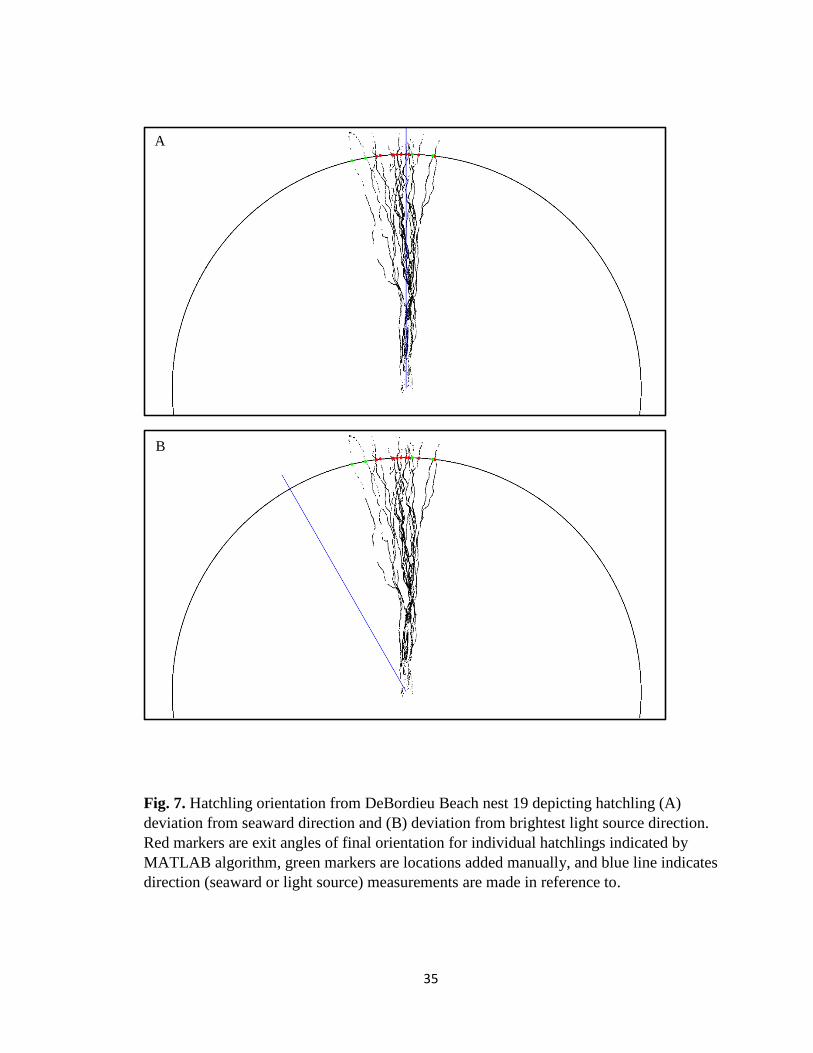
Fig. 7. Hatchling orientation from DeBordieu Beach nest 19 depicting hatchling (A)
deviation from seaward direction and (B) deviation from brightest light source direction.
Red markers are exit angles of final orientation for individual hatchlings indicated by
MATLAB algorithm, green markers are locations added manually, and blue line indicates
direction (seaward or light source) measurements are made in reference to.
A
B
36
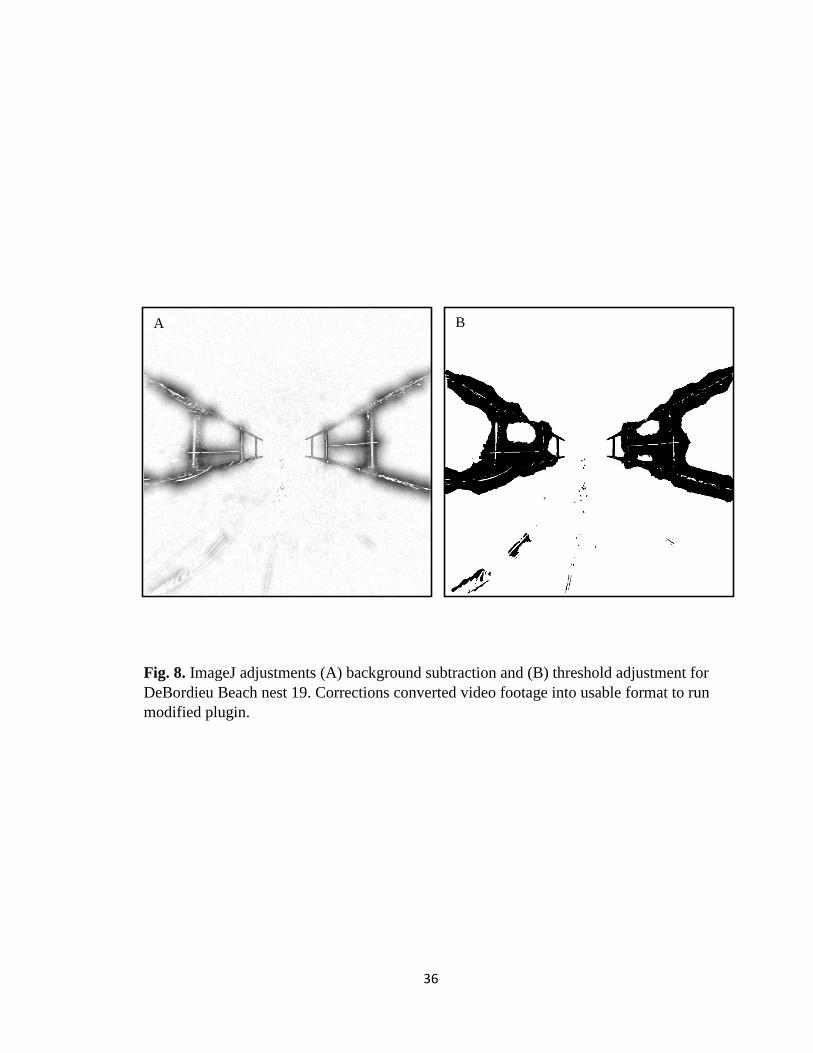
Fig. 8. ImageJ adjustments (A) background subtraction and (B) threshold adjustment for
DeBordieu Beach nest 19. Corrections converted video footage into usable format to run
modified plugin.
B B A
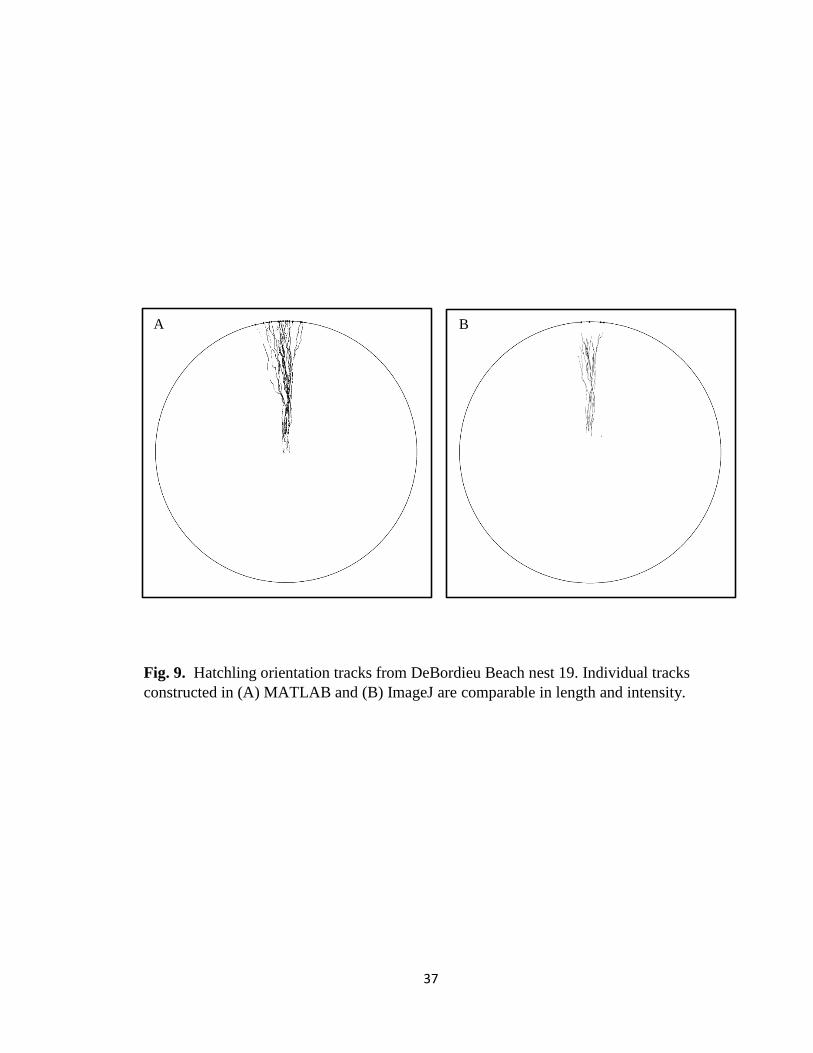
37
Fig. 9. Hatchling orientation tracks from DeBordieu Beach nest 19. Individual tracks
constructed in (A) MATLAB and (B) ImageJ are comparable in length and intensity.
B A
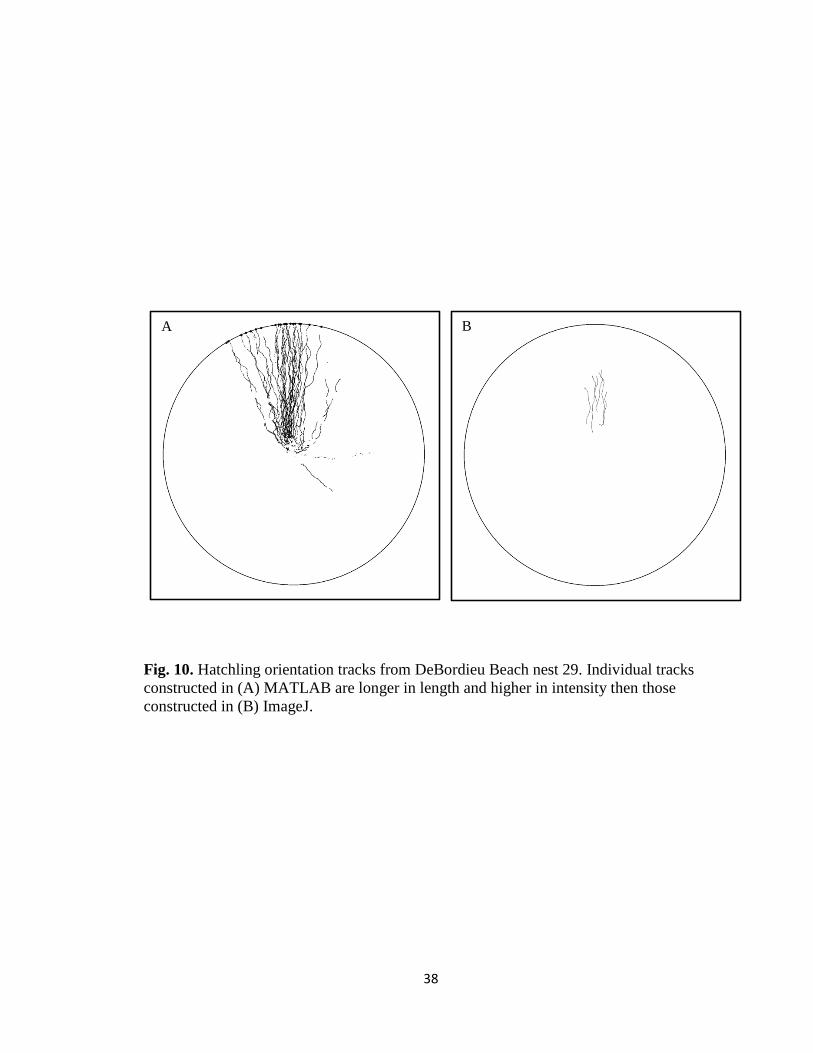
38
Fig. 10. Hatchling orientation tracks from DeBordieu Beach nest 29. Individual tracks
constructed in (A) MATLAB are longer in length and higher in intensity then those
constructed in (B) ImageJ.
B A
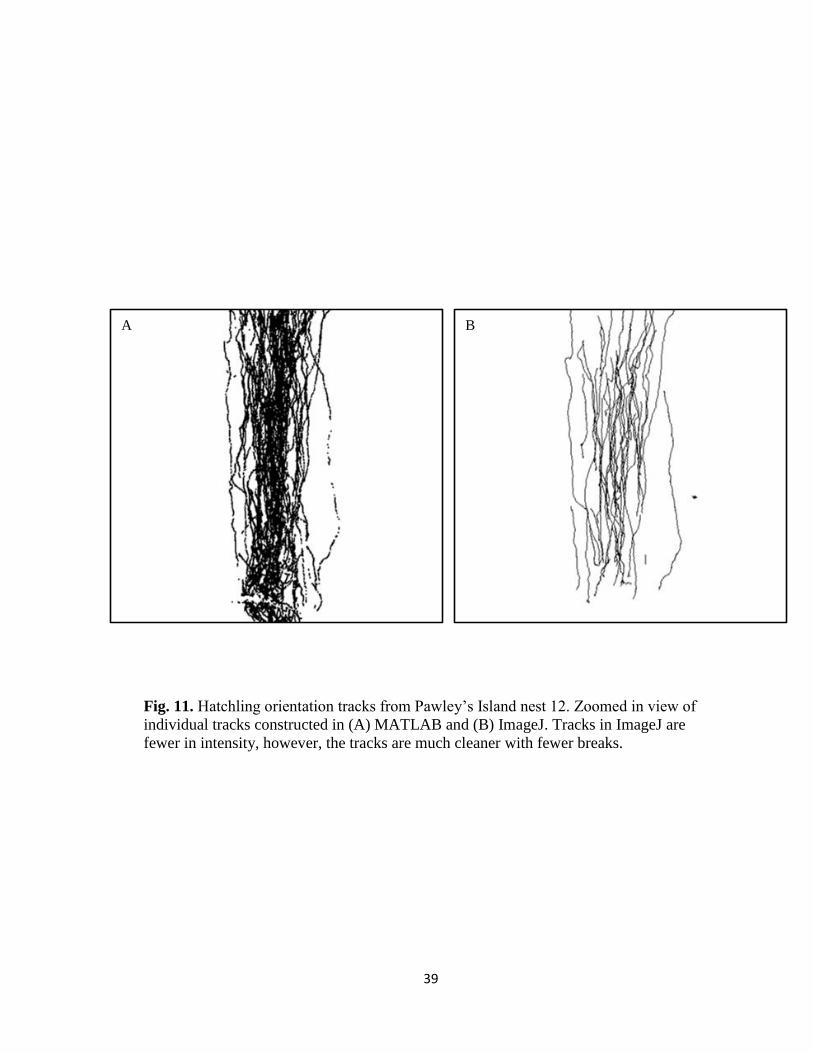
39
Fig. 11. Hatchling orientation tracks from Pawley’s Island nest 12. Zoomed in view of
individual tracks constructed in (A) MATLAB and (B) ImageJ. Tracks in ImageJ are
fewer in intensity, however, the tracks are much cleaner with fewer breaks.
A B
40
CHAPTER 3:
The Effect of Artificial Light on Loggerhead Hatchling Orientation in the
Grand Strand Region of South Carolina
Emily S. Asp1, Eric Koepfler2, Louis Keiner3, Scott L. Parker4, H. Erin Rickard5
ARTIFICIAL LIGHT ON HATCHLING ORIENTATION
Key words: Photopollution, Sea turtle, Caretta caretta, Disorientation, Misorientation,
Management
1 Department of Coastal Marine and Wetland Studies, 100 Chanticleer Dr E, Coastal Carolina University, Conway, South Carolina 29528; Email: [email protected]. Send reprint requests to this address.
2Department of Marine Science, 100 Chanticleer Dr E, Coastal Carolina University, Conway,
South Carolina 29528; Email.
3Department of Physics and Marine Science, 100 Chanticleer Dr E, Coastal Carolina University, Conway, South Carolina 29528; Email: [email protected].
4Department of Biology, 100 Chanticleer Dr E, Coastal Carolina University, Conway, South Carolina 29528; Email: [email protected].
5Department of Computing Sciences, 100 Chanticleer Dr E, Coastal Carolina University, Conway, South Carolina 29528; Email: [email protected].
deceased March 7, 2017
41
ABSTRACT. – Sea turtle hatchlings primarily utilize sight to detect differences in
elevation and light intensity present along the horizon to navigate from the nest to the
water’s edge. The addition of artificial lights can cause visual misdirection, resulting in
disorientation (aimlessly wandering in circular paths) or misorientation (moving in
distinct paths away from ocean). Extensive research has been done on effects of high
levels of artificial light but little on effects of comparatively lower levels of artificial light
on hatchling sea turtle orientation. This study examined these lower intensity areas to
identify if there is a threshold of artificial light above which hatchling orientation is
negatively affected. During the 2016 nesting season, a Geovision GV-FER5303 non-
illuminating infrared camera recorded hatchling trajectories at twenty-one loggerhead sea
turtle nests from areas varying in light intensity along the Grand Strand region of South
Carolina. Individual and group dynamics for lateral range of movement, orientation
deviation, and average speed were measured from each nest to determine if parameters
associated with orientation were significantly affected by total and artificial radiance
values present at the time of emergence. Lateral range of hatchling movement is not
significantly influenced under artificial or total radiance conditions; however, deviation
from seaward direction (F(2,299)=43.623, p<0.001; F(3,424)=23.528, p<0.001) and
average speed are (F(2,495)=42.612, p<0.001; F(3,648)=14.644, p<0.001). Deviation
from brightest light source is significant under total radiance conditions
(F(3,427)=11.358, p<0.001) while only marginally significant under artificial radiance
conditions (F(2,300)=2.336, p=0.098). Results may help inform current management
practices to enhance hatchling survival efforts near northern limit of loggerhead nesting
beaches.
42
INTRODUCTION
Upon emergence from the nest hatchlings utilize three primary senses, the first of
which is sight, to navigate across the beach. Although hatchlings can rarely see the ocean
from their position at the nest, if released with their eyes covered, hatchlings will travel
around aimlessly unable to locate the ocean (Lohmann & Lohmann 1996). Instead
hatchlings rely on subtle cues in their environment within an accepted range of view to
guide them towards the ocean. This view, or the cone of acceptance, is a flattened cone
with a horizontal view of 180 degrees and a vertical view of 30 degrees (Lohmann &
Lohmann 1996; Witherington & Witherington 2015). For effective sight detection,
hatchlings rely on positive phototaxis, movement towards a light source observed on the
horizon within the cone of acceptance and away from shadows cast by the dunes (Salmon
et al. 1995; Witherington & Martin 2000). In conjuncture with light intensity, hatchlings
detect differences in horizontal elevation, moving away from the higher elevation
associated with the dunes and vegetation and towards the flatter beach (Witherington
1992; Salmon et al. 1995). As hatchlings navigate across the beach they will conduct
scans horizontally and vertically to assess environmental differences, moving away from
scans detecting high elevation and low lighting and moving towards scans depicting low
elevation and high lighting (Witherington 1992; Lutz & Musick 1997). In the event that
one cue such as brightness is disrupted, hatchlings are still capable of detecting seaward
direction. However, when light intensity levels increase dramatically, hatchlings fail to
orient in any direction, and when levels are extreme, hatchlings may ignore or be blind to
other cues of seaward direction (Verheijen 1958; Witherington 1992). Under normal
43
conditions hatchlings will not stray more than 20 degrees in either direction of seaward
orientation based on sight characteristics and will reach the ocean in a few minutes
(Salmon 2003; Witherington & Witherington 2015).
Loggerheads have the ability to detect colors in the visible light spectrum ranging
from violet to yellow with wavelengths between 400-600 nm (Witherington & Bjorndal
1991; Wyneken et al. 2013). Their sight extends past conventional limits of colors
perceivable by the human eye, with the capability to detect some ultraviolet light with
wavelengths as low as 365 nm (Spotila 2004). High attraction is reported for lights
ranging from 365-600 nm with avoidance to yellow light observed in Atlantic loggerhead
species (Witherington & Bjorndal 1991; Witherington 1992; Lutz & Musick 1997;
Fritsches 2012). Reason for avoidance is not clearly understood because loggerheads are
the only turtle form the Cheloniidae family that demonstrates avoidance to yellow light
(Witherington 1992; Lutz et al. 1997) and this avoidance has not been observed in Pacific
species of loggerheads (Fritsches 2012). Loggerheads exhibit indifference when exposed
to longer wavelengths such as oranges and reds in the visible light spectrum ranging from
630-700 nm (Witherington 1992; Lutz et al. 2003; Spotila 2004), resulting in no
attraction or avoidance for these colors. Since longer wavelengths are absorbed by
saltwater more readily, the ability to detect these colors may have been lost over time
(Tyler & Smith 1970; Wyneken et al. 2013) In general, hatchlings cannot see definitive
shapes, but rather large silhouettes and indications of brightness (Wyneken et al. 2013).
These slight differentiations make the ability to locate the ocean a difficult task that is
exacerbated by anthropogenic disturbances.
44
Under normal circumstances, natural light of the moon can be used as an aid to
distinguish seafinding orientation. The moon reflects off the waves, illuminating it as the
brightest object on the horizon and prompting seaward orientation (Lohmann & Lohmann
1996). Since natural light is the result of celestial bodies (moon, stars, sun), it is scattered
throughout the atmosphere before it is perceived by sea turtles and thus has very low
directivity (Lutz & Musick 1997; Salmon 2003). Even in areas of high artificial light, the
presence of natural light can reduce mis-directionality associated with artificial light,
reducing extreme light intensity effects and allowing Cheloniidae and Dermochelyidae
(Witherington & Witherington 2015) to rely on other visual cues such as shape
(Verheijen 1958). Natural light can also be used as an absolute indicator of direction for
nocturnal species because light from the atmosphere illuminates objects on the surface of
the ground (Witherington & Martin 2000; Salmon 2003).
Development of the coast has produced an environment with increased artificial
light from large cities that is characterized by an urban glow (Moore et al. 2000; Cinzano
et al. 2002; Gallaway et al. 2010). Artificial lights are highly directional because they
illuminate from a given location, providing a bright source of light in an area that would
naturally be dim (Tuxbury & Salmon 2005). These lights are not scattered through the
atmosphere but rather appear much brighter due to their close proximity to the ground
(Witherington & Martin 2000; Salmon 2003). In the United States, projected ambient
light levels are expected to increase at a rate of 6 percent each year as reported by the
World Atlas of the artificial night sky brightness (Cinzano 2002), and if this trend
continues, could have substantial impacts on hatchling populations over time (Holker et
al. 2000; Witherington & Martin 2000). Increased levels of artificial light that effect
45
normal interactions between organisms and their environment (both terrestrial and
aquatic) is referred to as ecological light pollution (Longcore & Rich 2004). Ecological
light pollution is a result of changes in illumination which leads to a decrease in fitness of
the organism studied (Longcore & Rich 2004; Holker et al. 2010).
The addition of artificial lights to the night sky intensifies misdirection of visual
cues, leading to minimal illumination of seaward areas and high illumination of landward
areas especially during new moon lunar cycles (Salmon & Witherington 1995; Tuxbury
& Salmon 2005). As hatchlings move towards the artificial light source, uneven light
distribution hinders their ability to differentiate shape and elevation, essentially blinding
the hatching to other visual cues in a response know as light trapping (Verheijen 1958;
Salmon & Witherington 1995). In extreme circumstances busy roads (McFarlane 1963;
peters & Verhoeven 1994) and fires (Mortimer 1979) near the beach can eliminate entire
nests due to extreme light trapping (Witherington 1997; Lorne & Salmon 2007). In
Florida each year about one million hatchlings are misdirected by high levels of artificial
lights, resulting in the death of hundreds of thousands of hatchlings (Witherington 1997).
Insufficient visual cues and competing cues lead to high levels of both
disorientation and misorientation of hatchlings (Witherington & Martin 2000, Tuxbury &
Salmon 2005). Disorientation occurs when hatchlings wander around aimlessly in
circular paths searching for the ocean (Salmon 2003; Tuxbury & Salmon 2005). Often
times disorientation is a result of high background light (urban glow) providing little
illumination to objects in view (Salmon et al. 1995; Witherington & Martin 2000;
Gallaway et al. 2010). All objects are perceived at the same light intensity magnification,
creating competing stimuli which confuse the hatchling as to which direction is seaward
46
(Tuxbury & Salmon 2005). In contrast, misorientation occurs when hatchlings move in a
distinct path away from the ocean (Salmon 2003; Tuxbury & Salmon 2005).
Misorientation is a result of a few strong lights in a given area attracting hatchling
movement because these lights appear to be the brightest object in their field of view and
overpower any natural visual cues (Salmon et al. 1995; Tuxbury & Salmon 2005).
Disorientation and misorientation decrease the probability of locating the ocean and
increase the likelihood of hatchling mortality by dehydration, exhaustion, and predation
(Witherington & Martin 2000).
The aim of this study was to use a non-illuminating infrared camera to capture
discrete hatchling movements during emergence from the nest. Specific parameters
indicative of overall hatchling orientation a) speed, b) orientation deviation, and c) range
of hatchling movement were monitored to determine if there is a threshold of light
permissible before hatchling orientation is negatively affected. The presence of this
threshold may help inform future management practices to enhance hatchling survival
efforts.
MATERIALS AND METHODS
Study Area. – Research was conducted along the Grand Strand Region in Horry
and Georgetown Counties of South Carolina (Appendix B), a near 100 km section of
coastline extending from Little River Inlet (33.8481° N, 78.5483° W) in the north to
Winyah Bay (33.2702° N, 79.2423° W) in the south. Surveys were conducted from July
47
to October, 2016 on ten beaches in the study area, extending from Waties Island in the
north to Hobcaw Beach in the south.
Nest Selection. – Nighttime upwelling of visible light was measured by the
Visible Infrared Imaging Radiometer (VIIRS) on board NASA’s Suomi NPP satellite.
This sensor is used to detect light pollution worldwide. The data was then retrieved from
NOAA’s CLASS server and processed using ENVI remote sensing software to determine
the amount of upwelling light on the beach every quarter kilometer along the Grand
Strand. Data was extracted from May to October to represent conditions observed during
the nesting season. Only satellite data from cloudless moonless nights were considered in
order to estimate radiance of artificial light as opposed to total radiance. Radiance values
were then designated into one of four stratified light intensity regions (low, moderate,
high, very high) in order to create a baseline of artificial radiance values in the area and to
ensure equal sampling of nests from each lighting region. Stratified light intensity regions
were determined based on a log scale distribution of the range of artificial light intensity
values, grouping areas of relatively equal intensity (Appendix C).
Specific nests to survey were selected based off of nest incubation time and
reports from local permit holders. On average, eggs incubate for roughly 50-60 days
dependent on environmental conditions present during incubation (Witherington &
Witherington 2015), with nests laid at the beginning of the season have longer incubation
durations than nest laid in the middle of the season (Bolton and Witherington 2003).
Incubation information helped researchers to select nests to survey based on which were
more likely to emerge at a given time. In addition, some nests display a depression in the
fluffy loose sand above the egg chamber once hatchlings break through the ceiling of the
48
chamber (Witherington & Witherington 2015). If local permit holders observed a
depression during their morning surveys they would contact our research group since this
nest would be close to hatching. Individual nests were also selected based on which
lighting condition they were found in. In higher light areas there were fewer nests
accessible so these nests were sometimes prioritized to ensure equal sampling.
Field Experiments. – A Geovision GV-FER5303 camera (5MP H.264 WDR
Infrared Fisheye Rugged IP, Geovision Inc., Taiwan) was deployed before sunset each
night (total of 75 nights) at one or two nests within the study area. The camera was
suspended 3 m above the nest supported by a grade 30, 2 in diameter PVC structure
painted black. The structure was composed of two ladder like towers that stood 3 m tall
and spanned a distance of 1.8 m, positioned over the center of the nest (Fig. 1).
Additional neoprene support lines were attached to the towers to prevent movement of
the structure without obstructing turtle movement. The camera system was attached to an
external marine battery and wireless router to relay live video footage to the research
team monitoring the nest out of the camera field of view (radius of 9.9 m at night with IR
ring) on the Geovision smartphone application program. No external light sources (red or
white) were utilized by the research team during an emergence in order to capture
hatchling behavior under present environmental conditions. A total of 40 nests were
surveyed from Waties Island in the north to Hobcaw Beach in the south, with data
collected from 21 nests in which 1,204 hatchlings were observed. In the event an
emergence did not occur, camera and frame were removed at sun rise the following
morning.
49
After all hatchlings exited the camera field of view, we conducted a sweep of the
beach looking for misoriented or disoriented hatchlings. A total of 226 recovered
hatchlings were collected and moved to the swash zone of the beach where they were
immediately released by a researcher according to South Carolina DNR (SCDNR)
guidelines. Once hatchlings exited range, ambient environmental lighting conditions were
recorded, taking into account total radiance observed at the time of emergence. A
Unihedron SQM-LU handheld light meter was used to record radiance values 360
degrees around the nest based on the slope of the beach, in order to recreate the
conditions hatchlings observed upon emergence when sight is first utilized within their
cone of acceptance. Six seaward and six landward measurements were taken every thirty
degrees around the nest with seaward measurements positioned down towards the ocean
and landward measurements positioned up towards the dunes at the elevation height
equivalent to the slope of the beach.
Ancillary environmental measurements were also recorded after each emergence
since each of these characteristics have the potential to influence ambient lighting
conditions or the movement of hatchlings. Temperature of the air was taken using
Unihedron SQM-LU handheld meter, while temperature of the sand at the nest and
undisturbed sand surrounding the nest were taken using Cen-Tech Infrared Thermometer.
Cloud coverage was determined on a percentage scale with values ranging from 0, 25, 50,
75, or 100 percent coverage. Moon phase was determined from a K Solution LLC
Twilight and Moon Calendar characterized out of a 100% system, where 0% is new
moon conditions and 100% is full moon conditions. Wave height was determined by the
height of the water at the closest pier to the nest location and wind speed was determined
50
from The Weather Channel’s wind characteristics present at the time of emergence.
Distance from the nest to the tide line was measured using a feet/inches measuring tape to
determine distance hatchlings traveled. Any abnormal environmental conditions were
also recorded, such as exterior lights on at a house adjacent to the nest, abnormal weather
conditions, and protective covering placed over the nest.
Video Processing. – A Linux computer system was used to extract recorded
videos from the mini SD card embedded in the Geovision FER5303 camera central
housing system. Video segments containing turtles were converted to grayscale images at
a rate of 15 frames per second (fps). Individual images were run through a customized
Photoshop lens correction based on the specifications for a Parrot Bebop Drone 2.0 for
the best fisheye distortion correction. Once corrected, individual images were cropped to
a uniform maximum radius of 7.6 m from the center of the camera structure in any
direction (variable distance from nest given inconsistent beach terrain between locations),
with consecutive images from the original segment strung together into a cropped video.
To help eliminate excess background noise that can interfere with tracking turtle
movement, each cropped video segment was further divided into several shorter videos
with a duration of 20 seconds. Once in a usable format, the videos were run through a
modified TurtleTrack algorithm conducted in MATLAB, using counting cars script
(Nehemiah 2014) as a model to track individual turtle movement. This algorithm
differentiated what was foreground as opposed to background, defined minimum and
maximum parameters of turtle size through blob analysis, and morphologically filtered
the output. Once filtered, specific detections were marked on individual pixels which
were retained throughout the video to produce discrete tracks on a final image for the
51
video segment (Fig. 2). These colored red green blue (RGB) images were then converted
into binary black white (BW) images where the foreground (tracks of detected turtles)
was displayed as white and the background was displayed as black. BW images produced
from the same emergence were combined together to display all of the tracks from a
given nest, with the final image cleaned up to remove any noise accumulated in the
background during tracking.
Once all video footage was processed, characteristics such as group lateral range
of movement for a given nest, individual hatchling orientation deviation from a seaward
direction and from the brightest light source direction, and individual hatchling speed
were calculated. In order to measure range of movement, an interactive region of interest
(ROI) polygon was created in MATLAB over the tracks for each nest. Major and minor
axis lengths were calculated for a ROI ellipse with the same second moments as the
interactive ROI polygon. For each nest except one, the minor axis length (converted to
feet) indicated nest lateral range of movement. Orientation diagrams were constructed in
the MATLAB platform with individual hatchling exit angles recorded based on tracks.
Tracks that crossed circle but were not picked up by the TurtleTrack algorithm
constructed in MATLAB were manually inserted and reference line of seaward direction
and variable brightest light source direction for each nest were added (Appendix D).
Individual hatchling deviations were measured in the ImageJ platform using the angle
tool, and mean nest deviation recorded. Individual speed was calculated in ImageJ by
means of a modified wrMTrck plugin (Nussbaum-Krammer et al. 2015) where 1.5 m in
the field corresponded to 136 pixels on the image. Several high hatchling density 20
second clips for a given nest were combined into multiple minute segments where the
52
background was subtracted and threshold of image maximized to increase contrast
between hatchlings and the background. Corresponding minimum and maximum blob
analysis parameters utilized in turtle tracking MATLAB algorithm were implemented in
the plugin, with maximum and average speed calculated for individual tracks based on a
minimum length of 100 frames.
Data Analysis. –Linear regression was run through SPSS to determine if
multicollinearity was present between dependent variables. Variance inflation factors less
than three were accepted as variables uncorrelated to one another. Temperature of the
sand within the nest and temperature of the undisturbed sand surrounding the nest were
strongly correlated to one another and thus only temperature of the nest was considered.
Normal distribution of independent variables were also determined, with natural log
transformations used on variables ±1. Two-step cluster analysis was run in SPSS to
determine groupings for artificial light radiance (three groups) and total light radiance
(four groups) based on observed data (Fig. 3).
Analysis of variance (ANOVA) test between independent variables associated
with hatchling orientation was run in SPSS with values less than 0.05 considered
significant. Independent variables of range of movement, deviation from seaward
direction, deviation from the brightest light source, and average speed were compared to
total radiance groups and artificial radiance groups observed during new moon
conditions, with statistically different groups identified by Tukey-B post hoc test.
Circular statistics (Zar 1984; Berens 2009) were run in MATLAB to calculate mean
angle of orientation, r-vector length, and significant orientation at the 0.05 level by a
Rayleigh test. Stepwise linear regression was run in SPSS to determine if independent
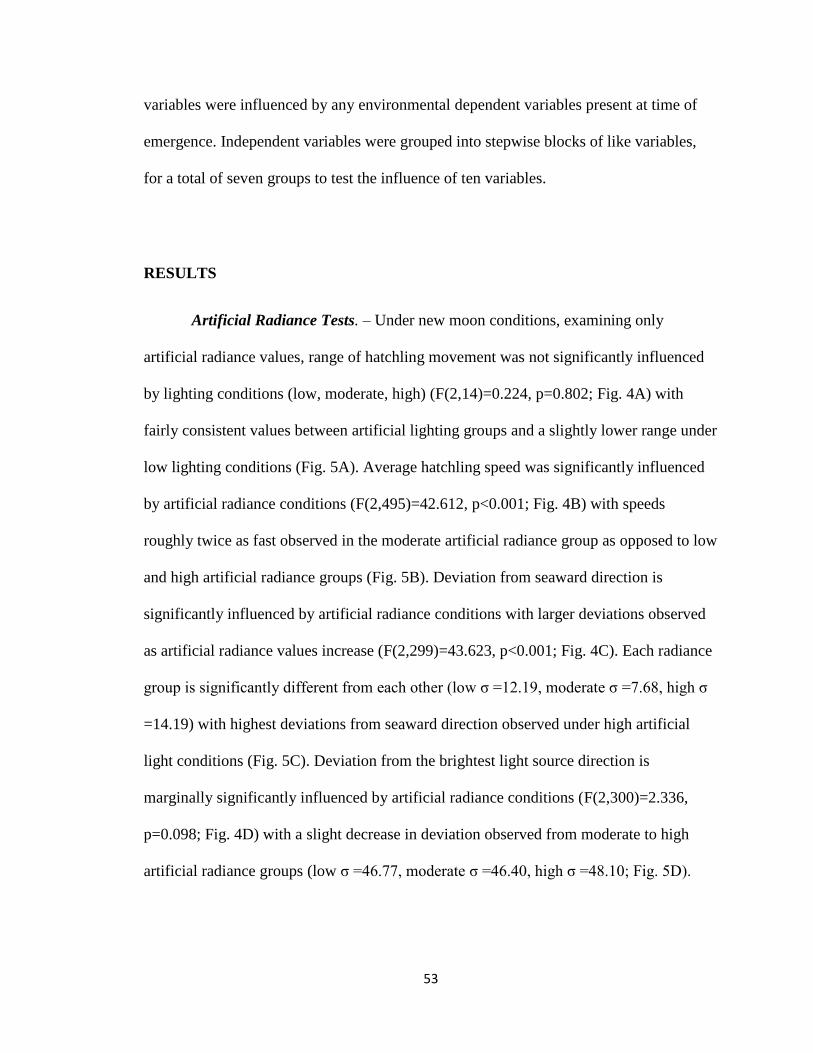
53
variables were influenced by any environmental dependent variables present at time of
emergence. Independent variables were grouped into stepwise blocks of like variables,
for a total of seven groups to test the influence of ten variables.
RESULTS
Artificial Radiance Tests. – Under new moon conditions, examining only
artificial radiance values, range of hatchling movement was not significantly influenced
by lighting conditions (low, moderate, high) (F(2,14)=0.224, p=0.802; Fig. 4A) with
fairly consistent values between artificial lighting groups and a slightly lower range under
low lighting conditions (Fig. 5A). Average hatchling speed was significantly influenced
by artificial radiance conditions (F(2,495)=42.612, p<0.001; Fig. 4B) with speeds
roughly twice as fast observed in the moderate artificial radiance group as opposed to low
and high artificial radiance groups (Fig. 5B). Deviation from seaward direction is
significantly influenced by artificial radiance conditions with larger deviations observed
as artificial radiance values increase (F(2,299)=43.623, p<0.001; Fig. 4C). Each radiance
group is significantly different from each other (low σ =12.19, moderate σ =7.68, high σ
=14.19) with highest deviations from seaward direction observed under high artificial
light conditions (Fig. 5C). Deviation from the brightest light source direction is
marginally significantly influenced by artificial radiance conditions (F(2,300)=2.336,
p=0.098; Fig. 4D) with a slight decrease in deviation observed from moderate to high
artificial radiance groups (low σ =46.77, moderate σ =46.40, high σ =48.10; Fig. 5D).
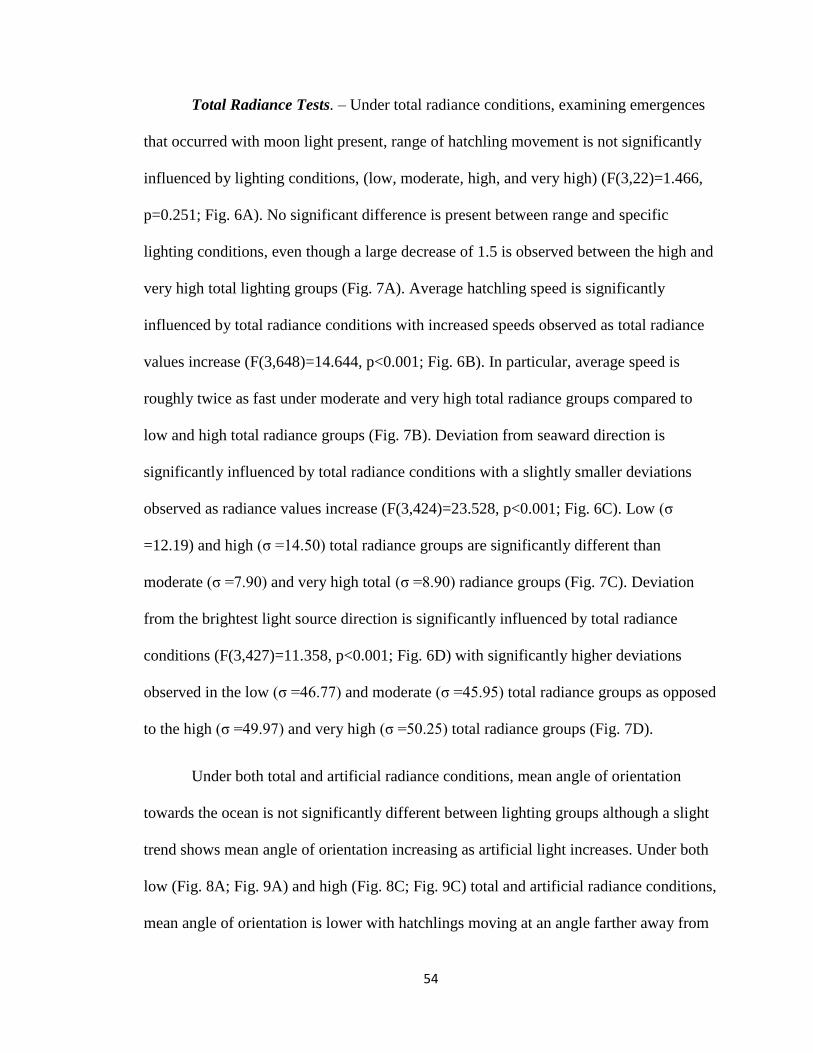
54
Total Radiance Tests. – Under total radiance conditions, examining emergences
that occurred with moon light present, range of hatchling movement is not significantly
influenced by lighting conditions, (low, moderate, high, and very high) (F(3,22)=1.466,
p=0.251; Fig. 6A). No significant difference is present between range and specific
lighting conditions, even though a large decrease of 1.5 is observed between the high and
very high total lighting groups (Fig. 7A). Average hatchling speed is significantly
influenced by total radiance conditions with increased speeds observed as total radiance
values increase (F(3,648)=14.644, p<0.001; Fig. 6B). In particular, average speed is
roughly twice as fast under moderate and very high total radiance groups compared to
low and high total radiance groups (Fig. 7B). Deviation from seaward direction is
significantly influenced by total radiance conditions with a slightly smaller deviations
observed as radiance values increase (F(3,424)=23.528, p<0.001; Fig. 6C). Low (σ
=12.19) and high (σ =14.50) total radiance groups are significantly different than
moderate (σ =7.90) and very high total (σ =8.90) radiance groups (Fig. 7C). Deviation
from the brightest light source direction is significantly influenced by total radiance
conditions (F(3,427)=11.358, p<0.001; Fig. 6D) with significantly higher deviations
observed in the low (σ =46.77) and moderate (σ =45.95) total radiance groups as opposed
to the high (σ =49.97) and very high (σ =50.25) total radiance groups (Fig. 7D).
Under both total and artificial radiance conditions, mean angle of orientation
towards the ocean is not significantly different between lighting groups although a slight
trend shows mean angle of orientation increasing as artificial light increases. Under both
low (Fig. 8A; Fig. 9A) and high (Fig. 8C; Fig. 9C) total and artificial radiance conditions,
mean angle of orientation is lower with hatchlings moving at an angle farther away from
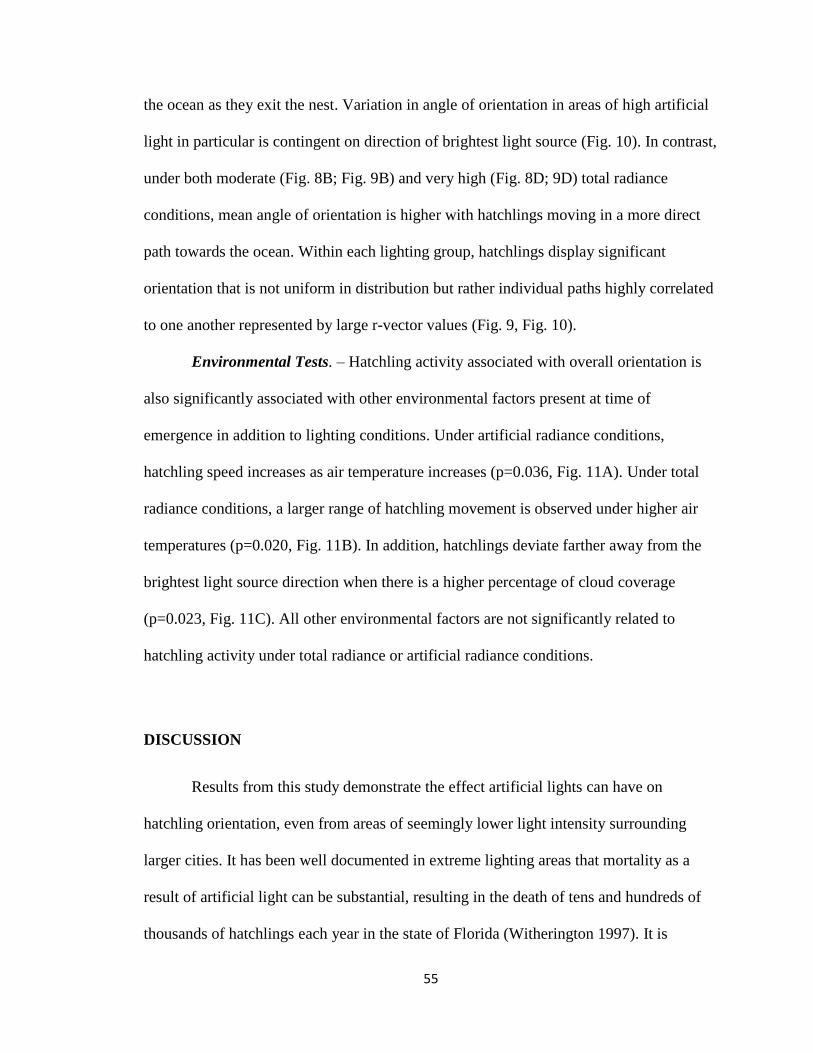
55
the ocean as they exit the nest. Variation in angle of orientation in areas of high artificial
light in particular is contingent on direction of brightest light source (Fig. 10). In contrast,
under both moderate (Fig. 8B; Fig. 9B) and very high (Fig. 8D; 9D) total radiance
conditions, mean angle of orientation is higher with hatchlings moving in a more direct
path towards the ocean. Within each lighting group, hatchlings display significant
orientation that is not uniform in distribution but rather individual paths highly correlated
to one another represented by large r-vector values (Fig. 9, Fig. 10).
Environmental Tests. – Hatchling activity associated with overall orientation is
also significantly associated with other environmental factors present at time of
emergence in addition to lighting conditions. Under artificial radiance conditions,
hatchling speed increases as air temperature increases (p=0.036, Fig. 11A). Under total
radiance conditions, a larger range of hatchling movement is observed under higher air
temperatures (p=0.020, Fig. 11B). In addition, hatchlings deviate farther away from the
brightest light source direction when there is a higher percentage of cloud coverage
(p=0.023, Fig. 11C). All other environmental factors are not significantly related to
hatchling activity under total radiance or artificial radiance conditions.
DISCUSSION
Results from this study demonstrate the effect artificial lights can have on
hatchling orientation, even from areas of seemingly lower light intensity surrounding
larger cities. It has been well documented in extreme lighting areas that mortality as a
result of artificial light can be substantial, resulting in the death of tens and hundreds of
thousands of hatchlings each year in the state of Florida (Witherington 1997). It is
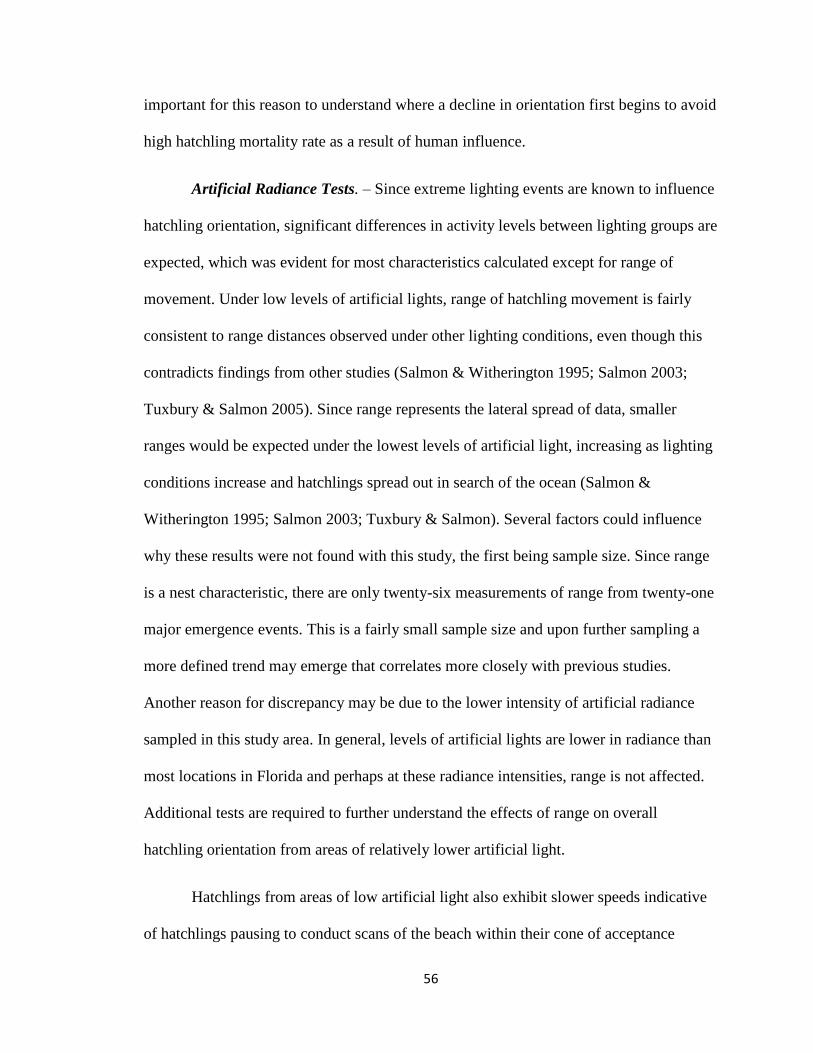
56
important for this reason to understand where a decline in orientation first begins to avoid
high hatchling mortality rate as a result of human influence.
Artificial Radiance Tests. – Since extreme lighting events are known to influence
hatchling orientation, significant differences in activity levels between lighting groups are
expected, which was evident for most characteristics calculated except for range of
movement. Under low levels of artificial lights, range of hatchling movement is fairly
consistent to range distances observed under other lighting conditions, even though this
contradicts findings from other studies (Salmon & Witherington 1995; Salmon 2003;
Tuxbury & Salmon 2005). Since range represents the lateral spread of data, smaller
ranges would be expected under the lowest levels of artificial light, increasing as lighting
conditions increase and hatchlings spread out in search of the ocean (Salmon &
Witherington 1995; Salmon 2003; Tuxbury & Salmon). Several factors could influence
why these results were not found with this study, the first being sample size. Since range
is a nest characteristic, there are only twenty-six measurements of range from twenty-one
major emergence events. This is a fairly small sample size and upon further sampling a
more defined trend may emerge that correlates more closely with previous studies.
Another reason for discrepancy may be due to the lower intensity of artificial radiance
sampled in this study area. In general, levels of artificial lights are lower in radiance than
most locations in Florida and perhaps at these radiance intensities, range is not affected.
Additional tests are required to further understand the effects of range on overall
hatchling orientation from areas of relatively lower artificial light.
Hatchlings from areas of low artificial light also exhibit slower speeds indicative
of hatchlings pausing to conduct scans of the beach within their cone of acceptance
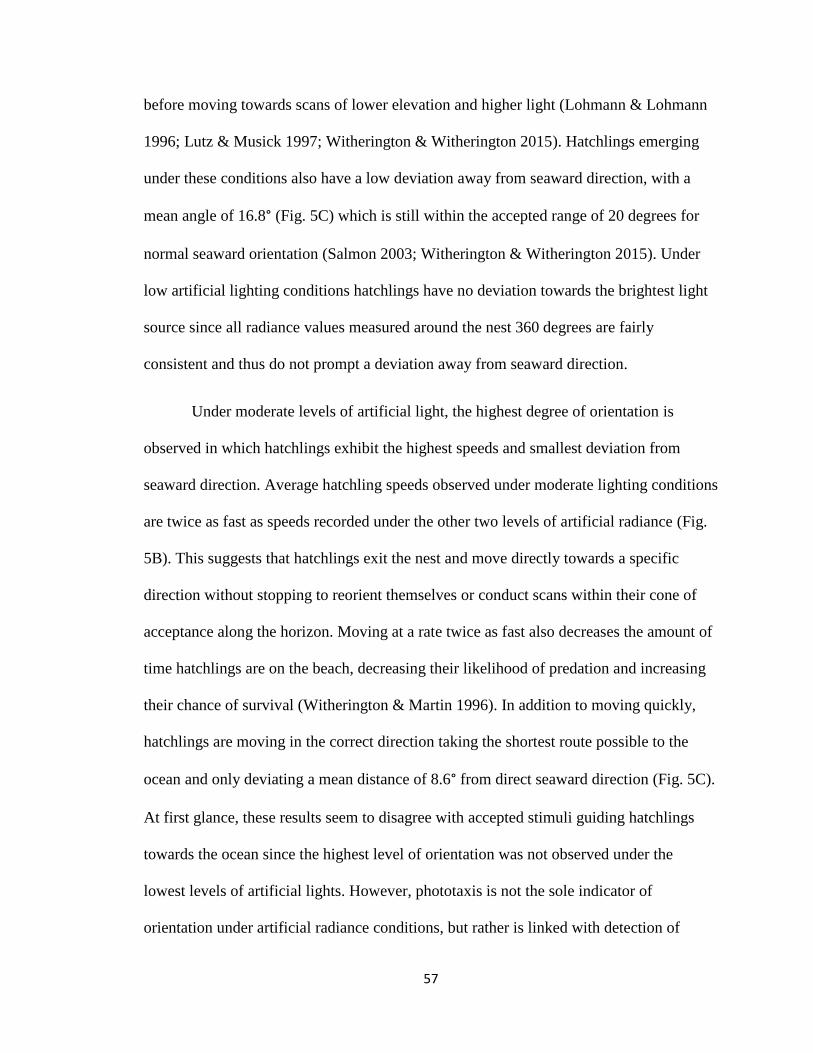
57
before moving towards scans of lower elevation and higher light (Lohmann & Lohmann
1996; Lutz & Musick 1997; Witherington & Witherington 2015). Hatchlings emerging
under these conditions also have a low deviation away from seaward direction, with a
mean angle of 16.8° (Fig. 5C) which is still within the accepted range of 20 degrees for
normal seaward orientation (Salmon 2003; Witherington & Witherington 2015). Under
low artificial lighting conditions hatchlings have no deviation towards the brightest light
source since all radiance values measured around the nest 360 degrees are fairly
consistent and thus do not prompt a deviation away from seaward direction.
Under moderate levels of artificial light, the highest degree of orientation is
observed in which hatchlings exhibit the highest speeds and smallest deviation from
seaward direction. Average hatchling speeds observed under moderate lighting conditions
are twice as fast as speeds recorded under the other two levels of artificial radiance (Fig.
5B). This suggests that hatchlings exit the nest and move directly towards a specific
direction without stopping to reorient themselves or conduct scans within their cone of
acceptance along the horizon. Moving at a rate twice as fast also decreases the amount of
time hatchlings are on the beach, decreasing their likelihood of predation and increasing
their chance of survival (Witherington & Martin 1996). In addition to moving quickly,
hatchlings are moving in the correct direction taking the shortest route possible to the
ocean and only deviating a mean distance of 8.6° from direct seaward direction (Fig. 5C).
At first glance, these results seem to disagree with accepted stimuli guiding hatchlings
towards the ocean since the highest level of orientation was not observed under the
lowest levels of artificial lights. However, phototaxis is not the sole indicator of
orientation under artificial radiance conditions, but rather is linked with detection of
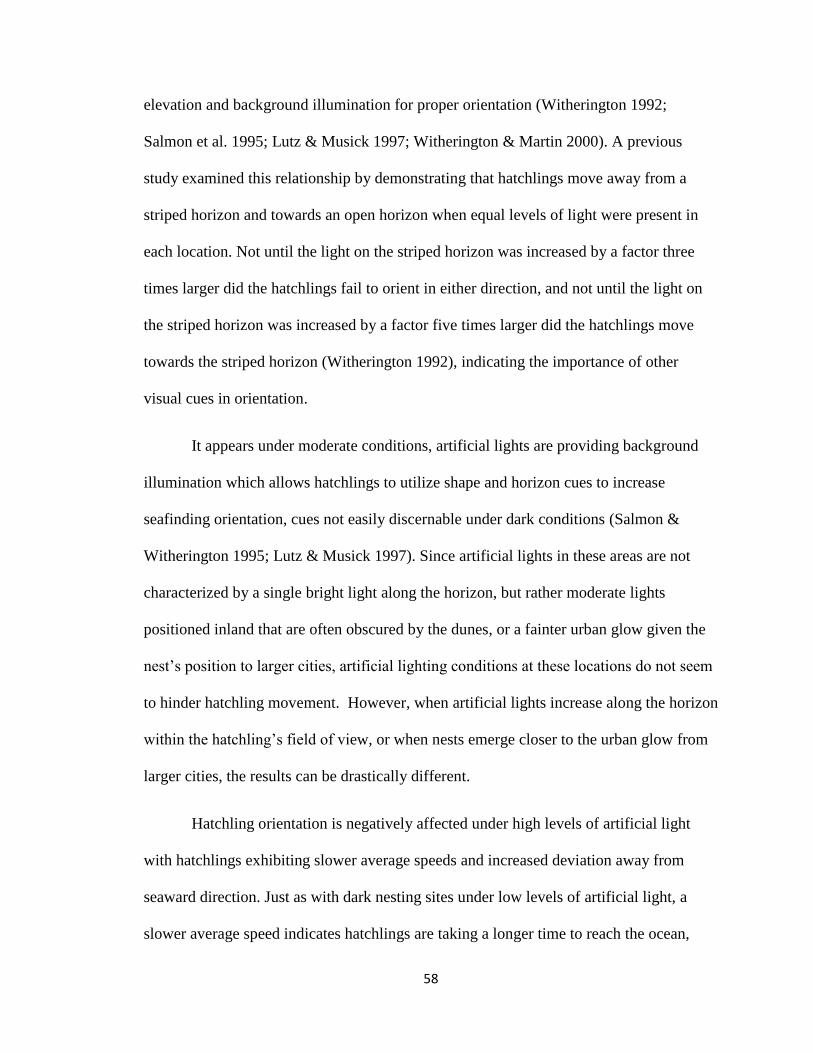
58
elevation and background illumination for proper orientation (Witherington 1992;
Salmon et al. 1995; Lutz & Musick 1997; Witherington & Martin 2000). A previous
study examined this relationship by demonstrating that hatchlings move away from a
striped horizon and towards an open horizon when equal levels of light were present in
each location. Not until the light on the striped horizon was increased by a factor three
times larger did the hatchlings fail to orient in either direction, and not until the light on
the striped horizon was increased by a factor five times larger did the hatchlings move
towards the striped horizon (Witherington 1992), indicating the importance of other
visual cues in orientation.
It appears under moderate conditions, artificial lights are providing background
illumination which allows hatchlings to utilize shape and horizon cues to increase
seafinding orientation, cues not easily discernable under dark conditions (Salmon &
Witherington 1995; Lutz & Musick 1997). Since artificial lights in these areas are not
characterized by a single bright light along the horizon, but rather moderate lights
positioned inland that are often obscured by the dunes, or a fainter urban glow given the
nest’s position to larger cities, artificial lighting conditions at these locations do not seem
to hinder hatchling movement. However, when artificial lights increase along the horizon
within the hatchling’s field of view, or when nests emerge closer to the urban glow from
larger cities, the results can be drastically different.
Hatchling orientation is negatively affected under high levels of artificial light
with hatchlings exhibiting slower average speeds and increased deviation away from
seaward direction. Just as with dark nesting sites under low levels of artificial light, a
slower average speed indicates hatchlings are taking a longer time to reach the ocean,
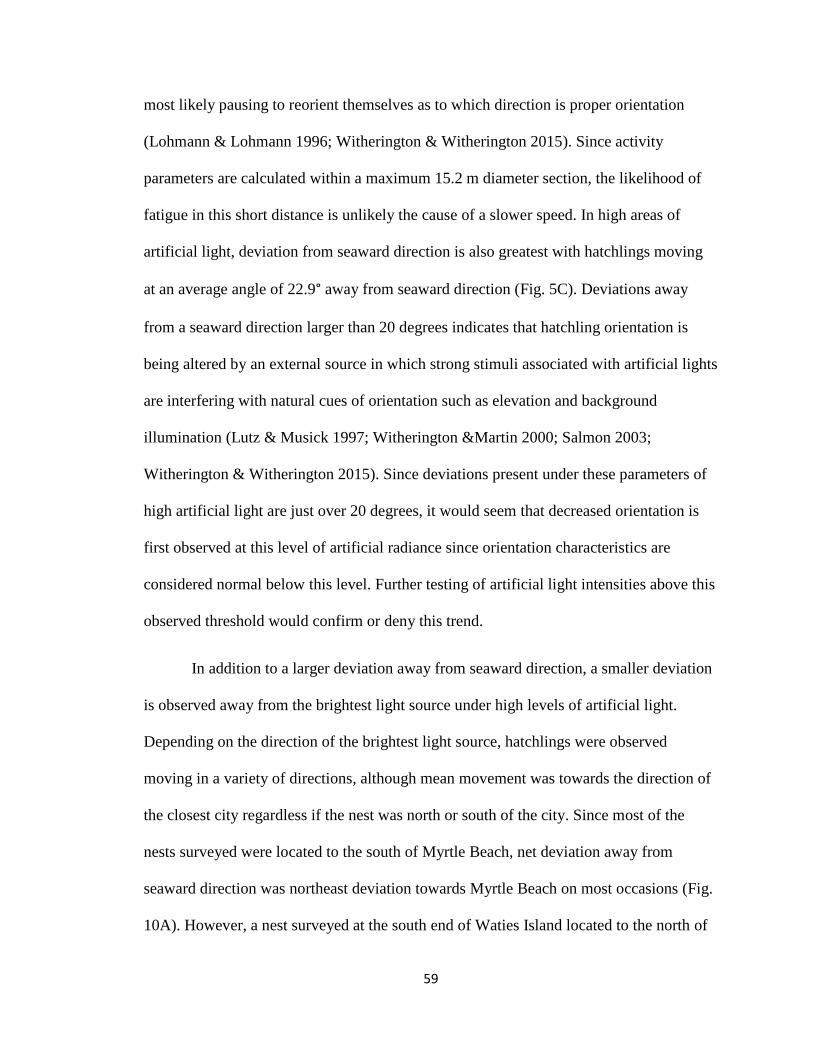
59
most likely pausing to reorient themselves as to which direction is proper orientation
(Lohmann & Lohmann 1996; Witherington & Witherington 2015). Since activity
parameters are calculated within a maximum 15.2 m diameter section, the likelihood of
fatigue in this short distance is unlikely the cause of a slower speed. In high areas of
artificial light, deviation from seaward direction is also greatest with hatchlings moving
at an average angle of 22.9° away from seaward direction (Fig. 5C). Deviations away
from a seaward direction larger than 20 degrees indicates that hatchling orientation is
being altered by an external source in which strong stimuli associated with artificial lights
are interfering with natural cues of orientation such as elevation and background
illumination (Lutz & Musick 1997; Witherington &Martin 2000; Salmon 2003;
Witherington & Witherington 2015). Since deviations present under these parameters of
high artificial light are just over 20 degrees, it would seem that decreased orientation is
first observed at this level of artificial radiance since orientation characteristics are
considered normal below this level. Further testing of artificial light intensities above this
observed threshold would confirm or deny this trend.
In addition to a larger deviation away from seaward direction, a smaller deviation
is observed away from the brightest light source under high levels of artificial light.
Depending on the direction of the brightest light source, hatchlings were observed
moving in a variety of directions, although mean movement was towards the direction of
the closest city regardless if the nest was north or south of the city. Since most of the
nests surveyed were located to the south of Myrtle Beach, net deviation away from
seaward direction was northeast deviation towards Myrtle Beach on most occasions (Fig.
10A). However, a nest surveyed at the south end of Waties Island located to the north of
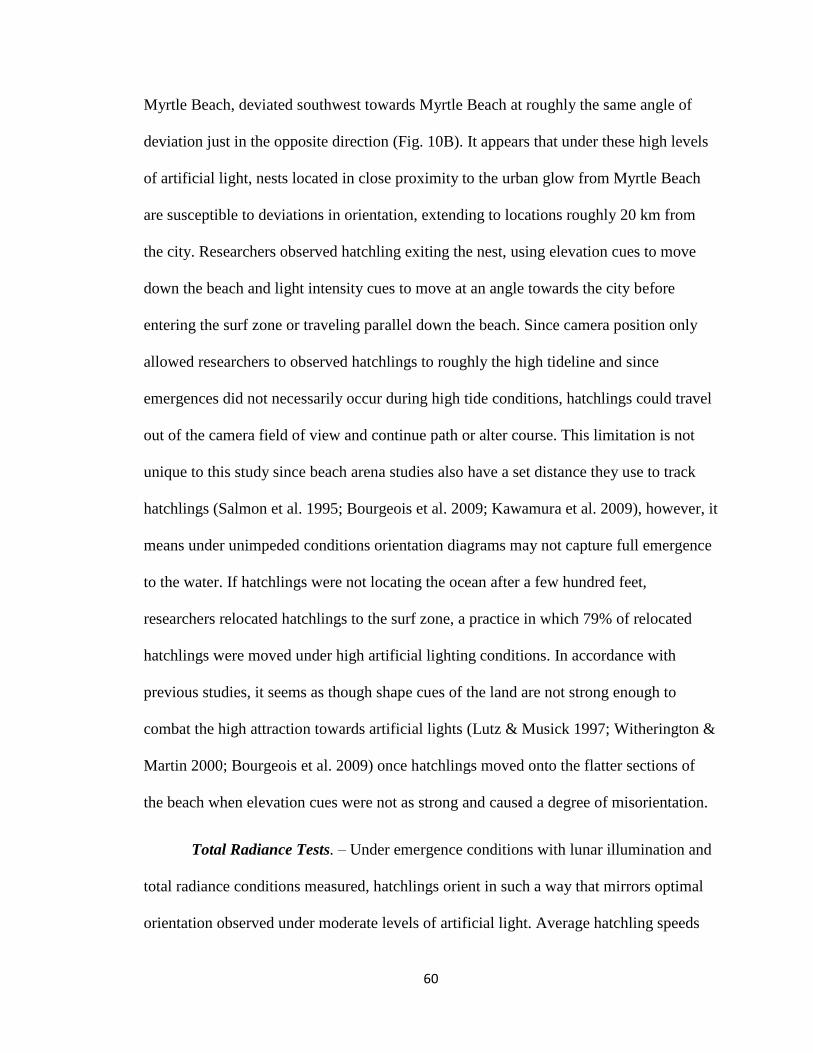
60
Myrtle Beach, deviated southwest towards Myrtle Beach at roughly the same angle of
deviation just in the opposite direction (Fig. 10B). It appears that under these high levels
of artificial light, nests located in close proximity to the urban glow from Myrtle Beach
are susceptible to deviations in orientation, extending to locations roughly 20 km from
the city. Researchers observed hatchling exiting the nest, using elevation cues to move
down the beach and light intensity cues to move at an angle towards the city before
entering the surf zone or traveling parallel down the beach. Since camera position only
allowed researchers to observed hatchlings to roughly the high tideline and since
emergences did not necessarily occur during high tide conditions, hatchlings could travel
out of the camera field of view and continue path or alter course. This limitation is not
unique to this study since beach arena studies also have a set distance they use to track
hatchlings (Salmon et al. 1995; Bourgeois et al. 2009; Kawamura et al. 2009), however, it
means under unimpeded conditions orientation diagrams may not capture full emergence
to the water. If hatchlings were not locating the ocean after a few hundred feet,
researchers relocated hatchlings to the surf zone, a practice in which 79% of relocated
hatchlings were moved under high artificial lighting conditions. In accordance with
previous studies, it seems as though shape cues of the land are not strong enough to
combat the high attraction towards artificial lights (Lutz & Musick 1997; Witherington &
Martin 2000; Bourgeois et al. 2009) once hatchlings moved onto the flatter sections of
the beach when elevation cues were not as strong and caused a degree of misorientation.
Total Radiance Tests. – Under emergence conditions with lunar illumination and
total radiance conditions measured, hatchlings orient in such a way that mirrors optimal
orientation observed under moderate levels of artificial light. Average hatchling speeds
61
are about two times faster than conditions observed under high artificial radiance
conditions with hatchlings pausing less frequently to reorient on path to the ocean. In
addition, lateral range of hatchling movement is slightly smaller with a mean deviation
away from seaward direction of 10.1° (Fig. 7C). Hatchlings are moving in the proper
direction quickly, reducing time on the beach. In addition hatchlings emerging under very
high total radiance conditions when lunar illumination is considered, have a significantly
lower deviation from the brightest light source. Even though the position of the moon in
reference to the nest may be perceived as the brightest source of light, hatchlings do not
necessarily move directly towards the moon. Since the moon scatters light throughout the
atmosphere, light is reflected off the water and casts shadows on the dunes ((Lutz &
Musick 1997; Salmon 2003), prompting proper seaward orientation which is often at a
smaller deviation from the brightest light source direction.
Lunar illumination present during emergence also creates background
illumination which can counter some of the effects associated with light trapping
(Verheijen 1958; Witherington 1992; Salmon & Witherington 1995). In this study, proper
seaward orientation was present at all nests that emerged during 30% or higher lunar
illumination, even in areas that would have been considered high artificial light had the
nest emerged under new moon conditions. In accordance with the cue competition
hypothesis, it seems that uniform background illumination by the moon in these areas
reduced the directivity of artificial light and prompted proper seaward orientation since
hatchlings were able to use all cues of orientation, leading to minimal or nonexistent
levels of disorientation (Witherington & Martin 2000; Tuxbury & Salmon 2005).
Previous studies have looked at this in extreme circumstances, conducting experiments at
62
dusk to observe the influence background light can have on light trapping. In these
studies hatchlings oriented properly towards the ocean, even when the brightest light
source of the moon or sun were not in view (Witherington 1992; Salmon & Witherington
1995). Another possible factor influencing orientation comes from hatchling’s perception
of light. Since hatchlings are capable of seeing past conventional limits of human sight,
there may be other forms of intensity cues at place that we cannot detect as the
researcher. As light is scattered through the atmosphere, the land absorbs most
wavelengths while the ocean absorbs longer wavelengths and scatters shorter
wavelengths. Since hatchlings are attracted to shorter wavelengths such as blue and UV
light, reflected light off the water could help prompt proper seaward orientation as the
brightest source of light intensity within their field of view (Kawamura et al. 2009).
Despite the level of artificial or total radiance levels observed at the time of
emergence, each nest displayed a non-uniform distribution of hatchlings that were
significantly oriented for each of the twenty-one major emergence events. In addition exit
angles of individual hatchlings from a given nest were highly correlated with one another.
This means that despite the mean angle of orientation away from seaward direction, the
majority of hatchlings from a nest exposed to the same environmental conditions moved
in the same direction overall. Some nest interactions could guide hatchlings together,
however, in some circumstances the nest emerged not as a major boil, but rather
hatchlings trickled out over time. In order for hatchlings to move in this manner even
when they do not emerge together, cues or orientation are guiding them. These cues are
beneficial in areas of moderate artificial light or very high total light when then moon is
present and hatchlings move directly towards the ocean. However, if hatchlings emerge
63
from areas of high artificial light above a threshold of normal orientation, a large
deviation away from seaward direction for the entire nest can be devastating.
Environmental Tests. – Since this study occurred under natural environmental
conditions, several environmental factors vary from nest to nest besides total or artificial
radiance intensity. Each environmental condition present at time of emergence has the
capability to influence hatchling activity levels, although very few showed a strong
relationship with activity levels. Under artificial conditions, hatchling speed is influenced
by air temperature with significantly increased speeds present under higher temperatures.
This trend was also observed under total radiance conditions, however, significance level
was slightly higher than 0.05 level. Since turtles like other reptiles are ectotherms, they
rely on external temperatures to warm their tissues since they have low levels of
metabolic heat production on their own (Wyneken et al. 2013). This means that activity
levels such as speed of movement can be increased when tissues temperatures are
increased under slightly higher air temperatures, while hatchlings emerging under slightly
cooler temperatures cannot warm tissue temperatures as much and will move slower.
Under total radiance conditions deviation from the brightest light source increases with
an increase in cloud coverage. Cloud coverage amplifies the effects of light intensity both
artificial and natural, causing the perceived levels of light intensity to be higher in areas
extending from the brightest light source (Kyba et al. 2011). With amplified lighting
conditions, the brightest light source is harder to distinguish and many hatchlings move
away from the source trying to locate proper orientation.
Management Implications. – Efficient management practices suggest a
combination of light management techniques as well as promotion of elevation cues in
64
order to enhance natural orientation of hatchlings (Holker et al. 2000; Witherington &
Martin 2000; Tuxbury & Salmon 2005). Since female turtles come to the beach
throughout the night to nest, but hatchlings often emerge from dusk to midnight (Salmon
et al. 1995), lighting conditions the female is exposed to may not be the same conditions
hatchings face upon emergence. For this reason, lights that may not hinder female nest
selection can have devastating impacts on hatchling survival. Given increased public
awareness and education on lighting effects on hatchling orientation, in most
circumstances observed within this study it is not a few bright lights along the horizon
leading to decreased orientation, but rather the urban glow associated with larger cities in
close proximity to nesting locations. Many of these issues are from inland sources that
are not adjacent to the beach but are contributing to increased urban glow.
Moving forward, simple light intensity management techniques can be
implemented to decrease this glow from inland sources as well as save homeowners and
business billions of dollars on wasted electricity. In the United States each year 30% of
outdoor lighting is wasted because lights shine in all directions, illuminating the
atmosphere in addition to the ground (Witherington & Martin 2000; Salmon 2003;
Gassaway et al. 2010). These lights increase levels of urban glow and add up to $1.5
billion wasted each year that could be saved by redirecting light focus and adding shield
features to lighting fixtures (Salmon 2003). In addition, turning off lights not in use,
reducing wattage output of lighting fixtures, and implementing new management
techniques into new construction can reduce lights in areas surrounding nesting habitat
(Holker et al. 2000; Witherington & Martin 2000; Salmon 2003). Natural light barriers in
the form of dune restoration could also be constructed on the beaches particularly close to
65
the city to reduce lights visible on the horizon and promote elevation cues (Salmon et al.
1995; Witherington & Martin 2000; Tuxbury & Salmon 2005).
In order to support proper management practices for this area, further studies
should build on the framework set by this study to survey areas of relatively lower light
intensity when a decrease in orientation is first observed. These studies could examine
parameters associated with orientation discussed in this study as well as additional
parameters such as sinuosity. In addition, modifications or implementation of additional
components to the tracking algorithm could be extremely beneficial at refining the
tracking process in order to support proper management practices.
ACKNOWLEDGMENTS
Funding for this study was provided by: SC Space Grant and SC Sea Grant
Kathryn Sullivan Earth and Marine Science Fellowship, Savannah Presbytery M.K.
Pentecost Ecology Fund, and Coastal Carolina University. Data collection made possible
by: International Animal Care and Use Committee (permit 2015.04), South Carolina
Department of Natural Resources (permit MTP-2016-011), South Carolina State Park
Service (permit N-7-16), local sea turtle nesting permit holders, undergraduate interns
and student/community volunteers.
LITERATURE CITED
Berens, P. (2009). CircStat: A Matlab Toolbox for Circular Statistics. Journal of
Statistical Software, 31, 1-21.
66
Bourgeois, S., Gilot-Fromont, E., Viallefont, A., Boussamba, F., Deem, S.L. (2009).
Influence of artificial lights, logs and erosion on leatherback sea turtle hatchling
orientation at Pongara National Park, Gabon. Biological Conservation, 142, 85-
93.
Cinzano, P. (2002). Light Pollution: a Global View (Volume 284). The growth of the
artificial night sky brightness in North America in the period 1947-2000: a
preliminary picture. Schwarz, H.E. (Ed.). Boston, MA: Kluwer Academic
Publishers, 39-48.
Fritsches, K.A. (2012). Australian loggerhead sea turtle hatchlings do not avoid yellow.
Marine and Freshwater Behaviour and Physiology, 45, 79-89.
Holker, F., Moss, T., Griefahn, B., Kloas, W., Voigt, C.C., Henckel, D., Hanel, A.,
Kappeler, P.M., Volker, S., Schwope, A., Franke, S., Uhrlandt, D., Fischer, J.,
Klenke, R., Wolter, C., Tockner, K. (2010). The dark side of light: a
transdisciplinary research agenda for light pollution policy. Ecology and Society,
15, 1-11.
Kawamura, G., Naohara, T., Tanaka, Y., Nishi, T., Anraku, K. (2009). Near-ultraviolet
radiation guides the emerged hatchlings of loggerhead turtles Caretta caretta
(Linnaeus) from a nesting beach to the sea at night. Marine and Freshwater
Behaviour and Physiology, 42, 19-30.
Kyba, C.C.M., Ruhtz, T., Fischer, J., Holker, F. (2011). Cloud coverage acts as an
amplifier for ecological light pollution in urban ecosystems. PLoS one, 6, 1-10.
Lohmann, K.J., Lohmann, C.M.F. (1996). Orientation and open-sea navigation in sea
turtles. Journal of Experimental Biology, 199, 73-81.
Longcore, T., Rich, C. (2004). Ecological light pollution. Frontiers in Ecology and the
Environment, 2, 191-198.
Lutz, P.L., Musick, J.A. (1997). The Biology of Sea Turtles (Volume I). Boca Raton, FL:
CRC Press.
Lutz, P.L., Musick, J.A., Wyneken, J. (2003). The Biology of Sea Turtles (Volume II).
Boca Raton, FL: CRC Press.
McFarlane, R.W. (1963). Disorientation of loggerhead hatchlings by artificial road
lighting. Copeia, 1963, 153.
Moore, M.V., Pierce, S.M., Walsh, H.M., Kvalvik, S.K., Lim, J.D. (2000). Urban light
pollution alters diel vertical migration of Daphnia. Biology of freshwater
Crustacea, 27, 1-4.
Mortimer, J.A. (1979). Ascension Island: British jeopardize 45 years of conservation.
Marine Turtle Newsletter, 10, 7-8.
Nehemiah, A. (2014). Computer vision made easy. Computer Vision with MATLAB,
Retrieved 2016.
67
Nussbaum-Krammer, C.I., Neto, M F., Brielmann, R.M., Pedersen, J.S., Morimoto, R.I.
(2015). Investigating the Spreading and Toxicity of Prion-like Proteins Using the
Metazoan Model Organism C. elegans. Journal of Visualized Experiments (95),
e52321, doi:10.3791/52321.
Peters, A., Verhoeven, K.J.F. (1994). Impact of artificial lighting on the seaward
orientation of hatchling loggerhead turtles. Journal of Herpetology, 28, 112-114.
Salmon, M. (2003). Artificial night lighting and sea turtles. Biologist, 50, 163-168.
Salmon, M., Witherington, B.E. (1995). Artificial lighting and seafinding by loggerhead
hatchlings: evidence for lunar modulation. Copeia, 4, 931-938.
Salmon, M., Tolbert, M.G., Painter, D.P., Goff, M., Reiners, R. (1995). Behavior of
loggerhead sea turtles on an urban beach hatchling orientation. Journal of
Herpetology, 29, 568-576.
Spotila, J.R. (2004). Sea Turtles a complete guide to their biology, behavior, and
conservation. Baltimore, MD: The Johns Hopkins University Press.
Tuxbury, S.M., Salmon, M. (2005). Competitive interactions between artificial lighting
and natural cues during seafinding by hatchling marine turtles. Biological
Conservation, 121, 311-316.
Tyler, J.E., Smith, R.C. (1970). Measurements of Spectral Irradiance Underwater. New
York, NY: Gordon and Breach Science Publishers.
Verheijen, F.J. (1958). The mechanisms of the trapping effect of artificial light sources
upon animals. Archives Néerlandaises de Zoologie, 13, 1-107.
Witherington, B.E. (1992). Sea-finding behavior and the use of photic orientation cues by
hatchling sea turtles. Ph.D. dissertation, University of Florida, Gainesville, FL.
Witherington, B.E. (1997). The problem of photopollution for sea turtles and other
nocturnal animals. Behavioral approaches to conservation in the wild.
Cambridge, UK: Cambridge University Press, 303-328.
Witherington, B.E., Martin, R.E. (2000). Understanding, assessing, and resolving light-
pollution problems on sea turtle nesting beaches. Florida Marine Research
Institute Technical Report TR-2, 1-73.
Witherington, B.E., & Witherington, D. (2015). Our Sea Turtles. Sarasota, FL: Pineapple
Press, Inc.
Wyneken, J., Lohmann, K.J., Musick J.A. (2013). The Biology of Sea Turtles (Volume
III). Boca Raton, FL: CRC Press.
Zar, J.H. (1984). Biostatistical analysis. Englewood Cliffs, NJ: Prentice-Hall, Inc.
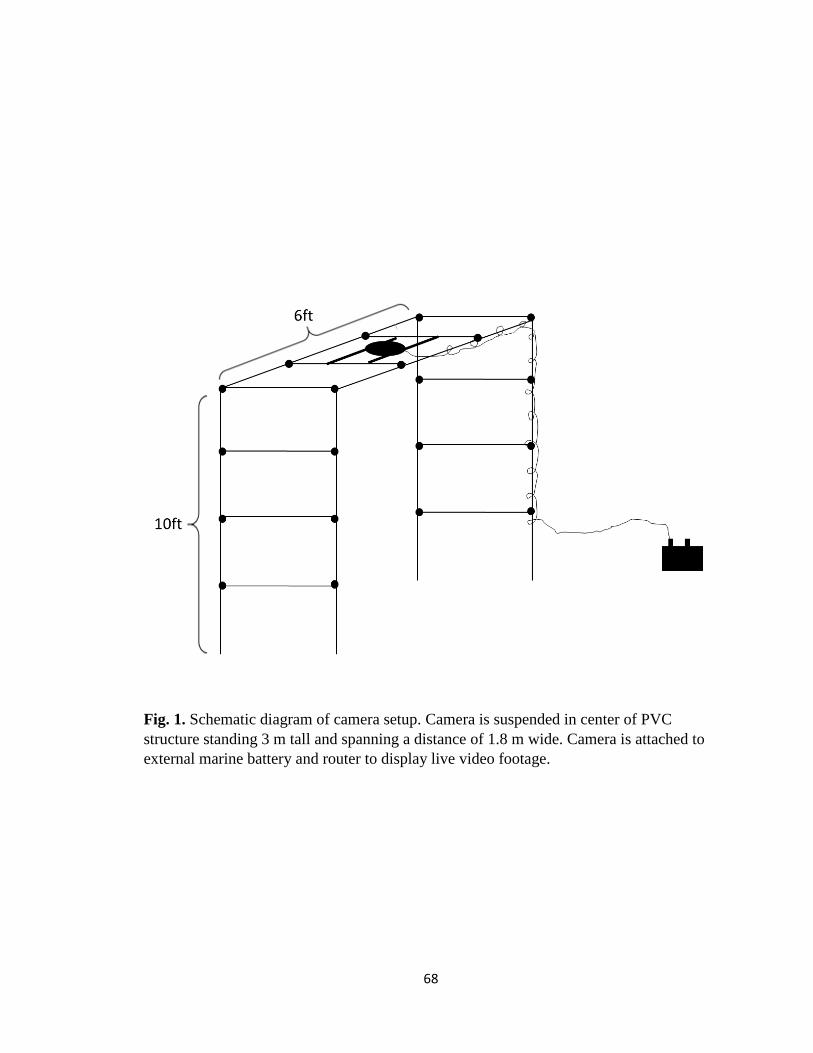
68
Fig. 1. Schematic diagram of camera setup. Camera is suspended in center of PVC
structure standing 3 m tall and spanning a distance of 1.8 m wide. Camera is attached to
external marine battery and router to display live video footage.
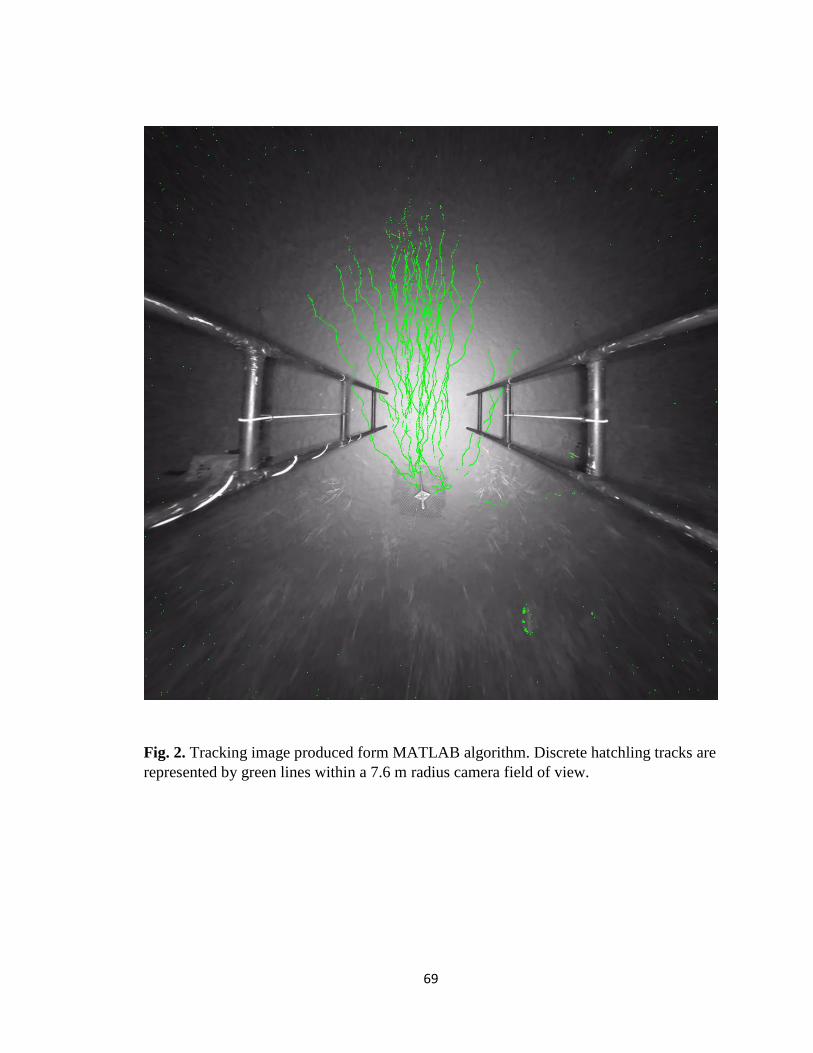
69
Fig. 2. Tracking image produced form MATLAB algorithm. Discrete hatchling tracks are
represented by green lines within a 7.6 m radius camera field of view.
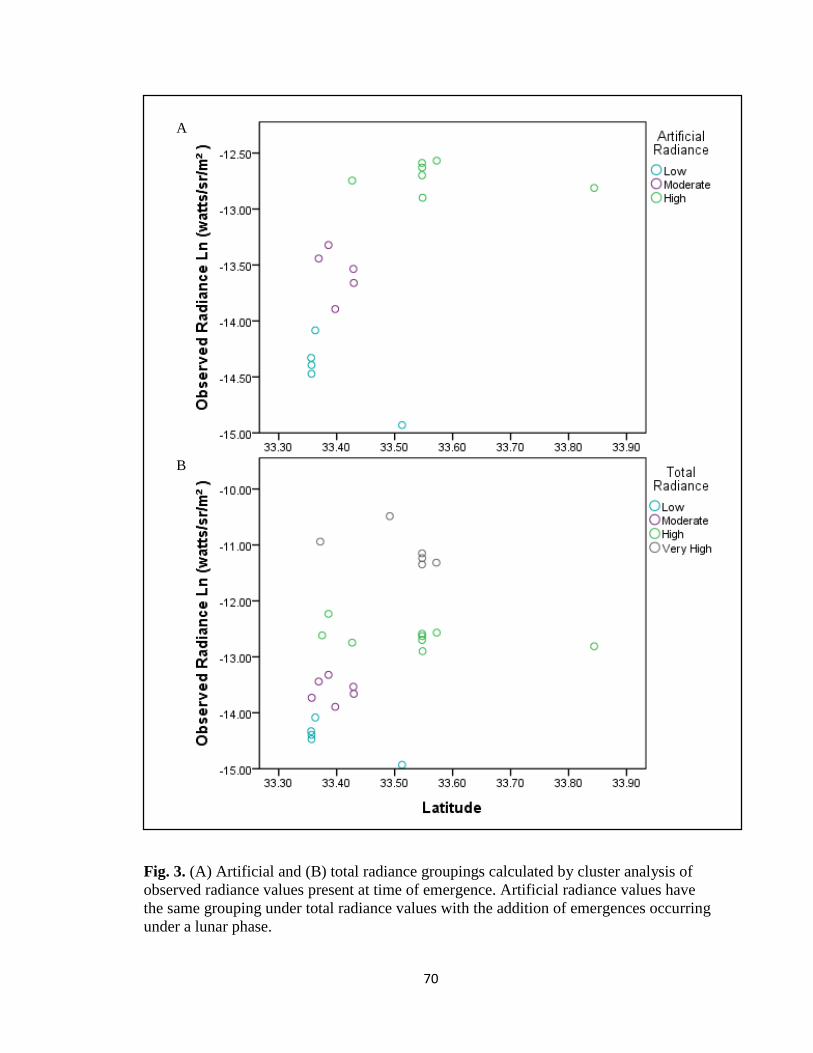
70
Fig. 3. (A) Artificial and (B) total radiance groupings calculated by cluster analysis of
observed radiance values present at time of emergence. Artificial radiance values have
the same grouping under total radiance values with the addition of emergences occurring
under a lunar phase.
A
B
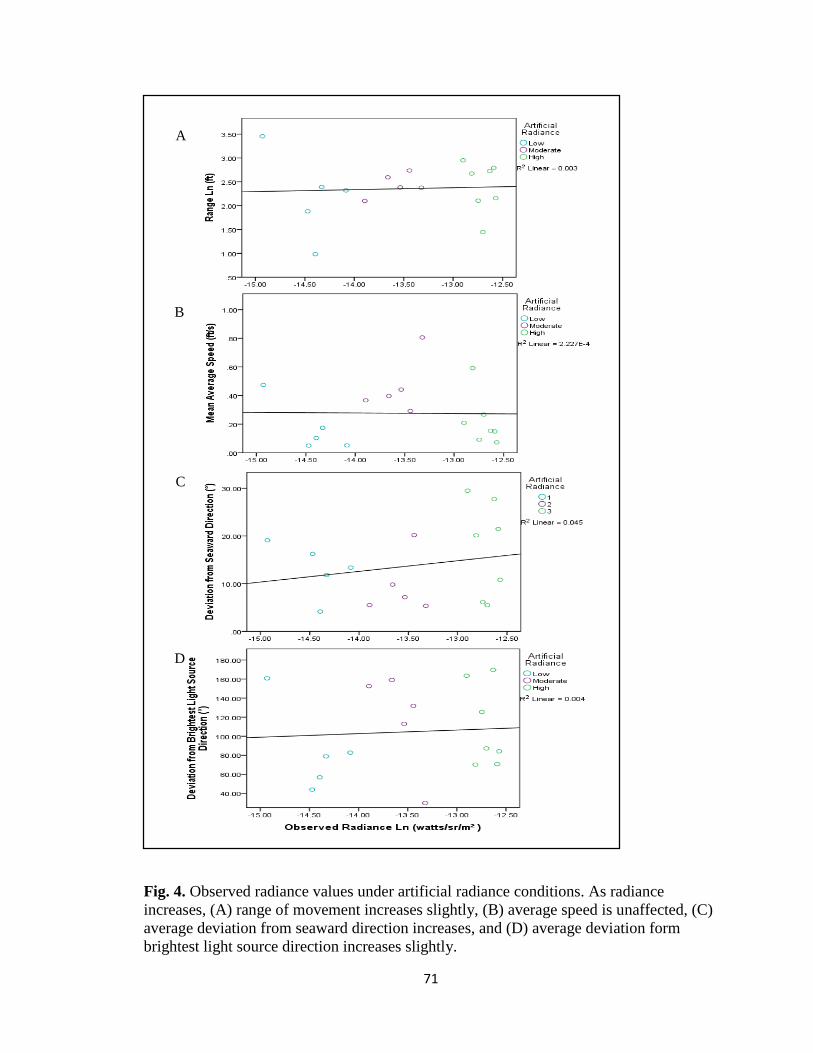
71
Fig. 4. Observed radiance values under artificial radiance conditions. As radiance
increases, (A) range of movement increases slightly, (B) average speed is unaffected, (C)
average deviation from seaward direction increases, and (D) average deviation form
brightest light source direction increases slightly.
B
C
D
A
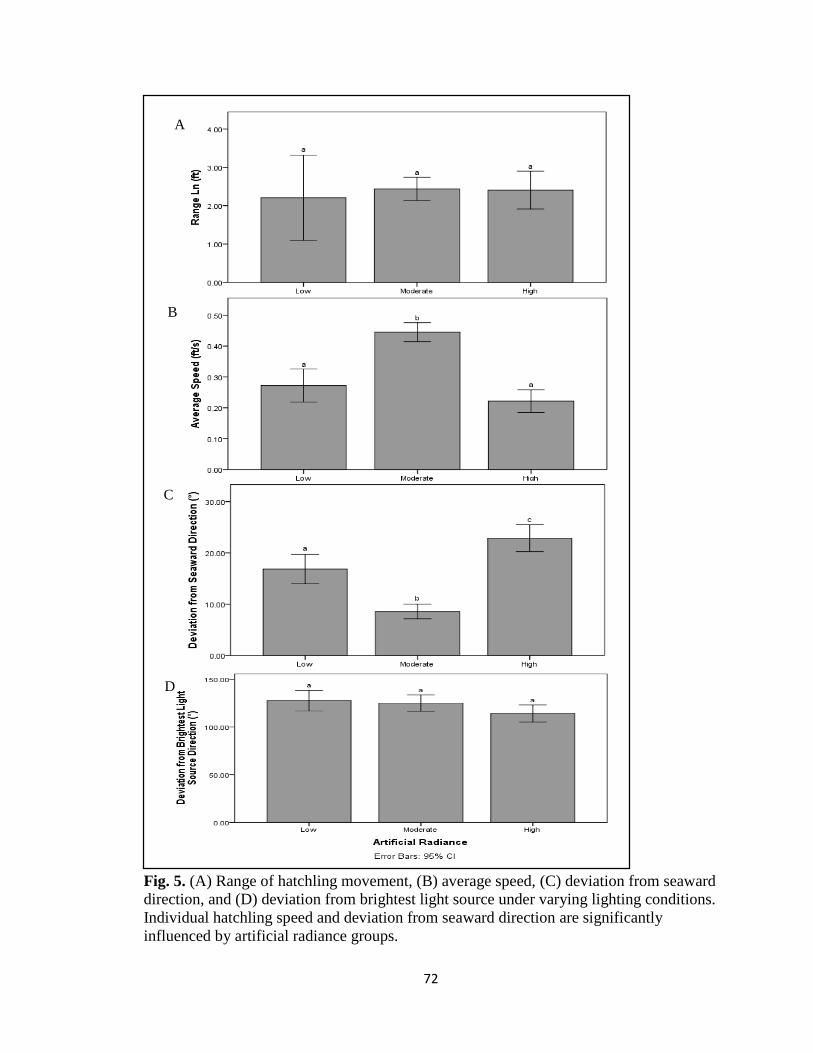
72
Fig. 5. (A) Range of hatchling movement, (B) average speed, (C) deviation from seaward
direction, and (D) deviation from brightest light source under varying lighting conditions.
Individual hatchling speed and deviation from seaward direction are significantly
influenced by artificial radiance groups.
A
B
C
D
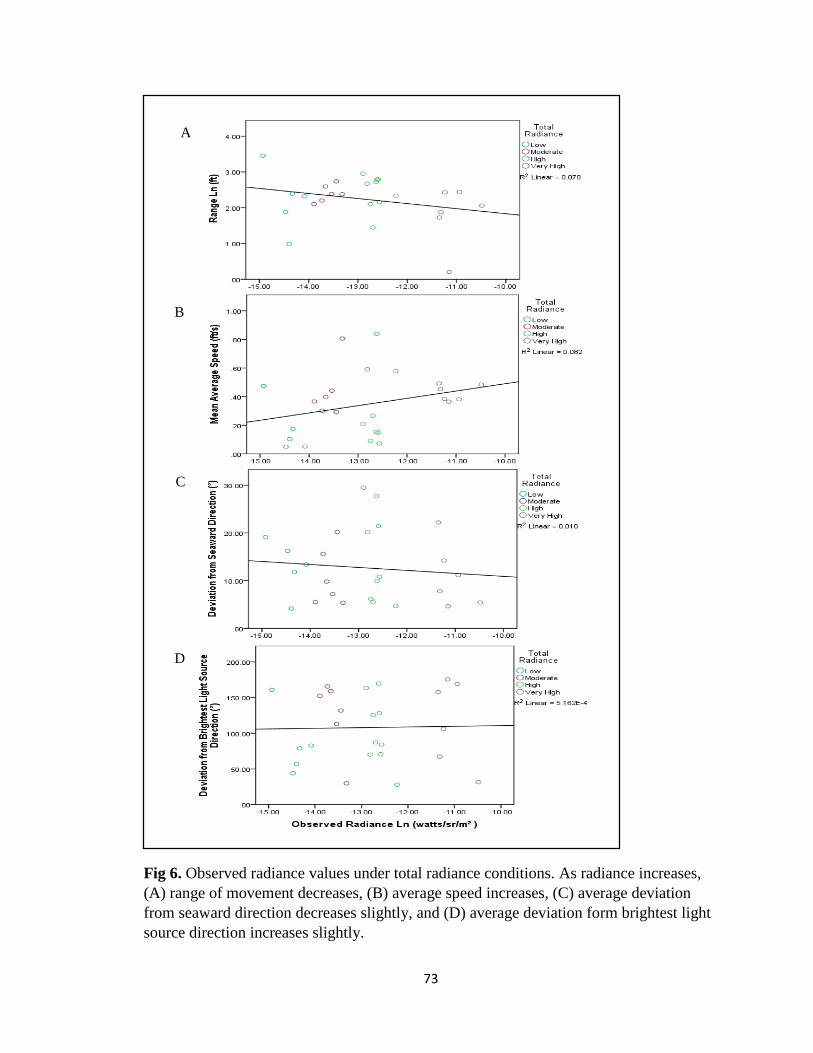
73
Fig 6. Observed radiance values under total radiance conditions. As radiance increases,
(A) range of movement decreases, (B) average speed increases, (C) average deviation
from seaward direction decreases slightly, and (D) average deviation form brightest light
source direction increases slightly.
A
B
C
D
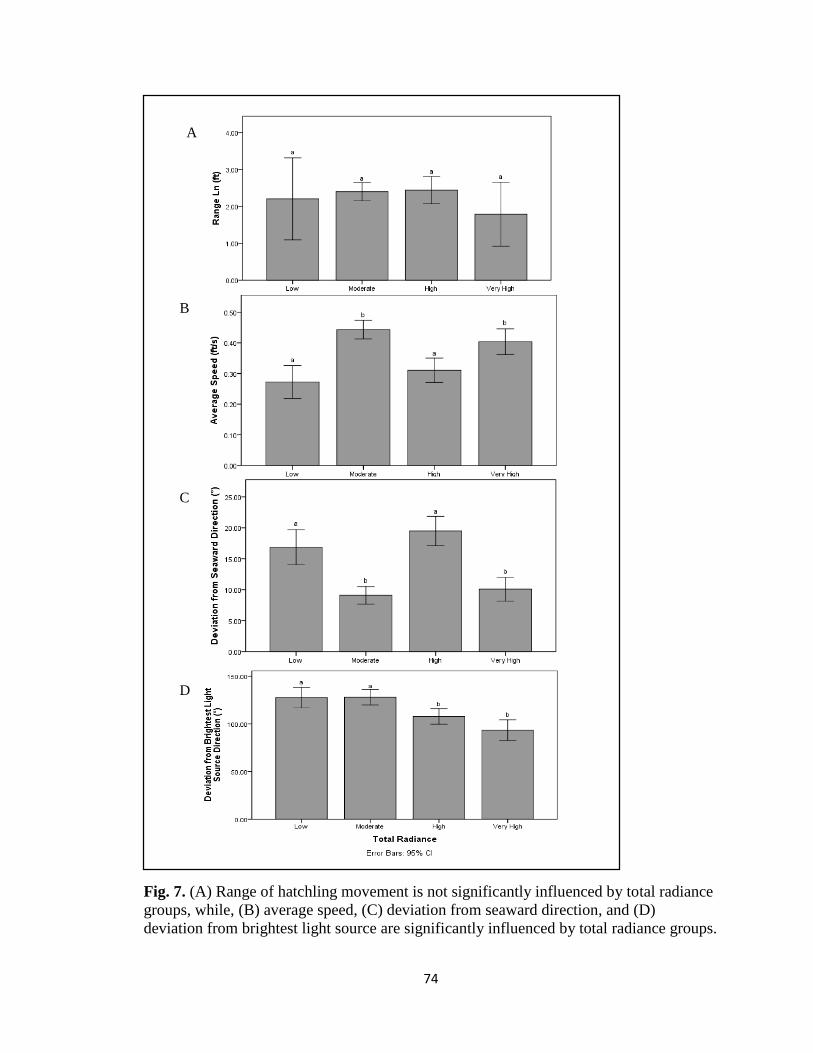
74
Fig. 7. (A) Range of hatchling movement is not significantly influenced by total radiance
groups, while, (B) average speed, (C) deviation from seaward direction, and (D)
deviation from brightest light source are significantly influenced by total radiance groups.
A
B
C
D
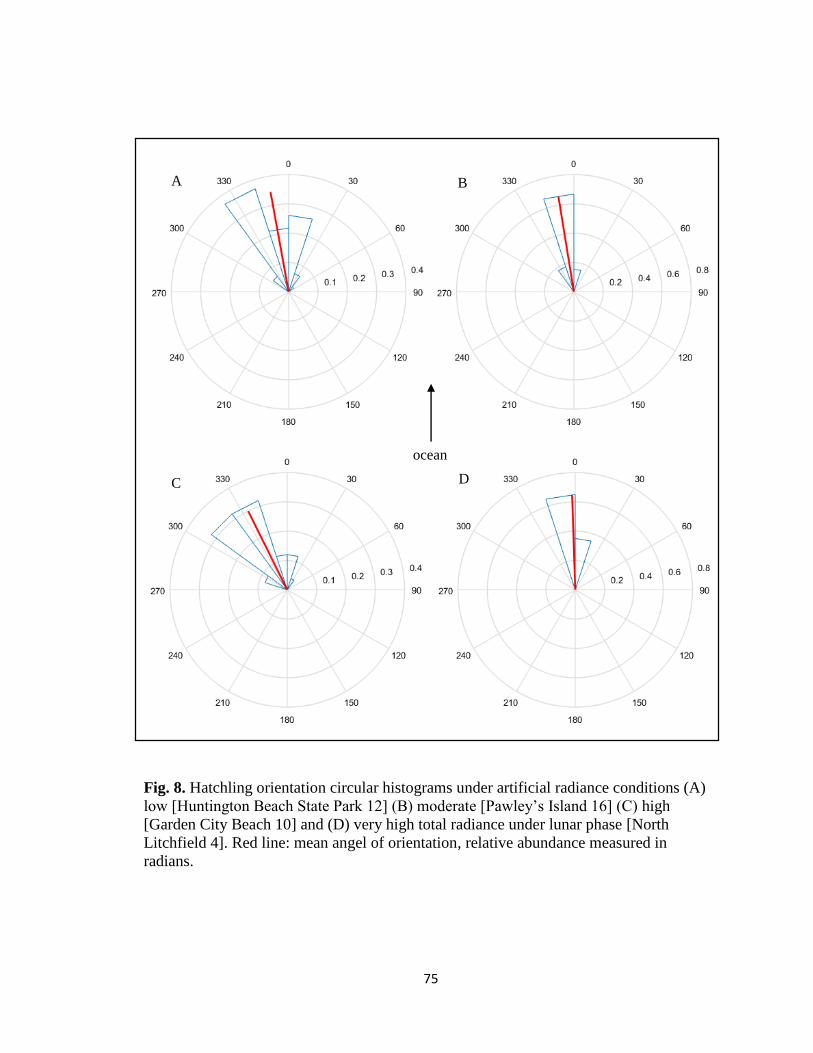
75
Fig. 8. Hatchling orientation circular histograms under artificial radiance conditions (A)
low [Huntington Beach State Park 12] (B) moderate [Pawley’s Island 16] (C) high
[Garden City Beach 10] and (D) very high total radiance under lunar phase [North
Litchfield 4]. Red line: mean angel of orientation, relative abundance measured in
radians.
ocean
A B
C D
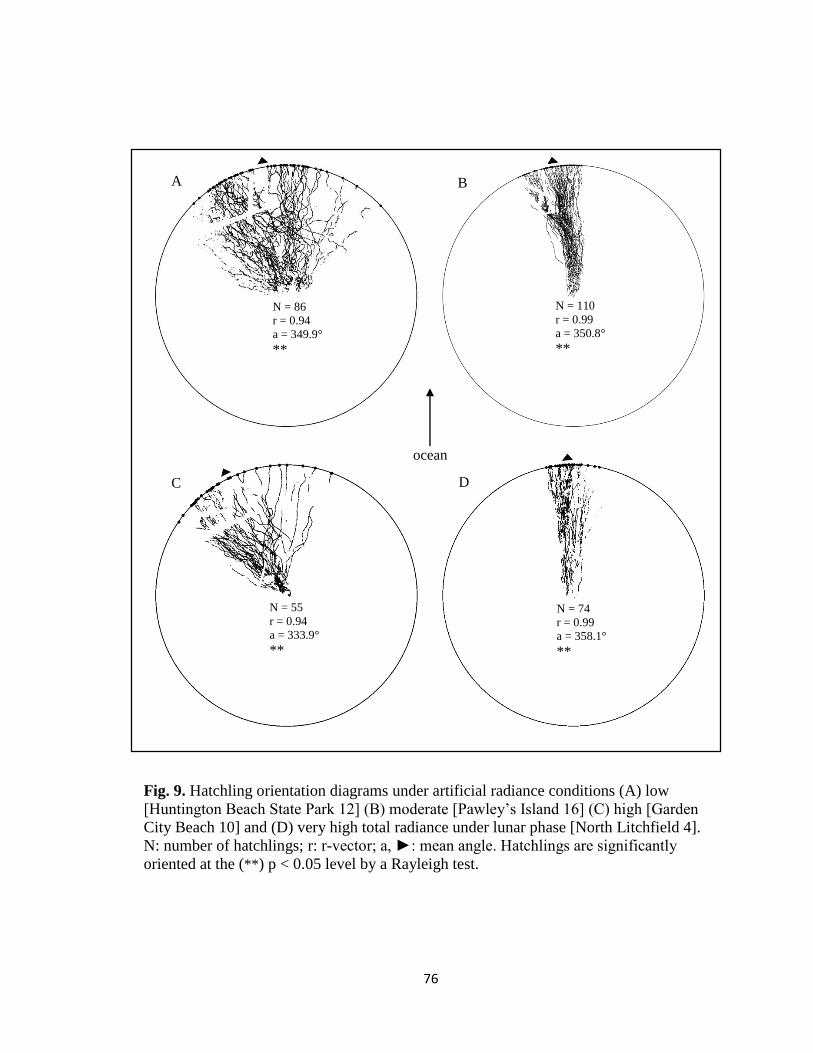
76
Fig. 9. Hatchling orientation diagrams under artificial radiance conditions (A) low
[Huntington Beach State Park 12] (B) moderate [Pawley’s Island 16] (C) high [Garden
City Beach 10] and (D) very high total radiance under lunar phase [North Litchfield 4].
N: number of hatchlings; r: r-vector; a, ►: mean angle. Hatchlings are significantly
oriented at the (**) p < 0.05 level by a Rayleigh test.
N = 86
r = 0.94
a = 349.9°
**
N = 55
r = 0.94
a = 333.9°
**
N = 74
r = 0.99
a = 358.1°
**
N = 110
r = 0.99
a = 350.8°
**
ocean
A B
C D
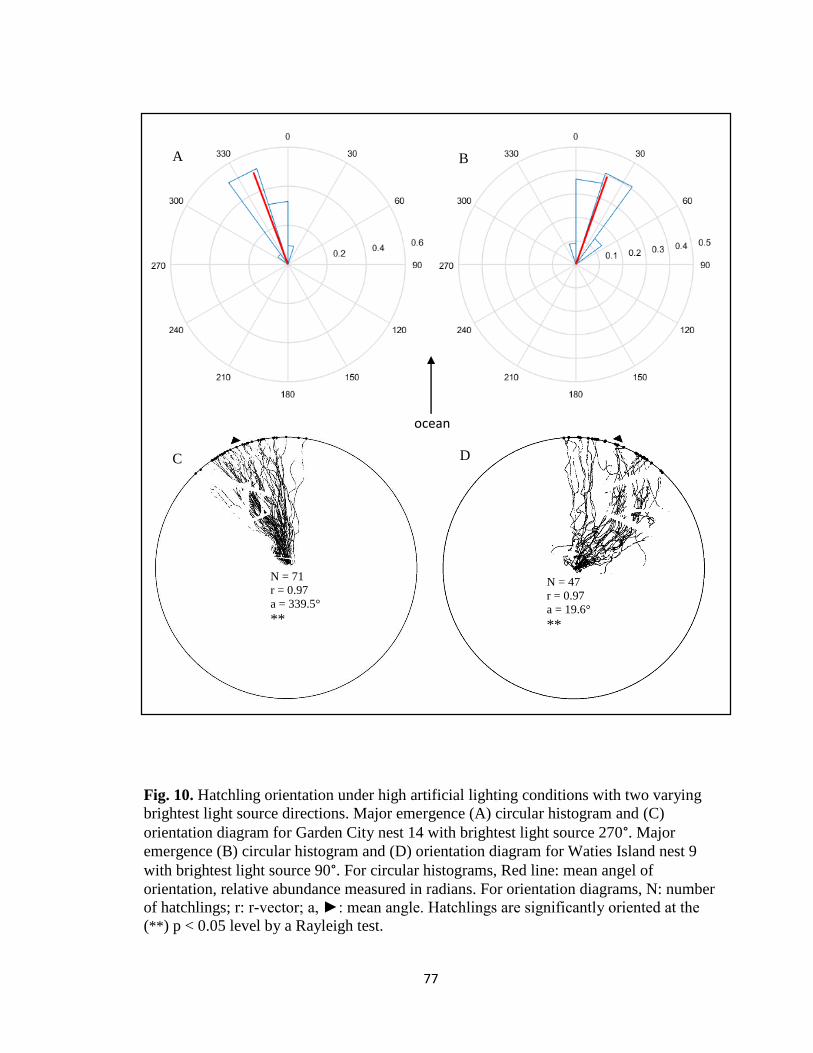
77
Fig. 10. Hatchling orientation under high artificial lighting conditions with two varying
brightest light source directions. Major emergence (A) circular histogram and (C)
orientation diagram for Garden City nest 14 with brightest light source 270°. Major
emergence (B) circular histogram and (D) orientation diagram for Waties Island nest 9
with brightest light source 90°. For circular histograms, Red line: mean angel of
orientation, relative abundance measured in radians. For orientation diagrams, N: number
of hatchlings; r: r-vector; a, ►: mean angle. Hatchlings are significantly oriented at the
(**) p < 0.05 level by a Rayleigh test.
N = 71
r = 0.97
a = 339.5°
**
N = 47
r = 0.97
a = 19.6°
**
ocean
A B
C D
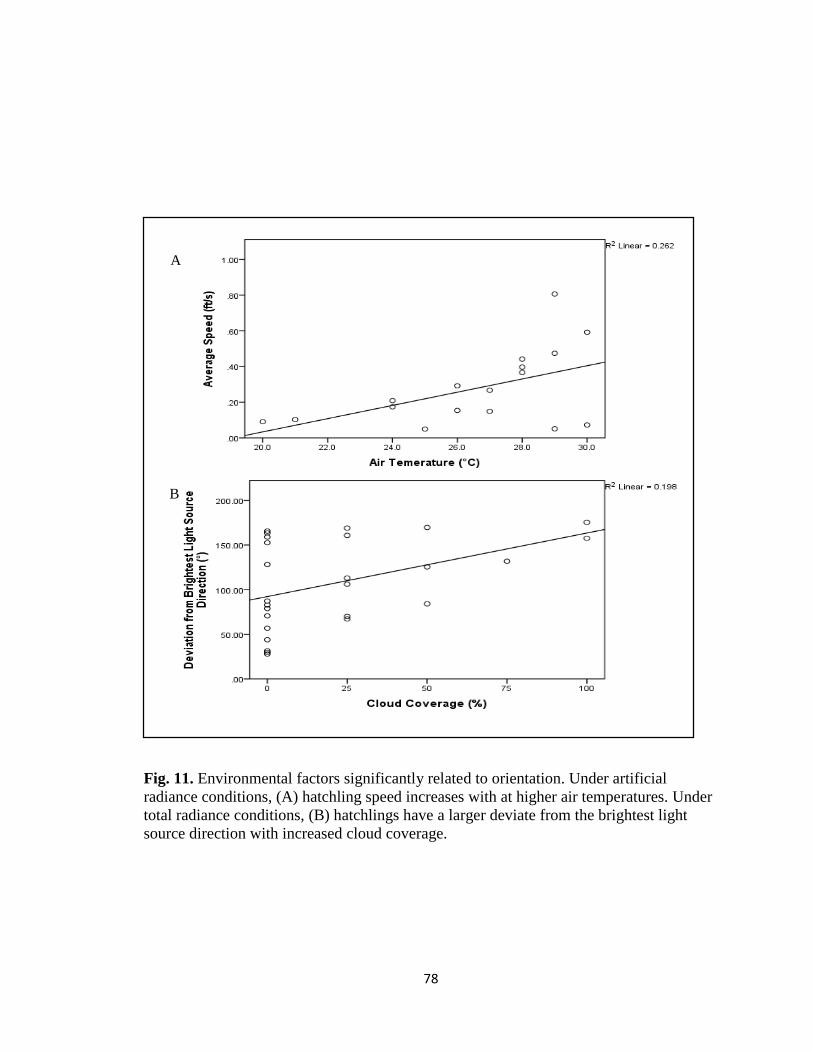
78
Fig. 11. Environmental factors significantly related to orientation. Under artificial
radiance conditions, (A) hatchling speed increases with at higher air temperatures. Under
total radiance conditions, (B) hatchlings have a larger deviate from the brightest light
source direction with increased cloud coverage.
A
B
79
CHAPTER 4: General Conclusions
Summary. – The aim of this study was (1) to use a noninvasive means to track
discrete hatchling movements from emergence of the nest under present environmental
lighting conditions by means of a non-illuminating infrared camera and algorithms
constructed in MATLAB and ImageJ. (2) Determine parameters associated with
individual hatchling orientation a) speed b) orientation deviation and c) range of
movement (3) to determine if there is a threshold of light permissible before orientation
of hatchlings is negatively affected.
(1) Primary TurtleTrack algorithm was constructed in MATLAB based off
counting cars script (Nehemiah 2014) to track hatchlings at time of emergence
with additional parameters calculated in ImageJ from wrMTrck plugin
(Nussbaum-Krammer et al. 2015). These algorithms were effective for larger
orientation study at tracking hatchling movement under natural conditions
without human influence, a new method of tracking that could be extremely
beneficial for future studies in this field and others.
(2) Orientation is optimal under moderate levels of artificial light when average
speeds are highest and deviation away from seaward direction is lowest. When
artificial light is increased to relatively high levels, deviation is greatest from
seaward direction with a smaller deviation from the brightest light source.
When emergences occur under partial or full moon conditions, proper seaward
orientation is restored even in areas of high artificial light by a smaller
deviation away from seaward and higher average speeds. Range of
80
movements is fairly consistent between groups although lowest values are
observed under conditions with lunar illumination.
(3) Under high artificial lighting conditions the angle of deviation away from
seaward direction was larger than 20 degrees, the acceptable standards for
proper orientation. It would seem that there is a threshold located between the
moderate and high artificial lighting conditions since decreased orientation is
first observed at this level while orientation is considered normal below this
level. Further testing of artificial light intensities above this observed
threshold would confirm or deny this trend.
Future Research. – Since this study was some of the first research of its kind in
this study site, continued research should be implemented increasing sample size and
increasing the number of recorded nest emergences from each beach. Increased data
would provide a more comprehensive profile from the area so the characteristics
observed at one nest do not carry so much weight within a lighting group. In addition, an
increased sample size would allow trends to emerge between already sampled parameters
such as range of movement, or for new trends to emerge between additional parameters
of orientation that have not yet been measured.
One parameter in particular that would be extremely beneficial to overall
indication of orientation would be to calculate sinuosity of individual hatchling tracks.
Sinuosity is measured by the distance of the curved path a hatchling takes divided by the
distance of a straight line intersecting the start and endpoint of that path. Sinuosity is a
good indicator of disorientation because hatchlings that take longer paths to get to the
81
ocean or hatchlings that travel around in circles can be identified by this parameter.
Orientation deviation is a good indicator of misorientation because it measures the
direction of hatchling movement either towards or away from seaward direction
(Witherington & Martin 2000; Salmon 2003; Tuxbury & Salmon 2005); however, it does
not take into account the path taken to get to that location. In contrast, lateral range of
movement and speed take into account some activities associated with both
misorientation and disorientation; however, neither take into account the shape of
individual hatchling tracks. Hatchlings that are misoriented have faster average speeds
and a smaller lateral range of movement (similar to that of proper orientation) since they
are moving towards the brightest light source, unaware that it’s not the ocean. Hatchlings
that wander in circles (Witherington & Martin 2000; Salmon 2003; Tuxbury & Salmon
2005) and are not oriented in a particular path will exhibit signs of disorientation,
characterized by a larger lateral range of movement as they spread out and decreased
average speeds as they pause to try and reorient themselves in the proper direction.
Sinuosity could be measured through a number of different methods.
Measurements of a curved path and measurements of the corresponding straight line can
be measured from final images of each 20 second clip of an emergence in the ImageJ
platform. The fewer number of tracks on an individual image increases accuracy of
measurements since there are fewer tracks overlapping one another. However, even on
images of 20 second clips, when fifty or more hatchlings emerge at one time it can be
very difficult to visually distinguish one track from another. Modifications or
implementation of additional components to the tracking algorithm could help improve
the ability to measure sinuosity. If individual tracks from a single turtle could be
82
distinguished from tracks of another turtle on the TurtleTrack algorithm in MATLAB,
sinuosity measurements may be able to be calculated directly from this information, just
as circular statistics algorithms have been written to measure parameters such as mean
angle of orientation and r-vector (Zar 1984; Berens 2009). If sinuosity is not easily
measured at this level, individual connected tracks could be distinguished by color in the
MATLAB platform, making it easier to identify one track from another in a large group
when examined in ImageJ. Track characteristics could also be grouped similar to
grouping of some environmental parameters rather than numerically measuring
individual tracks. For example tracks that turn less than 10 degrees could be considered
low sinuosity, tracks turning between 10 and 90 degrees moderate sinuosity, tracks
turning between 90 and 180 degrees high sinuosity and 180 to 360 degrees extreme
sinuosity. This measure is slightly subjective since individual tracks may fall into each of
these categories, however, if a rule is implemented such as the highest degree of sinuosity
present on an individual track will be considered its sinuosity, subjectivity decreases.
Another parameter that might be interesting to examine in regards to orientation
would be how maximum speed is influenced by observed total radiance conditions. This
parameter was calculated in conjunction with average speed on the wrMTrck plugin in
ImageJ, however, results were not sufficient at this time. Under both total and artificial
radiance conditions maximum speed was significantly related to lighting groups with the
slowest maximum speed observed under low artificial lighting conditions. However,
based on the wrMTrck plugin in ImageJ, the location at which maximum speed occurred
was not specified which prevented interpretation of the data. Maximum speed could have
occurred as hatchlings exited the nest and slope of the beach is often the highest, when
83
hatchlings were closer to the water line, or somewhere in between. Unfortunately under
these parameters there is no way to know. If location of maximum speed could be
identified then this component would be beneficial to understand speed parameters under
different lighting conditions.
Continued advances in technology means this form of tracking can increase in
effectiveness over time. Better models of non-illuminating infrared cameras can be
developed that could be supported in a manner that does not block any portion of
hatchling tracks in the camera field of view. In addition, advances and modifications to
current tracking algorithms with advances in technology would allow for the
identification of individual hatchlings on the TurtleTrack algorithm in MATLAB,
increasing the amount of individual turtle parameters calculable and improving on overall
track appearance.
This form of tracking could also be applied to other forms of hatchling orientation
studies not associated with lighting conditions. Little has been studied in reference to the
effects of sound on various stages of sea turtle life history, although studies have shown
that sea turtles hear low frequency sounds within the range of 100 to 1000 Hz with
greater sensitivity observed between the low and mid values of this range (Southwood et
al. 2008). Future studies could examine how levels of sound could influence hatchling
orientation towards the ocean, even if it is not the primary sense utilized to navigate
across the beach. Nest proximity to the road where high levels of anthropogenic sound
are detected, or the distance to the ocean where low rumbles of the waves are detected,
could have some influence on hatchling orientation. A study in which sound
measurements were made based on nest location to a variety of different environmental
84
factors could benefit from technology used in this study since any movement around
hatchlings could influence vibration detections and possibly alter results.
This technology could even extend into measuring orientation in the water right
after hatchlings enter the surf zone and wave orientation is first utilized (Salmon &
Lohmann 1989; Lohmann & Lohmann 1996). The primary way in which orientation is
measured at this stage is through the use of a “Witherington float” (Witherington 1992).
This device consists of a lighted float attached to the hatchling’s carapace which is
suspended in the water column behind the hatchling to indicate position (Lorne &
Salmon 2007; Whelan & Wyneken 2007). A drone equipped with a proper camera
structure to record non-illuminating footage could hoover over the water, recording
hatchling movement in the waves. Under ideal circumstances hatchlings would not need
to be equipped with any marker, however, given capabilities of infrared camera to detect
hatchlings in water, a Witherington float may still be needed. Conjunction of these
methods would still improve tracking capabilities since hatchling position could be
detected at each point in the waves, rather than measuring position at set markers and
connecting points to reveal overall tracks as has been practice in previous orientation
studies (Lorne & Salmon 2007).
LITERATURE CITED
Lohmann, K.J., Lohmann, C.M.F. (1996). Orientation and open-sea navigation in sea
turtles. Journal of Experimental Biology, 199, 73-81.
Lorne, J.K., Salmon, M. (2007). Effects of exposure to artificial lighting on orientation of
hatchling sea turtles on the beach and in the ocean. Endangered Species Research,
3, 23-30.
85
Nehemiah, A. (2014). Computer vision made easy. Computer Vision with MATLAB,
Retrieved 2016.
Nussbaum-Krammer, C.I., Neto, M F., Brielmann, R.M., Pedersen, J.S., Morimoto, R.I.
(2015). Investigating the Spreading and Toxicity of Prion-like Proteins Using the
Metazoan Model Organism C. elegans. Journal of Visualized Experiments (95),
e52321, doi:10.3791/52321.
Salmon, M. (2003). Artificial night lighting and sea turtles. Biologist, 50, 163-168.
Salmon, M., Lohmann, K.J. (1989). Orientation cues used by hatchling loggerhead sea
turtles (Caretta caretta) during their offshore migration. Ethology, 83, 215-228.
Southwood, A., Fritsches, K., Brill, R., Swimmer, Y. (2008). Sound, chemical, and light
detection in sea turtles and pelagic fishes: sensory-based approaches to bycatch
reduction in longline fisheries. Endangered Species Research, 5, 225-238.
Tuxbury, S.M., Salmon, M. (2005). Competitive interactions between artificial lighting
and natural cues during seafinding by hatchling marine turtles. Biological
Conservation, 121, 311-316.
Whelan, C.L., Wyneken, J. (2007). Estimating predation levels and site-specific survival
of hatchling loggerhead seaturtles (Caretta caretta) from south Florida beaches.
Copeia, 3, 745-754.
Witherington, B.E., Salmon, M. (1992). Predation on loggerhead turtle hatchlings after
entering the sea. Journal of Herpetology, 26, 226-228.
Witherington, B.E., Martin, R.E. (2000). Understanding, assessing, and resolving light-
pollution problems on sea turtle nesting beaches. Florida Marine Research
Institute Technical Report TR-2, 1-73.
Zar, J.H. (1984). Biostatistical analysis. Englewood Cliffs, NJ: Prentice-Hall, Inc.

86
Appendix A: Abbreviations
ESA – Endangered Species Act
TSD – Temperature-Dependent Sex Determination
VIIRS – Visible Infrared Imaging Radiometer Suite
NASA – National Aeronautics and Space Administration
NOAA – National Oceanic and Atmospheric Administration
CLASS – Comprehensive Large Array-Data Stewardship System
ENVI – Environment for Visualizing Images
IR – Infrared
SCDNR – South Carolina Department of Natural Resources
fps – frames per second
RGB – Color image containing red, green and blue pigments
BW – Black white images
ROI – Region of Interest
ANOVA – Analysis of variance statistical test
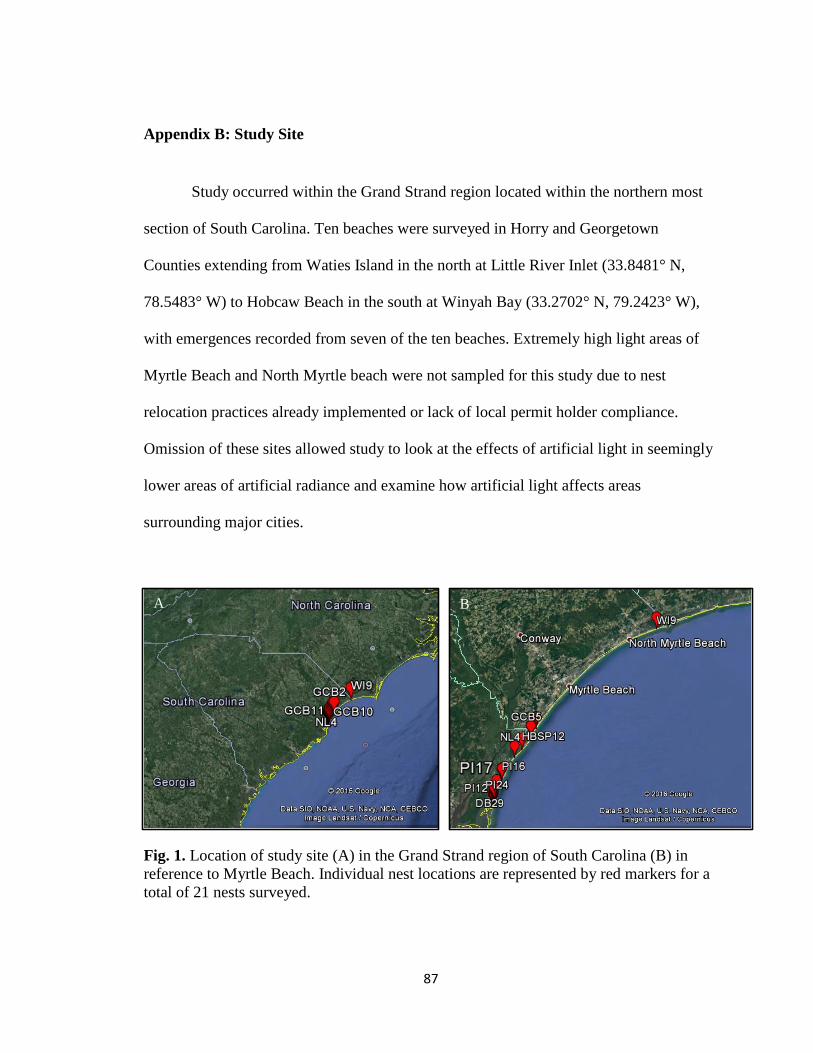
87
Appendix B: Study Site
Study occurred within the Grand Strand region located within the northern most
section of South Carolina. Ten beaches were surveyed in Horry and Georgetown
Counties extending from Waties Island in the north at Little River Inlet (33.8481° N,
78.5483° W) to Hobcaw Beach in the south at Winyah Bay (33.2702° N, 79.2423° W),
with emergences recorded from seven of the ten beaches. Extremely high light areas of
Myrtle Beach and North Myrtle beach were not sampled for this study due to nest
relocation practices already implemented or lack of local permit holder compliance.
Omission of these sites allowed study to look at the effects of artificial light in seemingly
lower areas of artificial radiance and examine how artificial light affects areas
surrounding major cities.
Fig. 1. Location of study site (A) in the Grand Strand region of South Carolina (B) in
reference to Myrtle Beach. Individual nest locations are represented by red markers for a
total of 21 nests surveyed.
A B
88
Appendix C: Satellite Data
Nighttime upwelling of visible light was measured by VIIRS sensor on board
NASA’s Suomi NPP satellite. Data was extracted from NOAA’s CLASS server for an
area extending from Little River Inlet in the north to Winyah Bay in the south. Only data
from May to October was extracted in order to represent conditions observed during the
nesting season. Lunar calendars and moon rise/set schedules were used to select dates
during new moon cycles. VIIRS images without clouds were selected for on ENVI
remote sensing software, while images with clouds were discarded. ROI files for the area
were downloaded, containing geographic information used to create subsets in which
light intensity measurements were extracted from. Transect were manually selected along
the coast using ENVI software to compile latitude and longitude coordinates along the
Grand Strand. Transect was down sampled to extract radiance values every 0.25km with
any duplicate data points extracted. A radiance profile was then extracted for each
0.25km section based on study ROI.
Satellite radiance values were plotted within study site from Hobcaw Beach in the
south with latitude values around 33.3 to Waties Island in the north with latitude values
around 33.9. Natural log of radiance values was used to divide lighting profiles into four
groups based on relatively equal levels of light intensity present within lighting profiles
of cooperating beaches. Artificial radiance groupings extracted from this information
provided a framework of artificial light present within the Grand Strand region of South
Carolina which was used to ensure equal sampling of nests with the study site over the
course of the 2016 field season.
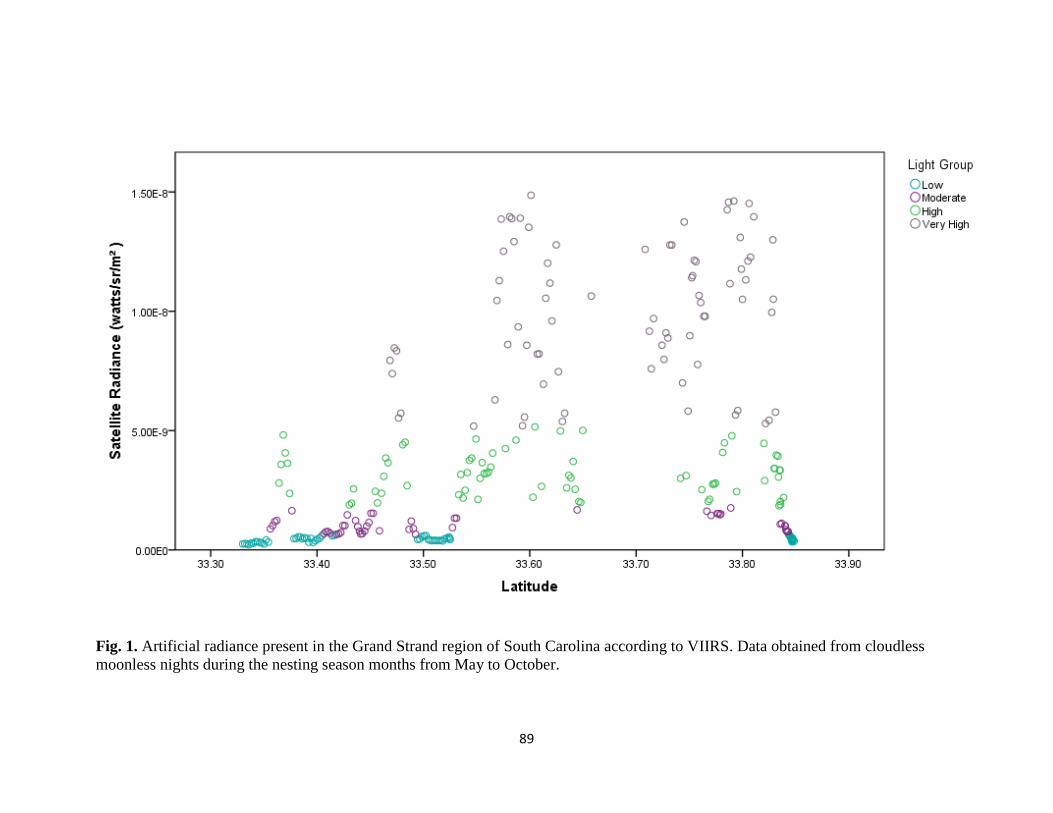
89
Fig. 1. Artificial radiance present in the Grand Strand region of South Carolina according to VIIRS. Data obtained from cloudless
moonless nights during the nesting season months from May to October.
90
Appendix D: Orientation Diagrams Produced in MATLAB Platform
Orientation diagrams produced for each of the twenty-six unique emergence
events from twenty-one major emergences. Hatchling tracks for each diagram originate
from the center of the circle which marks the origin of the nest. Track distances are
variable based on where the camera structure was set up in reference to nest position
based on unique characteristics of the beach at each location such as distance to the dunes
and slope of the beach, with maximum tracking distance is 15.2 m. The ocean is located
at the top of the circle for each diagram, in a vertical line from the nest origin along the 0°
line. Individual dots along the exterior of the circle represent individual hatchling exit
angles with the mean direction indicated by arrow outside of the nest.
In some orientation diagrams white blocked off sections are visible throughout
sections of the tracks. This obstruction is caused by the structure used to suspend the
camera over the nest. In order for a camera structure to not be visible, structure would
need to span a distance larger than 16 m (a very unstable structure) or be hoovering over
the nest with no structure at all (not feasible for this project however would be a great
improvement in the future). Since the position of the camera structure segments tracks,
tracks form an individual hatchling cannot be identified on both sides of the structure, a
limitation that would need to be adjusted to distinguish individuals in the future. In
addition, some tracks exit the nest origin and head parallel towards the dunes or even turn
back around and head into the dunes. Due to high dune vegetation, the camera cannot
identify the hatchling as far of a distance in the vegetation that it can on the beach. For
this reason these hatchling tracks do not reach the edge of circle and thus are not counted
as exit angles since researchers have no way of knowing exactly where the tracks will
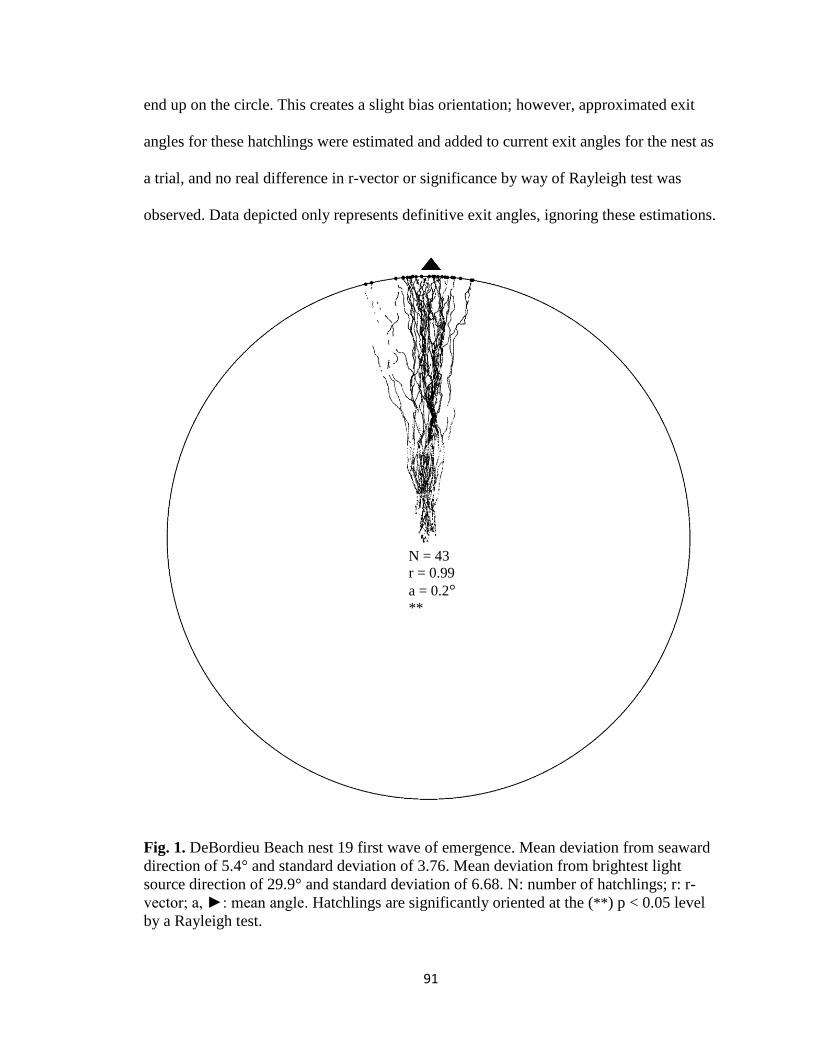
91
end up on the circle. This creates a slight bias orientation; however, approximated exit
angles for these hatchlings were estimated and added to current exit angles for the nest as
a trial, and no real difference in r-vector or significance by way of Rayleigh test was
observed. Data depicted only represents definitive exit angles, ignoring these estimations.
Fig. 1. DeBordieu Beach nest 19 first wave of emergence. Mean deviation from seaward
direction of 5.4° and standard deviation of 3.76. Mean deviation from brightest light
source direction of 29.9° and standard deviation of 6.68. N: number of hatchlings; r: r-
vector; a, ►: mean angle. Hatchlings are significantly oriented at the (**) p < 0.05 level
by a Rayleigh test.
N = 43
r = 0.99
a = 0.2° **
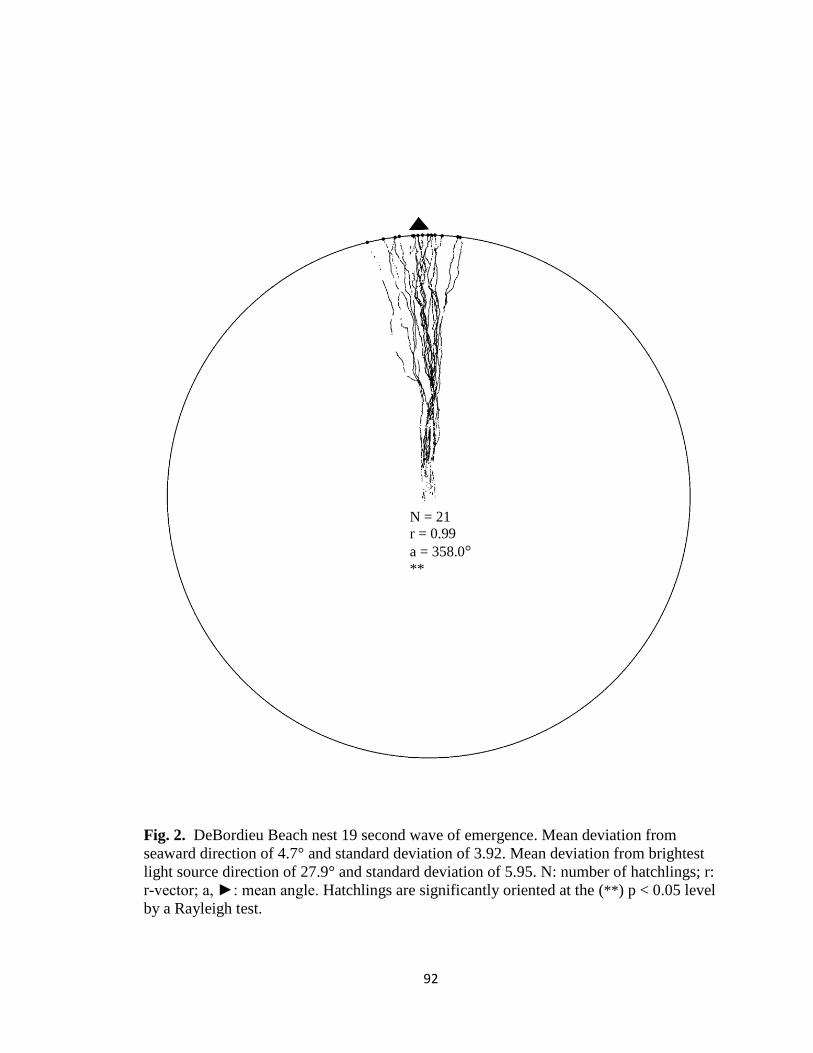
92
Fig. 2. DeBordieu Beach nest 19 second wave of emergence. Mean deviation from
seaward direction of 4.7° and standard deviation of 3.92. Mean deviation from brightest
light source direction of 27.9° and standard deviation of 5.95. N: number of hatchlings; r:
r-vector; a, ►: mean angle. Hatchlings are significantly oriented at the (**) p < 0.05 level
by a Rayleigh test.
N = 21
r = 0.99
a = 358.0° **
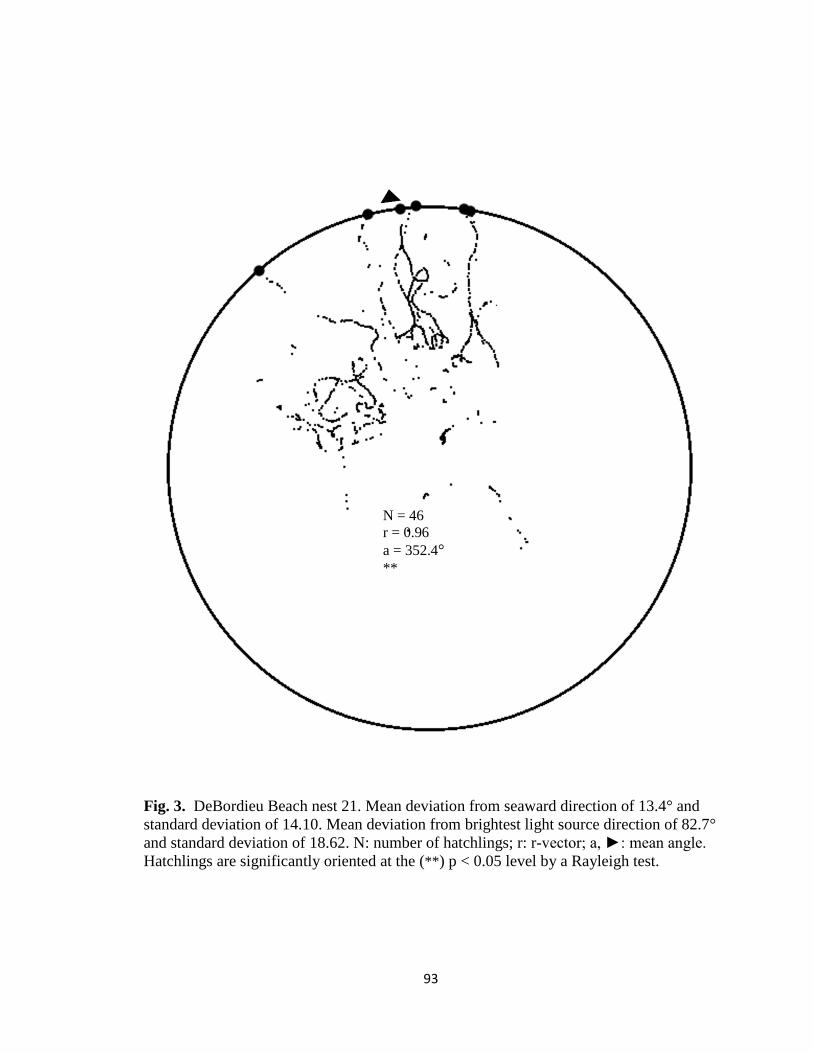
93
Fig. 3. DeBordieu Beach nest 21. Mean deviation from seaward direction of 13.4° and
standard deviation of 14.10. Mean deviation from brightest light source direction of 82.7°
and standard deviation of 18.62. N: number of hatchlings; r: r-vector; a, ►: mean angle.
Hatchlings are significantly oriented at the (**) p < 0.05 level by a Rayleigh test.
N = 46
r = 0.96
a = 352.4° **
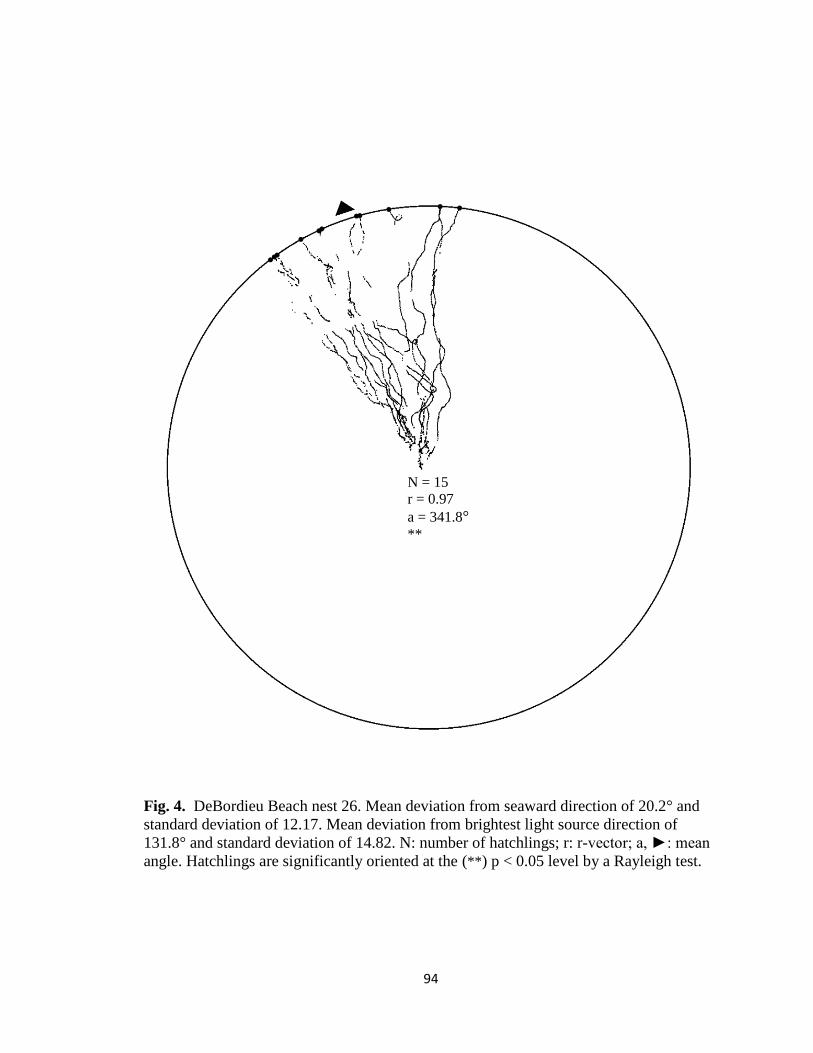
94
Fig. 4. DeBordieu Beach nest 26. Mean deviation from seaward direction of 20.2° and
standard deviation of 12.17. Mean deviation from brightest light source direction of
131.8° and standard deviation of 14.82. N: number of hatchlings; r: r-vector; a, ►: mean
angle. Hatchlings are significantly oriented at the (**) p < 0.05 level by a Rayleigh test.
N = 15
r = 0.97
a = 341.8° **
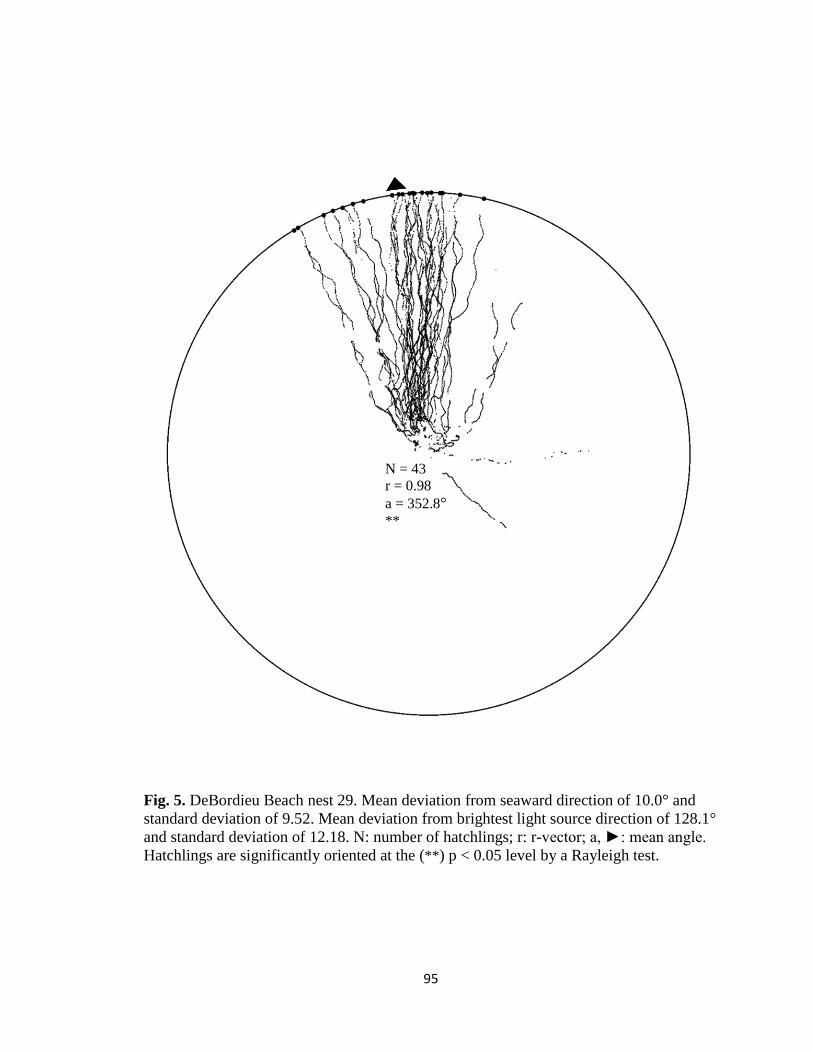
95
Fig. 5. DeBordieu Beach nest 29. Mean deviation from seaward direction of 10.0° and
standard deviation of 9.52. Mean deviation from brightest light source direction of 128.1°
and standard deviation of 12.18. N: number of hatchlings; r: r-vector; a, ►: mean angle.
Hatchlings are significantly oriented at the (**) p < 0.05 level by a Rayleigh test.
N = 43
r = 0.98
a = 352.8° **
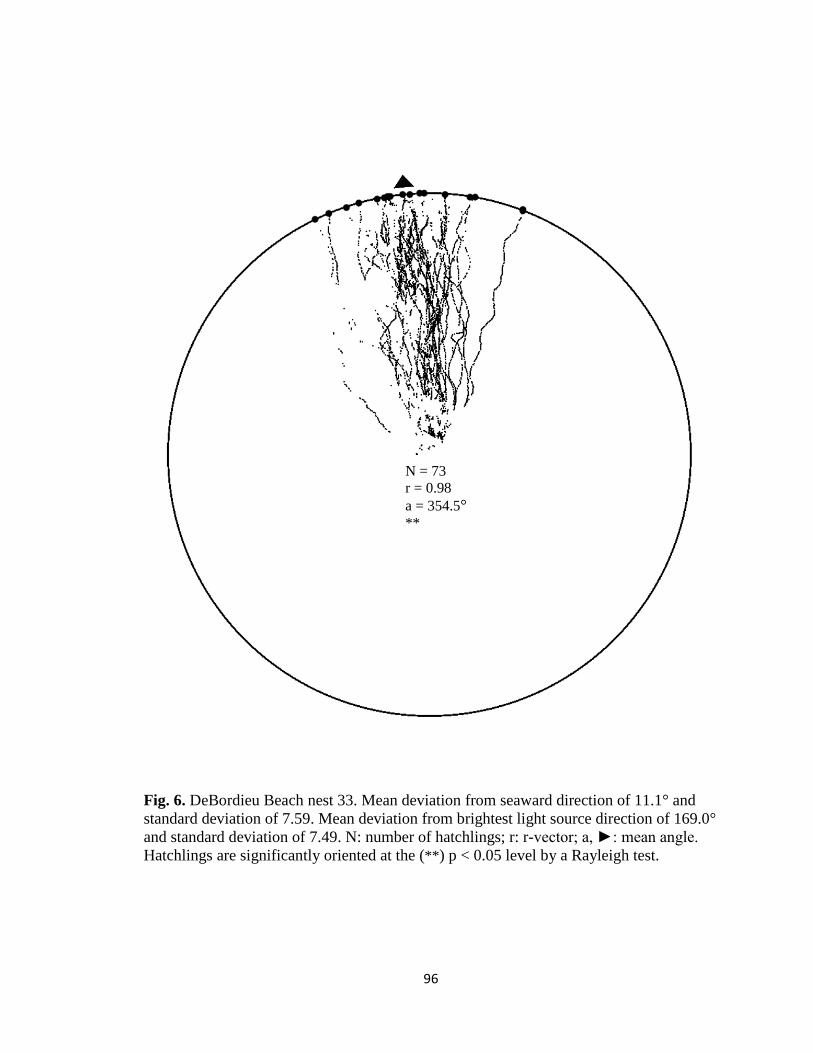
96
Fig. 6. DeBordieu Beach nest 33. Mean deviation from seaward direction of 11.1° and
standard deviation of 7.59. Mean deviation from brightest light source direction of 169.0°
and standard deviation of 7.49. N: number of hatchlings; r: r-vector; a, ►: mean angle.
Hatchlings are significantly oriented at the (**) p < 0.05 level by a Rayleigh test.
N = 73
r = 0.98
a = 354.5° **

97
Fig. 7. Garden City Beach nest 2. Mean deviation from seaward direction of 10.8° and
standard deviation of 7.54. Mean deviation from brightest light source direction of 84.1°
and standard deviation of 12.41. N: number of hatchlings; r: r-vector; a, ►: mean angle.
Hatchlings are significantly oriented at the (**) p < 0.05 level by a Rayleigh test.
N = 85
r = 0.98
a = 354.1° **
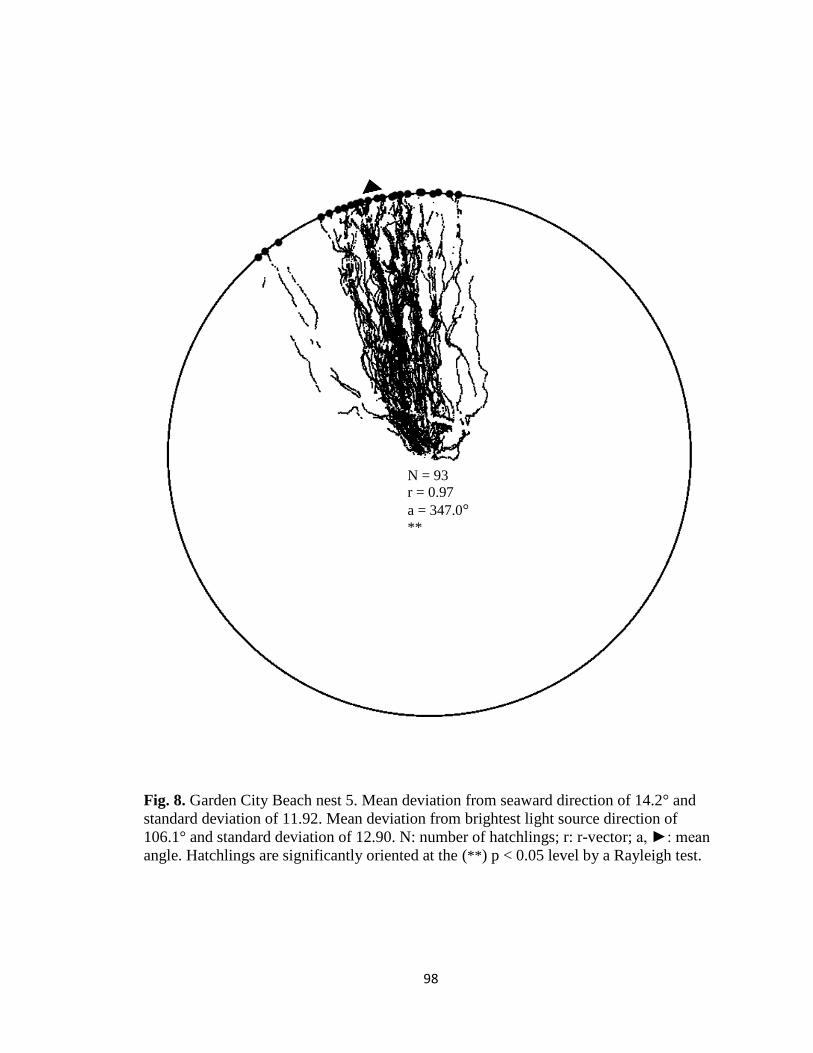
98
Fig. 8. Garden City Beach nest 5. Mean deviation from seaward direction of 14.2° and
standard deviation of 11.92. Mean deviation from brightest light source direction of
106.1° and standard deviation of 12.90. N: number of hatchlings; r: r-vector; a, ►: mean
angle. Hatchlings are significantly oriented at the (**) p < 0.05 level by a Rayleigh test.
N = 93
r = 0.97
a = 347.0° **
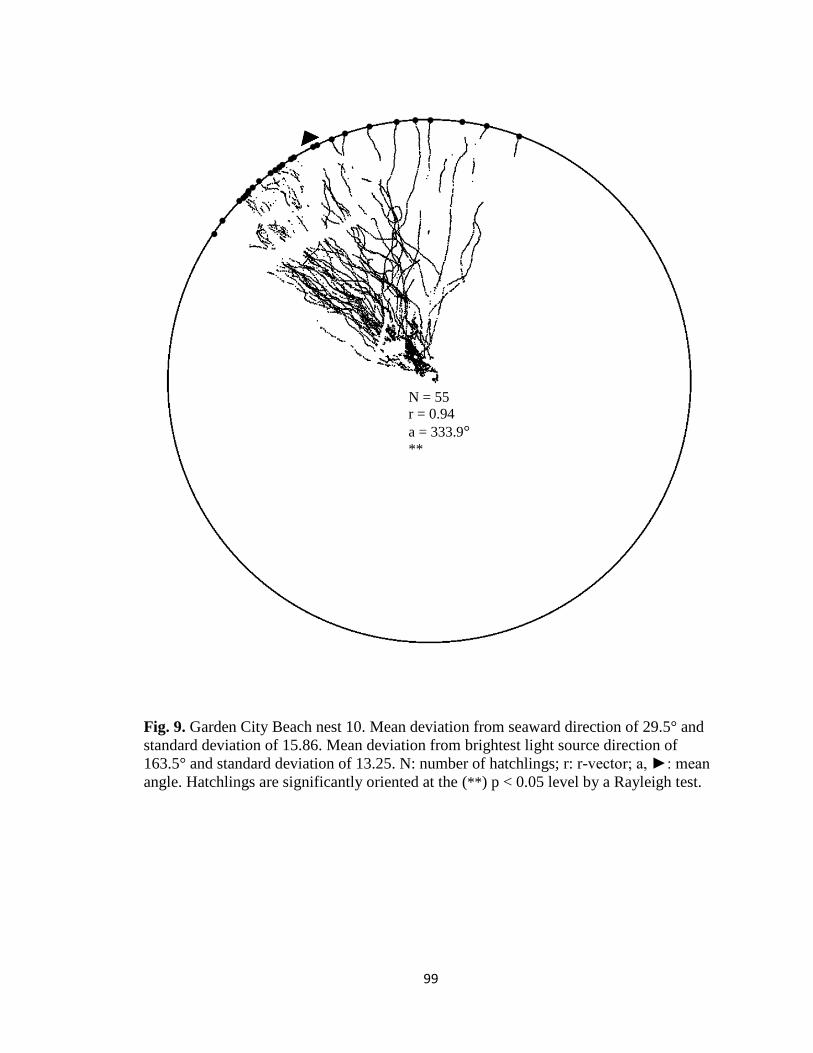
99
Fig. 9. Garden City Beach nest 10. Mean deviation from seaward direction of 29.5° and
standard deviation of 15.86. Mean deviation from brightest light source direction of
163.5° and standard deviation of 13.25. N: number of hatchlings; r: r-vector; a, ►: mean
angle. Hatchlings are significantly oriented at the (**) p < 0.05 level by a Rayleigh test.
N = 55
r = 0.94
a = 333.9° **
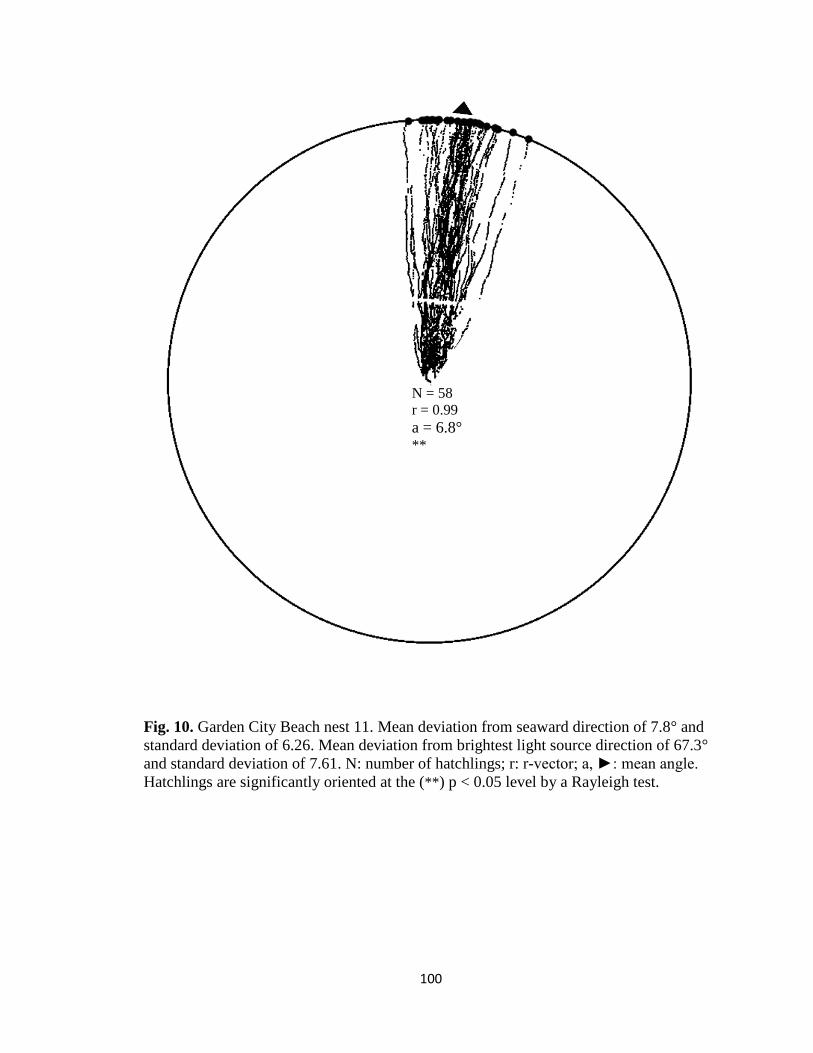
100
Fig. 10. Garden City Beach nest 11. Mean deviation from seaward direction of 7.8° and
standard deviation of 6.26. Mean deviation from brightest light source direction of 67.3°
and standard deviation of 7.61. N: number of hatchlings; r: r-vector; a, ►: mean angle.
Hatchlings are significantly oriented at the (**) p < 0.05 level by a Rayleigh test.
N = 58
r = 0.99
a = 6.8°
**
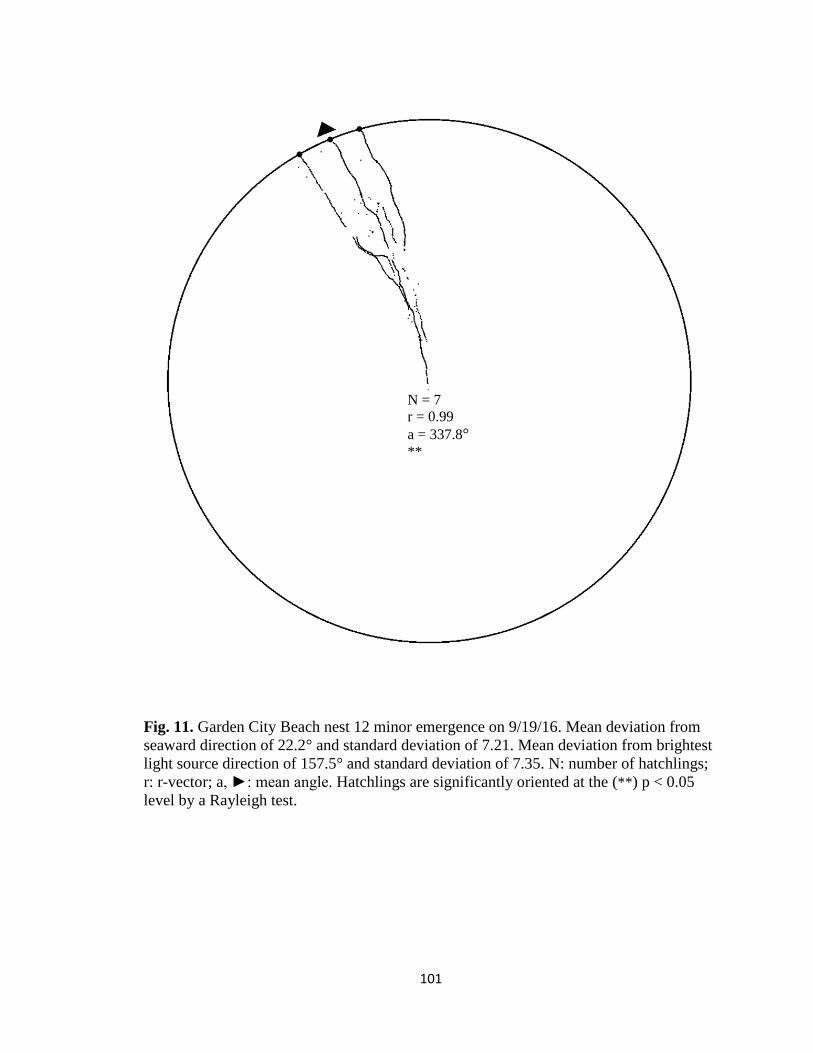
101
Fig. 11. Garden City Beach nest 12 minor emergence on 9/19/16. Mean deviation from
seaward direction of 22.2° and standard deviation of 7.21. Mean deviation from brightest
light source direction of 157.5° and standard deviation of 7.35. N: number of hatchlings;
r: r-vector; a, ►: mean angle. Hatchlings are significantly oriented at the (**) p < 0.05
level by a Rayleigh test.
N = 7
r = 0.99
a = 337.8° **
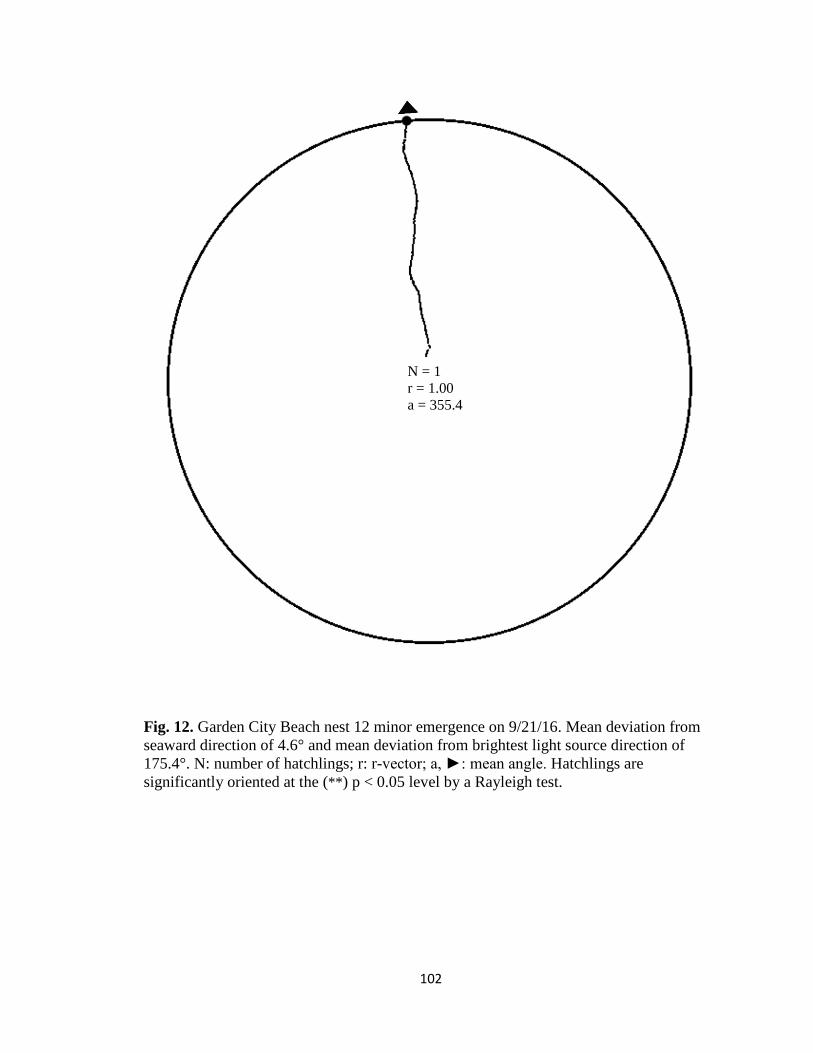
102
Fig. 12. Garden City Beach nest 12 minor emergence on 9/21/16. Mean deviation from
seaward direction of 4.6° and mean deviation from brightest light source direction of
175.4°. N: number of hatchlings; r: r-vector; a, ►: mean angle. Hatchlings are
significantly oriented at the (**) p < 0.05 level by a Rayleigh test.
N = 1
r = 1.00
a = 355.4
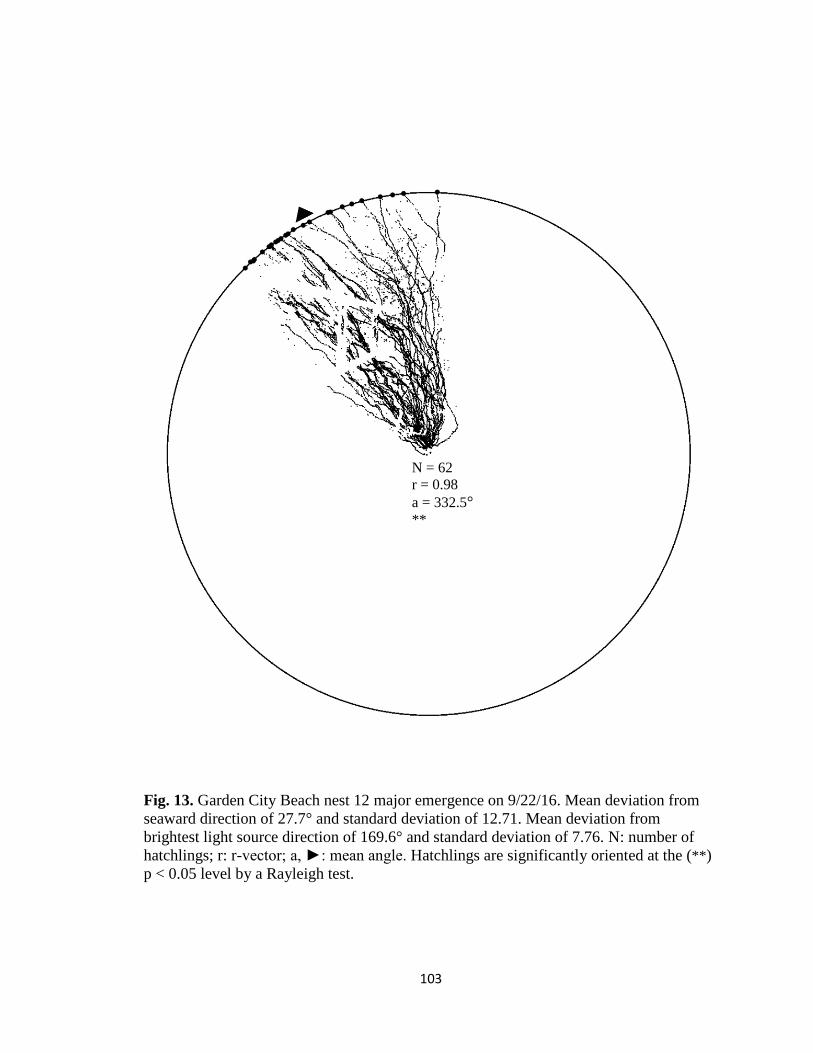
103
Fig. 13. Garden City Beach nest 12 major emergence on 9/22/16. Mean deviation from
seaward direction of 27.7° and standard deviation of 12.71. Mean deviation from
brightest light source direction of 169.6° and standard deviation of 7.76. N: number of
hatchlings; r: r-vector; a, ►: mean angle. Hatchlings are significantly oriented at the (**)
p < 0.05 level by a Rayleigh test.
N = 62
r = 0.98
a = 332.5° **
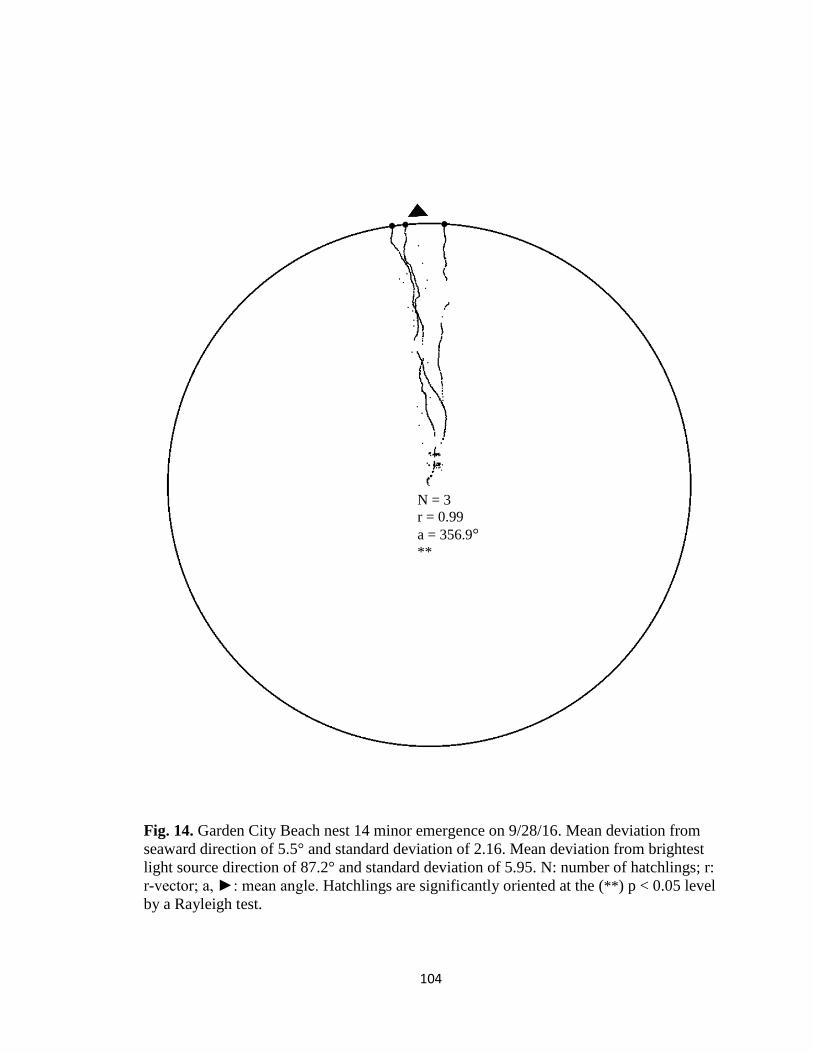
104
Fig. 14. Garden City Beach nest 14 minor emergence on 9/28/16. Mean deviation from
seaward direction of 5.5° and standard deviation of 2.16. Mean deviation from brightest
light source direction of 87.2° and standard deviation of 5.95. N: number of hatchlings; r:
r-vector; a, ►: mean angle. Hatchlings are significantly oriented at the (**) p < 0.05 level
by a Rayleigh test.
N = 3
r = 0.99
a = 356.9° **

105
Fig. 15. Garden City Beach nest 14 major emergence on 9/29/16. Mean deviation from
seaward direction of 21.5° and standard deviation of 12.08. Mean deviation from
brightest light source direction of 70.7° and standard deviation of 13.67. N: number of
hatchlings; r: r-vector; a, ►: mean angle. Hatchlings are significantly oriented at the (**)
p < 0.05 level by a Rayleigh test.
N = 71
r = 0.97
a = 339.5° **
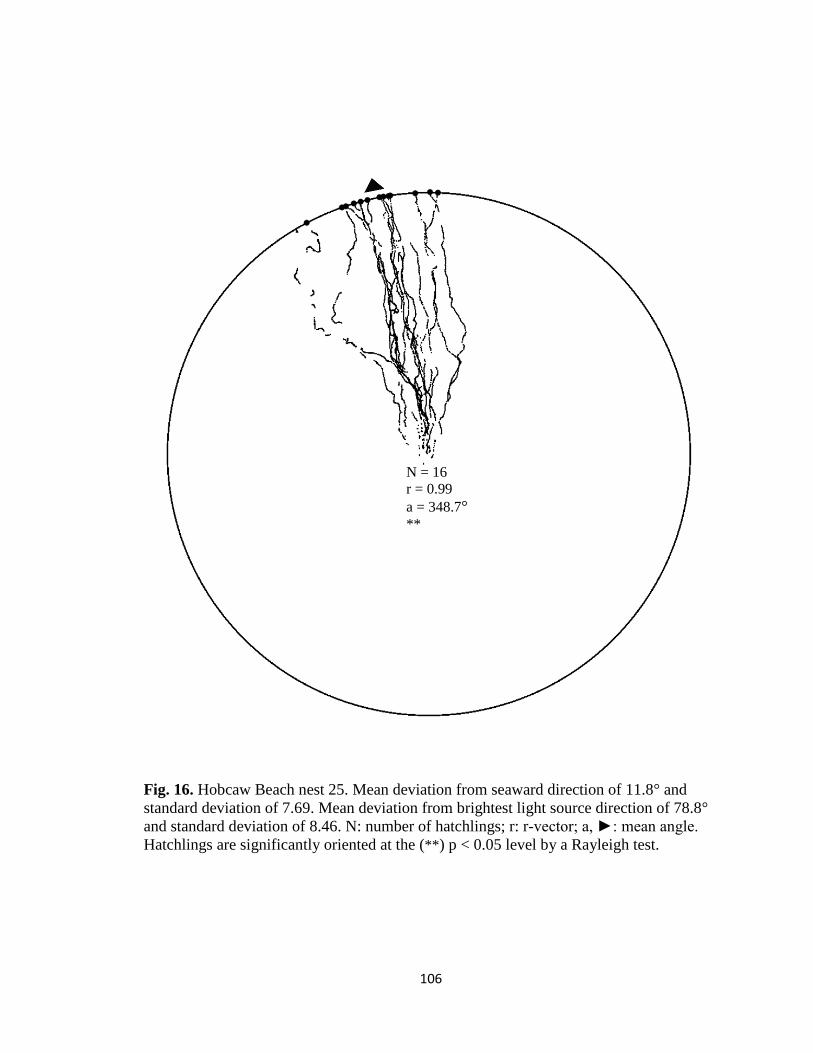
106
Fig. 16. Hobcaw Beach nest 25. Mean deviation from seaward direction of 11.8° and
standard deviation of 7.69. Mean deviation from brightest light source direction of 78.8°
and standard deviation of 8.46. N: number of hatchlings; r: r-vector; a, ►: mean angle.
Hatchlings are significantly oriented at the (**) p < 0.05 level by a Rayleigh test.
N = 16
r = 0.99
a = 348.7° **
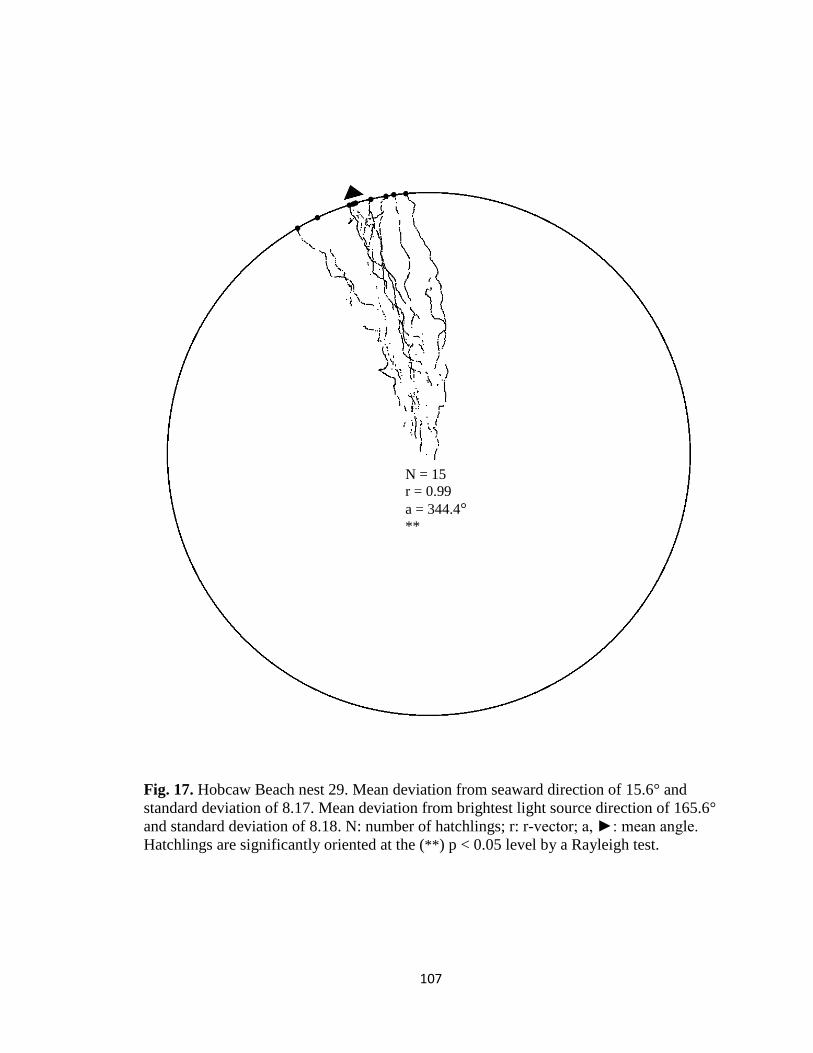
107
Fig. 17. Hobcaw Beach nest 29. Mean deviation from seaward direction of 15.6° and
standard deviation of 8.17. Mean deviation from brightest light source direction of 165.6°
and standard deviation of 8.18. N: number of hatchlings; r: r-vector; a, ►: mean angle.
Hatchlings are significantly oriented at the (**) p < 0.05 level by a Rayleigh test.
N = 15
r = 0.99
a = 344.4° **
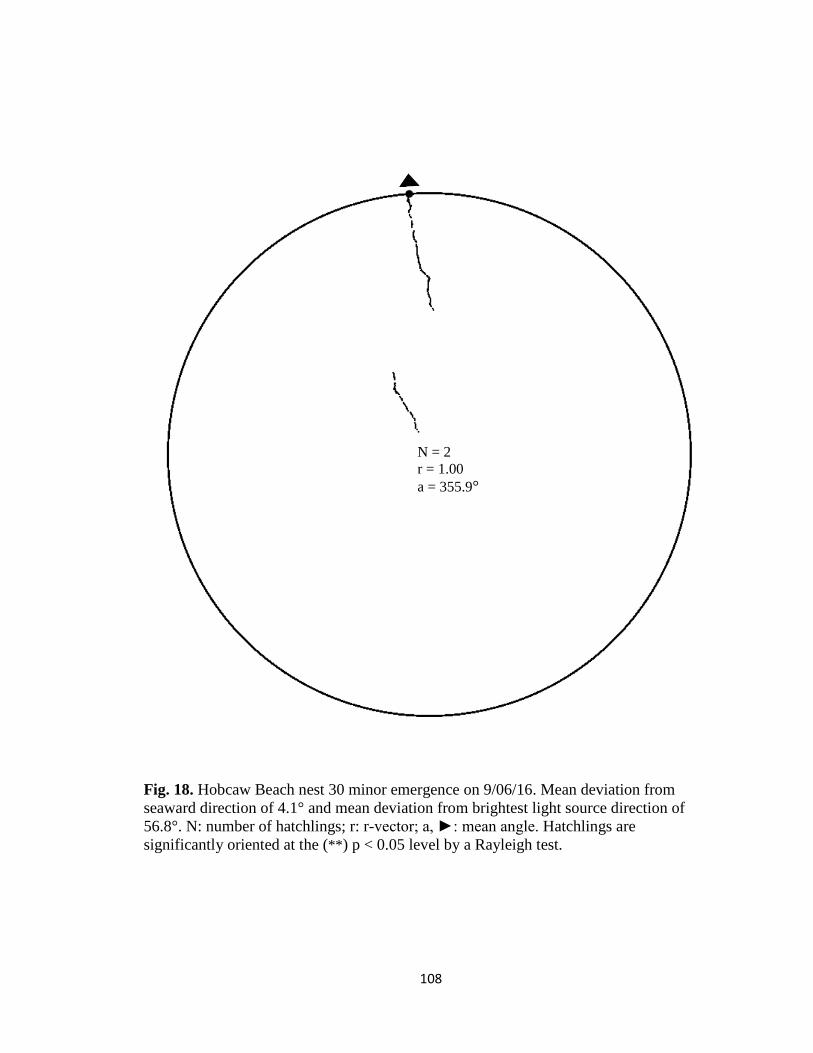
108
Fig. 18. Hobcaw Beach nest 30 minor emergence on 9/06/16. Mean deviation from
seaward direction of 4.1° and mean deviation from brightest light source direction of
56.8°. N: number of hatchlings; r: r-vector; a, ►: mean angle. Hatchlings are
significantly oriented at the (**) p < 0.05 level by a Rayleigh test.
N = 2
r = 1.00
a = 355.9°
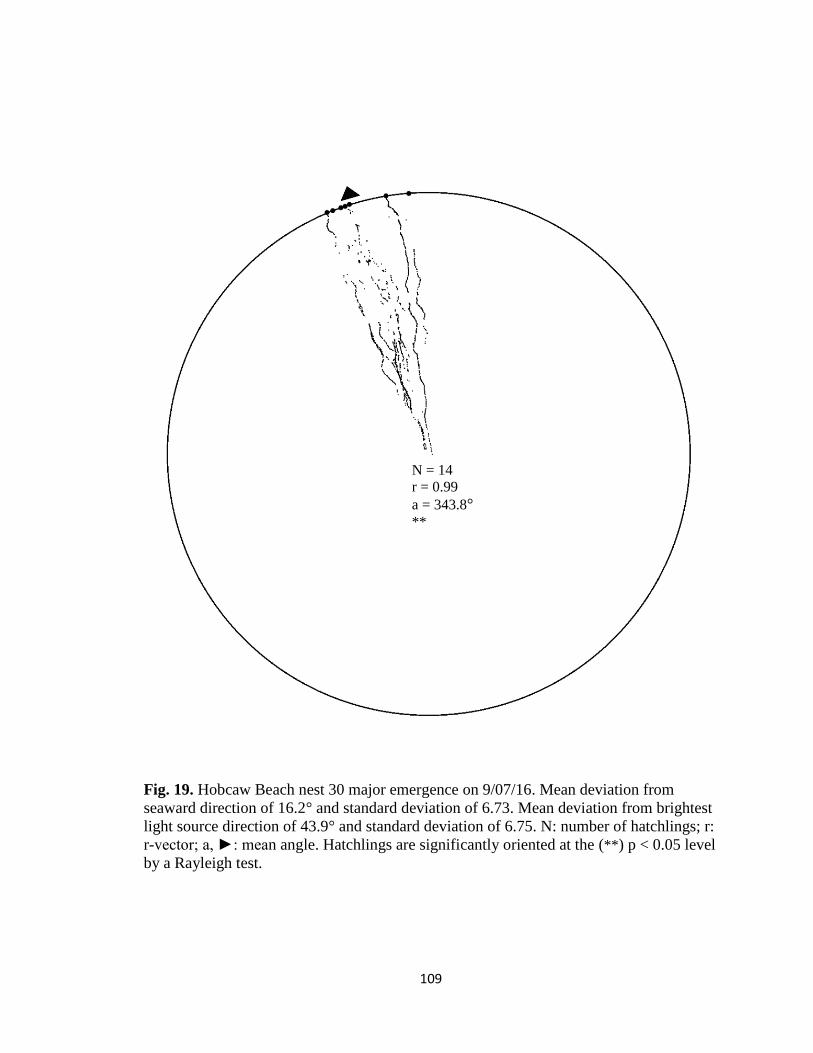
109
Fig. 19. Hobcaw Beach nest 30 major emergence on 9/07/16. Mean deviation from
seaward direction of 16.2° and standard deviation of 6.73. Mean deviation from brightest
light source direction of 43.9° and standard deviation of 6.75. N: number of hatchlings; r:
r-vector; a, ►: mean angle. Hatchlings are significantly oriented at the (**) p < 0.05 level
by a Rayleigh test.
N = 14
r = 0.99
a = 343.8° **
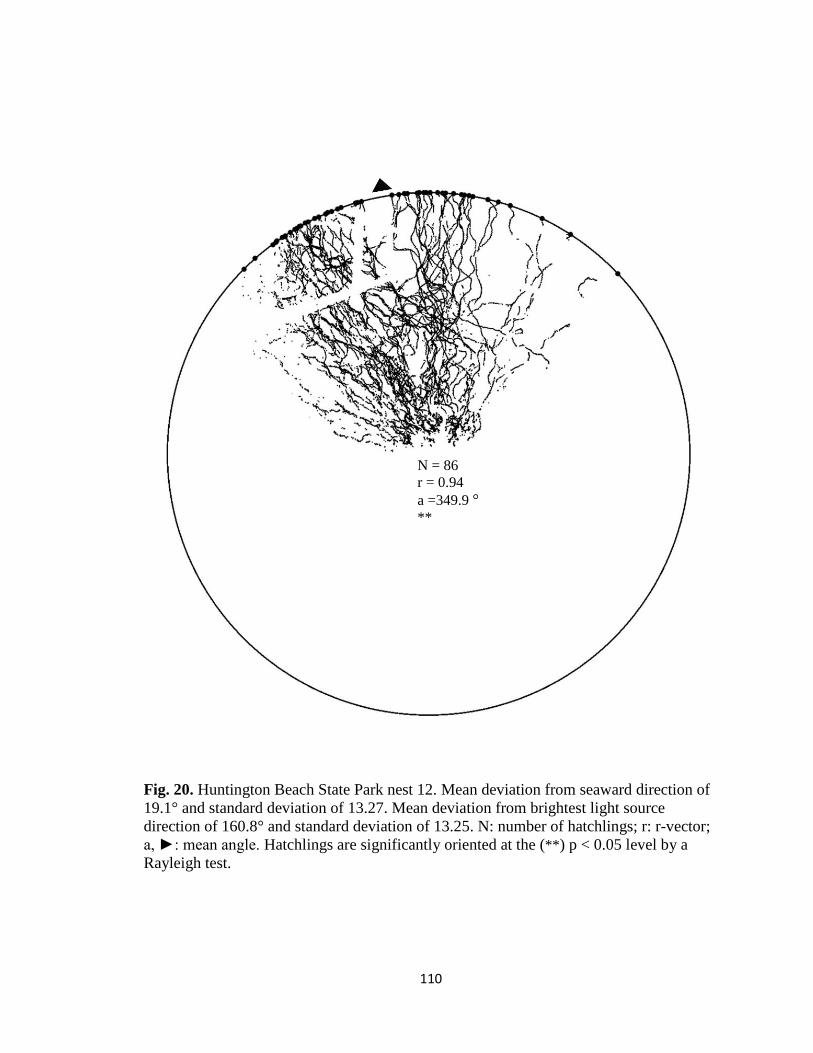
110
Fig. 20. Huntington Beach State Park nest 12. Mean deviation from seaward direction of
19.1° and standard deviation of 13.27. Mean deviation from brightest light source
direction of 160.8° and standard deviation of 13.25. N: number of hatchlings; r: r-vector;
a, ►: mean angle. Hatchlings are significantly oriented at the (**) p < 0.05 level by a
Rayleigh test.
N = 86
r = 0.94
a =349.9 ° **
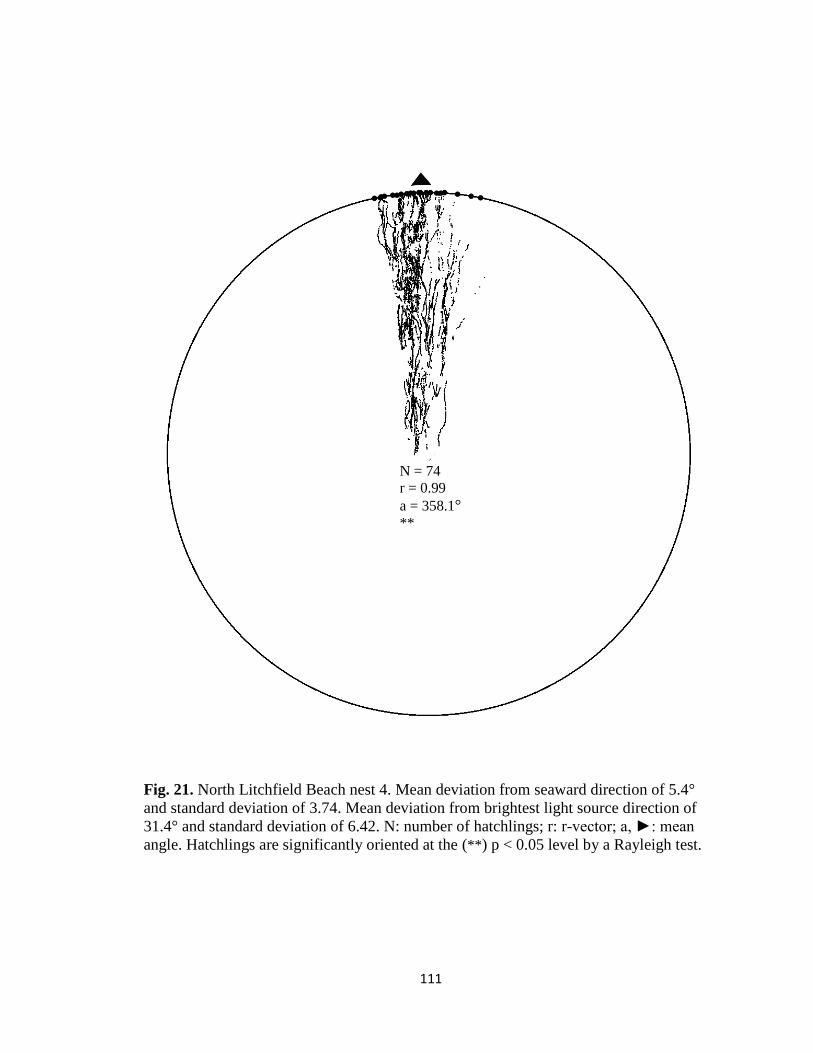
111
Fig. 21. North Litchfield Beach nest 4. Mean deviation from seaward direction of 5.4°
and standard deviation of 3.74. Mean deviation from brightest light source direction of
31.4° and standard deviation of 6.42. N: number of hatchlings; r: r-vector; a, ►: mean
angle. Hatchlings are significantly oriented at the (**) p < 0.05 level by a Rayleigh test.
N = 74
r = 0.99
a = 358.1° **
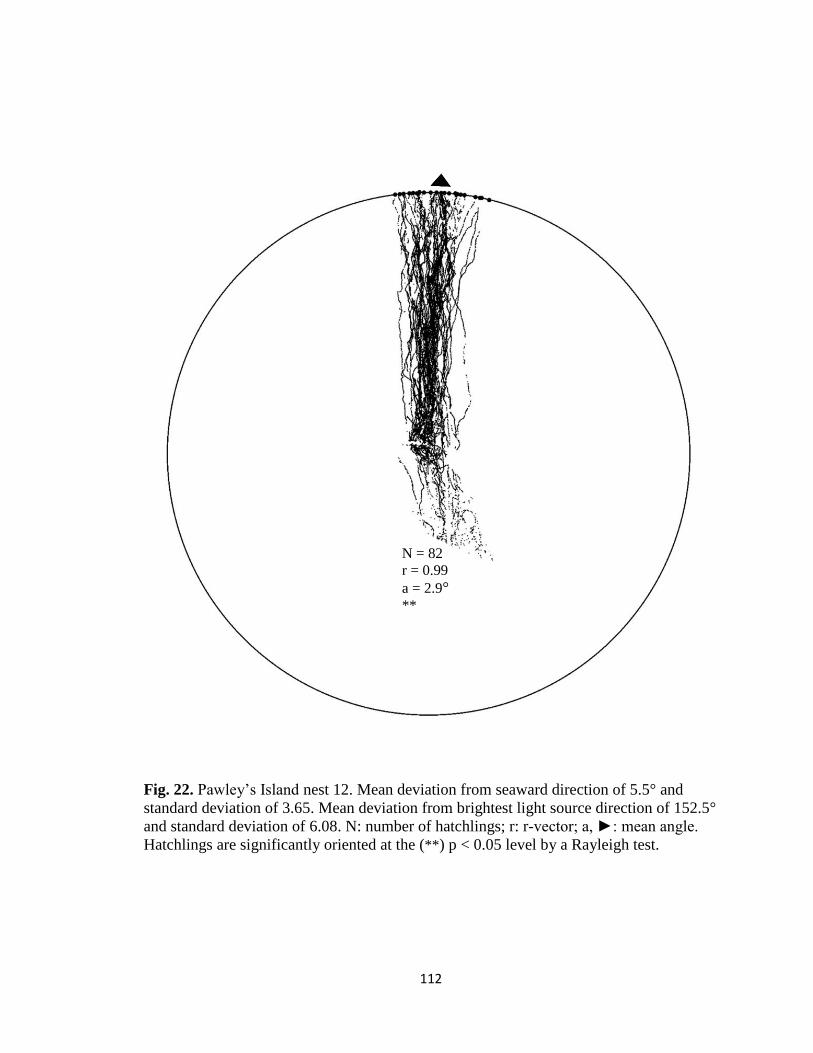
112
Fig. 22. Pawley’s Island nest 12. Mean deviation from seaward direction of 5.5° and
standard deviation of 3.65. Mean deviation from brightest light source direction of 152.5°
and standard deviation of 6.08. N: number of hatchlings; r: r-vector; a, ►: mean angle.
Hatchlings are significantly oriented at the (**) p < 0.05 level by a Rayleigh test.
N = 82
r = 0.99
a = 2.9° **
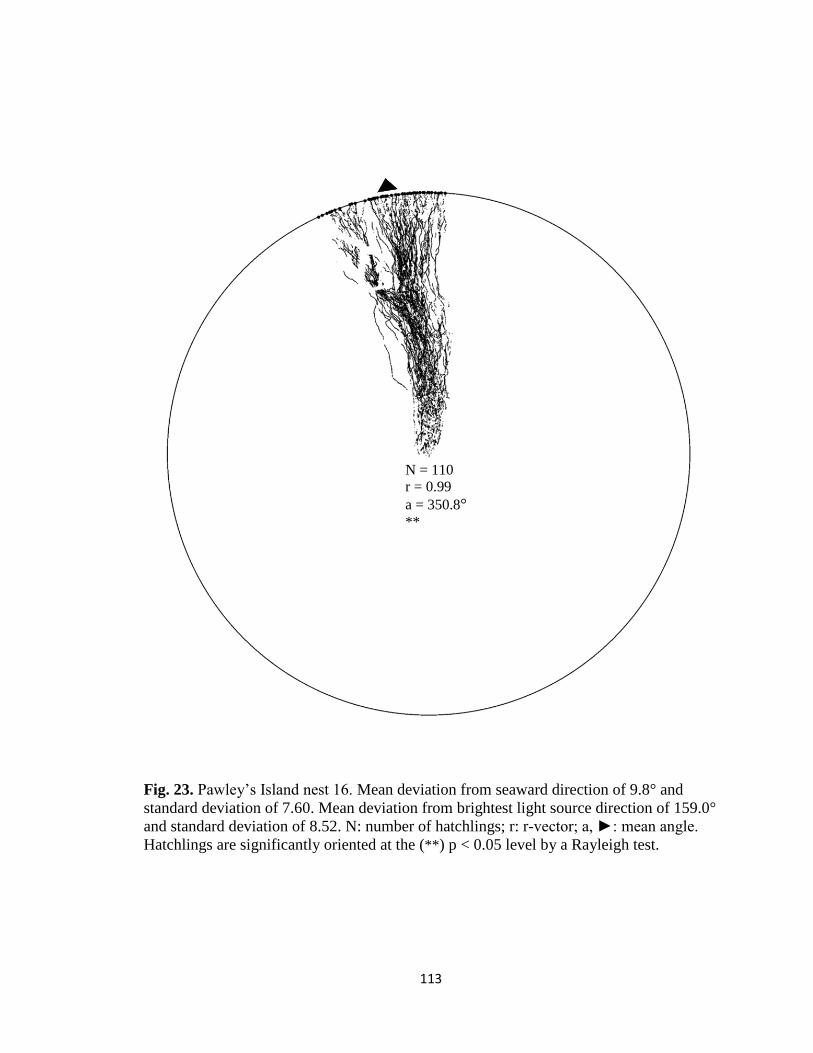
113
Fig. 23. Pawley’s Island nest 16. Mean deviation from seaward direction of 9.8° and
standard deviation of 7.60. Mean deviation from brightest light source direction of 159.0°
and standard deviation of 8.52. N: number of hatchlings; r: r-vector; a, ►: mean angle.
Hatchlings are significantly oriented at the (**) p < 0.05 level by a Rayleigh test.
N = 110
r = 0.99
a = 350.8° **
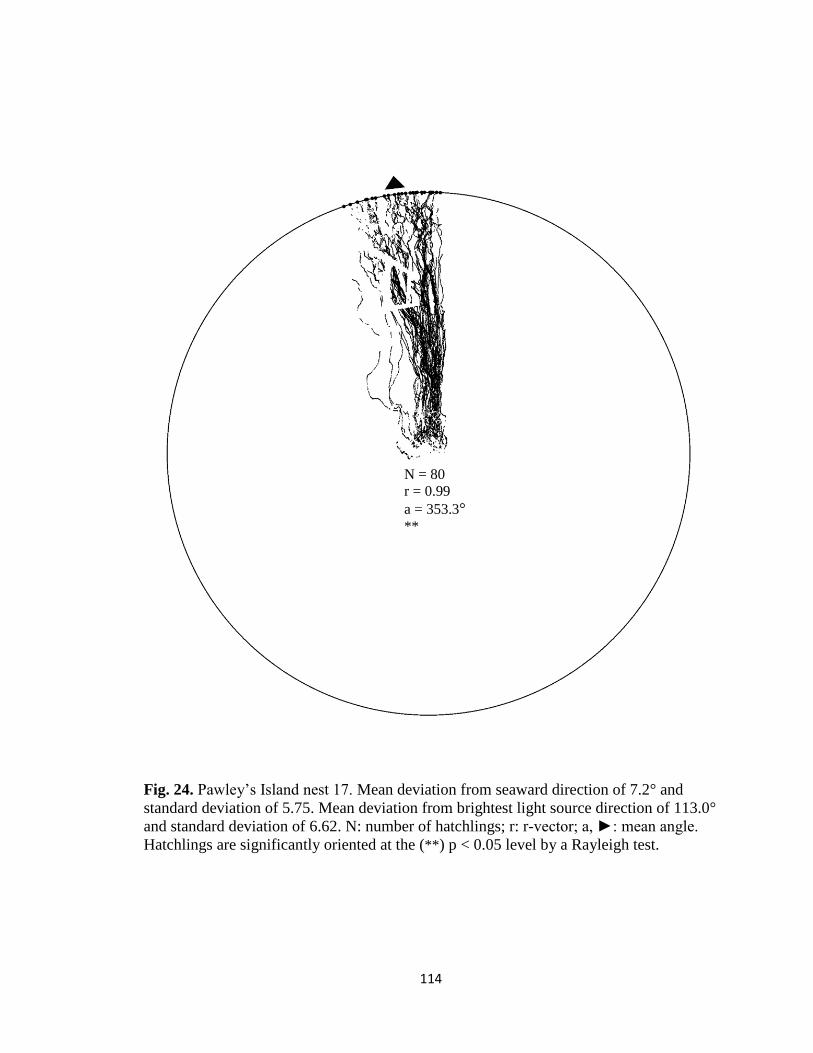
114
Fig. 24. Pawley’s Island nest 17. Mean deviation from seaward direction of 7.2° and
standard deviation of 5.75. Mean deviation from brightest light source direction of 113.0°
and standard deviation of 6.62. N: number of hatchlings; r: r-vector; a, ►: mean angle.
Hatchlings are significantly oriented at the (**) p < 0.05 level by a Rayleigh test.
N = 80
r = 0.99
a = 353.3° **
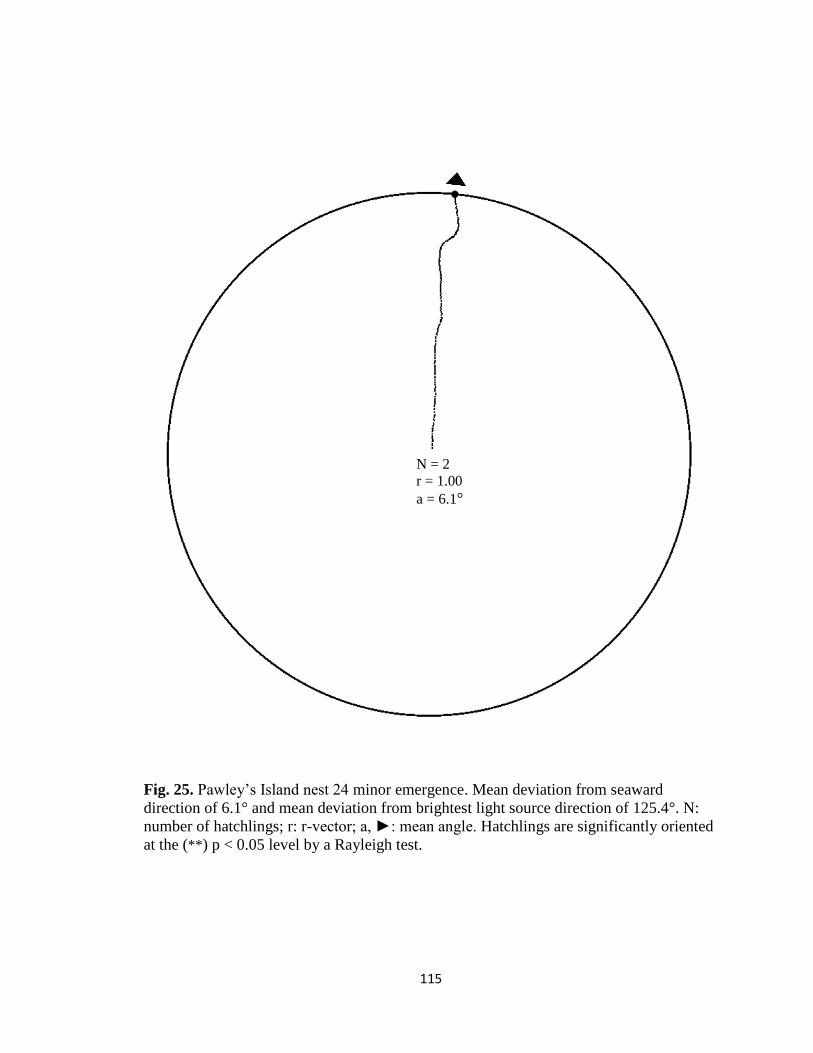
115
Fig. 25. Pawley’s Island nest 24 minor emergence. Mean deviation from seaward
direction of 6.1° and mean deviation from brightest light source direction of 125.4°. N:
number of hatchlings; r: r-vector; a, ►: mean angle. Hatchlings are significantly oriented
at the (**) p < 0.05 level by a Rayleigh test.
N = 2
r = 1.00
a = 6.1°
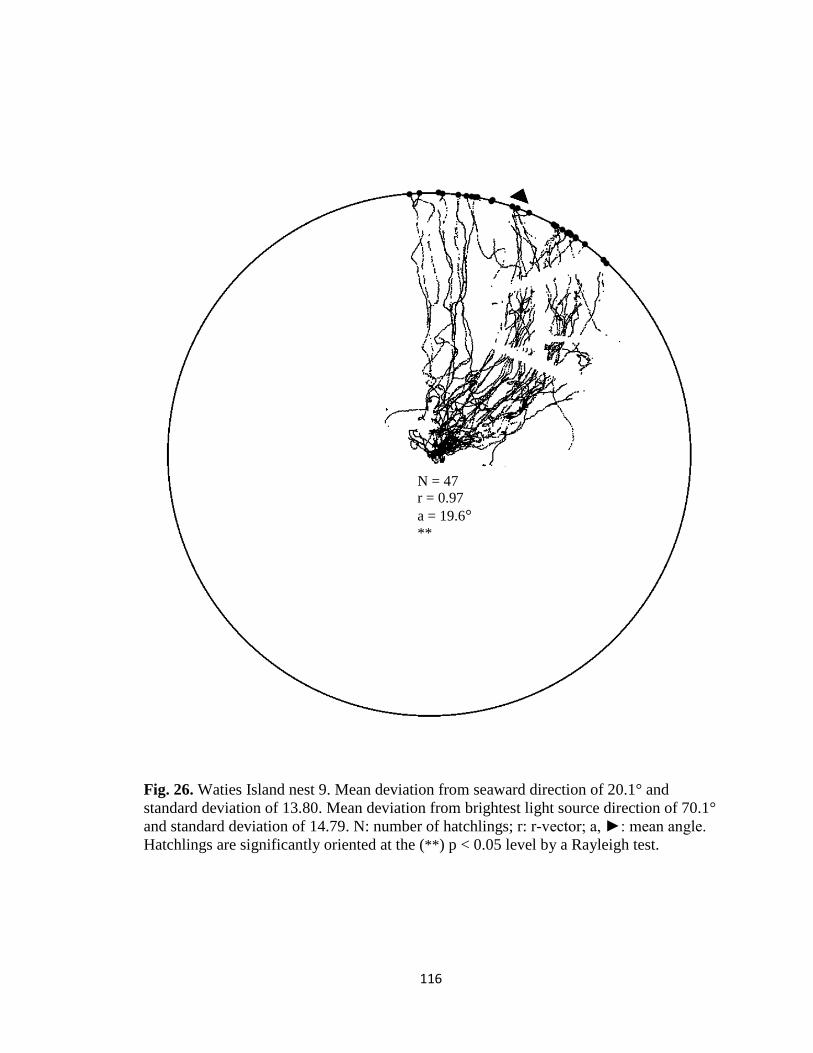
116
Fig. 26. Waties Island nest 9. Mean deviation from seaward direction of 20.1° and
standard deviation of 13.80. Mean deviation from brightest light source direction of 70.1°
and standard deviation of 14.79. N: number of hatchlings; r: r-vector; a, ►: mean angle.
Hatchlings are significantly oriented at the (**) p < 0.05 level by a Rayleigh test.
N = 47
r = 0.97
a = 19.6° **


![Pesticides, Environmental Pollution, and Healthenter the surrounding soil, water, and air [11,12]. As artificial organic compounds, pesticides can remain in the environment for many](https://img.pdfslide.us/doc/110x75/6138388d0ad5d20676491f97/pesticides-environmental-pollution-and-health-enter-the-surrounding-soil-water.jpg)


![Soft Artificial Life, Artificial Agents and Artificial ... Life-springer... · Soft Artificial Life, Artificial Agents and Artificial ... Introduction Artificial ... Stillings [22]](https://img.pdfslide.us/doc/110x75/5b0b2db47f8b9ae61b8d59e8/soft-artificial-life-artificial-agents-and-artificial-life-springersoft.jpg)