Embed Size (px)
Citation preview

Report Confidential • Published 03/14
The effect of AQUI-S on nitrogen compound removal efficiency in recirculating aquaculture system (RAS) Jelena Kolarevic and Bendik Fyhn Terjesen

Nofima is a business oriented research institute working in research and development for aquaculture, fisheries and food industry in Norway. Nofima has about 400 employees. The main office is located in Tromsø, and the research divisions are located in Averøy, Bergen, Stavanger, Sunndalsøra, Tromsø and Ås.
Company contact information: Tel: +47 77 62 90 00 E-mail: [email protected] Internet: www.nofima.no Business reg.no.: NO 989 278 835 VAT
Main office in Tromsø: Muninbakken 9–13 P.O.box 6122 Langnes NO-9291 Tromsø Ås: Osloveien 1 P.O.box 210 NO-1431 ÅS Stavanger: Måltidets hus, Richard Johnsensgate 4 P.O.box 8034 NO-4068 Stavanger Bergen: Kjerreidviken 16 P.O.box 1425 Oasen NO-5828 Bergen Sunndalsøra: Sjølseng NO-6600 Sunndalsøra Averøy: Ekkilsøy NO-6530 Averøy

Report
Title:
The effect of AQUI-S on the nitrogen compound removal efficiency of bioreactor withinin recirculationg aquaculture system (RAS)
Accessibility:
Confidential Date:
15 March 2014 Author(s)/Project Manager:
Jelena Kolarevic and Bendik Fyhn Terjesen /Jelena Kolarevic
Number of pages and appendixes:
<Fill in> Department:
Division Aquaculture
Project No.:
10786 Client:
Scan Aqua
Client's ref.:
<Fill in> Summary/recommendation:
AQUI-S (AQUI-S® New Zealand Ltd., Lower Hutt, New Zealand) is a water dispersible liquid anaesthetic that is
currently approved in Norway for sedation and anesthesia of Atlantic salmon (Salmo salar L.) and rainbow
trout (Oncorhynchus mykiss) prior and during handling events and during live fish transport. Its active
ingredient is isoeugenol; 540 mg/ml. It is used both in flow-through and recirculating aquaculture systems
(RAS). However, the potential effects of AQUI-S on the biological component of the water treatment and the
possible accumulation within RAS water have not been closely investigated. This project aims to look into the
bioreactor efficiency of nitrogen compound removal and AQUI-S stability and potential accumulation within
RAS water.
The initial concentration of AQUI-S in the RAS water was 5 ml/m3 total system volume, corresponding to 2,7
mg isoeugenol L-1. This represents the maximum load of Aqui-S that theoretically will be added to a RAS;
usually only a few tanks in the circuit will be medicated at once, not the entire system. Six hours after
addition of AQUI-S, 86-87% of the isoeugenol was degraded or converted although the total water exchange
within RAS was very low (6.6 %). It is therefore anticipated that in commercial RAS where the level of total
daily water exchange might be higher, the depletion of AQUI-S from water would occur even faster.
The water quality and the removal of the TAN and NO2-N were moderately affected, particularly during first
12h of the experiment. One of the reasons for the disturbance of the bioreactor function could be foam
formation that was visible prior and in all three chambers of the MBBR within 30 minutes after addition of
the AQUI-S. Consequently the difficulty in the mixing and the drop in the oxygen saturation within MBBR
could have affected proper operation of the bioreactor. In addition, the low and decreasing concentration of
nitrogenous compounds within the system (lack of feeding and fish) is not favourable for the nitrification
process within bioreactor. However, it is important to stress that certain amount of nitrogenous compounds
was removed at all times. The increase in concentration of TAN and NO2-N was significant; however
concentrations were within recommended values issued by Norwegian Food Safety Authorities at all times
during the experiment. This conclusion will, however, depend on the initial load of the system. Hence, it is
recommended that before AQUI-S use, the TAN levels should not be above 1 mg/l (at pH 7.4 or less), to allow
some reduction in removal efficiency and still be within legislation regarding TAN concentration. The removal
efficiency of nitrogenous compounds oscillated during first 12 h of experiment but was not significantly
affected by addition of AQUI-S. After 12 h, a steady increase in removal efficiency was recorded for TAN and
NO2-N, respectively.

• The study indicates that Aqui-S is readily degraded by RAS bioreactors, minimizing the risk of
isoeugenol accumulating following sequential medication of fish tanks in the RAS
• AQUI-S used at doses recommended for sedation is not likely to have serious effects on bioreactor
within 48 hours following its use in RAS
• Increased foaming in the moving bed bioreactor during the first hours following Aqui-S
administration might cause or contribute to a transient reduction in TAN and NO2 –N removal
efficiency

Table of Contents
1 Background ........................................................................................................... 1
2 Experimental design .............................................................................................. 1
3 Methods and analyses ........................................................................................... 3
3.1 Water sampling and water quality measurements ................................................................ 3 3.2 AQUI-S concentration determination .................................................................................... 4
4 Results ................................................................................................................... 5
4.1 AQUI-S stock solution preparation and addition to the RAS .................................................. 5 4.2 Concentration of AQUI-S in the recirculating water within 48 h post-addition ..................... 7 4.3 Effect of AQUI-S on water quality and TAN/NO2-N removal efficiency of the MBBR ............ 8
5 Concluding remarks ............................................................................................. 10
6 References ........................................................................................................... 11
1
1 Background
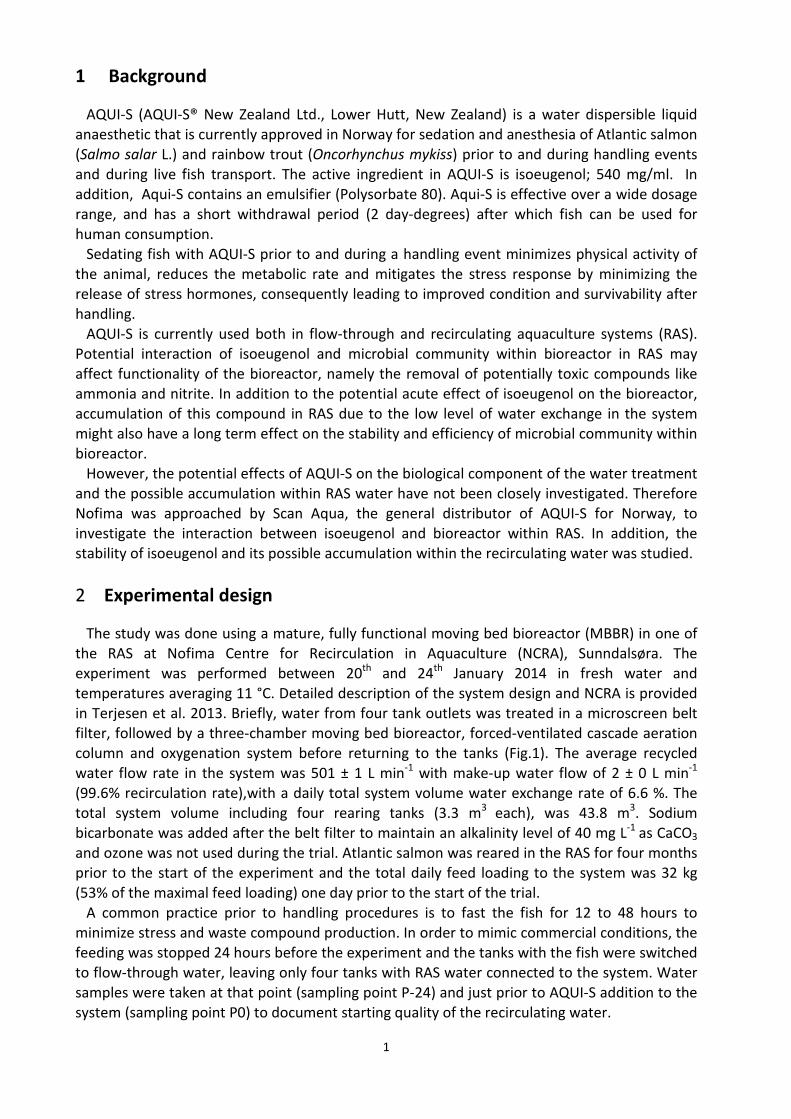
AQUI-S (AQUI-S® New Zealand Ltd., Lower Hutt, New Zealand) is a water dispersible liquid anaesthetic that is currently approved in Norway for sedation and anesthesia of Atlantic salmon (Salmo salar L.) and rainbow trout (Oncorhynchus mykiss) prior to and during handling events and during live fish transport. The active ingredient in AQUI-S is isoeugenol; 540 mg/ml. In addition, Aqui-S contains an emulsifier (Polysorbate 80). Aqui-S is effective over a wide dosage range, and has a short withdrawal period (2 day-degrees) after which fish can be used for human consumption. Sedating fish with AQUI-S prior to and during a handling event minimizes physical activity of the animal, reduces the metabolic rate and mitigates the stress response by minimizing the release of stress hormones, consequently leading to improved condition and survivability after handling. AQUI-S is currently used both in flow-through and recirculating aquaculture systems (RAS). Potential interaction of isoeugenol and microbial community within bioreactor in RAS may affect functionality of the bioreactor, namely the removal of potentially toxic compounds like ammonia and nitrite. In addition to the potential acute effect of isoeugenol on the bioreactor, accumulation of this compound in RAS due to the low level of water exchange in the system might also have a long term effect on the stability and efficiency of microbial community within bioreactor. However, the potential effects of AQUI-S on the biological component of the water treatment and the possible accumulation within RAS water have not been closely investigated. Therefore Nofima was approached by Scan Aqua, the general distributor of AQUI-S for Norway, to investigate the interaction between isoeugenol and bioreactor within RAS. In addition, the stability of isoeugenol and its possible accumulation within the recirculating water was studied.
2 Experimental design
The study was done using a mature, fully functional moving bed bioreactor (MBBR) in one of the RAS at Nofima Centre for Recirculation in Aquaculture (NCRA), Sunndalsøra. The experiment was performed between 20th and 24th January 2014 in fresh water and temperatures averaging 11 °C. Detailed description of the system design and NCRA is provided in Terjesen et al. 2013. Briefly, water from four tank outlets was treated in a microscreen belt filter, followed by a three-chamber moving bed bioreactor, forced-ventilated cascade aeration column and oxygenation system before returning to the tanks (Fig.1). The average recycled water flow rate in the system was 501 ± 1 L min-1 with make-up water flow of 2 ± 0 L min-1 (99.6% recirculation rate),with a daily total system volume water exchange rate of 6.6 %. The total system volume including four rearing tanks (3.3 m3 each), was 43.8 m3. Sodium bicarbonate was added after the belt filter to maintain an alkalinity level of 40 mg L-1 as CaCO3 and ozone was not used during the trial. Atlantic salmon was reared in the RAS for four months prior to the start of the experiment and the total daily feed loading to the system was 32 kg (53% of the maximal feed loading) one day prior to the start of the trial. A common practice prior to handling procedures is to fast the fish for 12 to 48 hours to minimize stress and waste compound production. In order to mimic commercial conditions, the feeding was stopped 24 hours before the experiment and the tanks with the fish were switched to flow-through water, leaving only four tanks with RAS water connected to the system. Water samples were taken at that point (sampling point P-24) and just prior to AQUI-S addition to the system (sampling point P0) to document starting quality of the recirculating water.
2
AQUI-S stock solution was prepared in accordance with the manufacturer’s recommendation. In short, 238.5 g of AQUI-S was weighed and diluted up to 2L volume with deionized water (5 ml of AQUI-S per m3 of total system volume) and mixed well. The stock solution was divided in four equal parts and 500 ml was added directly to each of four rearing tanks (Fig.2).
Figure 1. Schematic view of the experimental set-up in NCRA; RAS loop consisting of four 3.3 m3 rearing tanks
connected to the water treatment unit (mechanical filter, bioreactor, CO2 degasser and oxygenation unit).
Water samples and water quality measurements were done at predetermined times after addition of
AQUI-S to the system:
• 1 h after AQUI-S addition (P 1)
• 2 h after AQUI-S addition (P 2)
• 4 h after AQUI-S addition (P 4)
• 6 h after AQUI-S addition (P 6)
• 12 h after AQUI-S addition (P 12)
• 24 h after AQUI-S addition (P 24)
• 48 h after AQUI-S addition (P 48)
Ch3 Ch1

3
Figure 2. Addition of AQUI-S to RAS. AQUI-S stock solution was prepared (2L), and 500 ml was added directly to four 3.3 m3 tanks.
3 Methods and analyses
3.1 Water sampling and water quality measurements
Water samples were collected from two locations within the RAS, before and after the bioreactor, in order to measure removal efficiency of total ammonia nitrogen (TAN) and nitrite-nitrogen (NO2-N) by the bioreactor and isoeugenol concentration in the RAS water. One day prior to the start of the experiment silicone siphons were installed on the inlet water pipe in MBBR Chamber 1 (Ch 1, Fig.1) and at the outlet of the MBBR Chamber 3 (Ch 3, Fig. 1) for water sampling. Water quality measurements and water samples were taken simultaneously at the two sampling points at predetermined times specified in the experimental design.
The following water quality parameters were measured: pH, oxygen saturation, temperature and conductivity. The Sentix 980 IDS pH electrode and TetraCon 925-3 conductivity probe were connected to a WTW Multi 3410 hand-held meter and used to measure pH and temperature and conductivity (WTW, Oberbayern, Germany). An Oxyguard oxygen probe connected to the hand-held instrument (Oxyguard, Birkerød, Denmark) was used to measure oxygen saturation. The oxygen and pH probes were calibrated prior to each sampling.
In addition, two 50 ml water samples per location per time point were taken for analysis of TAN and NO2-N and one 100 ml sample per location per time point for AQUI-S concentrations. Alkalinity and turbidity were measured at the start (P-24 and P0) and the end of the trial (P48). Each collected water samples was analysed for TAN and NO2-N twice (two parallels) using an automated analyser (Flow Solution IV, OI Analytical, College Station, TX, USA), according to U.S. E.P.A Method 350.1 (U.S.EPA, 1983) for TAN and U.S. E.P.A Method 353.2 (U.S.EPA, 1983) for NO2-N. Turbidity was measured on fresh water samples using a Turbiquant 1500 IR (Merck, Darmstadt, Germany), while alkalinity was measured using the Hach alkalinity reagent

4
set and digital titrator (Hach, Loveland, Colorado, USA) according to APHA (1999). The TAN and NO2-N removal efficiencies were calculated according to formula: Concin- Concout Efficiency (%) = ---------------- x 100 Concin Where Concin represents TAN or NO2-N concentration in the MBBR inlet water (Ch.1 in) and Concout is concentration in the MBBR outlet water (Ch.3 out). Statistical analysis of data was done using JMP®Pro 9.0.0 (SAS 2010, SAS Institute Inc, Cary, USA).
3.2 AQUI-S concentration determination
Two potential methods for the analyses of the isoeugenol in water were identified (Meinertz and Hess, 2014). Although they were aimed to measure eugenol from AQUI-S® 20E these methods can be modified to measure isoeugenol. In that study (Meinertz and Hess, 2014), spectrophotometric and solid-phase extraction high pressure liquid chromatography methods (SPE-HPLC) were developed. It was shown that the presence of fish feed in the water can interfere with the accuracy and the precision of the spectrophotometric method and that the SPE-HPLC is more accurate when eugenol is measured in the water with low or moderate levels of fish feed. According to the European public MRL assessment report on isoeugenol (European Medicines Agency, 2011) a HPLC method is also used to determine residues of isoeugenol in muscle/skin of Atlantic salmon. During the trial at NCRA, feeding was stopped 24 h prior to the start of the experiment and the feed load was 53% of the maximum load the RAS was designed for (Terjesen et al., 2013), which should have help reduce the amount of the fish feed present in the recirculating water. In addition, 6.6 % of the system volume was exchanged during 24 h prior to the start of the experiment. Having this in mind, and in the agreement with the Scan Aqua the spectrophotometric method was method of choice for measurement of AQUI-S bio-stability and potential accumulation within RAS water. AQUI-S concentration in RAS water was determined according to a modified protocol (AQUI-S New Zealand Ltd., Lower Hutt, New Zealand) provided by Scan Aqua. The AQUI-S stock solution (500 mg isoeugenol L-1) was prepared by weighing 1.0008 g of AQUI-S in 1L of deionized water. The stock solution was diluted using RAS and deionized water to prepare two standard series of 0, 2.5, 5, 10, 20 and 30 mg isoeugenol L-1. Standards were diluted with analytical grade ethanol (1:1 v/v), mixed well and filtered using 0.45µm RC syringe filters (Whatman International Ltd., Maidstone, UK) directly into quartz cuvette as described in the protocol. Absorbance was measured at 254 nm using a Nicolet
Figure 3. Standard and sample preparation for measurement of AQUI-S concentration

5
Evolution 500 UV–vis spectrophotometer (Thermo Electron Corporation, Marietta, Ohio, USA). Higher absorbance values were recorded for standards prepared with RAS water and the largest difference was measured at lower AQUI-S concentrations (Fig. 4). Having in mind that the concentration of AQUI-S in the system was in the lower end of the standard curve and that the measured absorbance range differed from the one provided by Scan Aqua, a standard curve was made for each of the time points (P0 to P48) and each sampling point (Ch1 and Ch3 of MBBR) using RAS water in order to determine concentration of AQUI-S within the system.
Figure 4.
Difference in
measured
absorbance for
AQUI-S standard
series made with
deionized and RAS
water.
4 Results
4.1 AQUI-S stock solution preparation and addition to the RAS
The AQUI-S product arrived with an instruction sheet containing valuable information regarding optimal use and dosing. The sheet recommended that a stock solution is made from the concentrated AQUI-S solution to ensure rapid and uniform mixing of the anaesthetic within the water column. The stock solution is then added to the water forming the anaesthetic working solution. A number of standard series were made in the lab for the purpose of this trial. It was noted that preparation of the stock solution of AQUI-S by volume was not as accurate as when the stock solution was made by weighing concentrated AQUI-S solution. Several methods for preparation of the stock solution are described on the AQUI-S New Zealand LTD webpage (http://www.aquis.com/images/aquis/Products/AQUIS_bath_preparation.pdf) and preparing stock solution by weight should be recommended as more accurate and easier method for commercial use in aquaculture.
Figure 5 (on the next page). Foam formation at the surface of the recirculating water after addition of AQUI-S directly to the rearing tanks of the recirculating aquaculture system (RAS). Images were taken at three different parts of the RAS: mechanical belt filter, Chamber 1 and Chamber 3 of the moving bed bioreactor (MBBR) at different time points after AQUI-S addition (A-H).
80%
90%
100%
110%
120%
130%
140%
0 5 10 15 20 25 30
∆ A
bso
rban
ce (
%)
AQUI-S concentration (mg isoeugenol/L)

6
30 min
01 h
02 h 04 h 06 h
12 h
24 h
48 h
Mechanical filter MBBR Chamber 1 MBBR Chamber 3
A
B
C
D
E
F
G
H
7
In this trial the AQUI-S stock solution was prepared by weighing AQUI-S concentrate, diluting in deionized water and mixing before it was divided in four equal parts and added to four rearing tanks as described in section 2 and 3.1. The stock solution was added to the water surface and formation of foam was not observed in any of the tanks used in the experiment. However, large amounts of foam were observed at the water surface prior to the belt filter and within the MBBR chambers 30 minutes (Fig.5A) and one hour (Fig.5B) after AQUI-S was added to recirculation water. The regular movement of the biomedia within the MBBR chambers is maintained by continuous aeration; however within the first hour after AQUI-S addition it was notably reduced. The amount of foam was reduced after two hours and was present only in the MBBR (Fig.5C). The same trend was observed throughout the trial (Fig.5D-H) and after 48h the foam was mostly noticeable in the Chamber 3 of the MBBR (Fig.5H).
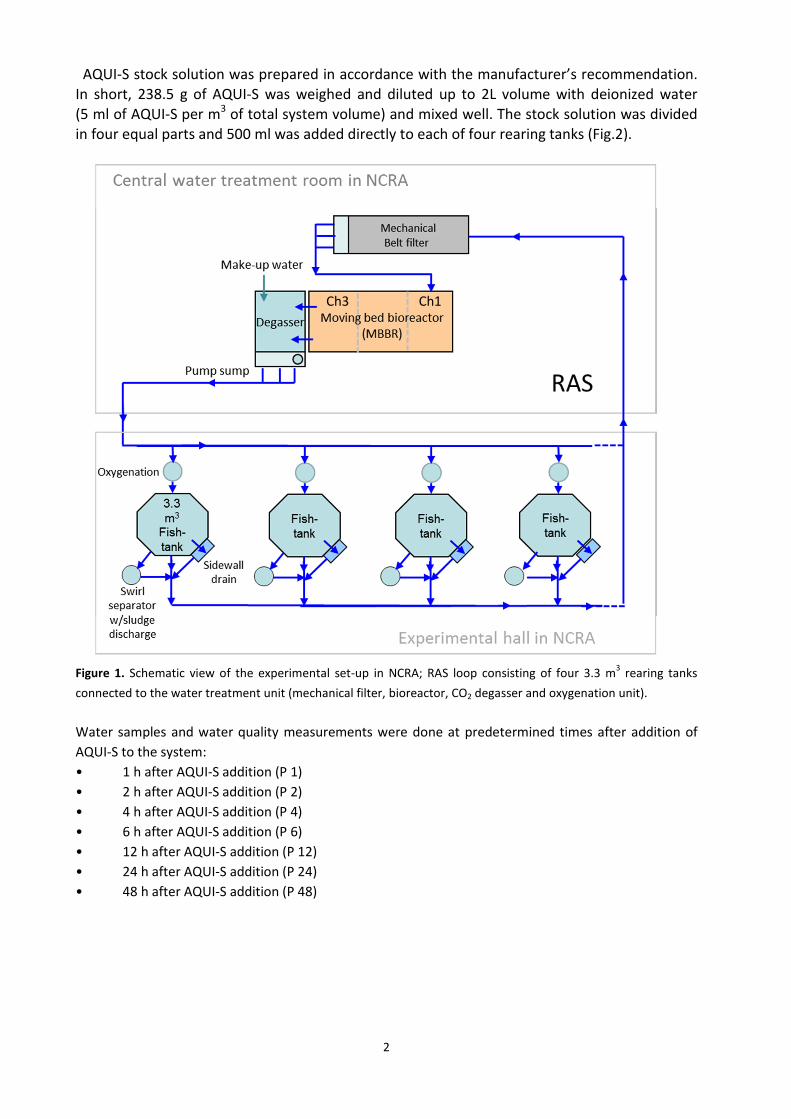
4.2 Concentration of AQUI-S in the recirculating water within 48 h post-addition
The starting concentration of AQUI-S in RAS water was 2.7 mg isoeugenol L-1. Having in mind the total system volume of the RAS and the total RAS flow, 87 minutes were necessary for the mixing of AQUI-S in the whole system volume. Within one hour after AQUI-S was added to the system, the measured concentrations of the anaesthetic were 2 and 2.2 mg isoeugenol L-1 at the MBBR inlet (Ch.1) and outlet (Ch.3) water (Fig.9). The reason for such a decrease in concentration could both be the degradation or conversion of AQUI-S and/or that the anaesthetic did not mix similarly in different parts of the system volume. The rapid decrease in concentration continued and 1.9 and 1.4 mgL-1 AQUI-S were measured in water collected two hours post-addition before MBBR Ch.1 and after MBBR Ch.3, respectively. Only 14% and 13% of the starting AQUI-S concentration remained in the MBBR inlet and outlet water after six hours of the experiment. At the end of the trial (after 48 h) AQUI-S was still detectable in the RAS water before and after MBBR at low concentration of 0.2 mg isoeugenol L-1.
Based on the difference in AQUI-S concentration between incoming and outlet water from the MBBR during the first four hours of the experiment it is likely that the microbial community
Figure 9. Concentration of AQUI-S in the recirculating water measured 1,2,4,6,12,24, and 48 h post-addition to the RAS. Measurements were taken simultaneously at the moving bed bioreactor (MBBR) chamber 1 (MBBR Ch.1) and chamber 3 (MBBR Ch.3).
Iso
euge
nol c
on
cen
trat
ion
(mg
L-1)

8
within the bioreactor contributed to the degradation or conversion of the isoeugenol, which is the active component of the AQUI-S.
4.3 Effect of AQUI-S on water quality and TAN/NO2-N removal efficiency of the MBBR
Water quality within the RAS slightly changed after feeding was stopped and fish were removed from the system (Fig. 6 and 7). Addition of AQUI-S to RAS water was followed by decrease in oxygen saturation, increase in conductivity and oscillation in pH within the first six hours of the experiment (Fig.6). The turbidity increased from 0.5 and 0.6 NTU in Ch.1 and Ch.3 at P-24 to 0.7 NTU at both sampling locations and further on to 1.0 and 1.1 NTU at P48 in Ch.1 and Ch.3, respectively. Measured alkalinity (data not shown) at P-24 was 43 and 31mg L-1 as CaCO3 in MBBR incoming water (Ch.1) and in the water leaving MBBR (Ch.3). The difference in alkalinity between the two sampling locations at P0 (42 and 41 mg L-1 as CaCO3 for Ch.1 and Ch.3) was negligible and at P48 33 mg L-1 as CaCO3 was measured in water sampled at both locations. A tendency for increase in TAN concentration (p<0.1) was visible within one hour after AQUI-S addition, when TAN in the Ch.1 reached approximately two times initial concentration. Level of NO2-N measured at both locations one day before the start of the experiment (P-24) was significantly higher (p<0.05) compared to subsequent time points.
Figure 6. Measured temperature, pH, oxygen saturation and conductivity one day before the start of the experiment and during 48 h after AQUI-S addition to RAS. Measurements were taken simultaneously at the moving bed bioreactor chamber 1 (Ch.1) and chamber 3 (Ch.3).
A
B
C
D

9
The concentration of NO2-N measured at the start of the experiment (P0) was significantly lower than concentrations measured after two and four hours after addition of AQUI-S, both when it comes to MBBR inlet (p=0.001) and MBBR outlet water (p=0.0013). A peak concentration of NO2-N was noted after two hours of the experiment (Fig.7). However, the concentrations of nitrogenous compounds remained relatively low (<0.2mg L-1 TAN and <0.07 mg L-1 NO2-N) and within recommended values issued by Norwegian Food Safety Authorities at all times during the experiment.
The TAN and NO2-N removal efficiencies prior to the start of the experiment (P-24) were 27% and 5%, respectively. Already at the start of the experiment (P0) reduced TAN and NO2-N removal efficiencies were noted in response to the reduced incoming concentrations of nitrogenous compounds after feeding was stopped. During first 12 hours of the experiment TAN removal efficiency oscillated between 3 and 30 % while steady increase in removal efficiency was noted after 12 h of the experiment (Fig.8). The drop in the NO2-N removal efficiency was also noted during first 24 hours of the experiment. The slow increase in removal of NO2-N followed steady increase in TAN removal efficiency (Fig.8). However, statistical analysis showed that TAN and NO2-N removal efficiencies after addition of AQUI-S were not significantly different then at the start of the experiment (P0) (p=0.3 and p=0.135 for TAN and NO2-N removal efficiency, respectively).
Figure 7. Concentration of
total ammonia nitrogen
(TAN) and nitrite nitrogen
(NO2-N) in the moving bed
bioreactor (MBBR) incoming
water (MBBR Ch.1) and
water leaving the bioreactor
(MBBR Ch.3) one day before
the experiment (-24 hours),
at the start of the experiment
(0 hours) and during 48 h
post AQUI-S addition (1-48
hours).

10
Figure 8. Moving bed bioreactor (MBBR) total ammonia nitrogen (TAN) and nitrite nitrogen (NO2-N) removal efficiencies (%) one day before the experiment (-24 hours), at the start of the experiment (0 hours) and during 48 h post AQUI-S addition (1-48 hours).
5 Concluding remarks
This study was done in NCRA with the aim to investigate if the efficiency of nitrogen compound removal was affected by AQUI-S, and the stability and potential accumulation of the anaesthetic
within RAS water. A RAS with a fully mature MBBR and low daily water exchange volume (6.6 %) was used in the trial. The fish were removed from the system one day prior to the start of the experiment to mimic the commercial conditions and to limit the amount of feed available in the system that could in turn affect the spectrophotometric measurements of AQUI-S concentration in the RAS water.
The initial concentration of AQUI-S in the RAS water was 5 ml/m3 total system volume, corresponding to 2,7 mg isoeugenol L-1. This represents the maximum load of Aqui-S that theoretically will be added to a RAS; usually only a few tanks in the circuit will be medicated at once, not the entire system. Six hours after addition of AQUI-S, 86-87% of the isoeugenol was degraded or converted although the total water exchange within RAS was very low (6.6 %). It is therefore anticipated that in commercial RAS where the level of total daily water exchange might be higher, the depletion of AQUI-S from water would occur even faster.
The water quality and the removal of the TAN and NO2-N were affected particularly during first 12h of the experiment. One of the reasons for the disturbance of the bioreactor function could be the observed foam formation that was visible prior and in all three chambers of the MBBR within 30 minutes after addition of the AQUI-S (Fig. 5). Foaming is likely caused by the emulsifier component of Aqui-S. Consequently, the difficulty in the mixing within the MBBR could have transiently affected operation of the bioreactor. In addition, the low and decreasing concentration of nitrogenous compounds within the system (lack of feeding and fish) is not favourable for the nitrification process within bioreactor. However, it is important to stress that certain amount of nitrogenous compounds was removed at all times. The noted significant increase in concentration on NO2-N and tendency for increase in concentration of TAN after
0
5
10
15
20
25
30
35
-24 0 1 2 4 6 12 24 48
Rem
ova
l eff
icie
ncy
(%
)
Time after AQUI-S addtion (h)
TAN
NO2-N

11
addition of AQUI-S, were low in absolution terms, and within recommended values issued by Norwegian Food Safety Authorities at all times during the experiment. However, the TAN concentration increased approximately two times. Hence, during use of AQUI-S, a best management practice may be to ensure that TAN is below 1 mg L-1 before AQUI-S addition to the system, to avoid increases in TAN above 2 mg L-1, the current recommended limit in Norway. Concurrently, pH should not be above 7.5, thus keeping NH3-N below 14 µg NH3-N (Kolarevic et al, 2013), as well as monitoring also other compounds, such as CO2. However, these practices will likely be most important during the first hours after AQUI-S addition, when oscillations in TAN and NO2-N removal efficiencies were observed. However, no significant change in the efficiency of nitrogen compound removal was noted after addition of AQUI-S to RAS water and a steady increase in removal efficiency was recorded after 12 and 24 h for TAN and NO2-N, respectively.
Preparation of the AQUI-S stock solution is a part of the procedure recommended by the manufacturer. In order to secure adequate and most accurate preparation of the stock solution weighing of AQUI-S is recommended.
If the AQUI-S concentration is measured using spectrophotometric method in RAS previously containing fish, a series of standard solutions of the known concentration (preferably in the range of the used AQUI-S concentration) prepared with RAS water should be used.
• The study indicates that Aqui-S is readily degraded by RAS bioreactors, minimizing the risk of isoeugenol accumulating following sequential medication of fish tanks in the RAS
• AQUI-S used at doses recommended for sedation is not likely to have serious effects on bioreactor within 48 hours following its use in RAS
• Increased foaming in the moving bed bioreactor during the first hours following Aqui-S administration might cause or contribute to a transient reduction in TAN and NO2 clearance. Therefore, in RAS with an MBBR, attempts should be made to reduce the formation of foam at the water surface, since this may have negative effects on the bioreactor operation. Anti-foaming agents are commercially available.
6 References
European Medicines Agency Committee for Medical Products for Veterinary Use, 2011. European public MRL assessment report (EPMAR) Isoeugenol (fin fish), p. 13: http://www.ema.europa.eu/docs/en_GB/document_library/Maximum_Residue_Limits_-_Report/2011/05/WC500106362.pdf
Kolarevic, J., Selset, R., Felip, O., Good, C., Snekvik, K., Takle, H., Ytteborg, E., Bæverfjord, G., Åsgård, T.,
Terjesen, B.F., 2013. Influence of long term ammonia exposure on Atlantic salmon (Salmo salar L.) parr growth and welfare. Aquaculture Research. 44, 1649-1664.
Meinertz, J.R., Hess, K.H., 2014. Evaluation of analytical techniques to determine AQUI-S® 20E (eugenol)
concentration in water. Aquaculture 418-419, p.62-66.
Terjesen, B.F., Summerfelt, S.T., Nerland, S., Ulgenes, Y., Fjæra, S.O., Megård Reiten, B.K., Selset, R., Kolarevic, J., Brunsvik, P., Bæverfjord, G., Takle, H., Kittelsen, A., Åsgård, T., 2013. Design, dimensioning, and performance of a research facility for studies on the requirements of fish in RAS environments. Aquacult. Eng. 54, 49-63.