Embed Size (px)
Citation preview
University of Pennsylvania Carey Law School University of Pennsylvania Carey Law School
Penn Law: Legal Scholarship Repository Penn Law: Legal Scholarship Repository
Faculty Scholarship at Penn Law
2015
The Effect of Any Willing Provider and Freedom of Choice Laws The Effect of Any Willing Provider and Freedom of Choice Laws
on Prescription Drug Expenditures on Prescription Drug Expenditures
Jonathan Klick University of Pennsylvania Carey Law School
Joshua D. Wright George Mason University
Follow this and additional works at: https://scholarship.law.upenn.edu/faculty_scholarship
Part of the Health Law and Policy Commons, Law and Economics Commons, and the
Pharmacoeconomics and Pharmaceutical Economics Commons
Repository Citation Repository Citation Klick, Jonathan and Wright, Joshua D., "The Effect of Any Willing Provider and Freedom of Choice Laws on Prescription Drug Expenditures" (2015). Faculty Scholarship at Penn Law. 438. https://scholarship.law.upenn.edu/faculty_scholarship/438
This Article is brought to you for free and open access by Penn Law: Legal Scholarship Repository. It has been accepted for inclusion in Faculty Scholarship at Penn Law by an authorized administrator of Penn Law: Legal Scholarship Repository. For more information, please contact [email protected].
Electronic copy available at: http://ssrn.com/abstract=2183279
1
THE EFFECT OF ANY WILLING PROVIDER AND FREEDOM OF CHOICE LAWS ON HEALTH CARE EXPENDITURES
Jonathan Klick and Joshua D. Wright
Abstract: Any Willing Provider and Freedom of Choice laws restrict the ability of managed care
entities, including pharmacy benefit managers, to selectively contract with providers. The
managed care entities argue this limits their ability to generate cost savings, while proponents of
the laws suggest that such selective contracts limit competition, leading to an increase in
aggregate costs. We examine the effect of state adoption of such laws on total state healthcare
spending, finding that any willing provider/ freedom of choice laws are associated with cost
increases of at least 3 percent. These results suggest that these laws are harmful from a spending
perspective.
Professor, University of Pennsylvania School of Law. Professor, George Mason University School of Law and Department of Economics. We thank Angela Diveley and Nate Harris for research assistance.
Electronic copy available at: http://ssrn.com/abstract=2183279
2
I. INTRODUCTION
Expenditures on health care in the United States have reached an all-time high. Finding
ways to stem these costs has become an issue of great economic importance. One potential
solution that addresses this problem before costs become unsustainable: pharmacy benefit
managers (“PBMs”). PBMs facilitate agreements among pharmaceutical manufacturers, retail
pharmacies, and health plan sponsors (DOJ & FTC 2004). They engage in selective contracting
to create networks of these providers, which in turn participate in specified plans to distribute
health care services and pharmaceutical drugs to patients who subscribe to the plans.
PBMs represent health plan sponsors in relations with pharmaceutical manufacturers and
retail pharmacies. They negotiate with pharmaceutical manufacturers and obtain lower prices for
prescription medications due to their ability to make high-volume purchases for distribution
within the network. Additionally, they facilitate administration of pharmacy services on the
health plan sponsors’ behalf. Membership in a given PBM network is often highly exclusive
(Klick & Wright 2012). There is evidence this characteristic contributes to PBMs’ ability to
provide consumers access to prescription drugs more efficiently and at a lower cost than would
otherwise be possible (GAO 2003).1 The more exclusive the network, the higher the volume of a
prescription drug a member manufacturer can expect to sell and the more customers a member
pharmacy can expect to serve (FTC 2005). Thus, bidding for membership in a network is highly
competitive, leading bidders to offer steep discounts, the savings from which are generally
passed on to consumers (Majoras 2005).
The exclusivity of PBM networks, however, also carries the potential to harm consumers
in the form of depriving them of adequate access to their choice of pharmacies from which they
1 PBMs are able to negotiate deeper discounts in retail pharmacy payments due to its smaller, more exclusive network (GAO 2003).
3
can obtain their prescriptions (Balto 2011). Furthermore, smaller, independent pharmacies are
often the pharmacies that are excluded from membership (House Committee on the Judiciary
2007). This exclusion raises concerns that competitors are being deprived of the opportunity to
compete and that consumers are being deprived of the quality of service they seek.
In response to these concerns, many states have adopted so-called any-willing-provider
(“AWP”) laws and freedom-of-choice (“FOC”) laws. AWP laws require managed care sponsors
to allow any provider into their networks that is willing to meet the networks’ terms of
membership.2 FOC laws allow an insured individual (“enrollee”) to choose any provider they
want regardless of if they are in the managed care sponsors’ network. These laws frequently
apply to pharmaceutical services and thereby prohibit PBMs from excluding pharmacies that
enrollees choose or pharmacies that are willing to accept the terms PBMs offer. Recently, “The
Pharmacy Competition and Consumer Choice Act of 2011” proposed similar legislation on the
national level (U.S. Congress 2011). Like state AWP laws, this bill prohibits PBMs from
“exclud[ing] an otherwise qualified pharmacist or pharmacy from participation in a particular
network provided that the pharmacist or pharmacy . . . accepts the terms, conditions and
reimbursement rates of the PBM . . . .” Proponents of AWP/FOC laws argue they increase
consumer choice by giving consumers a greater variety of providers from which to choose (Balto
2011). They also argue AWP/FOC laws contribute to decreased costs and permit providers to
offer higher quality service.
2 “Every . . . health care provider . . . shall have the right to become a participating physician or approved health care provider . . . under such terms or conditions as are imposed on other participating physicians or approved health care providers” (GA. CODE ANN. § 33-20-16 (2010)). “No hospital, physician or type of provider . . . willing to meet the terms and conditions offered to it or him shall be excluded” (VA. CODE ANN. § 38.2-3407 (2008)). “No policy of group health insurance providing benefits for hospital and medical expenses . . . may . . . [p]revent any person who is a party to or beneficiary of any health insurance policy from selecting a licensed pharmacy of his choice to furnish the pharmaceutical services offered under any policy or plan . . .” (South Dakota 1990).
4
The Federal Trade Commission (“FTC”) has long advocated against AWP/FOC laws,
arguing the competitive and potential cost advantages of network exclusivity are hindered when
managed care sponsors are forced to allow any willing provider into their networks or to accept
any provider that enrollees choose (FTC 1993). Moreover, empirical studies suggest AWP/FOC
laws increase state per capita health care expenditures and, in particular, pharmaceutical
expenditures. In one study, Durrance (2009) found an increase in per capita health spending
following the passage of AWP laws. She also found an increase in pharmaceutical spending that
was larger in states that passed laws applicable to pharmacies than in states that passed no such
laws. In another study, Vita (2001) similarly found an increase in per capita health spending in
states that passed stringent AWP/FOC laws. The existing evidence suffers from some key
limitations. Notably, the Vita study was conducted using techniques that are now out of date.
We update the existing evidence using more modern econometric techniques to identify
causal relationships between AWP/FOC laws and health care costs. Consistent with Vita, we
find a large positive effect of AWP/FOC laws on health care expenditures. In fact, we find a
larger effect on per capita health expenditures than that in the Vita study.
We also consider the category-specific effects of AWP/FOC laws on physician, hospital,
and prescription-drug spending. We are especially interested in the effect on the prescription-
drug industry because of the bill Congress is considering that will apply to pharmacies and
PBMs. We find statistically significant increases in physician, hospital, and prescription-drug
spending.
II. AWP AND FOC LAWS
AWP and FOC laws change the structure of the health care market by forcing managed
care sponsors to cover more health care providers, pharmacies included. AWP laws require
5
managed care sponsors to cover all providers that are willing to accept the same terms that the
managed care sponsors’ network providers receive (FTC & DOJ 2004; Vita 2001; Klilck &
Wright 2012). For example, if a hospital agrees to the terms a managed care sponsor pays the
hospitals in its network, the managed care sponsor must accept the hospital and pay it the same
rate the managed care sponsor pays other hospitals in its network (Durrance 2009). FOC laws
allow enrollees the right to choose any provider that it wants and managed care sponsors must
pay that provider the same rate that they pay providers in their networks (Hellinger1995). Thus,
if an enrollee chooses to go to a non-network pharmacy, the managed care sponsor must pay the
pharmacy the same rate that it would pay its network pharmacies. If the non-network pharmacy
charges more than the managed care sponsor pays its network pharmacies, the enrollee pays the
difference.
The purpose of AWP/FOC laws is to force managed care sponsors to contract with
community and independent providers, allegedly resulting in more choices, lower prices, and
higher quality service (Balto 2011; Klick & Wright 2012: Blumenreich 2003; Rodgers & Weiner
2011).3 Proponents of AWP/FOC laws argue that managed care sponsors and PBMs are driving
community and independent providers out of the market by only including large providers in
their networks (Blumenreich 2003; Marsteller et al. 1997; FTC & DOJ 2004). Allegedly,
without small providers, prices will increase because there is not a competitive check on the
larger providers that contract with managed care companies (National Community Pharmacists
Association 2011). Fewer small providers decrease the quality of health care service because
3 “Commission staff has expressed concerns about AWP and FOC laws, noting that they could have anticompetitive effects and harm consumers. . . . These restrictions on competition may result in insurance companies paying higher fees to providers, which in turn generally results in higher premiums, and may increase the number of uninsured Americans” (FTC & DOJ 2004).
6
there are fewer competing firms and because community providers allegedly provide high
quality service (Rodgers & Weiner 2011).
These arguments have convinced some policymakers at the federal and state levels
(Durrance 2009; Klick & Wright 2012). Congress adopted an AWP provision when it enacted
Medicare Part D (Balto 2011). Furthermore, the proposed Pharmacy Competition and Consumer
Choice Act of 2011 includes an AWP provision that applies to PBMs creating pharmacy
networks (U.S. Congress 2011). At the state level, AWP laws have been implemented for
several decades and it is estimated that most state now has an AWP or FOC law in its insurance
code (Marsteller et al. 1997).
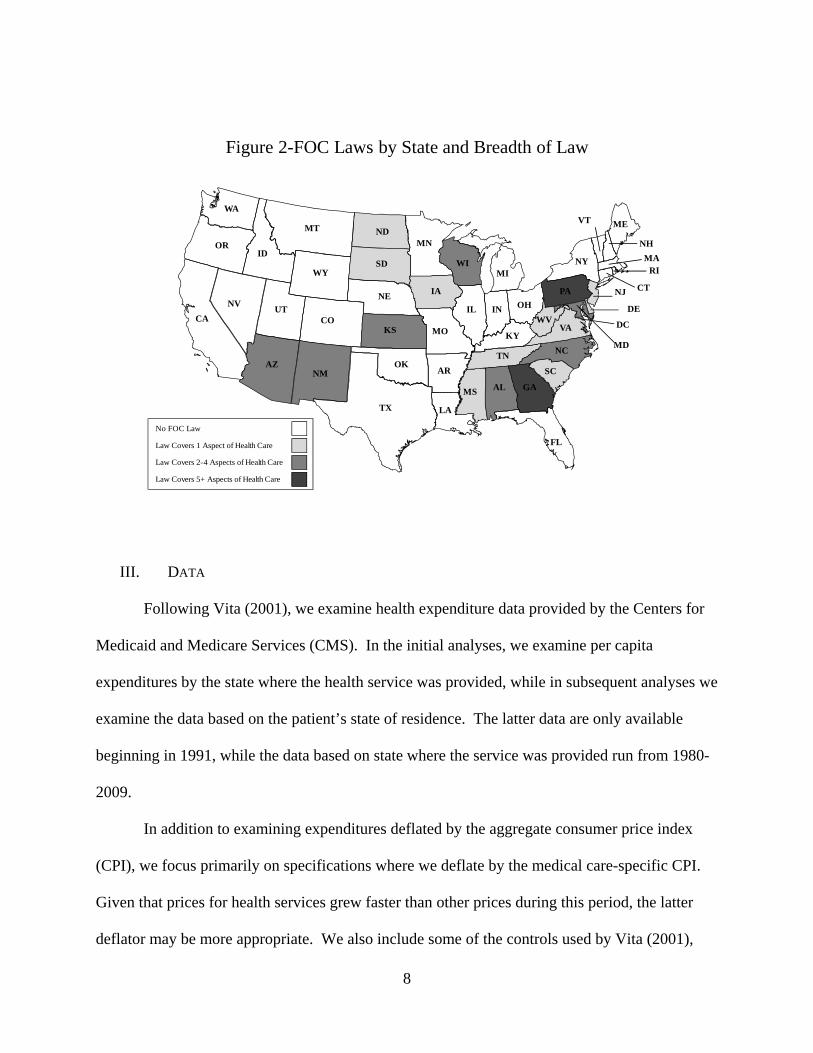
AWP/FOC laws are not all the same. The laws vary from state to state in terms of
applicability and enforcement. Applicability refers to how many aspects of health care are
covered by the law (Vita 2001).4 Some laws narrowly focus on a single provider class such as
optometrists5 or pharmacists.6 Other laws define providers broadly and include nearly every
imaginable aspect of health care.7 There is of course, a range of AWP laws that fall between
both these examples (Marsteller et al. 1997). Not all AWP/FOC laws identically apply to
4 “[A]n AWP law can either greatly interfere with regular plan operations or have little effect in practice. The strongest versions require plans to accept all providers who apply to participate . . . . Less restrictive or weaker forms of these laws allow health plans to limit the number and classes of providers to some degree . . . .” (Marsteller et al. 1997). 5 “No agency . . . shall deny to the recipients or beneficiaries of their aid or services the freedom to choose a duly licensed optometrist . . . as the provider of care or services which are within the scope of practice of the profession of optometry as defined in this Chapter” (North Carolina). 6 “[N]o provider of pharmaceutical services . . . who complies with the terms and conditions established by the . . . contracting health maintenance organizations and prepaid health plans shall be excluded from contracting for the provision of pharmaceutical services . . .” (Colorado). 7 “’Health care provider’ or ‘provider’ means those individuals or entities licensed by the State of Arkansas to provide health care services, limited to the following:(A) Advanced practice nurses;(B) Athletic trainers;(C) Audiologists;(D) Certified orthotists;(E) Chiropractors;(F) Community mental health centers or clinics;(G) Dentists;(H) Home health care;(I) Hospice care;(J) Hospital-based services;(K) Hospitals;(L) Licensed ambulatory surgery centers;(M) Licensed certified social workers;(N) Licensed dieticians;(O) Licensed durable medical equipment providers;(P) Licensed professional counselors;(Q) Licensed psychological examiners;(R) Long-term care facilities;(S) Occupational therapists;(T) Optometrists;(U) Pharmacists;(V) Physical therapists;(W) Physicians and surgeons (M.D. and D.O.);(X) Podiatrists;(Y) Prosthetists;(Z) Psychologists;(AA) Respiratory therapists;(BB) Rural health clinics;(CC) Speech pathologists; and(DD) Other health care practitioners as determined by the department in regulations promulgated under the Arkansas Administrative Procedure Act” (Arkansas).
7
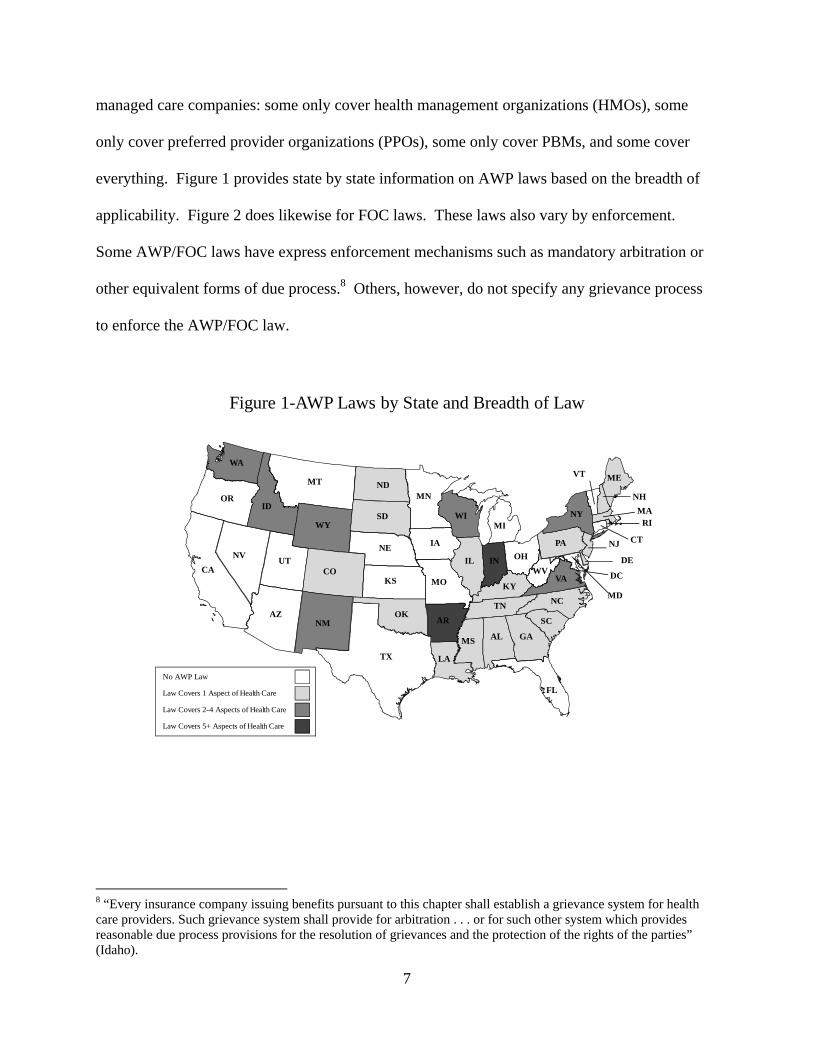
managed care companies: some only cover health management organizations (HMOs), some
only cover preferred provider organizations (PPOs), some only cover PBMs, and some cover
everything. Figure 1 provides state by state information on AWP laws based on the breadth of
applicability. Figure 2 does likewise for FOC laws. These laws also vary by enforcement.
Some AWP/FOC laws have express enforcement mechanisms such as mandatory arbitration or
other equivalent forms of due process.8 Others, however, do not specify any grievance process
to enforce the AWP/FOC law.
Figure 1-AWP Laws by State and Breadth of Law
WA
MT
WY
OR
NV
CA
ID
UT
AZ
CO
NM
ND
SD
NE
KS
MN
IA
TX
MO
AR
WI
IL
LA
MI
IN OH
KY
MS AL GA
TN
SC
PA
NC
VAWV
NY
ME
NH
VT
MARI
NJ CT
MD
OK
DE
DC
FL
No AWP Law
Law Covers 1 Aspect of Health Care
Law Covers 2-4 Aspects of Health Care
Law Covers 5+ Aspects of Health Care
8 “Every insurance company issuing benefits pursuant to this chapter shall establish a grievance system for health care providers. Such grievance system shall provide for arbitration . . . or for such other system which provides reasonable due process provisions for the resolution of grievances and the protection of the rights of the parties” (Idaho).
8
Figure 2-FOC Laws by State and Breadth of Law
WA
MT
WY
OR
NV
CA
ID
UT
AZ
CO
NM
ND
SD
NE
KS
MN
IA
TX
MO
AR
WI
IL
LA
MI
IN OH
KY
MS AL GA
TN
SC
PA
NC
VAWV
NY
ME
NH
VT
MARI
NJ CT
MD
OK
DE
DC
FL
No FOC Law
Law Covers 1 Aspect of Health Care
Law Covers 2-4 Aspects of Health Care
Law Covers 5+ Aspects of Health Care
III. DATA
Following Vita (2001), we examine health expenditure data provided by the Centers for
Medicaid and Medicare Services (CMS). In the initial analyses, we examine per capita
expenditures by the state where the health service was provided, while in subsequent analyses we
examine the data based on the patient’s state of residence. The latter data are only available
beginning in 1991, while the data based on state where the service was provided run from 1980-
2009.
In addition to examining expenditures deflated by the aggregate consumer price index
(CPI), we focus primarily on specifications where we deflate by the medical care-specific CPI.
Given that prices for health services grew faster than other prices during this period, the latter
deflator may be more appropriate. We also include some of the controls used by Vita (2001),
9
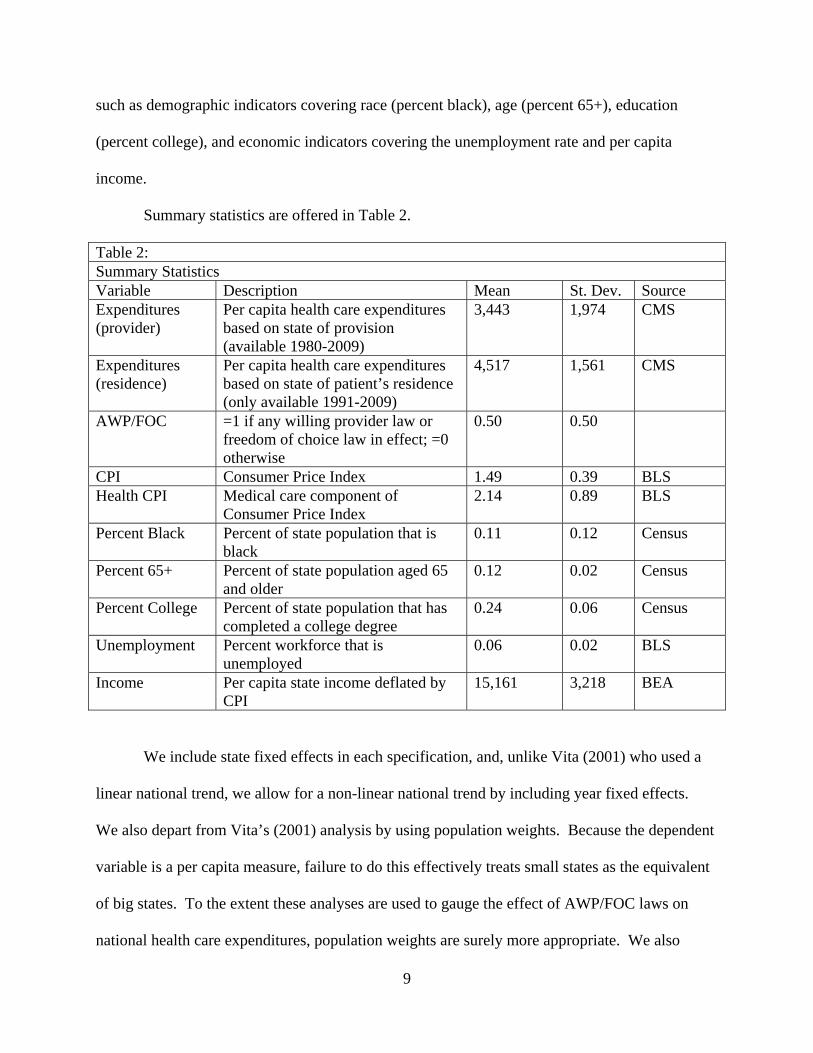
such as demographic indicators covering race (percent black), age (percent 65+), education
(percent college), and economic indicators covering the unemployment rate and per capita
income.
Summary statistics are offered in Table 2.
Table 2: Summary Statistics Variable Description Mean St. Dev. Source Expenditures (provider)
Per capita health care expenditures based on state of provision (available 1980-2009)
3,443 1,974 CMS
Expenditures (residence)
Per capita health care expenditures based on state of patient’s residence (only available 1991-2009)
4,517 1,561 CMS
AWP/FOC =1 if any willing provider law or freedom of choice law in effect; =0 otherwise
0.50 0.50
CPI Consumer Price Index 1.49 0.39 BLS Health CPI Medical care component of
Consumer Price Index 2.14 0.89 BLS
Percent Black Percent of state population that is black
0.11 0.12 Census
Percent 65+ Percent of state population aged 65 and older
0.12 0.02 Census
Percent College Percent of state population that has completed a college degree
0.24 0.06 Census
Unemployment Percent workforce that is unemployed
0.06 0.02 BLS
Income Per capita state income deflated by CPI
15,161 3,218 BEA
We include state fixed effects in each specification, and, unlike Vita (2001) who used a
linear national trend, we allow for a non-linear national trend by including year fixed effects.
We also depart from Vita’s (2001) analysis by using population weights. Because the dependent
variable is a per capita measure, failure to do this effectively treats small states as the equivalent
of big states. To the extent these analyses are used to gauge the effect of AWP/FOC laws on
national health care expenditures, population weights are surely more appropriate. We also
10
cluster standard errors at the state level to account for any serial dependence in spending within a
state.
IV. ANALYSIS AND DISCUSSION
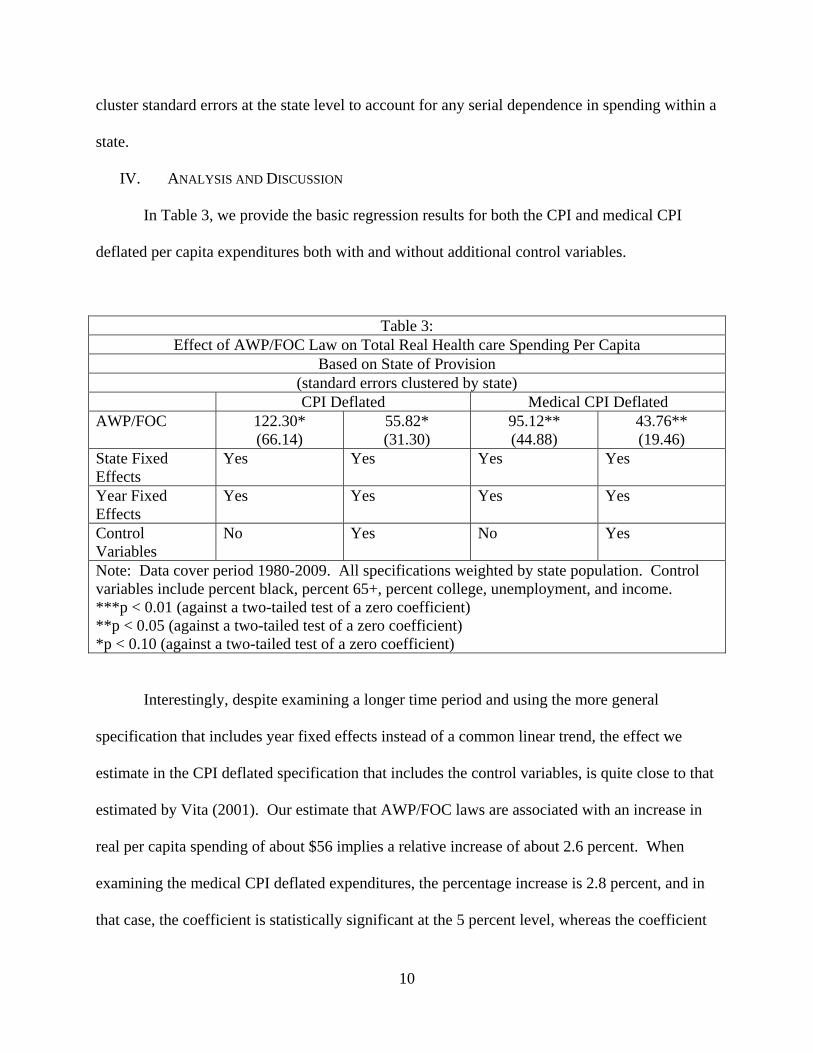
In Table 3, we provide the basic regression results for both the CPI and medical CPI
deflated per capita expenditures both with and without additional control variables.
Table 3: Effect of AWP/FOC Law on Total Real Health care Spending Per Capita
Based on State of Provision (standard errors clustered by state)
CPI Deflated Medical CPI Deflated AWP/FOC 122.30*
(66.14) 55.82* (31.30)
95.12** (44.88)
43.76** (19.46)
State Fixed Effects
Yes Yes Yes Yes
Year Fixed Effects
Yes Yes Yes Yes
Control Variables
No Yes No Yes
Note: Data cover period 1980-2009. All specifications weighted by state population. Control variables include percent black, percent 65+, percent college, unemployment, and income. ***p < 0.01 (against a two-tailed test of a zero coefficient) **p < 0.05 (against a two-tailed test of a zero coefficient) *p < 0.10 (against a two-tailed test of a zero coefficient)
Interestingly, despite examining a longer time period and using the more general
specification that includes year fixed effects instead of a common linear trend, the effect we
estimate in the CPI deflated specification that includes the control variables, is quite close to that
estimated by Vita (2001). Our estimate that AWP/FOC laws are associated with an increase in
real per capita spending of about $56 implies a relative increase of about 2.6 percent. When
examining the medical CPI deflated expenditures, the percentage increase is 2.8 percent, and in
that case, the coefficient is statistically significant at the 5 percent level, whereas the coefficient
11
in the specifications using the aggregate CPI to deflate expenditures is only statistically
significant at the 10 percent level.
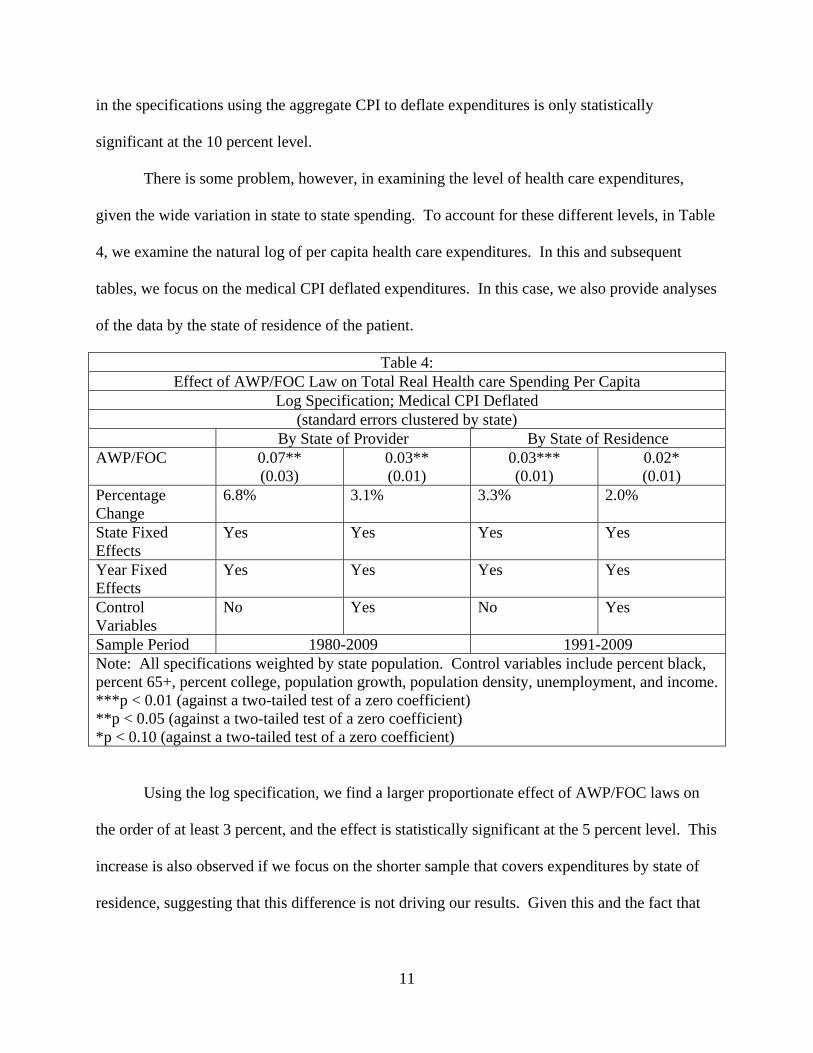
There is some problem, however, in examining the level of health care expenditures,
given the wide variation in state to state spending. To account for these different levels, in Table
4, we examine the natural log of per capita health care expenditures. In this and subsequent
tables, we focus on the medical CPI deflated expenditures. In this case, we also provide analyses
of the data by the state of residence of the patient.
Table 4: Effect of AWP/FOC Law on Total Real Health care Spending Per Capita
Log Specification; Medical CPI Deflated (standard errors clustered by state)
By State of Provider By State of Residence AWP/FOC 0.07**
(0.03) 0.03** (0.01)
0.03*** (0.01)
0.02* (0.01)
Percentage Change
6.8% 3.1% 3.3% 2.0%
State Fixed Effects
Yes Yes Yes Yes
Year Fixed Effects
Yes Yes Yes Yes
Control Variables
No Yes No Yes
Sample Period 1980-2009 1991-2009 Note: All specifications weighted by state population. Control variables include percent black, percent 65+, percent college, population growth, population density, unemployment, and income.***p < 0.01 (against a two-tailed test of a zero coefficient) **p < 0.05 (against a two-tailed test of a zero coefficient) *p < 0.10 (against a two-tailed test of a zero coefficient)
Using the log specification, we find a larger proportionate effect of AWP/FOC laws on
the order of at least 3 percent, and the effect is statistically significant at the 5 percent level. This
increase is also observed if we focus on the shorter sample that covers expenditures by state of
residence, suggesting that this difference is not driving our results. Given this and the fact that
12
the provider based data allows for a longer sample period, we focus attention on this metric
going forward.
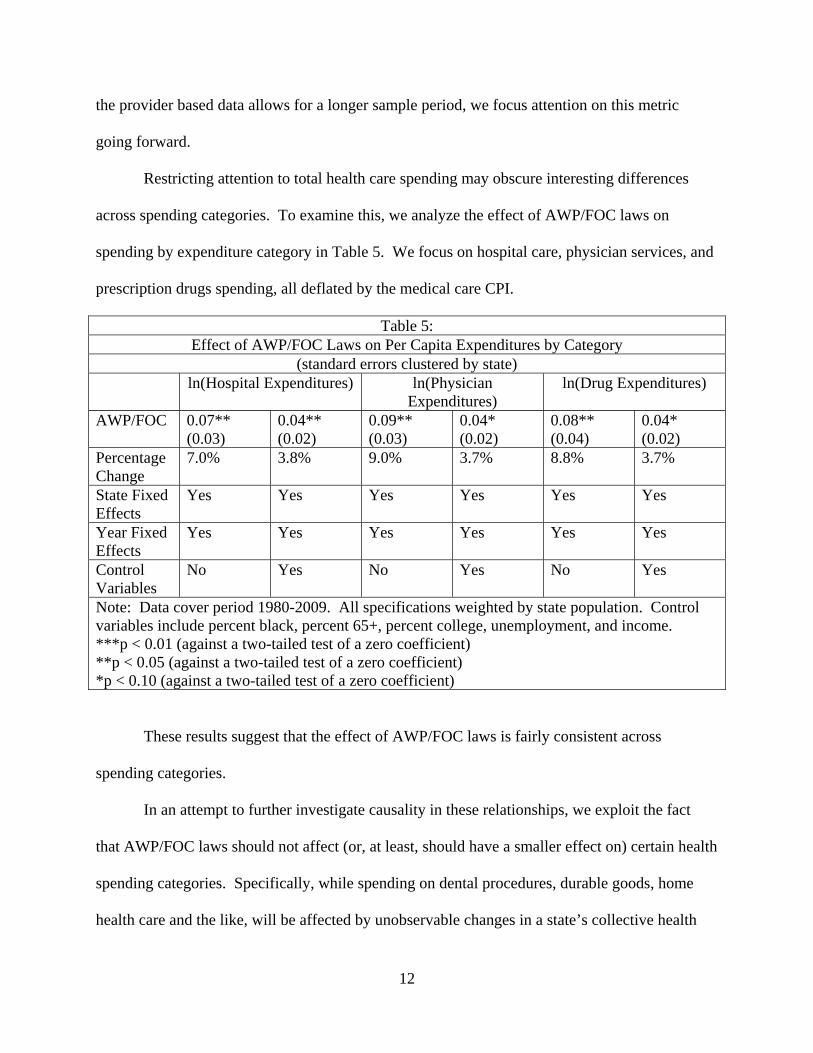
Restricting attention to total health care spending may obscure interesting differences
across spending categories. To examine this, we analyze the effect of AWP/FOC laws on
spending by expenditure category in Table 5. We focus on hospital care, physician services, and
prescription drugs spending, all deflated by the medical care CPI.
Table 5: Effect of AWP/FOC Laws on Per Capita Expenditures by Category
(standard errors clustered by state) ln(Hospital Expenditures) ln(Physician
Expenditures) ln(Drug Expenditures)
AWP/FOC 0.07** (0.03)
0.04** (0.02)
0.09** (0.03)
0.04* (0.02)
0.08** (0.04)
0.04* (0.02)
Percentage Change
7.0% 3.8% 9.0% 3.7% 8.8% 3.7%
State Fixed Effects
Yes Yes Yes Yes Yes Yes
Year Fixed Effects
Yes Yes Yes Yes Yes Yes
Control Variables
No Yes No Yes No Yes
Note: Data cover period 1980-2009. All specifications weighted by state population. Control variables include percent black, percent 65+, percent college, unemployment, and income. ***p < 0.01 (against a two-tailed test of a zero coefficient) **p < 0.05 (against a two-tailed test of a zero coefficient) *p < 0.10 (against a two-tailed test of a zero coefficient)
These results suggest that the effect of AWP/FOC laws is fairly consistent across
spending categories.
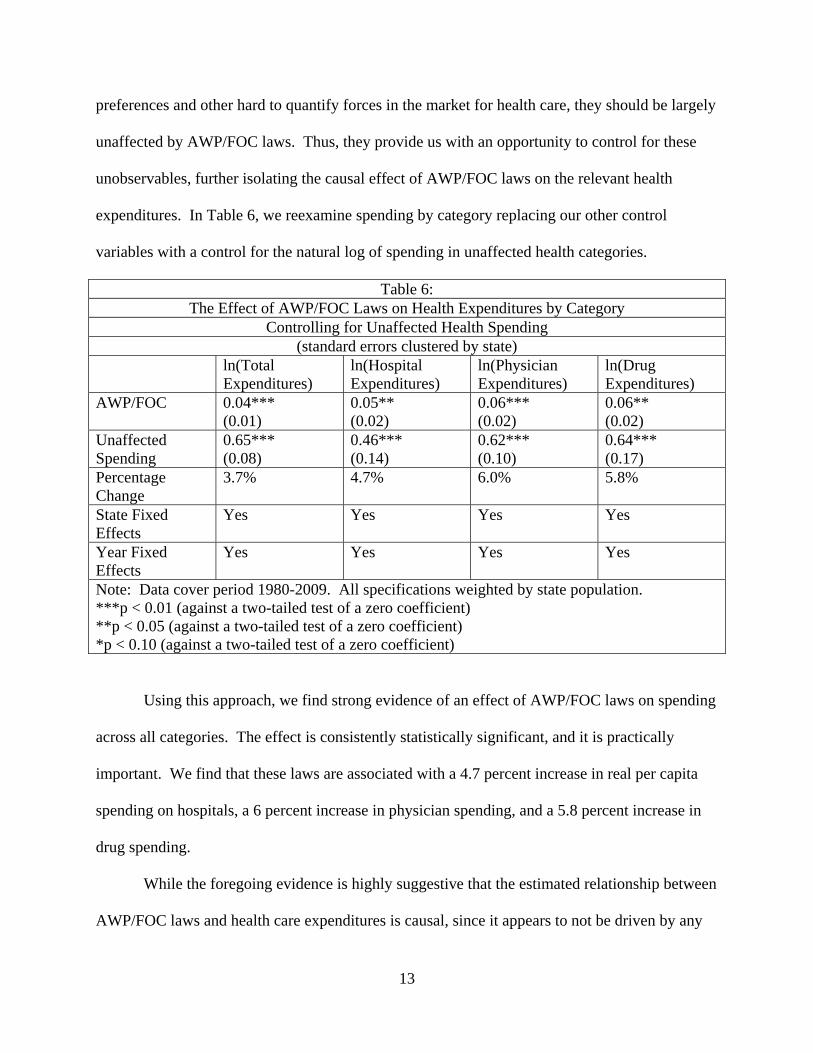
In an attempt to further investigate causality in these relationships, we exploit the fact
that AWP/FOC laws should not affect (or, at least, should have a smaller effect on) certain health
spending categories. Specifically, while spending on dental procedures, durable goods, home
health care and the like, will be affected by unobservable changes in a state’s collective health
13
preferences and other hard to quantify forces in the market for health care, they should be largely
unaffected by AWP/FOC laws. Thus, they provide us with an opportunity to control for these
unobservables, further isolating the causal effect of AWP/FOC laws on the relevant health
expenditures. In Table 6, we reexamine spending by category replacing our other control
variables with a control for the natural log of spending in unaffected health categories.
Table 6: The Effect of AWP/FOC Laws on Health Expenditures by Category
Controlling for Unaffected Health Spending (standard errors clustered by state)
ln(Total Expenditures)
ln(Hospital Expenditures)
ln(Physician Expenditures)
ln(Drug Expenditures)
AWP/FOC 0.04*** (0.01)
0.05** (0.02)
0.06*** (0.02)
0.06** (0.02)
Unaffected Spending
0.65*** (0.08)
0.46*** (0.14)
0.62*** (0.10)
0.64*** (0.17)
Percentage Change
3.7% 4.7% 6.0% 5.8%
State Fixed Effects
Yes Yes Yes Yes
Year Fixed Effects
Yes Yes Yes Yes
Note: Data cover period 1980-2009. All specifications weighted by state population. ***p < 0.01 (against a two-tailed test of a zero coefficient) **p < 0.05 (against a two-tailed test of a zero coefficient) *p < 0.10 (against a two-tailed test of a zero coefficient)
Using this approach, we find strong evidence of an effect of AWP/FOC laws on spending
across all categories. The effect is consistently statistically significant, and it is practically
important. We find that these laws are associated with a 4.7 percent increase in real per capita
spending on hospitals, a 6 percent increase in physician spending, and a 5.8 percent increase in
drug spending.
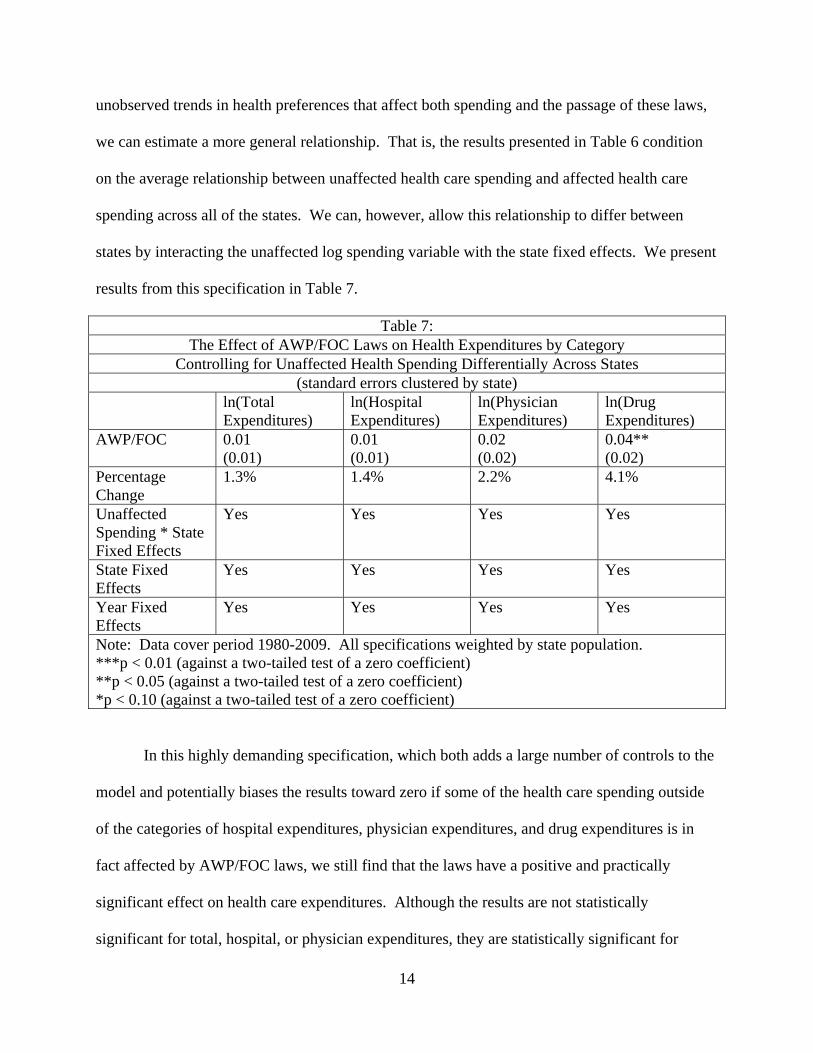
While the foregoing evidence is highly suggestive that the estimated relationship between
AWP/FOC laws and health care expenditures is causal, since it appears to not be driven by any
14
unobserved trends in health preferences that affect both spending and the passage of these laws,
we can estimate a more general relationship. That is, the results presented in Table 6 condition
on the average relationship between unaffected health care spending and affected health care
spending across all of the states. We can, however, allow this relationship to differ between
states by interacting the unaffected log spending variable with the state fixed effects. We present
results from this specification in Table 7.
Table 7: The Effect of AWP/FOC Laws on Health Expenditures by Category
Controlling for Unaffected Health Spending Differentially Across States (standard errors clustered by state)
ln(Total Expenditures)
ln(Hospital Expenditures)
ln(Physician Expenditures)
ln(Drug Expenditures)
AWP/FOC 0.01 (0.01)
0.01 (0.01)
0.02 (0.02)
0.04** (0.02)
Percentage Change
1.3% 1.4% 2.2% 4.1%
Unaffected Spending * State Fixed Effects
Yes Yes Yes Yes
State Fixed Effects
Yes Yes Yes Yes
Year Fixed Effects
Yes Yes Yes Yes
Note: Data cover period 1980-2009. All specifications weighted by state population. ***p < 0.01 (against a two-tailed test of a zero coefficient) **p < 0.05 (against a two-tailed test of a zero coefficient) *p < 0.10 (against a two-tailed test of a zero coefficient)
In this highly demanding specification, which both adds a large number of controls to the
model and potentially biases the results toward zero if some of the health care spending outside
of the categories of hospital expenditures, physician expenditures, and drug expenditures is in
fact affected by AWP/FOC laws, we still find that the laws have a positive and practically
significant effect on health care expenditures. Although the results are not statistically
significant for total, hospital, or physician expenditures, they are statistically significant for
15
prescription drug spending at the 5 percent level. For that category, the relative increase is
particularly large, exceeding 4 percent.
Taken together, these results strongly suggest that AWP/FOC laws raise health care
expenditures by a significant amount. This supports the general theory that AWP/FOC laws
should not be used, even when the law narrowly focuses on areas like the pharmaceutical
industry . These findings undermine the rationale for AWP/FOC because these laws do not
decrease costs as proponents assume. This is especially important to the pharmaceutical industry
where no matter how the model was specified, AWP/FOC laws resulted in a statistically
significant increase in prescription drug spending. Thus, Congress should abandon The
Pharmacy Competition and Consumer Choice Act of 2011, leaving PBMs free to contract.
V. CONCLUSION
PBMs create substantial health care savings through negotiating rebates from drug manufacturers
and decreased costs from pharmacies. Yet, state legislatures undermine PBMs’ ability to
function through AWP/FOC laws in an attempt save costs. Congress itself is considering an
AWP law that further harms PBMs. We add to previous literature by measuring the effect of
AWP/FOC laws on total, hospital, physician, and prescription drug expenditures. We find a
statistically significant increase in expenditures in all four of these categories because of
AWP/FOC laws. This suggests that AWP/FOC laws may be a poor idea from a public policy
perspective.
16
REFERENCES
Balto, David A. 2011. Letter from David A. Balto to Andrew M. Cuomo, Governor, N.Y. Blumenreich, Gene A. 2003. United States Supreme Court Upholds “Any Willing Provider” Statutes. AANA Journal 71:259-262. DOJ & FTC. 2004. Improving Health Care: A Dose of Competition. Durrance, Christine Piette. 2009. The Impact of Pharmacy-Specific Any-Willing-Provider Legislation on Prescription Drug Expenditures. Atlantic Economic Journal, 37:409-423. FTC. 2005. Letter from FTC Staff to Sen. Richard L. Brown. GAO. 2003. Federal Employees’ Health Benefits: Effects of Using Pharmacy Benefit Managers on Health Plans, Enrollees, and Pharmacies. http://www.gao.gov/assets/240/236828.pdf. Hellinger, Fred J. 1995. Any-Willing-Provider And Freedom-Of-Choice Laws: An Economic Assessment. Health Affairs 14:297-302. Klick, Jonathan, and Joshua D. Wright. 2012. The Anti-Competitive Effects of “Any Willing Provider” Laws. Washington Legal Foundation. Majoras, Deborah Platt. 2005. Current Topics in Antitrust Economics and Competition Policy. Marsteller, Jill A. et al. 1997. The Resurgence of Selective Contracting Restrictions. Journal of Health Politics, Policy and Law 22:1133-1189. National Community Pharmacists Assocation. 2011. Community Pharmacists Endorse Bipartisan Pharmacy Competition and Consumer Choice Act. http://www.ncpanet.org/index.php/news-releases/994-community-pharmacists-endorse-bipartisan-pharmacy-competition-and-consumer-choice-act. Rodgers, Cathy McMorris and Anthony Weiner. 2011. McMorris Rodgers and Weiner: Local Pharmacies Play Essential Role in Care. Roll Call. http://www.rollcall.com/issues/56_133/local_pharmacies_play_essential_role_care-206186-1.html. Vita, Michael G. 2001. Regulatory Restrictions on Selective Contracting: An Empirical Analysis of “Any Willing Provider” Regulations. Journal of Health Economics 20:955-966. 110th Congress. 2007. The Impact of Our Antitrust Laws on Community Pharmacies and Their Patients: Hearing on H.R. 971 Before the Antitrust Taskforce of the H. Comm. on Judiciary. Statement of David A. Balto. GA. CODE ANN. § 33-20-16 (2010). VA. CODE ANN. § 38.2-3407 (2008). N.C. Gen. Stat. Ann. § 90-127.1 (1973).
17
Colo. Rev. Stat. Ann. § 25.5-5-504 (2006) Ark. Code Ann. § 23-99-802(4)(A-DD) (2005) Idaho Code Ann. § 41-2872 (1994) S.D. Codified Laws § 58-18-37 (1990). H.R. 1971, 112th Cong. (2011). S. 1058, 112th Cong. (2011).