Embed Size (px)
Citation preview
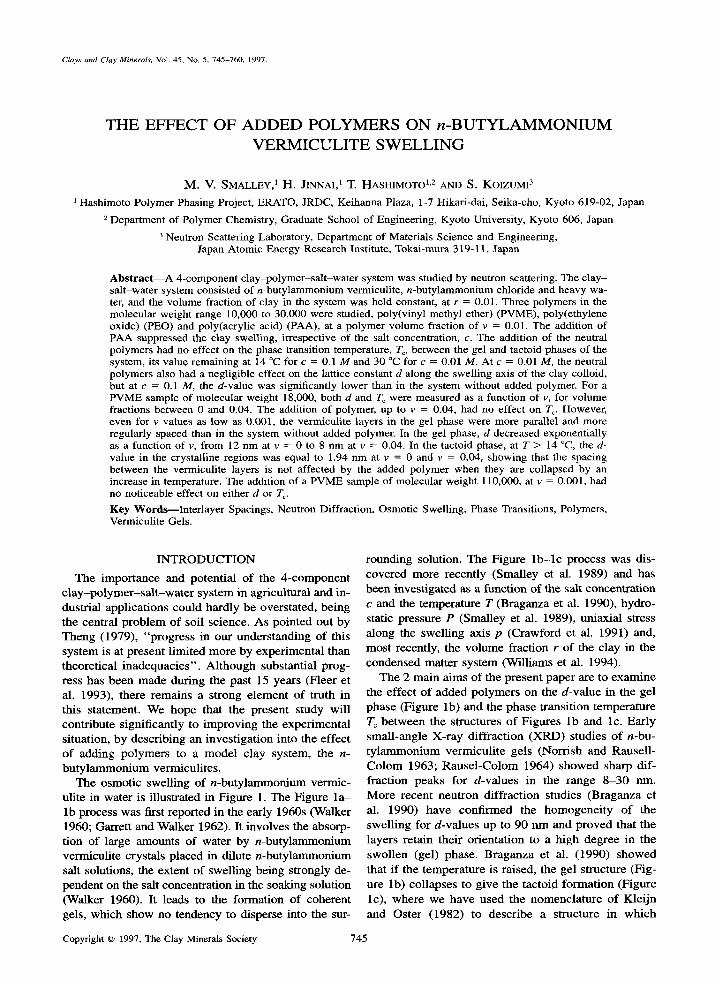
Clays and Clay Minerals, %1ol. 45, No. 5, 745-760, 1997.
THE EFFECT OF ADDED POLYMERS ON n - B U T Y L A M M O N I U M VERMICULITE SWELLING
M . V. SMALLEY, 1 H. JINNAI, i T. HASHIMOTO 1'2 AND S. KOIZUMI 3
1 Hashimoto Polymer Phasing Project, ERATO, JRDC, Keihanna Plaza, I-7 Hikari-dai, Seika-cho, Kyoto 619-02, Japan
2 Department of Polymer Chemistry, Graduate School of Engineering, Kyoto University, Kyoto 606, Japan
3 Neutron Scattering Laboratory, Department of Materials Science and Engineering, Japan Atomic Energy Research Institute, Tokai-mura 319-11, Japan
A b s t r a e t - - A 4-component clay-polymer-salt-water system was studied by neutron scattering. The clay- sait-water system consisted of n-butylammonium vermiculite, n-butylammonium chloride and heavy wa- ter, and the volume fraction of clay in the system was held constant, at r = 0.01. Three polymers in the molecular weight range 10,000 to 30,000 were studied, poly(vinyl methyl ether) (PVME), poly(ethylene oxide) (PEO) and poly(acrylic acid) (PAA), at a polymer volume fraction of v = 0.01. The addition of PAA suppressed the clay swelling, irrespective of the salt concentration, c. The addition of the neutral polymers had no effect on the phase transition temperature, To, between the gel and tactoid phases of the system, its value remaining at 14 ~ for c = 0.1 M and 30 ~ c = 0.01 M. At c = 0.01 M, the neutral polymers also had a negligible effect on the lattice constant d along the swelling axis of the clay colloid, but at c = 0.1 M, the d-value was significantly lower than in the system without added polymer. For a PVME sample of molecular weight 18,000, both d and T c were measured as a function of v, for volume fractions between 0 and 0.04. The addition of polymer, up to v = 0.04, had no effect on T c. However, even for v values as low as 0.001, the vermiculite layers in the gel phase were more parallel and more regularly spaced than in the system without added polymer. In the gel phase, d decreased exponentially as a function of v, from 12 nm at v = 0 to 8 nm at v = 0.04. In the tactoid phase, at T > 14 ~ the d- value in the crystalline regions was equal to 1.94 nm at v = 0 and v = 0.04, showing that the spacing between the vermiculite layers is not affected by the added polymer when they are collapsed by an increase in temperature. The addition of a PVME sample of molecular weight 110,000, at v = 0.001, had no noticeable effect on either d or To.
Key Words----Interlayer Spacings, Neutron Diffraction, Osmotic Swelling, Phase Transitions, Polymers, Vermiculite Gels.
I N T R O D U C T I O N
The impor t ance and poten t ia l o f the 4 - c o m p o n e n t c l a y - p o l y m e r - s a l t - w a t e r s y s t e m in agr icul tura l and in- dustr ial appl ica t ions cou ld ha rd ly b e overs ta ted , be ing the cent ra l p r o b l e m of soil science. As po in ted out by T h e n g (1979), "p rog re s s in our unde r s t and ing of this sys tem is at p resen t l imi ted m o r e by expe r imen ta l than theore t ica l i nadequac i e s " . A l t h o u g h subs tant ia l prog- ress has b e e n m a d e dur ing the pas t 15 years (Fleer et al. 1993), there r ema ins a s t rong e l emen t o f t ru th in this s ta tement . We hope that the p resen t s tudy wil l con t r ibu te s ignif icant ly to i m p r o v i n g the expe r imen ta l s i tuat ion, by desc r ib ing an inves t iga t ion into the ef fec t o f adding po lymer s to a mode l c lay sys tem, the n- b u t y l a m m o n i u m vermicul i tes .
The osmot ic swell ing of n -bu ty l ammoniu rn vermic- uli te in water is i l lustrated in Figure 1. The Figure l a - l b process was first reported in the early 1960s (Walker 1960; Garret t and Walker 1962). It involves the absorp- t ion of large amounts of water by n - b u t y l a m m o n i u m vermicul i te crysta ls p laced in dilute n - b u t y l a m m o n i u m salt solutions, the extent of swel l ing be ing s trongly de- penden t on the salt concent ra t ion in the soaking solut ion (Walker 1960). It leads to the fo rmat ion of coheren t gels, wh ich show no tendency to disperse into the sur-
rounding solution. The Figure l b - l c process was dis- covered more recent ly (Smal ley et al. 1989) and has been inves t iga ted as a func t ion of the salt concent ra t ion c and the tempera ture T (Braganza et al. 1990), hydro- static pressure P (Smal ley et al. 1989), uniaxia l stress a long the swel l ing axis p (Crawford et al. 1991) and, mos t recently, the vo lume fract ion r of the clay in the condensed mat te r sys tem (Wil l iams et al. 1994).
T h e 2 m a i n a ims of the p resen t pape r are to e x a m i n e the ef fec t of added po lymers on the d -va lue in the gel phase (Figure l b ) and the phase t rans i t ion t empera tu re T~ b e t w e e n the s t ructures o f F igures l b and lc . Ea r ly smal l - ang le X- ray d i f f rac t ion ( X R D ) s tudies o f n -bu- t y l a m m o n i u m ve rmicu l i t e gels (Norr i sh and Rause l l - C o l o m 1963; R a u s e l - C o l o m 1964) s h o w e d sharp dif- f rac t ion peaks for d -va lues in the r ange 8 - 3 0 nm. M o r e recen t neu t ron d i f f rac t ion s tudies (Braganza et al. 1990) h a v e conf i rmed the h o m o g e n e i t y o f the swel l ing for d -va lues up to 90 n m and p r o v e d that the layers re ta in the i r o r i en ta t ion to a h i g h degree in the swol l en (gel) phase. B r a g a n z a et al. (1990) s h o w e d that i f the t empera tu re is ra ised, the gel s t ructure (Fig- ure l b ) co l lapses to g ive the tac to id f o r m a t i o n (Figure lc) , whe re we h a v e used the n o m e n c l a t u r e of Kle i jn and Os te r (1982) to desc r ibe a s t ructure in w h i c h
Copyright �9 1997, The Clay Minerals Society 745
746 Smalley, Jinnai, Hashimoto and Koizumi Clays and Clay Minerals
(a) (b) (c)
I I I I
I I I I
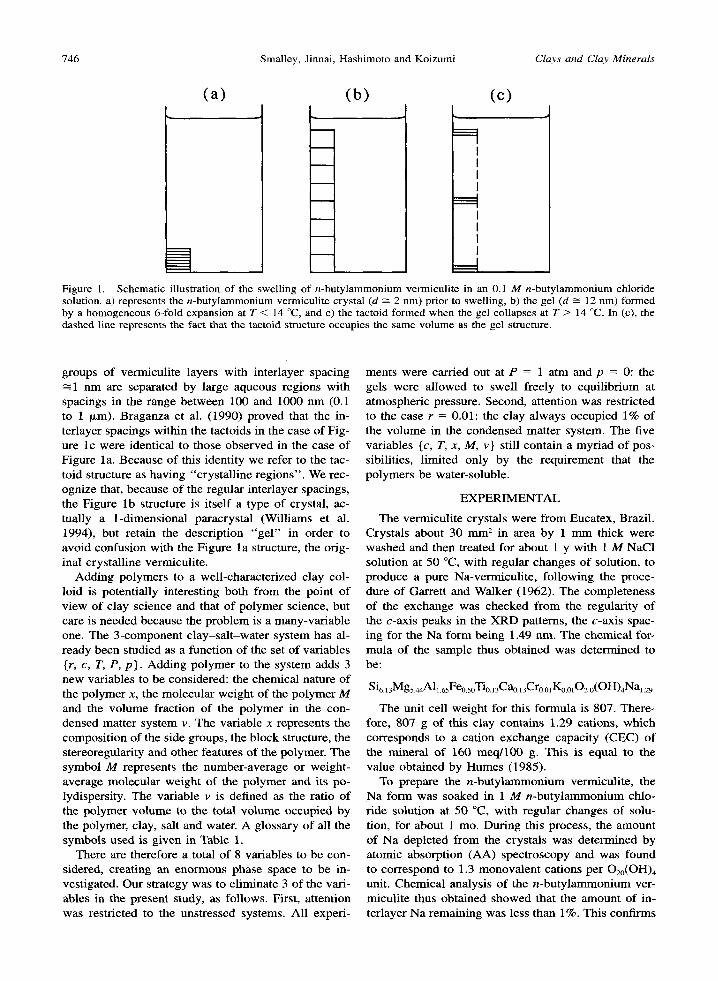
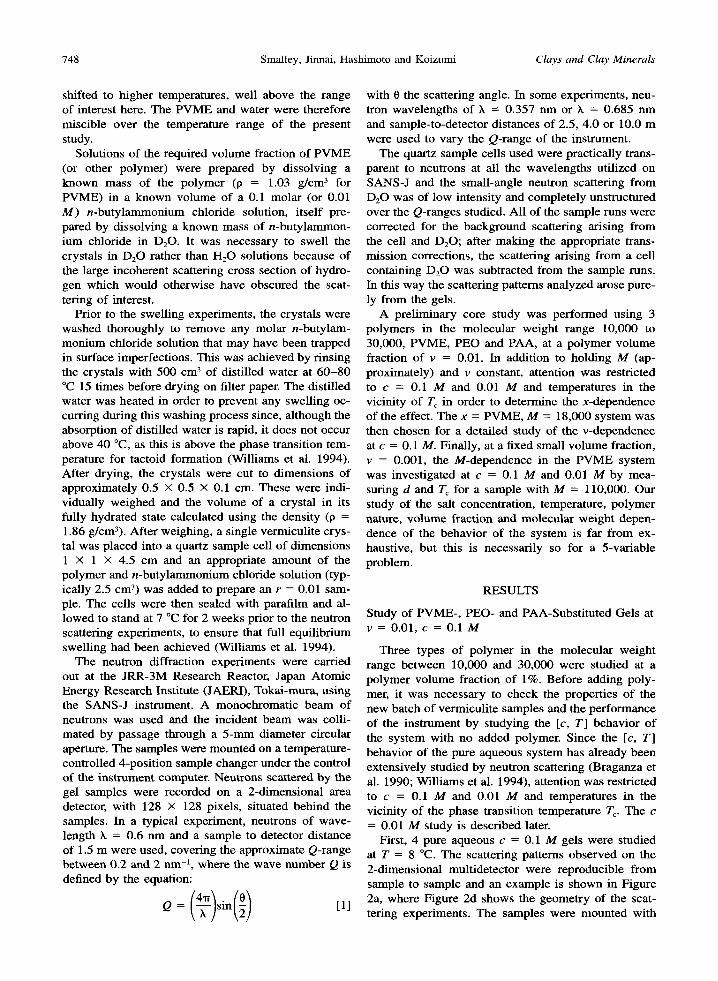
I Figure 1. Schematic illustration of the swelling of n-butylammonium vermiculite in an 0.1 M n-butylammonium chloride solution, a) represents the n-butylammonium vermiculite crystal (d ~ 2 nm) prior to swelling, b) the gel (d ~ 12 nm) formed by a homogeneous 6-fold expansion at T < 14 ~ and c) the tactoid formed when the gel collapses at T > 14 ~ In (c), the dashed line represents the fact that the tactoid structure occupies the same volume as the gel structure.
groups of vermiculite layers with interlayer spacing ~1 nm are separated by large aqueous regions with spacings in the range between 100 and 1000 nm (0.1 to 1 ~xm). Braganza et al. (1990) proved that the in- terlayer spacings within the tactoids in the case of Fig- ure lc were identical to those observed in the case of Figure la. Because of this identity we refer to the tac- told structure as having "crystalline regions". We rec- ognize that, because of the regular interlayer spacings, the Figure lb structure is itself a type of crystal, ac- tually a 1-dimensional paracrystal (Williams et al. 1994), but retain the description "ge l " in order to avoid confusion with the Figure 1 a structure, the orig- inal crystalline venrticulite.
Adding polymers to a well-characterized clay col- loid is potentially interesting both from the point of view of clay science and that of polymer science, but care is needed because the problem is a many-variable one. The 3-component clay-sal t-water system has al- ready been studied as a function of the set of variables {r, c, T, P, p}. Adding polymer to the system adds 3 new variables to be considered: the chemical nature of the polymer x, the molecular weight of the polymer M and the volume fraction of the polymer in the con- densed matter system v. The variable x represents the composition of the side groups, the block structure, the stereoregularity and other features of the polymer. The symbol M represents the number-average or weight- average molecular weight of the polymer and its po- lydispersity. The variable v is defined as the ratio of the polymer volume to the total volume occupied by the polymer, clay, salt and water. A glossary of all the symbols used is given in Table 1.
There are therefore a total of 8 variables to be con- sidered, creating an enormous phase space to be in- vestigated. Our strategy was to eliminate 3 of the vari- ables in the present study, as follows. First, attention was restricted to the unstressed systems. All experi-
ments were carried out at P = 1 atm and p = 0: the gels were allowed to swell freely to equilibrium at atmospheric pressure, Second, attention was restricted to the case r = 0.01: the clay always occupied 1% of the volume in the condensed matter system. The five variables {c, T, x, M, v} still contain a myriad of pos- sibilities, limited only by the requirement that the polymers be water-soluble.
EXPERIMENTAL
The vermiculite crystals were from Eucatex, Brazil. Crystals about 30 nun 2 in area by 1 mm thick were washed and then treated for about 1 y with 1 M NaCI solution at 50 ~ with regular changes of solution, to produce a pure Na-vermiculite, following the proce- dure of Garrett and Walker (1962). The completeness of the exchange was checked from the regularity of the c-axis peaks in the XRD patterns, the c-axis spac- ing for the Na form being 1.49 rim. The chemical for- mula of the sample thus obtained was determined to be:
Si6.13Mg5.44A11.65Fe0.50Ti0.13Ca0.13Cr0.01K0.01 O20(OH)4Nam9
The unit cell weight for this formula is 807. There- fore, 807 g of this clay contains 1.29 cations, which corresponds to a cation exchange capacity (CEC) of the mineral of 160 meq/100 g. This is equal to the value obtained by Humes (1985).
To prepare the n-butylammonium vermiculite, the Na form was soaked in 1 M n-butylammonium chlo- ride solution at 50 ~ with regular changes of solu- tion, for about I mo. During this process, the amount of Na depleted from the crystals was determined by atomic absorption (AA) spectroscopy and was found to correspond to 1.3 monovalent cations per O20(OH)4 unit. Chemical analysis of the n-butylammonium ver- miculite thus obtained showed that the amount of in- terlayer Na remaining was less than 1%. This confirms

Vol. 45, No. 5, 1997 747 The effect of added polymers on n-butylammonium vermiculite swelling
Table 1. Glossary of symbols and abbreviations used.
Ap
c
d I(Q) k lp LCST M Mn Mw n
p P PAA PEO PVME O amax /-
ro Rg P SANS-J T T~ 0 v
w X
Vo,, Zo.
Area of a vermiculite surface occupied by a polymer molecule Electrolyte concentration of n-butylammonium chloride solution Average repeat distance along the swelling axis Intensity of scattering as a function of momentum transfer Neutron wavelength Effective thickness of an adsorbed polymer layer Lower critical solution temperature Molecular weight Number--average molecular weight Weight--average molecular weight Power law exponent in the relation I(Q) oc Q ,, Uniaxial pressure along the swelling axis Hydrostatic pressure Poly(acrylic acid) Poly(ethylene oxide) Poly(vinyl methyl ether) Momentum transfer Momentum transfer at first-order diffraction maximum Volume fraction of vermiculite in the condensed matter system Unperturbed end-to-end distance of a polymer molecule Radius of gyration of a polymer molecule Density Small-angle neutron scattering instrument at Tokai reactor Temperature Transition temperature between gel and tactoid phases Scattering angle Volume fraction of polymer in the condensed matter system Width of disk of vermiculite layers Chemical nature of polymer Correlation length along the swelling axis Effective volume of a polymer molecule in solution Effective surface charge of a vermiculite layer
the accuracy of the alkylammonium ion exchange method for the characterization of clays described by Lagaly (1981). The purity was again checked by XRD, the c-axis spacing now being 1.94 nm. The crystals were stored in a 1 M n-butylammonium chloride so- lution prior to the swelling experiments.
The low molecular weight PVME used in the main study was synthesized by cationic polymerization in toluene at - 7 8 ~ with boron trifluoride etherate as initiator. The number-average molecular weight (Mn) of the PVME, measured by gel permeation chroma- tography (GPC) in chloroform, was 27,000 in terms of the polystyrene equivalent, and the polydispersity ratio (Mw/Mn, where Mw is the weight-average molec- ular weight) was 1.40. Experiments on PVME samples with narrow molecular weight distributions (Mw/Mn <
1.1) in the molecular weight range between 500 and 4000 have shown that the absolute value of M n ob- tained by 1H NMR is equal to 0.67 times the polysty- rene equivalent value obtained by GPC (Sawamoto and Kamigaito 1995). If we assume that this factor holds for our sample, although it may depend on the GPC conditions (such as temperature, kind of column used and solvent) and the polymer structure (such as stereoregularity), then the true value of Mn would be 18,000, corresponding to a degree of polymerization of 310.
The high molecular weight PVME was obtained by fractionation of a polydisperse sample purchased from Scientific Polymer Products, Inc. (6265 Dean Park- way, Ontario, New York 14519). It had a polystyrene equivalent Mn of 1.64 • 105 (Mw/M. = 1.05), which on the basis of the assumption used above would cor- respond to a true value of M n of 110,000. The PEO was also purchased from Scientific Polymer Products, Inc., with manufacturers specifications Mw = 10,900 and M. = 9200, and the PAA was purchased from Polymer Laboratories Ltd. (Separation Science Divi- sion, Essex Road, Church Stretton, Shropshire SY6 6AX, United Kingdom), with manufacturers specifi- cations Mw = 28,000 and Mn = 18,000 (M,~/M~ = 1.6). Both of these samples were used without further pu- rification.
The main study was of the vermicul i te-PVME sys- tem. We note that the PVME-water system has itself an interesting (v, T) phase diagram of lower critical solution temperature (LCST) type (Tanaka 1993). For a PVME sample of weight-average molecular weight 98,000, the phase separation temperature between PVME and water occurs at 33.0 + 0.2 ~ in the v range between 0 and 0.1 (Tanaka 1993). This was slightly above the highest temperature studied with our high molecular weight PVME (32 ~ and for the low- er molecular weight PVME we used, the LCST is
748 Smalley, Jinnai, Hashimoto and Koizumi Clays and Clay Minerals
shifted to h igher temperatures, wel l above the range of interest here. The P V M E and water were therefore miscible over the temperature range o f the present study.
Solutions of the required vo lume fraction of P V M E (or other polymer) were prepared by dissolving a known mass o f the po lymer (p = 1.03 g / cm 3 for PVME) in a known vo lume of a 0.1 molar (or 0.01 M ) n -bu ty lammonium chloride solution, i tself pre- pared by dissolving a known mass of n-butylarmnon- ium chloride in D20. It was necessary to swell the crystals in D20 rather than H20 solutions because o f the large incoherent scattering cross section of hydro- gen which would otherwise have obscured the scat- tering of interest.
Prior to the swell ing experiments , the crystals were washed thoroughly to r emove any molar n-butylam- m o n i u m chloride solution that may have been trapped in surface imperfect ions. This was achieved by rinsing the crystals with 500 cm 3 of distil led water at 6 0 - 8 0 ~ 15 t imes before drying on filter paper. The disti l led water was heated in order to prevent any swel l ing oc- curring during this washing process since, al though the absorption o f disti l led water is rapid, it does not occur above 40 ~ as this is above the phase transition tem- perature for tactoid formation (Will iams et al. 1994). After drying, the crystals were cut to d imensions of approximately 0.5 • 0.5 • 0.1 cm. These were indi- vidually weighed and the vo lume of a crystal in its fully hydrated state calculated using the density (p = 1.86 g/cm3). Af te r weighing, a single vermicul i te crys- tal was p laced into a quartz sample cell o f d imensions 1 • 1 • 4.5 cm and an appropriate amount o f the po lymer and n -bu ty lammonium chloride solution (typ- ical ly 2.5 cm 3) was added to prepare an r = 0.01 sam- ple. The cells were then sealed with paraf i lm and al- lowed to stand at 7 ~ for 2 weeks prior to the neutron scattering experiments , to ensure that full equi l ibr ium swell ing had been achieved (Will iams et al. 1994).
The neutron diffraction experiments were carried out at the J R R - 3 M Research Reactor, Japan Atomic Energy Research Institute (JAERI) , Tokai-mura, using the S A N S - J instrument. A monochromat ic beam of neutrons was used and the incident beam was colli- mated by passage through a 5 - m m diameter circular aperture. The samples were mounted on a temperature- controlled 4-posi t ion sample changer under the control of the instrument computer. Neutrons scattered by the gel samples were recorded on a 2-dimensional area detector, wi th 128 • 128 pixels, situated behind the samples. In a typical experiment , neutrons of wave- length X = 0.6 nm and a sample to detector distance of 1.5 m were used, cover ing the approximate Q-range be tween 0.2 and 2 n m -~, where the w a v e number Q is defined by the equation:
4~r . 0
with 0 the scattering angle. In some experiments , neu- tron wavelengths o f h = 0.357 nm or X = 0.685 n m and sample- to-detector distances of 2.5, 4.0 or 10.0 m were used to vary the Q-range of the instrument.
The quartz sample cells used were pract ical ly trans- parent to neutrons at all the wavelengths ut i l ized on S A N S - J and the small-angle neutron scattering f rom DeO was o f low intensity and comple te ly unstructured over the Q-ranges studied. All of the sample runs were corrected for the background scattering arising f rom the cell and D20; after making the appropriate trans- mission corrections, the scattering arising f rom a cell containing D20 was subtracted f rom the sample runs. In this way the scattering patterns analyzed arose pure- ly f rom the gels.
A pre l iminary core study was per formed using 3 po lymers in the molecu la r weight range 10,000 to 30,000, PVME, PEO and PAA, at a po lymer vo lume fraction of v = 0.01. In addit ion to holding M (ap- proximately) and v constant, attention was restricted to c = 0.1 M and 0.01 M and temperatures in the vicini ty of Tc in order to determine the x-dependence of the effect. The x = PVME, M = 18,000 system was then chosen for a detai led study of the v-dependence at c = 0.1 M. Finally, at a fixed small vo lume fraction, v = 0.001, the M-dependence in the P V M E system was invest igated at c = 0.1 M and 0.01 M by mea- suring d and T~ for a sample with M = 110,000. Our study of the salt concentrat ion, temperature, po lymer nature, vo lume fract ion and molecular weight depen- dence of the behavior of the system is far f rom ex- haustive, but this is necessari ly so for a 5-variable problem.
R E S U L T S
Study of P V M E - , PEO- and PAA-Subst i tu ted Gels at v = 0.01, c = 0.1 M
Three types o f po lymer in the molecular weight range be tween 10,000 and 30,000 were studied at a po lymer vo lume fraction of 1%. Before adding poly- mer, it was necessary to check the properties o f the new batch o f vermicul i te samples and the per formance of the instrument by studying the [c, T] behavior o f the system with no added polymer. Since the [c, T] behavior o f the pure aqueous system has already been extensively studied by neutron scattering (Braganza et al. 1990; Wil l iams et al. 1994), attention was restricted to c = 0.1 M and 0.01 M and temperatures in the vicini ty o f the phase transition temperature T c. The c = 0.01 M study is described later.
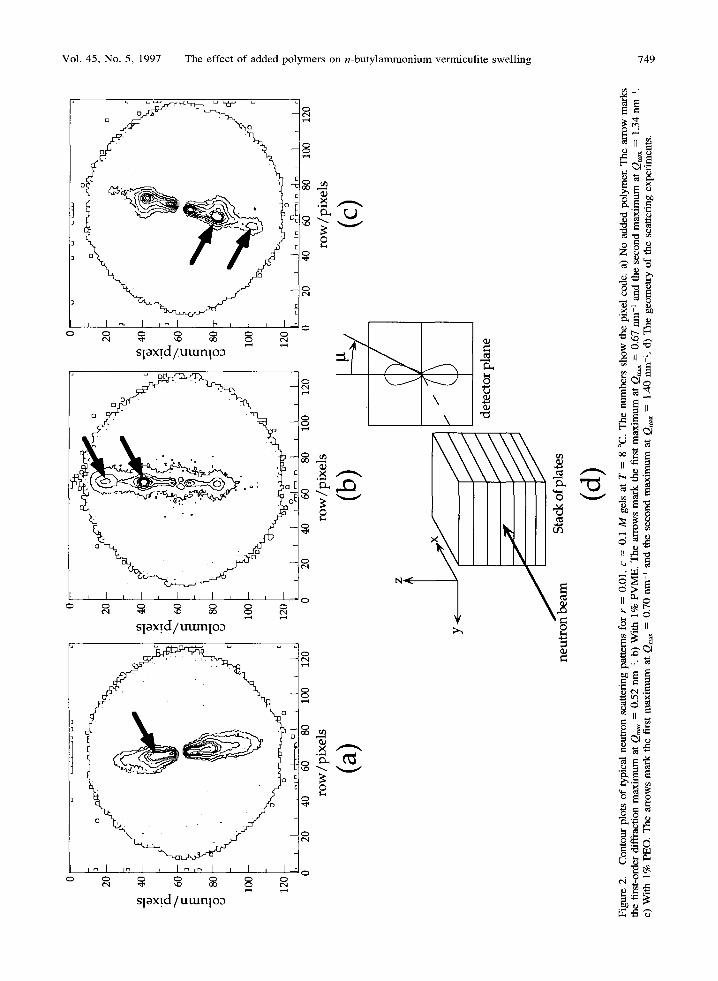
First, 4 pure aqueous c = 0.1 M gels were studied at T = 8 ~ The scattering patterns observed on the 2-dimensional mult idetector were reproducible f rom sample to sample and an example is shown in F igure 2a, where Figure 2d shows the geomet ry of the scat- tering experiments . The samples were mounted with
Vol. 45, No. 5, 1997 The effect o f added polymers on n - b u t y l a m m o n i u m vermiculi te swell ing 749
o o
o ~ o
0 0 0 ~ 0
slax!d/umnlo ) - ~ O
0 ~
~ I ~ I , I , I , I , I
Q
L
==
I
r
==
~W
x
o
- - 0
slax!d/uum[o~
==
0 ~ 0 ~ 0
Slax!d/uumlo~
ft./
\ "=
\~ 0
==ill
o ~
750 Smalley, Jinnai, Hashimoto and Koizumi Clays and Clay Minerals
the clay layers horizontal to the ground and the scat- tering pattern consists of 2 lobes of intensity above and below the plane of the layers in the gel, defined as the xy-plane in Figure 2d. If the layers were per- fectly parallel then coherent scattering would only oc- cur along the z-axis perpendicular to the layers, but in reality there are defects in the gel, so scattering occurs to either side of this axis such that almost all of the scattering falls within 2 cones of 60 ~ azimuthal width above and below the horizontal plane, corresponding to tx = 30 ~ in Figure 2d.
The slight tilting of the line of most intense scatter- ing from the z-axis in Figures 2a and 2b and the asym- metries in the cones of scattering in the +z and - z directions are due to the average orientation of the stack of layers lying slightly out of the xy-plane in the sense of rotations about the x-axis and y-axis, respec- tively. The existence of intensity maxima within the cones is due to a pronounced interference effect be- tween the vermiculite layers, which have a well-de- fined interlayer spacing.
The scattering from the polymer-added systems, also taken for 4 samples of each type of added poly- mer, was also reproducible. An example of the scat- tering from a c = 0.1 M PVME sample is shown in Figure 2b and that from a c = 0.1 M P E t sample shown in Figure 2c, The first remarkable feature of these patterns is that the cones of scattering have be- come narrower than those observed in the pure aque- ous system, almost all of the scattering now lying within Ix = 25 ~ rather than the 30 ~ observed previ- ously. This effect was observed for all the polymer- added samples studied in the gel phase. Since the width of the cone is a measure of the orientation dis- tribution of the vermiculite layers with respect to the z-axis and therefore a measure of the parallelity of the stack, this shows that: 1) the addition of polymer caus- es the vermiculite layers to become more parallel in the gel phase. The second remarkable feature of Fig- ures 2b and 2c is that the diffraction lobe has shifted to higher Q as compared with the pure aqueous c = 0.1 M sample. This means that 2) the addition of poly- mer causes a decrease in the interlayer spacing be- tween the vermiculite layers in the gel phase. This is shown more clearly by sector-summing the data, by taking constant Q cuts within the appropriate azimuth- al cones, to give plots of I(Q) vs. Q, as shown in Figure 3.
Similar patterns to those shown in Figures 2 and 3 were observed for all samples in the gel phase. In or- der to extract the most precise information from the neutron diffraction patterns it would be necessary to analyze them quantitatively using a 1-dimensional par- acrystalline lattice model (Shibayama and Hashimoto 1986). Although such an analysis can be performed for small-angle XRD patterns from vermiculite gels (Rausell-Colom et al. 1989), it is not so straightfor-
ward for small-angle neutron scattering data because of the poorer resolution due to the larger size of the beam and the wider spectral distribution, Ah/h -~ 0.1. However, the sharpness of the diffraction effect per- mits an immediate approximate evaluation of the d- value by measuring Q ..... the Q-value at the maximum of the first order diffraction peak, and applying the simple equation:
d = 2~r/Qma~ [2]
Although this procedure is not strictly rigorous, we note that in all cases when we were able to observe a second-order diffraction peak, the position of this peak was equal to twice the value of Qmax for the first-order diffraction peak, to the limit of experimental error. This validates the approximate evaluation, since it shows that the form factor of the scattering object has a negligible influence on the peak positions, and it was applied to all the I(Q) vs. Q plots obtained.
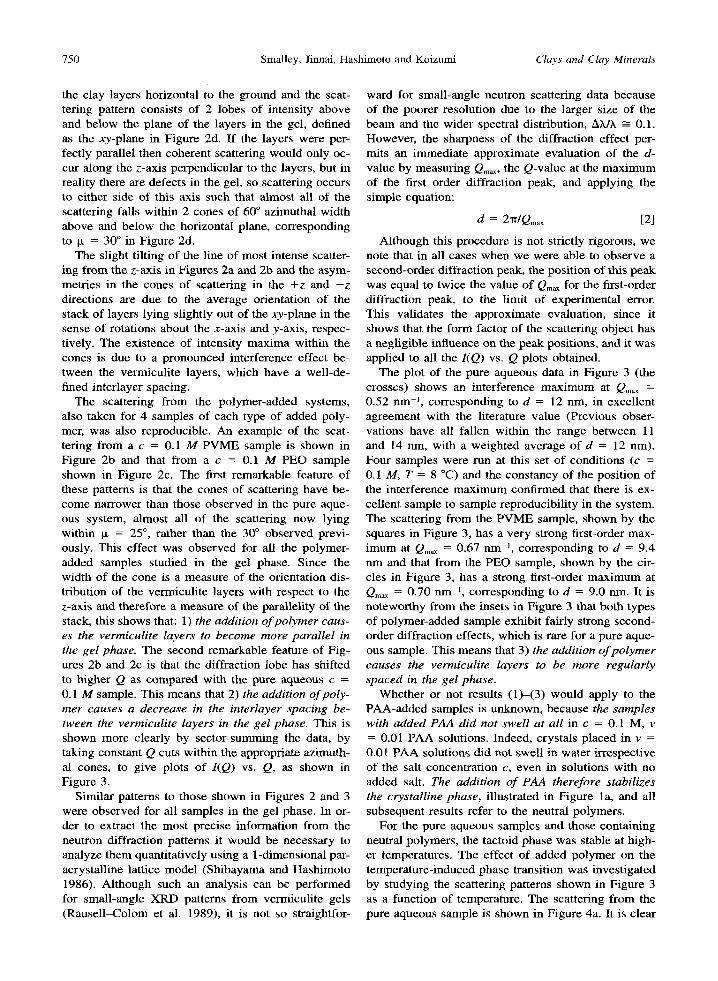
The plot of the pure aqueous data in Figure 3 (the crosses) shows an interference maximum at Q,~a~ = 0.52 nm -~, corresponding to d = 12 nm, in excellent agreement with the literature value (Previous obser- vations have all fallen within the range between 11 and 14 nm, with a weighted average of d = 12 nm). Four samples were run at this set of conditions (c = 0.1 M, T = 8 ~ and the constancy of the position of the interference maximum confirmed that there is ex- cellent sample to sample reproducibility in the system. The scattering from the PVME sample, shown by the squares in Figure 3, has a very strong first-order max- imum at Qmax = 0.67 nm -j, corresponding to d = 9.4 nm and that from the P E t sample, shown by the cir- cles in Figure 3, has a strong first-order maximum at Qmax = 0.70 nm -1, corresponding to d = 9.0 nm. It is noteworthy from the insets in Figure 3 that both types of polymer-added sample exhibit fairly strong second- order diffraction effects, which is rare for a pure aque- ous sample. This means that 3) the addition ofpolymer causes the vermiculite layers to be more regularly spaced in the gel phase.
Whether or not results (1)-(3) would apply to the PAA-added samples is unknown, because the samples with added PAA did not swell at all in c = 0.1 M, v = 0.01 PAA solutions. Indeed, crystals placed in v = 0.01 PAA solutions did not swell in water irrespective of the salt concentration c, even in solutions with no added salt. The addition of PAA therefore stabilizes the crystalline phase, illustrated in Figure la, and all subsequent results refer to the neutral polymers.
For the pure aqueous samples and those containing neutral polymers, the tactoid phase was stable at high- er temperatures. The effect of added polymer on the temperature-induced phase transition was investigated by studying the scattering pattems shown in Figure 3 as a function of temperature. The scattering from the pure aqueous sample is shown in Figure 4a. It is clear
Vol. 45, No. 5, 1997 The effect of added polymers on n-butylammonium vermiculite swelling 751
(Y
10
8 - -
6 , - -
4 -
2 -
0 0.0
I I I ) . 0 . . . . .
I I I I
0.8
0.6
0.4
0 . 2 1 -
0.0 0.8 1.0 1.2 1.4 1.6 1.8 2.0
Q / nm -]
- 4 - Aqueous --O- PEO -q53-- PVME
] ] v v v , . . , , k j , 5 , j ~ . I
0.5 1.0 1.5 2.0
Q / n m -1
Figure 3. The sector averaged plots of the patterns shown in Figure 2 for r = 0.0l, c = 0.1 M gels at T = 8 ~ The crosses, squares and circles denote the scattering from the pure aqueous system and those with 1% PVME and 1% PEO, respectively. The insets are the scattering on a magnified (• intensity scale, showing the clear second-order diffraction maxima for the polymer-added samples.
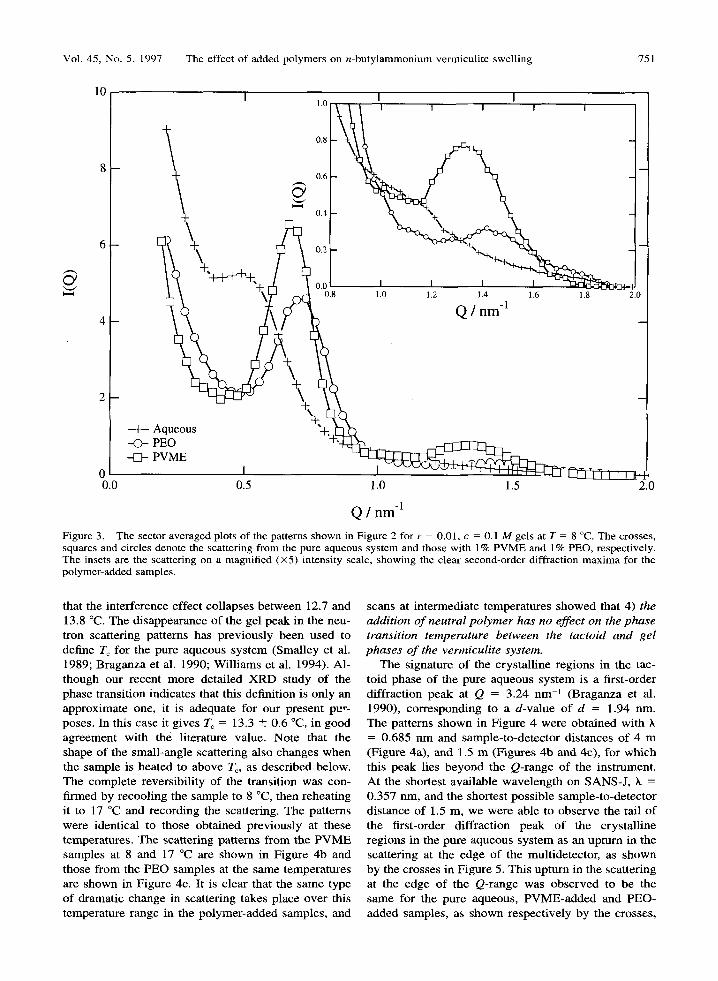
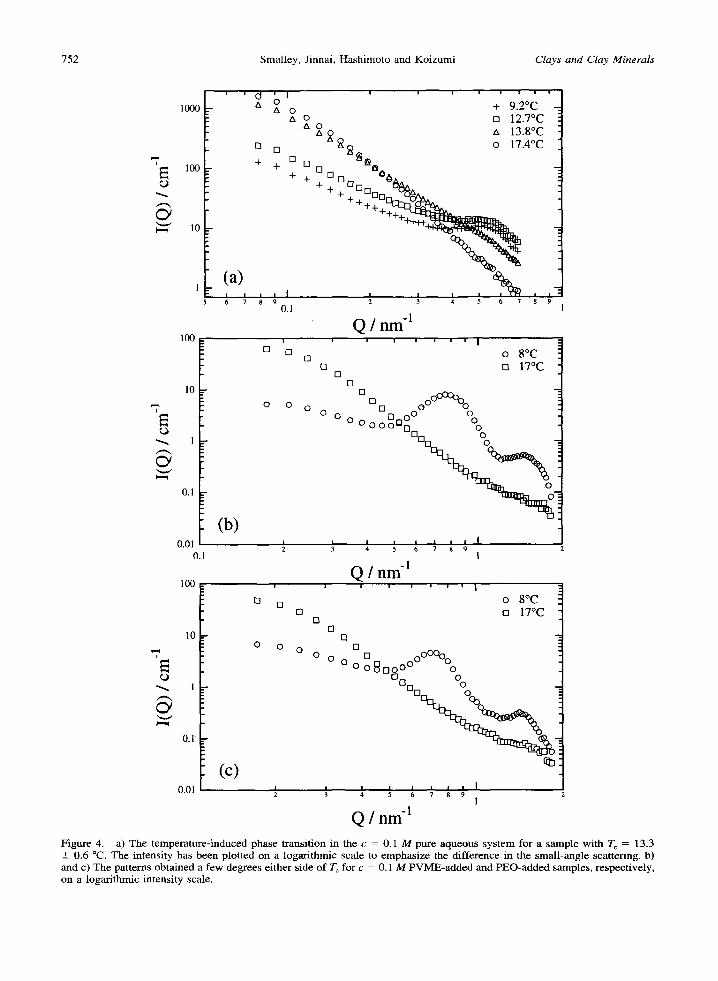
tha t the in te r fe rence effect co l lapses be tween 12.7 and 13.8 ~ The d i sappearance o f the gel peak in the neu- t ron scat ter ing pa t te rns has p rev ious ly been used to define T c for the pure aqueous sys tem (Smal ley et al. 1989; B r a g a n z a et al. 1990; Wi l l i ams et al. 1994). Al - t h o u g h our recen t more de ta i led X R D study of the phase t rans i t ion indica tes that this def ini t ion is on ly an approx imate one, it is adequa te for our p resen t pur- poses. In this case it g ives Tc = 13.3 ___ 0.6 ~ in good ag reemen t w i th the l i tera ture value. Note tha t the shape o f the smal l - ang le sca t te r ing also changes w h e n the sample is hea t ed to above To, as descr ibed below. The comple te revers ib i l i ty of the t rans i t ion was con- f i rmed by recoo l ing the sample to 8 ~ then rehea t ing it to 17 ~ and record ing the scat ter ing. The pa t te rns were ident ical to those ob ta ined p rev ious ly at these tempera tures . T h e scat ter ing pa t te rns f rom the P V M E samples at 8 and 17 ~ are s h o w n in F igure 4b and those f rom the P E O samples at the same t empera tu res are s h o w n in F igure 4c. It is c lear that the s ame type of d ramat i c c h a n g e in sca t ter ing takes place ove r this t empera tu re r ange in the po lymer - added samples , and
scans at in t e rmed ia te t empera tu res s h o w e d that 4) the addition o f neutral polymer has no effect on the phase transition temperature between the tactoid and gel phases o f the vermiculite system.
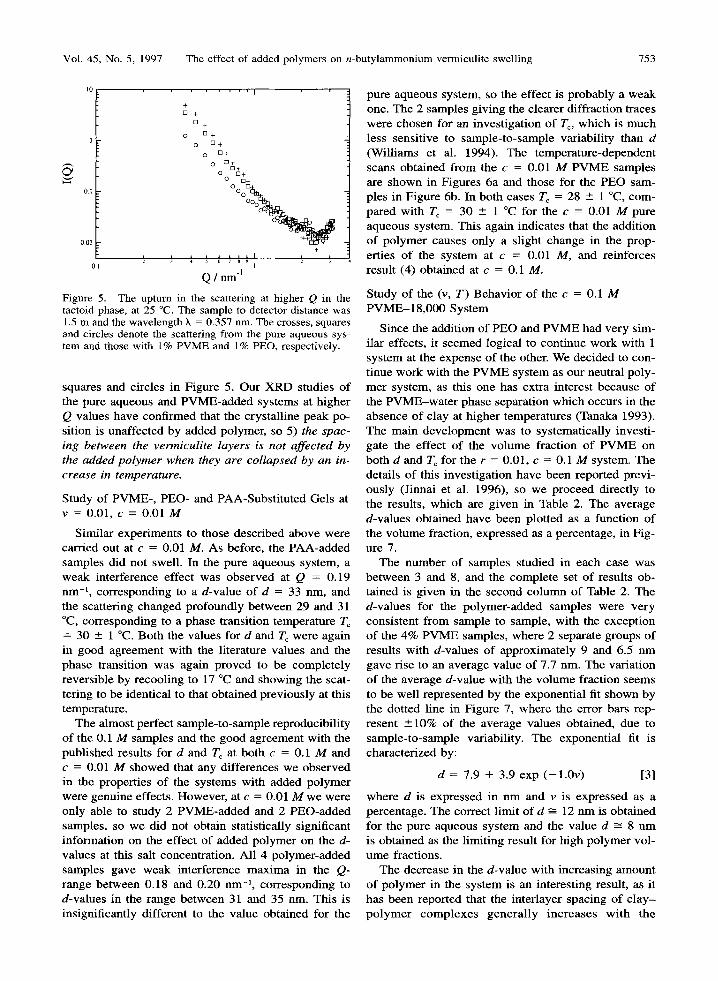
The s ignature o f the c rys ta l l ine reg ions in the tac- told phase of the pure aqueous sys t em is a f i rs t -order d i f f rac t ion peak at Q = 3.24 n m -l (B raganza et al. 1990), co r r e spond ing to a d -va lue o f d = 1.94 nm. The pa t te rns s h o w n in F igure 4 were ob ta ined wi th X = 0 .685 n m and sample - to -de tec to r d i s t ances o f 4 m (Figure 4a), and 1.5 m (Figures 4 b and 4c), for w h i c h this peak lies b e y o n d the Q-range o f the ins t rument . A t the shor tes t ava i lab le w a v e l e n g t h on SANS-J , h = 0 .357 nm, and the shor tes t poss ib le sample - to -de tec to r d i s tance of 1.5 m, we were able to o b s e r v e the tail o f the f i rs t -order d i f f rac t ion peak of the c rys ta l l ine reg ions in the pure aqueous sys tem as an up tu rn in the sca t ter ing at the edge of the mul t idetector , as s h o w n by the crosses in F igure 5. This up tu rn in the sca t ter ing at the edge o f the Q-range was o b s e r v e d to be the s ame for the pure aqueous , P V M E - a d d e d and PEO- added samples , as s h o w n respec t ive ly by the crosses ,
752 Smalley, Jinnai, Hashimoto and Koizumi Clays and Clay Minerals
1000
100
1 0
100
10
"7
0.1
0.01 0.1
100
10
"7, E
0.1
' ' 0 ' I . . . . . . . . A 0
- a o + 9"2~ /~ 0 [] 12.7~
A X ~ A 13.8~ ~ o 17.4~
+ + [] [] + [] + DD D ~ZX^
-r + + + +
+ + + ~ + ~
(a ) . . . . . . J , , , , , , 7 8 9 2 3 4 5 6 7 8 9
0.1
Q / n m -1 " ' | | ! | i i i i
[] []
0 0
(b)
|
[]
(c)
[] o 8~ ca O 17~
rn
o []
13 13 000000000 [] D~O 0 %
0 0 0 0 0 0 0 , . , , n 0 nn o
[] D
3 1
-1 Q / n m
! | , i w i |
o 8~ [] 17~
[]
o o o o O~RQO 000
uo D %
% :
O.Ol ~ 1
-1 Q / n m
Figure 4. a) The temperature-induced phase transit ion in the c = 0.1 M pure aqueous system for a sample with T~ = 13.3 - 0.6 ~ The intensity has been plotted on a logari thmic scale to emphasize the difference in the smal l -angle scattering, b) and c) The patterns obtained a few degrees either side of T~ for c = 0.1 M PVME-added and PEO-added samples, respectively, on a logari thmic intensity scale.
Vol. 45, No. 5, 1997 The effect of added polymers on n-butylammonium vermiculite swelling 753
' . . . . . ' I
+ [3 +
13 +
0 [ 3 + I 0 [ 3 +
0 [ 3 +
1-~ o [3+
o [ 3 + o [3+
0.I 000~ 0.01
+
0 1 1
Q / nm -1
Figure 5. The upturn in the scattering at higher Q in the tactoid phase, at 25 ~ The sample-to-detector distance was 1.5 m and the wavelength h = 0.357 nm. The crosses, squares and circles denote the scattering from the pure aqueous sys- tem and those with 1% PVME and 1% PEO, respectively.
squares and circles in F igure 5. Our X R D studies o f the pure aqueous and P V M E - a d d e d sys tems at h ighe r Q values h a v e conf i rmed that the crys ta l l ine peak po- s i t ion is unaf fec ted by added polymer , so 5) the spac- ing between the vermiculite layers is not affected by the added polymer when they are collapsed by an in- crease in temperature.
Study of P V M E - , P E t - and PAA-Subs t i t u t ed Gels at v = 0.01, c = 0.01 M
Simi la r expe r imen t s to those desc r ibed above were car r ied out at c = 0.01 M. As before , the P A A - a d d e d samples did not swell. In the pure aqueous sys tem, a w e a k in te r fe rence ef fec t was o b s e r v e d at Q = 0.19 n m -~, co r re spond ing to a d -va lue o f d = 33 nm, and the scat ter ing c h a n g e d p ro found ly b e t w e e n 29 and 31 ~ co r re spond ing to a phase t rans i t ion t empera tu re T c = 30 • 1 ~ B o t h the values for d and T c were aga in in good ag reemen t wi th the l i terature values and the phase t rans i t ion was again p r o v e d to be comple t e ly revers ib le by recool ing to 17 ~ and showing the scat- te r ing to be ident ica l to tha t ob ta ined p rev ious ly at this tempera ture .
The a lmos t pe r fec t s ample - to - sample reproducib i l i ty of the 0.1 M samples and the good ag reemen t wi th the pub l i shed resul ts for d and Tc at b o t h c = 0.1 M and c = 0.01 M s h o w e d that any d i f fe rences we o b s e r v e d in the proper t ies of the sys tems wi th added p o l y m e r were genu ine effects. However , at c = 0.01 M we were on ly able to s tudy 2 P V M E - a d d e d and 2 P E t - a d d e d samples , so we d id not ob ta in s tat is t ical ly s igni f icant i n fo rma t ion on the effect of added po l ym er on the d- va lues at this salt concent ra t ion . Al l 4 po lymer - added samples gave w e a k in te r fe rence m a x i m a in the Q- r ange b e t w e e n 0.18 and 0.20 n m -J, co r r e spond ing to d-va lues in the r ange b e t w e e n 31 and 35 nm. Th i s is ins igni f icant ly d i f ferent to the va lue ob ta ined for the
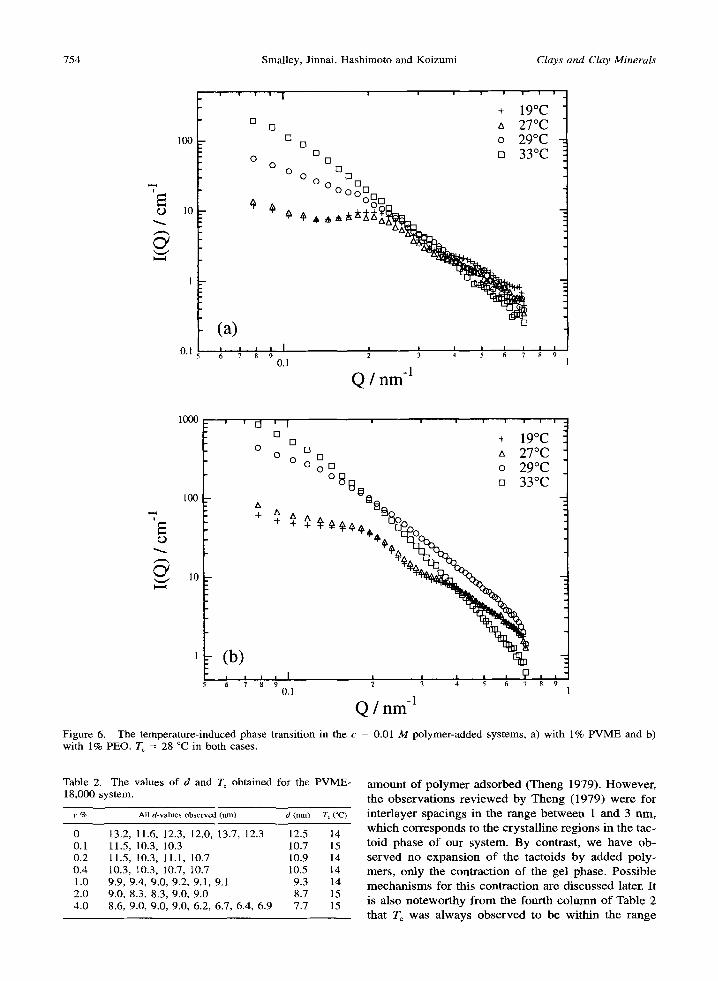
pure aqueous system, so the ef fec t is p r o b a b l y a w e a k one. The 2 samples g iv ing the c learer d i f f rac t ion t races were c h o s e n for an inves t iga t ion of To, w h i c h is m u c h less sens i t ive to s ample - to - sample var iabi l i ty than d (Wi l l i ams et al. 1994). The t e m p e r a t u r e - d e p e n d e n t scans ob ta ined f r o m the c = 0.01 M P V M E samples are s h o w n in Figures 6a and those for the P E t sam- pies in F igure 6b. In b o t h cases Tc = 28 + 1 ~ com- pa red wi th Tc = 30 • 1 ~ for the c = 0.01 M pure aqueous system. Th i s aga in ind ica tes tha t the addi t ion o f p o l y m e r causes on ly a s l ight c h a n g e in the prop- er t ies o f the sys tem at c = 0.01 M, and re in forces resu l t (4) ob ta ined at c = 0.1 M.
S tudy o f the (v, T) B e h a v i o r of the c = 0.1 M P V M E - 1 8 , 0 0 0 Sys t em
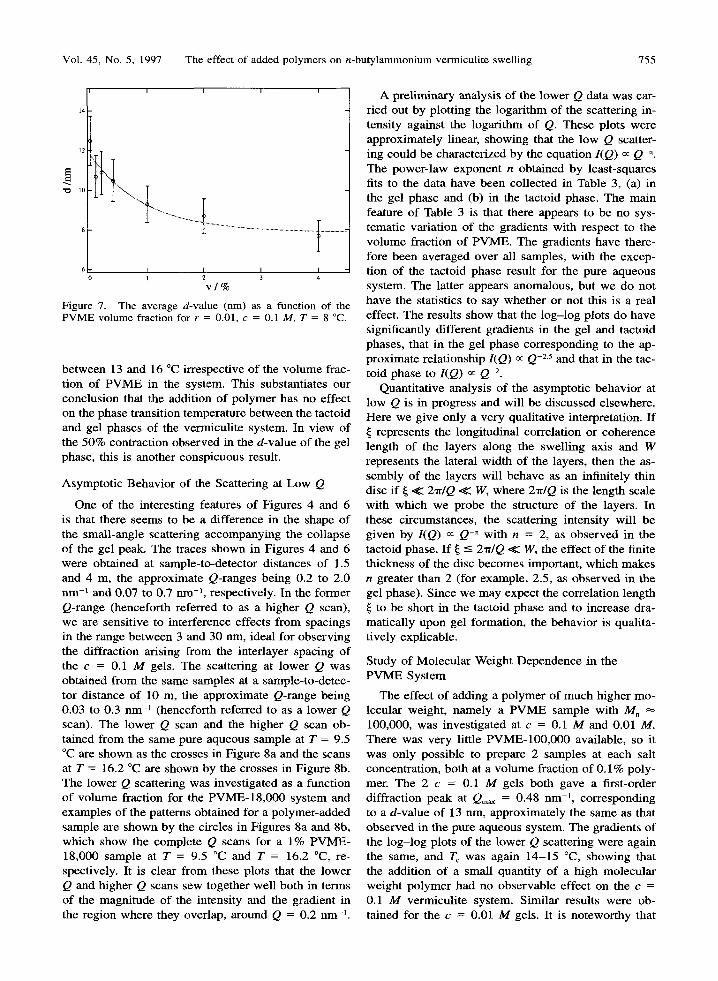
Since the addi t ion of P E t and P V M E had ve ry s im- i la r effects , i t s eemed logical to con t inue work wi th 1 sys tem at the expense o f the other. We dec ided to con- t inue work wi th the P V M E sys t em as our neut ra l poly- me r sys tem, as this one has extra in teres t because o f the P V M E - w a t e r phase separa t ion w h i c h occurs in the absence o f c lay at h ighe r t empera tu res (Tanaka 1993). The m a i n d e v e l o p m e n t was to sys temat ica l ly invest i - gate the ef fec t o f the v o l u m e f rac t ion o f P V M E on b o t h d and Tc for the r = 0.01, c = 0.1 M system. The deta i ls of this inves t iga t ion h a v e b e e n repor ted previ - ous ly ( J inna i et al. 1996), so we p roceed direct ly to the results , wh ich are g iven in Table 2. The ave rage d -va lues ob ta ined h a v e b e e n p lo t t ed as a func t ion o f the v o l u m e fract ion, expressed as a percentage , in Fig- ure 7.
The n u m b e r of samples s tudied in each case was b e t w e e n 3 and 8, and the comple t e set o f resul ts ob- t a ined is g iven in the s econd c o l u m n of Table 2. The d-va lues for the p o l y m e r - a d d e d samples were v e r y cons i s t en t f rom sample to sample , wi th the excep t ion o f the 4 % P V M E samples , where 2 separa te g roups of resul ts wi th d-va lues of approx ima te ly 9 and 6.5 n m gave r ise to an ave rage va lue o f 7.7 nm. The var ia t ion o f the average d-va lue wi th the v o l u m e f rac t ion seems to be wel l r epresen ted by the exponen t i a l fit s h o w n by the dot ted l ine in F igure 7, whe re the er ror bars rep- r e sen t • 10% of the ave rage va lues obta ined , due to s ample - to - sample variabi l i ty . T h e exponen t i a l fit is cha rac te r i zed by:
d ~ 7.9 + 3.9 exp ( - 1 . 0 v ) [3]
whe re d is expressed in n m and v is expressed as a percen tage . The correc t l imi t of d ~ 12 n m is ob ta ined for the pure aqueous sys t em and the va lue d ~ 8 n m is ob ta ined as the l imi t ing resu l t for h i g h p o l y m e r vol- u m e fract ions.
The decrease in the d -va lue w i th inc reas ing a m o u n t o f p o l y m e r in the sys t em is an in te res t ing result , as it has b e e n repor ted that the in te r layer spac ing o f c l a y - p o l y m e r c o m p l e x e s g e n e r a l l y i n c r e a s e s w i th the
754 Smalley, Jinnai, Hashimoto and Koizumi Clays and Clay Minerals
7
100
r 1o
0.1
! !
[ ]
(a) i i i ! 6 7 8 9
| ! i i I i ! l
+ 19~ zx 27~
[] D o 29~ [] [] 33~ [ ]
� 9 o o o O000DnDO~
[ ]
0.1 -1 Q/nm
"7
cr V
1000
100
10
' ' 0 ' I . . . . . . . []
[] + 19~ o o [] [] zx 27~
0 0 o [] o 29~
~ B [] 33~
( b ) %
6 7 8 9 2 0.1
-1 Q/nm Figure 6. The temperature-induced phase transition in the c = 0.01 M polymer-added systems, a) with 1% PVME and b) with 1% PEO. T c = 28 ~ in both cases.
Table 2. The values of d and Tc obtained for the PVME- 18,000 system.
v % Al l d -va lues o b s e r v e d (nm) d (nm) T0 (~
0 13.2, 11.6, 12.3, 12.0, 13.7, 12.3 12.5 14 0.1 11.5, 10.3, 10.3 10.7 15 0.2 11.5, 10.3, 11.1, 10.7 10.9 14 0.4 10.3, 10.3, 10.7, 10.7 10.5 14 1.0 9.9, 9.4, 9.0, 9.2, 9.1, 9.1 9.3 14 2.0 9.0, 8.3, 8.3, 9.0, 9.0 8.7 15 4.0 8.6, 9.0, 9.0, 9.0, 6.2, 6.7, 6.4, 6.9 7.7 15
amoun t of p o l y m e r adso rbed (Theng 1979). However , the obse rva t ions r e v i e w e d by T h e n g (1979) were for in te r layer spac ings in the r ange b e t w e e n 1 and 3 rim, wh ich co r responds to the c rys ta l l ine reg ions in the tac- told phase of our system. B y contrast , we h a v e ob- s e rved no expans ion o f the tac toids b y added poly- mers , on ly the con t rac t ion o f the gel phase. Poss ib le m e c h a n i s m s for this con t rac t ion are d i scussed later. I t is also no t ewor thy f rom the four th c o l u m n o f Table 2 that T c was a lways o b s e r v e d to be wi th in the r ange
Vol. 45, No. 5, 1997 The effect of added polymers on n-butylammonium vermiculite swelling 755
I I I I
12
I I I I 1 2 3 4
v / %
Figure 7. The average d-value (nm) as a function of the PVME volume fraction for r = 0.01, c = 0.1 M, T = 8 ~
between 13 and 16 ~ irrespective of the volume frac- tion of PVME in the system. This substantiates our conclusion that the addition of polymer has no effect on the phase transition temperature between the tactoid and gel phases of the vermiculite system. In view of the 50% contraction observed in the d-value of the gel phase, this is another conspicuous result.
Asymptotic Behavior of the Scattering at Low Q
One of the interesting features of Figures 4 and 6 is that there seems to be a difference in the shape of the small-angle scattering accompanying the collapse of the gel peak. The traces shown in Figures 4 and 6 were obtained at sample-to-detector distances of 1,5 and 4 m, the approximate Q-ranges being 0.2 to 2.0 nm -~ and 0.07 to 0.7 nm -1, respectively. In the former Q-range (henceforth referred to as a higher Q scan), we are sensitive to interference effects from spacings in the range between 3 and 30 nm, ideal for observing the diffraction arising from the interlayer spacing of the c = 0.1 M gels. The scattering at lower Q was obtained from the same samples at a sample-to-detec- tor distance of 10 m, the approximate Q-range being 0.03 to 0.3 nm -l (henceforth referred to as a lower Q scan). The lower Q scan and the higher Q scan ob- tained from the same pure aqueous sample at T = 9.5 ~ are shown as the crosses in Figure 8a and the scans at T = 16.2 ~ are shown by the crosses in Figure 8b. The lower Q scattering was investigated as a function of volume fraction for the PVME-18,000 system and examples of the patterns obtained for a polymer-added sample are shown by the circles in Figures 8a and 8b, which show the complete Q scans for a 1% PVME- 18,000 sample at T = 9.5 ~ and T = 16.2 ~ re- spectively. It is clear from these plots that the lower Q and higher Q scans sew together well both in terms of the magnitude of the intensity and the gradient in the region where they overlap, around Q = 0.2 nm -I.
A preliminary analysis of the lower Q data was car- l ied out by plotting the logarithm of the scattering in- tensity against the logarithm of Q. These plots were approximately linear, showing that the low Q scatter- ing could be characterized by the equation I(Q) ~ Q-n. The power-law exponent n obtained by least-squares fits to the data have been collected in Table 3, (a) in the gel phase and (b) in the tactoid phase. The main feature of Table 3 is that there appears to be no sys- tematic variation of the gradients with respect to the volume fraction of PVME. The gradients have there- fore been averaged over all samples, with the excep- tion of the tactoid phase result for the pure aqueous system. The latter appears anomalous, but we do not have the statistics to say whether or not this is a real effect. The results show that the log- log plots do have significantly different gradients in the gel and tactoid phases, that in the gel phase corresponding to the ap- proximate relationship I(Q) oc Q-Z5 and that in the tac- told phase to I (Q) oc Q-2.
Quantitative analysis of the asymptotic behavior at low Q is in progress and will be discussed elsewhere. Here we give only a very qualitative interpretation. If
represents the longitudinal correlation or coherence length of the layers along the swelling axis and W represents the lateral width of the layers, then the as- sembly of the layers will behave as an infinitely thin disc if ~ << 2'rr/Q << W, where 2'rr/Q is the length scale with which we probe the structure of the layers. In these circumstances, the scattering intensity will be given by I(Q) ~ Q n with n = 2, as observed in the tactoid phase. If ~ --< 2'rrlQ << W, the effect of the finite thickness of the disc becomes important, which makes n greater than 2 (for example, 2.5, as observed in the gel phase). Since we may expect the correlation length
to be short in the tactoid phase and to increase dra- matically upon gel formation, the behavior is qualita- tively explicable.
Study of Molecular Weight Dependence in the PVME System
The effect of adding a polymer of much higher mo- lecular weight, namely a PVME sample with M n 100,000, was investigated at c = 0.1 M and 0.01 M. There was very little PVME-100,000 available, so it was only possible to prepare 2 samples at each salt concentration, both at a volume fraction of 0.1% poly- mer. The 2 c = 0.1 M gels both gave a first-order diffraction peak at Qm~ = 0.48 nm -1, corresponding to a d-value of 13 nm, approximately the same as that observed in the pure aqueous system. The gradients of the log-log plots of the lower Q scattering were again the same, and Tc was again 14-15 ~ showing that the addition of a small quantity of a high molecular weight polymer had no observable effect on the c = 0.1 M vermiculite system. Similar results were ob- tained for the c = 0.01 M gels. It is noteworthy that

756 Smalley, Jiunai, Hashimoto and Koizumi Clays and Clay Minerals
"7,
CY
1 0 0 -
1 0 -
1 -
0 .1 -
0 . 0 1 -
0 . 0 0 1 -
0 . 0 0 0 1
0.01
(a)
O 1% P V M E + p u r e a q u e o u s
+ + +
0 0 ~ + + _ u 0 0 " 1 - % i
"~ 0 0 0 ~ + + + 4 . ~
0 . . , ~ , , . i . . . . . . . . , 1 5 7 8 9 3 4 5 6 7 8 9
0.1 1 -1 Q/nm
o 1% P V M E 100 - + + + + . + p u r e a q u e o u s
-~++§
10 O O O O +++++-~a_
"~ ~ ~o o ~++
0 . 0 1 -
0 . 0 0 1 -
(b) 0
I I I I I , , , , i , 1 0.0001 ~ ~ 41 ~ 6 7 8 9 ~ ~ 4 5 ~ 7 8 9 0.01 0.1 1
-1 Q/nm Figure 8. The complete Q scans obtained a) at T = 9 ~ and b) at T = 16 ~ in the gel phase and tactoid phase, respectively, on logarithmic intensity and Q scales. The crosses and the circles denote the scattering from the pure aqueous and 1% PVME- added samples, respectively, and the straight lines indicate the approximate gradients of the low Q scattering in each phase. Note that with T c = 15 ~ the tactoid phase results are near to Tc and there is evidence for weak persistence of the gel peak around Q = 0.7 nm ' in the diffraction trace from the PVME-added sample at 16 ~
none of the neutral po lymers had any observable effect on either d or Tc at c = 0.01 M.
D I S C U S S I O N
Sizes of Po lymer Molecu les
In d iscuss ing the poss ib le mechan i sms for our re-
suits, it is useful to have an est imate of the sizes o f the po lymer m o l e c u l e s used. Brandrup and Immergu t (1989) give the unper turbed end- to-end dis tance r0 of
a P V M E chain as:
ro = 900 M 1/2 • 10 -4 n m [41
Insert ing M = 18,000 into this formula gives r0 ~- 12
nm, and dividing this number by ~r gives the radius
of gyrat ion Rg ~ 5 nm, as s h o w n in the first row o f
Table 4. Uti l iz ing s imilar formulae for the P E O and
P A A chains enables us to comple te Table 4, where the
r 0 and Rg values have been given to 2 significant fig-
ures, the l imit o f the accuracy in the molecu la r weigh t
determinat ions .
Vol. 45, No. 5, 1997 The effect of added polymers on n-butylammonium vermiculite swelling 757
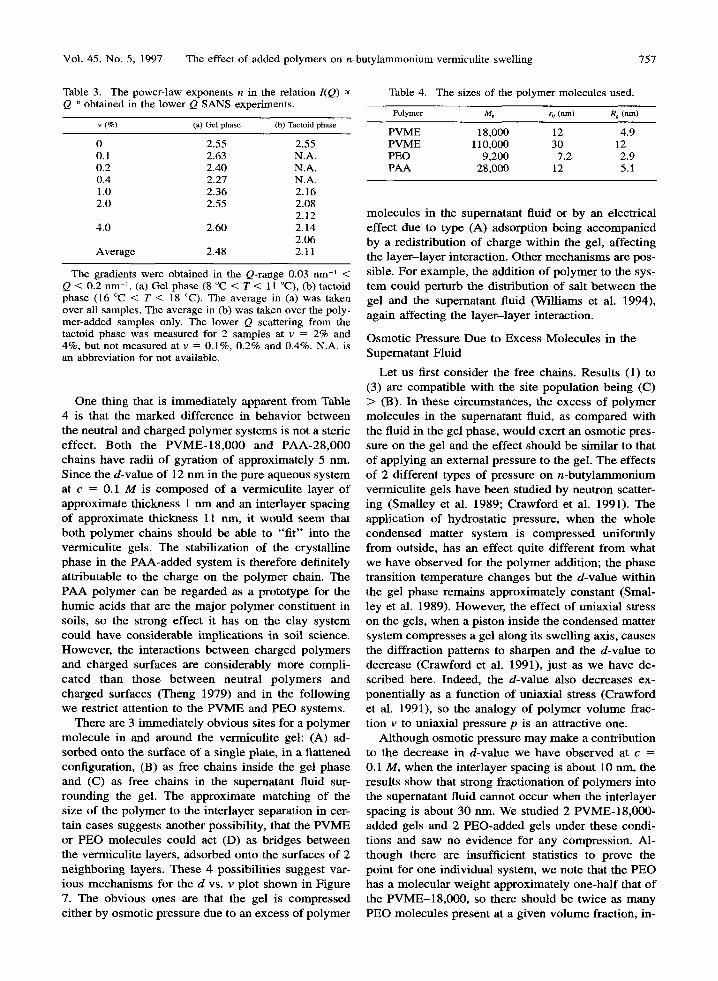
Table 3. The power-law exponents n in the relation I (Q) oc Q n obtained in the lower Q SANS experiments.
v (%) (a) Gel phase (b) Tactoid phase
0 2.55 2.55 0.1 2.63 N.A. 0.2 2.40 N.A. 0.4 2.27 N.A. 1.0 2.36 2.16 2.0 2.55 2.08
2.12 4.0 2.60 2.14
2.06 Average 2.48 2.11
The gradients were obtained in the Q-range 0.03 nm -1 < Q < 0.2 nm -1. (a) Gel phase (8 ~ < T < 11 ~ (b) tactoid phase (16 ~ < T < 18 ~ The average in (a) was taken over all samples. The average in (b) was taken over the poly- mer-added samples only. The lower Q scattering from the tactoid phase was measured for 2 samples at v = 2% and 4%, but not measured at v = 0.1%, 0.2% and 0.4%. N.A. is an abbreviation for not available.
One thing that is immedia te ly apparent f rom Table 4 is that the marked difference in behavior be tween the neutral and charged po lymer systems is not a steric ef fect . Both the P V M E - 1 8 , 0 0 0 and P A A - 2 8 , 0 0 0 chains have radii o f gyrat ion o f approximately 5 nm. Since the d-value o f 12 nm in the pure aqueous system at c = 0.1 M is composed of a vermicul i te layer of approximate thickness 1 nm and an interlayer spacing of approximate thickness 11 rim, it wou ld seem that both po lymer chains should be able to " f i t " into the vermicul i te gels. The stabilization of the crystal l ine phase in the PAA-added system is therefore definitely attributable to the charge on the po lymer chain. The P A A po lymer can be regarded as a prototype for the humic acids that are the major po lymer consti tuent in soils, so the strong effect it has on the clay system could have considerable implicat ions in soil science. However , the interactions be tween charged polymers and charged surfaces are considerably more compli - ca ted than those b e t w e e n neutra l p o l y m e r s and charged surfaces (Theng 1979) and in the fo l lowing we restrict attention to the P V M E and PEO systems.
There are 3 immedia te ly obvious sites for a po lymer molecule in and around the vermicul i te gel: (A) ad- sorbed onto the surface of a single plate, in a flattened configuration, (B) as free chains inside the gel phase and (C) as free chains in the supernatant fluid sur- rounding the gel. The approximate matching of the size o f the po lymer to the interlayer separation in cer- tain cases suggests another possibility, that the P V M E or PEO molecules could act (D) as bridges be tween the vermicul i te layers, adsorbed onto the surfaces o f 2 neighboring layers. These 4 possibil i t ies suggest var- ious mechanisms for the d vs. v plot shown in Figure 7. The obvious ones are that the gel is compressed either by osmotic pressure due to an excess o f po lymer
Table 4. The sizes of the polymer molecules used.
Polymer M. r 0 (nm) R e (nm)
PVME 18,000 12 4.9 PVME 110,000 30 12 PEO 9,200 7.2 2.9 PAA 28,000 12 5.1
molecules in the supernatant fluid or by an electrical effect due to type (A) adsorption being accompanied by a redistr ibution of charge within the gel, affect ing the l aye r - l aye r interaction. Other mechan isms are pos- sible. For example , the addition o f po lymer to the sys- tem could perturb the distribution of salt be tween the gel and the supernatant fluid (Will iams et al. 1994), again affect ing the l ayer - layer interaction.
Osmot ic Pressure Due to Excess Molecu les in the Supernatant Fluid
Let us first consider the free chains. Results (1) to (3) are compat ible with the site populat ion being (C) > (B). In these circumstances, the excess of po lymer molecules in the supernatant fluid, as compared with the fluid in the gel phase, would exert an osmot ic pres- sure on the gel and the effect should be similar to that of applying an external pressure to the gel. The effects o f 2 different types of pressure on n -bu ty lammonium vermicul i te gels have been studied by neutron scatter- ing (Smal ley et al. 1989; Crawford et al. 1991). The application of hydrostat ic pressure, when the whole condensed matter system is compressed uni formly f rom outside, has an effect quite different f rom what we have observed for the po lymer addition; the phase transition temperature changes but the d-value within the gel phase remains approximately constant (Smal- ley et al. 1989). However , the effect o f uniaxial stress on the gels, when a piston inside the condensed mat ter system compresses a gel along its swel l ing axis, causes the diffract ion patterns to sharpen and the d-value to decrease (Crawford et al. 1991), jus t as we have de- scribed here. Indeed, the d-value also decreases ex- ponential ly as a funct ion of uniaxial stress (Crawford et al. 1991), so the analogy of po lymer vo lume frac- tion v to uniaxial pressure p is an attractive one.
Al though osmotic pressure may make a contr ibution to the decrease in d-value we have observed at c = 0.1 M, when the interlayer spacing is about 10 nm, the results show that strong fract ionation o f po lymers into the supernatant fluid cannot occur when the inter layer spacing is about 30 nm. We studied 2 PVME-18 ,000- added gels and 2 PEO-added gels under these condi- t ions and saw no evidence for any compression. Al- though there are insufficient statistics to prove the point for one individual system, we note that the PEO has a molecu la r weight approximate ly one-ha l f that o f the P V M E - 1 8 , 0 0 0 , so there should be twice as many PEO molecules present at a g iven v o l u m e fraction, in-
758 Smalley, Jinnai, Hashimoto and Koizumi Clays and Clay Minerals
t ens i fy ing the effect, l ead ing to yet smal le r d -va lues for s t rong f rac t iona t ion at c = 0.01 M. T he insens i t iv- i ty o f the d -va lue for the 4 po lymer - added samples s tud ied under these cond i t ions therefore suggests (C)
(B) at the larger in te r layer spac ing studied. S ince the c = 0.01 M gels are more compres s ib l e than the c = 0.1 M gels (Crawford et al. 1991), this fur ther sug- gests tha t osmot ic p ressure is p r o b a b l y not the l ead ing effect in the decrease in d -va lue o b s e r v e d at c = 0,1 M. It therefore appears tha t the po lymers have some effec t ins ide the gel. The mos t l ikely source of this effect is po lymer adsorp t ion on to the surfaces of the ve rmicu l i t e layers.
Po lymer Adso rp t ion on to the Vermicu l i t e Sur face
In order to es t imate the degree of po l ym er adsorp- t ion, we first ca lcula te the total layer surface area o f the vermicu l i t e c lay in the swol l en (gel) state. The for- mu la for the d ry N a Euca tex sample g iven in the " E x - p e r i m e n t a l " sec t ion can be abbrev ia ted as:
Layer 1.3 - 1.3Na +
where the uni t cel l we igh t of 807 is c o m p o s e d o f 777 f rom the vermicu l i t e layer and 30 f rom the 1.3 cha rge ba l anc ing in ter layer Na cat ions. The d ry n -bu ty lam- m o n i u m Eucatex therefore has the formula :
Laye r J.3-1.3C4HgNH~ -
and the con t r ibu t ion o f 96 f rom the 1.3 n -bu ty l am- m o n i u m ions increases the uni t cel l we igh t to 873. T he d ry n - b u t y l a m m o n i u m Euca tex has a d -va lue of 1.49 n m and the wet n - b u t y l a m r n o n i u m Euca tex used in the swel l ing expe r imen t s has a d-va lue o f 1.94 n m (Humes 1985). A l t h o u g h the in -p lane d i m e n s i o n s of the uni t cel l are s l ight ly d e p e n d e n t on the type o f i somorphous subs t i tu t ions in the latt ice, and the exact d imens ions of the Euca tex cel l are u n k n o w n , it seems reasonab le to take the s tandard va lue of 0.515 x 0.89 n m 2 for the surface area of the cell (van O l p h e n 1977). This de- t e rmines the n u m b e r o f wate r molecu les in the wet c rys ta l l ine state via the densi ty: the v o l u m e of the un i t cel l is 0 .89 n m 3, and this m u s t con ta in 996 a.u. in order to reproduce the o b s e r v e d dens i ty p = 1.86 g c m 3. T he wa te r therefore con t r ibu tes 123 a.u. per un i t cel l and the fo rmula for the we t n - b u t y l a m m o n i u m Euca tex is:
Layer 1.3 1.3 { C4H9NH3.5.3(H20) }
The va lue of 5.3 wate r molecu les pe r ca t ion is a typ- ical one for a hydra t ed c rys ta l l ine ve rmicu l i t e (Skipper et al. 1994).
The ca lcu la t ion o f the surface area is now stra ight- forward . Each cel l has a surface area of 0.515 • 0 .89 n m 2 on each side, and 996 g of the c lay conta ins 6 .02 x 1023 cells ( A v o g a d r o ' s number ) . Thus , the total sur- face area of 1 g of n - b u t y l a m m o n i u m vermicu l i t e is:
(9-~6) • 2 1 5 1 0 2 3 • • 2 1 5 2 n m z g - 1
= 554 m 2 g-1 [5]
w h i c h co r responds to 1030 m 2 c m 3. It is un l ike ly tha t the th i rd f igure in this n u m b e r is t ruly signif icant , so we take the surface area o f 1 c m 3 o f the ve rmicu l i t e to be 1000 mL
T h e ca lcu la t ion of the area occup ied b y I c m 3 of adso rbed p o l y m e r is less clear-cut. The t rue s egmen t dens i ty profi le o f a p o l y m e r in con tac t wi th a c lay surface has not, to our knowledge , b e e n measured , bu t is supposed to cons i s t o f trains, loops and tails (F leer et al. 1993). W e can gain a qual i ta t ive ins igh t by us ing the radius o f the gyra t ion o f the p o l y m e r mo lecu le in solut ion to es t imate an ef fec t ive v o l u m e pe r mo lecu le Veff as:
4 Vef f = ~"~R~ [6]
I f we n o w assume that:
Veff = Aplp [7]
where Ap is the ef fec t ive sur face area occup ied by a p o l y m e r mo lecu le conf ined wi th in a d i s tance lp of the surface, we can calcula te the cove rage i f we k n o w the ef fec t ive th ickness o f the adso rbed layer lp. AS a first guess, we take lp = 1 nm. For the mos t ex tens ive ly s tudied sys tem, the P V M E - 1 8 , 0 0 0 sys tem, inser t ing Rg = 5 n m and lp = 1 n m into these c rude equa t ions gives A v = 500 n m 2, where on ly 1 s igni f icant f igure has b e e n kep t because the ca lcu la t ion is an order of m a g n i t u d e one only. As the dens i ty of the P V M E is approx imate ly 1 g c m 3, 1 c m 3 of a species wi th Mn = 18,000 con ta ins approx ima te ly 3 • 1019 molecu les , wh ich would occupy 1.5 • 10 z2 n m 2 ~ 10,000 m 2 of surface area. This is about 10 t imes the surface area of fered by 1 c m 3 of the vermicul i te . As r was he ld cons t an t at 0.01, this impl ies tha t v = 0.001 is suffi- c ient for comple t e cove rage of the surface i f the poly- me r is s t rongly adsorbed.
Such s t rong po lymer adsorp t ion wou ld lead to dis- p l a c e m e n t of n - b u t y l a m m o n i u m counter ions , as wel l as wa te r molecu les , f r o m the ve rmicu l i t e surfaces . D i s p l a c e m e n t of the n - b u t y l a m m o n i u m coun te r ions f rom the surface wou ld lead to an inc rease in Z, ff, the e f fec t ive sur face cha rge tha t med ia tes the e lect ros ta t ic in te rac t ion b e t w e e n the layers (Low 1987). This in turn wou ld cause a decrease in the d -va lue (Sogami et al. 1991; S o g a m i et al. 1992). I f we use F igure 7 o f the exact m e a n field t heo ry so lu t ion to the 1-d imen- s ional col lo id p r o b l e m (Sogami et al. 1992) to es t imate the c h a n g e in Z~ff neces sa ry to b r ing abou t a c h a n g e in d f rom 12 to 8 nm, it co r re sponds to a 2 to 3 t imes increase . This is not imposs ib le , because the ef fec t o f un iax ia l stress on the pure aqueous gels (Crawford et
Vol. 45, No. 5, 1997 The effect of added polymers on n-butylammonium vermiculite swelling 759
al. 1991) has shown that, at c = 0.1 M, (Zeff/Z, ot) = 0.2, correspoiading to 80% adsorption of the n-buty- lammonium ions. An increase in the effective surface charge of • would imply (Z~tf/Zto,) = 0.5, namely that 50% of the ions were adsorbed, rather than 80% in the pure aqueous system. There are 3 problems with this mechanism, however, as discussed below.
For a compressed polymer (contained within 1 nm of the surface) occupying the same effective volume as a free chain in solution, the surface would be com- pletely covered at all the volume fractions studied if we assume an H-type (high affinity) isotherm (Theng 1979) for the adsorption process, corresponding to (A) >> (C). However, such strong confinement of the poly- mer close to the surface in the gel phase may represent an underestimate of lp if there are substantial numbers of segments in trains and loops. We can obtain an up- per estimate for the polymer adsorption from the data collected by Theng (1979) for the plateau value of poly(vinyl alcohol) (Mn = 70,000) adsorption on clay surfaces. This was found to be remarkably similar for many 2:1 type layer silicates, ranging from 1.1 to 1.3 mg m -2. This corresponds to about 1 cm 3 of polymer adsorbed onto 1 cm 3 of vermiculite in our case, or complete coverage at v = 0.01 for H-type adsorption. In these circumstances, the confinement distance would be given by lp = 10 nm (approximately the same as the interlayer spacing), or 2R v so the latter model is a physically reasonable one.
Our order of magnitude calculations tell us that the vermiculite can adsorb between 0.1 to 1.0 times its own volume onto surface sites, depending on the de- gree of flattening of the polymer configuration. Of course, in the latter model, there would also be type (D) adsorption at c = 0.1 M. The approximate match- ing of 2Rg and lp in the case when the contraction was observed suggests that type (D) adsorption might be important, namely that a substantial number of poly- mer molecules are physically adsorbed onto both of 2 neighboring vermiculite layers, bridging them. Such "bonds" between the vermiculite layers might have the effect of binding them more strongly and so ex- plain results (1)-(3). However, all possible mecha- nisms run into the problem that they also have to ex- plain results (4) and (5), the insensitivity of Tc and the d-value in the tactoids to polymer addition.
Insensitivity of Tc and the d-value in the Tactoids
The most remarkable feature of all our results was (4), the insensitivity of Tc to the addition of neutral polymers, and its sister result (5), that the c-axis d- value of 1.94 nm in the collapsed regions in samples with added polymer is equal to that in the pure aque- ous system. Since the vermiculite layers themselves have a thickness of approximately 1 nm, the interlayer spacing in the crystalline regions is also approximately equal to 1 nm, so it is not possible for a polymer with
a radius of gyration of several nanometers to exist as f r e e chains inside the tactoids. Although it is possible for the polymer to be adsorbed into the 1-nm gap be- tween the clay plates in a flattened configuration, it is unlikely that substantial polymer adsorption into the tactoids would lead to an identical interlayer spacing to that obtained in the pure aqueous system, so result (5) suggests that only a very small number of polymer molecules can be included in the crystalline regions. Whether or not this in turn suggests that there is little adsorption in the gel phase is then a question of ki- netics. As the dynamics of polymer desorption are nor- mally considered to be slow (Theng 1979) and the dynamics of the n-butylammonium vermiculite phase transition have been reported to be surprisingly rapid, of the order of 10 rain (Smalley et al. 1989), it seems unlikely that the polymer could desorb during the time it takes for the plates to collapse. Result (5) therefore throws some doubt on the importance of sites (A) and (D).
CONCLUSION
Whatever the mechanisms, the facts are interesting in their own right. It seems unlikely that any theory could have predicted results (1)-(5) in advance of the experiments and they are all clear-cut results on a well- defined 4-component system. The general picture that emerges is that the effect of adding neutral polymers to the n-butylammonium vermiculite system is a sur- prisingly weak one, especially with regard to the in- sensitivity of To. This result is difficult to reconcile with substantial polymer adsorption onto the vermic- ulite surfaces and indicates that the driving force for the gel-tactoid phase transition must be strong. The electrical origin of this phase transition (Smalley 1990, 1994a, 1994b) is strongly supported by the fact that the gel phase is completely suppressed by the addition of a charged polymer.
ACKNOWLEDGMENTS
We would like to thank the Central Research Laboratories of the Kuraray Co. for the chemical analysis of the sodium and n-butylammonium vermiculite samples, H. Hasegawa of Kyoto University for providing us with the PVME-18,000 sample and K.A. Smalley for her assistance in the preparation of the neutron scattering samples.
REFERENCES
Braganza LE Crawford RJ, Smalley MV, Thomas RK. 1990. Swelling of n-butylammonium vermiculite in water. Clays Clay Miner 38:90-96.
Brandrup J, Immergut EH. 1989. Polymer handbook. New York: J. Wiley. 65 p.
Crawford RJ, Smalley MV, Thomas RK. 1991. The effect of uniaxial stress on the swelling of n-butylammonium ver- miculite. Adv Colloid Interface Sci 34:537-560.
Fleer GJ, Cohen Stuart MA, Scheutjens JMHM, Cosgrove T, Vincent B. 1993. Polymers at interfaces. London: Chap- man & Hall. 502 p.
760 Smalley, Jinnai, Hashimoto and Koizumi Clays and Clay Minerals
Garrett WG, Walker GE 1962. Swelling of some vermicu- lite-organic complexes in water. Clays Clay Miner 9:557- 567.
Humes RE 1985. Interparticle forces in clay minerals [D. Phil. thesis]. Oxford, UK: Oxford Univ. p 140-153.
Jinnai H, Smalley MV, Hasbimoto T, Koizumi S. 1996. Neu- tron scattering study of vermiculite-poly(vinyl methyl ether) mixtures. Langmuir 12:1199-1203.
Kleijn WB, Oster JD. 1982. A model of clay swelling and tactoid formation. Clays Clay Miner 30:383-390.
Lagaly G. 1981. Characterization of clays by organic com- pounds. Clay Miner 16:1-21.
Low PF. 1987. Structural component of the swelling pressure of clays. Langmuir 3:18-25.
Norrish K, Rausell-Colom JA. 1963. Low-angle X-ray dif- fraction studies of the swelling of montmorillonite and ver- miculite. Clays Clay Miner 10:123-149.
Rausel-Colom JA. 1964. Small-angle X-ray diffraction study of the swelling of butylammonium vermiculite. Trans Faraday Soc 60:190-201.
RausellM2olom JA, Saez-Aunon J, Pons CH. 1989. Vermic- ulite gelation: Structural and textural evolution. Clay Miner 24:459-478.
Shibayama M, Hashimoto T. 1986. Small-angle X-ray scat- tering analyses of lamellar microdomains based on a model of one-dimensional paracrystal with uniaxial orientation. Macromolecules 19:740-749.
Skipper NT, Soper AK, Smalley MV. 1994. Neutron diffrac- tion study of calcium vermiculite: Hydration of calcium ions in a confined environment. J Phys Chem 98:942-945.
Smalley MV. 1990. Electrostatic interaction in macroionic solutions and gels. Mol Phys 71 : 1251-1267.
Smalley MV. 1994a. Electrical theory of clay swelling. Langmuir 10:2884-2891.
Smalley MV. 1994b. One phase and two phase regions of colloid stability. Progr Colloid Polym Sci 97:59-64.
Smalley MV, Thomas RK, Braganza LE Matsuo T, 1989. Effect of hydrostatic pressure on the swelling of n-butylam- monium vermiculite. Clays Clay Miner 37:474-478.
Sogarni IS, Shinohara T, Smalley MV. 1991. Effective inter- action of highly charged plates in an electrolyte. Mol Phys 74:599-612.
Sogarni IS, Shinohara T, Smalley MV. 1992. Adiabatic pair potential of highly charged plates in an electrolyte. Mol Phys 76:1-19.
Tanaka H. 1993. Dynamic interplay between phase separa- tion and wetting in a binary mixture confined in a one- dimensional capillary. Phys Rev Lett 70:53-56.
Theng BKG. 1979. Formation and properties of clay-poly- mer complexes. Dev Soil Sci 9:37-94.
van Olphen H. 1977. An introduction to clay colloid chem- istry. New York: J. Wiley. p 254-255.
Walker GE 1960. Macroscopic swelling of vermiculite crys- tals in water. Nature 187:312-313.
Williams GD, Moody KR, Smalley MV, King SM. 1994. The sol concentration effect in n-butylammonium vermic- ulite swelling. Clays Clay Miner 42:614-627.
(Received 22 July 1996; accepted 27 January 1997," Ms. 2797)