Embed Size (px)
Citation preview


HD28.M414
no. lfe4S-
ae>vey
WORKING PAPER
ALFRED P. SLOAN SCHOOL OF MANAGEMENT
THE EFFECT OF ACCOUNTING PROCEDURE CHANGES
ON EXECUTIVES' REMUNERATION
Paul Healy,Sok-Hyon Kang
Sloan School of Management, M.I.T.
andKrishna Palepu
Harvard Business School
June 1985
MIT Sloan School of Management Working Paper: #1668-85
MASSACHUSETTS
INSTITUTE OF TECHNOLOGY50 MEMORIAL DRIVE
CAMBRIDGE, MASSACHUSETTS 02139

THE EFFECT OF ACCOUNTING PROCEDURE CHANGESON EXECUTIVES' REMUNERATION
/
Paul Healy,Sok-Hyon Kang
Sloan School of Management, M.I.T.and
Krishna PalepuHarvard Business School
June 1985
MIT Sloan School of Management Working Paper: #1668-85
Second Draft. Not to be quoted.
We wish to thank Andrew Christie, Linda DeAngelo, Bob Kaplan, Rick Ruback,
Ross Watts and Jerry Zimmerman for their helpful comments on earlier drafts
of this paper. We are also grateful to Bob Holthausen and Richard Rikert
for letting us use their data bases of changes in accounting procedures.

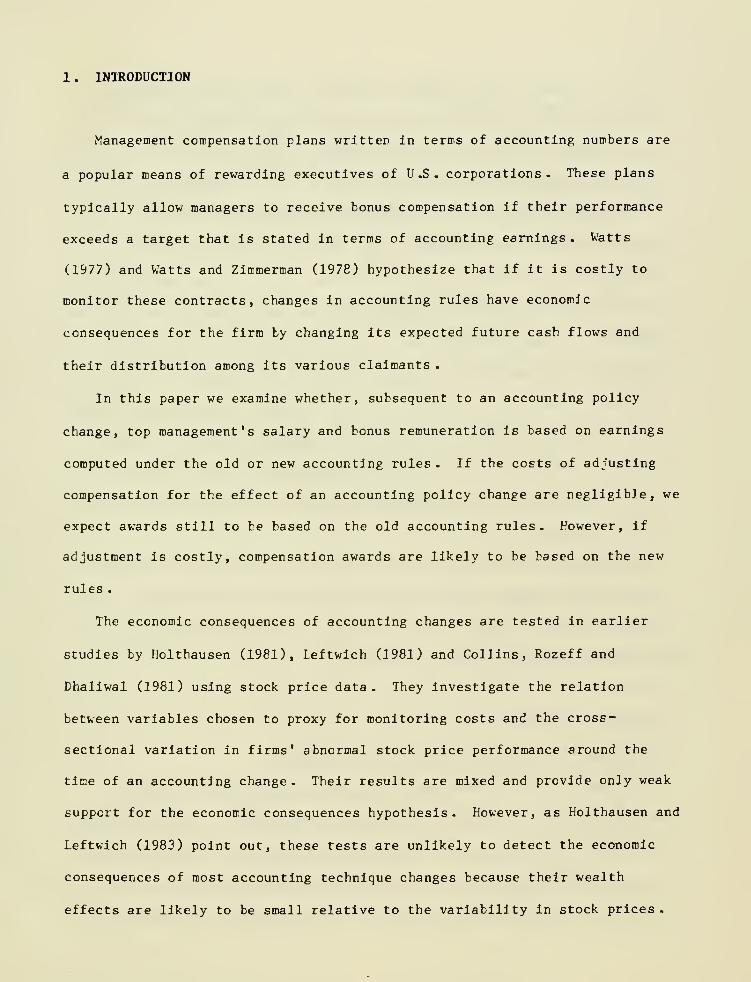
1 . INTRODUCTION
Management compensation plans written in terms of accounting numbers are
a popular means of rewarding executives of U.S. corporations. These plans
typically allow managers to receive bonus compensation if their performance
exceeds a target that is stated in terms of accounting earnings. Watts
(1977) and Watts and Zimmerman (1978) hypothesize that if it is costly to
monitor these contracts, changes in accounting rules have economic
consequences for the firm by changing its expected future cash flows and
their distribution among its various claimants .
In this paper we examine whether, subsequent to an accounting policy
change, top management's salary and bonus remuneration is based on earnings
computed under the old or new accounting rules . If the costs of adjusting
compensation for the effect of an accounting policy change are negligible, we
expect awards still to be based on the old accounting rules. However, if
adjustment is costly, compensation awards are likely to be based on the new
rules .
The economic consequences of accounting changes are tested in earlier
studies by Holthausen (1981), Leftwich (1981) and Collins, Rozeff and
Dhaliwal (1981) using stock price data. They investigate the relation
between variables chosen to proxy for monitoring costs and the cross-
sectional variation in firms' abnormal stock price performance around the
time of an accounting change . Their results are mixed and provide only weak
support for the economic consequences hypothesis. However, as Holthausen and
Leftwich (1983) point out, these tests are unlikely to detect the economic
consequences of most accounting technique changes because their wealth
effects are likely to be small relative to the variability in stock prices .

Further, the power of such tests is seriously limited by the difficulty in
identifying the event dates and specifying investors' expectations. This
paper attempts to mitigate these limitations by examining whether accounting
procedure changes are associated with changes in top management remuneration .
Our sample consists of 52 companies that changed from the FIFO to LIFO
inventory method, and 38 companies that changed from accelerated to
straight-line depreciation. For each of these firms, we test whether there
is a change in the time-series relation between executives' salary and bonus
awards and reported accounting earnings following the accounting change. The
results indicate that for our sample of companies, the relation between
compensation and reported earnings does not change following an accounting
policy change, irrespective of whether the change increases or decreases
reported earnings. This implies that top management's salary and bonus
payments are not adjusted for changes in reported earnings due to accounting
policy changes .
The remainder of the paper is organized as follows . Section two
describes the research design, sample selection and data collection. The
results of the statistical tests are presented in section three and our
conclusions are discussed in section four.
2 . RESEARCH DESIGN
2 .1 Management Compensation and Accounting Changes
In most large U.S. corporations managerial remuneration is tied to
reported earnings. Fox (1980), for example, finds that in 1980 more than 90
percent of the 1000 largest U.S. manufacturing companies used some form of
earnings-based compensation . The most popular schemes include bonus and
performance plans. Bonus plans typically award managers cash payments if
-2-

certain annual targets are attained; performance plans award managers the
value of performance units or shares in cash or stock if certain long-term
(three to five-year) performance targets are achieved. The targets in
these plans are usually written in terms of earnings per share, return on
assets or return on equity. Compensation can also be tied to earnings on an
informal basis. For example, executives' salary revisions can be a function
of earnings .
Compensation contracts are usually administered by a committee of
directors who are ineligible to participate in the schemes . Ihis committee
has discretion to set managers' salaries and award bonus and performance plan
payments .
Since compensation plan targets are stated in terms of accounting
numbers, managers' wealth will be affected by voluntary or mandatory changes
in accounting rules unless the compensation committees adjust awards to
offset the effect of the rule changes . If the costs of adjusting
compensation for changes in accounting policies are negligible, compensation
plans can either specify the accounting rules used to compute earnings for
remuneration purposes ex ante , or the plans can be adjusted ex post so that
compensation payments are fully insulated from accounting rule changes . With
costly monitoring, compensation committees weigh the benefits of insulating
compensation payments from accounting rule changes against the associated
costs .
If compensation payments are not fully insulated from the effects of
accounting changes, managers have an incentive to voluntarily switch
accounting policies to increase their compensation. However, two forces
limit their incentives to opportunistically change accounting policies .
First, if managers own shares in the firms that employ them, an accounting
-3-

rule change which reduces the value of the firm reduces their portfolio
wealth. Second, if managers opportunistically take actions that do not
maximize the value of their firms, the value of their human capital is likely
to decline- Hence, in considering accounting changes, managers trade off the
changes in their compensation against changes in their portfolio wealth and
human capital
.
To evaluate whether management compensation is fully adjusted by
compensation committees for the effects of accounting changes, we examine two
changes: changes from the FIFO to UFO inventory method, and changes from
2accelerated to straight-line depreciation. These accounting changes are
chosen for investigation for a number of reasons. First, they have a large
effect on reported earnings. Second, FIFO to LIFO switches typically
decrease reported earnings, whereas changes from accelerated to straight-line
depreciation usually increase reported earnings. Kence , if earnings-based
management compensation is not adjusted for changes in accounting policies,
the inventory policy change would decrease compensation and the depreciation
change would increase it. Third, changes from FIFO to LIFO typically
decrease a firm's tax payments and hence increase the equity value of the
firm. From managers' perspectives, FIFO-LIFO switches are therefore likely
to increase their portfolio wealth provided they own stock in the firms that
employ them. Also, managers' decisions to change from FIFO to LIFO are
likely to increase the value of their human capital since the decision
benefits the shareholders. The increase in portfolio wealth and human
capital may be sufficient to offset the reduction In managers' earnings-based
compensation if no adjustment is made by the compensation committees. In
contrast, the depreciation policy changes are tax neutral and are therefore
less likely to have significant effects on managers' portfolio wealth and
human capital
.
-4-
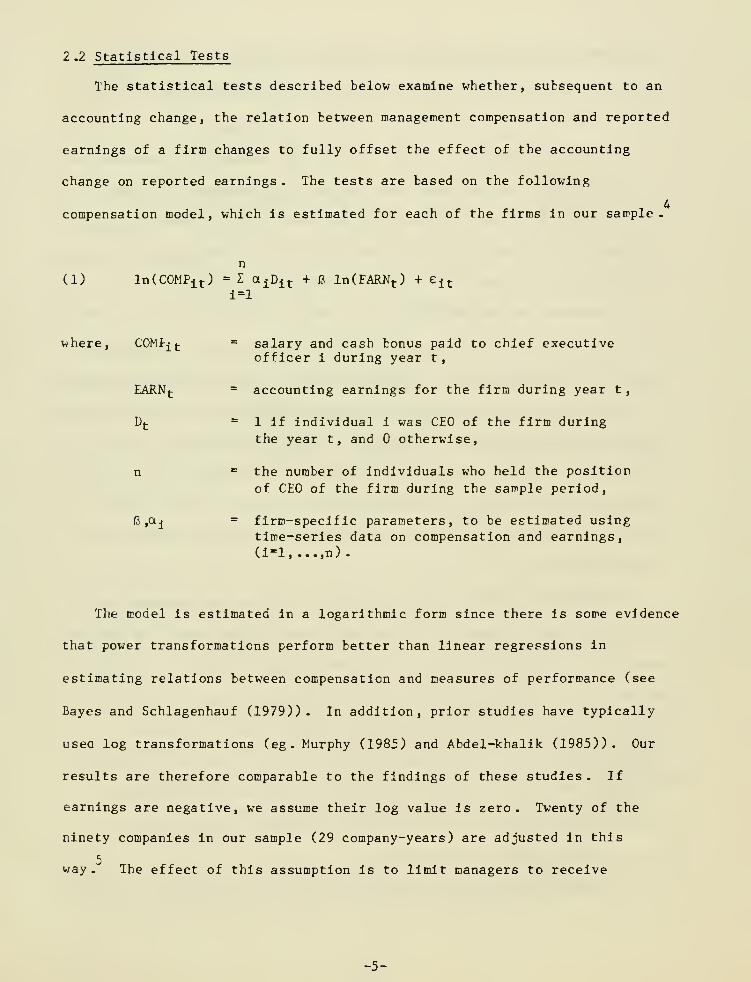
2 .2 Statistical Tests
The statistical tests described below examine whether, subsequent to an
accounting change, the relation between management compensation and reported
earnings of a firm changes to fully offset the effect of the accounting
change on reported earnings . The tests are based on the following
compensation model, which is estimated for each of the firms in our sample.
(1) ln(C0MPlt ) = I 04Dit + 13 ln(EARNt ) + e lti=l
where, COMfit
EARN.
Dt
6,C4
= salary and cash bonus paid to chief executiveofficer i during year t
,
= accounting earnings for the firm during year t ,
= 1 if individual i was CEO of the firm duringthe year t, and otherwise,
= the number of individuals who held the position
of CEO of the firm during the sample period,
= firm-specific parameters, to be estimated usingtime-series data on compensation and earnings,(i=l,...,n).
The model is estimated in a logarithmic form since there is some evidence
that power transformations perform better than linear regressions in
estimating relations between compensation and measures of performance (see
Bayes and Schlagenhauf (1979)). In addition, prior studies have typically
usea log transformations (eg. Murphy (1985) and Abdel-khalik (1985)). Our
results are therefore comparable to the findings of these studies. If
earnings are negative, we assume their log value is zero. Twenty of the
ninety companies in our sample (29 company-years) are adjusted in this
way. The effect of this assumption is to limit managers to receive
-5-

earnings-dependent compensation only when their company earns profits,
consistent with the option characteristics of most bonus contracts . (see
Healy (1985)).
The intercept term in our model (or the fixed component of compensation)
is allowed to vary across executives, reflecting differences in factors like
age, ability and education among CEOs. The elasticity of compensation to
earnings, 13, is assumed to be firm-specific. Both compensation and earnings
are measured in constant 1967 dollars to control for inflation.
The compensation variable used in our model is salary and bonus payments
to the chief executive officers (CEOs) of our sample firms. This variable
excludes several components of CEOs' compensation, such as performance awards
that are contingent on earnings, and stock option awards, because disclosures
of these awards are frequently incomplete. While this limits the conclusions
of the study, it is worth noting that bonus and salary comprise a nontrivial
proportion of executives' total remuneration. In Murphy's study of 461
executives from 1964 to 1981, salary and bonus is on average 80 percent of
total remuneration.
To evaluate the impact of the accounting change on the compensation-
earnings relation in equation (1), we define two earnings variables: reported
earnings and "original" earnings. Reported earnings (REARN ) are based on
one set of accounting policies before the accounting change, and another
after the change . Original earnings are computed using the original
accounting policies (which are in effect before the change) and are denoted
by OEARN . For periods prior to the accounting policy switch, OEARN
equals REARN ; after the switch, REARN is adjusted for the effect of
the accounting change to obtain OEARN .
If management comensation is fully adjusted for the effects of changes in
-6-
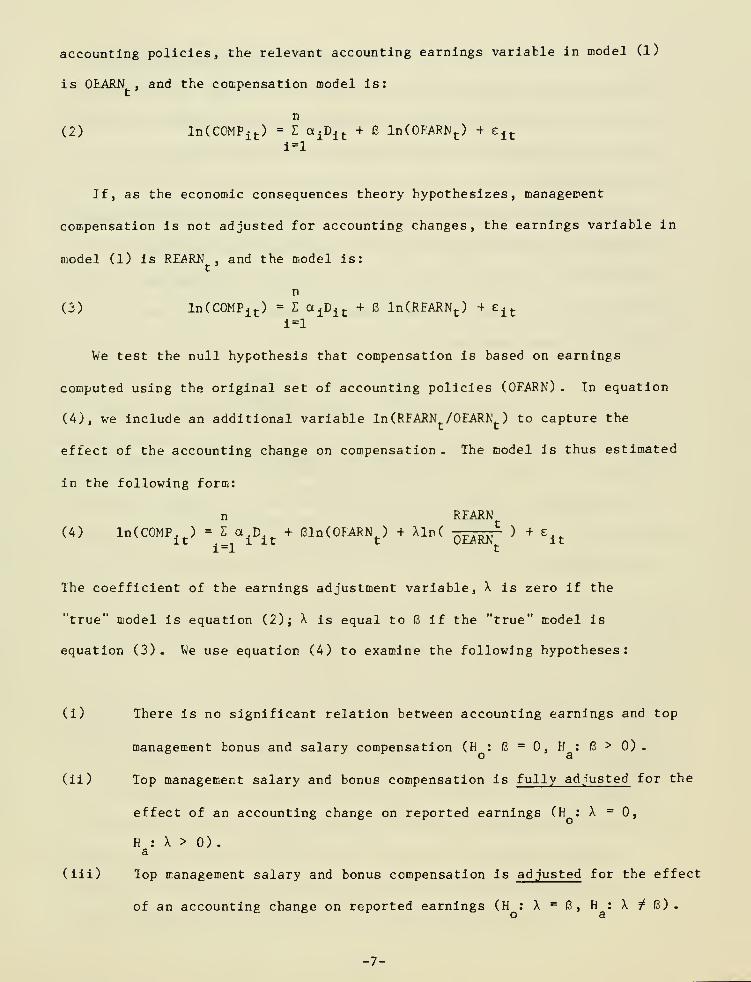
accounting policies, the relevant accounting earnings variable in model (1)
is OEARN , and the compensation model is:
n
(2) ln(COMP it ) = Z OL±Dit + E ln(OEARN
t) + e lt
i=l
If, as the economic consequences theory hypothesizes, management
compensation is not adjusted for accounting changes, the earnings variable In
model (1) is REARN , and the model is:
n
(3) ln(COMPlt ) = Z a ±D±t + 13 ln(REARNt ) + e lt
i=l
We test the null hypothesis that compensation is based on earnings
computed using the original set of accounting policies (OFARN) . In equation
(4), we include an additional variable ln(RFARN /OEARNj.) to capture the
effect of the accounting change on compensation . The model is thus estimated
in the following form:
n REARN
(4) ln(C0MP.J = L a.D_ + f31n(0EARN ) + Xln( ^..^ ) + e,.it , . l it t OEARN. It
i=l t
The coefficient of the earnings adjustment variable, X is zero if the
"true" model is equation (2); X is equal to 6 if the "true" model is
equation (3). We use equation (4) to examine the following hypotheses:
(i) There is no significant relation between accounting earnings and top
management bonus and salary compensation (H:I3=0,H:(3>0).
(ii) Top management salary and bonus compensation Is fully adjusted for the
effect of an accounting change on reported earnings (H : X = 0,
H : X > 0) .
a
(iii) lop management salary and bonus compensation is adjusted for the effect
of an accounting change on reported earnings (H:X=I3,H:X^I3).
-7-

Tests of hypothesis (ill) provides stronger evidence on the economic
consequences theory than tests of hypothesis (ii), because hypothesis (ii) is
rejected if the compensation committee partially adjusts compensation by
changing the elasticity of compensation to earnings subsequent to the
accounting change .
Equation (4) is estimated separately for each firm in the sample and the
distribution of the estimated values of 13 and X (and the associated
t-statistics) are used to test the above hypotheses. The sign and
significance of 13 , X and (B-X) are tested by computing the following
statistic for each variable:
, n t .
7 = 1 y 3
7^T, , /(k.-2)/k.J=l J 3
where, t = t-statistic for firm j associated with the estimates of
13 , X or ((3-X) in equation (4),
k. = degrees of freedom in regression for firm j,
n = number of firms in the sample .
The t statistic for firm j is distributed Student t with variance of
k./(k.-2). Under the Central Limit Theorem, the sum of the standardized t
statistics is normally distributed with variance of n. Each Z-statistic is
therefore a standard normal variate under the three null hypotheses discussed
ram<
7,8
above. In addition to this parametric test, a nonparametric binomial test
is used to test the hypotheses
-8-

2 .3 Sample Selection and Data Collection
The sample of inventory changes is selected from Accounting Trends and
Techniques (1970 to 1976) . We identify 161 companies that changed from FIFO
to LIFO during this period. Our sample of depreciation changes is selected
from Holthausen's database (see Holthausen (1981)) . We exclude companies that
changed to straight-line depreciation prior to 1967 since compensation data
for these companies are incomplete. This restriction limits our sample to 80
of Holthausen's 139 companies.
Eonus and salary data and management changes are collected for the CFOs of
our sample companies for the year of the accounting change and the ten years
before and after that event from two sources: corporate proxy statements and
the annual compensation survey published by Eusiness Week . We require that
(i) at least five years of consecutive compensation data are available before
and after the year of the accounting change, and (ii) a minimum of fourteen
consecutive years of data are available for each company. These data
constraints reduce the samples to 52 companies that changed inventory policies
and 38 companies that changed depreciation methods . The distribution of the
changes over the sample period is reported in Table 1 . The depreciation
changes are clustered in 1968 and 1969, and the inventory changes in 1974 and
1975.
Earnings before extraordinary items are collected from COMPUSTAT for
each company-year that has compensation data available . Compensation and
corporate earnings data are deflated by the CPI to 1967 dollars . A summary of
selected statistics is presented in Table 2 . The median Salary + Ponus in
1967 constant dollars across all executive-years is $186,000 for the inventory
sample and $190,000 for the depreciation sample. The median corporate
earnings in 1967 dollars across all company-years is $50,946,000 for the
inventory sample and $41,806,000 for the depreciation companies.
-9-

The earnings effects of the inventory and depreciation changes are
collected from the financial statement footnotes for years following the
change . Companies that use the LIFO inventory method report the current
replacement value of inventory. This value approximates the FIFO Inventory
value and is used to calculate the difference between reported LIFO income and
income that would have been reported had the company continued to use FIFO
(original FIFO income) . The effect of the depreciation switch from the
accelerated to straight-line method is calculated from the deferred tax
footnote . All the companies in our depreciation sample continue using the
accelerated method for taxes following the reporting change to the
straight-line method . The resulting timing difference between book and tax
incomes gives rise to an adjustment to deferred taxes which is reported in the
tax footnote, we use this value to calculate the difference between reported
income and income that would have been reported had the company continued
9using the accelerated depreciation method .
Table 3 reports statistics on the earnings effect of the change to LIFO as
a percentage of earnings under FIFO. Lairing the year of change, the median
earnings reduction from the inventory policy change is 19.3?: the median
reduction in earnings for all years after the change is 5 .2% . The effect of
the change in depreciation policy is also reported in Table 3 . The median
increase in earnings from the switch to straight-line depreciation is 6.6%
percent in the year of the change . For years subsequent to this accounting
change, the median earnings increase is 7.3 percent.
-10-
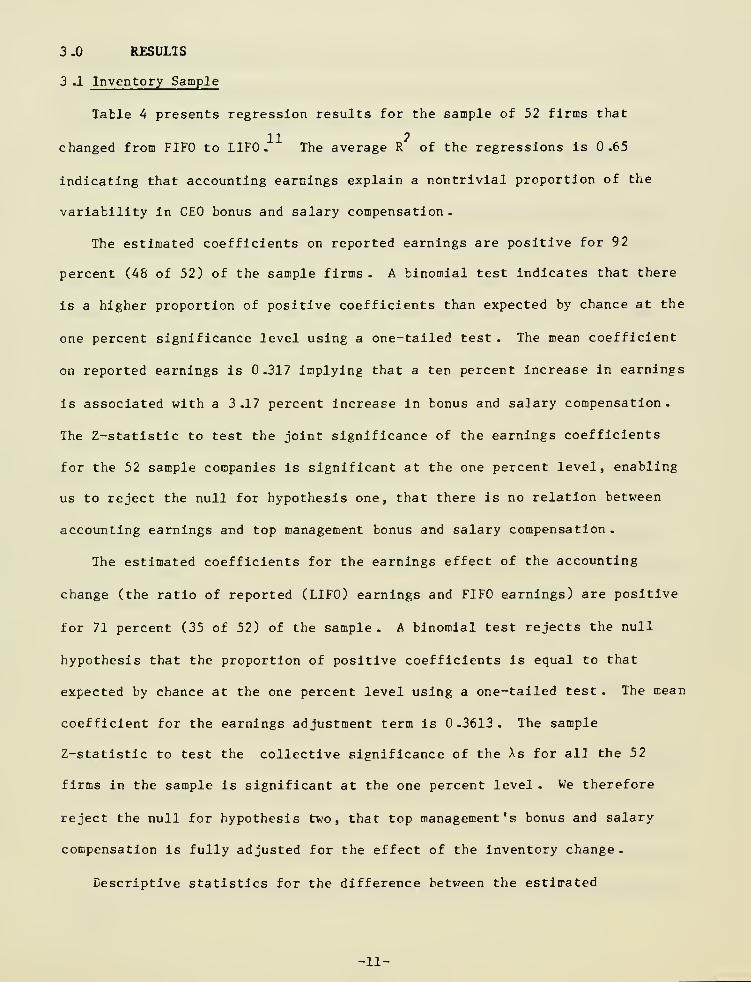
3 .0 RESULTS
3 J. Inventory Sample
Table 4 presents regression results for the sample of 52 firms that
11 ?changed from FIFO to LIFO . The average R of the regressions is 0.65
indicating that accounting earnings explain a nontrivial proportion of the
variability in CEO bonus and salary compensation .
The estimated coefficients on reported earnings are positive for 92
percent (48 of 52) of the sample firms . A binomial test indicates that there
is a higher proportion of positive coefficients than expected by chance at the
one percent significance level using a one-tailed test . The mean coefficient
on reported earnings is 0.317 implying that a ten percent increase in earnings
is associated with a 3 .17 percent increase In bonus and salary compensation .
The Z-statistic to test the joint significance of the earnings coefficients
for the 52 sample companies is significant at the one percent level, enabling
us to reject the null for hypothesis one, that there is no relation between
accounting earnings and top management bonus and salary compensation .
The estimated coefficients for the earnings effect of the accounting
change (the ratio of reported (LIFO) earnings and FIFO earnings) are positive
for 71 percent (35 of 52) of the sample . A binomial test rejects the null
hypothesis that the proportion of positive coefficients is equal to that
expected by chance at the one percent level using a one-tailed test . The mean
coefficient for the earnings adjustment term is .3613 . The sample
Z-statistic to test the collective significance of the Xs for all the 52
firms in the sample is significant at the one percent level . We therefore
reject the null for hypothesis two, that top management's bonus and salary
compensation is fully adjusted for the effect of the inventory change .
Descriptive statistics for the difference between the estimated
-11-

coefficients on as-if (FIFO) earnings and the earnings effect of the change to
LIFO (13-A) are also reported in Table 4. If the compensation committee uses
reported earnings to reward CEOs and does not adjust earnings for the effect
of the change to LIFO, the difference between these coefficients wil] be
zero. The mean difference is -0.0443 and is not significantly different from
zero at the five percent level using a two-tailed test. The differences In
the estimated coefficients are positive for 48 percent (25 of 52) of the
sample firms . A binomial test fails to reject the hypothesis that the
proportion of positive differences in coefficients is equal to that expected
by chance at the ten percent level. We thus reject the hypothesis that
earnings-dependent compensation is adjusted for the effect of an inventory
change to LIFO .
In summary, the results of the inventory tests support the economic
consequences theory. The estimated coefficient on the earnings effect of the
accounting change Is positive and statistically significant, but is not
statistically different from the as-if earnings coefficient . Compensation
committees therefore appear to use reported earnings to determine executives'
compensation subsequent to a change to LIFO and do not adjust earnings for the
effect of the change in inventory method .
3 .2 Depreciation Sample
The results for the 38 firms that changed from accelerated to
straight-line depreciation are consistent with the results for the inventory
sample presented above . Table 5 reports a summary of the ordinary least
2squares estimates of model (4). The average R of the regressions is 0.69
and 84.2 percent (32 of 38) of the earnings coefficients are positive. A
binomial test indicates that this number of positive estimates is
-12-

significantly greater than that expected by chance at the one percent level
using a one-tailed test . The mean estimated coefficient is J.745 and is also
statistically significant at the one percent level. Thus, as before, we find
that there is a significant positive relation between reported earnings and
CEOs' bonus and salary compensation.
Ihe estimates of X, the coefficient on the earnings adjustment variable,
are also reported in Table 5. Recall that, if the compensation committee
continues to use earnings based on accelerated depreciation after a charge to
straight -line depreciation, we expect X to be zero. If the committee uses
reported earnings, computed using straight-line depreciation subsequent to the
accounting change, we expect X to be positive. The estimates are positive
for 60.5 percent (23 of 38) of the companies. Using a one-tailed test, the
hypothesis that this percentage is the same as that expected by chance, is
rejected at the five percent level. The mean earnings adjustment coefficient
is 0.2752. The Z-statistic, which tests the hypothesis that the estimated
value of X is positive, is significant at the one percent level. We thus
reject the hypothesis that earnings-dependent compensation is fully adjusted
for the effect of the depreciation change .
The difference between the estimated coefficients on earnings computed
using accelerated depreciation and the earnings effect of the accounting
change is not statistically significant. The mean coeficient of -0.0753 is
not significant at the ten percent level using a two-tailed test . The
differences in the estimated coefficients are positive for 39.5 percent (15 of
38) of the sample firms. Using a two-tailed binomial test, we cannot reject
the hypothesis that this percentage is the same as that expected by chance at
the five percent level. As for the inventory sample, we reject the hypothesis
that earnings-based compensation Is adjusted for the effect of the accounting
change .
-13-

In summary, our results for both inventory and depreciation samples
indicate that there is a significant relationship between top executive
compensation and reported earnings (hypothesis (i)). They are also consistent
with the hypothesis that when the two accounting policies are changed,
compensation committees do not fully adjust reported earnings for their
effect. Finally, our tests support the hypothesis that there is no adjustment
of salary and bonus compensation for the effect of an inventory or use
reported earnings to depreciation change. In other words, compensation
committees appear to compute earnings-based remuneration subsequent to changes
from FIFO to L1F0 and changes from accelerated to straight-line depreciation.
3 .3 Tests of Changes in the Compensation Model's Parameters
Our model does not allow compensation committees to adjust the fixed
component of compensation, or the elasticity of compensation to earnings to
offset the effect of an accounting change. For example, committees might
increase executives' fixed compensation (represented by a in our model) or
increase the elasticity of compensation to earnings (represented by B)
following a change to LIFO . Executives' remuneration would then stiJl be a
function of reported earnings, but the compensation effect of using LIFO
earnings would be approximately offset by higher fixed rewards, or a higher
bonus payout for a given percentage increase in earnings . We find that there
is no significant difference between the coefficient on earnings based on the
original accounting policies (13) and the coefficient on the earnings effect of
the accounting changes (A). Since this latter variable is non-zero in only
the years following the accounting change, the result weakly supports our
assumption that the elasticity of bonus and salary payments to earnings is
constant throughout the estimation period .
-14-

To formally test statlonarlty of the models' coefficients, we estimate the
following regression:
n(5) ln(C0MFlt ) = I a.jDit + BjlnCREARNt) + l3 2
DUMt
+ B 3DUMtln(REARN
t ) + ulti=l
where, DLMt
= one subsequent to the accounting change, and zero prior to
the change .
Under the null hypothsis, that the fixed component of compensation and the
elasticity of compensation to earnings are constant throughout the estimation
period, both Ej and B3
are expected to be zero. A summary of the ordinary
least squares estimates for the inventory and depreciation samples are
reported in Table 6 . We are unable to reject the null hypothesis that B_
and 13 » are zero at the five percent level for the inventory sample. The
estimated coefficients for (3 and 13., are positive for 52 percent and 46
percent of the sample firms respectively. The mean estimate of (3_ is 1.0552
with a 2-statistic of 1.3237, and the mean estimate of B- is -0.0691 with a
Z-statistic of -1.1820. These results suggest that the compensation model's
parameters do not change following a change from FIFO to L1F0. In particular,
the compensation committee does not appear to increase the fixed component of
executives' compensation or the bonus payout for each dollar of earnings to
offset the earnings effect of the change to LIFO .
The results for the depreciation sample also support the hypothesis that
the compensation committee does not adjust the compensation model parameters
to offset the earnings effect of the accounting change*. A change from
accelerated to straight-line depreciation generally increases reported
earnings . If compensation committees allow for this change by reducing the
fixed component of bonus and salary awards and/or the elasticity of
-15-

compensation to earnings, I3?and (3-, in equation (5) will be negative. The
mean estimate of (3 is -0.1049 with a Z-statistic of -1.4759. We are unable
to reject the null hypothesis that 6, is zero at the five percent level.
The mean estimate for B„ is 1.3145 and we can reject the hypothesis that
this estimate is significantly less than zero at the ninety-five percent
level. This finding indicates that that fixed component of CEOs' bonus and
salary compensation increases following the change to straight-line
depreciation. However, it does not provide strong support for the view that
compensation committees adjust CEOs' fixed remuneration to offset the effect
of the accounting change, since we would then expect B„ to be negative.
In summary, our findings suggest that compensation committees do not
systematically offset the earnings effect of an acounting change on bonus and
salary awards by adjusting the fixed component of remuneration or the
elasticity of compensation to earnings .
3 .4 Limitation of Our Results
There are several potential limitations of our findings:
1. Definition of Compensation . We only examine bonus and salary
components of CEO compensation. Our study excludes stock-based remuneration.
Ihis form of compensation is particularly relevant to analysis of the
inventory sample since a change to LIFO decreases taxes and thus is expected
to increase equity prices and executives' portfolio wealth.
2. Cross-Sectional Dependence . Our statistical tests for pooling
regression results across companies assume that the sample observations are
independent . Since the inventory changes are clustered In 1974 and a majority
of the depreciation changes occur in 1968 ad 1969, this assumption may be
violated . The reported significance levels are then overstated . To
-16-

investigate cross-sectional dependence, we estimate the cross-sectional
correlations of the residuals from model (4) for 42 companies in the inventory
sample with complete data available from 1966 to 1980 . There are 861 pairwise
residual correlation coefficients for these 42 companies . The mean
correlation coefficient is only 0.0102, and is not significantly different
from zero . There is therefore no strong evidence of cross-sectional
dependence .
4.0 DISCUSSION OF RESULTS AND CONCLUSIONS
This paper investigates the effect of accounting policy changes on top
management's compensation. We examine a sample of 52 firms that change from
the FIFO to LIFO inventory method and 38 firms that change from accelerated
depreciation to the straight-line method. These accounting changes differ in
two dimensions. First, a change to LIFO is tax advantageous, whereas, a
change to straight-line is tax neutral. Second, a change to LIFO typically
decreases earnings, whereas a change to straight-line depreciation usually
increases earnings. Nonetheless, the effects of these accounting policy
changes in managerial compensation are consistent: remuneration apears to be
based on reported earnings. This finding implies that CEOs' salary and bonus
awards are reduced subsequent to the inventory policy change and increased
following the depreciation switch.
Our findings differ sharply from one other paper that examines whether
changes from FIFO to LIFO inventory methods are associated with changes in
executives' remuneration. Abdel-khalik (1985) estimates cross-sectional
regressions of bonus and salary compensation on earnings for a treatment
sample of 88 companies that changed to LIFO in 1974, and a control sample of
88 companies that remained on FIFO in that year . He estimates differences In
-17-

the fixed component of compensation and the elasticity of compensation to
reported earnings between these two samples in the two years prior to, the
year of, and the year subsequent to the accounting change. In the two years
prior to the inventory change the compensation parameters do not differ
between the treatment and control groups. In the year of the change, the
fixed component of compensation is higher for the control group and the
elasticity of compensation to reported earnings is higher for the treatment
group. These differences persist when reported earnings are replaced by as-if
FIFO earnings for the treatment group. Abdel-khalik 's findings are therefore
mixed .
Our test design differs from that of Abdel-khalik in three ways". First,
we examine two accounting changes, one that typically increases earnings (a
change to straight-line depreciation) and another that decreases earnings (a
change to LIFO) . Second, our tests examine earnings and compensation data for
as many as ten years following an accounting change. Third, we use a
time-series, rather than a cross-sectional, approach to estimate the relation
between compensation and earnings. Murphy (1985) points out that studies that
regress compensation on some index of performance across executives at a
particular point in time are likely to be misspecified . For these
regressions, "the exclusion of individual-specific factors, such as education
and training, perceived ability, performance in previous jobs, firm size,
etc... will lead to an omitted variables problem, reflecting factors that are
fixed for an executive over time but vary across executives at a point in
time ." Correlations between the independent variables in a cross-sectional
regression and these omitted variables will bias the estimated coefficients.
There is some evidence that Abdel-khalik 's findings suffer from this form of
misspecification since when firm size is included in his cross-sectional
-18-

regressions, the fixed component of bonus and salary awards and the elasticity
of compensation to earnings no longer differ between the treatment and control
groups .
In summary, the findings of our paper indicate that compensation
committees do not systematically adjust CEOs' bonus and salary awards for a
change in accounting procedures. This result is generally consistent with the
economic consequences hypothesis that it is costly to adjust compensation for
an accounting change. If compensation committees and managers have rational
expectations, the economic consequences hypothesis implies that committees
write remuneration contracts anticipating management's incentives to
opportunistically select accounting rules to increase their compensation . No
adjustment to management's compensation schedules will then be observed
following a change in accounting rules .
There are at least two costs of adjusting compensation for changes in
accounting rules. First, there are costs of recomputing earnings under the
original method in years subsequent to the change. These costs do not appear
to be important for the accounting changes considered in this paper, since we
are able to undo the effects of the change using publicly available
information. A second cost, is the cost of distinguishing accounting changes
selected by managers to increase their remuneration, from those selected to
maximize the value of stockholders' wealth. If managers have inside
information on future input prices, or investment opportunities, it would be
costly for the compensation committee to determine whether FIFO or LIFO, or
accelerated or straight-line depreciation methods maximize stockholders'
wealth .
Although our findings indicate that there are costs of adjusting bonus and
salary compensation for the effects of changes in accounting policies, there
-19-
appear to be important forces that limit managers' incentives to select
policies purely to increase their bonus and salary remuneration- For example,
companies in our inventory sample change to the LIFO method despite the
associated decline in their executives' bonus and salary awards.
Two factors are likely to offset this decline in earnings-based
remuneration. First, managers own stock in the companies that employ them.
Iheir portfolio wealth will therefore increase following a change to LIFO
since equity prices will reflect the accompanying tax savings. Second,
executive's human capital is likely to Increase following a change to LIFO
since the decision benefits shareholders . One area for future research is to
compare these portfolio wealth and human capital effects for managers of
companies that change to LIFO, and for managers of firms In the same industry
that retain FIFO. If the tax advantages of using LIFO are similar for both
samples of firms, portfolio wealth and human capital differences between
executives could explain differences in their firm's accounting policy
decisions .
-20-

FOOTNOTES
1 . For a more detailed description of bonus plans see Healy (1985) . For a
description of performance plans see Smith and Watts (1982) and larcker
(1983) .
2» A number of earlier studies that investigated the stock price reaction to
accounting changes also focused on these two changes . They include Kaplanand Roll (1972) and Holthausen (1981) in the case of depreciation changes,and Sunder (1976), Biddle and Lindahl (1982) and Ricks (1982) in the case
of inventory changes -
3« Changes from FIFO to LIFO decrease reported earnings if input prices are
rising and physical inventory levels are not depleted . Changes from
accelerated to straight-line depreciation increase reported earnings if
nominal investments in new depreciable assets are increasing*.
4». This model is similar to a model presented in Murphy (1985). However,
Murphy uses abnormal stock performance as a proxy for management's
performance, and constrains the slope coefficient (6) to be constantacross firms .
5. \ve also estimate model (1) in linear form, allowing earnings to be
negative, and constraining negative earnings to zero. Our conclusions arenot sensitive to this adjustment to earnings, or to the logarithmictransformation .
6. For a detailed discussion of this test, see Christie (1982).
7. See Siegel (1956) for a description of the binomial test.
8 . Both the tests discussed here are based on the sample distribution of theparameter estimates. In using these tests, it is assumed that the
parameters are independent across the firms in the sample . Furtherdiscussion of this assumption is deferred to later In the paper .
9 . Our depreciation sample includes six companies that changed to
straight-line depreciation after 1970 . For these companies the deferredtax items after 1981 reflect Accelerated Cost Recovery System (.ACRS)
rates. ACRS decreased the depreciable lives of fixed assets relative to
previous accelerated methods, implying that subsequent to 1981 ouradjustments for these companies are not strictly comparable to accelerateddepreciation used for reporting purposes. However, this change affects at
most three years data, and does not alter our conclusions.
10. None of the companies in our sample report the deferred tax effect for
depreciation prior to 1971 . Our as-If earnings series is thereforeincomplete for companies that change to the straight-line method prior to
this date .
-21-

11. Twenty-three of the 52 company regression residuals exhibit serial
correlation. We use a Cochran-Orcutt transformation for these companies
(see Iheil (1971) for a description of this technique) . The results do notchange significantly . The results reported in Table 5 are therefore for
the unadjusted estimates .
12. See Eall (1985) and Demski and Sappington (1985) for a discussion of
selection of accounting procedures when managers have inside information
on the costs and benefits of alternative accounting andproduction/investment decisions .
-22-

REFERENCES
Abdel-khalik, A J*., 1984, "The Effect of LIFO-Switching and Firm Ownership onExecutives' Pay," Journal of Accounting Research, forthcoming.
Ball, Ray, 1985, "Accounting, Auditing and the Nature of the Firm,"
unpublished paper, Australian Graduate School of Management and Universityof Chicago .
Biddle, G .C . and F.W. Lindahl , 1982, "Stock Frice Reactions to L1F0 Adoptions:The Association Eetween Excess Returns and LIFO Tax Savings," Journal of
Accounting Research, Vol. 20, Pt . II, Autumn 1982, 551-588.
Bowen , R.M., E .W . Noreen and J -M . Lacy, 1981, "Determinants of the CorporateDecisions to Capitalize Interest /'Journal of Accounting and Economics, 3,
151-179.
fioyes, to. and D. Schlagenhauf , 1979, "Managerial Incentives and the Specificationof Functional Forms," Southern Economics Journal , April.
Collins, D.W., M .S . Rozef f and D .S . Dhaliwal, 1981, "The Economic Determinantsof the Market Reaction to Proposed Mandatory Accounting Changes In the Oil
and Gas Industry: A Cross-Sectional Analysis ."Journal of Accounting andEconomics , 3, 37-72.
Demski, Joel S. and David F. Sappington, 1985, "Accounting Procedures in a
Principal-Agent Model," unpublished paper Stanford University and Universityof Pennsylvania .
Fox, Harland, 1980, "Top Executive Compensation," The Conference Board,New York .
Hagerman, R JL . and M .E . Zmijewski, 1979, "Some Economic Determinants ofAccounting Policy Choice
,
"Journal of Accounting and Economics, 1, 141-162 .
Healy, P.M., 1985, "The Effect of Bonus Schemes on AccountingDecisions ."Journal of Accounting and Economics, 7.
holthausen, R.W., 1981, "Evidence on the Effect of Bond Covenants andManagement Compensation Contracts on the Choice of Accounting Techniques:The Case of the Depreciation Switch-Back, Journal of Accounting andEconomics, 3, 73-109.
Holthausen, R .to . and R .to . Leftwich, 1983, "The Economic Consequences ofAccounting Choice: Implications of Costly Contracting and Monitoring,"Journal of Accounting and Economics, 5, 77-117.
Kaplan, R. and R. Roll, 1972, "Investor Evaluation of Accounting Information:Some Empirical Evidence," Journal of Business, April 1972, 225-257.
-23-

Larcker, David F., 1983, "The Association Between Performance Plan Adoption and
Corporate Capital Investment, " Journal of Accounting and Economics , 5, 3-30
Murphy, K., 1985, "Corporate Performance and Managerial Remuneration: An
Empirical Analysis /'Journal of Accounting and Economics, forthcoming.
Ricks, W., 1982, "The Market's Response to the 1974 L1F0 Adoptions /'Journal ofAccounting Research, Autumn 1982, Part I, 367-387-.
Siegel, Sidney, 1956, Nonparametric Statistics for the Behavioral Sciences(McGraw-Hill, New York).
Smith, Clifford and Ross watts, 1982, "Incentive and Tax Effects of ExecutiveCompensation Plans, " Australian Journal of Management, 7, No. 2, December,
139-157.
Ihiel, h., 1971, Principles of Econometrics (John Wiley & Sons, New York).
Watts, R-, 1977, "Corporate Financial Statements, A Product of the Market and
Political Processes /'Australian Journal of Management, April, 53-75.
Watts, R. and J. Zimmerman, 1978. "Towards a Positive Theory of theDetermination of Accounting Standards," Accounting Review, January,112-134.
Zmijewski, M -E . and R. Hagerman, 1981, "An Income Strategy Approach to the
Fositive Theory of Accounting Standard Setting Choice," Journal of
Accounting and Economics, 3, 129-149.
-24-

Table 1
Distribution of Years of Accounting Changes for52 Companies Changing to the LIFO Inventory Method (1970-1976) and
38 Companies Changing to the Straight-Line Depreciation Method (1967-1976)
Itear of Accounting Number of Companies Number of CompaniesChange Changing to LIFO Changing to Straight-
Line Depreciation
1967 - 2
1968 - 17
1969 - 12
1970 1 1
1971 1 3
1972 2
1973
1974 36 1
1975 10
1976 _4 _^
52 38
-25-

Table 2
Selected Statistics for Executive-Years and Company Years for52 Companies Changing to the L1F0 Inventory Method (1970-1976) and
38 Companies Changing to the Straight-Line Depreciation Method (1967-1974) .
All Variables are in Thousands of CPI-Deflated (1967 = 100) Constant Dollars .
Selected Statistics
Mean Standard First Median ThirdDeviation Quartile Quartile
Executive Salary + Bonus
Inventory Sample
Depreciation Sample
201
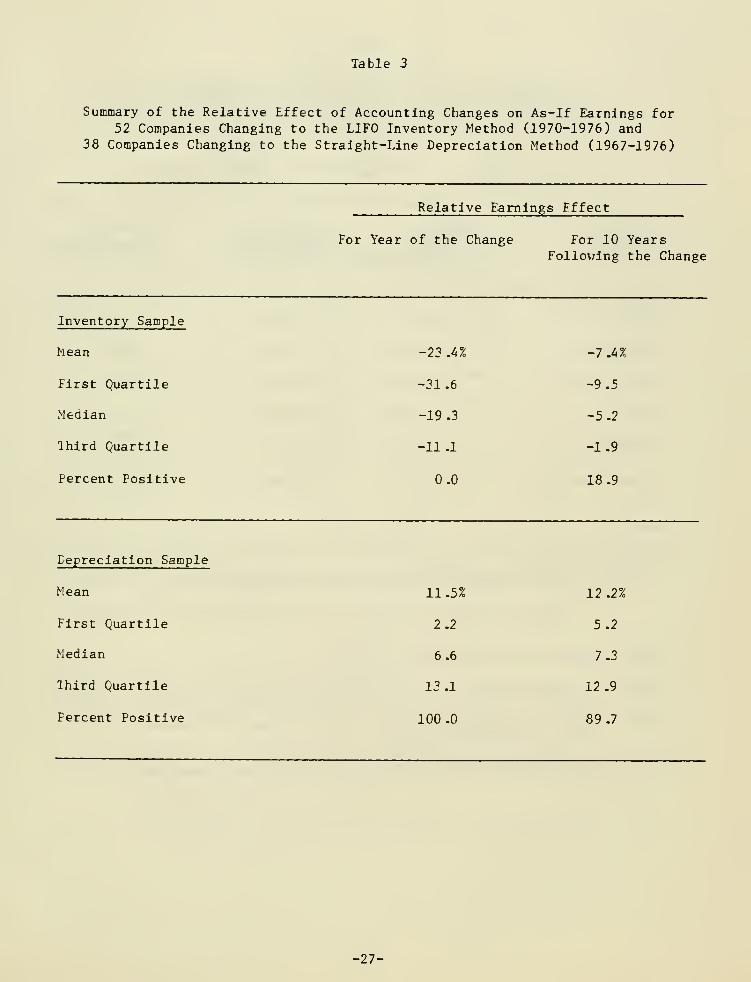
Table 3
Summary of the Relative Effect of Accounting Changes on As-lf Earnings for52 Companies Changing to the L1F0 Inventory Method (1970-1976) and
38 Companies Changing to the Straight-Line Depreciation Method (1967-1976)
Relative Earnings Fffect
For Year of the Change For 10 YearsFollowing the Change
Inventory Sample
Mean
First Quartile
Median
Ihird Quartile
Percent Positive
-23 .4%
-31.6
-19.3
-11.1
0.0
-7 -4%
-9.5
-5.2
-1.9
18.9
Depreciation Sample
Mean
First Quartile
Median
Ihird Quartile
Percent Positive
11.5%
2.2
6.6
13.1
100.0
12.2%
5.2
7.3
12.9
89.7
-27-

Table 4
Summary of OLS Compensation Model Fstimates for52 Companies that Changed to the LIFO Inventory Method from 1970-1976
Separate Intercepts are Estimated for Individual Executives .
n REARN
ln(C0MP, J = I a.n + Gln(0EARN ) + Xln( -...* ) + e_.it lit t OEARN it
As-If Accounting DifferenceStatistics Earnings Change Effect in Coefficients
Coefficient(e) Coeficient (X) (B - X
)
Mean 0.3170 0.3613 .0443
Z-Statistic 18 .1227a 5 -8315a -1.3850
First Quartile 0.0664 -0.0443 -0.3312
Median 0.2397 0.2701 -0.0328
Third Quartile 0.5290 0.8111 0.2643
Fercent Positive 92 Jl% a 71 .15% a 48 .08*
Mean R2 0.6515
a Significant at the one percent level using a one-tailed test
C0MF it= salary + bonus for CEO i in year t
,
OEARNf. = original earnings in year t computed using the FIFO inventory method,
RLARttt = reported earnings in year t, computed using FIFO before, and LIFOafter the accounting change,
Dit = one if individual i is CEO of the firm in year t and zero otherwise -
-28-
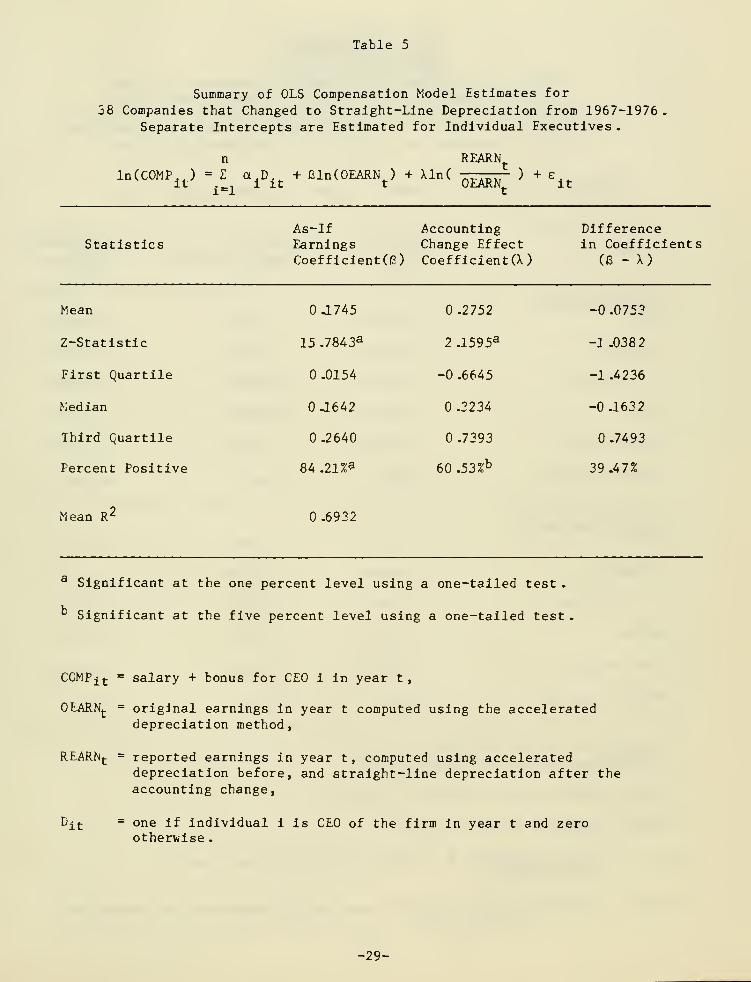
Table 5
Summary of OLS Compensation Model Estimates for
38 Companies that Changed to Straight-Line Depreciation from 1967-1976 .
Separate Intercepts are Estimated for Individual Executives .
n REARNt
InCCCMP.J = Z a,D.„ + l31n(0EARN ) + Xln( ngADKT ) + e,fcit ._. i it t OEARN it
As-If Accounting DifferenceStatistics Earnings Change Effect in Coefficients
Coefficient^) Coefficient (X) (6 - X)
Mean J.745 0.2752 -0.0753
Z-Statistic 15 .7843a 2 .I595a -1.038 2
First Quartile .0154 -0 .6645 -1 .4236
Median .1642 0.3234 -0.1632
Third Quartile 0.2640 0.7393 0.7493
Percent Positive 84.21%a 60.53%b 39.47%
Mean R2 0.6932
a Significant at the one percent level using a one-tailed test .
Significant at the five percent level using a one-tailed test
C0MP it = salary + bonus for CEO i in year t,
0EARNt
= original earnings in year t computed using the accelerateddepreciation method,
REARhit = reported earnings in year t, computed using accelerateddepreciation before, and straight-line depreciation after theaccounting change,
Dit = one if individual i is CEO of the firm in year t and zerootherwise .
-29-

Table 6
Summary of OLS Estimated of Changes In Compensation ModelIntercepts and Slopes Following an Accounting Change for
52 Companies that Changed to the LIFO Method from 1970-1976 and38 Companies that Changed to Straight-Line Depreciation from 1967-1976
Separate Intercepts are Estimated for Individual Executives*.
ln(C0MPlt ) = I a±Dit + BjREARN,- + (3 2DUMt
+ l33DUMtln(REARNt ) + tolti=l
StatisticsEarningsCoefficient
(8 )

MIT LIBRARIES
3 ^DflO D03 Dbl D3


BASEM£NJd«
MAY 1 1 1989
Lib-26-67