Embed Size (px)
Citation preview

THE EFFECT OF A PERCEPTUAL MOTOR PROGRAMME ON THE
DRAWING OF A PERSON BY FIVE YEAR OLD NEW ZEALAND
CHILDREN.
Ingrid Catherine Köhne
A research report submitted to the Faculty of Health Sciences, University of the
Witwatersrand, Johannesburg, in partial fulfilment of the requirements for the degree of
Master of Science in Occupational Therapy.
New Zealand, 2008.
Ethical Clearance Number: M040937.
DECLARATION
I, Ingrid Catherine Köhne declare that this research report is my own work. It is being
submitted in partial fulfilment of the requirements for the degree of Master of Science in
Occupational Therapy in the University of the Witwatersrand, Johannesburg. It has not been
submitted before for any degree or examination at this or any other University.
ii

ABSTRACT
This study investigated whether participation in the Smart Start with Perceptual Motor
Program (PMP) over a six month period, by a group of 14 five year old New Zealand school
children from a low socio-economic school in Rotorua, enhanced their drawings of a man,
woman and self when compared to a control group of 14 children who did not participate in
PMP. Their drawings were scored using the Draw A Person: A Quantitative Scoring System
(DAP) by Naglieri. The data from this quasi-experimental research design was analysed using
an analysis of covariance to compare the two groups. Scores of the drawing of Self were
analysed separately from the Total scores (sum of the Man, Woman and Self scores). There
was not a significant difference between the experimental and the control group. A number of
confounding variables, including small sample size, number of PMP sessions and differences
between groups, were likely to have influenced the results.
iii
ACKNOWLEDGEMENTS
The researcher would like to gratefully acknowledge the assistance received from the
following people:
Adj. Prof. Pat de Witt - Supervisor, University of the Witwatersrand, SA
Prof. Piet Becker - Statistician, South African Medical Research Council
Dr Brian Coffee - Director of Research, Bay of Plenty Polytechnic, NZ
Dr Ruth Gorinski - Researcher, Bay of Plenty Polytechnic, NZ
Jean O’Boyle - Librarian, Rotorua Hospital, NZ
Helen Richards - Librarian, Gisborne Hospital, NZ
Patricia Laurenson - Information Co-ordinator, M. of Education Library, NZ
The researcher also acknowledges and thanks the principals, staff, parents and children from
the two schools in Rotorua who participated in this study.
iv
TABLE OF CONTENTS Page
DECLARATION ii
ABSTRACT iii
ACKNOWLEDGEMENTS iv
TABLE OF CONTENTS v
LIST OF TABLES x
LIST OF FIGURES xi
1.0 INTRODUCTION
1.1 Introductory Statement 1
1.2 Justification of the Study 1
1.3 Statement of the Problem 5
1.4 Purpose of the Study 6
1.5 Glossary of Key Terms and Abbreviations 7
2.0 REVIEW OF THE LITERATURE
2.1 Introduction 9
2.2 Perceptual Motor Programmes 9
2.2.1 Definitions and Components 9
2.2.2 Components of PMP 11
2.2.3 PMP in the New Zealand Context 13
2.2.4 Review of Perceptual Motor Programmes 14
v

2.3 Body Image 19
2.3.1 Alternative Usages of Term Body Image 19
2.3.2 Usage of the Term Body Image in the Present Study 20
2.3.3 Relevant Influences on Body Image 21
2.3.4 Measurement of Body Image and Human Figure Drawings in
Perceptual Motor Programme and Movement Literature 22
2.3.5 Body Image Measures Correlated with Human Figure Drawing Tests 29
2.4 Children’s Human Figure Drawings and Draw A Person Tests 31
2.4.1 Abilities Required for Human Figure Drawings with Reference to
Specific Draw A Person Tests 31
2.4.2 Influences on Human Figure Drawings with Reference to Specific
Draw A Person Tests 37
2.5 The DAP Measurement Instrument 40
2.5.1 Reasons for Selection of the DAP 40
2.5.2 The DAP Reliability 42
2.5.3 The DAP Concurrent Validity, Criterion Validity and Applications 43
2.6 Literature Review Summary 46
3.0 MATERIALS AND METHODS
3.1 Introduction 49
3.2 Research Design 49
3.3 Sample Size and Selection 49
3.4 Selection of Schools 51
3.5 Research Procedure 51
vi

3.5.1 Ethical Clearance Procedures 53
3.5.2 DAP Administration 53
3.5.3 Learning the DAP Scoring System 55
3.5.4 Description of the DAP Scoring System 56
3.5.5 PMP Administration, Data Collection and Recording at School A1 58
3.6 Data Analysis 59
4.0 RESULTS
4.1 Introduction 61
4.2 Sample Demographics 61
4.3 Study Results 62
5.0 DISCUSSION
5.1 Introduction 69
5.2 Discussion of the Results 69
5.3 Influences of Age, Gender, Ethnicity and Schooling 72
5.3.1 Influence of Age 72
5.3.2 Influence of Gender 73
5.3.3 Influence of Ethnicity 73
5.3.4 Influence of Schooling 74
5.4 Study Limitations 75
5.4.1 Sample Size 75
5.4.2 Differences between Control and Experimental Groups 76
5.4.3 PMP Implementation 78
vii
5.4.4 PMP Duration 81
5.4.5 DAP Administration 81
5.5 Criticisms of PMP 82
5.5.1 Theoretical Basis 81
5.5.2 PMP Structure 82
5.6 Discussion Summary 83
6.0 CONCLUSION AND RECOMMENDATIONS
6.1 Summary of Findings 84
6.2 Conclusion 85
6.3 Recommendations 86
6.3.1 Revisions of the Methodology 86
6.3.2 Directions for Future Research 88
REFERENCES 90
APPENDIX A PMP Implementation within the New Zealand
Educational Context 98
APPENDIX B PMP Screen Test, Resource Materials, Equipment, Structural
Components and Copy of Activity Cards 100
APPENDIX C Summary of Contents of PMP Activity Stations 108
APPENDIX D Information on the School Decile 114
APPENDIX E Copy of Study Information Sheet, Consent and
Assent Forms 116
viii
APPENDIX F Copy of Ethical Clearance Certificate 119
APPENDIX G Copy of Letters of Permission from School Principals 120
APPENDIX H Copy of DAP Scoring System Sheet, Response and Record
Forms 122
ix
LIST OF TABLES
Table Page
Table 4.2 Composition of Study Sample by Gender and Age at Post-test 61
Table 4.3.1 Means, Standard Deviations and P-values Using Standard
Scores: Control versus Experimental Group Performance
on the DAP 63
Table 4.3.2 Increase in Raw Scores from Pre-test to Post-test per
Category on the DAP 64
Table 4.3.3 Mean Increase and Standard Deviation of Total Standard
Scores for Boys and Girls 65
Table 4.3.4 Numbers of Children in Control and Experimental Groups
Who Produced Each of the Different Types of Human
Figure Drawings 66
Table C PMP Activity Cards with Station Name and
Activity Description 108
x
LIST OF FIGURES
Figure Page
Figure 2.2.2 PMP Outcomes Model 13
Figure 3.5 Flow Diagram of Research Procedure 52
Figure 4.3.1 Examples of Pre-test and Post-test Self Drawings from
the Control and Experimental Groups 67
xi
1
CHAPTER 1
1.0 INTRODUCTION
1.1 Introductory Statement
This study examined the effect of a specific perceptual motor programme on human figure
drawings by five year old New Zealand children from the central North Island town of
Rotorua. This specific perceptual motor programme is called Smart Start with Perceptual
Motor Program (PMP) developed by Judie Bulluss and Peter Coles. The investigation of PMP
is important as it has been developed
‘to cater for today’s students in a changing environment’ where ‘less opportunity is
provided for children to play, climb, run, challenge and gain motor experiences.’ 1, p1
An essential outcome of children’s participation in PMP is the enhancement of their body
image. 2 According to literature, young children’s body image can be inferred from their
human figure drawings. 3, 4, 5 Studies have shown that movement experiences can significantly
increase the quantitative aspects of children’s drawings of people. 4, 6, 7 It is possible therefore
that participation in PMP will cause similar effects and this will be reflected in the drawings of
a man, woman and self by five year old New Zealand children.
1.2 Justification of the Study
Perceptual motor based techniques and programmes have been utilised in the fields of
occupational therapy and education since the 1960’s. 8
‘The importance of perceptual motor function in early learning, in maturation of motor
competence, and in personality development has made it a subject of primary
consideration in developmental occupational therapy.’ 9, p423
Occupational therapists have researched various aspects of perceptual motor programmes
including the effects on: gross motor skills; 3, 9, 10 fine motor skills and visual-motor
integration; 3, 10 visual perceptual skills; 3 self-concept; 9 and body image. 3 As body image
involves the awareness of the various parts of the body and their relationship to each other, 2 it
is essential for the performance of activities of daily living. Tasks such as feeding, dressing,
using a pencil and catching a ball, all rely on the accurate knowledge of one’s body. 6 Body
image must therefore be considered by occupational therapists when assessing and treating
children with perceptual motor deficits. 6 The effects of perceptual motor training on body
image have been measured by children’s performance on draw a person tests. Occupational
therapists have also studied the effects of sensorimotor and cognitive-perceptual training on
young children’s human figure drawings. 6
Within the area of children’s human figure drawing, a number of draw a person tests have
been devised and utilised. Each draw a person test has different scoring criteria and
interpretations depending on the purpose and field of study.11 In occupational therapy studies,
the Goodenough-Harris Draw-a-Person Test and the Miller Draw-a-Person Game have been
used to assess young children’s body concept 6 and body image. 3 The effect of movement on
body image and concept has been measured by the number, details and proportion of body
parts within their human figure drawings. The Goodenough Draw-a-Man Test has been
validated as a test of personal neglect in stroke patients. 12
The Goodenough-Harris Draw-a-Person Test and its predecessor, the Goodenough Draw-a-
Man Test, have also been utilised in the field of special and movement education as scoring
2

measures for children’s human figure drawings. This has included studies evaluating the effect
of movement interventions. 7, 13, 14
In the PMP training workshop, 15 the Goodenough Draw-a-Man Test is provided to score
children’s drawings of themselves. The drawing task can be re-administered once the children
have participated in PMP for a time. The drawings of self are scored on various criteria with
emphasis on the presence of body parts. 16 Bulluss and Coles write that the
‘children’s drawings of themselves will give the teacher some idea of how much
internalised knowledge the child has of their own body. The child will draw the parts
they know they have.’ 2 p16
The children’s self drawings are interpreted as an indication of their body image. Body image
‘is the complete cognizance of one’s own body and its movement possibilities. It is the
internal knowledge of the “me-ness of me”.’ 2 p16
According to Bulluss and Coles, many activities in PMP aim to improve children’s body
image. These activities include the use of dramatised songs emphasising body parts, musical
games and movement activities where specific body parts are used in controlled ways e.g.
climbing ladders and ropes with hands and feet. The improvement of children’s body image is
an essential outcome of their participation in PMP. 2
The improvement of children’s body image is an important outcome not only in PMP but also
in perceptual motor programmes 3, 17 and sensorimotor interventions in general. 18, 19 It is
necessary for children to be fully aware of their bodies in order to learn to move skilfully and
3

interact successfully within their environment. 19, 20, 21 Developmental studies on the way in
which young children understand and use their bodies recognise the importance of providing
movement opportunities to enhance their body image. 22, 23
In addition, the acquisition of information about children’s developing body image is
important as there is limited data available on the developmental progression at which most
children are aware of their various body parts. 21, 24 Research on the initial development of
body image in children suggests that young children possess a vague conception of their body
structure. 25 Body image also forms a part of the concept of self which is essential for optimal
health and well-being. 2, 21
Body image is a complex construct 26 and as a result is difficult to measure. 4 The human
figure drawing task however, offers advantages when working with young children. 25 Young
children’s freehand human figure drawings provide a valuable measure of their conceptual
knowledge of their body. 6, 23 Numerous studies 13, 16, 27 have validated the increase in parts,
details and accuracy of proportions in human figure drawings by children with increase in
chronological age. Young children in particular, tend to draw what they know. 28 Experts in
the field of study of children’s drawings view their drawings as public representations of their
internal thoughts and mental processes. 29
PMP is currently being used in schools in many countries including New Zealand,
Australia, 30, 31 Scotland, Oman, Hong Kong, Singapore and India. 32 In New Zealand, PMP
has become more popular in schools over the last five to eight years. As yet the New Zealand
Ministry of Education does not fund the programme so PMP is funded on the schools’
4
initiatives. 33 If the Ministry of Education were to fund PMP many more schools would be
able to offer the programme. Before such funding could be considered the effectiveness of
PMP as a perceptual motor and early learning intervention would need to be established. 31
1.3 Statement of the Problem
There is limited literature examining the efficacy of perceptual motor programmes in general
within the typically developing four to five year old population. 21 Available literature with
young children indicates that self-concept 9 and body image 3, 6 can be improved by perceptual
motor training. Although various methods have been utilised to measure body image in
children, 3, 5 the detection of body image problems in young children is complex. 4 Researchers
19 have suggested that studies should specifically examine methods for assessing the body
image component of perceptual motor programmes.
Despite the growing popularity of PMP, there is to date no published research on the
effectiveness of any aspect of this programme, including body image as a perception of self. 1
Bulluss and Coles provide 15 the non-standardised Goodenough Draw-a-Man Test 16 to
evaluate the children’s drawings of themselves as a measure of their body image. 2 The
reported changes in children’s human figure drawings could be due to maturation or
spontaneous learning factors.
The evidence that Bulluss and Coles have used to substantiate the value of PMP is the fact that
it has been used for about 28 years. This is despite the cost in time, equipment and resources
that schools need to allocate to the implementation of PMP. 1 Informal reports regarding the
effectiveness of the programme include, observed improvements in motor performance in the
5
areas of skipping, ball handling abilities, seated posture and handwriting. Memory
development, general enjoyment and improvements in attitudes of the children who took part
in PMP, have been observed. 33 Teachers have also commented on improvements in children’s
drawing of self and knowledge of their bodies. 34
1.4 Purpose of the Study
The purpose of this study was to examine the effectiveness of Smart Start with Perceptual
Motor Program (PMP) on enhancing the ability of five year old New Zealand children to draw
pictures of a person - a man, woman and themselves. This study investigated whether there
would be a significant quantitative difference in five year old New Zealand children’s
drawings of a person, including of themselves, after six months of participation in PMP, as
compared to a similar control group that did not participate in PMP.
It was anticipated that children who have had perceptual motor training by virtue of their
participation in PMP, would draw pictures of human figures with more body parts and would
include more details in their drawings than those in the matched control group. The changes in
the human figure drawings were measured using the standardised Draw A Person: A
Quantitative Scoring System (DAP) by Jack Naglieri. 27 The DAP allows for the quantifying
of drawing features with four main categories, namely, presence, detail, proportion and bonus.
The DAP contains norms for the drawing of self in addition to the drawing of a man and a
woman. 27
More information about the implementation of PMP within the New Zealand educational
context is contained in Appendix A. General information on PMP including PMP screen test,
6

resource materials, equipment and structural components is contained in Appendix B. Specific
information on PMP activity stations is in Appendix C. A glossary of terms and definitions as
used in this study is presented below.
1.5 Glossary of Key Terms and Abbreviations
Perceptual motor development ‘This is the process of enhancing the ability to integrate
sensory stimuli arising from or relating to observable movement experiences.’ 35, p283 It
involves the ability to organise and interpret information from the ‘various channels of
perception (visual, auditory, tactile and kinaesthetic)’ 3, p46 and make an appropriate motor
response.
Perceptual motor programme A programme in which children ‘move and manipulate their
bodies in relation to external objects to match up what they perceive with what is
reality.’ 32, p21 Children therefore ‘learn various perceptual skills (necessary for optimal
functioning) by organizing motor actions directed towards the environment.’ 3, p46
Smart Start with Perceptual Motor Program (PMP) The specific perceptual motor
programme investigated in this study. It was developed by Australian educationalists, Judie
Bulluss and Peter Coles. PMP is typically implemented in the first year of formal schooling,
preparing the child for fundamental motor skills by ‘first developing the basic patterns of
movement, namely: locomotion, balance, eye-hand and eye-foot co-ordination, fitness, body
image, body control, laterality, directionality, body rhythm and space awareness.’ 2 p10
7
Sensorimotor activity programme A programme with activities that aim to affect subcortical
brain structures by incorporating the major sensory modalities associated with movement.
There is ‘considerable overlap’ 35 p286 between the contents of sensorimotor and perceptual
motor programmes. This is because perceptual motor functioning is dependent on
sensorimotor functioning. 21, 35
Body image Body image is defined by Bulluss and Coles as ‘the complete cognizance of one’s
own body and its movement possibilities. It is the internal knowledge of the “me-ness of
me”.’ 2, p16 The cognisance of one’s body involves the awareness and knowledge of: the
physical structure of the body and its parts; the movements and functions of the body and its
parts; and the position of the body and its parts in relation to each other and the
environment. 17 Other authors including Humphrey 4 and Williams, 21 writing in a perceptual-
motor context use the words body awareness instead of body image. Kavale and Mattson
juxtapose the words body awareness and body image and write about the ‘body
awareness/image categories.’ 36, p168
Draw A Person: A Quantitative Scoring System (DAP) The standardised assessment
developed by Jack Naglieri in 1988, used in this study to evaluate the children’s drawings. 27
Decile A school’s decile indicates the ‘extent to which a school draws its students from low
socio-economic communities. Decile 1 schools are the 10% of schools with the highest
proportion of students from low socio-economic communities.’ 37, p1 This is a system of
classifying schools that is unique to New Zealand. (Refer to Appendix D for further
information on the decile.)
8

CHAPTER 2
2.0 REVIEW OF THE LITERATURE
2.1 Introduction
National and international literature has been used to inform this study. Firstly, the literature
on perceptual motor programmes is reviewed. This includes a definition of relevant terms and
the components of perceptual motor programmes including PMP. PMP is also presented
within the New Zealand context. A discussion on body image follows. Alternative usages of
the term body image are outlined. The definition of body image as used in this study is then
described along with relevant influences. Literature on the measurement of body image and
human figure drawings within a perceptual motor and movement context is presented. A study
correlating a body image test with a human figure drawing test is reviewed in depth. The
history of and research on draw a person tests and children’s human figure drawing is then
presented. Skills required for human figure drawings by young children are discussed.
Relevant influences are also described. Reasons for the choice of the DAP measuring
instrument are given along with detailed information on the DAP reliability and validity.
Finally, key points from the reviewed literature relevant to chapter three are summarised.
2.2 Perceptual Motor Programmes
2.2.1 Definitions and Components
All voluntary movement depends on perceptual awareness which results from some kind of
sensory stimulation. 20, 35, 38 Incoming sensory stimuli from the visual, auditory, tactile and
kinaesthetic systems must be interpreted and organised in order for an adaptive motor
response to occur. 35 The process of interpreting and organising this incoming sensory
information with previously stored information is known as perception. 20, 35 The quality of
9

one’s movement performance depends on the accuracy of one’s perceptions and the translation
of these perceptions into a series of movement acts. 20 From Gibson’s ecological perspective,
perception and action are integral: we perceive in order to move and we have to move in order
to perceive. 39 Perceptual motor abilities are learnt with this learning process beginning in
early infancy. 21, 39 To successfully direct behaviour in the environment, the infant establishes
a bodily frame of reference for action. This requires the infant to learn about its body
dimensions and its movement possibilities. 39 It is thought that during the early years, most
children develop foundational perceptual motor skills through spontaneous interaction with
their environment. Many children for reasons such as slower rate of development, nutritional
deficiency and lack of opportunity do not develop these fundamental skills to the degree that
they should. 21
Perceptual motor programmes are designed to provide opportunities for children to
‘move and manipulate their bodies in relation to external objects to match up what
they perceive with what is reality.’ 32, p21
Children therefore
‘learn various perceptual skills (necessary for optimal functioning) by organizing
motor actions directed towards the environment.’ 3, p46
There are two categories of perceptual motor programmes, structured and unstructured. 4
Structured programmes have prescribed activities which follow a predetermined order like
those of Bulluss and Coles 2 and Capon. 17 Unstructured programmes are more flexible with
general guidelines and activity suggestions, as seen in the work of Humphrey, 4 Cratty 5 and
Kephart. 40
10
A review of perceptual motor literature revealed that there is considerable variability in the
components of a perceptual motor programme. Gallahue groups the perceptual motor
components into body awareness, spatial awareness, directional awareness and temporal
awareness. 20 Humphrey includes auditory and visual perceptual skills 4 in addition to those
suggested by Gallahue. Williams writes that a perceptual motor programme should address
four basic categories of perceptual motor skills, namely: gross motor control; fine motor
control (also known as eye-hand co-ordination); simple auditory, visual and tactile-
kinaesthetic behaviours; and body awareness. 21 Kephart classifies posture and balance,
locomotion, manipulative activities and ball skills as being essential. In addition body image
and laterality are also important. 38, 40 Capon promotes the following perceptual motor
abilities: loco-motor coordination, balance, proprioception, hand-eye and foot-eye co-
ordination, agility, strength, flexibility, body image, laterality, directionality, rhythm and
spatial awareness. 17 Body awareness/image is an important component of all of the above
perceptual motor programmes.
2.2.2 Components of PMP
PMP is based on the work of theorists such as Kephart, Montessori, Ayres, Doman and
Delacato and Capon. 1 Bulluss and Coles developed PMP based on the belief
‘that formal learning is often introduced before children have mastered pre-requisite
skills’ 33, p9
and that this leads to many children struggling to acquire the basic literacy skills. 2 They
reason that
‘children are growing up in a world where there are no longer activities that allow for
the discovery of self, exploration of the environment and input from the extended
11
family. Poor diet, inactivity, computer games, and a rush to get children into formal
learning may also be contributing to the lack of perceptual motor skill development
among some … children.’ 33, p9
Bulluss and Coles in their PMP floor and equipment sessions, aim to develop
‘the basic patterns of movement, namely: locomotion, balance, eye-hand and eye-foot
co-ordination, fitness, body image, body control, laterality, directionality, body rhythm
and space awareness.’ 2 p10
In addition, Bulluss and Coles have developed specific language follow-up activities for use in
the classroom. 2 This is different from the above mentioned perceptual motor programmes.
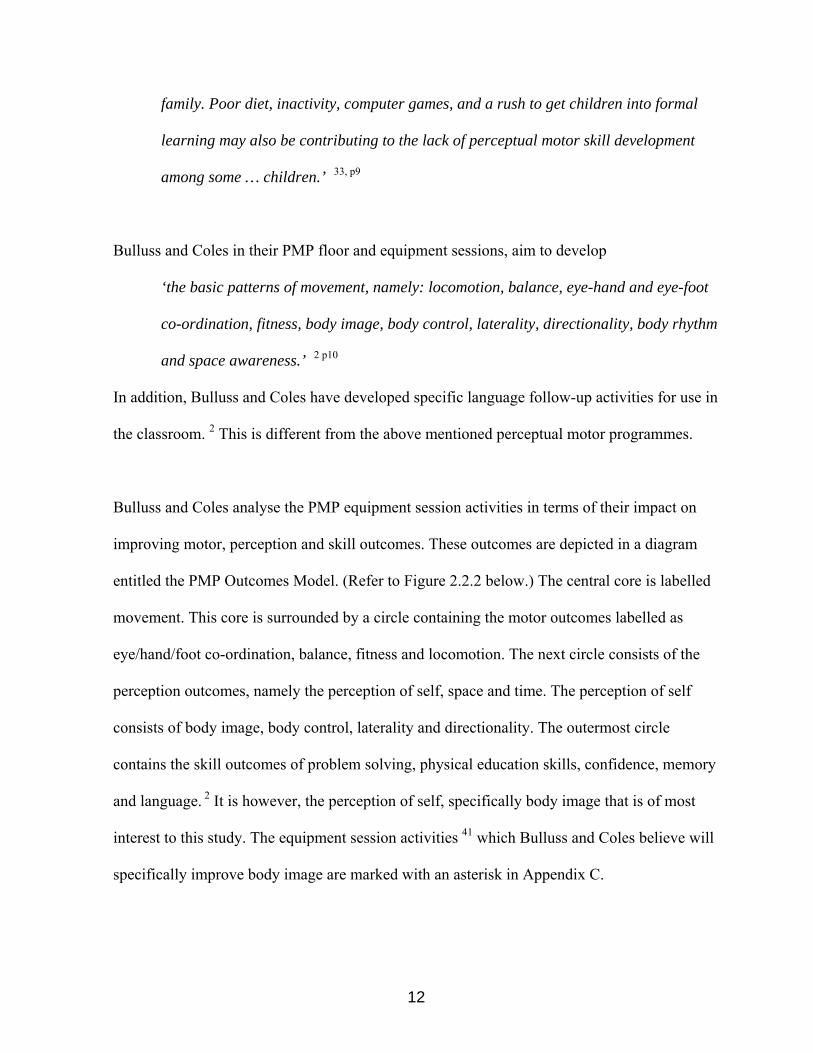
Bulluss and Coles analyse the PMP equipment session activities in terms of their impact on
improving motor, perception and skill outcomes. These outcomes are depicted in a diagram
entitled the PMP Outcomes Model. (Refer to Figure 2.2.2 below.) The central core is labelled
movement. This core is surrounded by a circle containing the motor outcomes labelled as
eye/hand/foot co-ordination, balance, fitness and locomotion. The next circle consists of the
perception outcomes, namely the perception of self, space and time. The perception of self
consists of body image, body control, laterality and directionality. The outermost circle
contains the skill outcomes of problem solving, physical education skills, confidence, memory
and language. 2 It is however, the perception of self, specifically body image that is of most
interest to this study. The equipment session activities 41 which Bulluss and Coles believe will
specifically improve body image are marked with an asterisk in Appendix C.
12
Figure 2.2.2 PMP Outcomes Model
Copied with permission from J. Bulluss and P. Coles 1, 2
2.2.3 PMP in the New Zealand Context
PMP has become more popular in New Zealand schools over the last five to eight years. This
is partly because it is an integrated programme that includes many areas of the current national
curriculum content as outlined by the New Zealand Ministry of Education. 15 (Also refer to
Appendix A.) In particular, PMP fits appropriately into the school curriculum area of Health
and Physical Education. It provides opportunities for learning in all four strands or areas of
Health and Physical Education. These strands are: personal health and physical development;
movement concepts and motor skills; relationships with other people; and healthy
communities and environments. 42 PMP has been perceived to be beneficial for students
especially in the areas of ‘developing physical co-ordination, balance, and locomotion.’ 32, p23
13
This is especially relevant considering the results of a 1983 New Zealand survey of 335 South
Auckland primary school children of which 18.6% had significantly impaired motor skill
development as measured on the standardised Bruininks-Oseretsky Test of Motor
Proficiency. 43
2.2.4 Review of Perceptual Motor Programmes
Most of the literature available on perceptual motor programmes and training comes from the
USA from the 1970’s. 9, 44, 45 Many studies involved older children with learning or intellectual
delays. Some perceptual motor studies examined preventative-type of perceptual motor
programmes with younger children at kindergarten level. 9, 46 These preventative-type
programmes had a focus on school readiness. Cratty and others believe that the optimal time to
prevent difficulties in perceptual motor learning is during the pre-school years. 5, 21
Platzer in 1976 examined the effect of a daily 10 week perceptual motor training programme
on gross motor skills and self-concept of 40 four and five year old children. 9 Cratty’s Six-
Category Gross-Motor Test which includes body perception, gross agility, balance, locomotor
agility, throwing and tracking was used to evaluate the perceptual motor skills. Self-concept
was measured by the children’s drawings of a house, tree and person. The drawings were
scored by a qualified expert in projective evaluations using the Goodenough House, Tree,
Person Projective Test scoring criteria. The experimental group performed better on the gross-
motor test, but the results were not statistically significant. The analysis of the projective test
which included a human figure drawing task, revealed significant improvements in self-
concept, defined as the child’s feeling about self and capabilities. It was concluded that the
14
programme length should rather be of at least three months duration to achieve the desired
goal of significantly improving gross motor skills.
Farr and Leibowitz in 1976 examined the efficacy of a daily eight week perceptual motor
programme on kindergarten children from low socio-economic backgrounds. 46 The average
age of the twenty children was four years and two months and there were 14 girls and 6 boys.
All the children were pre-tested using the Rosner-Richman Perceptual Motor Survey, the
Peabody Picture Vocabulary Test and the Goodenough-Harris Draw-a-Person Test. The
children were then divided into two groups for the two phases of the study. The mean pre-test
scores on the Rosner-Richman Perceptual Motor Survey were approximately equal for Group
One and Group Two.
In the first phase, Group One participated in daily one hour perceptual motor activities
consisting of: creeping and crawling; tachistoscopic training; walking board; form perception
box; blackboard; parquetry blocks; trampoline board; balance board and rocking board. The
children were encouraged to verbalise as they participated. Group Two attended their regular
pre-school programme during this one hour. The three tests were then repeated. The second
phase of this study occurred after a 10 week winter recess. The groups rotated so that Group
Two participated in the perceptual motor activities and Group One served as the control. The
same three tests were administered prior to and after the perceptual motor programme in this
second phase.
The analyses of the test results for the two phases were similar. There was a significant
difference in the means for the pre-and post-test scores on the Rosner-Richman Perceptual
15
Motor Survey for the group that participated in 40 hours of perceptual motor intervention.
This also occurred in phase two when the groups rotated. For both phases, the pre-and post-
test scores on the Peabody Picture Vocabulary Test and the Goodenough-Harris Draw-a-
Person Test showed no significant differences in either the control or experimental group.
The perceptual motor training programme in the study by Farr and Leibowitz had a strong
emphasis on visual perceptual and balance activities. Without further details on the
programme, it is not clear whether any component specifically addressed body image or
awareness. The authors did not give any rationale for the use of the Peabody Picture
Vocabulary Test nor the use of the Goodenough-Harris Draw-a-Person Test. Farr and
Leibowitz’s study results appear to indicate that movement experiences afforded by this
perceptual motor training programme did not significantly improve the children’s human
figure drawing test scores. 46
There is a significant lack of studies on perceptual motor programmes from the 1980’s
onwards. Reasons for this are presented as follows. The first is the probable impact of the US
Federal Education for All Handicapped Children Act of 1975. This Act stated that all
handicapped children (including those with intellectual and learning handicaps) are entitled to
a free and appropriate education in the ‘least restrictive environment.’ 47, p19 The Act gave
federal funds to programmes that placed these children into normal or integrated educational
classrooms and extracurricular activities. This Act has been widely interpreted as supporting
the expansion of mainstreaming. It is possible that, with the mainstreaming of these children,
there may have been a curtailment in perceptual motor programmes as special schools and
units closed. Reduced programmes would most likely result in fewer samples for research. In
16
1994, Cratty wrote in the context of movement interventions, that the US federal government
was reluctant to fund large scale normative studies on typically developing children. 48
In addition the results of a well known 31, 49 meta-analysis in 1983 by Kavale and Mattson, One
Jumped off the Balance Beam, 36, 50 may have contributed to the decline in the amount of
literature on perceptual motor programmes. In this meta-analysis, 180 studies from the 1970’s
investigating the effectiveness of perceptual motor training that had a control group were
utilised. In the 180 studies the average age of the 13 000 subjects was 7.97 years, the average
IQ was 89, the average sample size 54 and the average intervention period was 19 weeks. The
results of the analysis revealed that perceptual motor training is not an effective intervention
technique for increasing academic, cognitive or perceptual motor variables in children with
lower intelligence levels. A small treatment effect approaching one tenth of a standard
deviation occurred in the balance/posture and body awareness/image categories in over half
the studies.
Kavale and Mattson reported that almost half of the 180 reviewed studies were rated low in
internal validity due to design, measurement and analysis errors. 36 Perceptual motor training
is however, a relatively new area of practice and inquiry and in
‘new areas of research inquiry, effect sizes are likely to be small (when they are not
zero!) because the phenomena under study are not easily controlled experimentally or
measured accurately or both.’ 51, p262 ‘The gold standard for the assessment of an
intervention continues to be the experimental randomised controlled trial.’ 10, p496
There are however, significant ethical considerations when some subjects are withdrawn from
a standard service while a trial is being conducted. 10
17
A short-coming of the investigated perceptual motor training programmes in Kavale and
Mattson’s study is the average programme length of 19 weeks. The authors of PMP believe
that programmes of such short duration are not effective. 1
Kavale and Mattson also mention that there have been
‘philosophical attacks challenging the theoretical… foundations of perceptual motor
training programmes.’ 36, p165
In the PMP manual, Bulluss and Coles have minimal information on the theory underlying
perceptual motor development and research on perceptual motor programmes. 2 Instead they
encourage all users to do their own theory reading in order to understand the rationale behind
the programme. A list of references is supplied. 2
Litterick-Biggs and Broadley conducted a small qualitative study which examined how eight
members of teaching staff from six New Zealand schools implemented and evaluated Smart
Start with Perceptual Motor Program (PMP). 32 On interviewing the eight participants they
found that they did not carry out feasibility studies before implementing PMP and neither did
they critically read evaluative literature on perceptual motor training programmes. Litterick-
Biggs and Broadley concluded that schools and teachers should examine the empirical
evidence rather than relying on a high degree of blind optimism in the effectiveness of PMP.
Campbell, writing in the Australian context expressed similar concerns. 52
PMP equipment sessions are based largely on Capon’s perceptual motor programme. 1, 17 In
1984, a study on the effect of the Capon perceptual motor programme reported significant
perceptual motor gains for the 47 typically developing kindergarten children compared to their
18
peers in the control group. 53 The 85 children from four kindergartens were predominantly
from low socio-economic backgrounds. The Capon Perceptual Motor Scale was used as a pre-
and post-test to evaluate the children’s perceptual motor abilities. It included a total score with
sub-task scores in the following areas: identification of body parts, walking board, hopping,
jump and land, obstacle course and balance. The experimental group participated in daily 30
minute developmentally sequenced perceptual motor activities for 12.5 weeks i.e. a total of 63
lessons. The 38 children in the control group took part in undirected physical activity e.g.
slides, see-saws during these times. The significant perceptual motor gains attained by the
experimental group are encouraging particularly as the intervention period was only 12.5
weeks.
2.3 Body Image
2.3.1 Alternative Usages of Term Body Image
The term body image is important to this study. In order to avoid terminological confusion
which is prevalent in literature, 54, 55, 56 the following brief overview summarises alternative
usages of the term body image with resulting applications to human figure drawings.
The term body image is widely used in literature in many fields. 57 In the fields of psychiatry
and psychology, body image is referred to as the mental image that the individual has of their
physical appearance. 58 This is similar to the layman’s use of the term. 59 In the fields of
psychiatry and psychology, the body image construct has been studied in terms of affective
and perceptual disturbances as seen in individuals with anorexia nervosa and bulimia
nervosa. 60 Where human figure drawings have been used in these contexts, the scoring and
interpretation has focussed on the measurement of body part size. 58
19

Within the study of personality and psychoanalysis, body image, the mental self-image, has
been inferred from human figure drawings using projection techniques. 11 According to
Machover’s study of personality, measures such as the details of the body and clothing are
interpreted in terms of functional significance. Figure size and placement, and the type of line
used are also interpreted as signs of how the individual ‘sees’ their body and self. 61
Finally, Koppitz proposed that children’s human figure drawings can also be used to assess
emotional functioning. Emotional indicators within the drawing are interpreted in the light of
how children ‘feel’ about their bodies and themselves. 61
2.3.2 Usage of the Term Body Image in the Present Study
Within the field of motor learning and awareness of the body, communication has been
hampered by a lack of standardisation of terms. 20, 21 Humphrey and Sherborne explain that the
terms body-schema, body-concept, body-sense, body-experience, body-awareness and body-
image have been used by different writers for the same related concepts. 4, 18 Humphrey
selected the wording body awareness over body image as he found the former to be used more
frequently within the literature that he reviewed. 4 Within the researcher’s review of the
perceptual motor literature, the researcher also found that the terms body image and body
awareness occurred most frequently. For example in their meta-analysis, Kevale and Mattson
refer to the body awareness/image category. 36
For the purpose of this study, the term body image will be used according to Bulluss and
Coles’ definition from the PMP manual. Accordingly, body image is the
‘complete cognizance of one’s own body and its movement possibilities. It is the
20

internal knowledge of the “me-ness of me.”’ 2, p16
Based on the researcher’s review of the literature referenced by Bulluss and Coles, 2 it was
concluded that Capon’s description of body image was most relevant to PMP in general and
also specifically to this study. Capon’s perceptual motor programme has served as a model for
PMP. 2, 17 The cognisance of one’s body involves the awareness and knowledge of:
a. the physical structure of the body and its parts;
b. the movements and functions of the body and its parts;
c. the position of the body and its parts in relation to each other and the environment. 17
2.3.3 Relevant Influences on Body Image
Many factors play a role in the development of this conceptual awareness of the body. These
include body sensations, 35, 54, 62 cognitive development and mental imagery. 63 According to
perceptual motor programme theorists and developers, the improvement of body image is
essential for the development of all other perceptual motor areas. 2, 5 Basic to children’s
physical performance is their ‘vehicle’ for movement, their body. 5 Accurate, specific
knowledge about their body will provide children with a basis for acquiring motor skills. 21, 63
Children’s discovery of what the various body parts are and where they are located helps them
to learn about themselves. 63 It is thought by some that children will first learn about the large
areas of their body and then the more discrete body parts. They will learn about body planes
and movements, and also space awareness, laterality and directionality. 63
Some researchers, including Cratty believe that the primary way in which these body concepts
may be acquired is through participation in carefully sequenced movement experiences. 4, 5
21

This would coincide with Kevale and Mattson’s meta-analysis assessing the efficacy of
perceptual motor training where one of the greatest treatment effect sizes occurred in the body
awareness/image category. 36
2.3.4 Measurement of Body Image and Human Figure Drawings in Perceptual Motor
Programme and Movement Literature
The following literature includes studies from child development, movement education and
occupational therapy fields. These studies will firstly be described and later evaluated by way
of a summary at the end of this section.
Cratty in his book Perceptual Motor Efficiency in Children, lists a variety of methods for
evaluating body image namely: verbal responses to directions including sequences of
movements; pointing to body parts; imitation of gestures; constructing manikins out of
disconnected body parts; and drawing pictures of people. 5 Occupational therapists have
likewise used a variety of assessments to determine body part awareness. These include
pointing to and naming body parts, completing person puzzles and the drawing of a person. 24
Short De-Graff et al write that human figure drawings are a versatile assessment option for
occupational therapists. Amongst other uses, human figure drawings can be used to assess
perceptual motor function, explore body image and measure intervention effects. 64
According to Humphrey it is doubtful whether there are any ‘absolutely foolproof’ methods
for detecting body image problems in children. 4 Humphrey explains that signs said to be
indicative of body image problems can be symptomatic of other deficiencies such as the mild
developmental delay. Broadly speaking there are two ways in which body image deficiencies
22

may be detected. The first is by making observations of the child’s motor behaviours and
secondly by the drawing of self. Humphrey cites the drawing of self as a technique often used
in literature to diagnose body image problems. He states that it is possible through the
drawings of typically developing children to trace certain characteristic stages of perceptual
development.
‘It has been found that drawing a picture of himself assists in helping to detect if there
is a lack of body awareness…The primary purpose of this is to see if certain parts of
the body are not included in the drawing.’ 4, p58
Humphrey includes an account of an informal experiment in which a group of children drew
self drawings before and after a body image movement game called ‘Busy Bee’. In this game,
children in pairs performed specific movements according to verbal directions e.g. ‘shoulder-
to-shoulder’ or ‘toe-to-toe’. After a few verbal directions were given, ‘Busy Bee’ was called
out and the children changed partners. The game continued in this manner with many body
parts emphasised. Before the game, many children did not know where to begin when drawing
a picture of self and others omitted some of the major limbs in their drawings. Following the
game, the children’s self drawings all included a trunk and some had more discrete details e.g.
ears and feet. 4
This view that a child’s drawing of self will reveal their body image and perceptual motor
development is supported by other literature. Ayres and Reid published a paper in 1966
entitled The Self-Drawing as an Expression of Perceptual Motor Dysfunction. 65 They studied
the self drawings of 100 children with suspected perceptual motor dysfunction and 50 children
without. The children’s self drawings were scored according to a scoring system developed by
23
Ayres which assigned points for presence, detail, proportion and attachment of body parts. The
study results revealed that the scores on the self drawing task significantly discriminated
between children with perceptual motor dysfunction and those without. This human figure
scoring system correlates well with the DAP and similar draw a person tests. 66
In a study by Numminen et al the self drawings of 150 children ages three to five years were
analysed on a five-point scale using Saastamoinen’s (1993) test battery. 23 The results showed
that typically developing children’s human figure drawings develop in line with age. The five
year old children’s drawings were more detailed and sophisticated with more body parts
present. It was asserted that
‘3-5-year-old children’s human figure drawing may reflect the important role that
her/his body plays in a certain stage of her/his perceptual development. Through this
“physical body image” a child develops understanding of the relationships in her/him-
self and of her/him-self and other objects in environment.’ 23, p4
As a recommendation, opportunities for the development of perceptual motor skills were
advocated to aid in the development of body image.
Harris in his book 13 provides details on an early study by Mott S.M. entitled Muscular
Activity an Aid in Concept Formation. 7 This study investigated the effect on drawing scores
following the movement of specified body parts. Children first drew a man. They were then
put through a series of exercises emphasising parts of their bodies, verbalising as they moved
e.g. ‘This is my head, I nod it.’ Drawings made immediately afterward were scored using the
Goodenough Draw-a-Man Test scale. This scale allocates points for the presence and detail of
clothing and body parts, as well as the proportions of body parts (length greater than width).
24
The post-movement drawings showed that the exercised parts were not only more likely to be
shown but were also drawn with more detail.
Harris in 1950 investigated the effect of rhythmic exercises, not emphasised verbally, on
children’s drawings of a man. 13 The children consisted of 48 boys and 56 girls in first grade
from two schools in a lower-middle class district. Both groups were required to draw a man
each day for a 10 day period. The experimental group however had 15 minutes of music and
games emphasising arm and leg movements prior to their drawing a man. The drawings from
both groups were scored according to the Goodenough Draw-a-Man Test scale. 16 The
drawings were also scored on a second set of criteria devised for this study: the proportions of
the leg, arm, head and trunk length in millimetres, the average angle of the arms and legs in
relation to the vertical dimension of the picture and a simple rating based on the amount of
movement in the figure. Harris only reported on the results from the second set of scoring
criteria where no significant difference was found between the groups. He concluded that
motor experience was not projected into the drawings or that a fifteen minute period is
insufficiently long to produce a carry-over effect. 13
More recently, two occupational therapists Parush and Hahn-Markowitz explored the effect of
large and small space treatment settings on perceptual motor functioning of 53 pre-school
children. 3 The mean age of the children was five years and 7 months. Eight measures of
perceptual motor functioning were utilised. This included the drawing of a person which was
used as the measurement for body image. The Draw-a-Person Game from the Miller
Assessment of Preschoolers 67 was used to score the drawings. A total score was obtained by
adding the number of items that were present in the drawing and whether the body parts were
25

one or two-dimensional. As the Miller Assessment of Preschoolers was standardised on a
sample from the USA and norms for Israeli children were not available, the raw scores were
used in the data analysis. Subjects in both treatment groups improved as a result of the seven
month one-and-a half hour weekly perceptual motor programme. This included gains in the
total score for the drawing of a person, seen as the measure of body image. 3
A study by Painter 14 cited in Culp et al 6 investigated the effects of a sensorimotor activity
programme on kindergarten children’s body concept. The Goodenough Draw-a-Man Test was
used as a measure to detect change in children’s conceptual awareness of their bodies. The
sensorimotor activity programme resulted in significant gains in knowledge of their bodies as
measured by increased scores on the human figure drawing test.
Culp et al investigated the effect of two types of intervention on young children’s body
concept as reflected in their human figure drawings. 6 Culp et al used the term body concept in
a clinical context to mean the total body experiences that enable children to solve body
awareness problems. The average age of the 16 preschool children in the two experimental
groups, Group A and B, was four years three months. The average age of the eight children in
the matched control group, Group C, was four years five months. There were an equal number
of boys and girls in the three groups. The Goodenough-Harris Draw-a-Person Test was used as
a pre-and post-test to measure changes in body concept. All 24 children drew two sets of
pictures including a man, woman and themselves, one set before and one set at the end of the
intervention period.
26
The 16 children in Groups A and B each participated in 13 training sessions, of approximately
45 minute duration over the one month period. Group A participated in the following sequence
of activities: 10 minutes of yoga; 30 minutes of perceptual motor type activities (e.g. tumbling
on mats, balancing on a beam or other motor activities); five minutes of relaxation/breathing
exercises. Group B participated in the following sequence of activities: 10 minutes of body
part identification songs and finger plays; 30 minutes of planned activities (e.g. additional
songs, flannel board fantasy man, identifying body parts in a mirror or reading ‘Bodies’); five
minutes of ‘Where’s Mr. Thumbkin?’ Group C was not involved in specific training activities
over the month long period.
The data analysed consisted of pre-test and post-test differences of composite drawing scores
on the human figure drawing test. Composite drawing scores were obtained by averaging the
scores on the man, woman and self drawings. There were no significant differences in the
three groups’ pre-test scores. Significant differences were not found between the males and
females in pre-and post-test comparisons.
There was a significant difference among the three groups’ scores following intervention. As
predicted, the greater mean gain in scores was in the sensorimotor group, Group A. The mean
differences for each group were are follows: Group A gained an average of 9.55 points; Group
B gained an average of 4.2 points; Group C gained an average of .55 points. Differences in the
pre-and post-test scores were mainly due to the addition of body parts and not to the amount of
clothing drawn or body/leg proportion. All drawings were in frontal perspective. The authors
concluded that body concept as measured by human figure drawings was significantly altered
by the two types of intervention.
27

What follows is an evaluative summary of the above reviewed literature on the measurement
of body image by human figure drawings in a movement context. Humphrey’s account of
children’s improvements in their self-drawings following a body part movement game 4
provides anecdotal support for the use of human figure drawings as a measure of body image.
Numminen et al’s interpretation of their findings on the developmental changes in young
children’s self-drawings 23 lacks substantial references to other literature and their work was
not peer reviewed. Mott’s study showed that verbalisation and movement of body parts results
in immediate improvements in body concept as reflected by the inclusion and increased detail
of the drawn exercised parts. 7 Like Humphrey’s account, however, the absence of a control
group limits the reliability of these findings. Parush and Hahn-Markowitz also found that
young children’s human figure drawings included more body parts following perceptual motor
intervention. 3 These changes in the drawings, reported to reflect improvements in body
image, in the absence of a control group, could have been affected by maturational or
spontaneous learning factors.
Harris’s rhythmic exercise study included a control group but also used different criteria for
scoring the human figure drawings. 13 Harris did not provide information on the changes in
overall drawing score. When additional criteria, including body proportions (measured in
millimetres), were evaluated the difference between groups was not significant. Harris
considered that the 15 minute exercise period may have been insufficient to produce changes
in the drawings.
Finally, Culp et al’s study which used a control group was presented in detail. 6 Their findings
favour movement experiences over language training for improving body concept as reflected
28
in children’s human figure drawings. The experimental groups participated in 13 three quarter
of an hour sessions over one month. Culp et al found that the changes in the pre-and post-test
drawing scores were mainly due to the addition of body parts as measured by the
Goodenough-Harris Draw-a-Person Test. A criticism of their study is that the drawings of self
with corresponding instructions have not been standardised in the Goodenough-Harris Draw-
a-Person Test. 13 Culp et al’s findings are very positive considering that the intervention period
was only one month.
2.3.5 Body Image Measures Correlated with Human Figure Drawing Tests
In the earlier described study by Ayres and Reid entitled The Self-Drawing as an Expression
of Perceptual Motor Dysfunction a modest but significant correlation of .32 was found
between the children’s self-drawing scores and their ability to identify different parts. 65
Woodburn et al stated that body image can be measured by drawings of the human figure. 68
They examined what specific aspects of body image can be measured by human figure
drawing tests using the Goodenough-Harris Draw-a-Person Test and a body image test in
Costa Rican children. 68 A Spanish version of the Goodenough-Harris Draw-a-Person Test
was used. A prior study by Ceciliano-Rogers and Woodburn, cited in Woodburn et al, 68 had
found the estimated reliability of this version to be good at .83 and likewise good objectivity at
.87. The Spearman-Brown coefficients were good ranging from .87 to .92.
Woodburn et al used the Body Image Diagnostic Test-Universidad Nacional, a Spanish body
image test developed by Woodburn and Mendez in 1988. The test is based on the progressions
outlined in Cratty’s 1970 body image scale. The 94 items on the body image test were judged
29
to be valid by 12 educator judges with 75% to 92% agreement. The reliability with 300 five
and a half to nine year old Costa Rican children was .82 for stability and .85 to .94 for internal
consistency (Spearman-Brown). The inter-rater agreement was good at .85 for the whole test
and ranged from .69 to .85 on the subtests.
The body image test has four subtests:
1. Body Parts and Planes: measures children’s ability to identify their body parts and
planes and spatial relations between them and stationary objects;
2. Body Movements: measures children’s ability to move their trunk and whole body
to show spatial directions and perform non-locomotor movements;
3. Laterality: measures children’s ability to identify their left and right on self and with
objects and to use left-right judgements to establish spatial relationships between
self and stationary and moving objects;
4. Directionality: measures children’s ability to use directional concepts to establish the
laterality of stationary and moving objects in space, alone and in relation to other
objects.
The 90 children in Woodburn et al’s study consisted of 30 children in kindergarten, 30 in first
and 30 in second grade. There were 49 boys and 41 girls. The age range was from five and a
half to seven years in kindergarten and six and a half to nine years in the other two grades. The
Goodenough-Harris Draw-a-Person Test and the body image test were administered to the
children over a two week period.
30
The correlations between the Goodenough-Harris Draw-a-Person Test total score (average of
man and woman drawing scores) and the body image test were significant and positive
(r=.49). Important correlations were also found when the total scores on the body image test
were correlated with four subtest scores on the Goodenough-Harris Draw-a-Person Test,
namely: identification of all the elements on the trunk and limbs (r=.47); proportion (length
greater than width) of trunk and extremities (r=.41); identification and proportion
(combination of previous two subtests) (r=.49); identification and proportion of body trunk (all
details in prior subtest that are on the central part of the body) (r=.50). Slightly lower
coefficients were obtained when the total Goodenough-Harris Draw-a-Person Test scores were
correlated with each of the four subtests on the body image test (from .30 to .43).
Particularly relevant to this current study is the significant correlation of .43 between the body
planes and body parts aspect of body image test with the children’s performance on the human
figure drawing test.
2.4 Children’s Human Figure Drawings and Draw A Person Tests
2.4.1 Abilities Required for Human Figure Drawings with Reference to Specific Draw A
Person Tests
The progression in children’s drawings from non-symbolic marking to graphic symbolism can
be attributed to inter-related developmental changes in their cognitive-conceptual, perceptual
and motor systems. 69, 70, 71 Cognitive skills are firstly described with specific reference to the
following human figure drawing tests, namely the Goodenough Draw-a-Man Test, the
Goodenough-Harris Draw-a-Person Test and the Draw A Person: A Quantitative Scoring
31
System (DAP). A brief account of these three tests is given in this section. Perceptual and
visual-motor skills are then discussed with reference to the above drawing tests.
The use of children’s drawings to estimate cognitive ability is an approach that has been
researched since the late 1800’s. 16 Goodenough in 1926 published findings that children’s
drawings of a man can be correlated to their level of intelligence. Goodenough stated that the
human figure drawing task is
‘useful in the analysis of specific mental functions and in the study of the development
of conceptual thinking during early childhood.’ 16, p13
Goodenough postulated that the following cognitive processes are required by a child when
performing a freehand human figure drawing task: association by similarity; analysis and
synthesis of parts and spatial relationships; judgements of quantitative relationships and of
relative proportions; abstraction and adaptability. 16
The Goodenough Draw-a-Man Test or scale as it was initially known was established as a
measure of non-verbal cognitive ability. This scoring system consists of 51 possible points
based mainly on the presence, detail and proportion of body parts in the drawing of a man. It
was normed on nearly 4000 US children including 375 children in the five year age group.
Age norms were given for the number of points obtained with the resultant approximate
mental age of the child. Standard scores were not provided. 16
This test was refined by Harris in 1963 through the addition of a drawing of a woman and a
drawing of the self. 13 Separate standard scores for boys and girls are provided for the man and
woman drawings. Harris’s norms were initially based on 3000 US children with 75 finally
32
selected in each age level from kindergarten (age five) to 15 years. The man drawing is scored
on 73 items and the woman drawing on 72 items. Only 42 items are common to both scales. 72
The majority of the test items can be grouped into four categories: motor control and
coordination (seven items); proportions (nine items); depiction of features (18 items); detail in
features (33 items). 73
Harris discussed the abilities required by this drawing test as those of intellectual or
conceptual maturity rather than intelligence per se. 13 Accordingly, conceptual maturity
involves the child’s ability to form concepts of an increasingly abstract nature, requiring
perception, abstraction and generalisation.
‘This change gets away from the notion of unitary intelligence and permits
considerations of children’s concepts of the human figure as an index or sample of
their concepts generally.’ 13, p5
Children’s level of conceptual awareness of their bodies is therefore important in helping them
to draw pictures of themselves and others. 13, 66 Woodburn et al’s study confirmed this finding
a significant correlation between children’s Goodenough-Harris Draw-a-Person Test scores
and their body image test scores. 68
The Goodenough-Harris Draw-a-Person Test was used for over 20 years as the main rating
approach applied to children’s drawings to estimate cognitive ability. 27 Studies have shown
the Goodenough-Harris Draw-a-Person Test to be a predictor of future academic success. 74 It
has been shown to be a fairly adequate screening estimate of intellectual ability with reported
correlations with the Wechsler Intelligence Test for Children Revised (WISC-R) ranging from
.40 to .64. 66, 75 Strongest correlations occur specifically between the performance component
33
of the WISC-R and the human figure drawing test scores. The ability to conceptualise and
draw human figures demonstrating detail and accuracy is similar to the visual conceptual
abilities measured on the WISC-R. 75
Criticisms of the Goodenough-Harris Drawing Test 66, 76 led to the development of the Draw A
Person: A Quantitative Scoring System (DAP) by Jack Naglieri in 1988. 27 The DAP increased
the precision of the standard scores by providing norms for half-year and quarter-year age
intervals. The DAP provides norms for the Self drawing and a composite standard score (Total
score) consisting of the scores of all three drawings, Man, Woman and Self, for greater
reliability. The DAP scoring system has 14 criteria, consisting of presence, detail, proportion
and bonus categories. (Refer to section 2.5 in Chapter Three and Appendix H for more
information on the DAP.)
To date the most widely examined methods for scoring children’s human figure drawings as
measures of cognitive ability are the Goodenough-Harris Drawing Test and the DAP. 66
Other cognitive abilities required by children when completing freehand human figure
drawing tasks include attention, 24, 77 working memory, 69 motor planning 73 and visualisation
or imagery. 67, 78, 79 Typically children need to have a mental model or internal representation
of the object to be drawn. 28, 29, 80 The most commonly drawn object by young children is that
of the self. 23 At around four to five years of age, children are considered to have graphic
routines which are efficient enough to enable them to draw familiar objects or topics. 28 These
graphic routines are required for both the ‘what of drawing’ i.e. the representation of the
34
subject matter and the ‘how of drawing’ i.e. the process of how the physical movements are
organised when drawing. 28
Perceptual abilities are also required for the human figure drawing task. 71 Bodily sensations,
textures, sounds, smells, tastes and visual shapes and forms can be represented within the
drawing once perceived and organised. 71 Children need to develop a sensitive perceptual
awareness of self, others and their environment in order to represent their experiences
graphically in a holistic and developmentally appropriate manner. 70, 71, 81
Blind children’s human figure drawings have been found to have less detail. 71 Autistic
children’s drawings of the self and others have been found to lack distinguishing features in
line with their restricted social awareness. 81 Human figure drawings by children with right
hemisphere injury lack spatial organisation with body parts attached in inappropriate places. 82
The relationship between children’s visual perceptual skills and drawings of human figures
was specifically studied by Armentrout. 83 A group of 38 at-risk children who had just
completed kindergarten took part in a six week perceptual skill training programme. The
perceptual training component consisted of visual perceptual, fine motor and body image
activities. The children also took part in physical education, speech and language skills and
pre-reading skills. The children’s drawings of a man and woman were scored using the
Goodenough-Harris Draw-a-Person Test. Marianne Frostig’s Developmental Test of Visual
Perception was used as a measure of visual perceptual skills. Both tests were administered
prior to and at the end of the six weeks. Scores on both tests increased significantly with
35
modest inter-correlations found between the human figure drawing test and the visual
perceptual test.
The drawing of a person also requires the coordination of visual perceptual and finger-hand
movements, known as visual-motor integration. 74, 84 A study by Duffey et al found a
significant .46 correlation between 80 kindergarten children’s scores on the Goodenough
Draw-a-Man Test and the Developmental Test of Visual-Motor Integration (VMI). 74 The
VMI requires children to copy a series of developmentally graded geometric forms. Similar
findings between children’s copying ability of geometric forms and their human figure
drawing performance have been reported by Oakland and Dowling. 75
Children’s drawings of human figures when scored using the Goodenough Draw-a-Man Test
and the Goodenough-Harris Draw-a-Person Test are awarded points for motor control or co-
ordination. Barnett and Henderson used the Goodenough-Harris Draw-a-Person Test as a test
of drawing ability in a study on clumsy children’s drawing performance. 73 The greatest
difficulty for the clumsy children was in the seven motor control and co-ordination test items.
The lines on their human figure drawings were irregular, poorly controlled and did not meet
cleanly at junctures. Shapes were often incomplete and shading was frequently inaccurate and
variable. Harris found a .34 correlation between a tracing test and children’s performance on
the Goodenough-Harris Draw-a-Person Test. 13 The DAP however, does not assign points for
exact or complex motor skill 27 and hence children are not unduly advantaged or
disadvantaged for their fine motor ability.
36
In contrast, the influence of children’s fine motor abilities has been found to be particularly
important in the projective usage of human figure drawing tests. 69 Individual differences in
fine motor skills have been found to confound the drawing variables and outcomes of
personality assessments. 69 For example, the interpretation of signs such as the thickness of
line, shading and size of human figures are greatly affected by fine motor ability. 61
In summary, the abilities most strongly associated with typically developing children’s
performance particularly on the DAP and similar draw a person tests are: general cognitive
abilities including conceptual knowledge about the body; visual perceptual abilities and
visual-motor integration. 75
2.4.2 Influences on Human Figure Drawings with Reference to Specific Draw A
Person Tests
Within the literature on children’s human figure drawings a number of influences have been
identified and described. The most noted is age. With increase in chronological and mental
age, the way boys and girls draw various parts of their human figures changes in a systematic
manner in most Western cultures. 85, 86 Children around the ages of three to four years draw
tadpole figures consisting of a head with single lines attached to represent the limbs. 85 Some
children around age four draw a transitional form which has longer lines for legs. The longer
legs are thought to represent the trunk because the arms are attached to these legs. 85
From age five upwards, children add a trunk below the head. This is an important milestone
making the figure look more normal. It is now known as a conventional human figure
drawing. Up until the age of 12 or 13 years children add more and more body parts to their
37
drawings of people. 85 As each feature is added, it is clearly delineated so that the figure has an
overall segmented appearance. Later, children begin to use a continuous contour to unite the
previously segmented parts. Most of the human figures drawn by five year old children are
segmented, while nearly all nine year olds draw contoured figures. 85 Young children’s
drawings are drawn in the characteristic frontal view or canonical orientation. It is uncommon
for children under the ages of nine years to draw the human figure in profile view. 16, 85
Researchers, including Cox, have challenged the claim by Di Leo and others that the human
figure drawing task is culture-free. 69, 85, 87 Differences in human figure drawing performance
using the Goodenough Draw-a-Man and the Goodenough-Harris Draw-a-Person scoring
systems, have been reported in a range of different cultural groups. 85, 88 For example, in 1932
Paget using the Goodenough Draw-a-Man Test, found that among 4000 drawings produced by
967 Maori children in New Zealand, the proportion of figures drawn in profile increased from
61% at age five years to 88% at age eight years. 85, 88
Harris wrote that for the most valid results, points of the Goodenough-Harris scoring scale
should be re-standardised for every group having a distinctly different pattern of dress, way of
life and level of education. 13 Naglieri designed the DAP scoring system to reduce some of the
cultural influences, particularly in the area of style of dress, making the DAP less culturally
loaded than Goodenough’s and Harris’s scoring scales. 27, 89
Besides age and cultural factors, another important influence on children’s performance on
human figure drawing tests is that of gender. Goodenough noted that girls performed slightly
better on the Draw-a-Man Test than boys. The most marked differences were of a qualitative
38

rather than a quantitative nature. 16 Harris gave separate norms for boys and girls. 13 Strommen
and Smith found that girls outperformed boys on the Goodenough-Harris Draw-a-Person Test
by an average of two points at ages five to seven years. At age eight boys outperformed girls
by an average of four points. 72
Woodburn et al did not find that gender was an important aspect of variance in their study
examining the relationship between the Goodenough-Harris Draw-a-Person Test and a body
image test in Costa Rican children. 68 Likewise Oakland and Doweling found that gender was
unrelated to performance on this drawing test with white, black and Mexican American
children. 75
The DAP does not have separate norms for males and females. In a sample of 1500 children
Naglieri found a small difference between girls’ and boys’ drawings scored using the DAP
system. He concluded that it had little practical significance. 27 Hagood using the DAP to
score 306 drawings by 34 primary school children, found no significant difference between
boys and girls over the three phases of the year long study. 89
Socio-economic influences were not found to be significant in Golomb’s extensive studies of
the representational development of children’s human figure drawings. 71 In contrast, Oakland
and Dowling found that children from the lower socio-economic group scored lower than
children from the middle-income group on the Goodenough-Harris Draw-a-Person Test. 75
They and others concluded that socio-economic differences are more important than racial and
ethic group membership in determining differences in performance on human figure drawing
tests. 75, 90
39
Children’s drawings of people are also influenced by schooling and educational level. 13, 87, 88
Schooling provides opportunities to practise writing and drawing, introducing children to the
concept of signs and symbols. 69, 87 Even limited educational opportunities have led to children
from graphically naive societies producing conventional Western type of figure drawings 87 as
described at the beginning of this section.
Artistic influences from art within societies, formal art lessons and artwork within popular
culture can affect how children draw human figures. 88 Children also learn drawing techniques
from their peers and adults. 87, 88 Direct training in drawing the human figure has been found to
affect the human figure drawing test results resulting in increased scores. 13, 16
In summary, there are a number of influences on children’s performance on human figure
drawing tests. Researchers have agreed on the particular influences of age, schooling and art.
There is some dispute over the influence on culture, gender and socio-economic status.
2.5 The DAP Measurement Instrument
2.5.1 Reasons for Selection of the DAP
The DAP was selected as the measurement instrument for this study for a number of important
reasons. Firstly, the DAP has been well standardised on large numbers of children and is
considered to be methodologically sound. 27, 66, 91 The reliability and validity of the DAP is
discussed below in detail. Secondly, according to recent literature, the DAP along with the
Goodenough-Harris Draw-a-Person Test is the most widely examined method for scoring
children’s drawings from a cognitive-conceptual developmental perspective. 66, 91, 92 In
40

developing the DAP Naglieri used material from Goodenough 16 and Harris. 13 Correlations
between the DAP and Goodenough-Harris Draw-a-Person Test are high. 27, 66
The DAP was developed in 1988 and was selected by the researcher over the Goodenough-
Harris Draw-a-Person Test which was developed in 1963. As advocated by Harris and
Naglieri, it is important to use the most contemporary instrument available when scoring
children’s drawings of a person. 13, 27, 89 The DAP scoring system reduces the influence of the
current style of dress, making it less sensitive to current fashion trends and cultural
influences. 27, 89
The Goodenough-Harris Draw-a-Person Test has been criticised for being outdated and the
scoring instructions have found to be imprecise on some items. 27, 93 Concerns have been
raised about its concurrent validity. 66
The DAP, unlike the Goodenough-Harris Draw-a-Person Test, offers norms for the self
drawing. Naglieri advocated the use of the total score based on three drawings which he found
to be more reliable. 27, 89 The DAP has increased precision in its scoring system with half-year
and quarter-year intervals. 27 In contrast, the Goodenough-Harris scoring system has one year-
intervals. 13
The Goodenough-Harris Draw-a-Person Test is time consuming to score. 66, 94 This detailed
scoring system may be more useful for older rather than younger children. For example Piersal
and Santos found that with five year old children, a maximum of 20 out of the 73 possible
scoring categories were used with the Goodenough-Harris Draw-a-Person Test. 94 In contrast
41
the DAP system is shorter with only 50 items (without the 14 bonus points) grouped into 14
criteria. The same 14 criteria are used for all three drawings. The DAP scoring system is easy
to learn and quick to administer. 66, 91
Within the New Zealand context, no published standardisation studies were found on the DAP
or Goodenough-Harris Draw-a-Person Test. New Zealand test use patterns show that the
Wechsler Intelligence Scale for Children-III and Ravens Standard Progressive Matrices are
used as cognitive assessment measures for children. Human figure drawing tests of the
projective kind rather than the cognitive kind are used in a limited manner in New Zealand. 95
2.5.2 The DAP Reliability
The DAP was standardised on a sample of 2 622 individuals aged five through 17 years from
the USA. This sample was matched to population characteristics according to the US Census
figures. A sample of approximately 200 individuals in each of the 13 one-year age groups
between 5 and 17 years was determined as being large enough to yield stable norms. 27
The DAP’s internal consistency coefficients were calculated using the standardisation sample.
The DAP Total score (sum of the Man, Woman and Self scores) reliability coefficients
(Chronbach Alpha) ranged from .83 in the 12 year age group to .89 in the five year age group.
‘This indicates good internal consistency of scores across the 14 scoring criteria and
the three drawings.’ 27, p14
The DAP’s reliability coefficients of the Man, Woman and Self scores ranged from .56 to .78.
In the five year age group the internal consistency scores were .70 for the Man and Self scores
42

and .71 for the Woman scores. Thus in the five year age group, the reliability coefficient of .89
for the DAP Total score is much higher than the individual drawing
scores. 27
The stability of the DAP scores was studied by retesting a sub-sample of the standardisation
sample. This test-retest study consisted of 112 individuals from grades one through seven and
was conducted four weeks after the initial testing. It revealed a mean stability coefficient for
the Total Scores of .74. The mean coefficients for the Man, Woman and Self scores were not
as high and were .70, .65 and .58 respectively. 27
The DAP manual reports on a study by Gottling in 1985 (an unpublished master’s thesis)
which compared the interrater reliability of the DAP to the Goodenough-Harris scoring
system. A sample of 45 children in elementary school (15 each in grades one, two and three)
and 44 children in junior high school (approximately 15 each in grades five, six and seven)
was obtained. The students (approximately half females and half males) were tested in groups
in their regular classes by their teachers. Two examiners trained in both test scoring systems
then scored the drawings. The coefficients (product-moment correlations) of the DAP and
Goodenough-Harris scoring systems at the elementary and junior high school levels were good
with a range of .86 to .95. 27
Intrarater reliability was obtained from the same study with the drawings being scored, using
both scoring systems, a second time by the same two examiners. The first examiner scored
drawings from children in grades one through three and then rescored them after an average of
16 days. The second examiner followed the same procedure with the grade five through seven
43
students, with an average time interval of 25 days. The results of these coefficients were good
with a range of .89 to .97. 27
2.5.3 The DAP Concurrent Validity, Criterion Validity and Applications
The concurrent validity of the DAP in relation to the Goodenough-Harris scoring system is
reported from four studies. The first was Gottling’s study which used the 89 students
described above. The students’ drawings of a Man, Woman and Self were scored by one
examiner according to the two different scoring systems. The results indicated that
‘the two scoring systems yield standard scores that are highly correlated’ 27, p17
with correlations higher than .76.
The second study had a sample consisting of 100 nine-year olds (half boys, half girls) which
were taken from the DAP standardisation sample. Two trained scorers each scored 50 cases
using both scoring systems. These correlations were high ranging from .80 to .87. 27
Harrison et al found a strong relationship between the DAP and Goodenough-Harris scoring
system in a study with 75 kindergarten children. 96 Abell et al reported a correlation of .79
between the DAP and Goodenough-Harris scoring systems with 200 children aged six to 15
years. 66
Within the DAP manual Naglieri has made no attempt to interpret the results of the DAP in
any way other than as a statement of developmental maturity. 27, 89 Within the manual two
studies are given which provide support for the DAP as a nonverbal measure of ability. The
first study involved the students from the DAP standardisation sample. Naglieri’s Matrix
44
Analogies Test-Short Form (MAT-SF) was used as the test of nonverbal ability. It utilises
abstract figural analogies of the progressive matrix type.
‘The DAP Total, Man, Woman, and Self standard scores correlated significantly with
the MAT-SF.’ 27 p19
The second criterion-related validation study compared the Goodenough-Harris scoring
system with that of the DAP in a sample of 100 nine year olds taken from the DAP
standardisation sample. The correlations with the MAT-SF were not
‘significantly different for the two scoring methods, indicating that they have
comparable validity as measures of (non-verbal) ability.’ 27, p19
Later studies have investigated the relationship between children’s performance on the DAP
and other ability measures. In 1990, Harrison et al correlated 75 kindergarten children’s
drawings scored with three scoring systems including the DAP, with the Standford
Achievement Test and Otis Lennon School Ability Test. 96 Harrison et al reported some
stastical support for the validity of the DAP, Goodenough-Harris Draw-a-Person Test and
McCarthy Draw-a-Child (subtest from the McCarthy Scales of Children’s Abilities) in
predicting later school ability and achievement.
In 1989, Wisniewski and Naglieri found a modest concurrent validity coefficient of .51
between the DAP scores and Wechsler Intelligence Scale for Children-Revised. 97 In 2001,
Abell et al correlated two groups of 100 children’s drawings measured using the DAP,
Goodenough-Harris and Ayres and Reid scoring systems with the two versions of the
Wechsler Intelligence Scales for Children. Correlations ranged from .29 to .55. The most
45
significant correlations were found between the younger children’s performance on the DAP
and Goodenough-Harris tests and their performance intelligence quotient. 66
The reviewed literature shows that the DAP has good reliability and validity. Abell et al,
Hagood and Harrison et al reported that the DAP can be used as a developmental measure of
non-verbal cognitive ability. 66, 91, 96 Naglieri, like Harris, in interpreting his drawing test views
the DAP as a measure of developmental maturity. 13, 27, 89 Children’s human figure drawing
tests like the DAP have important advantages in that they are child-friendly, cost-effective and
less influenced by linguistic variables. 76, 98 The DAP scoring system in particular is easy to
learn and score. 27, 91 The DAP is well correlated with the Goodenough-Harris Draw-a-Person
Test. 27, 66, 96 The DAP, like the Goodenough-Harris Draw-a-Person Test, 68 can be used as a
measure of children’s body image as children’s knowledge of their bodies will be reflected in
their drawings of people. 6, 13, 16 Ayres and Reid aptly wrote that
‘Ever since Goodenough (1926) demonstrated the value of drawings of a man as
indices of children’s intellectual capacity, variations of her technique have been used
as expressions of cognitive, affective, and organic function. It commonly has been
inferred that, in contrast to the drawings of other objects, depicting the human figure
reflected the status of the drawer along the many dimensions that contributed to the
perception of himself.’ 65, p254
2.6 Literature Review Summary
The investigation of perceptual motor programmes falls within the domains of developmental
occupational therapy, special and movement education. 2, 5, 9 Children’s awareness of their
bodies and resultant movement possibilities are important for the accuracy of their perceptual
46
motor responses. 20, 39 The improvement of children’s body image is therefore an essential
outcome of PMP 2 and perceptual motor programmes in general. 17, 20, 21 Children’s body
image is seen to be reflected in their drawings of self and others. 3, 64 Human figure drawing
tests like the DAP, which score for presence, detail and proportion of body parts 27 can be used
to measure developmental changes in children’s body image.
This study investigated the effect of PMP on young children’s drawing of a person, including
self, as measured by the change in their scores on the DAP. The following key points from the
above literature review were relevant for this study’s research methodology:
• A quasi-experimental design was utilised to examine the effectiveness of the
PMP intervention taking into account ethical issues 10 and the need for a control group
to control for maturation and spontaneous learning factors; 3
• The number of weeks that the children participated in PMP was to be greater than 19
weeks; 36
• The children in this study were aged five as by this age they have sufficient
knowledge of their body parts and the ability to create human figure drawings. 28, 85
In addition, PMP is typically introduced in the first year of schooling when children
are aged five; 2
• Children from the experimental and control groups were from similar socio-
economic backgrounds to reduce the influence of this variable on test scores; 75, 90
• The numbers of boys and girls in each group was as similar as possible as the
effect of gender differences of human figure drawing performance has been
inconclusively reported on in the literature; 13, 16, 27, 68, 75, 89
• The effect of PMP on children’s drawing of human figures was statistically
47
evaluated utilising the DAP as it is the most recent instrument, has good reliability and
validity, increased precision of the standard scores and norms for the Self
drawing; 27, 66, 89
• The DAP Total score was computed and utilised in the data analysis. The Total score
has the highest internal consistency coefficient in the five year age group. The Total
score has also been shown to have the best test-retest reliability over the individual
drawing scores; 27
• The DAP Self score was also calculated and analysed as the self drawing received
emphasis in literature; 23, 64, 65
• As the DAP has not been standardised on the New Zealand population, the raw scores 3
for the Total and Self scores were also analysed. It was beyond the scope of this study
to undertake the standardisation of the DAP scoring system on the New Zealand
population.
48
CHAPTER 3
3.0 MATERIALS AND METHODS
3.1 Introduction
The purpose of this study was to examine the effectiveness of PMP on enhancing the ability of
five year old New Zealand children to draw human figures. The following research question
was investigated: Will there be a significant quantitative difference in five year old New
Zealand children’s drawing of a person, including of themselves, after a six month period of
participation in PMP, as compared to a similar control group that does not participate in PMP?
3.2 Research Design
A quasi-experimental pre-test post-test research design was used. This specific methodology
was selected because a control group was needed in order to discount for maturation effects
between the initial administration of the DAP and the re-administration six months later.
Therefore, two groups of five year old school children were compared by virtue of their
participation (experimental group - School A1) and non-participation (control group - School
A2) in PMP. These children’s drawings were quantitatively assessed, before commencement
in PMP and six months later and the results were compared.
3.3 Sample Size and Selection
For this study a normally distributed sample was required to enable meaningful comparisons
between the control and experimental groups. In a normally distributed sample differences
between children, such as fine motor skill ability, intelligence and activity levels, can be
controlled for. This is because the nature of normal distribution allows for varying levels of
ability. In order to determine this study’s sample size needed for a normal distribution, the
49

scoring sensitivity of the DAP with five year olds from New Zealand would have been
required. As no such specific data was available ideally it would have been necessary to
conduct a preliminary study prior to this study. This was outside the scope of this research
study. Based on sample sizes from the reviewed literature the total sample size needed to be
greater than 20 subjects, 46 preferably close to 30 in each group 68 to obtain a normal
distribution.
The participants in this study, five year old children, were selected using purposeful sampling
based on the following selection criteria:
• All children were enrolled in local primary schools in the Rotorua region. Children in
New Zealand enter primary schooling on their fifth birthday (year one). 99 (The class
sizes increase during the year, as more children enrol after turning five.)
• The New Zealand school year runs from late January or early February to December.
Children who entered school after mid-February were excluded from the study. This
allowed for the subjects to participate over a six month period from approximately
mid-February to mid-August.
• Each child was five years old for the duration of the study.
• Similar gender composition of the children in both groups was required.
• The children were from the same socio-economic background based on the schools’
decile rank. (Refer to Appendix D for the information on the school decile.)
• Each child had signed parental consent to participate in the study and gave verbal
assent to completing the test. (Refer to Appendix E for copies of these forms.)
• None of the children had known development disabilities, identified by having no prior
involvement with the Group Special Education Early Intervention Services.
50

3.4 Selection of Schools
Following enquiries it was established that four schools in the Rotorua region conducted PMP.
These schools formed the population from which the experimental sample was drawn.
• Of the four schools, three were not suitable for the following reasons: one was a rural
school in an isolated area and a suitable school from which to draw a similar sample to
serve as a control group could not be found; the second school conducted PMP for
only one term of the school year and this was not a long enough duration for this study;
the third school was an urban school of decile four ranking and a school of equal or
similar ranking did not exist in this region.
• The remaining school which conducted PMP, School A1, was a decile two school
with children from a low socio-economic community. 100 School A1 conducted the
PMP equipment sessions twice a week following the sequential activity cards and
utilising the prescribed equipment. The floor sessions were performed once a week.
School A1 has been conducting PMP for one year.
• School A2 was selected based on recommendations by the principal of School A1 as
being the most similar school to School A1. School A2 was also a decile two school
with children from a low socio-economic community. School A2 did not conduct
PMP. The children from School A2 participated in standard physical education
sessions three times a week for 45 minutes for the duration of the study.
3.5 Research Procedure
The research procedure for this study is summarised in the Figure 3.5 below.
51

Figure 3.5 Flow Diagram of Research Procedure
Letters of request mailed to Schools
Discussions with School principals
Letters of permission to conduct study in Schools obtained (Appendix G)
Information Sheets and Consent Forms (Appendix E) distributed by teachers
Signed Parental Informed Consent Forms returned to Schools
Samples obtained based on sample selection criteria (pp 50-51)
February pre-test administration of DAP to 14 children in School A1 and to 15 children in School A2
Researcher scored and interpreted pre-test DAP responses (Appendix H)
School A1 began PMP programme: two equipment sessions and one floor session weekly (Appendix C)
August post-test administration of DAP to 14 children in School A1 and to 14 children in School A2
Researcher scored and interpreted post-test DAP responses (Appendix H)
52Statistical analysis: ANCOVA - parametric and non-parametric (using ranks)
3.5.1 Ethical Clearance Procedures
Ethical clearance was obtained for this study from the Faculty of Ethics committee. (Refer to
Appendix F.) An introductory letter outlining the proposed study and requesting permission to
conduct the study in the schools was mailed to Schools A1 and A2. Appointments were then
made with both school principals where the study proposal was further discussed. Both
principals then signed letters granting support for the study. (Refer to Appendix G.)
Study Information Sheets and Parental Informed Consent Forms were then distributed by the
class teachers to children that met the inclusion criteria in the year one classes at School A1
and School A2 respectively. (Refer to Appendix E.) The parents then returned the signed
Parental Informed Consent Forms to Schools A1 and A2. Only those children, whose parents
returned a signed Parental Informed Consent Form allowing them to participate, were included
in the study. The associate principal at School A1 and senior junior teacher at School A2, kept
the signed consent forms and gave them to the researcher at the time of the February
administration of the DAP.
3.5.2 DAP Administration
The DAP may be administered in a group or individual setting. 27 The researcher administered
the DAP in a group setting at both schools in February and August. Standardised
administration procedures were utilised namely, the use of the same set of instructions for all
the children, the same drawing materials, same time of day and the same examiner.
At the pre-test and post-test DAP administrations the researcher distributed the DAP response
forms and pencils to the children. Where necessary the children were given assistance with
53
writing their first name on the cover of the DAP Response Form. The researcher then asked
the children to draw a man, woman and themselves on the separate pages of the DAP response
form. The children used HB pencils that were sharpened on a regular basis. Drawings were
consistently made in the same order. The wording of the instructions varied according to the
manual and was as follows:
‘First/this time/now I’d like you to draw a picture of a man/woman/yourself. Be sure to
draw the very best picture that you can. Take your time and work very carefully,
and I’ll tell you when to stop. Be sure to draw the/your whole man/woman/self. Please
begin.’ 27, pp23-24
The children were given a maximum of five minutes for each drawing. If the children asked
questions, the researcher repeated the instructions. The drawings were not collected until all
the children were finished. The children were enthusiastic and appeared to give of their best
when doing the drawings in February and again in August.
For the February pre-test DAP administration, the children from both schools were assessed in
their respective classrooms seated in small groups around tables or grouped desks. Their
teachers were present. At this early stage in the school year the total number of children (study
participants and non-participants) in the classes at both schools was small (less than 15). The
non-participants at School A1 and A2 performed other table top activities during the test
administration. At School A1 the study participants were from three different classes with six,
four and four children respectively. At School A2 the children in the control group were from
two classes with eight from one class and seven from the other class. Overall class sizes at
School A2 were a little smaller than those at School A1.
54
At the August post-test administration of the DAP, the class sizes in both schools had
increased as more children had started school, having turned five during the course of the year.
It was thought that it may be quieter and more conducive to test conditions if the study
participants were assessed elsewhere. As a result of this the children at School A1 and A2
were tested in one large group in a room attached to the hall. Their respective associate
principals were present for the duration of the second administration.
The researcher collected the completed DAP Response Forms. The class teachers provided the
researcher with the children’s birth dates from their class records. The researcher then filled in
the birth date, gender, date of testing and school on the cover of each Response Form. In
addition, the researcher also wrote an assigned number on each Response Form. Thus each
child was allocated a number to protect their identity and from this point onwards only this
number was used to identify the data. The drawings were then scored and interpreted by the
researcher at her home.
3.5.3 Learning the DAP Scoring System
Prior to scoring the drawings, the researcher completed the following procedure outlined in the
DAP manual for learning the scoring system: Description of DAP Scoring System was read;
the 14 criteria and 64 items were studied; six drawings in the Worked Examples and
Comments section were scored and reviewed; five drawings in Competency Test I were
scored; these five drawings were then reviewed in the light of the comments provided. The
minimum competency of 90% correct agreements was exceeded so the researcher could then
proceed with scoring the subjects’ drawings. 27
55

3.5.4 Description of the DAP Scoring System
There are three main components in the DAP scoring system: items, criteria and categories.
Each of the three drawings was scored based on points awarded for the number of items
(specific characteristics of the drawing) correctly completed. The points are awarded on 14
criteria. Of these criteria, 12 are parts of the body, namely: Arms, Ears, Eyes, Feet, Fingers,
Hair, Head, Legs, Mouth, Neck, Nose and Trunk. The remaining two criteria are placement of
certain body parts in relation to each other and clothing. Each criterion can be met to varying
degrees, based on the number of items correctly completed. For example, the items for the
Arms criterion include the following: Arms presence, Arms detail 1, Arms detail 2, Arms
proportion and Arms bonus.
‘This organization allows for as few as three and as many as seven items organized
according to the four categories for any one of the 14 criteria.’ 27, p25
Within the 14 criteria, the items are organised into four categories:
• Presence - 13 of the criteria (all except Attachment) are scored for presence. A point is
given if the drawing includes a particular body part or piece of clothing. This category
represents the most basic way the subject may earn credit. It requires only the crudest
type of representation.
• Detail - 12 criteria are scored for at least one detail. This score credits the elaboration
of the criterion beyond a simple representation.
• Proportion - 10 criteria are scored for proportion. This score credits relatively realistic
proportions of the body part.
• Bonus - for each of the 14 criteria, additional credit is given if all the applicable
categories for that criterion are scored as correct. 27
56
One point was given for each item which was correctly completed in the drawing, for a
maximum drawing score of 64. This was then the raw score for the drawing. (Refer to
Appendix H which contains a copy of the DAP Scoring System Sheet with the 64 items under
the 14 criteria on which they are scored.)
In order to obtain the standard scores from the raw scores the following steps were performed:
• Subject’s chronological age was calculated by subtracting the birth date from the
testing date, assuming that a month has 30 days. Rounding up days to the nearest
month did not occur as per the DAP manual instructions. 27
• Raw scores were calculated for Man, Woman and Self drawings based on the above
scoring system description. The DAP Record Forms were used for this purpose. (Refer
to Appendix H for a copy.)
• Total raw score for each drawing was calculated by summing the raw scores on the
Man, Woman and Self drawings.
• Total raw score for each drawing was converted to a standard score with a mean of
100 and a standard deviation of 15. This was performed by utilising the appropriate
age columns in the tables in Appendix A of the DAP manual.
• Man, Woman and Self raw scores were converted to standard scores with a mean of
100 and a standard deviation of 15. The appropriate age columns in the tables in
Appendix B of the manual were utilised for this purpose.
• There are no separate norms in the DAP for scoring the boys’ and girls’ drawings. 27
57
3.5.5 PMP Administration, Data Collection and Recording at School A1
PMP equipment sessions are typically administered by a teacher with assistance from teacher
aides and/or parent helpers. Usually only one class takes part in the half hour equipment
session at a time. 2 The PMP equipment sessions at School A1 were conducted twice a week in
the afternoons in this manner.
The class teachers kept a record of the attendance at PMP of each child in their class who was
part of the study sample. It was intended that the class teachers would perform the prescribed
evaluation of each child’s performance at the equipment station that they were managing. This
evaluation is part of the programme (Refer to pp 103-104 in Appendix B) and was to be
performed by answering the yes/no question at the bottom of the corresponding activity card.
An evaluation grid for this recording purpose is supplied by the PMP consultants. 15
Unfortunately these evaluations were not consistently performed. Since the data was
incomplete it could not be analysed. If all the data were to have been available this would have
provided an indication on whether individual children could successfully perform the activities
designated to improve body image. This information would then have been correlated to
individual scores on the drawing of Self.
It was anticipated that the subjects would attend approximately 48 half hour equipment
sessions during the six month period between the two DAP test administrations. In the second
school term however, over a five week period, 10 sessions were lost due to problems with the
venue. This break was unforeseen and unfortunate. It resulted in the experimental group
58
participating in 38 equipment sessions. Appendix C contains a brief description of the 41
activity stations that the subjects participated in during the 38 equipment sessions.
As per the PMP outline, six floor sessions were completed before any equipment sessions
were begun. Further floor sessions were then completed, one for every two equipment sessions
over the duration of the study. These floor sessions were taken by the class teachers and lasted
on average between 20 to 30 minutes. They were conducted at various times as suited the
three class teachers’ teaching timetables.
School A1 did not conduct the language follow-up sessions. The teachers had not yet put this
into place as this was their second year of running PMP.
3.6 Data Analysis
Demographic information on the children’s age and gender was obtained and analysed.
Descriptive data on the types of human figure drawings made by the children was extracted.
Professor Piet Becker from the South African Medical Research Council assisted with the
statistical analysis of the study data. Pre-test and post-test data from this within subject design,
i.e. change in score from February to August, was analysed using an analysis of covariance
(ANCOVA) to compare the two groups with respect to this change in score with the February
score as covariate. Thus, the groups were compared with respect to mean change after
adjusting for baseline i.e. the February score. These results were also confirmed using a
nonparametric analysis of covariance making use of ranks. The latter analysis was done due to
concern over the relatively small sample size and the large variations in the data.
59
The breakdown of the raw scores according to the four DAP categories of Presence, Detail,
Proportion and Bonus was computed. The mean increase in the Total score for boys and girls
was also calculated.
60
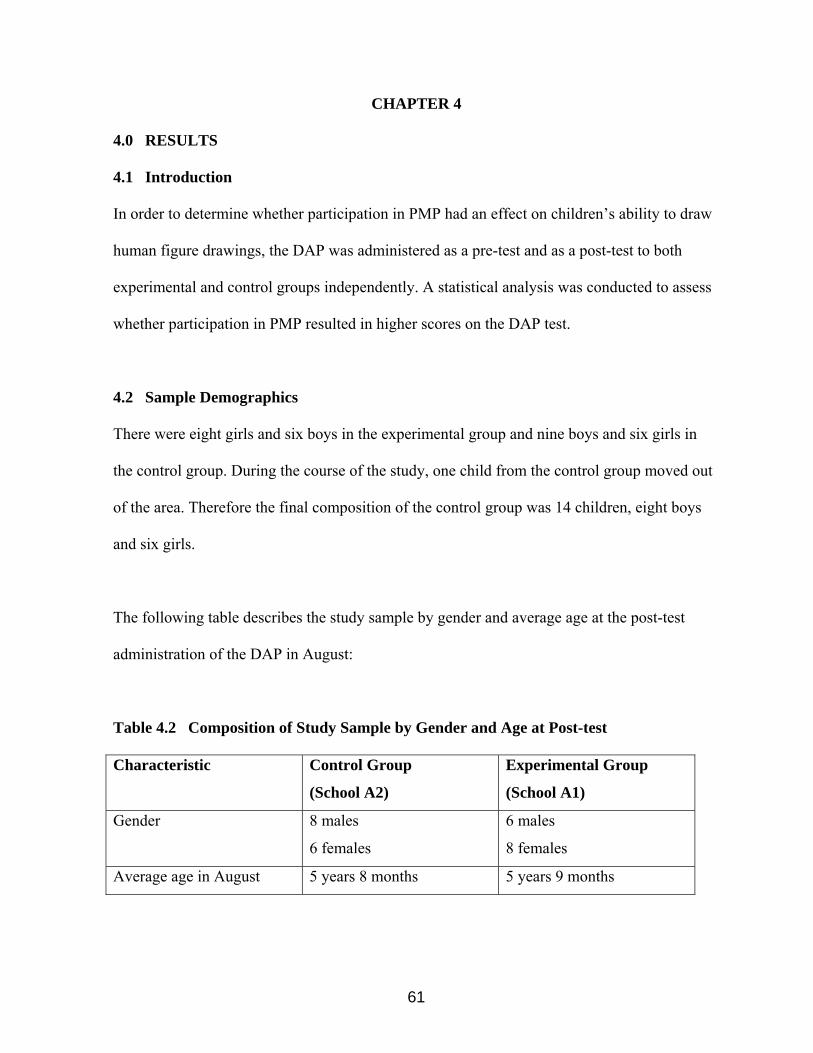
CHAPTER 4
4.0 RESULTS
4.1 Introduction
In order to determine whether participation in PMP had an effect on children’s ability to draw
human figure drawings, the DAP was administered as a pre-test and as a post-test to both
experimental and control groups independently. A statistical analysis was conducted to assess
whether participation in PMP resulted in higher scores on the DAP test.
4.2 Sample Demographics
There were eight girls and six boys in the experimental group and nine boys and six girls in
the control group. During the course of the study, one child from the control group moved out
of the area. Therefore the final composition of the control group was 14 children, eight boys
and six girls.
The following table describes the study sample by gender and average age at the post-test
administration of the DAP in August:
Table 4.2 Composition of Study Sample by Gender and Age at Post-test
Characteristic Control Group
(School A2)
Experimental Group
(School A1)
Gender 8 males
6 females
6 males
8 females
Average age in August 5 years 8 months 5 years 9 months
61
4.3 Study Results
The research question investigated whether there was a significant quantitative difference with
respect to the mean change (increase) in DAP standard scores between the two groups. The
results of this study were analysed in terms of improvements in standard scores (with a mean
of 100 and standard deviation of 15) made by each group respectively. Scores of the drawing
of Self were analysed separately from the Total scores (sum of the Man, Woman and Self
scores). An additional analysis of the raw scores for the drawing of Self and Total scores was
also performed. This was necessary as the DAP has not been standardised on the New Zealand
population.
Table 4.3.1 below reports the following data for both the control and experimental group -
means and standard deviations for the pre-test and post-test standard scores and that of the
change in these scores computed as pre-test score minus post-test score. Also given are the p-
values associated with the comparison of the two groups with respect to change using an
ANCOVA (parametric and nonparametric) with the baseline score (pre-test score) as
covariate. The nonparametric p-values appear in brackets next to the p-values from the initial
parametric analysis.
62
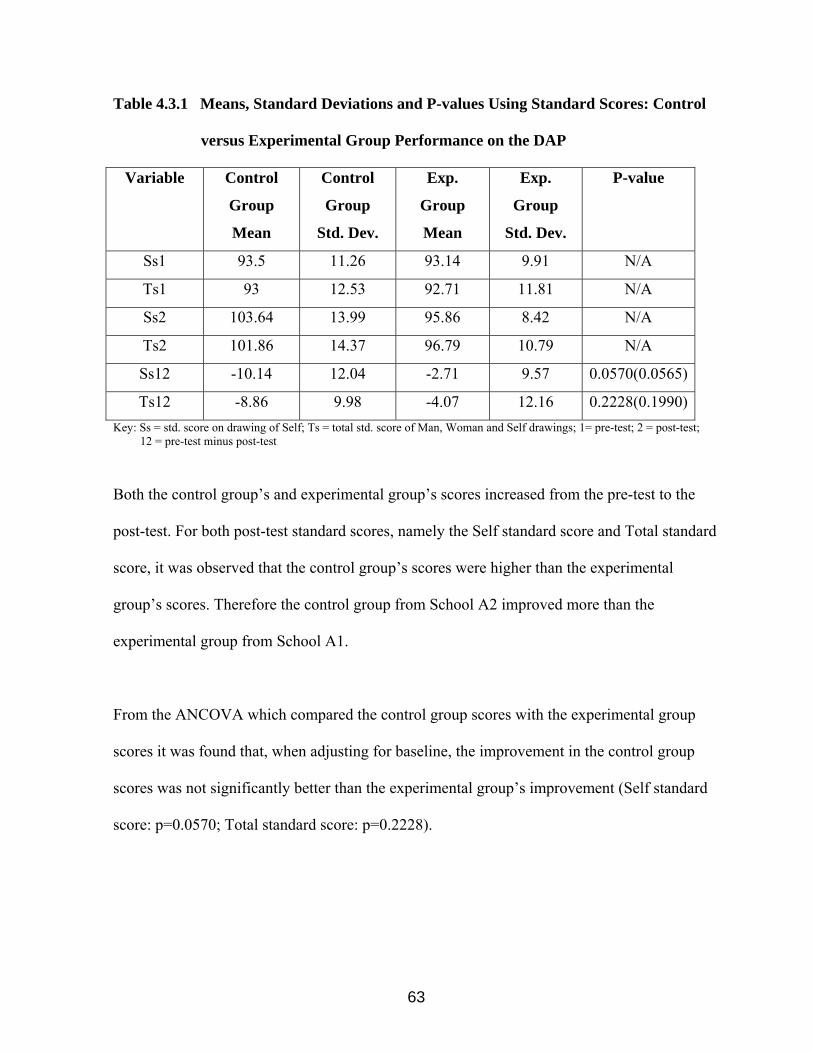
Table 4.3.1 Means, Standard Deviations and P-values Using Standard Scores: Control
versus Experimental Group Performance on the DAP
Variable Control
Group
Mean
Control
Group
Std. Dev.
Exp.
Group
Mean
Exp.
Group
Std. Dev.
P-value
Ss1 93.5 11.26 93.14 9.91 N/A
Ts1 93 12.53 92.71 11.81 N/A
Ss2 103.64 13.99 95.86 8.42 N/A
Ts2 101.86 14.37 96.79 10.79 N/A
Ss12 -10.14 12.04 -2.71 9.57 0.0570(0.0565)
Ts12 -8.86 9.98 -4.07 12.16 0.2228(0.1990)Key: Ss = std. score on drawing of Self; Ts = total std. score of Man, Woman and Self drawings; 1= pre-test; 2 = post-test; 12 = pre-test minus post-test
Both the control group’s and experimental group’s scores increased from the pre-test to the
post-test. For both post-test standard scores, namely the Self standard score and Total standard
score, it was observed that the control group’s scores were higher than the experimental
group’s scores. Therefore the control group from School A2 improved more than the
experimental group from School A1.
From the ANCOVA which compared the control group scores with the experimental group
scores it was found that, when adjusting for baseline, the improvement in the control group
scores was not significantly better than the experimental group’s improvement (Self standard
score: p=0.0570; Total standard score: p=0.2228).
63

The conclusion of the nonparametric analysis, performed due to the relatively small sample
size and the large variations in the data, was very similar to the initial parametric analysis
above (Self standard score: p=0.0565; Total standard score: p=0.1990).
The difference between the groups’ raw Self scores and raw Total scores were also calculated
using an ANCOVA. The p-values obtained from the raw scores were similar to the p-values
derived from the standard scores (Self raw score: p=0.0619; Total raw score: p=0.2283).
In order to provide further insight into the above results, the children’s raw scores on the DAP
were analysed according to the four categories in the DAP scoring system. These four
categories are Presence, Detail (including Attachment), Proportion and Bonus. Table 4.3.2
below illustrates how the children’s raw scores increased from the pre-test to the post-test in
each of these four categories for the Self scores and the Total scores. The table highlights the
difference between the control group’s and the experimental group’s increases per category.
Table 4.3.2 Increase in Raw Scores from Pre-test to Post-test per Category on the DAP
Presence Detail Proportion Bonus
Control Exp. Control Exp. Control Exp. Control Exp.
Sr21 21 0 65 31 29 26 18 9
Difference 21 - 34 - 3 - 9 -
Tr21 58 19 146 100 86 74 53 39
Difference 39 - 46 - 12 - 14 -
Key: Sr = raw score on drawing of Self; Tr = total raw score of Man, Woman and Self drawings; 21= post-test minus pre-test; Difference = control group’s score increase minus the experimental group’s score increase
64
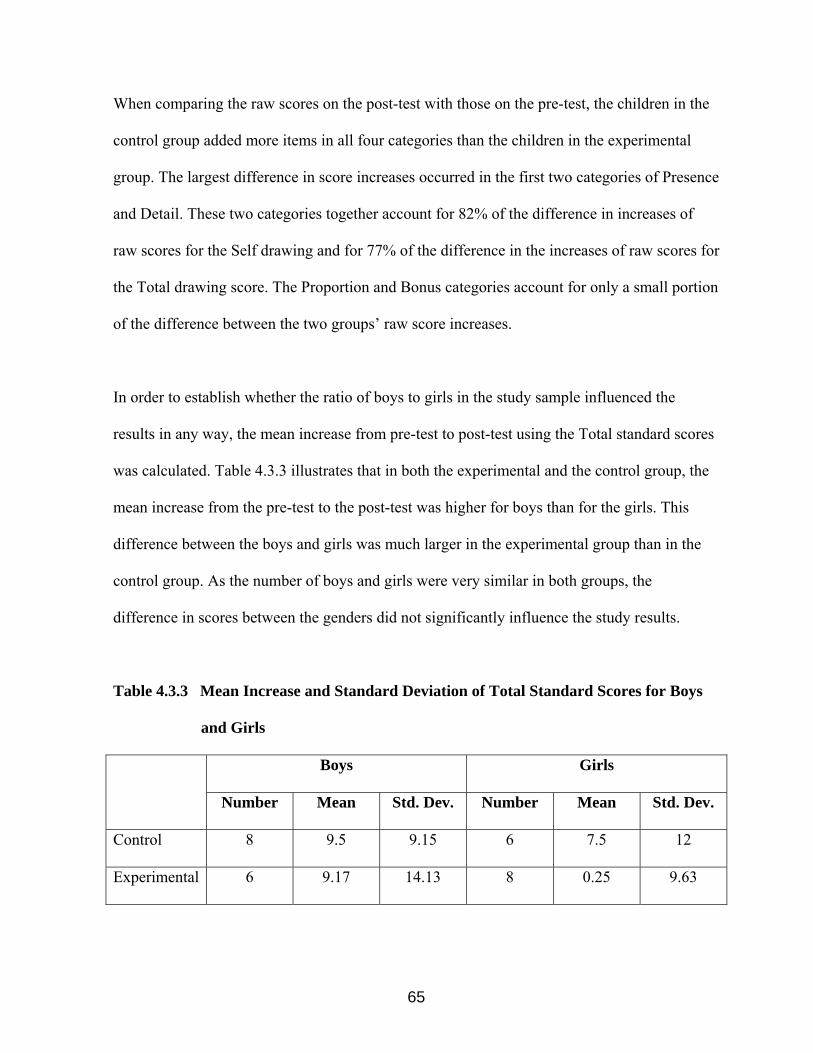
When comparing the raw scores on the post-test with those on the pre-test, the children in the
control group added more items in all four categories than the children in the experimental
group. The largest difference in score increases occurred in the first two categories of Presence
and Detail. These two categories together account for 82% of the difference in increases of
raw scores for the Self drawing and for 77% of the difference in the increases of raw scores for
the Total drawing score. The Proportion and Bonus categories account for only a small portion
of the difference between the two groups’ raw score increases.
In order to establish whether the ratio of boys to girls in the study sample influenced the
results in any way, the mean increase from pre-test to post-test using the Total standard scores
was calculated. Table 4.3.3 illustrates that in both the experimental and the control group, the
mean increase from the pre-test to the post-test was higher for boys than for the girls. This
difference between the boys and girls was much larger in the experimental group than in the
control group. As the number of boys and girls were very similar in both groups, the
difference in scores between the genders did not significantly influence the study results.
Table 4.3.3 Mean Increase and Standard Deviation of Total Standard Scores for Boys
and Girls
Boys Girls
Number Mean Std. Dev. Number Mean Std. Dev.
Control 8 9.5 9.15 6 7.5 12
Experimental 6 9.17 14.13 8 0.25 9.63
65
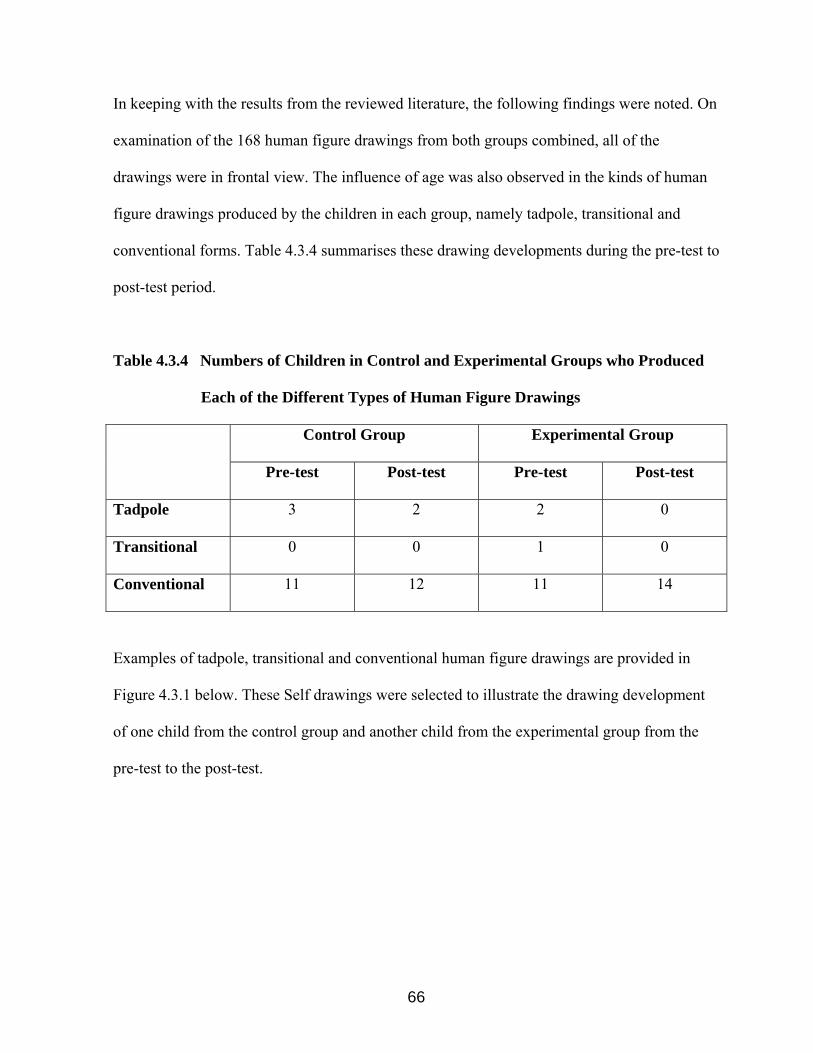
In keeping with the results from the reviewed literature, the following findings were noted. On
examination of the 168 human figure drawings from both groups combined, all of the
drawings were in frontal view. The influence of age was also observed in the kinds of human
figure drawings produced by the children in each group, namely tadpole, transitional and
conventional forms. Table 4.3.4 summarises these drawing developments during the pre-test to
post-test period.
Table 4.3.4 Numbers of Children in Control and Experimental Groups who Produced
Each of the Different Types of Human Figure Drawings
Control Group Experimental Group
Pre-test Post-test Pre-test Post-test
Tadpole 3 2 2 0
Transitional 0 0 1 0
Conventional 11 12 11 14
Examples of tadpole, transitional and conventional human figure drawings are provided in
Figure 4.3.1 below. These Self drawings were selected to illustrate the drawing development
of one child from the control group and another child from the experimental group from the
pre-test to the post-test.
66
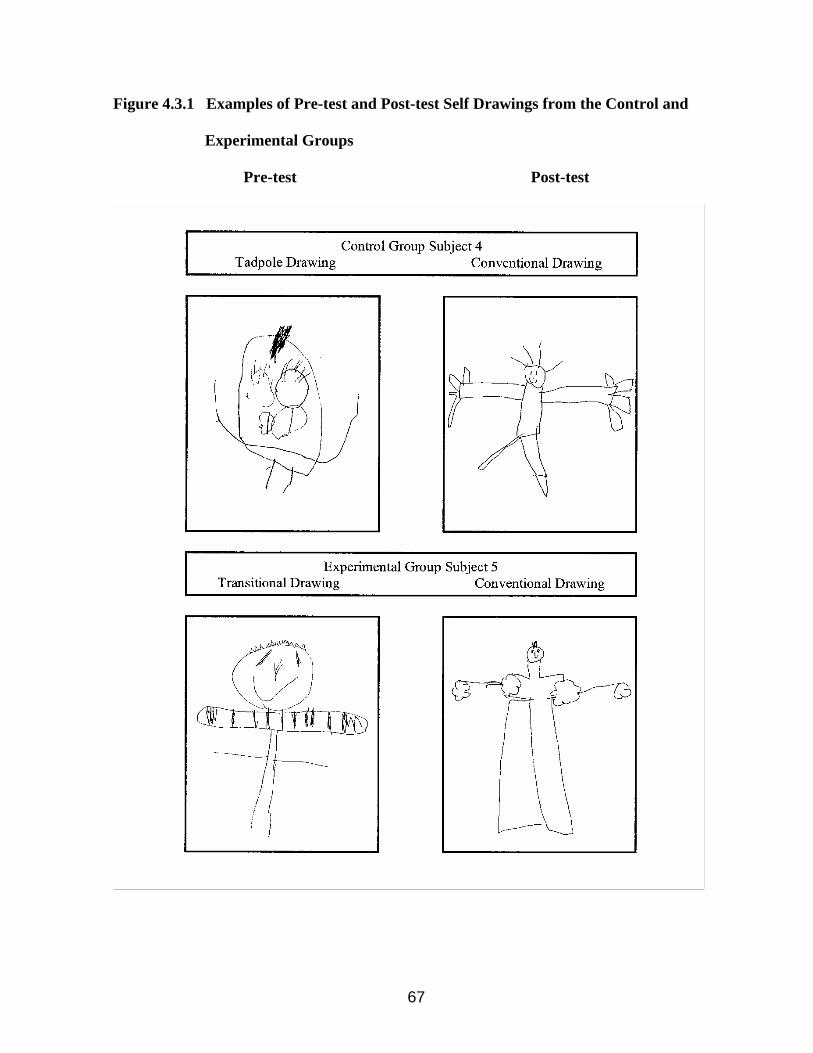
Figure 4.3.1 Examples of Pre-test and Post-test Self Drawings from the Control and
Experimental Groups
Pre-test Post-test
67
In summary, the results of the statistical analyses showed that participation in PMP did not
have a significant effect on enhancing a child’s drawing of a man, woman and self. These
analyses negatively answer the research question which enquired whether there would be a
significant quantitative difference in five year old New Zealand children’s drawings of a
person, including of themselves, after six months of participation in PMP, as compared to a
similar control group that did not participate in PMP.
68
CHAPTER 5
5.0 DISCUSSION
5.1 Introduction
The results of this study are discussed with reference to literature from similar studies. The
influences of age, gender, ethnicity and schooling are described. Confounding variables which
influenced the results are described under study limitations. The confounding variables include
sample size, differences between groups, PMP administration and duration and DAP
administration. Concern with the theory underlying PMP is discussed along with a criticism of
the programme.
5.2 Discussion of the Results
Due to the experimental group’s participation in PMP it was anticipated that these children’s
human figure drawing scores would be significantly greater than those of the children who did
not participate in PMP. Following the specific movement opportunities afforded by the PMP
equipment and floor sessions directed at increasing awareness of the body structure and
movement possibilities, it was expected that these children would draw human figures with
more body parts and greater details. The children, who participated in PMP however, did not
perform better on the human figure drawing task than the children in the control group.
An analysis of the increase in raw scores from pre-test to post-test per category on the DAP
showed that the experimental group did not increase in score in the Presence of body parts
category for the Self drawing. (Refer to Table 4.3.2.) The improvement in the Presence of
body parts category for the Total drawing scores was 19 points. The experimental group’s
69
increase in raw scores on the Detail and Proportion categories ranged between 26 to 100
points.
In the literature 4, 5, 68 it is reported that consciously moving body parts in a purposeful manner
and judging spatial relations with external objects is important in improving body image.
Children’s knowledge and awareness of their bodies, their body image, can be measured by
their drawings of people. 3, 68 Humphrey 4 and Mott 7 reported an increase in the details on
children’s human figure drawings produced immediately after specific movement activities
accompanied by verbalisation of the moving body part. In this study, the DAP was not
administered immediately after the floor or equipment sessions. Memory 69 can influence
children’s performance on human figure drawing tasks. In Humphrey’s and Mott’s studies the
children would have had an advantage performing the drawing task immediately after the
movement activities.
Parush and Hahn-Markowitz 3 reported a significant increase in five year old children’s human
figure drawings following their participation in a perceptual-motor programme for one and a
half hours a week over seven months. The equipment in their gross motor programme appears
similar to the PMP equipment apart from their use of swings, bolsters, slides, a sandbox and a
trampoline. Parush and Hahn-Markowitz utilised climbing, crawling and balance activities
similar to PMP equipment session activities. The differences between Parush and Hahn-
Markowitz’s study and this study include: children with identified perceptual motor
dysfunction versus typically developing children in PMP; 28 weeks versus 19 weeks in PMP;
programme developed and implemented by occupational therapists versus PMP developed by
teachers and administered by teachers and teacher aides/parent volunteers. The differences
70

between Parush and Hahn-Markowitz’s study and this study could account for the different
human figure drawing results. Factors including programme length, development and
administration are discussed in depth later in this chapter.
Culp et al 6 found that ten hours of sensorimotor training over a one month period can
significantly improve typically developing preschool children’s body awareness as reflected in
their drawings of a person. The children’s drawings displayed increased body parts from the
pre-test to post-test. The main differences between Culp et al’s study and this study are: the
mean age of the children namely, four years three months versus five years three months in
PMP; the inclusion of yoga, tumbling on mats and relaxation/breathing exercises in Culp’s
programme.
Williams comments that the age of children can influence the effectiveness of perceptual
motor training outcomes. 21 There is a decreasing relationship between perceptual and
cognitive behaviours with increasing age. Yoga and relaxation techniques make use of
imagery which is required for the human figure drawing task. 67, 78, 79 The specific vestibular
input provided by the tumbling on the mats is likely to have provided heightened bodily
sensory awareness. 62 The processing of body sensations play a role in the development and
improvement of body image. 35, 54, 62
The results of this current study are comparable to the findings in Farr and Leibowitz’s
study 46 where 20 kindergarten children from low socio-economic backgrounds participated in
a daily eight week perceptual motor programme. Although there was an increase in the human
figure drawing scores from the pre-test to post-test, this increase was not significant. The mean
71
increase for the total drawing scores ranged from 6.5 to 10.3 points in the experimental
groups. The mean increase in this current study’s experimental group for the Total DAP score
was 4.08 points. The children in Farr and Leibowitz’s study participated in 40 hours of
perceptual motor training over a two month period in comparison to the children in PMP who
had approximately 28 hours of intervention over a six month timeframe.
5.3 Influences of Age, Gender, Ethnicity and Schooling
5.3.1 Influence of Age
The group mean for the Total standard score of the children who took part in PMP increased
by 4.08 points from the February to the August administration of the DAP. The mean increase
from DAP pre-test to post-test for the Self standard score for this group was 2.72 points. The
mean increase for the Total and Self standard scores of the children in the control group was
8.86 and 10.14 points respectively. (Refer to Table 4.3.1.) This finding that the human figure
drawing scores of both groups of children improved over time was to be expected. In the
literature 85, 86 it is consistently documented that as children increase in age their drawings of
people become more detailed resulting in increased scores on human figure drawings
tests. 13, 16, 27
The influence of maturation was also observed in the developmental progression of the types
of human figure drawings produced by the children in both groups. 85 Over the duration of the
study, two children from the experimental group and one child from the control group changed
from drawing immature tadpole human figure drawings to mature conventional figure
drawings. One child in the experimental group produced transitional human figure drawings at
the pre-test and conventional human figure drawings at the post-test. In this study all the
72
children’s drawings were in the frontal view which is typical of five year olds’ drawings of
people. 16, 85
5.3.2 Influence of Gender
According to studies, the difference in drawing scores between boys and girls as measured by
the DAP is not significant. 27, 89, 91 No separate norms for boys and girls are provided in the
DAP manual. 27
In this study the experimental group had six boys and eight girls, and the control group had
eight boys and six girls. In both groups the boys’ mean Total standard scores increased more
the girls’. (Refer to Table 4.3.3.) Thus the gender composition affected how well the groups
performed on the DAP in relation to each other. Having more boys than girls would have been
an advantage to the control group in terms of the mean score increases, and having fewer boys
than girls would have been a disadvantage for the experimental group. This is especially true
for the experimental group in which the boys scored substantially higher than the girls. This
difference in gender composition between the two groups is however not statistically
significant. The control group’s scores remain higher than the experimental group’s scores
even after adjusting the scores to compensate for this difference.
5.3.3 The Influence of Ethnicity
According to the literature, the DAP and similar human figure drawing tests that rely on the
progression of observed developmental stages can be meaningfully used in Western cultures
such as New Zealand as the measured developmental stages are known to occur there. 85 In
73
1932 Paget found that 61% of the human figure drawings produced by five year old Maori
children were drawn in profile. 85, 88
In this study the children’s drawings were all in the frontal view and displayed the
conventional Western type of figure drawings, namely either tadpole, transitional or
conventional forms. 85, 87 During the administration of the DAP the researcher observed that
approximately half of the children in the control group appeared to belong to the Maori ethnic
group. In the experimental group this representation appeared to be lower. Human figure
drawing studies 75, 90 have shown that if age and socio-economic variables are controlled for,
ethnic differences if present are insignificant. Within this study the age of the children was
controlled for along with the socio-economic level as the children from both groups belonged
to low socio-economic decile two schools. (Refer to Appendix D for information on the school
decile.)
5.3.4 The Influence of Schooling
Studies have shown that exposure to schooling can influence human figure drawing
ability. 85, 87 Schooling provides opportunities to draw with increasing proficiency and aids in
the development of related cognitive skills such as categorisation, analysis and synthesis. 87
The influence of schooling was controlled for in this study in that the children from both
groups had very similar amounts of time in school, having begun primary school at age five.
The mean ages for the control and experimental group differed by one month with the mean
age of the children in the experimental group being five years three months in February, one
month older than the children in the control group.
74
5.4 Study Limitations
5.4.1 Sample Size
A limitation of this study is the sample size of 14 children in both the experimental and the
control groups together with the large standard deviations for both groups. (Refer to Table
4.3.1.) Using the means and standard deviations from this study, the statistician performed a
power analysis using the two-sample t-test. The statistical power was found to be poor at
0.3058 due to the high variability in this study sample. In order to have obtained an estimated
power value of 0.8 based on the Total standard scores of this study, there would need to have
been 67 children in each group. It was not possible to obtain a larger sample size given the
size of the schools in Rotorua and in the nearby towns. A significant difference in performance
on the DAP was not found between the two groups. A possible cause of this could have been
insufficient statistical power, influenced by the sample size. A larger sample size would have
yielded more reliable results.
Farr and Leibowitz’s sample consisted of 20 children divided into two groups of 10 for both
phases of the study. 46 They did not find a significant difference between the human figure
drawing test scores after perceptual motor training when compared to the control group’s
drawing scores. Culp et al had a study sample of 24 with three groups of eight children. 6 They
found a significant difference in the children’s human figure drawing scores in both the
sensorimotor and cognitive-perceptual training groups. As the sample from this study is
comparable in size to the above study samples, it is likely that additional factors also
influenced this study’s results.
75
5.4.2 Differences between Control and Experimental Groups
The control group was matched as closely as possible to the experimental group using the
decile ranking system and the recommendations by School A1’s principal. Despite this
however, differences between the groups did exist and were likely to have influenced the
results. During the administration of the pre-and post-tests, the researcher observed differences
in teaching methods and classroom management of the children within the samples from the
two schools.
School A2, from which the control group was obtained, appeared to have a more structured
teaching approach. One teacher mentioned teaching her class how to draw people, focusing on
the inclusion of certain basic body parts. This may have given the children from this class at
School A2 an advantage in terms of inclusion of details in their drawings during the post-test
administration. When the breakdown of the increase in raw scores from the initial to final
administration of the DAP was analysed, it was apparent that the main difference between the
experimental and control groups was in the Presence and Detail categories. (Refer to Table
4.3.2.)
Goodenough reported on a study where direct coaching on human figure drawing according to
the Goodenough Draw-a-Man scoring system was given to a first grade class. 16 Prior to the
coaching a control drawing of a man was obtained from each of the children. On the following
two days a 30 minute period was spent on coaching the drawing by a teacher who had
considerable experience in administering and scoring the drawing test. The teacher coached
the children by illustrating the drawing method on the blackboard, dictating instructions to
them as they made their drawings and pointing out individual errors in the drawings. In the
76
afternoon of the second day of coaching, the human figure drawing test was administered in
the usual way and re-administered again one week later. When comparing the control drawing
with the final drawing, 70 percent of the children had gained at least one point, eight percent
had neither a gain nor loss and 22 percent showed a slight loss.
It would appear that in the majority of cases, specific training in drawing the human figure can
slightly increase the test scores. Although the teacher at School A2 would not have taught the
children according to the DAP scoring criteria, it is possible that her instruction could have
contributed to the children in the control group scoring higher than those in the experimental
group. A limitation of using a human figure drawing test as an outcome of PMP is that the
drawing of a person is a familiar and common task in the educational setting. 76
During the pre-test administration when the children from the control group were performing
the drawings, they were expected to remain quiet for the entire duration of the procedure. This
was actively enforced by the teachers present. The teachers of the experimental group at
School A1 however, did not insist on complete silence and generally allowed more classroom
noise in keeping with a more co-operative learning style. For the post-test administration, the
control and experimental groups were assessed as whole groups in rooms next to the halls. The
children, especially those from the experimental group, appeared slightly more excitable in
this type of setting. Wilson and Kaplan in their study attributed the variability of some
subjects’ scores to behaviour rather than to the actual skill being measured. 51 This could be
applicable to this study, especially to the children in the experimental group.
77
A final difference between the control and experimental groups’ scores on the DAP is the
nature of the movement opportunities that were available to the children. The children in the
control group, while not having access to PMP floor and equipment sessions, did participate in
their regular physical education lessons three times a week for 45 minutes. They had
swimming lessons for the first 10 weeks and then running/fitness and ball skills. In addition
these children participated in half hourly Kapa Haka sessions three times a week for six
weeks. These sessions consisted of group singing, dancing and movement. These activities
could have had a greater impact on the control group’s drawings than the PMP intervention.
Some schools have replaced traditional physical education programmes with perceptual motor
programmes for their younger students. 52 Campbell commented that physical education
activities can be considered to be perceptual motor in origin. 52 Further more promoters of
perceptual motor programmes are yet to show evidence that the activities in these programmes
are unique or more effective than physical education programmes in improving children’s
fundamental movement and concept acquisition. 52
5.4.3 PMP Implementation
Cratty wrote that in order to elicit changes in motor function in children, close supervision and
good instruction should be applied by professionals possessing appropriate educational
backgrounds. 48 Cratty also commented that the programmes investigated in Kavale and
Mattson’s meta-analysis 36 were conducted by individuals with little or no background in
motor development. 48
78
Litterick-Biggs and Broadley in their study on the implementation, management and
evaluation of PMP, found that participant teachers had
‘very little knowledge of the programme before implementation.’ 32, p23
In their study teacher training on PMP consisted of a one day seminar. Parent help was rated
by the participant teachers as the most important factor in managing the programme. Teachers
expressed that it was difficult to recruit and retain helpers. 32
In this study PMP was overseen by teachers and run with the assistance of helpers namely,
teacher aides and parent volunteers. The teacher aides and parents were not given any practical
training on how to administer the activities at the equipment sessions. The school management
were unwilling to invest in an additional training expense required to compensate the teacher
aides for their time or to put further demands on the parent volunteers. They believed that the
programme had gone well the previous year and that the initial one day teacher training by the
New Zealand PMP consultant was sufficient. The school reasoned that most of the teacher
aides knew the programme from the year before. The helpers had access to the 11 page helper
training guide in the PMP manual which describes the correct movement patterns and
techniques for the floor and equipment sessions. 2 The helpers were expected to follow the
directions on the activity cards and any incidental instruction by the teacher in charge.
With teacher aides and volunteer parents supervising many of the equipment activity stations,
their ability to facilitate the acquisition of the children’s fundamental movement skills can be
questioned. 52 According to the literature quality instruction is a critical element in
contributing to fundamental movement skill improvement. 20, 48, 52
79
The language follow up activity sessions of PMP were not implemented by the school as this
was their second year of running the programme and this component had not been put into
place. The language activity sheets in these sessions are designed to reinforce the language
concepts covered in the equipment sessions and occur for five to ten minutes in the classroom
as a whole group immediately following each equipment session. The language follow up
activities require the children to write and draw about their experiences in the PMP equipment
sessions. 2
On analysis of the language concepts 101 that would have been covered with the corresponding
equipment sessions, the researcher found that the majority of the language concepts were
prepositions and adjectives with a few nouns and verbs. No parts of the body were emphasised
as the language concepts related primarily to spatial concepts such as on/off, over/under and
up/down and descriptors such as big/little and first/last.
Bulluss reported that children’s body image as assessed by the human figure drawing test is
only developed when language is utilised in conjunction with the specific movement of named
body parts. 34 This is designed to occur during the movement to music in the floor sessions and
during the equipment sessions when the helpers are required to talk to the children as they
perform the specific activities and movement patterns. 2, 34 The floor sessions in particular are
viewed as being the most effective in linking movement experiences to body image
development. 34 In view of these comments and the findings of Humphrey 4and Mott 7 the
omission of the language follow up sessions is not likely to have had a significant effect on
this study’s results.
80
5.4.4 PMP Duration
It was anticipated that the children would participate in 48 half hour equipment sessions and
24 twenty to thirty minute floor sessions during the six month period. In the second school
term however, over a five week period, 10 equipment sessions were lost due to problems with
the venue. Thus the experimental group participated in PMP for a total of 19 weeks.
According to the findings from Kavale and Mattson’s meta-analysis perceptual motor
programmes of this length have been found to be ineffective in increasing academic, cognitive
or perceptual motor variables. 36 Therefore the number of sessions of PMP may have been
insufficient to make a significant difference in favour of PMP enhancing children’s human
figure drawings.
Hagood commented on the limitations of conducting research in the school environment. 89 In
this study the loss of the hall as a venue for the equipment sessions and the school’s
unwillingness to train the helpers were beyond the researcher’s control.
5.4.5 DAP Administration
At Schools A1 and A2, during both pre-test and post-test administrations of the DAP, the
researcher noticed the close proximity of the children to one another and the potential for
copying one another’s drawings. One teacher from School A2, after the testing, mentioned this
to the researcher as a concern. Children learn drawing techniques from their peers 87 and being
able to see each other’s work may have confounded the scores by inflating the group means,
possibly more for the control than the experimental group.
81
5.5 Criticisms of PMP
5.5.1 Theoretical Basis
PMP’s theoretical basis is from the work of theorists mainly from the 1960’s and 70’s namely,
Kephart, Montessori, Ayres, Doman and Delacato and Capon. 1 It is also based on the work of
Cratty, Arnheim and Sinclair and the ‘task analysis’ psychologists. 2 While the authors claim
that the programme is specifically designed for ‘today’s students’, 1, p1 there is no evidence
that findings from recent research have been incorporated into the programme’s theoretical
basis and activity components. For example, no scientific rationale 32 is provided to explain
the PMP Outcomes Model (Refer to Figure 2.2.2.) or how certain activities in the equipment
sessions are categorised as enhancing body image. (Refer to asterisks next to Station Name in
Table C in Appendix C.)
As early as the 1970’s there have been concerns raised as to the
‘theoretical and empirical foundations of perceptual motor training programs.’ 36, p165
Specifically there are study findings that cast doubt on the effectiveness of Delacato 38, 50 and
the Kephart-type 38 programmes. If some of the theory behind PMP is outdated and possibly
weak, then it is likely that this would have impacted adversely on this study’s findings.
5.5.2 PMP Structure
The researcher observed that the children’s physical activity levels were low during some of
the equipment sessions. For example, the children spent valuable time waiting in line for a
turn on selected pieces of equipment. Children must be active participants in order to improve
their body image and moment skills. 3, 21, 52 It is reasonable to expect that children will learn
more when they are actively involved for longer periods. 52 It is possible that the children in
82

the control group may have had higher rates of physical activity participating in the swimming
and running/fitness activities.
5.6 Discussion Summary
Due to this study’s relatively small sample size and the large variability of the data within the
groups, it is not possible to draw a definitive conclusion about the effect of PMP equipment
and floor sessions on the children’s human figure drawings. Factors including the theoretical
knowledge and skill of the programme developers are important in intervention efficacy.
Within the reviewed literature, the movement interventions developed by professionals such as
occupational therapists, were shown to have a significant effect on the participants’ human
figure drawings. 3, 6 The effectiveness of the PMP equipment sessions may have been
somewhat reduced by the utilisation of unskilled helpers. According to the literature, children
are most likely to benefit from quality instruction delivered by appropriate professionals. 20, 48,
52 The number of sessions of PMP is likely to have been insufficient to make a significant
impact on the children’s body image as reflected in their drawings of a person. 4, 36
In comparison the control group scored marginally higher on the DAP, particularly in the
Presence and Detail categories, than the experimental group. The children in the control group
appeared to benefit from incidental classroom instruction in the drawing of the human
figure. 16 In addition, the control group participated in regular physical education, group
movement and dance lessons. These lessons may have provided the control group with more
significant perceptual motor experiences particularly if they were structured to facilitate high
activity levels and rates of participation. 52
83
CHAPTER 6
6.0 CONCLUSION AND RECOMMENDATIONS
6.1 Summary of Findings
This study examined the effectiveness of the Smart Start with Perceptual Motor Program
(PMP) on enhancing the ability of five year old New Zealand children to draw pictures of a
person - a man, woman and themselves.
A quasi-experimental research design with purposeful sampling was utilised. The 14 children
in the experimental group were from School A1, a low socio-economic decile two school in
Rotorua, New Zealand. These children participated in 38 half hour equipment sessions and
approximately 19 twenty to thirty minute preparatory floor sessions of PMP from February to
August. The control group was from School A2, also a low socio-economic decile two school
in Rotorua. The control group consisted of 14 children who did not participate in PMP. Both
groups of children drew three pictures of a person, a Man, Woman and Self, using The Draw
A Person: A Quantitative Scoring System (DAP) assessment tool. The DAP was administered
at both schools prior to the experimental group’s commencement in PMP as a pre-test and
again six months later as a post-test.
The Self raw scores and Total (sum of the Man, Woman and Self) raw scores on the DAP
were converted to standard scores. The change in these standard scores from February to
August was analysed using an analysis of covariance (ANCOVA) to compare the two groups
with the February scores as the baseline. A significant difference was not found between the
scores of the experimental and control groups. The p-values from the ANCOVA were Self
standard score: p=0.0570 and Total standard score: p=0.2283. These results were also
84
confirmed using a nonparametric analysis of covariance making use of ranks. The results of
the latter were very similar to the initial parametric analysis (Self standard score: p=0.0565;
Total standard score: p=0.1990). The results from the analysis of the difference between the
groups’ raw Self and raw Total scores supported the above standard score findings.
Upon examination of the increase in the raw scores in the four categories of the DAP from the
February to August administrations, the control group added more items in each category.
This was particularly evident in the Presence and Detail categories. The experimental group
made smaller increases per category, except in the Presence category of the Self drawing
where no increase from the pre-test to the post-test was evident.
6.2 Conclusion
The purpose of this study was to examine the effectiveness of the Smart Start with Perceptual
Motor Program (PMP) on enhancing the ability of five year old New Zealand children to draw
pictures of a person - a man, woman and themselves. The standardised Draw A Person: A
Quantitative Scoring System (DAP) by Naglieri was used to score the children’s drawings.
It was investigated whether there would be a significant quantitative difference in five year old
New Zealand children’s drawings of a person, including of themselves, after participating in
PMP over a six month period, as compared to a similar control group that did not participate in
PMP. It was found that there was no significant, quantitative difference based on the results of
the statistical analysis of covariance (ANCOVA). It would therefore appear that PMP does not
have an effect on enhancing the ability of five year old New Zealand children to draw pictures
of a person, including of themselves.
85

The results of this study however, should be interpreted cautiously in the light of the
previously discussed study limitations namely: relatively small sample size (14 in both
experimental and control group); differences in experimental and control groups (teaching
methods, classroom management); implementation of PMP (training and use of helpers); short
duration of PMP (19 weeks); and DAP administration (group administration and copying).
Therefore, due to the above study limitations, the researcher concludes that it is not possible to
make reliable inferences to the population. Thus, in order to determine the effectiveness of
PMP on enhancing five year old New Zealand children’s ability to draw pictures of people,
more data utilising a larger and broader sampling regime would need to be gathered in future
studies. Future studies should take into account the recommended methodological revisions
described below.
6.3 Recommendations
6.3.1 Revisions of the Methodology
In order to further investigate the effectiveness of PMP on enhancing children’s ability to draw
pictures of people, it would be advisable to make the following changes to this study’s
methodology.
The results from the post-hoc power analysis conducted by the statistician determined that the
future sample size should be 67 children in each group. In order to obtain a sample of this size,
the study would need to be conducted in a larger town than Rotorua. Suitable schools from
which to draw the sample would need to be anticipating a large enrolment of five year old
children.
86
In order to reduce the influence of the confounding variables involving the differences
between the control and experimental groups, the following option could be considered -
obtaining both control and experimental groups from a large school conducting PMP and
randomly assigning half of the children from each class to participate in PMP. The children
from the other half of each class would participate in regular physical education lessons. In
practice, this has ethical implications 10, 51 as it would mean that children from the remaining
half would not have the opportunity to participate in PMP.
To control for the confounding influence of teachers training the children how to draw human
figures, 16 the teachers would need to agree to adhere to certain guidelines beforehand.
Comprehensive practical training of the helpers on the administration of PMP would aid in
ensuring the instruction of the correct techniques in the floor and equipment sessions. 20, 48, 52
The expense of additional training would need to be budgeted on and the necessary funding
resourced.
It would be advisable to conduct the study over a longer time period to allow the experimental
group to participate in more sessions of PMP. There is a lack of longitudinal studies on the
effect of PMP and other perceptual motor programmes. 1, 36 Bulluss and Coles believe in
perceptual motor programmes of longer duration 1 and have designed resources with
equipment sessions for the first three years of schooling. 2
In order to control for the children copying each other’s work, the DAP could be administered
individually. 6, 27, 87 Young children new to school could however become anxious if required
87
to work with a stranger and this could adversely affect their performance. A more suitable
option may be to administer the DAP in a large enough venue so as to seat the children
individually well away from one another.
6.3.2 Directions for Future Research
Bulluss and Coles provide the drawing of a person as the PMP outcome measure for the
improvement in children’s body image. 2 From the literature it is evident that other measures
are also available. 5, 24, 68 For example, Woodburn and Mendez in 1988 developed a Spanish
body image test based on Cratty’s 1970 body image scale. 68 Their body image test utilised
verbal and movement responses. Future studies could use the DAP together with other
measures of body image when examining the effectiveness of PMP.
In order to fully investigate informal claims 33, 34 attesting to the effectiveness of PMP, a more
comprehensive investigation could be undertaken. Future studies could examine the effect of
PMP floor, equipment and language sessions on improving academic skill acquisition, self-
esteem and motor skills. Pupil and teacher perceptions of the effectiveness of PMP could be
investigated using qualitative research methods.
The criticisms directed towards PMP’s theoretical basis 32, 38, 50 and programme structure 21, 52
are likely to also impact upon future studies. The empirical evidence of Kavale and Mattson’s
meta-analysis on the efficacy of perceptual motor training does not provide support for
perceptual motor programmes in general. 36 Therefore a thorough examination of the
theoretical basis on which the activities in PMP are based is warranted. Relevant up to date
research from the field of the allied heath sciences, paediatrics and child development, human
88
movement sciences and the neurosciences should be critically evaluated. This would also
serve to provide the basis and evidence for future perceptual motor programme development
and possible revisions to PMP.
To conclude, future studies should evaluate PMP participants’ progress both quantitatively and
qualitatively. The type of evaluation measures should incorporate more information than the
criterion reference skill grid supplied by Bulluss and Coles. 2 Qualitative evaluations would
also be necessary to document progress along a continuum. 32 Ultimately this would ensure
that the PMP activities were best designed to meet individual children’s needs.
Comprehensive evaluation measures would provide information on PMP strengths and
shortcomings. 32, 52 These evaluations would provide the necessary data on the efficacy of
PMP. This would inform decisions as to whether Smart Start with Perceptual Motor Program
should be a part of the school curriculum in the junior year levels and whether government
funding should be allocated to this programme. 31, 52
89
REFERENCES
1. Bulluss, J. <[email protected] > Re: Request for Information Around PMP. Personal e-mail. [accessed 1 February 2004].
2. Bulluss, J. & Coles, P. A Perceptual Motor Program: A Manual for Teachers. Third Edition. Victoria, Australia: P.J. Developments: 1998. 3. Parush, S. & Hahn-Markowitz, J. A Comparison of Two Settings for Group Treatment
in Promoting Perceptual Motor Function of Learning Disabled Children. Physical and Occupational Therapy in Pediatrics 1997; 17:1.
4. Humphrey, J.H. Motor Learning in Childhood Education. Illinois, USA: Charles C
Thomas Publisher: 1992. 5. Cratty, B.J. Perceptual Motor Efficiency in Children. Philadelphia, USA: Lea &
Febiger: 1969. 6. Culp, R.E., Packard, V.N. & Humphry, R. Sensorimotor versus Cognitive-Perceptual Training Effects on the Body Concept of Preschoolers. The American Journal of Occupational Therapy 1980; 34:4. 7. Mott, S.M. Muscular Activity an Aid in Concept Formation. Child Development. 1945; 16. 8. Swee Hong, C. Occupational Therapy for Children with Perceptual Motor Disorders:
A Literature Review. Occupational Therapy 1984; 2. 9. Platzer, W.S. Effect of Perceptual Motor Training on Gross-Motor Skill and Self-
Concept of Young Children. The American Journal of Occupational Therapy 1976; 30:7.
10. Davidson, T. & Williams, B. Occupational Therapy for Children with Developmental Coordination Disorder: A Study of the Effectiveness of a Combined Sensory Integration and Perceptual Motor Intervention. British Journal of Occupational Therapy 2000; 63:10.
11. Flanagan, R. & Motta, R.W. Figure Drawings: A Popular Method. Psychology in the Schools 2007; 44:3. 12. Mei-Jin, C. Validating the Draw-A-Man Test as a Personal Neglect Test. The
American Journal of Occupational Therapy 2000; 54:4. 13. Harris, D.B. Children’s Drawings as Measures of Intellectual Maturity. New York, USA: Harcourt, Brace and World, Inc.: 1963.
90

14. Painter, G. The Effect of a Rhythmic and Sensory Motor Program on Perceptual Motor Spatial Abilities of Kindergarten Children. Exceptional Child 1966; 33. 15. Connell, J. An Introduction to Perceptual Motor Programming [workshop]. Hamilton,
New Zealand, 10 June 2003. 16. Goodenough, F.L. Measurement of Intelligence by Drawings. Chicago, USA: World
Book Company: 1926. 17. Capon, J. Perceptual-Motor Lesson Plans, Level-2. Third Edition. California, USA:
Front Row Experience: 1983. 18. Sherborne, V. Developmental Movement for Children: Mainstream, Special Needs, and Preschool. Cambridge, UK: Cambridge University Press: 1990. 19. Rintala, P., Pienimäki, K., Ahonen, T., Cantell, M. & Kooistra, L. The Effects of a Psychomotor Training Programme on Motor Skill Development in Children with Developmental Language Disorders. Human Movement Sciences 1998; 17. 20. Gallahue, D.L. & Ozmun, J.C. Understanding Motor Development: Infants, Children, Adolescents, Adults. Fifth Edition. New York, USA: McGraw-Hill: 2002. 21. Williams, H.G. Perceptual and Motor Development. Englewood Cliffs, USA: Prentice-Hall, Inc.: 1983. 22. Matthew, P.S. A Descriptive Study of the Body Use Enculturation of Typically
Developing First Graders in the School Environment. [dissertation] New Mexico, USA: Univ. of New Mexico, 1999.
23. Numminen, P., Nevala, N., Pennanen, M. & Sääkslahti, A. Human Figure Drawing as
a Representative Medium of Perceptual Motor Development among 3-to 5-Year-Old Children. Paper presented at the Biennial Meeting of the International Society for the Study of Behavioural Development; 1996 August 12-16; Quebec City, Quebec, Canada. Available from: ERIC Document Reproduction Service.
24. MacWhinney, K., Cermak, S.A. & Fisher, A. Body Part Identification in 1-to 4-Year- Old Children. The American Journal of Occupational Therapy 1987; 41:7. 25. Tanaka, C. & Sakuma, H. Human Figure Drawing Size and Body Image in Preschool Children from a Self-Physique Perspective. Perceptual and Motor Skills 2004; 99. 26. Clark, D.F. Body Image and Motor Skills in Normal and Subnormal Subjects. International Journal of Rehabilitation Research 1984; 7:2. 27. Naglieri, J.A. Draw A Person: A Quantitative Scoring System Manual. USA: Harcourt Brace Jovanovich, Inc: 1988.
91
28. Vinter, A. How Meaning Modifies Drawing Behavior in Children. Child Development 1999; 70:1. 29. Freeman, N.H. Drawing: Public Instruments of Representation. In C. Pratt & A.F.
Gorton (Eds.), Systems of Representations in Children. Chichester, UK: Wiley & Sons: 1993.
30. Corrie, L. & Barratt-Pugh, C. Perceptual-Motor Programmes Do Not Facilitate Development: Why Not Play? Journal of Early Child Development and Care 1997; 22:1. 31. Stephenson, J., Carter, M. & Wheldall, K. Still Jumping on the Balance Beam: Continued Use of Perceptual Motor Programs in Australian Schools. Australian Journal of Education 2007; 51:1. 32. Litterick-Biggs, A. & Broadley, G. Smart Start with PMP: Implementation,
Management and Evaluation. Teaching and Learning 2005; 2. 33. Craig, B. The Reality Is…Perceptual Motor Programmes. New Zealand Physical
Educator 2001; 3. 34. Bulluss, J. <[email protected] > Re: Questions from NZ PMP Researcher. Personal e-mail. [accessed 12 June 2007]. 35. Winnick, J.P. Adapted Physical Education and Sport. Champaign, USA: Human Kinetics: 2000. 36. Kavale, K.A. & Mattson, P.D. ‘One Jumped Off the Balance Beam’; Meta-Analysis of
Perceptual Motor Training. Journal of Learning Disabilities 1983; 16:3. 37. New Zealand Ministry of Education. How the Decile is Calculated: 2003.
<http://www.minedu.govt.nz> [accessed 19 December 2003]. 38. Cratty, B.J. Physical Expressions of Intelligence. Englewood Cliffs, USA: Prentice-
Hall: 1972. 39. Van der Meer, A.L.H. & Van der Weel, F.R. Development of Perception in Action in Healthy and At-Risk Children. Acta Paediatrica Supplement 1999; 429. 40. Kephart, N.C. The Slow Learner in the Classroom. Second Edition. Columbus, USA: Charles E. Merrill Publishing Company: 1971. 41. Bulluss, J. & Coles, P. Starter Activity Cards. Melbourne, Australia: P.J.
Developments: 1994. 42. The New Zealand Curriculum Draft for Consultation 2006. Wellington, New Zealand:
Learning Media Limited: 2006.
92
43. Donaldson, L. & Maurice, P. The South Auckland Perceptual Motor Dysfunction Survey [research report]. New Zealand: Univ. of Waikato, 1983.
44. Barlow, B. Perceptual Motor Activities in the Treatment of Severe Reading Disability. The Reading Teacher 1971; 24. 45. Hedges, W.D. & Hardin, V.B. Effects of a Perceptual Motor Program on Achievement of First Graders. Educational Leadership Research Supplement 1972; December. 46. Farr J. & Leibowitz H.W. An Experimental Study of the Efficacy of Perceptual-Motor Training. American Journal of Optometry and Physiological Optics 1976: 53:9, Part 1. 47. Case-Smith, J., Allen, A.S. & Pratt, P.N. Occupational Therapy for Children. Third Edition. St Louis, USA: Mosby-Year Book, Inc: 1996. 48. Cratty, B.J. Clumsy Child Syndromes: Descriptions, Evaluation and Remediation. Chur, Switzerland: Harwood Academic Publishers: 1994. 49. Attention Deficit Hyperactivity Disorder - Educational Management: 2001.
<http://www.health.govt.au/nhmrc/publications/adhd/part23.htm> [accessed 5 March 2004].
50. Kavale, K.A. & Forness, S.R. Efficacy of Special Education and Related Services. Washington, USA: American Association on Mental Retardation: 1999. 51. Wilson, B.N. & Kaplan, B.J. Follow-up Assessment of Children Receiving Sensory
Integration Treatment. The Occupational Therapy Journal of Research 1994; 14:4. 52. Campbell, L. Perceptual-Motor Programs, Movement and Young Children’s Needs: Some Challenges for Teachers. Journal of Early Child Development and Care 1997;
22:1. 53. Moore, J.B., Guy, L.M. & Gilmour Reeve, T. Effects of the Capon Perceptual-Motor Program on Motor Ability, Self-Concept, and Academic Readiness. Perceptual and
Motor Skills 1984; 58. 54. Gallagher, S. & Cole, J. Body Image and Body Schema in a Deafferented Subject. The
Journal of Mind and Behaviour 1995; 16:4. 55. Paillard, J. Body Schema and Body Image - A Double Dissociation in Deafferented Patients. In G.N. Gantchev, S. Mori & J. Massion (Eds.), Motor Control: Today and
Tomorrow. Sofia, Bulgaria: Academic Publishing House: 1999. 56. Shontz, F.C. Body Image and Its Disorders. International Journal of Psychiatry in
Medicine 1974; 5:4.
93
57. Bermúdez, J.L., Marcel, A.J. & Eilan, N. The Body and the Self. Massachusetts, USA: Massachusetts Institute of Technology: 1995. 58. Gardner, R.M. & Moncrieff, C. Body Image Distortion in Anorexics as a Non-Sensory Phenomenon: A Signal Detection Approach. Journal of Clinical Psychology 1988;
44:2. 59. Haggard, P. & Wolpert, D.M. Disorders of Body Scheme. Higher-Order Motor
Disorders. In press. 60. Cash, T.F. & Brown, T.A. Body Image in Anorexia Nervosa and Bulimia Nervosa. Behavior Modification 1987; 11:4. 61. Offman, H. J. & Bradley, S.J. Body Image of Children and Adolescents and Its Measurement: An Overview. Canadian Journal of Psychiatry 1992; 37:6. 62. Bundy, A.C., Lane, S.J. & Murray, E.A. Sensory Integration Theory and Practice.
Second Edition. Philadelphia, USA: F.A. Davis Company: 2002. 63. Arnheim, D.D. & Sinclair, W.A. The Clumsy Child: A Program of Motor Therapy. Second Edition. St. Louis, USA: The C.V. Mosby Company: 1979. 64. Short-DeGraff, M.A., Slansky, L. & Diamond, K.E. The Validity of Preschoolers’ Self-Drawings as an Index of Human Figure Drawing Performance. The Occupational Therapy Journal of Research 1989; 9:5. 65. Ayres, A.J. & Reid, W. The Self-Drawing as an Expression of Perceptual-Motor
Function. Cortex 1966; 2. 66. Abell, S.C., Wood, W. & Liebman, S.J. Children’s Human Figure Drawings as Measures of Intelligence: The Comparative Validity of Three Scoring Systems. Journal of Psychoeducational Assessment 2001; 19. 67. Miller, L.J. Miller Assessment for Preschoolers. 1988 Revision. USA: The Psychological Corporation Harcourt Brace Jovanovich, Inc: 1988. 68. Woodburn, S.S., Fernández, H. & Boschini, C. Relationships between the
Goodenough-Harris Draw-A-Person Test and a Body-Image Test in Costa Rican Children. Perceptual and Motor Skills 1989; 68.
69. Cherney, I.D., Seiwert, C.S., Dickey, T.M. & Flichtbeil, J.D. Children’s Drawings: A Mirror to Their Minds. Educational Psychology 2006; 26:1. 70. Pfall, P.B. Framing a Developmental Psychology of Art. Human Development
1997; 40.
94
71. Lowenfeld, V. & Lambert Brittain, W. Creative and Mental Growth. Eight Edition. New York, New York, USA: Macmillan Publishing Company: 1987.
72. Strommen, E.F. & Smith, J.K. Internal Consistency and Bias Considerations of the Goodenough-Harris Draw-A-Person Test. Educational and Psychological
Measurement 1987; 47.
73. Barnett, A. & Henderson, S.E. Some Observations on the Figure Drawings of Clumsy Children. British Journal of Educational Psychology 1992; 62. 74. Duffey, J.B., Ritter, D.B. & Fedner, M. Developmental Test of Visual-Motor Integration and the Goodenough Draw-A-Man Test as Predictors of Academic
Success. Perceptual and Motor Skills 1976; 43. 75. Oakland, T. & Dowling, L. The Draw-A-Person Test: Validity Properties for
Nonbiased Assessment. Learning Disability Quarterly 1983; 6. 76. Loxton, H., Mostert, J. & Moffatt, D. Screening of Intellectual Maturity: Exploring
South African Preschoolers’ Scores on the Goodenough-Harris Drawing Test and Teachers’ Assessment. Perceptual and Motor Skills 2006; 103.
77. Boyatzis, C.J., Michaelson, P. & Lyle, E. Symbolic Immunity and Flexibility in
Preschoolers’ Human Figure Drawings. The Journal of Genetic Psychology 1995; 156:3.
78. Hendry, J. & Kerr, R. Communication through Physical Activity for Learning
Disabled Children. Perceptual and Motor Skills 1983; 56. 79. Sisto, F.F. Relationships of the Piagetian Cognitive Development to Human Figure Drawing. Child Study Journal 2000; 30: 4. 80. Vinter A. & Picard, D. Drawing Behavior in Children Reflects Internal
Representational Changes. In M.L. Simner, C.G. Leedham & A.J.W.M. Thomassen (Eds.), Handwriting and Drawing Research: Basic and Applied Issues. Amsterdam, Netherlands: IOS Press: 1996.
81. Lee, A. & Hobson, R.P. Drawing Self and Others: How do Children with Autism Differ from Those with Learning Difficulties? British Journal of Developmental Psychology 2006; 24. 82. Stiles-Davis, J., Janowsky, J., Engel, M. & Nass, R. Drawing Ability in Four Young Children with Congenital Unilateral Brain Lesions. Neuropsychologia 1988; 26:3. 83. Armentrout, J. Effects of Perceptual Training on Children’s Human Figure Drawings. Journal of Genetic Psychology 1971; 119:2.
95

84. Beery, K.E. & Beery N. A. The Beery-Buktenica Developmental Test of Visual-Motor Integration: Administration, Scoring and Teaching Manual. Fifth Edition. Minneapolis, USA: NCS Pearson, Inc.: 2004.
85. Cox, M.V. Children’s Drawings of the Human Figure. East Sussex, UK: Lawrence
Erlbaum Associated Ltd.: 1993.
86. Barrett, M. & Eames, K. Sequential Developments in Children’s Human Figure Drawing. British Journal of Developmental Psychology 1996; 14.
87. Martlew, M. & Connolly, K.J. Human Figure Drawings by Schooled and Unschooled Children in Papua New Guinea. Child Development 1996; 67. 88. Cox, M.V., Koyasu, M., Hiranuma, H. & Perara, J. Children’s Human Figure
Drawings in the UK and Japan: The Effects of Age, Sex and Culture. British Journal of Developmental Psychology 2001: 19.
89. Hagood, M.M. The Use of the Naglieri Draw-a-Person Test of Cognitive Development: A Study with Clinical and Research Implications for Art Therapists Working with Children. Art Therapy: Journal of the American Art Therapy Association 2003; 20:2. 90. Adler, P.T. Ethnic and Socioeconomic Status Differences in Human Figure Drawing. Journal of Consulting and Clinical Psychology 1971; 36:3. 91. Hagood, M.M. A Correlational Study of Art-based Measures of Cognitive
Development: Clinical and Research Implications for Art Therapists Working with Children. Art Therapy: Journal of the American Art Therapy Association 2002; 19:2.
92. Motta, R.W., Little, S.G. & Tobin, M.I. The Use and Abuse of Human Figure
Drawings. School Psychology Quarterly 1993; 8:3. 93. Phillips, C.J., Smith, B. & Broadhurst, A. The Draw-A-Man Test: A Study of Scoring Methods, Validity and Norms with English Children at Five and Eleven Years. Journal
of Child Psychology and Psychiatry 1973; 14:2.
94. Piersel, W. & Santos, L. Comparison of McCarthy and Goodenough-Harris Scoring Systems for Kindergarten Children’s Human Figure Drawings. Perceptual and Motor Skills 1982; 55. 95. Dugdale, J. & Dunn, K. Patterns of Use of Psychological Tests in New Zealand. Presentation at the Inaugural International Test User’s Conference; 2002 July 3-5; Sydney, Australia. 96. Harrison, P.L., Schmitt, C.S. & Holder-Brown, L. Comparison of Three Draw-A-
Person Scoring Systems for Young Children. Paper presented at the meeting of the National Association of School Psychologists; 1990 April; San Francisco, USA.
96

97. Wisniewski, J.J. & Naglieri, J. Validity of the Draw-A-Person: A Quantitative Scoring System with the WISC-R. Journal of Psychoeducational Assessment 1989: 7. 98. Naglieri, J.A. Human Figure Drawings in Perspective. School Psychology Quarterly 1993; 8:3. 99. New Zealand Ministry of Education. Introduction to School statistics: 2003.
<http://www.minedu.govt.nz> [accessed 9 December 2003]. 100. Tki Organization. Schools’ Links: 2002.
<http://www.tki.org.nz> [accessed 19 December 2003]. 101. Bulluss, J. & Coles, P. Language Follow Up Activities. Melbourne, Australia: P.J.
Developments: 1996. 102. New Zealand Ministry of Education. Schooling in New Zealand A Guide: 2001. <http:www.minedu.govt.nz> [accessed 8 December 2006]. 103. Smartstarters. PMP Resources. <http:www.smartstarters.com.au> [re-accessed 8 December 2006]. 104. Bulluss, J. & Coles, P. Starter Activity Cards. Melbourne, Australia: P.J.
Developments: 1996.
97

APPENDIX A PMP Implementation within the New Zealand Educational Context
The intervention under investigation, PMP, is typically conducted in primary schools in the
first year of formal learning. It is
‘a program for all children in the first three years of school, with the first year being
the most important.’ 15, p1
There is however, a large variation in how New Zealand schools implement PMP. Many run it
for only the year one children. The programme may go for the entire school year or in rare
cases only over the winter months. Not all schools include all three structural components.
Sometimes the language follow-up sessions are not conducted. 15
The New Zealand schools which implement PMP make the decision independently as there is
flexibility within the New Zealand educational curriculum for schools to define the specific
contents of their teaching curriculum. 102 The New Zealand Ministry of Education only sets
general guidelines (statements) for curriculum content. Therefore each school uses the national
curriculum statements to
‘develop, and expand if desired, its own school curriculum and plan its own classroom
programmes, also taking into account the goals and objectives of its local
community.’ 102, p18
Some schools have chosen to implement PMP because they believe it will assist children with
school readiness. 32 Other schools implement it in the junior levels as a major part of their
physical education programme. 15
98

In New Zealand, PMP is not funded by the New Zealand Ministry of Education and schools
fund the programme on their own initiatives e.g. with money obtained from school fund
raising events or charitable trusts. Children who participate in PMP through their local school
will not pay for participation in the programme. This is because it is seen as part of their
learning experience which takes place during their school day.
99
APPENDIX B
PMP Screen Test, Resource Materials, Equipment, Structural Components and Copy of
Activity Cards
An informal screening procedure called a ‘screen test’ has been developed by Bulluss and
Coles. 2 Bulluss and Coles recommend that the screen test be administered to all the children
early on in the school year, ideally before formal learning begins. The aim of the screen test is
to assist in the early diagnosis of those children who have readiness/foundation/pre-requisite
skill deficits which will hinder formal learning. Bulluss and Coles state that these problems
will also become evident in the classroom and during PMP sessions.
The screen test covers the following areas: language (self, environment, auditory and visual
association); motor (fine, laterality/dominance, body awareness/image); auditory skills
(patterning, discrimination, closure, analysis, sequencing, repetition); visual skills (patterning,
discrimination, completion, sequencing, figure/ground) and memory skills (visual and
auditory). The information from this screen test can then be plotted on a graph for each child.
When all the individual graphs have been completed, a class graph is then made showing class
weakness and strengths. This information is then used to plan a class teaching programme
suited to the needs and abilities of each child in the class. 2 The screen test is not specifically
designed to be a pre-test or post-test to measure the effectiveness of PMP.
The drawing of self task appears in the screen test. The Goodenough Draw-a-Person scoring
criteria for the figure drawing are provided in the PMP workshops to score the children’s
drawings of self. If required, the self drawings can be repeated later in the programme in order
to evaluate the influence of PMP on body image. 15
100
PMP has the following resource materials 103 which are relevant to this study:
• A Perceptual Motor Program: A Manual for Teachers - 3rd edition. A manual to aid
schools in the set up and implementation of perceptual motor programmes.
• Starter Activity Cards For A Perceptual Motor Program - 2nd edition. A set of
100 activity cards used for running the PMP equipment sessions.
• Extension Activity Cards for Perceptual Motor Program. A further set of 100
activity cards.
• Floor Session Plans for Starter Activity Cards - 2nd edition. A set of cards with
instructions on how to perform the movement patterns required in the equipment
sessions.
• Language Follow Up Activities for Starter Activity Cards - 2nd edition. A set of
100 language activities covering language concepts used in PMP equipment
sessions.
• Compact Discs Moving Moving. Two CDs with accompanying music for PMP
floor sessions.
In addition, there is the following required equipment 2 which is divided into five categories:
• Eye/hand/foot co-ordination equipment e.g. rebound nets, skittles.
• Balance equipment e.g. balance beams, ladders.
• Fitness equipment e.g. ropes, scooter boards.
• Locomotion equipment e.g. hoops, bicycle tyres.
• Extra equipment e.g. cones, blindfolds, memory pictures.
101

Equipment can be made (instructions are given for some pieces) or purchased from certain
suppliers. There is a comprehensive ideal equipment list and a shortened basic list for schools
with financial constraints. 2
PMP has three structural components, namely:
1. Floor sessions
2. Equipment sessions with evaluation
3. Language follow-up sessions
1. The floor sessions are introductory sessions aimed to introduce students to the movement
patterns required in the equipment sessions. They consist of specific instruction and practice in
skills such as underarm ball toss, heel toe walking etc. Movement to music activities are also
performed during these times. The first six floor sessions are completed before any equipment
sessions are conducted. Further floor sessions are then completed, one for every two or three
equipment sessions for the duration of PMP. Floor sessions take about twenty to thirty
minutes, are done in any safe area, at any time of day and are usually taken by the class
teacher with the whole class as a group. 2
2. Equipment sessions run from two to five sessions a week depending on the school. They
take half an hour and are conducted at any time of the day in a large, safe area. Each
equipment session consists of five activity ‘stations’ and children in groups of three to six
spend five minutes at each station. Each station is dedicated to one of the following five areas:
eye/hand/foot co-ordination, balance, fitness, locomotion and eye-tracking. There is one adult
at each station, often parent volunteers, with at least one teacher present. 2 Each equipment
102

session uses the equipment in a more complex manner. In so doing the equipment is rotated
through PMP so that the participants get a variety of eye/hand/foot co-ordination, balance,
fitness and locomotion experiences. 1
The illustrated starter (and extension) activity cards describe exactly what is to be done at each
activity station. (Refer to the copy of the three examples at the end of this Appendix.) On the
card there is always a main activity (described next to the heading program station) and
sometimes additional activities (described under the heading substation). The cards also
contain the following: what will be done in the accompanying floor session; key language
used; suggestions for individualising up and down the activity; information on techniques;
teaching points when performing the activity; and an evaluation question. 2 In addition, the
activity card also lists in the top right corner the PMP Outcomes which are being worked on at
that station. The activity stations which have activities designed to specifically improve body
image, have been marked with an asterisk in Table C in Appendix C.
PMP is developmental and sequential 1 so the activity cards are used in numerical order. The
first equipment session is conducted using activity cards one, two, three and four plus the first
card for eye-tracking. Eye-tracking receives special emphasis and one of five eye-tracking
activities is performed during each equipment session.
The evaluation of the children’s performance during the equipment sessions will be explained
using the following example. (Also refer to the copy of activity card S1 on p105.) During the
first equipment session, the main programme station activity on card S1 is tossing, bouncing
or bowling a 20cm ball to a helper. This will then be evaluated by the teacher present. The
103

teacher will answer the closed question printed on activity card S1 e.g. ‘Can the student return
the ball every time, to the helper, copying the helper’s action correctly?’ The teacher will then
mark ‘yes’ or ‘no’ on an evaluation grid 1 which is supplied in the resources. The grid lists the
children’s names down the one side and the activity card numbers along the top. This
evaluation grid thus shows whether a child can or can not complete the set activity. This
evaluative data can then be interpreted in the light of the specified PMP Outcomes listed on
the activity card. In this way specific outcomes are linked to the activity/ies performed on the
activity card.
In the second equipment session undertaken later in the week, the main activity on activity
card S2 will be evaluated. PMP follows a ‘one in/one out’ pattern for the entire duration of the
programme 1 so that the activity first introduced, i.e. activity card S1 is omitted in the next
session and replaced by a new one i.e. activity card S5.
3. The final structural component is the language follow up sessions. 2, 101 These occur for
five to ten minutes in the classroom as a whole group immediately following each equipment
session. These sessions aim to transfer language concepts such as in, through, beside, first,
high etc. experienced in the equipment session, to the classroom situation. The children’s
language concepts are developed by writing and drawing their experiences onto worksheets,
thereby moving from the real to the symbolic form. The children are encouraged to talk about
their movement experiences and to identify these words when reading and writing. 1, 15, 101
104

Copy of Activity Card S1
105
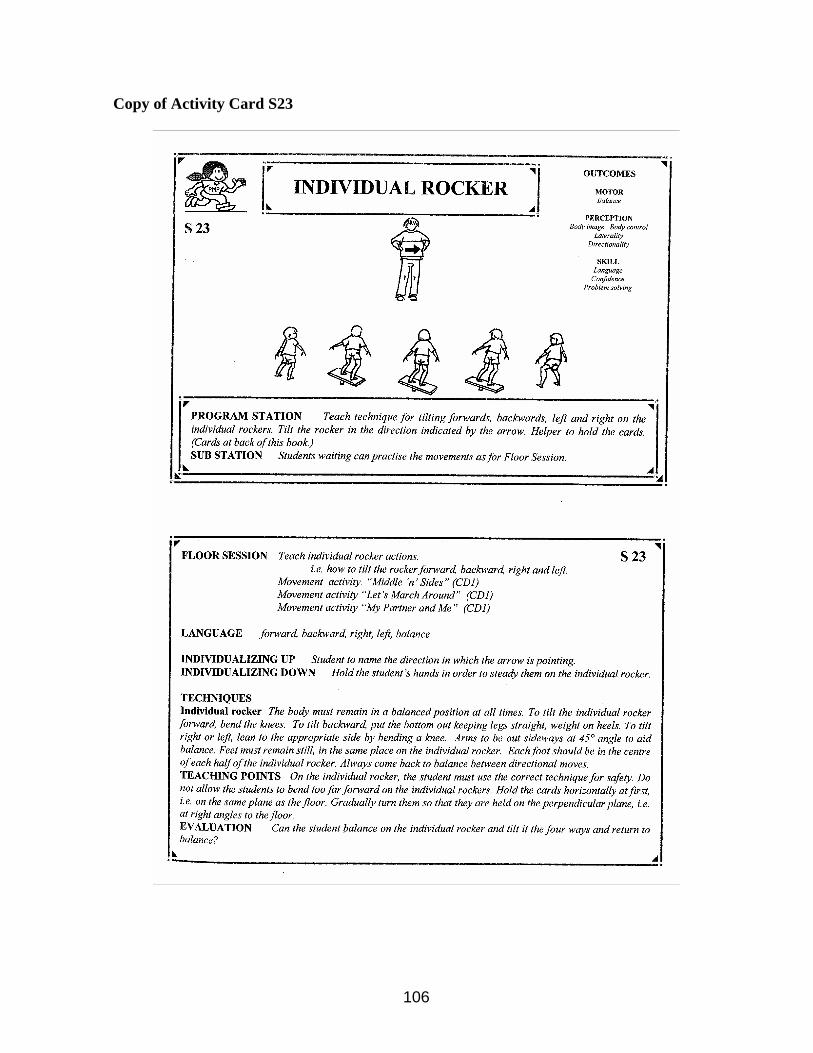
Copy of Activity Card S23
106
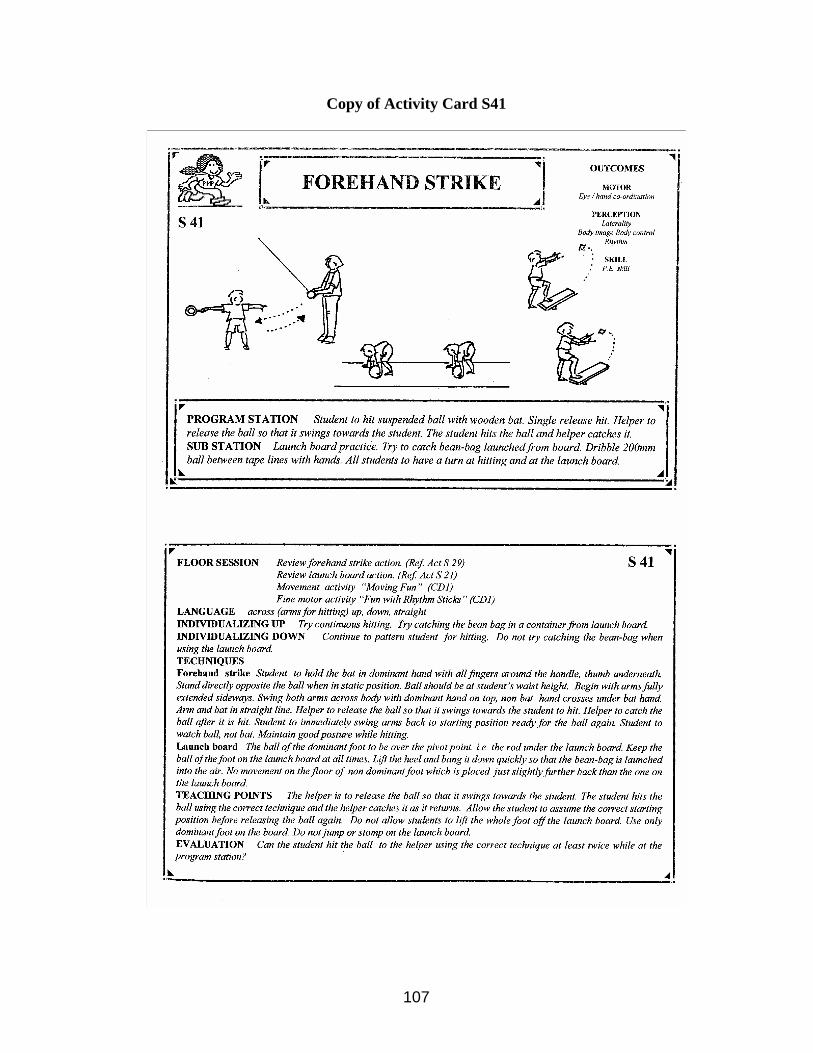
Copy of Activity Card S41
107
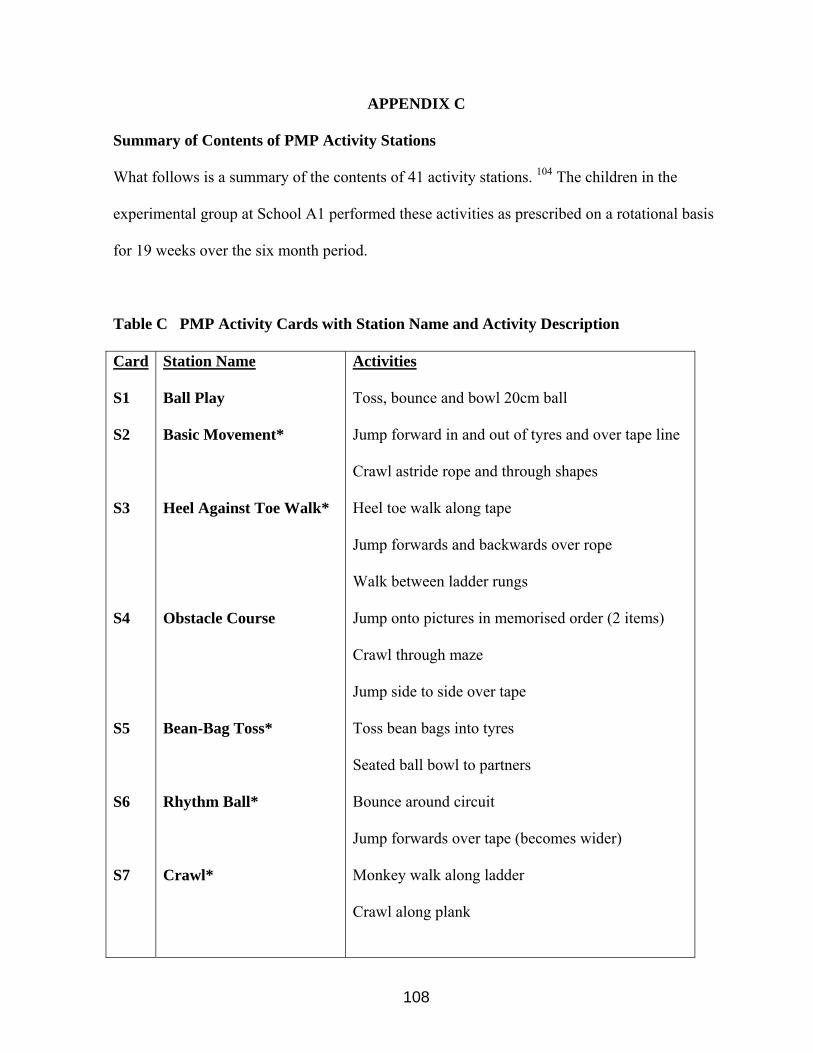
APPENDIX C
Summary of Contents of PMP Activity Stations
What follows is a summary of the contents of 41 activity stations. 104 The children in the
experimental group at School A1 performed these activities as prescribed on a rotational basis
for 19 weeks over the six month period.
Table C PMP Activity Cards with Station Name and Activity Description
Card S1 S2 S3 S4 S5 S6 S7
Station Name
Ball Play
Basic Movement*
Heel Against Toe Walk*
Obstacle Course
Bean-Bag Toss*
Rhythm Ball*
Crawl*
Activities
Toss, bounce and bowl 20cm ball
Jump forward in and out of tyres and over tape line
Crawl astride rope and through shapes
Heel toe walk along tape
Jump forwards and backwards over rope
Walk between ladder rungs
Jump onto pictures in memorised order (2 items)
Crawl through maze
Jump side to side over tape
Toss bean bags into tyres
Seated ball bowl to partners
Bounce around circuit
Jump forwards over tape (becomes wider)
Monkey walk along ladder
Crawl along plank
108
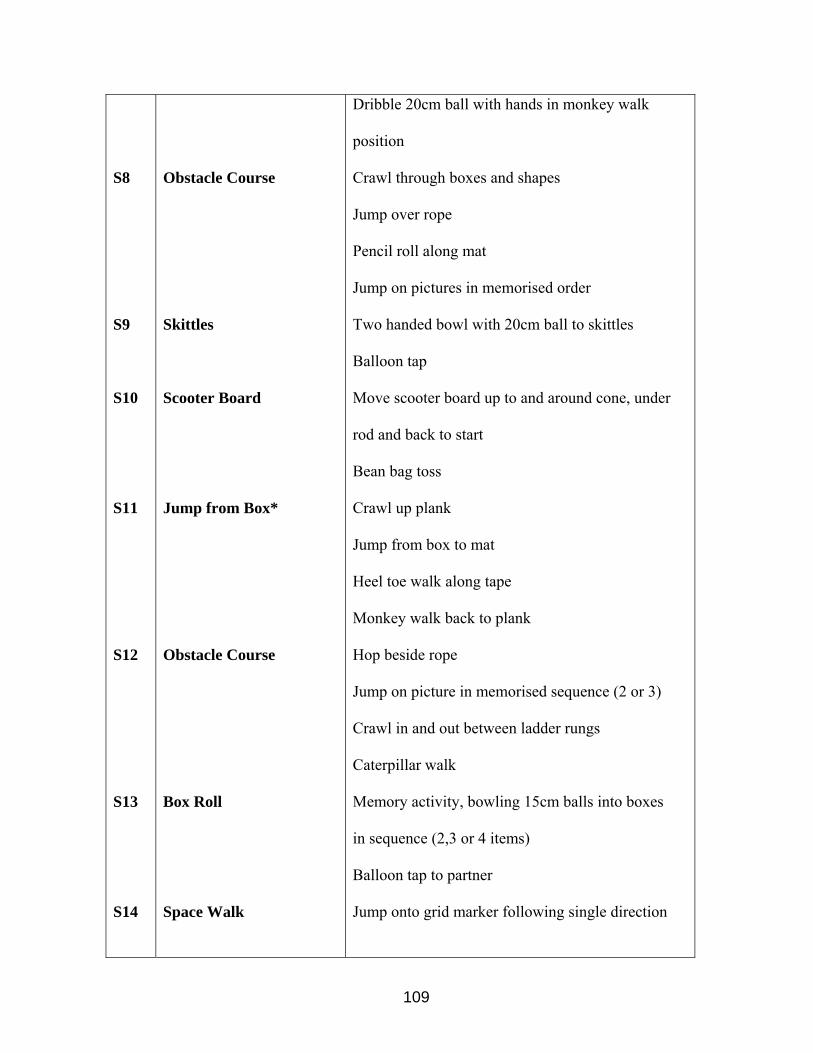
S8 S9 S10 S11 S12 S13 S14
Obstacle Course
Skittles
Scooter Board
Jump from Box*
Obstacle Course
Box Roll
Space Walk
Dribble 20cm ball with hands in monkey walk
position
Crawl through boxes and shapes
Jump over rope
Pencil roll along mat
Jump on pictures in memorised order
Two handed bowl with 20cm ball to skittles
Balloon tap
Move scooter board up to and around cone, under
rod and back to start
Bean bag toss
Crawl up plank
Jump from box to mat
Heel toe walk along tape
Monkey walk back to plank
Hop beside rope
Jump on picture in memorised sequence (2 or 3)
Crawl in and out between ladder rungs
Caterpillar walk
Memory activity, bowling 15cm balls into boxes
in sequence (2,3 or 4 items)
Balloon tap to partner
Jump onto grid marker following single direction
109
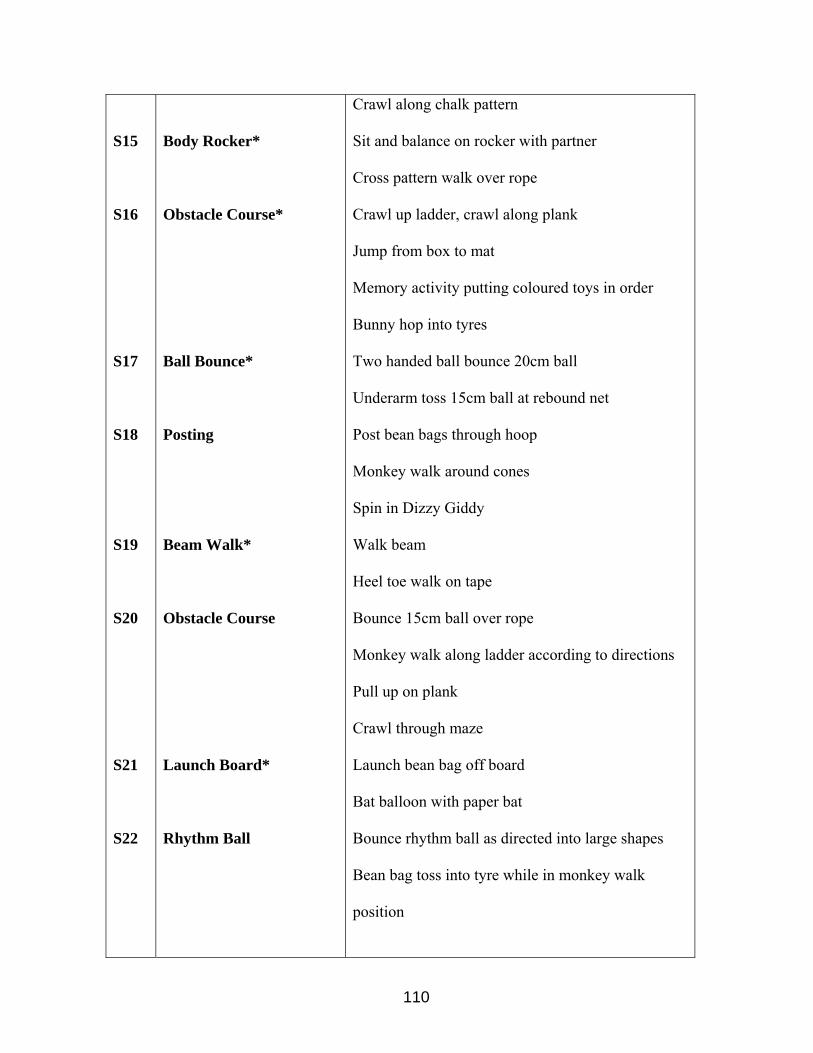
S15 S16 S17 S18 S19 S20 S21 S22
Body Rocker*
Obstacle Course*
Ball Bounce*
Posting
Beam Walk*
Obstacle Course
Launch Board*
Rhythm Ball
Crawl along chalk pattern
Sit and balance on rocker with partner
Cross pattern walk over rope
Crawl up ladder, crawl along plank
Jump from box to mat
Memory activity putting coloured toys in order
Bunny hop into tyres
Two handed ball bounce 20cm ball
Underarm toss 15cm ball at rebound net
Post bean bags through hoop
Monkey walk around cones
Spin in Dizzy Giddy
Walk beam
Heel toe walk on tape
Bounce 15cm ball over rope
Monkey walk along ladder according to directions
Pull up on plank
Crawl through maze
Launch bean bag off board
Bat balloon with paper bat
Bounce rhythm ball as directed into large shapes
Bean bag toss into tyre while in monkey walk
position
110
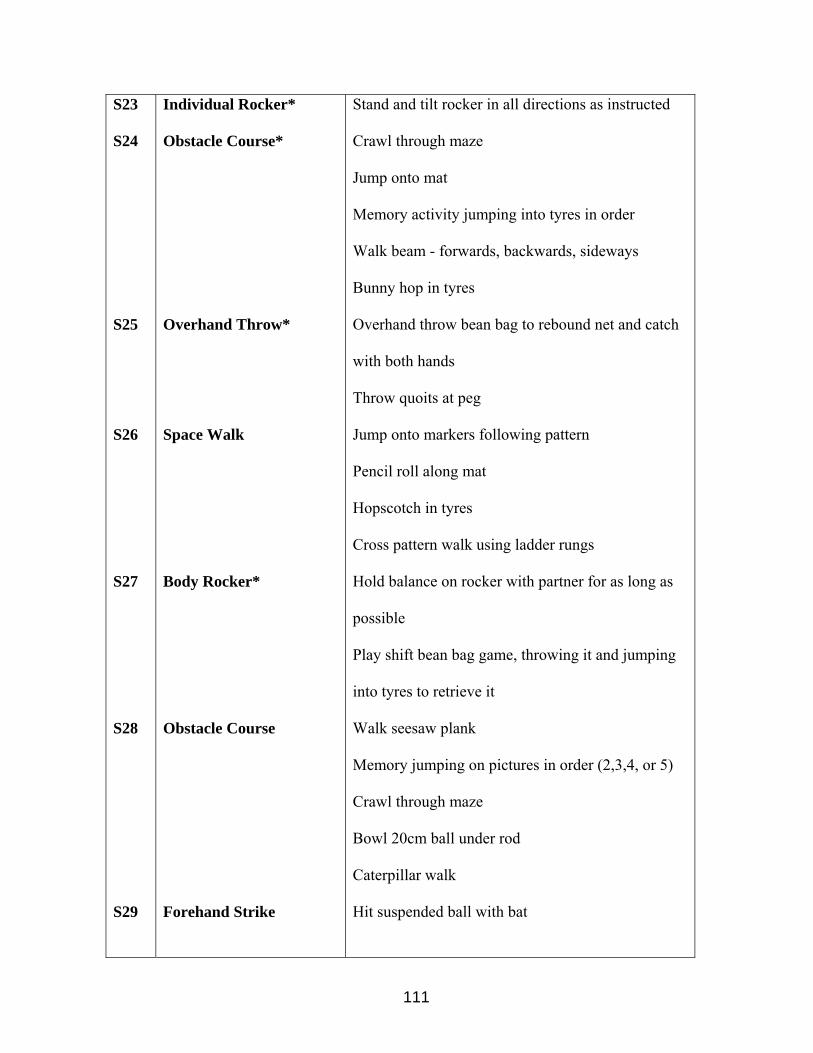
S23 S24 S25 S26 S27 S28 S29
Individual Rocker*
Obstacle Course*
Overhand Throw*
Space Walk
Body Rocker*
Obstacle Course
Forehand Strike
Stand and tilt rocker in all directions as instructed
Crawl through maze
Jump onto mat
Memory activity jumping into tyres in order
Walk beam - forwards, backwards, sideways
Bunny hop in tyres
Overhand throw bean bag to rebound net and catch
with both hands
Throw quoits at peg
Jump onto markers following pattern
Pencil roll along mat
Hopscotch in tyres
Cross pattern walk using ladder rungs
Hold balance on rocker with partner for as long as
possible
Play shift bean bag game, throwing it and jumping
into tyres to retrieve it
Walk seesaw plank
Memory jumping on pictures in order (2,3,4, or 5)
Crawl through maze
Bowl 20cm ball under rod
Caterpillar walk
Hit suspended ball with bat
111
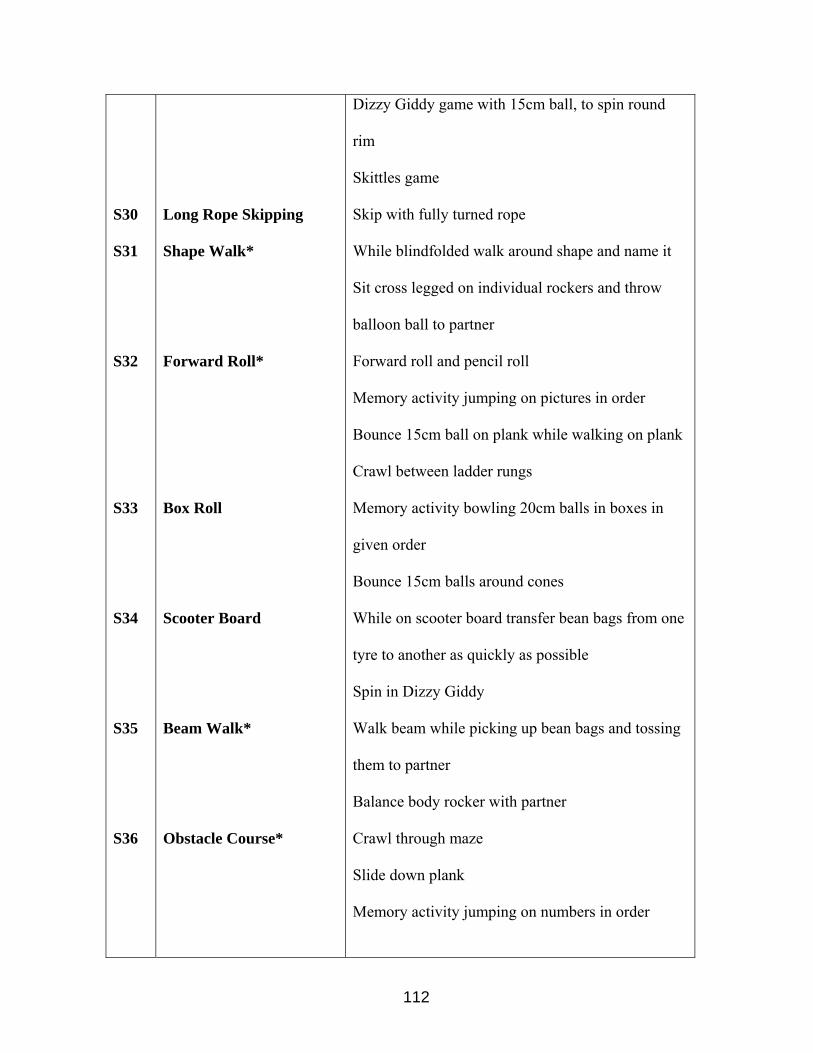
S30 S31 S32 S33 S34 S35 S36
Long Rope Skipping
Shape Walk*
Forward Roll*
Box Roll
Scooter Board
Beam Walk*
Obstacle Course*
Dizzy Giddy game with 15cm ball, to spin round
rim
Skittles game
Skip with fully turned rope
While blindfolded walk around shape and name it
Sit cross legged on individual rockers and throw
balloon ball to partner
Forward roll and pencil roll
Memory activity jumping on pictures in order
Bounce 15cm ball on plank while walking on plank
Crawl between ladder rungs
Memory activity bowling 20cm balls in boxes in
given order
Bounce 15cm balls around cones
While on scooter board transfer bean bags from one
tyre to another as quickly as possible
Spin in Dizzy Giddy
Walk beam while picking up bean bags and tossing
them to partner
Balance body rocker with partner
Crawl through maze
Slide down plank
Memory activity jumping on numbers in order
112

S37 S38 S39 S40 S41
Overhand Throw*
Long Rope Skipping*
Individual Rocker*
Obstacle Course
Forehand Strike
Jump over rod
Hop beside rope
Star jump pattern in tyres
Throw bean bag at rebound net
Tap balloons with bats
Introduce limited skips and run out
In standing tilt rocker in the direction given, come
back to balance in between moves
Jump grid according to directions
Crawl up ladder
Move along plank
Jump from box, over rod and land on mat
Walk beam with bean bag on head
Memory activity jumping on numbers in order
Caterpillar walk
Hit suspended ball with bat after a suspended
release from helper
Launch board practice to catch bean bag
Dribble ball with hands
Key: * = Activities in this station classified by PMP authors as designed to improve body image
113

APPENDIX D
Information on the School Decile
The New Zealand Ministry of Education funds compulsory schooling in state and integrated
schools (Schools that were private but still own their own buildings and land). Operational
funding is provided for the general running expenses of a school. In addition, many school
boards raise additional funds from their local community to fund extra activities and staff. The
amount of operational funding that a school receives depends on its decile ranking. The lower
the decile rank, the more per pupil funding is received from the government. 102
Census information and school ethnicity data are used to calculate a school’s decile rank. A
school’s decile will indicate the
‘extent to which a school draws its students from low socio-economic
communities.’ 37, p1
These communities are identified based on socio-economic indicators. Household income,
occupation, household crowding, educational qualifications and income support are five
factors from the census information that make up the socio-economic indicator. The sixth
factor is ethnicity, defined as the percentage of Maori and Pacific Islander students, and
students who have refugee status. The six scores for each school are added together and this
total gives an overall standing in relation to all the other schools in New Zealand. Schools are
then divided into even groups called deciles. Thus
‘decile one schools are the 10% of schools with the highest proportion of students from
low socio-economic communities, whereas decile ten schools are the 10% of schools
with the lowest proportion of these students.’ 37, p1
114

The two schools in this study are decile two schools. Thus they have equal access to resources
and funding and have children from similar socio-economic backgrounds.
115
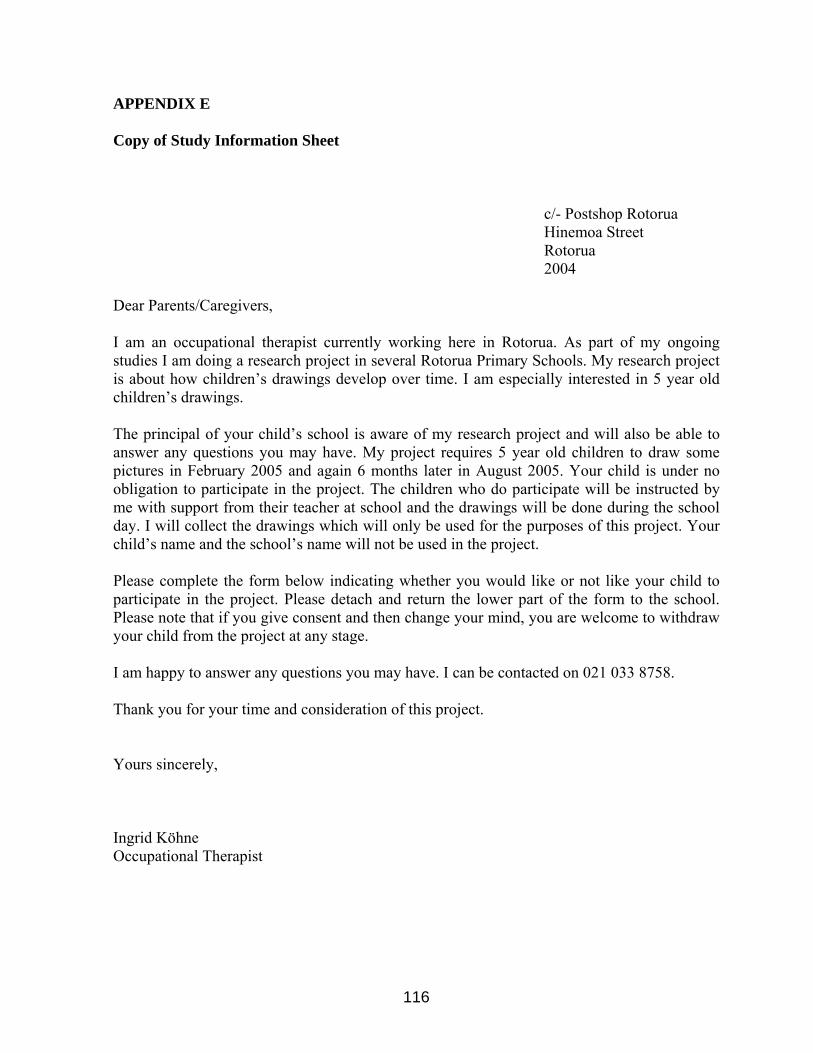
APPENDIX E
Copy of Study Information Sheet
c/- Postshop Rotorua Hinemoa Street Rotorua 2004 Dear Parents/Caregivers, I am an occupational therapist currently working here in Rotorua. As part of my ongoing studies I am doing a research project in several Rotorua Primary Schools. My research project is about how children’s drawings develop over time. I am especially interested in 5 year old children’s drawings. The principal of your child’s school is aware of my research project and will also be able to answer any questions you may have. My project requires 5 year old children to draw some pictures in February 2005 and again 6 months later in August 2005. Your child is under no obligation to participate in the project. The children who do participate will be instructed by me with support from their teacher at school and the drawings will be done during the school day. I will collect the drawings which will only be used for the purposes of this project. Your child’s name and the school’s name will not be used in the project. Please complete the form below indicating whether you would like or not like your child to participate in the project. Please detach and return the lower part of the form to the school. Please note that if you give consent and then change your mind, you are welcome to withdraw your child from the project at any stage. I am happy to answer any questions you may have. I can be contacted on 021 033 8758. Thank you for your time and consideration of this project. Yours sincerely, Ingrid Köhne Occupational Therapist
116

Copy of Parental Consent Form
------------------------------------------------------------------------------------------------------------------ Informed Consent Form – please detach and return to school
I _____________________________________ (full name) parent/caregiver would like □ (please tick appropriate box) would not like □ ______________________________________ (child’s name) to participate in the research project. Signature of parent/caregiver _____________________________ Signature of researcher _____________________________ Date _____________________________
117

Copy of Child Assent Form
The following was read to the child before handing out the papers and pencils. Their response
was recorded below. If their response was ‘no’, they were not required to do the drawings.
------------------------------------------------------------------------------------------------------------------
Child Informed Consent Form Would you like to draw some pictures of people, today? You can say yes or no. Yes □ Please tick appropriate box No □ _____________________________________________________________________
118

APPENDIX F
Copy of Ethical Clearance Certificate
119

APPENDIX G
Copy of Letter of Permission from School A1 Principal
120

Copy of Letter of Permission from School A2 Principal
121
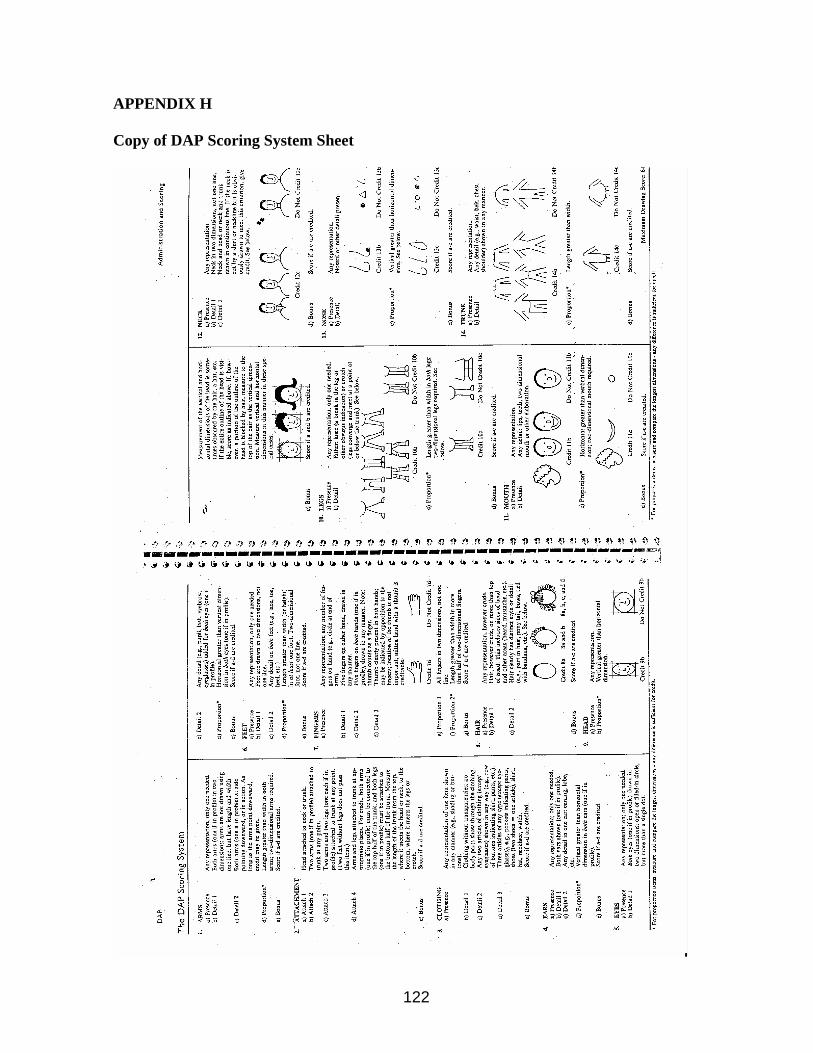
APPENDIX H Copy of DAP Scoring System Sheet
122
Copy of DAP Response Form
123

124
125
126
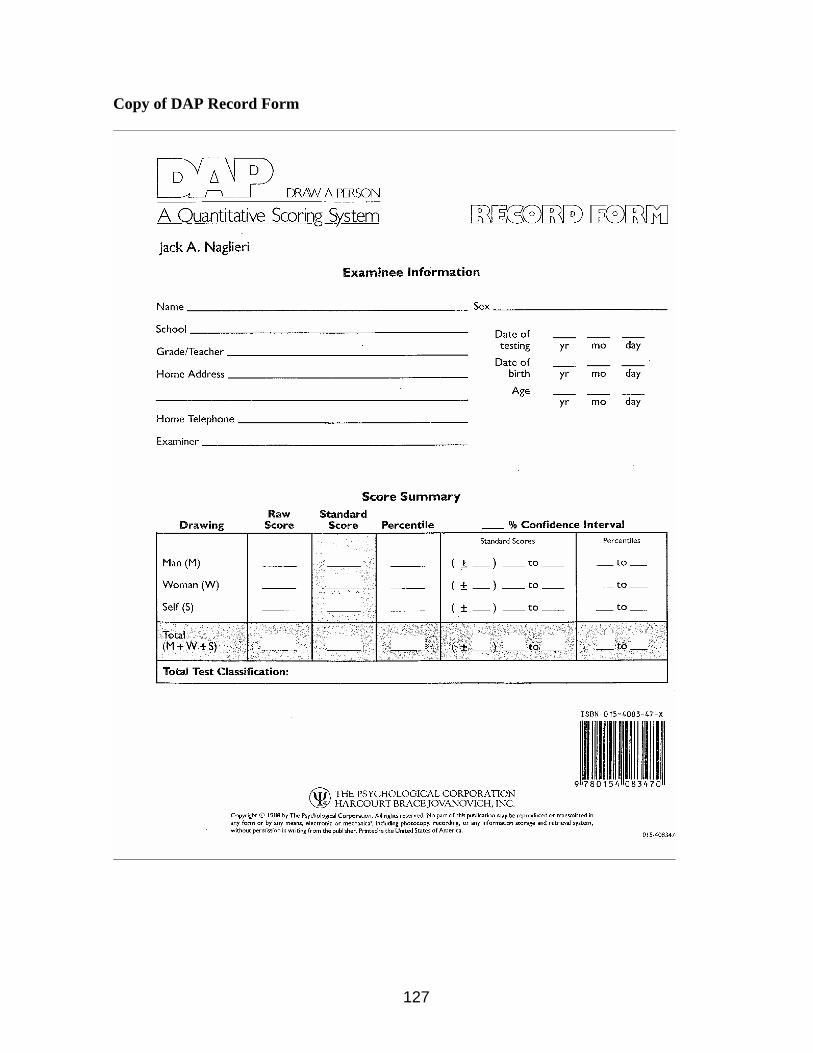
Copy of DAP Record Form
127

128
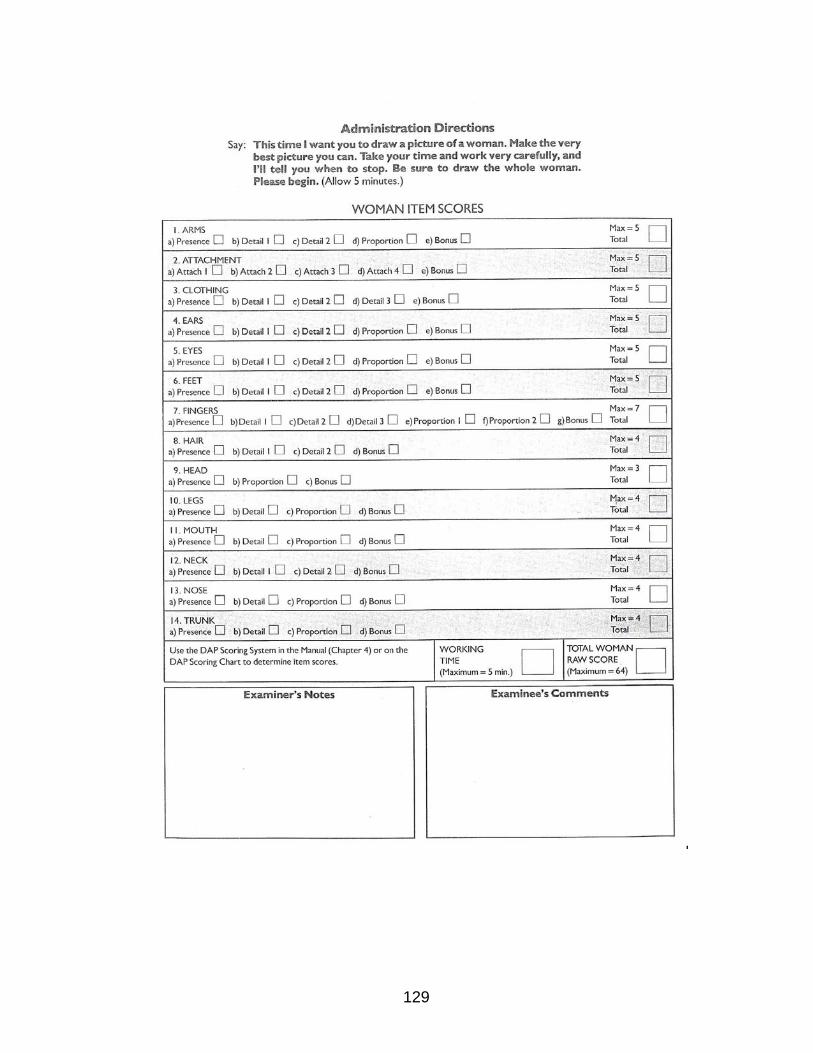
129
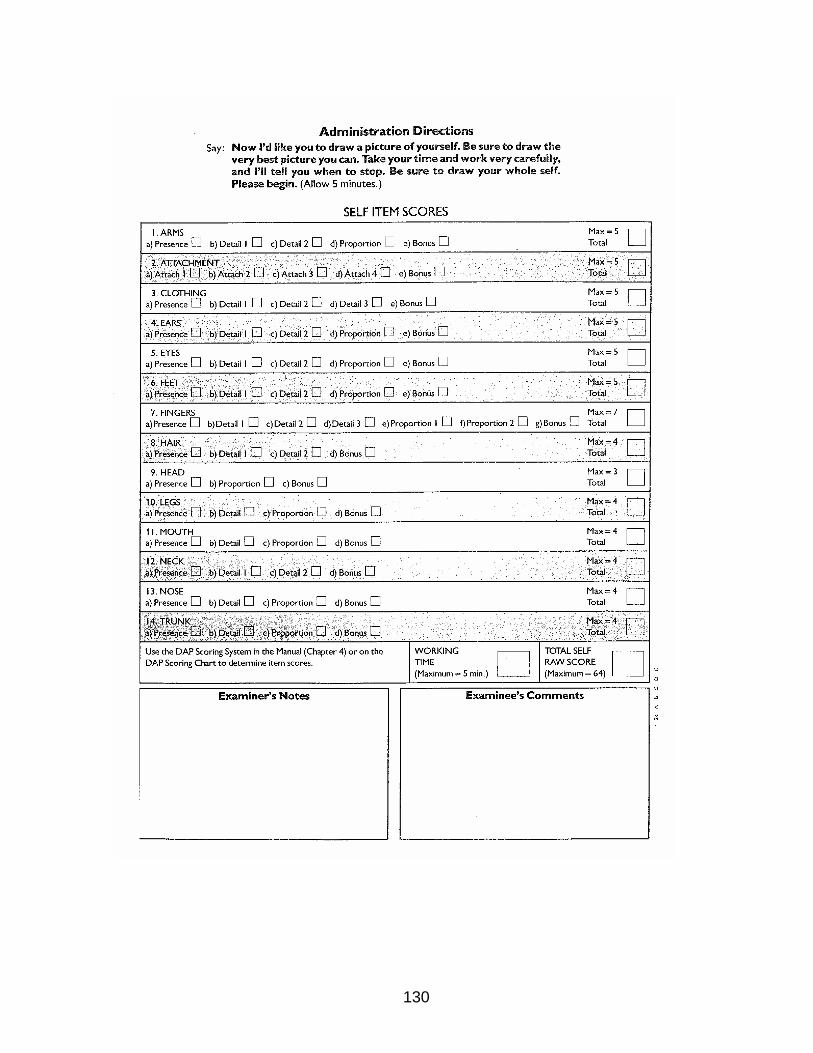
130