1
I. Resonance Frequency Considering the air in the neck as a piston, the thermodynamic equations and the pressure pushing the air into flask, (1) where P is the increased pressure inside the volume, ρair is the air density, c is the speed of sound, S is the cross sectional area of the 0 0.05 0.1 0.15 0.2 0.25 0.3 0.35 0.4 0.45 0.5 0 0.05 0.1 0.15 0.2 0.25 0.3 0.35 St Vac/Vflow The Effect of A Helmholtz Resonator’s Neck Geometry On The Aero-Acoustic Excitation of Resonance Asami Nishikawa, Faculty Mentor: Dr. William Slaton Department of Physics and Astronomy, University of Central Arkansas Abstract The aero-acoustic excitation of a Helmholtz resonator with different neck geometries has been examined with an improved measurement technique. A Helmholtz resonator consists of a volume connected to a duct and has a well defined resonance frequency which depends on the length of the duct, the volume of the resonator and the cross sectional area of the duct. In the system used during this experiment, two Helmholtz resonators have been positioned at opposite sides of a junction in a wind tunnel. The air speed in the wind tunnel can be varied over the range 0 to 28 m/s. The air flowing over the junction openings to the Helmholtz resonators can excite the acoustic resonance of the system. This is similar to blowing over an empty bottle’s opening and creating a tone. The excitation of the resonators as a function of flow speed in the wind tunnel has been recorded. The effect of the resonator’s geometry has been seen in the measured acoustic amplitude and frequency in the resonator and will be presented. mass neck air x V c S P = 0 2 ρ System Pressure Sensor Calibration Different Length Straight Necks Data Trends Replaceable Necks Vflow Theory A Freescale differential pressure sensor (MPX 5010DP) was used to measure the mean flow, Vflow, in the wind tunnel by use of a pitot tube and as a microphone. The pressure sensor has a response time of 1 ms. This response time is smaller than the period of the fastest signal we measured, 13.4 ms. It was calibrated with a water monometer and a syringe as illustrated in the figure to the right. Pressure Sensor Water monometer Syringe valve Open to air Open to air The graph above displays the measured resonance frequency at the Vac/Vflow maximum for each neck length. The measured frequency agrees well with the theoretical model of Equation (2). Frequency at (Vac/Vflow)max VS Neck Length 40 45 50 55 60 65 70 75 80 0 5 10 15 20 25 30 L_neck(cm) f_max(Hz) Theory Measurement Vflow Decreasing Vflow Increasing neck, Vo is the volume of the resonator, and xmass is the distance which the air moves into the volume. The frequency can be expressed as (2) where L’ is the effective neck length. Therefore, the frequency is related to the flask’s neck length plus end corrections. II. Strouhal Number (St) The flow observed in this experiment is unsteady, so the Strouhal Number (St) can be useful to characterize the aero-acoustic excitation of the resonator with different neck geometries. St for this experiment can be expressed as (3) where Dneck is the diameter of the neck, and Vflow is the mean velocity inside the duct. III. Acoustic Velocity For calculation of the acoustic velocity in the neck, the measurable acoustic pressure in the flask’s spherical part works. The velocity of the air mass can be written as (4) where ω = 2π f of the resonance. Eq. (4) can also be written as (5) where Pamp is the amplitude of the pressure wave, which can be observed in the oscilloscope’s display. IV. Pitot Tube The mean flow, Vflow, in the wind tunnel can be measured using a pitot tube illustrated below. The difference in pressure between the small tube facing into the flow and the tube at the wall of the wind tunnel is related to Vflow via (6) where p is the measurable pressure using the Pressure sensor. 0 0.1 0.2 0.3 0.4 0.5 0 0.05 0.1 0.15 0.2 0.25 0.3 0.35 St Vac/Vflow I would like to thank the UCA Physics department. ' 2 0 L V S c f neck π = We intend to measure the flow velocity before and after the junction to determine the change in the flow’s kinetic energy. This change in kinetic energy should be equal to the work done to excite and sustain the resonance. The acoustic source strength of the vortex driving the resonance is a function of frequency and flow. The system is composed of a 2 inch ID glass pipe, a junction, various kinds of duct pieces and two 5L flasks. In order to measure the quantities required to see the flow’s behavior, the following are used: a thermometer, an oscilloscope, a voltmeter, a pitot-tube, and two pressure sensors. The one pressure sensor is used to measure the mean flow of the air in the duct, Vflow, via a pitot tube; and, it also can measure the pressure difference between room and the inside of the duct for another pressure measurement. The other pressure sensor is used as a microphone to measure the amplitude of the pressure change, Pamp, and the frequency of oscillation in the flasks. The microphone signal is viewed on the oscilloscope. The mean flow of air over the junction openings will excite the air in the flasks into resonance for certain neck lengths and flow speeds. As the mean flow passes over the junction opening a vortex is created. The creation of the vortex and its behavior influences the acoustic excitation of the flasks. Consequently, the acoustic behavior of the flasks influences the creation of the next vortex. In this way, a feedback loop is generated, which is shown to depend only on the geometry of the system and Vflow. Future Work Acknowledgement flow neck V D f St = mass ac x V = ϖ amp neck air ac P c S V V = 2 0 ρ ϖ Same Length Different Geometry Necks The above graph shows the results with 0, 3.0, 7.0, 19.6, 22.6, 24.6, 25.6, 26.6 and 31.5 (cm) Straight replaceable necks. The lightly filled points for the each data set were the ones, which the flow started with high velocity then we decrease it. The darkly filled points for the each data set were the ones, which the flow started with low velocity then we increase it. The data shows the same general trend for all neck lengths. The acoustic amplitude increases with increased Vflow, however, the ratio Vac/vflow reaches a maximum value. At a sufficiently high Vflow, the resonance is extinguished as illustrated by the abrupt end of the data at low St. Additionally, longer necks generally have lower pressure amplitude indicating the importance of damping. This data is analyzed in the Data Trends section. The above graph shows the results of the trials with same length replaceable necks but different geometries. The length of the 90 bend is 12.0 (cm). These plots seem to show no difference between the illustrated orientations. (Vac/Vflow)max VS Neck Length 0 0.1 0.2 0.3 0.4 0.5 0.6 0 5 10 15 20 25 30 35 Replaceable neck's length(cm) (Vac/Vflow)max Vflow Vflow Vflow Vflow Vflow Decreasing Vflow Increasing air flow p V ρ = 2 p The graph above shows the maximum measured value of the ratio Vac/Vflow for each neck length. There is a slight decrease in the ratio until a dramatic drop at 25.6 cm . There seems to be a sudden transition in behavior of the system at this point. Understanding this phenomena will be the subject of future work.

The Effect of A Helmholtz Resonator’s Neck Geometry On …faculty.uca.edu/wvslaton/Student_Research_Projects/AY2009-2010/... · I. Resonance Frequency ... the length of the duct,

  • Upload
    doanbao

  • View
    219

  • Download
    3

Embed Size (px)

Citation preview

I. Resonance FrequencyConsidering the air in the neck as a piston, the thermodynamic equations and the pressure pushing the air into flask,

(1)

where ∆P is the increased pressure inside the volume, ρair is the air density, c is the speed of sound, S is the cross sectional area of the

0

0.05

0.1

0.15

0.2

0.25

0.3

0.35

0.4

0.45

0.5

0 0.05 0.1 0.15 0.2 0.25 0.3 0.35

St

Vac

/Vflo

w

The Effect of A Helmholtz Resonator’s Neck Geometry On The Aero-Acoustic Excitation of Resonance

Asami Nishikawa, Faculty Mentor: Dr. William SlatonDepartment of Physics and Astronomy, University of Central Arkansas

Abstract

The aero-acoustic excitation of a Helmholtz resonator with different neck geometries has been examined with an improved measurement technique. A Helmholtz resonator consists of a volume connected to a duct and has a well defined resonance frequency which depends on the length of the duct, the volume of the resonator and the cross sectional area of the duct. In the system used during this experiment, two Helmholtz resonators have been positioned at opposite sides of a junction in a wind tunnel. The air speed in the wind tunnel can be varied over the range 0 to 28 m/s. The air flowing over the junction openings to the Helmholtz resonators can excite the acoustic resonance of the system. This is similar to blowing over an empty bottle’s opening and creating a tone. The excitation of the resonators as a function of flow speed in the wind tunnel has been recorded. The effect of the resonator’s geometry has been seen in the measured acoustic amplitude and frequency in the resonator and will be presented.

massneckair x

V

cSP ⋅=∆

0

System

Pressure Sensor Calibration Different Length Straight Necks Data Trends

Replaceable Necks

Vflow

Theory

A Freescale differential pressure sensor (MPX 5010DP) was used to measure the mean flow, Vflow, in the wind tunnel by use of a pitot tube and as a microphone. The pressure sensor has a response time of 1 ms. This response time is smaller than the period of the fastest signal we measured, 13.4 ms. It was calibrated with a water monometer and a syringe as illustrated in the figure to the right.

Pressure Sensor

Water monometer

Syringe

valveOpen to air

Open to air

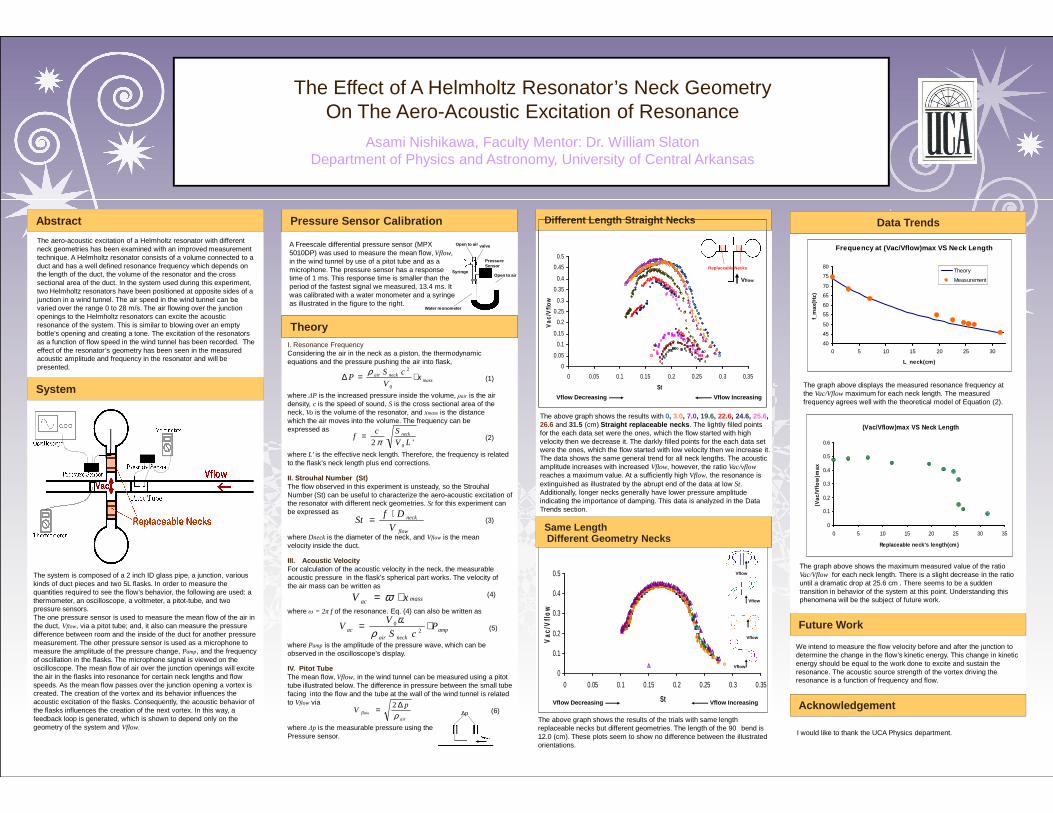
The graph above displays the measured resonance frequency at the Vac/Vflowmaximum for each neck length. The measured frequency agrees well with the theoretical model of Equation (2).

Frequency at (Vac/Vflow)max VS Neck Length

40

45

50

55

60

65

70

75

80

0 5 10 15 20 25 30

L_neck(cm)

f_m

ax(H

z)

Theory

Measurement

Vflow Decreasing Vflow Increasingdensity, c is the speed of sound, S is the cross sectional area of the neck, Vo is the volume of the resonator, and xmassis the distance which the air moves into the volume. The frequency can be expressed as

(2)

where L’ is the effective neck length. Therefore, the frequency is related to the flask’s neck length plus end corrections.

II. Strouhal Number (St)The flow observed in this experiment is unsteady, so the Strouhal Number (St) can be useful to characterize the aero-acoustic excitation of the resonator with different neck geometries. St for this experiment can be expressed as

(3)

where Dneckis the diameter of the neck, and Vflow is the mean velocity inside the duct.

III. Acoustic VelocityFor calculation of the acoustic velocity in the neck, the measurable acoustic pressure in the flask’s spherical part works. The velocity of the air mass can be written as

(4)

where ω = 2π f of the resonance. Eq. (4) can also be written as

(5)

where Pamp is the amplitude of the pressure wave, which can be observed in the oscilloscope’s display.

IV. Pitot Tube The mean flow, Vflow, in the wind tunnel can be measured using a pitot tube illustrated below. The difference in pressure between the small tube facing into the flow and the tube at the wall of the wind tunnel is related to Vflow via

(6)

where ∆p is the measurable pressure using the Pressure sensor.

0

0.1

0.2

0.3

0.4

0.5

0 0.05 0.1 0.15 0.2 0.25 0.3 0.35

St

Vac

/Vflo

w

I would like to thank the UCA Physics department.

'2 0 LV

Scf neck

π=

We intend to measure the flow velocity before and after the junction to determine the change in the flow’s kinetic energy. This change in kinetic energy should be equal to the work done to excite and sustain the resonance. The acoustic source strength of the vortex driving the resonance is a function of frequency and flow.

The system is composed of a 2 inch ID glass pipe, a junction, various kinds of duct pieces and two 5L flasks. In order to measure the quantities required to see the flow’s behavior, the following are used: a thermometer, an oscilloscope, a voltmeter, a pitot-tube, and two pressure sensors. The one pressure sensor is used to measure the mean flow of the air in the duct, Vflow, via a pitot tube; and, it also can measure the pressure difference between room and the inside of the duct for another pressure measurement. The other pressure sensor is used as a microphone to measure the amplitude of the pressure change, Pamp, and the frequency of oscillation in the flasks. The microphone signal is viewed on the oscilloscope. The mean flow of air over the junction openings will excite the air in the flasks into resonance for certain neck lengths and flow speeds. As the mean flow passes over the junction opening a vortex is created. The creation of the vortex and its behavior influences the acoustic excitation of the flasks. Consequently, the acoustic behavior of the flasks influences the creation of the next vortex. In this way, a feedback loop is generated, which is shown to depend only on the geometry of the system and Vflow.

Future Work

Acknowledgement

flow

neck

V

DfSt

⋅=

massac xV ⋅= ω

ampneckair

ac PcS

VV ⋅=

20

ρω

Same LengthDifferent Geometry Necks

The above graph shows the results with 0, 3.0, 7.0, 19.6, 22.6, 24.6, 25.6, 26.6 and 31.5 (cm) Straight replaceable necks . The lightly filled points for the each data set were the ones, which the flow started with high velocity then we decrease it. The darkly filled points for the each data set were the ones, which the flow started with low velocity then we increase it. The data shows the same general trend for all neck lengths. The acoustic amplitude increases with increased Vflow, however, the ratio Vac/vflowreaches a maximum value. At a sufficiently high Vflow, the resonance is extinguished as illustrated by the abrupt end of the data at low St. Additionally, longer necks generally have lower pressure amplitude indicating the importance of damping. This data is analyzed in the Data Trends section.

The above graph shows the results of the trials with same length replaceable necks but different geometries. The length of the 90 bend is 12.0 (cm). These plots seem to show no difference between the illustrated orientations.

(Vac/Vflow)max VS Neck Length

0

0.1

0.2

0.3

0.4

0.5

0.6

0 5 10 15 20 25 30 35

Replaceable neck's length(cm)

(Vac

/Vflo

w)m

ax

Vflow

Vflow

Vflow

Vflow

Vflow Decreasing Vflow Increasing

airflow

pV

ρ∆= 2

∆p

The graph above shows the maximum measured value of the ratio Vac/Vflow for each neck length. There is a slight decrease in the ratio until a dramatic drop at 25.6 cm . There seems to be a sudden transition in behavior of the system at this point. Understanding this phenomena will be the subject of future work.